Research Report Japan Real Estate Fourth Quarter...
22
Japan Real Estate Fourth Quarter 2016 October 2016 Research Report Please note certain information in this presentation constitutes forward-looking statements. Due to various risks, uncertainties and assumptions made in our analysis, actual events or results or the actual performance of the markets covered by this presentation report may differ materially from those described. The information herein reflect our current views only, are subject to change, and are not intended to be promissory or relied upon by the reader. There can be no certainty that events will turn out as we have opined herein. Certain Deutsche AM’s real estate investment strategies may not be available in every region or country for legal or other reasons, and information about these strategies is not directed to those investors residing or located in any such region or country. For Professional Clients (MiFID Directive 2004/39/EC Annex II) only. For Qualified Investors (Art. 10 Para. 3 of the Swiss Federal Collective Investment Schemes Act (CISA)). For institutional investors only. Further distribution of this material is strictly prohibited. Marketing Material
Transcript of Research Report Japan Real Estate Fourth Quarter...

Japan Real Estate Fourth Quarter 2016
October 2016
Research Report
Please note certain information in this presentation constitutes forward-looking statements. Due to various risks, uncertainties and assumptions made in our analysis, actual events or results or the actual performance of the markets covered by this presentation report may differ materially from those described. The information herein reflect our current views only, are subject to change, and are not intended to be promissory or relied upon by the reader. There can be no certainty that events will turn out as we have opined herein. Certain Deutsche AM’s real estate investment strategies may not be available in every region or country for legal or other reasons, and information about these strategies is not directed to those investors residing or located in any such region or country. For Professional Clients (MiFID Directive 2004/39/EC Annex II) only. For Qualified Investors (Art. 10 Para. 3 of the Swiss Federal Collective Investment Schemes Act (CISA)). For institutional investors only. Further distribution of this material is strictly prohibited.
Marketing Material

2 Japan Real Estate Fourth Quarter 2016 | October 2016
Table of Contents
1 Executive Summary 3
2 Macro Economy 4
3 Capital and Investment Market 6
3.1 Lending 6
3.2 Pricing 7
3.3 Transactions 8
3.4 Performance 9
3.5 J-REITs 9
4 Market Fundamentals 12
4.1 Office 12
4.2 Retail 15
4.3 Residential 16
4.4 Industrial 17
Past Topics of This Report 18
Important Notes 19
Research & Strategy Team 21 The opinions and forecasts expressed are those of Japan Real Estate Research Report and not necessarily those of Deutsche Asset Management Distributors, Inc. All opinions and claims are based upon data at the time of publication of this article and may not come to pass. This information is subject to change at any time, based upon economic, market and other conditions and should not be construed as a recommendation.

Japan Real Estate Fourth Quarter 2016 | October 2016 3
1 Executive Summary — Macro Economy: The unfavourable currency exchange rate remains a drag on the Japanese
manufacturing and high street retail sectors with this trend intensifying following the “Brexit” vote at the U.K. referendum in June, while the Japanese yen is seen as a safe heaven. Real GDP is now expected to grow only 0.7% in 2016 while external concerns over China’s slowdown remain a key risk. In September, the Bank of Japan announced it would turn its monetary policy emphasis away from quantity of money towards interest rates as new policy instruments. The yield curve steepened accordingly. Core CPI declined to -0.5% in August 2016 due to weak consumer demand and cyclical exogenous factors, including energy prices.
1
— Capital and Investment Market: Cap rates remain under pressure on the back of the negative interest
rate policy while transaction volumes declined due to a lack of assets on the market and also due to rich valuations in Central Tokyo. Capital flowing into environs and regional cities were not strong enough to fill the gap. Listed REITs remain attractive investment products for investors as the average J-REIT dividend yield spread over the 10 year government bond yield widened to 360 basis points in August, with four new J-REIT listings in the third quarter of 2016. Accordingly listed J-REITs became the dominant purchaser group in the investment market.
2
— Real Estate Market Fundamentals: Leasing markets and real estate fundamentals were broadly healthy
overall while a slow down trend was observed in some sectors such as high street retail. Office vacancy rates recovered in all major cities in Japan in the third quarter of 2016 whilst increasing in the industrial sector in Greater Tokyo and Greater Osaka. Rents painted a mixed picture, recording small but healthy growth in the office and the residential sectors while, they were broadly flat in the retail and logistics sectors.
3
1 Bank of Japan, Cabinet Office, Deutsche Bank “Japan Economics Weekly.” As of Sept 2016,
2 Association for Real Estate Securitization, TMAX, Real Capital Analytics, Bloomberg, Nissay Asset Management, ARES, Nikkei Deutsche Asset Management. As of Sept 2016
3 Miki Shoji, Sanko Estate, Style Act, Real Estate Economic Institute, TAS Corporation, Leasing Management, IPD-RECRUIT Residential Index, Ichigo Real Estate Service, Deutsche Asset Management. As of Sept 2016
An investment in real estate involves a high degree of risk, including possible loss of principal amount invested, and is suitable only for sophisticated investors. who can bear such losses. Any forecasts provided herein are based upon Deutsche Asset Management's opinion of the market at this date and are subject to change dependent on the market. Past performance or any prediction, projection or forecast on the economy or markets is not indicative of future performance. The forecasts provided are based upon our opinion of the market as at this date and are subject to change, dependent on future changes in the market. Any prediction, projection or forecast on the economy, stock market, bond market or the economic trends of the markets is not necessarily indicative of the future or likely performance.
4 Japan Real Estate Fourth Quarter 2016 | October 2016
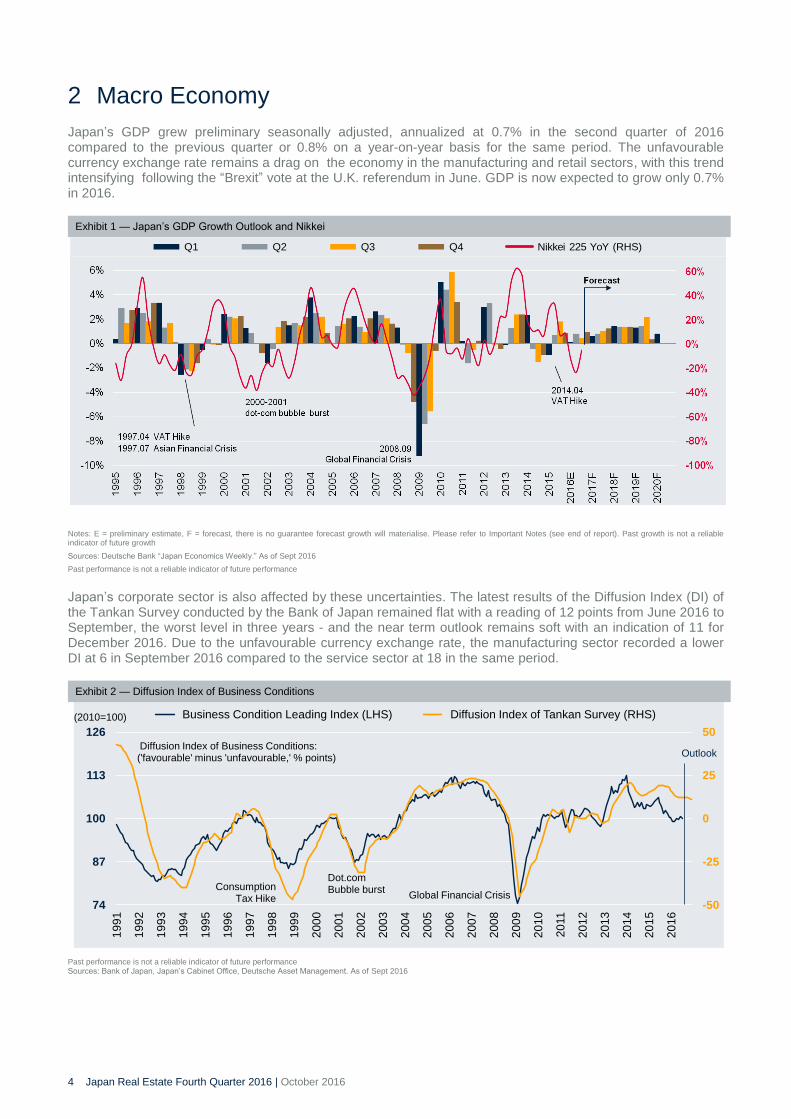
2 Macro Economy Japan’s GDP grew preliminary seasonally adjusted, annualized at 0.7% in the second quarter of 2016 compared to the previous quarter or 0.8% on a year-on-year basis for the same period. The unfavourable currency exchange rate remains a drag on the economy in the manufacturing and retail sectors, with this trend intensifying following the “Brexit” vote at the U.K. referendum in June. GDP is now expected to grow only 0.7% in 2016.
Notes: E = preliminary estimate, F = forecast, there is no guarantee forecast growth will materialise. Please refer to Important Notes (see end of report). Past growth is not a reliable indicator of future growth
Sources: Deutsche Bank “Japan Economics Weekly.” As of Sept 2016
Past performance is not a reliable indicator of future performance
Japan’s corporate sector is also affected by these uncertainties. The latest results of the Diffusion Index (DI) of the Tankan Survey conducted by the Bank of Japan remained flat with a reading of 12 points from June 2016 to September, the worst level in three years - and the near term outlook remains soft with an indication of 11 for December 2016. Due to the unfavourable currency exchange rate, the manufacturing sector recorded a lower DI at 6 in September 2016 compared to the service sector at 18 in the same period.
Past performance is not a reliable indicator of future performance Sources: Bank of Japan, Japan’s Cabinet Office, Deutsche Asset Management. As of Sept 2016
Q1 Q2 Q3 Q4 Nikkei 225 YoY (RHS)
-50
-25
0
25
50
74
87
100
113
126
19
91
19
92
19
93
19
94
19
95
19
96
19
97
19
98
19
99
20
00
20
01
20
02
20
03
20
04
20
05
20
06
20
07
20
08
20
09
20
10
20
11
20
12
20
13
20
14
20
15
20
16
Business Condition Leading Index (LHS) Diffusion Index of Tankan Survey (RHS)
Diffusion Index of Business Conditions:('favourable' minus 'unfavourable,' % points)
(2010=100)
Dot.com Bubble burst
Global Financial CrisisConsumption
Tax Hike
Outlook
Exhibit 2 — Diffusion Index of Business Conditions
Exhibit 1 — Japan’s GDP Growth Outlook and Nikkei

Japan Real Estate Fourth Quarter 2016 | October 2016 5
The Nikkei 225 index declined about 13.6% in the first nine months of 2016. The short slump in the stock market is in line with the appreciation of the Japanese yen in the currency exchange rate, which was traded at 100.9 for a US dollar in September 2016, a 16% appreciation since the end of 2015.
Sources: The Bank of Japan, Japan’s Cabinet Office, Deutsche Bank. As of Sept 2016 Past performance is not a reliable indicator of future performance.
In September, the Bank of Japan announced in its monetary policy meeting it would turn its monetary policy emphasis away from quantity of money and towards interest rates as new policy instruments. The yield curve steepened accordingly and 10 year government bonds (JGB) rose to 0% in September from -0.25% in June in accordance with the bank’s announcement, while the long term viability of the yield curve control remains not unclear. Core CPI declined to -0.5% in August 2016 due to weak consumer demand and cyclical exogenous factors, including energy prices.
Notes: F = forecast, there is no guarantee rates forecasted will materialise. JGB = Japanese Government Bond. CPI = Consumer Price Index. Please refer to Important Notes (see end of report) Sources: The Bank of Japan, Japan’s Cabinet Office, Deutsche Bank. As of Sept 2016 Past performance is not a reliable indicator of future performance
¥60
¥80
¥100
¥120
¥5,000
¥10,000
¥15,000
¥20,000
Se
p-0
6
Ma
r-07
Se
p-0
7
Ma
r-08
Se
p-0
8
Ma
r-09
Se
p-0
9
Ma
r-10
Se
p-1
0
Ma
r-11
Se
p-1
1
Ma
r-12
Se
p-1
2
Ma
r-13
Se
p-1
3
Ma
r-14
Se
p-1
4
Ma
r-15
Se
p-1
5
Ma
r-16
Se
p-1
6
Nikkei 225 (LHS) USD/JPY (RHS)
2008.09Global Financial Crisis
2011.10JPY peaked at 75
(JPY)(JPY)
"Abenomics"
Exhibit 4 — Forecast of Interest Rate and CPI
Exhibit 3 — Stock (Nikkei) and Forex

6 Japan Real Estate Fourth Quarter 2016 | October 2016
3 Capital and Investment Market
3.1 Lending The Bank of Japan’s Diffusion Index for lending attitudes of banks to the real estate industry (orange line in Exhibit 5) was an index value of 26 as of September 2016, a marginal drop from the previous quarter. The credit conditions remain reasonably accommodative from an historical perspective, with banks still accepting 50% to 60% loan-to-values (LTVs) for core income producing assets. Lending volumes for new projects jumped by 25% in the latest survey as at the end of June 2016.
Sources: The Bank of Japan, Japan’s Cabinet Office, Deutsche Asset Management. As of Sept 2016
Past performance is not a reliable indicator of future performance
The volume of commercial real estate transactions in Japan in the rolling 12 months to September 2016 was JPY4.2 trillion on a preliminary basis, around a 19% drop from the same period last year. Transaction volumes declined due to a lack of assets on the market and also due to rich valuations in Central Tokyo, while capital flow into environs and regional cities were not strong enough to fill the gap.
Notes: E = preliminary estimate. Please refer to Important Notes (see end of report).
Sources: Urban Research Institute, Bank of Japan, Real Capital Analytics, Deutsche Asset Management. As of Sept 2016
Past performance is not a reliable indicator of future performance
Exhibit 6 — Real Estate Transaction Volume and Lending Attitude DI
Exhibit 5 — Real Estate Lending by Japanese Banks

Japan Real Estate Fourth Quarter 2016 | October 2016 7
3.2 Pricing Office appraisal cap rates in Tokyo declined to a preliminary 3.7% in the second quarter of 2016, a 20 basis point drop from a year earlier. Cap rates still remain under pressure on the back of continuous investment demand in the real estate market. The average office yield spread — the difference between the cap rates and 10 year bond yields — sharply widened to 490 basis points in Tokyo in the second quarter of 2016 triggered by the negative government bond yield, highlighting the relative attractiveness of the market.
Appraisal Cap Rate Office Yield Spread (Average Transacted)
Sources: Association for Real Estate Securitization, TMAX, Real Capital Analytics, Bloomberg, Deutsche Asset Management. As of Sept 2016
Past performance is not a reliable indicator of future performance
The capital value for grade-A office in Central Tokyo was JPY7.5 million per tsubo
4 in June 2016, a 13%
decline from the third quarter of 2015, the recent peak of the capital value. The unit price of office buildings usually follows about one year behind the listed J-REIT index, and a mild value increase could be possible given the recently widened gap between these two indices.
Sources: Daiwa Real Estate Appraisal, Bloomberg, Deutsche Asset Management. As of Sept 2016
4 Tsubo is a Japanese unit of area. It is equivalent to 3.3 square metres (35.6 square feet)
3.0%
3.5%
4.0%
4.5%
5.0%
5.5%
6.0%
6.5%
Q1
Q2
Q3
Q4
Q1
Q2
Q3
Q4
Q1
Q2
Q3
Q4
Q1
Q2
Q3
Q4
Q1
Q2
Q3
Q4
Q1
Q2
Q3
Q4
Q1
Q2
Q3
Q4
Q1
Q2
Q3
Q4
Q1
Q2
Q3
Q4
Q1
Q2
07 08 09 10 11 12 13 14 15 16
Tokyo Office Osaka Office
Tokyo Residential Osaka Residential
TMAX Economic
preliminary
Exhibit 8 — Real Estate Capital Value in Japan
Exhibit 7 — Cap Rate and Yield Spread

8 Japan Real Estate Fourth Quarter 2016 | October 2016
3.3 Transactions Exhibit 9 shows major real estate transactions completed or announced since July 2016 where listed J-REITs remained the dominant buyers group in most sectors except for retail. The largest transaction was the acquisition of a portfolio of Top REIT which was merged with Nomura Real Estate Master Fund (J-REIT) for JPY172 billion for its 19 assets, followed by nine logistics properties acquired by Mitsui Fudosan Logistics Park (J-REIT) for JPY76 billion at its initial public offering. Other big portfolio deals include the acquisitions by Sakura Sogo REIT and Samty Residentail both of which were over JPY50 billion. A single largest transaction was a partial sale of Harumi Island Triton Square Tower Y by Idera Capital Management for JPY50 billion.
Notes: Acquisitions by foreign managers are highlighted in gray and by J-REITs in yellow. This table is prepared solely for information purposes and not intended to recommend or endorse any specific company's shares or other products. Although information in this document has been obtained from sources believed to be reliable, we do not guarantee its accuracy, completeness or fairness, and it should not be relied upon as such.
Source: Real Capital Analytics; Deutsche Asset Management, Sept 2016
Tokyo’s volume of commercial real estate transactions for the rolling 12-month period ended September 2016 was US$23.3 billion, flat from the previous periods ended June 2016. It overtook Paris and ranked fifth among global cities and kept the first position in the Asia Pacific region. According to our own estimates 38% of transactions in Tokyo were purchases by listed J-REITs and 13% by foreign capital respectively. Osaka reported US$4.6 billion for the same period, ranking ninth in Asia Pacific with slightly smaller transaction volumes than Beijing and Seoul.
Notes: Commercial real estate transactions exclude non-income producing assets, such as development site transactions
Sources: Real Capital Analytics, Deutsche Asset Management. As of Sept 2016
Type AssetPrice
(JPY bn)
Unit price
(JPYm
/GFA sqm)
Cap rate Location Month Acquired byInvestor
Origin
NEC HQ etc. (19 Props, merger of Top Reit) 172 0.75 3.9% Tokyo Sep-16 Nomura Master Fund J-REIT
Harumi Island Triton Square Tower Y (3F-15F) Est 50 1.01 - Tokyo Jul-16 Idera-Fosun China
Sharp Tanabe Bldg 14 0.38 - Osaka Oct-16 Sharp Japan
Umeda Gate Tower (5-20FL) 19 1.56 4.3% Osaka Sep-16 Activia J-REIT
Ochanomizu Solacity 15 - 3.9% Tokyo Oct-16 Hulic REIT J-REIT
Aeon Mall Higashiura etc. (2 Props) 15 - - Aichi etc Aug-16 Yamada Denki Japan
Mitsui Shopping Park LaLaport 15 0.21 5.0% Saitama Aug-16 Frontier REIT J-REIT
Shinjuku Higashiguchi Bldg 13 2.59 - Tokyo Sep-16 Fuyo General Lease Japan
Shinsaibashi GIGO 12 4.12 - Osaka Sep-16 Foreign Investor -
Aeon Mall Kashiihama 10 0.13 5.7% Fukuoka Sep-16 GK Double 05 Japan
MFLP Kuki etc. (9 Props) 76 - - Saitama etc. Sep-16 Mitsui Fudosan Logistics J-REIT
GLP Atsugi 2 etc. (4 Props) 43 0.27 4.7% Kanagawa etc. Sep-16 GLP J-REIT
Shin-Kiba Logistics Center 15 0.31 5.0% Tokyo Jul-16 Japan Logistics Fund J-REIT
Apartment S-Fort etc. (20 Props) 52 - 5.3% Osaka etc. Jul-16 Samty Residential J-REIT
Hotel Vista Grande Osaka etc. (3Props) 47 - 5.0% Osaka etc Jul-16 Japan Hotel REIT J-REIT
Ooedo Onsen Reoma Resort etc. (9 Props) 27 - 4.9% Kagawa etc. Sep-16 Ooedo Onsen REIT J-REIT
Nest Hotel Osaka Shinsaibashi etc. (10 Props) 27 - - Osaka etc. Aug-16 Ichigo Hotel REIT J-REIT
Seishin Building etc. (18 Props) 57 - - Tokyo etc. Sep-16 Sakura Sogo REIT J-REIT
Artisa Sendai etc. (17 Props) 16 - - Miyagi etc. Aug-16 Marimo Regional REIT J-REIT
Office
Retail
Logistics
Hotel/
Healthcare
Portfolio
35%
16%
66%
21%
13%
32%
21%
19%
13%
8%
69%
57%
58%
1%
26%
18%
27%
5%
0 10 20 30 40 50 60 70 80
NYC Metro
LA Metro
London Metro
SF Metro
Paris
DC Metro
Chicago
Hong Kong
Shanghai
Sydney
Singapore
Melbourne
Beijing
Seoul
Taipei
Guangzhou
Office Retail Apartment Industrial Hotel
Tokyo
($bn)
Osaka
~
~
(of which cross border %)
J-REIT Domestic Foreign
Exhibit 10 — Real Estate Transaction Volume by City (12 months rolling)
Exhibit 9 — Major Transactions in the Third Quarter 2016

Japan Real Estate Fourth Quarter 2016 | October 2016 9
3.4 Performance The average annual total return for unlevered direct real estate investment in Japan rose to preliminary 9.0% in May 2016 (the latest period available), from 8.4% a year earlier. Among property sectors, the industrial sector made the highest annual return of 9.7% during the period, followed by residential (8.1%), office (8.0%) and then retail (7.7%) sectors respectively.
Total Return by Component Total Return by Sector
Notes: There is a time lag because of raw data being collected through semi-annual reports. Past performance is not indicative of future results
Sources: MSCI Real Estate - IPD, Deutsche Asset Management. As of Sept 2016
3.5 J-REITs J-REITs remain a popular product among yield seeking investors while it has traded soft in the last six months since the rate hike probability in the United States. As of mid October 2016, J-REIT stock traded at a 2.1% premium since the beginning of the year, while the Nikkei 225, a broader stock market, experienced a decline of 11% in the same period.
J-REIT Index and Nikkei 225 (5-year) Global REIT Comparison (10-year)
J-REIT Index and Nikkei 225 (5-year) Notes: Past performance is not indicative of future results. Tokyo Stock Exchange REIT Index (J-REIT), FTSE NAREIT All Equity REITS Index (US-REIT), S&P/ASX 200 A-REIT Index (A-REIT), FTSE ST REIT Index (S-REIT)
Sources: Bloomberg, Deutsche Asset Management. As of Sept 2016
-10%
-5%
0%
5%
10%
15%
2003
2005
2008.0
6
2008.1
2
2009.0
6
2009.1
2
2010.0
6
2010.1
2
2011.0
6
2011.1
2
2012.0
6
2012.1
2
2013.0
6
2013.1
2
2014.0
6
2014.1
2
2015.0
6
2015.1
2
2016.0
5
Office Retail Residential Industrial
Preliminary
Exhibit 12 — J-REIT Index and Long-Term Global Comparison
Exhibit 11 — Real Estate Total Returns in Japan (unlevered)
10 Japan Real Estate Fourth Quarter 2016 | October 2016
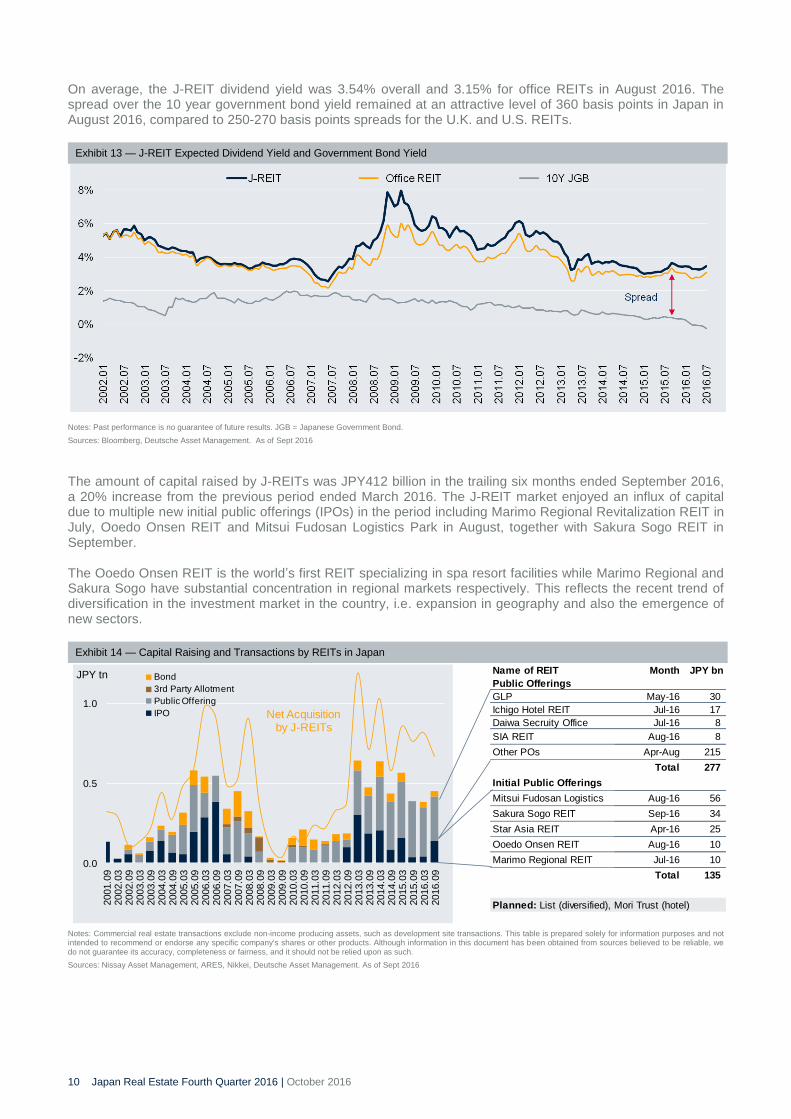
On average, the J-REIT dividend yield was 3.54% overall and 3.15% for office REITs in August 2016. The spread over the 10 year government bond yield remained at an attractive level of 360 basis points in Japan in August 2016, compared to 250-270 basis points spreads for the U.K. and U.S. REITs.
Notes: Past performance is no guarantee of future results. JGB = Japanese Government Bond.
Sources: Bloomberg, Deutsche Asset Management. As of Sept 2016
The amount of capital raised by J-REITs was JPY412 billion in the trailing six months ended September 2016, a 20% increase from the previous period ended March 2016. The J-REIT market enjoyed an influx of capital due to multiple new initial public offerings (IPOs) in the period including Marimo Regional Revitalization REIT in July, Ooedo Onsen REIT and Mitsui Fudosan Logistics Park in August, together with Sakura Sogo REIT in September. The Ooedo Onsen REIT is the world’s first REIT specializing in spa resort facilities while Marimo Regional and Sakura Sogo have substantial concentration in regional markets respectively. This reflects the recent trend of diversification in the investment market in the country, i.e. expansion in geography and also the emergence of new sectors.
Notes: Commercial real estate transactions exclude non-income producing assets, such as development site transactions. This table is prepared solely for information purposes and not intended to recommend or endorse any specific company's shares or other products. Although information in this document has been obtained from sources believed to be reliable, we do not guarantee its accuracy, completeness or fairness, and it should not be relied upon as such.
Sources: Nissay Asset Management, ARES, Nikkei, Deutsche Asset Management. As of Sept 2016
Name of REIT Month JPY bn
Public Offerings
GLP May-16 30
Ichigo Hotel REIT Jul-16 17
Daiwa Secruity Office Jul-16 8
SIA REIT Aug-16 8
Other POs Apr-Aug 215
Total 277
Initial Public Offerings
Mitsui Fudosan Logistics Aug-16 56
Sakura Sogo REIT Sep-16 34
Star Asia REIT Apr-16 25
Ooedo Onsen REIT Aug-16 10
Marimo Regional REIT Jul-16 10
Total 135
Planned: List (diversified), Mori Trust (hotel)
0.0
0.5
1.0
2001.0
92002.0
32002.0
92003.0
32003.0
92004.0
32004.0
92005.0
32005.0
92006.0
32006.0
92007.0
32007.0
92008.0
32008.0
92009.0
32009.0
92010.0
32010.0
92011.0
32011.0
92012.0
32012.0
92013.0
32013.0
92014.0
32014.0
92015.0
32015.0
92016.0
32016.0
9
Bond
3rd Party Allotment
Public Offering
IPO
JPY tn
Net Acquisitionby J-REITs
Exhibit 14 — Capital Raising and Transactions by REITs in Japan
Exhibit 13 — J-REIT Expected Dividend Yield and Government Bond Yield

Japan Real Estate Fourth Quarter 2016 | October 2016 11
The preliminary volume of commercial real estate transactions in Japan in the six months to September 2016 was JPY1.4 trillion, a 30% decline from the same period the previous year. Acquisitions by J-REITs accounted for more than 50% of all reported transactions in the same six months, on the back of multiple REIT IPOs reported in the period.
Notes: E = preliminary estimate. Commercial real estate transactions exclude non-income producing assets, such as development site transactions
Sources: ARES, Urban Research Institute, Real Capital Analytics, Deutsche Asset Management. As of Sept 2016
Exhibit 15 — Real Estate Transactions in Japan and J-REIT Share

12 Japan Real Estate Fourth Quarter 2016 | October 2016
4 Market Fundamentals
4.1 Office The average office vacancy rate in Tokyo’s central five wards recovered to 3.9% in August 2016, from 4.3% in March 2016. No large sized buildings were brought to market in the recent months while a couple of sizable assets are in the pipeline in the final quarter of this year, including Roppongi Grand Tower and Kyobashi Edogrand. The average vacancy rate at twenty six newly-developed buildings completed within the last 12 months in Tokyo recovered from 29.4% to 16.7% in the same period.
Notes: GFA = gross floor area. sqm = square metres. There is no guarantee the supply pipeline will materialize Sources: Miki Shoji, Nikkei Real Estate Market Report, Company information, Deutsche Asset Management. As of Sept 2016
Despite the gradual recovery in the vacancy rate, the average rent free period offered to office tenants recovered only mildly from 3.2 months in March 2016 to 2.8 months in June 2016. This reflects the current occupier market trend where landlords still need to provide decent amount of incentives to attract new tenants even with the tight vacancy rate, and therefore increasing rents would not be an easy negotiation.
Notes: sqm = square metres
Sources: Sanko Estate, Xymax Real Estate Institute, Deutsche Asset Management. As of Sept 2016
Building Date Floors GFA (sqm)
Shinjuku Garden Tower Mar-16 37 55,817
JR Shinjuku Miraina Tower Mar-16 32 55,000
Otemachi Fin. City Gran Cube Apr-16 31 108,330
Tokyo Garden Terrace May-16 36 110,000
Roppongi Grand Tower Oct-16 40 103,620
Kyobashi Edogrand Oct-16 32 66,590
Sumitomo RD Azabu Juban Dec-16 10 33,571
Ginza 6 chome Project Jan-17 13 38,000
Otemachi Park Bldg Jan-17 29 60,710
Uchisaiwai-cho 2 chome Project May-17 21 57,500
Akasaka InterCity AIR Aug-17 38 79,200
Meguro Sta. Redevelopment Nov-17 27 47,223
Shin Hibiya Project 2018 35 115,500
Nishi Shinagawa 1 chome 2018 24 130,656
Hamamatsucho 2 Area A 42 ttl 270,000
Nissay Hamamatsucho Crea Tw 29 51,900
TGMM Shibaura Tower A 2018 31 101,400
〃 Tower B 2019 36 118,400
Toranomon Trust City World Gate 2018 36 ttl 210,000
Otemachi 2 chome Tower A 35 173,250
〃 Tower B 32 97,152
Shibuya Sta. South 2018 35 45,000
Shibuya Sta. Dogenzaka 2018 18 58,900
Marunouchi 3-2 Project 2018 30 89,100
Toranomon Hills Business Tower 2019 36 94,000
Toranomon Hills Station Tower 2022 - 174,800
Supply Pipeline in Tokyo
2018
2018
Exhibit 17 — Office Vacancy Rate and Rent Free Period in Tokyo
Exhibit 16 — Office Vacancy Rate and Supply in Central Tokyo (5 wards)
Japan Real Estate Fourth Quarter 2016 | October 2016 13
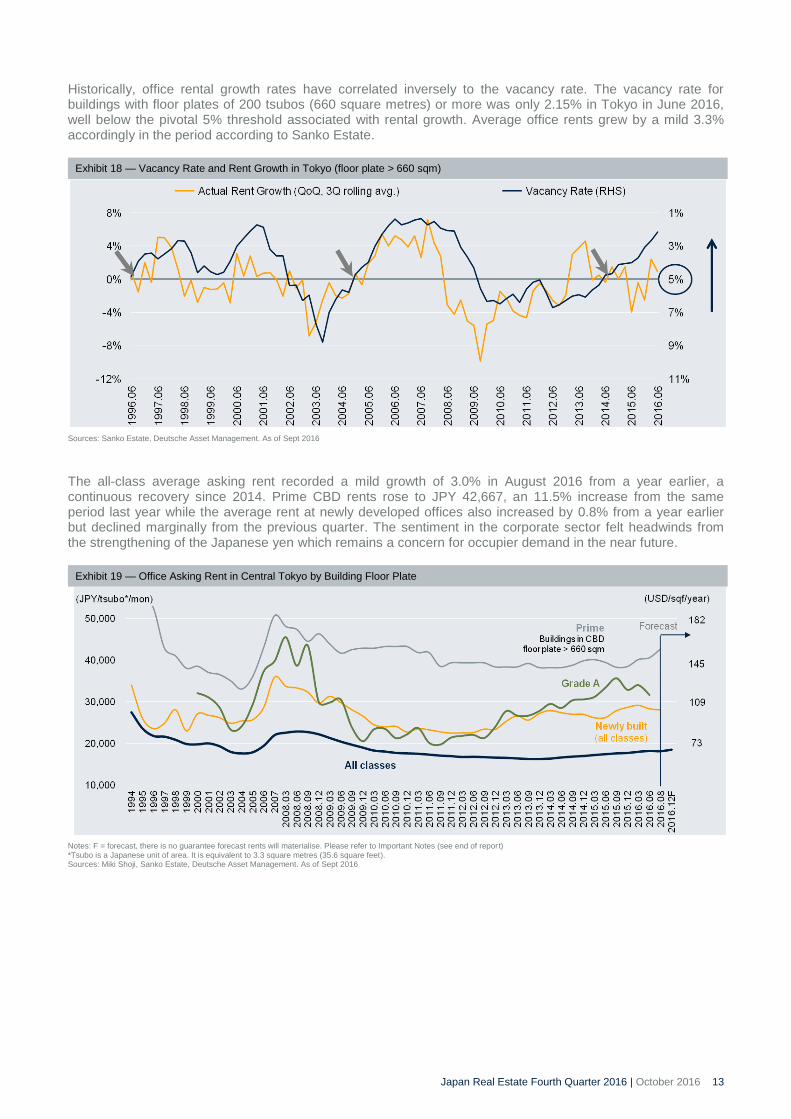
Historically, office rental growth rates have correlated inversely to the vacancy rate. The vacancy rate for buildings with floor plates of 200 tsubos (660 square metres) or more was only 2.15% in Tokyo in June 2016, well below the pivotal 5% threshold associated with rental growth. Average office rents grew by a mild 3.3% accordingly in the period according to Sanko Estate.
Sources: Sanko Estate, Deutsche Asset Management. As of Sept 2016
The all-class average asking rent recorded a mild growth of 3.0% in August 2016 from a year earlier, a continuous recovery since 2014. Prime CBD rents rose to JPY 42,667, an 11.5% increase from the same period last year while the average rent at newly developed offices also increased by 0.8% from a year earlier but declined marginally from the previous quarter. The sentiment in the corporate sector felt headwinds from the strengthening of the Japanese yen which remains a concern for occupier demand in the near future.
Notes: F = forecast, there is no guarantee forecast rents will materialise. Please refer to Important Notes (see end of report) *Tsubo is a Japanese unit of area. It is equivalent to 3.3 square metres (35.6 square feet). Sources: Miki Shoji, Sanko Estate, Deutsche Asset Management. As of Sept 2016
Exhibit 19 — Office Asking Rent in Central Tokyo by Building Floor Plate
Exhibit 18 — Vacancy Rate and Rent Growth in Tokyo (floor plate > 660 sqm)

14 Japan Real Estate Fourth Quarter 2016 | October 2016
Vacancy rates have continued to recover in major regional cities in the period ended August 2016. It decreased to 3.9% in Sapporo, 5.2% in Fukuoka, 6.0% in Osaka and 6.7% in Nagoya, respectively recovering from the previous quarter. There were no new completions of significant office buildings in any of these regional markets in the third quarter of 2016 and the vacancy rate was at the lowest level in more than 20 years in Sapporo.
Notes: There is no guarantee forecast rents will materialise. Please refer to Important Notes (end of report). GFA = gross floor area. sqm = square metres Sources: Miki Shoji, Nikkei Real Estate Market Report, Company information, Deutsche Asset Management. As of Sept 2016
0
4
8
12
16
19
97
19
98
19
99
20
00
20
01
20
02
20
03
20
04
20
05
20
06
20
07
20
08
20
09
20
10
20
11
20
12
20
13
20
14
20
15
20
16
.03
20
16
.08
Sapporo Fukuoka Nagoya
Osaka Tokyo
(%)Building Date Floors GFA (sqm)
Dai Nagoya Bldg Oct-15 34 65,000
JP Tower Nagoya Nov-15 40 80,000
JRJP Hakata Bldg (Fukuoka) Apr-16 12 44,000
Symphony Toyota Bldg (Nagoya) Jun-16 25 15,444
JR Gate Tower (Nagoya) 2017 46 45,030
Nakanoshima Fes Twr W (Osaka) 2017 41 67,750
Global Gate West (Nagoya) 36
Global Gate East (Nagoya) 17
MM21 32 Office 1 (Yokohama) 15
MM21 32 Office 2 (Yokohama) 6
Nishiki 2 chome Project (Nagoya) 2018 21 45,586
Shin Nankai Kaikan (Osaka) 2018 29 34,650
Sousei 111 (Sapporo) 2018 28 35,112
Umeda 3 chome (Osaka) 2019 40 120,000
Umeda 1 chome (Osaka) 2022 42 270,000
2017 ttl 55,578
2017 ttl 157,000
Supply Pipeline in Regional Cities
Exhibit 20 — Office Vacancy Rates in Major Cities in Japan (all grades)

Japan Real Estate Fourth Quarter 2016 | October 2016 15
4.2 Retail Despite tourist consumption expanding by 7.2% in the second quarter of 2016 on a year-on-year basis, the growth rate is slowing down. High street retail rents were broadly flat in Japan over the first quarter of 2016. Rents rose slightly by 0.9% in Shinjuku, while they declined marginally in other submarkets including Omotesando, Ginza, Shibuya, Ikebukuro (all in Tokyo) and in Shinsaibashi (Osaka) respectively.
Sources: Style Act, Miki Shoji, Deutsche Asset Management. As of Sept 2016
Past growth is not a reliable indicator of future growth
Sales at convenience stores in Japan increased by 0.5% in July and August in 2016 from the same period last year, while sales at other store types declined including chain stores (1.4% on nationwide) and shopping centers (1.5% in top 13 cities) in the same period. Sales at department stores declined most, by 3.1% in Tokyo and Osaka, due to the recent strengthening of the Japanese yen, causing a slowdown of luxurious goods sales among inbound foreign shoppers.
Source: Japan Council of Shopping Center, Japan Franchise Association, Japan Chain Store Association, Japan Department Store Association, Deutsche Asset Management, Sept 2016
-15%
-10%
-5%
0%
5%
10%
15%
20
00
20
01
20
02
20
03
20
04
20
05
20
06
20
07
20
08
20
09
20
10
20
11
2012
2013
.03
2013
.06
2013
.09
2013
.12
2014
.03
2014
.06
2014
.09
2014
.12
2015
.03
2015
.06
2015.0
9
2015
.12
2016
.03
2016
.06
2016
.08
Shopping Center (13 cities) Dept Store (Tokyo/Osaka) Chain Store (nationwide) Convenience Store
(for existing stores for all categories)
VAT hike
Exhibit 22 — Retail Sales Growth by Store Category (year on year)
Exhibit 21 — High Street Average Rents in Tokyo and Osaka
16 Japan Real Estate Fourth Quarter 2016 | October 2016
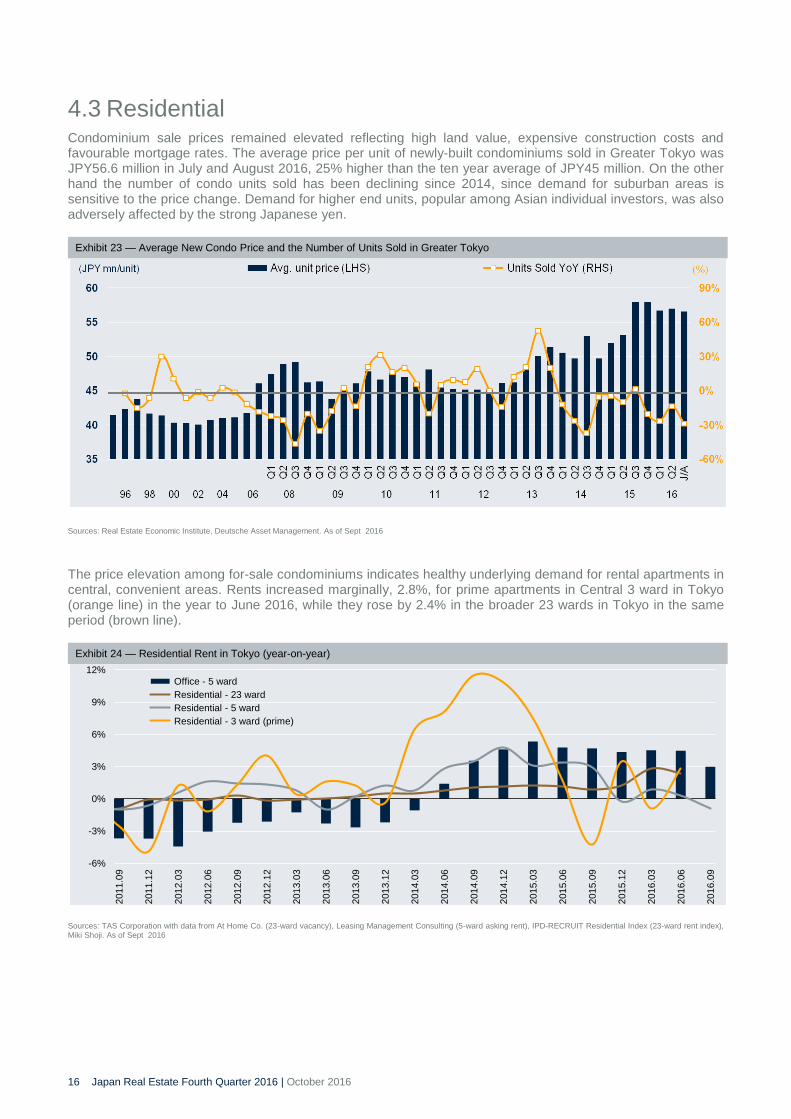
4.3 Residential Condominium sale prices remained elevated reflecting high land value, expensive construction costs and favourable mortgage rates. The average price per unit of newly-built condominiums sold in Greater Tokyo was JPY56.6 million in July and August 2016, 25% higher than the ten year average of JPY45 million. On the other hand the number of condo units sold has been declining since 2014, since demand for suburban areas is sensitive to the price change. Demand for higher end units, popular among Asian individual investors, was also adversely affected by the strong Japanese yen.
Sources: Real Estate Economic Institute, Deutsche Asset Management. As of Sept 2016
The price elevation among for-sale condominiums indicates healthy underlying demand for rental apartments in central, convenient areas. Rents increased marginally, 2.8%, for prime apartments in Central 3 ward in Tokyo (orange line) in the year to June 2016, while they rose by 2.4% in the broader 23 wards in Tokyo in the same period (brown line).
Sources: TAS Corporation with data from At Home Co. (23-ward vacancy), Leasing Management Consulting (5-ward asking rent), IPD-RECRUIT Residential Index (23-ward rent index), Miki Shoji. As of Sept 2016
-6%
-3%
0%
3%
6%
9%
12%
2011.0
9
2011.1
2
2012.0
3
2012.0
6
2012.0
9
2012.1
2
2013.0
3
2013.0
6
2013.0
9
2013.1
2
2014.0
3
2014.0
6
2014.0
9
2014.1
2
2015.0
3
2015.0
6
2015.0
9
2015.1
2
2016.0
3
2016.0
6
2016.0
9
Office - 5 ward
Residential - 23 ward
Residential - 5 ward
Residential - 3 ward (prime)
Exhibit 24 — Residential Rent in Tokyo (year-on-year)
Exhibit 23 — Average New Condo Price and the Number of Units Sold in Greater Tokyo

Japan Real Estate Fourth Quarter 2016 | October 2016 17
4.4 Industrial Vacancy rates at multi-tenant logistics assets in Greater Tokyo recovered from 4.6% in March 2016 to 4.4% while they widened from 1.4% to 3.6% in Greater Osaka in the same period. The market is now experiencing an evolutionary change. Space demand for quality space is extremely strong while a record number of large scale logistics assets are being brought to market successively in both Greater Tokyo and Greater Osaka. Rents stayed flat in both markets in the quarter to June 2016.
Vacancy Rate of Multi-tenant Logistics Logistics Rent
Notes: F = forecast, there is no guarantee forecast returns will materialise. Past performance is not indicative of future results. Sources: Ichigo Real Estate Service, Deutsche Asset Management. As of Sept 2016
The annual supply of logistics assets is expected to peak at 1.6 million square meters in 2016 in Greater Tokyo
and at 0.8 million square meters in 2017 in Greater Osaka, all time high in the respective markets, to be
followed by more moderate supply in the following years. The vacancy rates are expected to rise to high single
digits in Greater Tokyo or even higher in Greater Osaka in the next 12 months, before stabilizing in 2017-18.
Greater Tokyo Greater Osaka
Notes: F = forecast, there is no guarantee forecast returns will materialise. Past performance is not indicative of future results. Sources: Ichigo Real Estate Service, Deutsche Asset Management. As of Sept 2016
0%
3%
6%
9%
12%
15%
0.0
0.4
0.8
1.2
1.6
2.0
04
05
06
07
08
09
10
11
12
13
14
15
16F
17F
18F
New Supply (LHS)
Vacancy Rate (RHS)(million sqm)
forecast
0%
3%
6%
9%
12%
15%
0.0
0.2
0.4
0.6
0.8
1.0
04
05
06
07
08
09
10
11
12
13
14
15
16F
17F
18F
New Supply (LHS)
Vacancy Rate (RHS)(million sqm)
forecast
Exhibit 26 — Logistics Supply in Greater Tokyo and Greater Osaka
Exhibit 25 — Logistics Leasing Market in Greater Tokyo and Greater Osaka

18 Japan Real Estate Fourth Quarter 2016 | October 2016
Past Topics of This Report
Vol Year
1 Q2 Jun-08 Making sense of the rental market in Japan
2 Q3 Sep-08 Impact of the credit crunch
3 Q4 Dec-08 Revitalisation of ailing J-REITs
4 Q1 Mar-09 Tokyo office market in its global context
5 Q2 Jul-09 Japan residential market
6 Q3 Oct-09 History repeats itself? A comparison of the ‘Year 2003 Problem’ with 2009
7 Q4 Jan-10 Introducing unit pricing analysis in Japan
8 Q1 Apr-10 Portfolio optimisation analysis in Japan
9 Q2 Jul-10 Japan’s capital market in a global context
10 Q3 Oct-10 Quarterly Report
11 Q4 Jan-11 Cross-border investment into and out of Japan
12 Q1 Apr-11 The Great Tohoku Earthquake and its impact on the Japanese real estate market
13 Q2 Jul-11 Adapting Japan’s land price index for real estate analysis
14 Q3 Oct-11 Quarterly Report
15 Q1 Jan-12 The J-REITs next 10 years
16 Q2 Apr-12 Quarterly Report
17 Q3 Jul-12 Quarterly Report
18 Q4 Oct-12 The inward-looking focus of the real estate investors in Japan
19 Q1 Jan-13 Can the housing tax credit boost demand?
20 Q2 Apr-13 Quarterly Report
21 Q3 Jul-13Logistics : Rapid Modernisation
Underway in the Asia Pacific Region
22 Q4 Oct-13 Quarterly Report
23 Q1 Jan-14 Japan, Asia and Global Investing
24 Q2 Apr-14 Quarterly Report
25 Q3 Jul-14 Quarterly Report
26 Q4 Oct-14 Quarterly Report
27 Q1 Jan-15 Quarterly Report
28 Q2 Apr-15 Emergence of Private REITs in Japan and Implications to the market
29 Q3 Jul-15 Quarterly Report
30 Q4 Oct-15 Quarterly Report
31 Q1 Jan-16 Will the Third Arrow of Abenomics Fly?
32 Q2 Apr-16 Quarterly Report
33 Q3 Jul-16 Impact of Negative Interest Rate
2016
Publication
2011
2012
2013
2015
Research Topic
2008
2009
2010
2014

Japan Real Estate Fourth Quarter 2016 | October 2016 19
Important Notes Deutsche Asset Management represents the asset management activities conducted by Deutsche Bank AG or any of its subsidiaries. Clients will be provided Deutsche Asset Management products or services by one or more legal entities that will be identified to clients pursuant to the contracts, agreements, offering materials or other documentation relevant to such products or services. In the U.S., Deutsche Asset Management relates to the asset management activities of RREEF America L.L.C.; in Germany: RREEF Investment GmbH, RREEF Management GmbH, and RREEF Spezial Invest GmbH; in Australia: Deutsche Australia Limited (ABN 37 006 385 593) is an Australian financial services license holder. Deutsche Australia Limited is not an Authorized Deposit-taking Institution under the Banking Act 1959 nor regulated by APRA. Deutsche Asset Management may also relate to the asset management activities of other regional entities in the Deutsche Bank Group; in Japan: Deutsche Asset Management (Japan) for financial advisory (not investment advisory) and distribution services only; in Hong Kong: Deutsche Bank Aktiengesellschaft, Hong Kong Branch (for direct real estate business), and Deutsche Asset Management (Hong Kong) Limited (for real estate securities business); in Singapore: Deutsche Asset Management (Asia) Limited (Company Reg. No. 198701485N); in the United Kingdom: Deutsche Alternative Asset Management (UK) Limited, Deutsche Alternative Asset Management (Global) Limited and Deutsche Asset Management (UK) Limited; and in Denmark, Finland, Norway and Sweden: Deutsche Alternative Asset Management (UK) Limited and Deutsche Alternative Asset Management (Global) Limited; in addition to other regional entities in the Deutsche Bank Group. This views expressed in this document have been approved by the responsible portfolio management team and Real Estate investment committee and may not necessarily be the views of any other division within Deutsche Asset Management. Key Deutsche Asset Management research personnel are voting members of various investment committees. Members of the investment committees vote with respect to underlying investments and/or transactions and certain other matters subjected to a vote of such investment committee. This material was prepared without regard to the specific objectives, financial situation or needs of any particular person who may receive it. It is intended for informational purposes only. It does not constitute investment advice, a recommendation, an offer, solicitation, the basis for any contract to purchase or sell any security or other instrument, or for Deutsche Bank AG or its affiliates to enter into or arrange any type of transaction as a consequence of any information contained herein. Neither Deutsche Bank AG nor any of its affiliates gives any warranty as to the accuracy, reliability or completeness of information which is contained in this document. Except insofar as liability under any statute cannot be excluded, no member of the Deutsche Bank Group, the Issuer or any officer, employee or associate of them accepts any liability (whether arising in contract, in tort or negligence or otherwise) for any error or omission in this document or for any resulting loss or damage whether direct, indirect, consequential or otherwise suffered by the recipient of this document or any other person. The views expressed in this document constitute Deutsche Bank AG or its affiliates’ judgment at the time of issue and are subject to change. This document is only for professional investors. This document was prepared without regard to the specific objectives, financial situation or needs of any particular person who may receive it. No further distribution is allowed without prior written consent of the Issuer. An investment in real estate involves a high degree of risk, including possible loss of principal amount invested, and is suitable only for sophisticated investors who can bear such losses. Any forecasts provided herein are based upon Deutsche Asset Management’s opinion of the market at this date and are subject to change dependent on the market. Past performance or any prediction, projection or forecast on the economy or markets is not indicative of future performance. The forecasts provided are based upon our opinion of the market as at this date and are subject to change, dependent on future changes in the market. Any prediction, projection or forecast on the economy, stock market, bond market or the economic trends of the markets is not necessarily indicative of the future or likely performance. © 2016. Deutsche Bank AG. All rights reserved. MARKETING MATERIAL CD#159598 (10/19), CRS#I-048430-1.2 (10/20)

20 Japan Real Estate Fourth Quarter 2016 | October 2016
Notice to Investors in Switzerland: This presentation document has been prepared upon your request exclusively on a best effort basis and intends to respond to your investment objective/strategy as a sophisticated and qualified investor within the meaning of the Swiss Collective Investment Schemes Act of June 23, 2006 (“CISA”). This document has not been approved by the Swiss Financial Market Supervisory Authority (“FINMA”) under the Swiss Collective Investment Schemes Act of June 23, 2006 ("CISA"). The products contained in this presentation may not be registered with the Swiss Financial Market Supervisory Authority (“FINMA”), and therefore, not supervised by the FINMA. As a result, you cannot claim any protect ion for unregistered products under the CISA. Notice to Investors in the United Kingdom, Denmark, Finland, Norway and Sweden: This document is issued and approved in the United Kingdom by Deutsche Bank AG London Branch. Deutsche Bank AG is authorised under German Banking Law (competent authority: European Central Bank and the BaFin, Germany’s Federal Financial Supervisory Authority) and in the United Kingdom, by the Prudential Regulation Authority. It is subject to supervision by the European Central Bank and by BaFin, Germany’s Federal Financial Supervisory Authority, and is subject to limited regulation in the United Kingdom by the Prudential Regulation Authority and Financial Conduct Authority. Deutsche Bank AG is a joint stock corporation with limited liability incorporated in the Federal Republic of Germany, Local Court of Frankfurt am Main, HRB No. 30 000; Branch Registration in England and Wales BR000005 and Registered Address: Winchester House, 1 Great Winchester Street, London EC2N 2DB. This document is confidential and is being presented for informational and discussion purposes only. Any reproduction and/or redistribution thereof, in whole or in part, and any disclosure of its content without our consent is strictly forbidden. This material was prepared without regard to the specific objectives, financial situation or needs of any particular person who may receive it. It is intended for informational purposes only and it is not intended that it be relied on to make any investment decision. It does not constitute investment advice or a recommendation or an offer or solicitation and is not the basis for any contract to purchase or sell any security or other instrument, or for Deutsche Bank AG and its affiliates to enter into or arrange any type of transaction as a consequence of any information contained herein. Neither Deutsche Bank AG nor any of its affiliates, gives any warranty as to the accuracy, reliability or completeness of information which is contained in this document. Except insofar as liability under any statute cannot be excluded, no member of the Deutsche Bank Group, the issuer or any officer, employee or associate of them accepts any liability (whether arising in contract, in tort or negligence or otherwise) for any error or omission in this document or for any resulting loss or damage whether direct, indirect, consequential or otherwise suffered by the recipient of this document or any other person. The views expressed in this document constitute Deutsche Bank AG or its affiliates' judgment at the time of issue and are subject to change. The value of shares/units and their derived income may fall as well as rise. Past performance or any prediction or forecast is not indicative of future results. This document is only for professional investors. The information contained herein must be kept strictly confidential. No further distribution is allowed without prior written consent of the issuer. Any forecasts provided herein are based upon our opinion of the market as at this date and are subject to change, dependent on future changes in the market. Any prediction, projection or forecast on the economy, stock market, bond market or the economic trends of the markets is not necessarily indicative of the future or likely performance. Investments are subject to risks, including possible loss of principal amount invested. Certain Deutsche Asset Management investment strategies may not be available in every region or country for legal or other reasons, and information about these strategies is not directed to those investors residing or located in any such region or country Past performance is not an indication of future performance. ©2016. All rights reserved. MARKETING MATERIAL.
Japan Real Estate Fourth Quarter 2016 | October 2016 21
Research & Strategy - Alternatives
Office Locations: Team:
Chicago
222 South Riverside Plaza 26th Floor Chicago IL 60606-1901 United States Tel: +1 312 537 7000 Frankfurt
Taunusanlage 12 60325 Frankfurt am Main Germany Tel: +49 69 71909 0 London
Winchester House 1 Great Winchester Street London EC2A 2DB United Kingdom Tel: +44 20 754 58000 New York
345 Park Avenue 24th Floor New York NY 10154-0102 United States Tel: +1 212 454 6260 San Francisco
101 California Street 24th Floor San Francisco CA 94111 United States Tel: +1 415 781 3300 Singapore
Floor 20 One Raffles Quay South Tower Singapore 048583 Tel: +65 6538 7011 Tokyo
Floor 18 Sanno Park Tower 2-11-1 Nagata-cho Chiyoda-Ku Tokyo Japan Tel: +81 3 5156 5000
Global
Mark Roberts Head of Research & Strategy [email protected]
Jaimala Patel Quantitative Strategy [email protected]
Gianluca Minella Infrastructure Research [email protected] Jessica Elengical Head of ESG Strategy [email protected]
Aaron Heffernan Liquid Real Assets Research [email protected]
Americas
Kevin White Head of Strategy, Americas [email protected] Ross Adams Industrial Research [email protected] Bradley Doremus Apartment Research [email protected] Ana Leon Retail Research [email protected]
Brooks Wells Head of Research, Americas [email protected] Erin Patterson Office Research [email protected] Silverio Vasquez Quantitative Research [email protected]
Europe
Simon Wallace Head of Research, Europe [email protected] Tom Francis Property Market Research [email protected] Farhaz Miah Property Market Research [email protected]
Matthias Naumann Head of Strategy, Europe [email protected] Martin Lippmann Property Market Research [email protected] Julien Scarpa Property Market Research [email protected]
Asia Pacific
Koichiro Obu Head of Research & Strategy, Asia Pacific [email protected] Seng-Hong Teng Property Market Research [email protected]
Natasha Lee Property Market Research [email protected] Hyunwoo Kim Property Market Research [email protected]