
Research Report - AHDB Potatoes · Research Report Evaluation of the soil nitrogen supply system...
94
Research Report Evaluation of the soil nitrogen supply system – opportunities for further improvements to the nitrogen economy of the GB potato crop Ref: 807/228 Final Report : July 2004 M F Allison & E J Allen CUF 2004 Research Report 2004/13
Transcript of Research Report - AHDB Potatoes · Research Report Evaluation of the soil nitrogen supply system...

Research Report
Evaluation of the soil nitrogen supply system – opportunities for further improvements to the nitrogen economy of the GB potato crop
Ref: 807/228
Final Report : July 2004
M F Allison & E J Allen CUF
2004 Research Report 2004/13

Additional copies of this report and a list of other publications can be obtained from: Publications Tel: 01865 782222 British Potato Council Fax: 01865 782283 4300 Nash Court e-mail: [email protected] John Smith Drive Oxford Business Park South Oxford OX4 2RT Most of our reports, and lists of publications, are also available at www.potato.org.uk
© British Potato Council
Any reproduction of information from this report requires the prior permission of theBritish Potato Council. Where permission is granted, acknowledgement that the workarose from a British Potato Council supported research commission should be clearlyvisible. While this report has been prepared with the best available information, neither theauthors nor the British Potato Council can accept any responsibility for inaccuracy orliability for loss, damage or injury from the application of any concept or procedurediscussed.

BPC Project Report: Evaluation of the soil nitrogen supply system
BPC improving crop management 3 © British Potato Council 2004
Contents
Preface..................................................................................................................................8
Summary ..............................................................................................................................9
Using measurements of soil mineral nitrogen to make N fertilizer recommendations for potato crops .................................................................................................................10
General introduction to the programme.......................................................................................10 Experiments in 2003 and structure of the report..........................................................................10 Acknowledgments........................................................................................................................10 Effects of N fertilizer on yield of King Edward at Theberton, Suffolk .......................................13
Effects of N fertilizer on yield of Maris Peer at Wrentham, Suffolk.........................................15 Components of yield ....................................................................................................................15 Soil Mineral Nitrogen ..................................................................................................................15
Effects of N fertilizer on yield of Carlingford at Wrentham, Suffolk .......................................17 Components of yield ....................................................................................................................17 Soil Mineral Nitrogen ..................................................................................................................17
Effects of poultry manure and N fertilizer applications on growth and yield of Maris Peer at Goodrich, Herefordshire ...............................................................................................................19
Introduction..................................................................................................................................19 Material and Methods ..................................................................................................................19 Variability of manure and nutrient application............................................................................19 Emergence and Ground Cover.....................................................................................................20 Components of yield and quality .................................................................................................21 Effects of poultry manure and inorganic N of skin set ................................................................23 Soil Mineral Nitrogen ..................................................................................................................24 References....................................................................................................................................25
Effects of N application rate on Maris Peer at Linton, Herefordshire .....................................26 Emergence, ground covers and components of yield ..................................................................26 Soil Mineral Nitrogen ..................................................................................................................26
Effect of N fertilizer on Estima at Allowenshay, Somerset ........................................................28 Components of yield ....................................................................................................................28 Soil Mineral Nitrogen ..................................................................................................................28
Effect of N fertilizer on Estima at North Cadbury, Somerset ...................................................30 Components of yield ....................................................................................................................30 Soil Mineral Nitrogen ..................................................................................................................30
Effect of N application rate on yield of Saturna at East Harling, Norfolk ...............................32 Components of yield ....................................................................................................................32 Soil Mineral Nitrogen ..................................................................................................................32
Effect of N application rate on yield of Russet Burbank at Brettenham, Norfolk...................34 Components of yield ....................................................................................................................34 Soil Mineral Nitrogen ..................................................................................................................34
Effects of N fertilizer on growth and yield of contrasting varieties at CUF.............................36 Emergence and ground covers .....................................................................................................36 Components of yield ....................................................................................................................38

BPC Project Report: Evaluation of the soil nitrogen supply system
BPC improving crop management 4 © British Potato Council 2004
Analysis of the relative merits of the Field Assessment Method and Soil Nitrogen Supply Analysis Method for determining N requirements using 2001-2003 results....42
Effects of soil type and cultivation on soil mineral nitrogen and nitrogen uptake by Cara ...48 Introduction..................................................................................................................................48 Materials and Methods.................................................................................................................48 Emergence and ground covers .....................................................................................................49 Components of yield and N uptake 22 August ............................................................................50 Components of yield and N uptake 2 October.............................................................................51 Relationships between radiation absorption, DM production and N uptake ...............................52 Soil Mineral Nitrogen ..................................................................................................................52
Effects of planting date and N supply on yield and N uptake of Estima at CUF.....................58 Introduction..................................................................................................................................58 Materials and Methods.................................................................................................................58 Results and Discussion ................................................................................................................58
Effect of variety, nitrogen application rate and planting density on canopy form and function..........................................................................................................................................................68
Introduction..................................................................................................................................68 Materials and Methods.................................................................................................................68 Results and Discussion ................................................................................................................69 References....................................................................................................................................81
General conclusions for the experimental programme 2001 – 2003.............................82
List of Tables Table 1. Details of soil, previous cropping, organic manure usage, seed and dates of planting,
defoliation and harvest for SNS experiments in 2003 ......................................................11 Table 2. Details of soil, previous cropping, organic manure usage, seed and dates of planting,
defoliation and harvest for SNS experiments in 2003 ......................................................12 Table 3. Effect of N application rate on components of yield of King Edward at Theberton,
Suffolk...............................................................................................................................14 Table 4. Soil mineral N (kg N/ha) at Theberton, Suffolk ...............................................................14 Table 5. Effect of N application rate on components of yield of Maris Peer at Wrentham, Suffolk.
Harvested 12 August 2003................................................................................................16 Table 6. Soil mineral N (kg N/ha) at Wrentham, Suffolk...............................................................16 Table 7. Effect of N application rate on components of yield of Carlingford at Wrentham, Suffolk.
Harvested 13 August 2003................................................................................................18 Table 8. Soil mineral N (kg N/ha) at Wrentham, Suffolk...............................................................18 Table 9. Variation in rate of poultry manure application and total nutrients applied at Goodrich.
Poultry manure applied 11 March.....................................................................................20 Table 10. Main effects of poultry manure and fertilizer nitrogen on days from planting to 50 %
emergence, total integrated ground cover and integrated ground cover during tuber initiation (% days) at Goodrich.........................................................................................20
Table 11. Effects of poultry manure and N application on number of tubers > 10 mm (1000/ha) at Goodrich............................................................................................................................21
Table 12. Effects of poultry manure and N application on number of tubers > 10 mm per stem at Goodrich............................................................................................................................22

BPC Project Report: Evaluation of the soil nitrogen supply system
BPC improving crop management 5 © British Potato Council 2004
Table 13. Effects of poultry manure and N application on tuber FW yield > 10 mm (t/ha) at Goodrich............................................................................................................................22
Table 14. Effects of poultry manure and N application on tuber FW yield 25-38 mm (t/ha) at Goodrich............................................................................................................................23
Table 15. Effects of poultry manure and N application on percent of skin removed by scuffing barrel after application of Reglone on 9 July, assessed 14 July........................................24
Table 16. Effects of poultry manure and N application on percent of skin removed by scuffing barrel after application of Reglone on 9 July, assessed 24 July........................................24
Table 17. Effects of poultry manure and N applications on soil mineral nitrogen (0-90 cm, kg N/ha) 25
Table 18. Effect of rate of poultry manure application on rate of mineralization at Goodrich 200325 Table 19. Effect of N application rate on components of yield of Maris Peer at Linton,
Herefordshire. Harvested 9 July 2003..............................................................................27 Table 20. Soil mineral N (0-90 cm) at Linton, Herefordshire ..........................................................27 Table 21. Effect of N application rate on components of yield of Estima at Allowenshay, Somerset.
Harvested 20 August 2003................................................................................................29 Table 22. Soil mineral N (kg N/ha) at Allowenshay, Somerset........................................................29 Table 23. Effect of N application rate on components of yield of Estima at North Cadbury,
Somerset. Harvested 21 August 2003 ..............................................................................31 Table 24. Soil mineral N at North Cadbury Somerset (kg N/ha)......................................................31 Table 25. Effect of N application rate on components of yield of Saturna, at East Harling, Norfolk.
Harvested 16 September 2003 ..........................................................................................33 Table 26. Soil mineral N at East Harling, Norfolk ...........................................................................33 Table 27. Effect of N application rate on components of yield of Russet Burbank at Brettenham,
Norfolk. Harvested 29 September 2003...........................................................................35 Table 28. Soil mineral N at Brettenham, Norfolk.............................................................................35 Table 29. Effects of variety and N application rate on integrated ground cover (% days) at CUF ..36 Table 30. Effects of variety and N application rate on number of stems (1000/ha) at CUF.............38 Table 31. Effects of variety and N application rate on the number of tubers > 10 mm per stem at
CUF...................................................................................................................................38 Table 32. Effects of variety and N application rate on number of tubers > 10 mm (000/ha) at CUF
39 Table 33. Effects of variety and N application rate on tuber FW yield > 10 mm (t/ha) at CUF ......39 Table 34. Seasonal variation in tuber FW yield (t/ha) and response to c. 200 kg N/ha at CUF 1997-
2003...................................................................................................................................40 Table 35. Effects of variety and N application rate on tuber DM concentration (%) at CUF ..........41 Table 36. Effects of variety and N application rate on tuber DW yield (t/ha) > 10 mm at CUF......41 Table 37. Summary of N recommendations calculated using the Field Assessment method
(RB 209) and actual N requirement found in experiments ...............................................43 Table 38. Summary of N recommendations using Soil Nitrogen Supply Analysis method and actual
N requirement found in experiments ................................................................................44 Table 39. Summary of regression analyses of actual N requirement found in experiments and N
requirements predicted from Field Assessment method (FAM) and SNS Analysis method (SNS).................................................................................................................................46
Table 40. Timing of operations used to establish the potato crops, CUF, Starveacre Field .............48 Table 41. Effect of soil type and planting date (9 May or 9 June) on growth and components of
yield of Cara. Starveacre Field, harvested 22 August 2003.............................................51 Table 42. Effect of soil type and planting date (9 May or 9 June) on growth and components of
yield of Cara. Starveacre Field, harvested 2 October 2003 .............................................51

BPC Project Report: Evaluation of the soil nitrogen supply system
BPC improving crop management 6 © British Potato Council 2004
Table 43. Effects of soil texture, cultivations and cropping on soil mineral nitrogen (0-90 cm, kg N/ha). CUF, Starveacre Field 2003..................................................................................54
Table 44. Estimates of start date of rapid phase of N mineralization and net mineralization rate using a split-line function. CUF Starveacre Field 2003...................................................54
Table 45. Summary of soil properties and nitrogen mineralization rates in uncultivated plots CUF 2001-2003 .........................................................................................................................55
Table 46. Effect of sampling date on estimated soil mineral N (0-90 cm), SNS Index and N fertilizer recommendation for Cara...................................................................................56
Table 47. Effect of planting date and N application rate on time from planting to 50 % emergence (days) of Estima at CUF....................................................................................................58
Table 48. Effect of planting date and N application rate on integrated ground cover (% days) of Estima at CUF...................................................................................................................59
Table 49. Effect of planting date and N application rate on tuber FW yield > 10 mm (t/ha) of Estima at CUF...................................................................................................................61
Table 50. Effect of planting date and N application rate on total DW yield (t/ha) of Estima at CUF 61
Table 51. Effect of planting date and N application rate on total N uptake at final harvest (kg N/ha) of Estima at CUF...............................................................................................................61
Table 52. Effect of planting date and N application rate on efficiency of DM production (g/MJ) from planting to penultimate harvest of Estima at CUF ...................................................62
Table 53. Effect of planting date and N application rate on date of cessation of net N uptake by canopy (DAE) of Estima at CUF ......................................................................................64
Table 54. Effect of planting date and N application rate on date of change in rate of leaf appearance (DAE) of Estima at CUF...................................................................................................65
Table 55. Effect of planting date and N application rate on amount of N in canopy at cessation of net N uptake by canopy (g N/m2) in Estima at CUF.........................................................65
Table 56. Effect of planting date and N application rate on date at which canopy had senesced to 50 % ground cover (DAE) for Estima at CUF.......................................................................66
Table 57. Effect of variety, plant spacing and N application rate on date of 50 % emergence and total integrated ground cover ............................................................................................69
Table 58. Effect of variety, planting density and N application rate on haulm and tuber growth. Harvested 30 September 2003 (173 DAP) and 7 October 2003 .......................................72
Table 59. Selected details of variety and N experiments at CUF .....................................................74 Table 60. Effect of variety and N application rate on the date of cessation of net canopy N uptake
(DAE)................................................................................................................................76 Table 61. Effect of variety and N application amount of radiation absorbed (MJ/m2) at cessation of
canopy N uptake................................................................................................................76 Table 62. Effect of variety and N application rate on the date of onset of senescence (DAE).........77 Table 63. Estimate of amount of N (kg N/ha) in canopy at cessation of canopy N uptake ..............77 Table 64. Effect of variety and N application rate on harvest index (% of total DM as tuber DM) at
CUF 2003..........................................................................................................................78 Table 65. Effect of variety, plant spacing and N application rate on N uptake by main-axis,
branches and tubers at CUF 2003 .....................................................................................80 Table 66. Effects of variety, plant spacing and N application rate on the average rate of N uptake by
branches and tubers in June and July. CUF 2003 ............................................................81 Table 67. Example of current N recommendation and suggested new N recommendations for
potato crops grown on SNS Index 0/1 without organic manures. Season length is from emergence to defoliation/harvest. New recommendations assume good soil conditions 82

BPC Project Report: Evaluation of the soil nitrogen supply system
BPC improving crop management 7 © British Potato Council 2004
List of Figures Figure 1. Effect of poultry manure and inorganic N fertilizer on ground cover at Goodrich. Key:
□, 0+0; ■, 0+200; ∆, 6+0; ▲, 6+200; ♦, 12+0 and ◊, 12+200. ........................................21 Figure 2. Effect of N application rate on ground cover of four varieties at Cambridge University
Farm 2003. Key: □, 0; ◊, 60; ∆, 120; ■, 180 and ▲, 240 kg N/ha. .................................37 Figure 3. Relationship between soil mineral N and response to c. 200 kg N/ha for Cara, ■, Estima,
□ and Hermes, ∆. CUF 1997-2003 ..................................................................................40 Figure 4. Relationship between actual N requirement and that estimated by (a) Field Assessment
method or (b) SNS Analysis method (b). Key: □, 2001; ◊, 2002 and ∆, 2003; line is 1:1 relationship........................................................................................................................45
Figure 5. Effect of soil texture and planting date on pattern of ground cover development in Cara. Key: □, Light land early planted; ■, Light land late planted; ∆, Heavy land early planted and ▲, Heavy land late planted........................................................................................50
Figure 6. Example of split-line model fitted to soil mineral N results for uncultivated light land at CUF 2003. Squares are measured results and line is fitted results ..................................53
Figure 7. Soil temperature at 10 cm (thin line) and cumulative rainfall and irrigation (thick line) at CUF 2003. Horizontal line corresponds to 13°C.............................................................55
Figure 8. Effect of planting date and N application rate on ground cover development in Estima. Key: □, 0 kg N/ha; ◊, 120 kg N/ha and ∆, 240 kg N/ha. CUF 2003................................60
Figure 9. Relationship between total DM yield and radiation absorbtion for four planting dates. Key: ■, 3 April; ♦, 6 May; □, 2 June and ◊, 30 June of Estima at CUF. ..........................62
Figure 10. Example of total and tuber N uptake for Plot 19 (Planted 3 April, 120 kg N/ha). Symbols are measured values (total ∆ and tubers □) and lines are derived from estimated parameters. The final value for total N uptake has been omitted from the analysis........63
Figure 11. Example of the change of rate of N uptake for Plot 19 (Planted 3 April, 120 kg N/ha)...64 Figure 12. Relationship between ground cover and estimated daily potential evapotranspiration rate
for crops receiving 120 kg N/ha. ......................................................................................67 Figure 13. Effect of variety, plant spacing and N application rate on pattern of ground cover
development. Key: □, 15 cm 0N; ∆, 60 cm 0N ■, 15 cm 300N and ▲, 60 cm 300N.....70 Figure 14. Relationship between total DM yield and rzadiation absorption from planting until
penultimate harvest. ..........................................................................................................73

BPC Project Report: Evaluation of the soil nitrogen supply system
BPC improving crop management 8 © British Potato Council 2004
Preface Application of the new recommendations in the seventh and latest edition of Fertiliser Recommendations for Agricultural and Horticultural Crops (Reference Book 209) has the potential to produce recurrent cost savings across the GB potato area of £7 million/year. The new recommendations have replaced the N index system for estimating the soil’s capacity to supply N to crops with the soil nitrogen supply (SNS) system; based on either ‘field assessment’ as in the old N index system, using information on previous cropping and soil type; or measurement of soil mineral nitrogen (SMN) and crop N in the spring. These changes to the recommendations were made, even though there has been little research on the SMN analysis method specific to potato crops. There was therefore a need for evaluation of the system and opportunities for further improvements in management of nitrogen nutrition for potatoes.
This final report, of interest to both growers and agronomists, covers a study carried out for the BPC at Cambridge University Farm to test different components of the SNS system.
The study has shown that nitrogen recommendations based on soil analysis were no better than those based on information of previous cropping and soil type. However, neither method predicted the large season-to-season variation in crop N requirement observed in this study, indicating a need to develop a better understanding of this seasonal variation. The study also demonstrated that the rate of N net mineralization could double in ploughed and ridged soils compared to those which were uncultivated, with other factors such as soil temperature, moisture content, texture and organic matter content also having an affect. As a result, the study indicated that the timing of soil sampling had a large effect on the amount of soil mineral N measured and the subsequent N recommendations. The work has also provided a potential explanation for the differing N requirements of contrasting varieties, and the influence of agronomic factors on partitioning of N between the canopy and tubers, which affects canopy persistence.
Dr Ewen Brierley, British Potato Council

BPC Project Report: Evaluation of the soil nitrogen supply system
BPC improving crop management 9 © British Potato Council 2004
Summary This report covers the third and final year of the British Potato Council funded project 807/228. The main objectives of this project were to investigate the reliability of N recommendations made using information on soil type and previous cropping (the Field Assessment method) and those based on measurement of soil mineral N in the spring (the Soil Nitrogen Supply Analysis method). In addition, further experiments, co-funded by Cambridge University Farm, investigated the physiological effects of N supply that underpin all N recommendation systems.
The 2003 experiments measured the N requirements of contrasting varieties grown on differing soil types throughout most of the production areas of England. When combined with the 2001 and 2002 data sets, these experiments confirm that Fertilizer Recommendations for Agricultural and Horticultural Crops (Reference Book 209) systematically overestimates the N requirement of potato crops and whilst this did not necessarily result in loss of yield it did result in delayed skin-set, reduced tuber dry matter concentration and, in 2003, reduction in tuber populations in some experiments. Therefore, growers should consider reducing the amount of N applied particularly to short season crops.
Nitrogen recommendations based on soil analysis were no better than those based on information of previous cropping and soil type and therefore cannot be recommended. However, neither method predicted the large season-to-season variation in crop N requirement. Whilst this is of concern, a better understanding of this seasonal variation would result in further opportunities to reduce N inputs whilst maintaining or increasing tuber yields.
A series of experiments were done at Cambridge University Farm in 2001-2003 to better understand the effect of cultivations used to establish potato crops on the mineralization of N from soil organic matter. These experiments showed that, relative to uncultivated soils, the rate of N net mineralization could double in ploughed and ridged soils. However, the rate of mineralization was also affected by factors such as soil temperature, moisture content, texture and organic matter content. The experiments demonstrated that the timing of soil sampling in relation to the sequence of cultivations and environmental conditions had a large effect on the amount of soil mineral N measured and, in consequence, the amount of N recommended. However, this information could not be usefully used to improve the accuracy of N recommendations.
A series of experiments in 2001-2003 used contrasting varieties, plant spacings and N application rates to generate crop canopies of differing structures and persistence. The purpose of these experiments was to improve understanding of the effect of these factors on N requirement and yield formation. Analysis of these experiments has provided a plausible explanation of the physiological basis underlying the differing N requirements of contrasting varieties. Furthermore, the experiments have shown that agronomic factors under grower control (i.e. variety selection, planting density and N regime) affect the partitioning of N between the canopy and tubers and this in turn affects canopy persistence. With further development this improved understanding may result in reliable diagnostic tests that will predict canopy persistence and any requirement for supplementary N applications.

BPC Project Report: Evaluation of the soil nitrogen supply system
BPC improving crop management 10 © British Potato Council 2004
Using measurements of soil mineral nitrogen to make N fertilizer recommendations for potato crops
General introduction to the programme In 2000, the seventh edition of Fertilizer Recommendations for Agricultural and Horticultural Crops (Reference Book 209) was published. In this edition of RB 209, the earlier N index system was replaced with the Soil Nitrogen Supply (SNS) index. For cereals and other arable crops, there are seven Indices (0-6), although for potatoes these have been amalgamated into three groups. There are two methods to estimate a field’s SNS Index. The first is the “Field Assessment” method and uses information on soil type, winter rainfall and previous cropping to estimate the quantity of N that will be supplied by the soil. The second method is the “SNS Analysis” method, which uses direct measurements of the amount of soil mineral N (SMN) and crop N in the spring to determine SNS index. In potatoes, crop N will be zero when sampling for SNS is done and thus values for SNS will be equivalent to SMN. However, for consistency, SNS will be used throughout this report. For both methods once the SNS Index has been estimated, information on variety and season length are then used to calculate N fertilizer requirement.
Despite a paucity of evidence to support the validity of the SNS Analysis method on potato crops, its use was recommended in the latest edition of Reference Book 209. In 2001, the British Potato Council funded a research programme at Cambridge University Farm to test whether the SNS Analysis method could be used reliably on potato crops. Results from 2001 and 2002 have been published in previous BPC and CUPGRA Annual Reports.
Experiments in 2003 and structure of the report In 2003, fourteen experiments at eight sites tested various components of the SNS system. Most experiments were simple N response experiments that attempted to relate estimates of N requirement made using both the Field Assessment method and measurements of SNS with estimates of optimum N rate measured at harvest. Further experiments were done at Cambridge University Farm which were designed to investigate aspects of N uptake and utilization in more detail. These experiments included: two cultivation experiments designed to further examine the relationship between timing of cultivations and the subsequent interpretation of SNS results in guiding N fertilizer recommendations; a Planting Date and N rate experiment and a Variety, Nitrogen and Planting Density experiment that were designed to explore relationships between N uptake, canopy persistence and tuber yield.
Field, crop and management details for all experiments are given in Table 1 and 2. In this report, the results for individual sites in 2003 will be presented separately and then combined with 2001 and 2002 results to make some general inferences about the relative merits of the Field Assessment method and the SNS Analysis method.
Acknowledgments The authors thanks the following people for their help at the SNS sites: John Chinn at Cobrey Farms; Tim Jolly at W. O. & P. O. Jolly, East Harling; Simon Madge at F. R. Madge and Sons, Ilminster; Archie Montgomery at J. A. & E. Montgomery, North Cadbury; John Poll, Theberton; John Pigg and Stuart Liddell at Wrentham Vegetables.

BPC Project Report: Evaluation of the soil nitrogen supply system
BPC improving crop management 11 © British Potato Council 2004
TABLE 1. DETAILS OF SOIL, PREVIOUS CROPPING, ORGANIC MANURE USAGE, SEED AND DATES OF PLANTING, DEFOLIATION AND HARVEST FOR SNS EXPERIMENTS IN 2003
Theberton Wrentham 1 Wrentham 2 Goodrich Linton Allowenshay North Cadbury O.S. Grid reference TM 441649 TM 505811 TM 506811 SO 565176 SO 662244 ST 387134 ST 642274 pH 7.5 7.5 6.8 7.5 7.4 7.1 6.3 Sand (%) 77 75 70 45 58 26 17 Silt (%) 12 15 18 30 18 51 56 Clay (%) 11 10 12 25 24 23 27 Organic Matter (%) 2.2 2.3 2.5 3.9 2.9 4.4 9.8 Texture Sandy loam Sandy loam Sandy loam Clay loam Sandy clay loam Clay loam Silty clay loam mg P/l (Index) 52 4 64 4 50 4 92 5 33 3 41 3 26 3 mg K/l (Index) 159 2- 198 2 79 1 214 2+ 107 1 181 2+ 201 2+ mg Mg/l (Index) 43 1 38 1 39 1 107 3 165 3 87 2 105 3 Previous crop Sugar Beet Winter Barley Winter Barley Winter Wheat Winter Wheat Sugar Beet Maize Organic manures within previous year
None None None Poultry manure (Treatment)
None None FYM
Variety King Edward Maris Peer Carlingford Maris Peer Maris Peer Estima Estima Grade and count/50 kg E2 1207 E1 891 E1 570 HS 675 HS 1175 E2 2826 E2 1892 Irrigation Yes Yes Yes Yes Yes No Yes Planting date 4 April 23 May 21 May 1 April 31 March 24 April 8 May Defoliation date 1 August 31 July 7 August 9 July n.a. n.a n.a. Final harvest date 12 August 12 August 13 August 23 July 9 July 20 August 21 August

BPC Project Report: Evaluation of the soil nitrogen supply system
BPC improving crop management 12 © British Potato Council 2004
TABLE 2. DETAILS OF SOIL, PREVIOUS CROPPING, ORGANIC MANURE USAGE, SEED AND DATES OF PLANTING, DEFOLIATION AND HARVEST FOR SNS EXPERIMENTS IN 2003
East Harling Brettenham CUF-Cult 1 CUF Cult 2 CUF P date &N CUF V & N CUF V, N & Den O.S. Grid reference TL 995893 TL 942851 TL 424601 TL 425599 TL 426598 TL 427598 TL 428597 pH 7.9 7.9 6.7 7.3 7.3 7.3 7.3 Sand (%) 84 78 81 61 74 74 74 Silt (%) 11 13 13 18 19 19 19 Clay (%) 5 9 6 21 7 7 7 Organic Matter (%) 2.5 2.7 5.0 6.1 7.0 7.0 7.0 Texture Loamy sand Loamy sand Loamy sand Sandy clay loam Loamy sand Loamy sand Loamy sand mg P/l (Index) 72 5 65 4 82 5 74 5 91 5 91 5 91 5 mg K/l (Index) 132 2- 168 2 464 4 715 5 621 3 621 3 621 3 mg Mg/l (Index) 55 2 56 2 99 2 172 3 109 3 109 3 109 3
Previous crop Winter Barley Sugarbeet Winter Barley Winter Barley Winter Barley Winter Barley Winter Barley Organic manures within previous year
None None None None None None None
Variety 1 Saturna Russet Burbank Cara Cara Estima Cara Cara Grade and count/50 kg EC1 764 SE3 1148 EC2 1817 EC2 1817 E2 1969 EC2 2755 EC2 1817 Variety 2 Estima Estima Grade and count/50 kg E2 2826 E2 2826 Variety 3 FL 2006 Grade and count/50 kg AS 2804 Variety 4 Hermes Grade and count/50 kg E2 2909
Irrigation Yes Yes Yes Yes Yes Yes Yes Planting date(s) 9 April 14 April P1 9 May
P2 9 June P1 9 May P2 9 June
P1 3 April P2 6 May P3 2 June P4 30 June
8 April 10 April
Defoliation date 29 August 12 September n.a. n.a n.a n.a n.a Final harvest date 16 September 24 September 2 October 2 October 6 Oct 30 September 7 October

BPC Project Report: Evaluation of the soil nitrogen supply system
BPC improving crop management 13 © British Potato Council 2004
Effects of N fertilizer on yield of King Edward at Theberton, Suffolk This experiment was done near Theberton, Suffolk on land farmed by J Poll. The experiment tested the effects of N fertilizer (0-200 kg N/ha in 50 kg N/ha increments) on the yield of King Edward. Each treatment was replicated five times and allocated at random to blocks. Each plot was 4.8 m long and 4 rows (3.66 m) wide. Seed tubers were planted by hand on 4 April at a spacing of 30 cm (36 454 plants/ha). The N treatments were applied as ammonium nitrate in a single dose at planting. The crop was defoliated on 1 August and a single harvest (2.74 m2) was dug by hand on 12 August from the central rows of each plot. At harvest, soil samples (0-90 cm) were taken from each replicate of the 0 and 150 kg N/ha treatments
Components of yield
At harvest, N had no effect on number of plants or stem population, which averaged 88 000/ha (Table 3). On average, each stem produced 9.2 tubers > 10 mm and this was also unaffected by N application rate. Thus, increasing the amount of N applied from 0 to 200 kg N/ha had no significant effect on tuber population > 10 mm which averaged 795 000/ha. The largest increase in yield resulted from the application of the first 50 kg N/ha. Once the standard errors had been taken into account the probable optimum N application rate was between 100 and 150 kg N/ha. As the amount of N applied was increased from 0 to 200 kg/ha, tuber DM concentration increased from 19.9 to 22.2 %. This effect of N supply is relatively unusual but shows that tuber DM concentration may be increased when N is applied. As a result of the effects of N on yield, the mean tuber size was increased from 43 mm in the absence of N fertilizer to c. 50 mm when 150-200 kg N/ha had been applied.
Soil Mineral Nitrogen
An initial soil sample was taken on 12 March before the field had been cultivated and gave a value of 41 kg N/ha (Table 4). At planting this had increased to 78 kg N/ha, corresponding to an average rate of increase of 1.6 kg N/ha/day. At harvest on 12 August the mean soil N residue was 65 kg N/ha and was not affected by N application rate.

BPC Project Report: Evaluation of the soil nitrogen supply system
BPC improving crop management 14 © British Potato Council 2004
TABLE 3. EFFECT OF N APPLICATION RATE ON COMPONENTS OF YIELD OF KING EDWARD AT THEBERTON, SUFFOLK
N application rate (kg N/ha) Mean 0 50 100 150 200 S.E. Number of mainstems per plant 2.4 2.3 2.5 2.5 2.6 2.2 0.12 Number of mainstems (000/ha) 88 83 90 90 93 82 4.2 Number of tubers > 10 mm per mainstem 9.2 9.0 9.2 9.9 8.9 8.7 0.44 Number of tubers > 10 mm (000/ha) 795 734 819 881 828 712 25.0 Tuber FW yield > 10 mm (t/ha) 49.6 35.5 48.7 51.6 57.3 54.8 2.00 Tuber DM concentration (%) 21.6 19.9 21.8 21.8 22.2 22.2 0.74 Tuber DW yield > 10 mm (t/ha) 10.8 7.0 10.6 11.3 12.7 12.2 0.51 Mean tuber size (µ, mm) 47 43 46 47 49 51 0.7
TABLE 4. SOIL MINERAL N (KG N/HA) AT THEBERTON, SUFFOLK
Date kg N/ha 0-30 cm 30-60 cm 60-90 cm 0-90 cm 12 March 0 18 18 4 41 S.E. 4.7 8.1 1.6 14.2 4 April 0 32 35 10 78 S.E. 3.5 9.0 2.3 10.3 12 August 0 29 25 13 66 150 27 23 15 64 S.E. 6.6 2.3 2.2 7.7

BPC Project Report: Evaluation of the soil nitrogen supply system
BPC improving crop management 15 © British Potato Council 2004
Effects of N fertilizer on yield of Maris Peer at Wrentham, Suffolk This experiment was done at South Cove, Wrentham on land farmed by Wrentham Vegetables Ltd, and tested the effects of six N application rates (0-200 kg N/ha in 40 kg N/ha increments) on the yield of Maris Peer destined for the baby salad potato market. Each treatment was replicated five times and allocated at random to blocks. Each plot was 4 m long and two beds (3.66 m) wide. The crop was machine planted on 23 May at an average spacing of c. 20 cm (82 021 plant/ha). Nitrogen treatments were applied, by hand, at planting as ammonium nitrate in a single application. The crop was defoliated on 31 July and single harvest of 1.83 m2 was dug by hand on 12 August. At harvest soil samples (0-90 cm) were taken from each replicate of the 0 and 80 kg N/ha treatments.
Components of yield The mean plant population was 80 700/ha (mean plant spacing 20.3 cm). Nitrogen application rate had no effect on number of plants or number of stems per plant at final harvest (Table 5) and therefore the stem population (mean 409 000/ha) was independent of N application rate. On average each stem produced c. 1.9 tubers > 10 mm and N had no effect. Owing to the very small number of tubers produced per stem the overall population was small at 758 000/ha. Nitrogen application rate had no consistent effect on tuber yield and the optimum N rate was less than 40 kg N/ha. Thus, even on sandy soils with small organic matter content, short season crops often require very small amounts of N fertilizer. The effects of N fertilizer on tuber DM concentration were also inconsistent but it tended to decrease as the amount of N applied increased. The mean tuber size (µ) was 34 mm, and about 60 % of the total yield was within the 25-38 mm size fraction.
Soil Mineral Nitrogen A soil sample taken on 12 March showed there was 136 kg N/ha in the top 90 cm of soil and by 27 May (4 days after planting) this had increased to 195 kg N/ha (Table 6). This change in soil mineral N was equivalent to a mineralization rate of 0.8 kg N/ha/day. A soil sample taken 1 day after harvest showed the average amount of N remaining in the soil was 82 kg N/ha. Applying 80 kg N/ha did not increase the N residues when compared with 0 kg N/ha.

BPC Project Report: Evaluation of the soil nitrogen supply system
BPC improving crop management 16 © British Potato Council 2004
TABLE 5. EFFECT OF N APPLICATION RATE ON COMPONENTS OF YIELD OF MARIS PEER AT WRENTHAM, SUFFOLK. HARVESTED 12 AUGUST 2003
N application rate (kg N/ha) Mean 0 40 80 120 160 200 S.E. Total number of stems per plant 5.1 4.8 4.9 5.1 5.5 5.2 4.9 0.32 Number of stems (000/ha) 409 379 393 402 458 414 406 29.2 Number of tubers > 10 mm (000/ha) 758 727 825 758 737 823 679 70.2 Number of tubers > 10 mm per stem 1.9 2.0 2.1 1.9 1.6 2.0 1.7 0.16 Tuber FW yield > 10 mm (t/ha) 18.5 19.8 22.6 18.1 15.2 20.1 15.3 1.76 Tuber DM concentration (%) 17.1 18.0 17.9 16.6 17.0 16.5 16.6 0.28 Tuber DW yield > 10 mm (t/ha) 3.18 3.56 4.04 3.02 2.58 3.34 2.54 0.320 Mean tuber size (µ, mm) 34 35 35 33 33 35 34 0.7 Proportion of yield in 25-38 mm (%) 62 57 58 70 60 60 66 3.8 Yield in 25-38 mm grades (t/ha) 11.4 11.1 13.1 12.8 9.2 12.2 10.1 1.29
TABLE 6. SOIL MINERAL N (KG N/HA) AT WRENTHAM, SUFFOLK
Date kg N/ha 0-30 cm 30-60 cm 60-90 cm 0-90 cm 12 March 0 100 27 8 136 S.E. 28.1 4.5 1.8 31.1 27 May 0 124 57 15 195 S.E. 11.6 10.4 1.5 23.1 13 August 0 30 29 21 80 80 35 27 22 84 S.E. 2.6 5.8 4.6 9.5

BPC Project Report: Evaluation of the soil nitrogen supply system
BPC improving crop management 17 © British Potato Council 2004
Effects of N fertilizer on yield of Carlingford at Wrentham, Suffolk This experiment tested the effects of six rates of N (0-200 kg N/ha in 40 kg N/ha increments) on the yield of Carlingford grown at South Cove, Wrentham on land farmed by Wrentham Vegetables Ltd. Each N treatment was replicated five times and allocated at random to blocks. Each plot was 4 m long and four rows (3.66 m) wide. Carlingford seed was planted at 40 cm spacing (27 300 plant/ha), by hand on 21 May and the N treatments applied as ammonium nitrate in a single application. The crop was defoliated on 7 August and a harvest (3.66 m2) was taken by hand on 13 August. At harvest, soil samples (0-90 cm) were taken from each replicate of the 0 and 80 kg N/ha treatments.
Components of yield At harvest, all treatments had c. 100 % plant establishment. However, number of stems per plant was reduced particularly at the largest rates of N application (Table 7). This effect is unusual since N applications normally have little effect on stem population, however, a similar effect was also found this year in a Russet Burbank crop grown at Brettenham (p. 34). At present there is no plausible explanation why this should occur. Nitrogen had no effect on number of tubers > 10 mm per stem, however, due to the effects of N on stem population, tuber populations varied with N application rate but inconsistently. Increasing the N application rate from 0 to 200 kg N/ha had no effect on tuber FW yield > 10 mm and therefore the optimum N application rate was 0 kg N/ha. Increasing the N application rate resulted in a systematic decrease in tuber DM concentration from 18.2 % (at 0 kg N/ha) to 16.4 % (at 200 kg N/ha). Tuber DW yields were reduced by c. 30 % when the amount of N applied was increased from 0 to 200 kg N/ha. Although it was not measured, this decrease in tuber DM yield was probably due to excess N promoting haulm growth at the expense of tuber growth and this effect is particularly important for short season crops.
Soil Mineral Nitrogen An initial soil sampling in early spring (12 March) showed that the soil contained c. 70 kg N/ha (Table 8) and by 27 May this had increased to 159 kg N/ha. This corresponds to an average mineralization rate of c. 1.2 kg N/ha/day. At harvest, the average amount of N remaining in the soil was 151 kg N/ha and, compared with the 0 kg N/ha treatment, applying 80 kg N/ha did not result in any significant increase in N residues although the distribution of N within the soil profile was changed.

BPC Project Report: Evaluation of the soil nitrogen supply system
BPC improving crop management 18 © British Potato Council 2004
TABLE 7. EFFECT OF N APPLICATION RATE ON COMPONENTS OF YIELD OF CARLINGFORD AT WRENTHAM, SUFFOLK. HARVESTED 13 AUGUST 2003
N application rate (kg N/ha) Mean 0 40 80 120 160 200 S.E. Total number of stems per plant 4.1 4.5 4.2 4.3 4.2 3.8 3.6 0.20 Total number of stems (000/ha) 112 124 114 117 116 104 98 5.4 Number of tubers > 10 mm (000/ha) 609 627 570 664 681 571 540 33.8 Number of tubers > 10 mm per stem 5.5 5.1 5.0 5.7 5.9 5.6 5.5 0.27 Tuber FW yield > 10 mm (t/ha) 25.0 27.2 26.3 24.1 26.8 24.3 21.3 2.0 Tuber DM concentration (%) 17.1 18.2 17.5 16.9 16.9 16.7 16.4 0.25 Tuber DW yield > 10 mm (t/ha) 4.29 4.96 4.62 4.08 4.54 4.06 3.50 0.349 Mean tuber size (µ, mm) 40 41 41 39 40 40 40 0.62 Proportion of yield in 25-38 mm (%) 34 34 32 39 34 36 34 1.8 Yield in 25-38 mm grades (t/ha) 8.5 9.2 8.2 9.1 9.2 8.4 7.1 0.50
TABLE 8. SOIL MINERAL N (KG N/HA) AT WRENTHAM, SUFFOLK
Date kg N/ha 0-30 cm 30-60 cm 60-90 cm 0-90 cm 12 March 0 41 20 9 69 S.E. 10.3 1.8 0.8 10.1 27 May 0 90 51 18 159 S.E. 4.2 6.1 2.9 12.6 13 August 0 96 28 33 157 80 45 78 22 145 S.E. 44.6 19.3 7.7 53.8

BPC Project Report: Evaluation of the soil nitrogen supply system
BPC improving crop management 19 © British Potato Council 2004
Effects of poultry manure and N fertilizer applications on growth and yield of Maris Peer at Goodrich, Herefordshire
Introduction Organic manures are applied to about one third of the potato cropping area. Of this c. 75 % is straw-based FYM, 12 % poultry manure, 12 % slurry and the remainder as biosolids and industrial “wastes”. When used correctly these materials may make a valuable contribution towards the nutrition of the crop. However, many growers do not take full account of the nutrients supplied by organic manure due to uncertainty in the quantities of nutrients that will be made available during the growing season. This uncertainty is a particular problem with short season potato crops since organic manures may be contributing a relatively large proportion of their total N requirement. The purpose of this study was to quantify the variability of manure spreading and N supply from manure and to investigate the impact of this variability on crop growth, yield and quality.
Material and Methods The experiment was done at Huntsham, near to Goodrich, Herefordshire on land rented by Cobrey Farms. The experiment was split-plot design with three-fold replication. The main-plots tested three rates of poultry manure application (0, 6 and 12 t/ha) and each main-plot was split into sub-plots that tested five rates of inorganic N (0, 50, 100, 150 and 200 kg N/ha). Each plot was 5.49 m wide (equivalent to three beds) and 6 m long. The sub-plots were randomized into main-plots and the main-plots randomized into blocks. The plots not receiving poultry manure were covered with polythene sheeting and c. 6 t/ha poultry manure was spread by tractor and spreader on 11 March over all plots. The fresh weight of poultry manure on the sheet was recorded on a plot by plot basis and at the same time a sample was taken for subsequent nutrient analysis. The poultry manure remaining on the sheet was then transferred to the appropriate main-plot to achieve an application rate of c. 12 t/ha. The manure was incorporated by ploughing on the same day. Soil samples (0-90 cm) were taken from key treatments on five occasions and analysed for soil mineral N.
Seed of Maris Peer, destined for the baby potato market was planted on 1 April. Ammonium nitrate was applied by hand to the appropriate treatments at planting. In addition, 60 kg P/ha, 120 kg K/ha and 20 kg Mg/ha was applied to the zero poultry manure plots in an attempt to remove the confounding effects of P, K and Mg supplied by the organic manure. Emergence and ground covers were recorded at regular intervals during the growing season. The crop was desiccated with Reglone on 9 July. At final harvest (23 July) an area of 1.83 m2 was taken from the centre bed of each plot. Between desiccation and final harvest, samples of tubers were taken from key treatments and assessed for skin set using a scuffing barrel.
Variability of manure and nutrient application Averaged over the experimental area, the mean rate of poultry manure application was c. 6 t FW/ha with a coefficient of variation (CV) of 22 % (Table 9). Studies by ADAS (Brian Chambers, personal communication) have shown that CV’s of 15-25 % are as low as can be expected particularly when spreading manures at small rates. The total N concentration in poultry manure averaged 4.9 % with a CV of 9 %. The total amount of N applied averaged 155 kg N/ha with a CV of 31 %. Thus, although the manure was spread precisely, the combination of variability of spreading and nutrient concentration resulted in relatively large CVs for total amounts of N applied.

BPC Project Report: Evaluation of the soil nitrogen supply system
BPC improving crop management 20 © British Potato Council 2004
TABLE 9. VARIATION IN RATE OF POULTRY MANURE APPLICATION AND TOTAL NUTRIENTS APPLIED AT GOODRICH. POULTRY MANURE APPLIED 11 MARCH
Application rate of poultry
manure
Total N in
DM
Total N applied
Total P applied
Total K applied
Total Mg applied
(t FW/ha) (% of DM) (kg N/ha) (kg P/ha) (kg K/ha) (kg Mg/ha) Mean 6.0 4.92 155 55 117 20 Maximum 8.2 5.30 218 78 171 30 Minimum 3.9 3.91 86 30 59 12 S.E. 0.34 0.117 12.4 4.1 10.4 1.4 % C.V. 22 9 31 28 35 26
Emergence and Ground Cover When averaged over all treatments, 50 % emergence was achieved c. 35 days after planting (Table 10). Poultry manure had no significant effect on emergence and whilst the small effects of inorganic N were statistically significant, they are unlikely to be of agronomic importance. With the exception of the crops that received no N, all crops achieved c. 100 % ground cover. Increasing the rate of application of poultry manure or inorganic N resulted in significantly larger crop canopies (Figure 1).
TABLE 10. MAIN EFFECTS OF POULTRY MANURE AND FERTILIZER NITROGEN ON DAYS FROM PLANTING TO 50 % EMERGENCE, TOTAL INTEGRATED GROUND COVER AND INTEGRATED GROUND COVER DURING TUBER INITIATION (% DAYS) AT GOODRICH
Poultry manure (t/ha) Fertilizer nitrogen (kg N/ha) Mean 0 6 12 S.E. 0 50 100 150 200 S.E. Emergence 35.1 35.1 35.1 35.1 0.13 34.8 35.2 34.9 35.2 35.3 0.07 Total integrated ground cover
2929 2853 2950 2985 9.7 2858 2875 2878 3004 3030 39.8
Integrated GC during T.I.
715 685 721 739 7.0 679 697 705 742 752 13.1

BPC Project Report: Evaluation of the soil nitrogen supply system
BPC improving crop management 21 © British Potato Council 2004
FIGURE 1. EFFECT OF POULTRY MANURE AND INORGANIC N FERTILIZER ON GROUND COVER AT GOODRICH. KEY: □, 0+0; ■, 0+200; ∆, 6+0; ▲, 6+200; ♦, 12+0 AND ◊, 12+200.
Components of yield and quality On average each plant produced 3.7 stems giving a mean stem population of 307 000/ha and this was not affected by application of poultry manure or inorganic N. The effects of treatments on number of tubers > 10 mm are shown in Table 11. Averaged over all treatments, the mean tuber population was c. one million. The number of tubers was not affected by rate of poultry manure application but there was a statistically significant decrease in tuber population as the rate of inorganic N was increased. The effects of inorganic N on tuber population were due to the effects of inorganic N on number of tubers per stem (Table 12). Increasing the rate of poultry manure application from 0 to 12 t/ha had no statistically significant effect on number of tubers produced per stem. However, increasing the inorganic N supply from 0 to 200 kg N/ha resulted in decrease in number of tubers per stem from 4.1 to 2.9.
TABLE 11. EFFECTS OF POULTRY MANURE AND N APPLICATION ON NUMBER OF TUBERS > 10 MM (1000/HA) AT GOODRICH
Rate of poultry manure application (t/ha) kg N/ha 0 6 12 Mean 0 1206 1410 1118 1245 50 1180 1177 1035 1131 100 1038 1133 1038 1070 150 872 1015 978 955 200 902 809 849 853 Mean 1040 1109 1004 1051 S.E. for poultry manure 27.6; S.E. for N 54.2 S.E. for poultry manure × N 88.4 or 93.9 when comparing same rate of poultry manure
0
20
40
60
80
100
1-May 16-May 31-May 15-Jun 30-Jun
Gro
und
cove
r (%
)

BPC Project Report: Evaluation of the soil nitrogen supply system
BPC improving crop management 22 © British Potato Council 2004
TABLE 12. EFFECTS OF POULTRY MANURE AND N APPLICATION ON NUMBER OF TUBERS > 10 MM PER STEM AT GOODRICH
Rate of poultry manure application (t/ha) kg N/ha 0 6 12 Mean 0 3.7 4.5 3.9 4.1 50 3.9 4.0 3.3 3.7 100 3.3 3.6 3.3 3.4 150 2.9 3.1 3.2 3.1 200 3.0 2.8 3.0 2.9 Mean 3.4 3.6 3.3 3.4 S.E. for poultry manure 0.18; S.E. for N 0.19 S.E. for poultry manure × N 0.34 or 0.32 when comparing same rate of poultry manure
This effect of N supply on number of tubers per stem and, in turn, tuber population is unusual – normally N supply has little or no effect on these variates and these results are unexpected. The number of tubers set per stem is a function of the amount of radiation absorbed by the crop during tuber initiation (T.I.). Earlier work at CUF has shown that for Maris Peer, T.I. starts 17-21 days after 50 % emergence and lasts for 7-14 days. The results in Table 10 show that the treatments had little effect on emergence and therefore all treatments were likely to be initiating tubers at a similar time and, importantly, in similar radiation environments. Analysis of ground cover results during T.I. (19-29 days after 50 % emergence) shows that increasing the N supply from organic manures and inorganic N results in slightly larger canopies (Table 10). These larger canopies would intercept more radiation and this should result in more tubers being initiated. It is likely that increasing the N supply resulted in a shift in dry matter partitioning away from the initiating stolons and towards the haulm. Thus, whilst the crops that had received N were absorbing more solar radiation, a relatively small amount of this was translocated toward the stolons resulting in few tubers set per stem. When averaged over all treatments tuber FW yield > 10 mm was 28 t/ha (Table 13). Applying poultry manure at 12 t/ha reduced tuber yield when compared with 0 or 6 t/ha. Increasing the application rate from 0 to 200 kg N/ha resulted in a continuous decrease in tuber yield.
TABLE 13. EFFECTS OF POULTRY MANURE AND N APPLICATION ON TUBER FW YIELD > 10 MM (T/HA) AT GOODRICH
Rate of poultry manure application (t/ha) kg N/ha 0 6 12 Mean 0 30.1 36.3 31.3 32.6 50 30.2 31.3 28.6 30.0 100 28.4 31.3 28.1 29.3 150 24.7 27.8 22.3 24.9 200 26.0 23.5 22.5 24.0 Mean 27.9 30.0 26.6 28.2 S.E. for poultry manure 0.57; S.E. for N 1.09 S.E. for poultry manure × N 1.79 or 1.89 when comparing same rate of poultry manure

BPC Project Report: Evaluation of the soil nitrogen supply system
BPC improving crop management 23 © British Potato Council 2004
The effects of N supply on tuber FW yield appear to contradict the effect of N supply on integrated ground cover. However, for these short-season crops, it is likely that the adverse effects of N on DM partitioning outweighed any benefit resulting from increased radiation absorption.
The most profitable grade for baby salad potatoes is 25-38 mm. Tuber yield in this grade was significantly reduced when 12 t/ha of poultry manure was applied when compared with 0 or 6 t/ha (Table 14). Increasing the inorganic N supply from 0 to 200 kg N/ha reduced yield in this grade by c. one third.
TABLE 14. EFFECTS OF POULTRY MANURE AND N APPLICATION ON TUBER FW YIELD 25-38 MM (T/HA) AT GOODRICH
Rate of poultry manure application (t/ha) kg N/ha 0 6 12 Mean 0 22.4 27.8 23.1 24.4 50 23.0 25.2 17.0 21.7 100 21.0 22.0 20.5 21.2 150 16.5 18.6 15.6 16.9 200 16.5 14.4 14.5 15.1 Mean 19.9 21.6 18.1 19.9 S.E. for poultry manure 0.71; S.E. for N 1.18 S.E. for poultry manure × N 1.96 or 2.04 when comparing same rate of poultry manure
In summary, irrespective of the amount of poultry manure applied, the optimum N application rate was 0 kg N/ha and applying more resulted in a reduction in total yield, the number of tubers and hence the value of the crop.
Effects of poultry manure and inorganic N of skin set On two occasions after the crop had been defoliated, a representative sample of 30 tubers was taken from the 0 and 100 kg N/ha treatments at each rate of poultry manure application. After scuffing in a scuffing barrel (20 revolutions at 40 revolutions/minute) the tubers were assessed for the percentage of skin removed. Five days after canopy destruction, an average of 9 % of skin was removed by the scuffing barrel (Table 15). The percentage skin removed was independent of the amount of poultry manure applied, however, applying 100 kg N/ha significantly increased the proportion of skin removed. At a second sampling (15 days after haulm destruction), the amount of skin removed averaged 3 % and was not affected by rate of application of either poultry manure or inorganic N (Table 16). Earlier work (CUPGRA Annual Report 2002 p. 39-40) has also demonstrated that excess N delays skin-set in Maris Peer. Bowen (2000), working with a range of varieties estimated that, depending on variety, application of an extra 40-50 kg N/ha resulted in a delay in skin set of 5-7 days. These delays may result in a larger amount of disease and an increased risk of problems within store and emphasise the need for accurate N recommendations.

BPC Project Report: Evaluation of the soil nitrogen supply system
BPC improving crop management 24 © British Potato Council 2004
TABLE 15. EFFECTS OF POULTRY MANURE AND N APPLICATION ON PERCENT OF SKIN REMOVED BY SCUFFING BARREL AFTER APPLICATION OF REGLONE ON 9 JULY, ASSESSED 14 JULY
Rate of poultry manure application (t/ha) kg N/ha 0 6 12 Mean 0 4.1 3.6 4.6 4.1 100 15.4 12.8 12.4 13.5 Mean 9.7 8.2 8.5 8.8 S.E. for poultry manure 2.60; S.E. for N 1.28 S.E. for poultry manure × N 3.04 or 2.22 when comparing same rate of poultry manure
TABLE 16. EFFECTS OF POULTRY MANURE AND N APPLICATION ON PERCENT OF SKIN REMOVED BY SCUFFING BARREL AFTER APPLICATION OF REGLONE ON 9 JULY, ASSESSED 24 JULY
Rate of poultry manure application (t/ha) kg N/ha 0 6 12 Mean 0 3.8 1.9 2.4 2.7 100 1.9 4.7 3.8 3.5 Mean 2.9 3.3 3.1 3.1 S.E. for poultry manure 0.65; S.E. for N 0.95 S.E. for poultry manure × N 1.33 or 1.64 when comparing same rate of poultry manure
Soil Mineral Nitrogen An initial soil sample (11 March) was taken before any cultivations and before application of the poultry manure. At this sampling there was c. 53 kg N/ha (Table 17). In the absence of any poultry manure this value had increased to 150 kg N/ha at the time of planting (1 April). Regression analysis and subsequent analysis of variance showed that between the first and second sampling the average mineralization rate in this treatment was 4.7 kg N/ha/day. When poultry manure was applied at 6 or 12 t FW/ha the initial rate of mineralization was 10 or 23 kg N/ha/day respectively. Thus, on 20 March soil mineral N values of 145 and 258 kg N/ha were found in plots given 6 or 12 t/ha of poultry manure respectively. Between 20 March and 1 April, the rate of mineralization in control plots averaged 4.8 kg N/ha/day. Where poultry manure had been applied the rate of mineralization had decreased to values similar to the control plots. Although limited by the number of samplings these results suggest that after incorporation, N is rapidly mineralized from poultry manures with most N being released within c. two weeks of incorporation. After applying poultry manures, many growers feel it necessary to apply a small amount of inorganic N (i.e. 30 kg N/ha) to ensure that early growth is not limited by slow N mineralization. The results in this experiment demonstrate that this “top up” of N may not be necessary.

BPC Project Report: Evaluation of the soil nitrogen supply system
BPC improving crop management 25 © British Potato Council 2004
TABLE 17. EFFECTS OF POULTRY MANURE AND N APPLICATIONS ON SOIL MINERAL NITROGEN (0-90 CM, KG N/HA)
0 t PM/ha 6 t PM/ha 12 t PM/ha 0 kg N/ha 100 kg N/ha 0 kg N/ha 100 kg N/ha 0 kg N/ha 100 kg N/ha S.E. 11 March 50 55 54 5.9 20 March 93 145 258 7.3 1 April 150 198 345 22.7 22 May 128 214 241 67.4 23 July 156 180 163 175 226 199 19.5
TABLE 18. EFFECT OF RATE OF POULTRY MANURE APPLICATION ON RATE OF MINERALIZATION AT GOODRICH 2003
Rate of manure application (t FW/ha)
Rate of mineralization 0 to 9 days after application (kg N/ha/day)
Rate of mineralization 9 to 21 days after application (kg N/ha/day)
0 4.7 4.8 6 10.0 4.4 12 22.7 7.5 S.E. 0.31 1.44
At final harvest (23 July) there was an average of c. 183 kg N/ha remaining in the soil with no significant differences between organic N and inorganic N treatments. Since there was no response to N in this experiment, it is difficult to estimate the fertilizer replacement value of the poultry manure. The total amount of N supplied by the manure treatments was 155 or 310 kg N/ha. The soil results indicate that, on average c. 45 % of this was made available to the crop – an identical value to that given in RB 209. However, this value was variable ranging from 31 to 63 %.
References BOWEN, S. (2000). Nutritional effects on crop maturity and skin set in potatoes. Nutrition of the Potato Crop – A Technical Update for Advisers and Salesmen. Kelham Hall, Newark. pp 5-9.

BPC Project Report: Evaluation of the soil nitrogen supply system
BPC improving crop management 26 © British Potato Council 2004
Effects of N application rate on Maris Peer at Linton, Herefordshire This experiment was done at Vines Farm, Linton, Herefordshire on land rented by Cobrey Farms and used to produce Maris Peer for the punnet market. The experiments tested six rates of N fertilizer (0-200 kg N/ha in 40 kg N/ha increments) and each N treatment was replicated five times and allocated at random to blocks. The N treatments were applied as ammonium nitrate in a single application. Seed of Maris Peer was planted at 20 cm spacing (82 021 plants/ha) into three-row bed. Each plot was 4 m long and two beds (3.66 m) wide. A single harvest (1.83 m2) was dug by hand on 9 July without prior defoliation. At harvest, soil samples (0-90 cm) were taken from all replicate of 0 and 80 kg N/ha treatments Due to accidental over-planting with the commercial Maris Peer crop, three plots in fifth block were excluded from the analysis.
Emergence, ground covers and components of yield The crop reached 50 % emergence 39 days after planting (9 May) and N application had no significant effect on emergence (Table 19). In terms of integrated ground cover, the optimum N rate was c. 80 kg N/ha as there was no statistically significant increase above this rate. Nitrogen application rate had no effect on number of stems per plant or number of tubers per stem and the average tuber population > 10 mm was 594 000/ha. Overall, tuber FW yields at this site were relatively small (20 t/ha). This may have been due to poor soil conditions, particularly compaction, as a result of many years of intensive cereal production. The optimum N application for tuber FW yield > 10 mm was c. 40 kg N/ha. There was some evidence that the response was overturning and applying the largest rate of N (200 kg N/ha) resulted in a decrease in tuber FW yield. The mean tuber size (µ) was 38 mm, this was increased by applying 40 to 80 kg N/ha but not by larger rates. The yield in the 25-38 mm grades was largest when no N had been applied.
Soil Mineral Nitrogen An initial soil sample taken on the 19 March before any cultivations, showed there was less than 40 kg N/ha in the top 90 cm (Table 20). At planting (31 March) this had increased to c. 70 kg N/ha corresponding to an average rate of mineralization of 2.6 kg N/ha/day. At harvest on 9 July, soil mineral N residues were 46 kg N/ha where no N had been applied and 68 kg N/ha where 120 kg N/ha had been applied.

BPC Project Report: Evaluation of the soil nitrogen supply system
BPC improving crop management 27 © British Potato Council 2004
TABLE 19. EFFECT OF N APPLICATION RATE ON COMPONENTS OF YIELD OF MARIS PEER AT LINTON, HEREFORDSHIRE. HARVESTED 9 JULY 2003
N application rate (kg N/ha) Mean 0 40 80 120 160 200 S.E. Days from planting to 50 % emergence 38.8 38.9 38.7 38.4 38.9 38.9 38.8 0.26 Integrated ground cover (% days) 2763 2184 2614 2921 2945 2905 3009 70.8 Total number of stems per plant 2.5 2.4 2.6 2.5 2.5 2.7 2.4 0.08 Total number of stems (000/ha) 204 195 209 203 204 219 197 6.6 Number of tubers > 10 mm (000/ha) 594 570 639 576 609 612 555 30.0 Number of tubers > 10 mm per stem 2.9 3.0 3.1 2.8 2.9 2.8 2.9 0.12 Tuber FW yield > 10 mm 20.2 16.4 20.2 21.9 21.3 21.6 19.7 0.81 Tuber DM concentration (%) 22.8 23.7 23.2 23.0 22.7 22.1 22.1 0.21 Tuber DW yield > 10 mm (t/ha) 4.59 3.87 4.69 5.04 4.82 4.78 4.37 0.206 Mean tuber size (µ, mm) 38 36 38 39 38 39 40 0.4 Proportion of yield in 25-38 mm (%) 48 66 51 42 47 41 38 2.6 Yield in 25-38 mm size range (t/ha) 9.4 10.8 10.3 9.1 9.8 8.7 7.5 0.63
TABLE 20. SOIL MINERAL N (0-90 CM) AT LINTON, HEREFORDSHIRE
Nitrogen application rate 0 kg N/ha 80 kg N/ha S.E. 19 March 37 4.0 31 March 68 6.8 9 July 46 68 3.4

BPC Project Report: Evaluation of the soil nitrogen supply system
BPC improving crop management 28 © British Potato Council 2004
Effect of N fertilizer on Estima at Allowenshay, Somerset This experiment was done at Allowenshay, near Ilminster, Somerset on land rented by S. Madge. The experiment was designed to test the effects of N application rate (0-250 kg N/ha in 50 kg N/ha increments) on the yield of Estima. Each N treatment was replicated five times and allocated at random to blocks and each plot was 4.8 m long and 4 rows (3.66 m) wide. Estima seed was planted by hand at 30 cm spacing (36 454 plant/ha) on 24 April. Nitrogen treatments were applied as a single application of ammonium nitrate at planting. A single harvest of 3.29 m2 was dug by hand from the central rows of each plot on the 20 August prior to defoliation. At harvest, soil samples (0-90 cm) were taken from all replicates of the 0 and 150 kg N/ha.
Components of yield Increasing the N application rate from 0 to 250 kg N/ha had no effect on number of plants at harvest, number of stems per plant (mean 2.1), stem population (mean 77 600/ha), number of tubers > 10 mm per stem (3.1) and tuber population > 10 mm (mean 238 100/ha) (Table 21). Tuber yield > 10 mm was 24.4 t/ha when no N had been applied and increased to a maximum of 28 t/ha with 100 kg N/ha, suggesting an optimum for this site of 100 kg N/ha. Nitrogen had no effect on tuber DM which averaged 21 %. The mean tuber size increased from 52 mm when no N was applied to 56 mm at the optimum N application rate (100 kg N/ha) and ware yield (40-80 mm) was also largest when 100 kg N/ha had been applied. The yields in this experiment were exceptionally small. A visit to the site on 23 July showed that the average ground cover of the experiment was c. 70 % compared with c. 100 % in the majority of the surrounding, commercially planted Estima crop. The experimental area was also a paler green than the surrounding crop. The cause of this poor performance is difficult to ascertain. It is unlikely to be due to a nutritional effect since P, K and Mg Indices were more than adequate. The experimental area was ridged up and planted c. 10 days before the rest of the field and it is possible that the experimental area was worked in non-ideal conditions leading to compaction. Earlier work at CUF has shown that a few days difference in the timing of cultivation may have a large effect on resistance to root penetration and crop growth and yield. It is also possible that, since the experimental area was planted first, pre-emergence herbicides applied to the commercial crop resulted in phytotoxicity from which the crop never recovered.
Soil Mineral Nitrogen The first soil sample was taken on 19 March after a light cultivation to minimise erosion but before the main sequence of cultivations used to establish the potato crop. At this time there was 33 kg N/ha of available N within the top 90 cm of soil (Table 22). At planting on 24 April, soil mineralization at an average rate of 1.4 kg N/ha/day had increased the quantity of soil mineral N to 84 kg N/ha. At harvest, soil mineral N residues in the unfertilized plots had decreased to 60 kg N/ha. However, mainly due to increased soil mineral N in the top soil, there was 160 kg N/ha in the plots that had received 150 kg N/ha.

BPC Project Report: Evaluation of the soil nitrogen supply system
BPC improving crop management 29 © British Potato Council 2004
TABLE 21. EFFECT OF N APPLICATION RATE ON COMPONENTS OF YIELD OF ESTIMA AT ALLOWENSHAY, SOMERSET. HARVESTED 20 AUGUST 2003
N application rate (kg N/ha) Mean 0 50 100 150 200 250 S.E. Number of stems per plant 2.1 2.3 2.2 2.1 2.2 2.0 2.0 0.08 Number of stems (000/ha) 77.6 83.2 78.4 77.8 79.0 74.1 73.5 2.91 Number of tubers > 10 mm (000/ha) 238 254 229 244 242 232 227 8.6 Number of tubers > 10 mm per stem 3.1 3.0 2.9 3.2 3.1 3.1 3.1 0.14 Tuber FW yield > 10 mm (t/ha) 26.5 24.4 25.2 28.0 26.5 28.1 26.8 0.65 Tuber DM concentration (%) 21.0 20.8 21.4 20.6 21.2 20.8 21.3 0.35 Tuber DW yield > 10 mm (t/ha) 5.6 5.1 5.4 5.8 5.6 5.9 5.7 0.16 Mean tuber size (µ, mm) 55 52 54 56 54 56 56 0.6 Proportion of yield in 40-80 mm (%) 90 87 90 90 90 92 90 0.9 Yield in 40-80 mm grades (t/ha) 23.9 21.3 22.8 25.3 23.9 25.7 24.2 0.65
TABLE 22. SOIL MINERAL N (KG N/HA) AT ALLOWENSHAY, SOMERSET
Date kg N/ha 0-30 cm 30-60 cm 60-90 cm 0-90 cm 19 March 0 18 9 6 33 S.E. 1.3 1.9 1.6 3.7 24 April 0 51 22 11 84 S.E. 5.9 1.2 1.7 8.4 20 August 0 29 23 9 60 150 102 47 11 160 S.E. 21.6 12.3 1.2 34.4

BPC Project Report: Evaluation of the soil nitrogen supply system
BPC improving crop management 30 © British Potato Council 2004
Effect of N fertilizer on Estima at North Cadbury, Somerset The experiment was done on land owned by J. A. and E Montgomery at North Cadbury and tested the effect of N fertilizer (0-240 kg N/ha in 60 kg N/ha increments) on the yield of Estima. The experiment was randomised block design with six replicates. The experiment was planted by hand into plots 4.8 m long and 4 rows (3.66 m) wide on 8 May at a within row spacing of 30 cm (36 454 plants/ha). Ammonium nitrate was applied at planting in a single application. A single harvest was taken on 21 August by hand lifting an area of 2.74 m2 from the central rows of each plot before the crop was defoliated. At harvest, soil samples (0-90 cm) were taken from each replicate of the 0 and 120 kg N/ha treatments.
Components of yield Plant establishment measured at harvest was c. 100% in all treatments and each plant produced 2.3 stems irrespective of N application rate giving a mean stem population of 81 200/ha (Table 23). Each stem produced 4.6 tubers > 10 mm and this was also independent of the amount of N applied, in consequence, increasing the N application rate from 0 to 240 kg N/ha had no significant effect on tuber population > 10 mm which averaged 372 000/ha. Despite a relatively short growing season the mean tuber FW yield > 10 mm was 56 t/ha. Nitrogen application rate had no significant effect on yield and thus the optimum rate was zero. Increasing the N application from 0 to 240 kg N/ha had no significant effect on tuber DM concentration. Since the N treatments had no effect on tuber population or tuber yield, the mean tuber size was also independent of N application rate and averaged 63 mm. The mean yield in the ware grades (40-80 mm) was 49 t/ha and was not affected by N application rate.
Soil Mineral Nitrogen An initial soil sample was taken on 19 March, before cultivation and application of any organic manures and at this time there was 82 kg N/ha of available N (Table 24). At planting on 8 May, as a consequence of FYM application and cultivations, the quantity of soil mineral N had increased to 215 kg N/ha. At harvest on 21 August, the N residues in the unfertilized plots had decreased to 115 kg N/ha. In contrast, soil mineral N residues were 257 kg N/ha where 120 kg N/ha had been applied suggesting that little of the N applied as fertilizer had been used by the crop.

BPC Project Report: Evaluation of the soil nitrogen supply system
BPC improving crop management 31 © British Potato Council 2004
TABLE 23. EFFECT OF N APPLICATION RATE ON COMPONENTS OF YIELD OF ESTIMA AT NORTH CADBURY, SOMERSET. HARVESTED 21 AUGUST 2003
N application rate (kg N/ha) Mean 0 60 120 180 240 S.E. Number of stems per plant 2.3 2.3 2.3 2.3 2.2 2.2 0.11 Number of stems (000/ha) 81.2 81.5 83.0 81.0 81.0 79.5 3.85 Number of tubers > 10 mm (000/ha) 372 363 384 384 376 351 15.0 Number of tubers > 10 mm per stem 4.6 4.5 4.7 4.8 4.7 4.5 0.18 Tuber FW yield > 10 mm (t/ha) 56.1 56.9 56.7 55.9 57.0 53.9 1.99 Tuber DM concentration (%) 18.4 18.8 17.9 18.1 18.1 19.3 0.38 Tuber DW yield > 10 mm (t/ha) 10.3 10.7 10.1 10.1 10.4 10.4 0.36 Mean tuber size (µ, mm) 63 64 63 63 64 63 0.6 Proportion of yield in 40-80 mm (%) 88 88 88 88 86 88 1.4 Yield in 40-80 mm grades (t/ha) 49.0 50.0 49.8 49.2 48.9 47.2 1.60
TABLE 24. SOIL MINERAL N AT NORTH CADBURY SOMERSET (KG N/HA)
Date kg N/ha 0-30 cm 30-60 cm 60-90 cm 0-90 cm 19 March 0 44 20 18 82 S.E. 2.2 4.2 6.6 11.3 8 May 0 151 40 24 215 S.E. 2.0 2.5 3.0 6.0 21 August 0 60 43 12 115 120 188 49 20 257 S.E. 38.6 5.7 3.4 42.4

BPC Project Report: Evaluation of the soil nitrogen supply system
BPC improving crop management 32 © British Potato Council 2004
Effect of N application rate on yield of Saturna at East Harling, Norfolk This experiment was done on land farmed by W. O. & P. O. Jolly near East Harling, Norfolk. The experiment tested six rates of N fertilizer (0-250 kg N/ha in increments of 50 kg N/ha) on the yield of Saturna. Each treatment was replicated six times and allocated at random to blocks. Each plot was 4.8 m long and 4 rows (3.66 m) wide. Seed tubers of Saturna were planted at 30 cm spacing (36 454 plants/ha) on 9 April and the N treatments, as ammonium nitrate were applied at the same time in a single application. The crop was defoliated on 29 August and a harvest (2.75 m2) was taken by hand from the central rows of each plot on 16 September. Soil samples (0-90 cm) were taken at harvest from all replicates of the 0 and 100 kg N/ha treatments.
Components of yield All treatments had full emergence when measured at final harvest and when averaged over N treatments the stem population was 132 000 (Table 25). Nitrogen application rate had no significant effect on stem population. When applied at the largest rate (250 kg N/ha), N reduced the number of tubers per stem and the tuber population was significantly smaller when 200 and 250 kg N/ha had been applied. Nitrogen had no effect on tuber DM yield which averaged 13.2 t/ha. However, N had a statistically significant but erratic effect on tuber DM concentration with the smallest DM concentration (26.3 %) occurring when 100 kg N/ha and the largest (28.0 %) when 150 and 250 kg N/ha was applied. Overall, these tuber DM concentrations are exceptionally large. In another series of experiments in 2003, the average tuber DM concentration of Saturna was 23.9 % (range 21.4 to 26.8 %). Although this experiment was irrigated these large DM concentrations may be a consequence of the hot and dry weather in August and September. Nitrogen had a statistically significant but erratic effect on yield with the 150 and 200 kg N/ha treatments having a smaller yield than the other N treatments. Owing to the variability of these results it is difficult to define an optimum N application rate with any confidence, however, it was certainly no more than 100 kg N/ha and was probably less.
Soil Mineral Nitrogen On 26 March, soil sampling showed that there was 83 kg N/ha in the top 90 cm of soil and this had increased to 91 kg N/ha at planting (Table 26). At harvest on 16 September, soil samples taken from plots not receiving N and after application of 100 kg N/ha showed almost identical soil mineral N residues.

BPC Project Report: Evaluation of the soil nitrogen supply system
BPC improving crop management 33 © British Potato Council 2004
TABLE 25. EFFECT OF N APPLICATION RATE ON COMPONENTS OF YIELD OF SATURNA, AT EAST HARLING, NORFOLK. HARVESTED 16 SEPTEMBER 2003
N application rate (kg N/ha) Mean 0 50 100 150 200 250 S.E. Total number of stems per plant 3.6 3.7 3.8 3.6 3.6 3.6 3.5 0.15 Total number of stems (000/ha) 132 135 137 131 132 129 126 5.5 Number of tubers > 10 mm (000/ha) 609 651 658 646 591 540 569 26.1 Number of tubers > 10 mm per stem 4.6 4.8 4.8 5.0 4.5 4.2 4.6 0.16 Tuber FW yield > 10 mm (t/ha) 48.4 50.8 47.9 52.3 44.2 45.0 50.1 1.81 Tuber DM concentration (%) 27.2 26.6 26.7 26.3 28.0 27.8 28.0 0.40 Tuber DW yield > 10 mm (t/ha) 13.2 13.5 12.8 13.8 12.4 12.5 14.0 0.56 Mean tuber size (µ, mm) 50 50 49 51 50 51 53 0.7 Proportion of yield in 40-80 mm (%) 86 86 83 87 84 88 88 1.2 Yield in 40-80 mm grades (t/ha) 41.7 43.9 40.0 45.6 37.3 39.5 44.2 1.92
TABLE 26. SOIL MINERAL N AT EAST HARLING, NORFOLK
Date kg N/ha 0-30 cm 30-60 cm 60-90 cm 0-90 cm 26 March 0 36 32 16 83 S.E. 0.9 2.0 1.3 2.7 9 April 0 49 28 14 91 S.E. 3.1 2.9 0.9 6.3 16 September 0 23 17 9 48 100 24 15 7 46 S.E. 1.6 1.3 0.9 2.5

BPC Project Report: Evaluation of the soil nitrogen supply system
BPC improving crop management 34 © British Potato Council 2004
Effect of N application rate on yield of Russet Burbank at Brettenham, Norfolk This experiment was done on land farmed by W. O. & P. O. Jolly near Brettenham, Norfolk. The experiment tested six rates of N fertilizer (0-250 kg N/ha in increments of 50 kg N/ha) on the yield of Russet Burbank. Each treatment was replicated five times and allocated at random to blocks. Each plot was 4.8 m long and 4 rows (3.66 m) wide. Seed tubers of Russet Burbank were planted at 30 cm spacing (36 454 plant/ha) on 14 April and the N treatments, as ammonium nitrate were applied at the same time in a single application. The crop was defoliated on 12 September and a harvest (2.75 m2) was taken form the central rows of each plot by hand on 24 September. At harvest, soil samples (0-90 cm) were taken from each replicate of the 0 and 150 kg N/ha treatments.
Components of yield Nitrogen had no effect on the plant population at harvest and, on average, each plant produced 2.5 stems (Table 27). The average stem population was 89 000/ha and each stem produced c. 5 tubers > 10 mm. Increasing the N application rate affected the number of tubers > 10 mm, but the effect was erratic and difficult to explain. The mean tuber FW yield > 10 mm was 60 t/ha and there was no evidence that yield was affected by N application rate, thus the optimum for this crop was 0 kg N/ha. In contrast to other experiments, increasing the N application rate from 0 to 250 kg N/ha had no significant effect on tuber DM concentration (average 23.6 %). Since N had no effect on yield but reduced the number of tubers, the mean tuber size (µ) increased from 53 to 59 mm as the N application rate was increased from 0 to 250 kg N/ha. The yield in marketable grades (45-90 mm) averaged 51 t/ha and was not significantly affected by N application rate.
Soil Mineral Nitrogen Soil mineral N (0-90 cm) was 172 kg N/ha on 26 March and by 14 April had increased slightly to 176 kg N/ha (Table 28). At harvest on 24 September, the quantity of soil mineral N had decreased to an average of 76 kg N/ha and was not affected by N application rate.

BPC Project Report: Evaluation of the soil nitrogen supply system
BPC improving crop management 35 © British Potato Council 2004
TABLE 27. EFFECT OF N APPLICATION RATE ON COMPONENTS OF YIELD OF RUSSET BURBANK AT BRETTENHAM, NORFOLK. HARVESTED 29 SEPTEMBER 2003
N application rate (kg N/ha) Mean 0 50 100 150 200 250 S.E. Total number of stems per plant 2.5 2.7 2.7 2.4 2.4 2.4 2.1 0.15 Total number of stems (000/ha) 89 100 98 87 86 86 78 5.5 Number of tubers > 10 mm (000/ha) 428 482 469 435 392 414 375 15.2 Number of tubers > 10 mm per stem 4.9 4.9 4.9 5.2 4.6 4.8 4.8 0.35 Tuber FW yield > 10 mm (t/ha) 60.2 60.2 62.9 61.6 58.6 59.7 58.6 2.72 Tuber DM concentration (%) 23.6 24.0 24.3 23.4 23.1 23.8 22.7 0.46 Tuber DW yield > 10 mm (t/ha) 14.2 14.4 15.3 14.4 13.6 14.2 13.3 0.67 Mean tuber size (µ, mm) 56 53 55 56 56 58 59 0.7 Proportion of yield in 45-90 mm (%) 85 81 84 86 85 86 88 1.1 Yield in 45-90 mm grades (t/ha) 51.3 48.9 52.7 53.0 50.3 51.1 51.7 2.86
TABLE 28. SOIL MINERAL N AT BRETTENHAM, NORFOLK
Date kg N/ha 0-30 cm 30-60 cm 60-90 cm 0-90 cm 26 March 0 42 64 66 172 S.E. 4.0 8.2 23.1 32.1 14 April 0 64 77 36 176 S.E. 10.3 21.5 6.2 36.5 24 September 0 30 26 14 70 150 31 31 20 82 S.E. 2.7 2.3 2.2 4.7

BPC Project Report: Evaluation of the soil nitrogen supply system
BPC improving crop management 36 © British Potato Council 2004
Effects of N fertilizer on growth and yield of contrasting varieties at CUF Four varieties (Cara, Estima, FL 2006 and Hermes) were tested in factorial combination with five rates of N (0, 60, 120, 180 and 240 kg N/ha) in a randomized block design with three replicates. Each plot was 4 rows wide and 4 m long and the experiment was planted by hand on 8 April into ridges (76 cm centres) at 25 cm spacing. Fertilizer N, as ammonium nitrate, was applied in a single dose at planting. No other nutrients were applied. Crop emergence was measured every 3-4 days until the crop was fully emerged and ground covers were measured weekly using a grid. A single harvest of 2.28 m2 was taken from the two centre rows of each plot on 30 September. Soil samples were taken on 16 May and showed that there was 94 (± 3.5) kg N/ha in the top 90 cm of soil.
Emergence and ground covers For all treatments, the mean interval between planting and 50 % emergence was 42 days (c. 20 May). Estima achieved 50 % emergence first (39 days) whilst FL 2006 took 47 days. Increasing the N application rate from 0 to 240 kg N/ha had no significant effect on emergence. The effects of variety and N application rate on development and extent of ground cover are shown in Table 29 and Figure 2.
TABLE 29. EFFECTS OF VARIETY AND N APPLICATION RATE ON INTEGRATED GROUND COVER (% DAYS) AT CUF
Nitrogen application rate (kg N/ha) Variety 0 60 120 180 240 Mean Cara 10416 10176 10619 10729 10990 10586 Estima 5932 6170 6350 6818 7317 6517 Hermes 8275 7968 8197 9032 8045 8303 FL 2006 8747 8991 8669 9072 9084 8913 Mean 8343 8326 8459 8913 8859 8580 S.E. for variety 127.7; S.E. for N rate 142.8; S.E. for Variety × N rate 285.6
Irrespective of N application rate, all treatments attained 100 % ground cover and, on average, this was reached c. 35 days after 50 % emergence (DAE).

BPC Project Report: Evaluation of the soil nitrogen supply system
BPC improving crop management 37 © British Potato Council 2004
FIGURE 2. EFFECT OF N APPLICATION RATE ON GROUND COVER OF FOUR VARIETIES AT CAMBRIDGE UNIVERSITY FARM 2003. KEY: □, 0; ◊, 60; ∆, 120; ■, 180 AND ▲, 240 KG N/HA.
Hermes
0
20
40
60
80
100
1-May 31-May 30-Jun 30-Jul 29-Aug 28-Sep
Gro
und
cove
r (%
)
FL 2006
0
20
40
60
80
100
1-May 31-May 30-Jun 30-Jul 29-Aug 28-Sep
Gro
und
cove
r (%
)
Cara
0
20
40
60
80
100
1-May 31-May 30-Jun 30-Jul 29-Aug 28-Sep
Gro
und
cove
r (%
)
Estima
0
20
40
60
80
100
1-May 31-May 30-Jun 30-Jul 29-Aug 28-Sep
Gro
und
cove
r (%
)

BPC Project Report: Evaluation of the soil nitrogen supply system
BPC improving crop management 38 © British Potato Council 2004
When averaged over N treatments, Cara was the slowest to reach 100 % ground cover (39 DAE) and Hermes (32 DAE) was the quickest. In the absence of N fertilizer, 100 % ground cover was reached 42 DAE compared with 34 DAE when 60 kg N/ha or more had been applied. Cara had the most persistent canopy and Estima the least and the main effects of N were to delay the onset and rate of senescence although these effects were not very large.
Components of yield Averaged over all treatments, the mean number of stems was 86 500/ha (Table 30). FL 2006 produced the fewest stems (59 500/ha, equivalent to 1.1 stems/plant) and Cara the most (129 200/ha, 2.5 stems/plant). Increasing the N application rate from 0 to 240 kg N/ha had no effect on the stem population.
TABLE 30. EFFECTS OF VARIETY AND N APPLICATION RATE ON NUMBER OF STEMS (1000/HA) AT CUF
Nitrogen application rate (kg N/ha) Variety 0 60 120 180 240 Mean Cara 101 112 124 166 143 129 Estima 108 86 73 82 85 87 Hermes 64 70 73 69 77 71 FL 2006 57 57 57 66 61 60 Mean 82 81 82 96 92 87 S.E. for variety 6.3; S.E. for N rate 7.1; S.E. Variety × N rate 14.2
Cara produced the fewest tubers > 10 mm per stem and FL 2006 the most (Table 31). Nitrogen application rate had no effect on the number of tubers per stem. The mean number of tubers > 10 mm was 472 900/ha (Table 32). Despite having the smallest stem population, FL 2006 produced the largest tuber population per hectare. The effects of N application rate on the number of tubers were generally small and inconsistent.
TABLE 31. EFFECTS OF VARIETY AND N APPLICATION RATE ON THE NUMBER OF TUBERS > 10 MM PER STEM AT CUF
Nitrogen application rate (kg N/ha) Variety 0 60 120 180 240 Mean Cara 5.0 3.9 3.5 3.7 3.2 3.8 Estima 4.3 5.8 6.5 5.1 4.8 5.3 Hermes 7.1 7.1 7.7 7.1 6.5 7.1 FL 2006 8.7 9.3 8.0 7.9 9.2 8.6 Mean 6.3 6.5 6.4 6.0 5.9 6.2 S.E. for variety 0.41; S.E. for N rate 0.45; S.E. Variety × N rate 0.91

BPC Project Report: Evaluation of the soil nitrogen supply system
BPC improving crop management 39 © British Potato Council 2004
TABLE 32. EFFECTS OF VARIETY AND N APPLICATION RATE ON NUMBER OF TUBERS > 10 MM (000/HA) AT CUF
Nitrogen application rate (kg N/ha) Variety 0 60 120 180 240 Mean Cara 500 388 389 582 455 463 Estima 416 493 452 413 402 435 Hermes 439 490 550 477 494 490 FL 2006 489 524 454 500 554 504 Mean 461 474 461 493 476 473 S.E. for variety 19.8; S.E. for N rate 22.1; S.E. Variety × N rate 44.2
The mean tuber FW yield > 10 mm for the whole experiment was c. 69 t/ha. When standard errors are taken into account there were no differences in yield due to the main effects of variety or N application rate (Table 33). There was some evidence, supported by ground cover results, that applying 120 to 180 kg N/ha increased yields of Estima. However, due to the relatively large standard errors on this experiment these yield differences were not statistically significant. Thus, for all varieties the optimal N application was 0 kg N/ha.
TABLE 33. EFFECTS OF VARIETY AND N APPLICATION RATE ON TUBER FW YIELD > 10 MM (T/HA) AT CUF
Nitrogen application rate (kg N/ha) Variety 0 60 120 180 240 Mean Cara 73.0 68.6 66.3 70.3 65.2 68.7 Estima 56.7 67.5 69.3 72.4 73.5 67.9 Hermes 61.8 62.6 69.1 66.9 72.4 66.5 FL 2006 67.8 73.7 65.9 75.8 79.1 72.4 Mean 64.8 68.1 67.7 71.3 72.5 68.9 S.E. for variety 2.75; S.E. for N rate 3.08; S.E. Variety × N rate 6.15
Table 34 compares yields of Cara, Estima and Hermes given no N or c. 200 kg N/ha in 1997-2003. As might be expected, Cara generally gave the smallest increase in yield when N was applied (mean 12 t/ha), Estima the largest (24 t/ha) with Hermes intermediate (15 t/ha). However, responses to N were very variable from season to season. For example, 2003 was the least responsive season with an average yield increase of 6 t/ha for all three varieties whereas 2002 was the most responsive where the average yield increase was 28 t/ha. In 2003, the yield of Cara and Hermes given no N was larger than the yield of Cara and Hermes given 200 kg N/ha in other seasons.
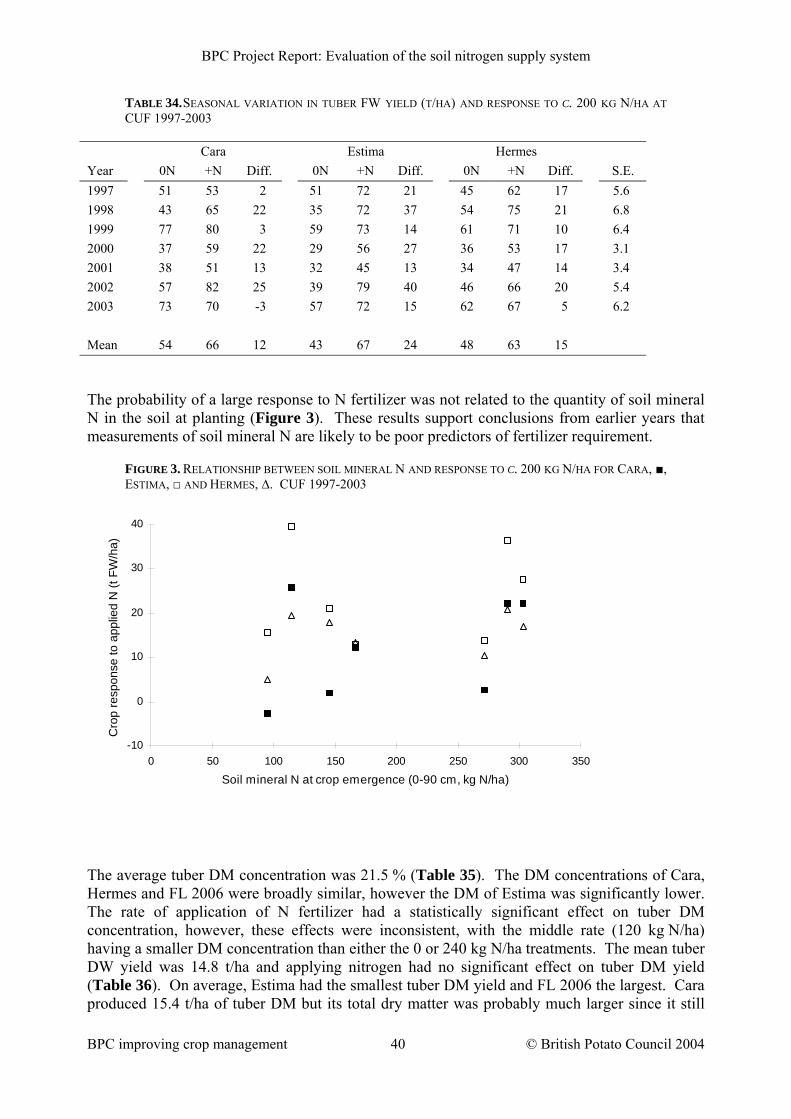
BPC Project Report: Evaluation of the soil nitrogen supply system
BPC improving crop management 40 © British Potato Council 2004
TABLE 34. SEASONAL VARIATION IN TUBER FW YIELD (T/HA) AND RESPONSE TO C. 200 KG N/HA AT CUF 1997-2003
Cara Estima Hermes Year 0N +N Diff. 0N +N Diff. 0N +N Diff. S.E. 1997 51 53 2 51 72 21 45 62 17 5.6 1998 43 65 22 35 72 37 54 75 21 6.8 1999 77 80 3 59 73 14 61 71 10 6.4 2000 37 59 22 29 56 27 36 53 17 3.1 2001 38 51 13 32 45 13 34 47 14 3.4 2002 57 82 25 39 79 40 46 66 20 5.4 2003 73 70 -3 57 72 15 62 67 5 6.2 Mean 54 66 12 43 67 24 48 63 15
The probability of a large response to N fertilizer was not related to the quantity of soil mineral N in the soil at planting (Figure 3). These results support conclusions from earlier years that measurements of soil mineral N are likely to be poor predictors of fertilizer requirement.
FIGURE 3. RELATIONSHIP BETWEEN SOIL MINERAL N AND RESPONSE TO C. 200 KG N/HA FOR CARA, ■, ESTIMA, □ AND HERMES, ∆. CUF 1997-2003
The average tuber DM concentration was 21.5 % (Table 35). The DM concentrations of Cara, Hermes and FL 2006 were broadly similar, however the DM of Estima was significantly lower. The rate of application of N fertilizer had a statistically significant effect on tuber DM concentration, however, these effects were inconsistent, with the middle rate (120 kg N/ha) having a smaller DM concentration than either the 0 or 240 kg N/ha treatments. The mean tuber DW yield was 14.8 t/ha and applying nitrogen had no significant effect on tuber DM yield (Table 36). On average, Estima had the smallest tuber DM yield and FL 2006 the largest. Cara produced 15.4 t/ha of tuber DM but its total dry matter was probably much larger since it still
-10
0
10
20
30
40
0 50 100 150 200 250 300 350
Soil mineral N at crop emergence (0-90 cm, kg N/ha)
Cro
p re
spon
se to
app
lied
N (t
FW
/ha)

BPC Project Report: Evaluation of the soil nitrogen supply system
BPC improving crop management 41 © British Potato Council 2004
had an extensive canopy at harvest. For example, the canopy of Cara given no N in the Variety, Density and N experiment contained c. 3 t DM/ha and at a tuber DM concentration of 18 % this is equivalent to a tuber FW yield of 16 t/ha.
TABLE 35. EFFECTS OF VARIETY AND N APPLICATION RATE ON TUBER DM CONCENTRATION (%) AT CUF
Nitrogen application rate (kg N/ha) Variety 0 60 120 180 240 Mean Cara 22.6 21.6 21.7 22.0 24.3 22.4 Estima 17.9 17.3 17.7 18.1 18.4 17.9 Hermes 22.5 21.7 20.4 21.6 24.0 22.1 FL 2006 24.6 23.0 22.3 23.4 24.1 23.5 Mean 21.9 20.9 20.5 21.3 22.7 21.5 S.E. for variety 0.34; S.E. for N rate 0.37; S.E. Variety × N rate 0.75
TABLE 36. EFFECTS OF VARIETY AND N APPLICATION RATE ON TUBER DW YIELD (T/HA) > 10 MM AT CUF
Nitrogen application rate (kg N/ha) Variety 0 60 120 180 240 Mean Cara 16.4 14.8 14.3 15.3 15.9 15.4 Estima 10.2 11.7 12.3 13.2 13.5 12.2 Hermes 13.8 13.6 14.1 14.5 17.3 14.7 FL 2006 16.7 17.1 14.8 17.8 19.2 17.1 Mean 14.3 14.3 13.9 15.2 16.5 14.8 S.E. for variety 0.70; S.E. for N rate 0.78; S.E. Variety × N rate 1.56
BPC Project Report: Evaluation of the soil nitrogen supply system
BPC improving crop management 42 © British Potato Council 2004
Analysis of the relative merits of the Field Assessment Method and Soil Nitrogen Supply Analysis Method for determining N requirements using 2001-2003 results The purpose of this section is to compare N recommendations made using the Field Assessment method and the SNS Analysis method with optima measured in field experiments in 2001-2003. Where possible, the methods outlined in the 7th edition of Reference Book 209 were used and any significant modifications are detailed below.
For all experiments, the optimum N application rate was defined, as the smallest rate of N application above which there was no significant increase in tuber yield. For the purpose of these analyses, Courlan (FL 1953) was assumed to be in Variety Group 1 (very determinate) and FL 2006 was assumed to be Variety Group 3 (indeterminate). The length of growing season was calculated from the date of 50 % emergence to the date of defoliation or date of harvest in those crops harvested when there was still appreciable ground cover. In some experiments, particularly those at CUF, the date of final harvest was several weeks after the canopies of Courlan and Estima had senesced. To avoid overestimating the length of season in these two varieties, an estimate of the maximum potential duration of ground cover was used as season length (c. 100 days for both Estima and Courlan). This estimate was based on experiments at CUF and from crop monitoring in commercial crops. For the SNS Analysis method, values of soil mineral N taken at planting (± 7 days) was used to estimate the soil nitrogen supply index of the field. Soil samples were taken from plots prior to N application. For both systems, the estimate of N fertilizer required is presented as the mid-range of the values given in RB 209. Reference Book 209, advises against using the SNS Analysis method on fields that have recently been ploughed out of grass (i.e. Llanwarne 2002, Site No 10, Table 37). However, an initial analysis showed that including Llanwarne made little difference to the analyses or conclusions. Summaries of the methods of calculation, the N fertilizer requirement estimated by the Field Assessment and by the SNS Analysis methods and the actual fertilizer requirement are given in Tables 37 and 38.

BPC Project Report: Evaluation of the soil nitrogen supply system
BPC improving crop management 43 © British Potato Council 2004
TABLE 37. SUMMARY OF N RECOMMENDATIONS CALCULATED USING THE FIELD ASSESSMENT METHOD (RB 209) AND ACTUAL N REQUIREMENT FOUND IN EXPERIMENTS
Site and site number
Variety, determinacy group and length of growing season (days)
Soil type RB 209
Previous cropping
SNS Index
Required (kg N/ha)
Manures (kg N/ha)
Fertilizer (kg N/ha)
Actual (kg N/ha)
GOS Johnsons West 1 Hermes 2 130 Medium Carrots 0/1 225 0 225 160 GOS Robins Wood 2 Hermes 2 130 Medium Winter wheat 0/1 225 0 225 160 JEPCO Field 15 3 Desiree 3 75 Fertile silt Daffodils 0/1 140 0 140 n.a. JEPCO Field 57 4 Cara 4 90 Fertile silt Winter wheat 0/1 85 0 85 0 CUF Cage Field 5 Cara 4 110 Medium Winter barley 0/1 110 0 100 100 CUF Cage Field 6 Courlan 1 100 Medium Winter barley 0/1 255 0 255 100 CUF Cage Field 7 Estima 1 100 Medium Winter barley 0/1 255 0 255 100 CUF Cage Field 8 Hermes 2 110 Medium Winter barley 0/1 190 0 190 150 Wrentham Dodd’s Field 9 Maris Peer 2 40 Light sand Set aside 0/1 115 0 115 0 Cobrey Llanwarne 10 Maris Peer 2 60 Medium Grass 2-4 75 90 0 0 Cobrey Bransford 11 Estima 1 120 Medium Spring rape 2-4 210 60 150 60 Jolly East Harling 12 Lady Rosetta 2 80 Light sand Winter barley 0/1 165 180 0 100 Jolly East Harling 13 Russet Burbank 3 80 Light sand Winter barley 0/1 140 180 0 0 King Taunton 14 Lady Rosetta 2 120 Medium Winter wheat 0/1 190 100 90 0 King Taunton 15 Russet Burbank 3 120 Medium Winter wheat 0/1 150 100 50 0 CUF Cage Side 16 Cara 4 140 Medium Winter barley 0/1 120 0 120 80 CUF Cage Side 17 Courlan 1 100 Medium Winter barley 0/1 255 0 255 160 CUF Cage Side 18 Estima 1 100 Medium Winter barley 0/1 255 0 255 160 CUF Cage Side 19 Hermes 2 120 Medium Winter barley 0/1 210 0 210 200 Wrentham Over Road 20 Maris Peer 2 40 Light sand Winter barley 0/1 115 0 115 40 Wrentham Packway 21 Carlingford 2 50 Light sand Winter barley 0/1 115 0 115 0 Jolly East Harling 22 Saturna 3 130 Light sand Winter barley 0/1 185 0 185 100 Jolly Brettenham 23 Russet Burbank 3 130 Light sand Winter barley 0/1 185 0 185 0 Poll Theberton 24 King Edward 3 100 Light sand Sugarbeet 0/1 150 0 150 125 Montgomery N. Cadbury 25 Estima 1 80 Medium Maize 0/1 200 50 150 0 Madge Allowenshay 26 Estima 1 85 Medium Sugarbeet 0/1 200 0 200 100 Cobrey Goodrich 27 Maris Peer 2 70 Medium Winter wheat 0/1 165 0 165 0 Cobrey Goodrich 28 Maris Peer 2 70 Medium Winter wheat 0/1 165 80 85 0 Cobrey Goodrich 29 Maris Peer 2 70 Medium Winter wheat 0/1 165 160 5 0 Cobrey Linton 30 Maris Peer 2 70 Medium Winter wheat 0/1 165 0 165 40 CUF Osier 31 Cara 4 140 Medium Winter barley 0/1 140 0 140 0 CUF Osier 32 Estima 1 100 Medium Winter barley 0/1 255 0 255 0 CUF Osier 33 FL 2006 3 130 Medium Winter barley 0/1 185 0 185 0 CUF Osier 34 Hermes 2 130 Medium Winter barley 0/1 255 0 255 0 Mean 177 29 150 59

BPC Project Report: Evaluation of the soil nitrogen supply system
BPC improving crop management 44 © British Potato Council 2004
TABLE 38. SUMMARY OF N RECOMMENDATIONS USING SOIL NITROGEN SUPPLY ANALYSIS METHOD AND ACTUAL N REQUIREMENT FOUND IN EXPERIMENTS
Site and site number
Variety
SMN at planting
SNS Index
Required (kg N/ha)
Actual (kg N/ha)
GOS Johnsons West 1 Hermes 87 2-4 170 160 GOS Robins Wood 2 Hermes 111 2-4 170 160 JEPCO Field 15 3 Desiree 163 5/6 50 n.a. JEPCO Field 57 4 Cara 65 0/1 90 0 CUF Cage Field 5 Cara 167 5/6 20 100 CUF Cage Field 6 Courlan 167 5/6 170 100 CUF Cage Field 7 Estima 167 5/6 170 100 CUF Cage Field 8 Hermes 167 5/6 100 150 Wrentham Dodd’s Field 9 Maris Peer 88 2-4 75 0 Cobrey Llanwarne 10 Maris Peer 397 5/6 50 0 Cobrey Bransford 11 Estima 345 5/6 170 60 Jolly East Harling 12 Lady Rosetta 177 5/6 70 100 Jolly East Harling 13 Russet Burbank 177 5/6 50 0 King Taunton 14 Lady Rosetta 696 5/6 120 0 King Taunton 15 Russet Burbank 696 5/6 70 0 CUF Cage Side 16 Cara 117 2-4 70 80 CUF Cage Side 17 Courlan 117 2-4 210 160 CUF Cage Side 18 Estima 117 2-4 210 160 CUF Cage Side 19 Hermes 117 2-4 160 200 Wrentham Over Road 20 Maris Peer 195 5/6 20 40 Wrentham Packway 21 Carlingford 159 2-4 70 0 Jolly East Harling 22 Saturna 91 2-4 130 100 Jolly Brettenham 23 Russet Burbank 176 5/6 90 0 Poll Leiston 24 King Edward 78 0/1 150 125 Montgomery N. Cadbury 25 Estima 215 5/6 110 0 Madge Allowenshay 26 Estima 84 2-4 155 100 Cobrey Goodrich 27 Maris Peer 150 2-4 115 0 Cobrey Goodrich 28 Maris Peer 198 5/6 70 0 Cobrey Goodrich 29 Maris Peer 345 5/6 70 0 Cobrey Linton 30 Maris Peer 70 0/1 165 40 CUF Osier 31 Cara 94 2-4 70 0 CUF Osier 32 Estima 94 2-4 210 0 CUF Osier 33 FL 2006 94 2-4 130 0 CUF Osier 34 Hermes 94 2-4 170 0 Mean 115 59
Comparison of the mean estimated N requirement and the mean actual N requirement showed that, on average, the Field Assessment method overestimated the N requirement by 91 kg N/ha compared with an overestimate of 56 kg N/ha when the fertilizer requirement was estimated using the SNS Analysis method.
Regressing the measured N requirement against the predicted N requirement assessed the accuracy of N recommendations made by the Field assessment method and the SNS Analysis

BPC Project Report: Evaluation of the soil nitrogen supply system
BPC improving crop management 45 © British Potato Council 2004
method. Regression of actual N requirement against N requirement predicted from the Field Assessment method (Figure 4 a) shows that nearly all the points lie below the 1 : 1 line and there is a large amount of scatter. Of particular interest is that a large proportion of the 2003 data, despite being recommended substantial quantities of N fertilizer, gave no response to N. Regression of actual N against N requirement predicted by the SNS Analysis method shows a similar amount of scatter (Figure 4 b).
FIGURE 4. RELATIONSHIP BETWEEN ACTUAL N REQUIREMENT AND THAT ESTIMATED BY (A) FIELD ASSESSMENT METHOD OR (B) SNS ANALYSIS METHOD (B). KEY: □, 2001; ◊, 2002 AND ∆, 2003; LINE IS 1:1 RELATIONSHIP.
Collectively, the Field Assessment method explained c. 24 % of the variation in actual N requirement (Table 39). However, including season as a factor in the analysis (i.e. by allowing each season to have its own regression line) significantly improved the amount of variation explained by Field Assessment method (R2 = 51 %). This suggests that the effects of season on N requirement may be similar to the combined effects of variety, season length and SNS Index. Furthermore, these analyses show that crops grown in 2003 were much less responsive to N fertilizer than crops grown in 2001 and 2002. The lack of response to N in 2003 may have been
(a)
0
100
200
300
0 100 200 300
Estimated N requirement from field assessment (kg N/ha)
Act
ual N
requ
irem
ent (
kg N
/ha)
(b)
0
100
200
300
0 100 200 300
Estimated N requirement from soil analysis (kg N/ha)
Act
ual N
requ
irem
ent (
kg N
/ha)

BPC Project Report: Evaluation of the soil nitrogen supply system
BPC improving crop management 46 © British Potato Council 2004
due to better than average soil conditions. The SNS Analysis method performed no better than the Field Assessment method.
TABLE 39. SUMMARY OF REGRESSION ANALYSES OF ACTUAL N REQUIREMENT FOUND IN EXPERIMENTS AND N REQUIREMENTS PREDICTED FROM FIELD ASSESSMENT METHOD (FAM) AND SNS ANALYSIS METHOD (SNS)
Actual-N = FAM × 0.39 (± 0.059); R2= 23.9 %; P < 0.001 Predicted value of Actual-N for a Field Assessment-N of 177 kg N/ha = 70 (± 10.5) kg N/ha Actual-N (2001) = FAM × 0.57 (± 0.087); R2 = 50.9 %; P < 0.001 Actual-N (2002) = FAM × 0.61 (± 0.129) Actual-N (2003) = FAM × 0.16 (± 0.112) Predicted value of Actual-N for a Field Assessment-N of 177 kg N/ha 2001, 100 (± 15.3); 2002, 107 (± 16.9); 2003, 29 (± 12.6) Actual-N = SNS × 0.51 (± 0.079); R2= 22.1 %; P < 0.001 Predicted value of Actual-N for a SNS-N of 115 kg N/ha= 59 (± 9.1) kg N/ha Actual-N (2001) = SNS × 0.79 (± 0.138); R2 = 41.8 %; P < 0.001 Actual-N (2002) = SNS × 0.67 (± 0.182) Actual-N (2003) = SNS × 0.23 (± 0.173) Predicted value of Actual-N for a SNS-N of 115 kg N/ha 2001, 90 (± 15.9); 2002, 77 (± 13.6); 2003, 27 (± 12.0)
Irrespective of the method used, RB 209 tends to overestimate the N requirement of potato crops. This effect is particularly noticeable in short season salad crops. Thus, of the five Maris Peer and Carlingford crops grown in the absence of organic manures (Nos 9, 20, 21 27 & 30), the Field Assessment method recommended an average of 112 kg N/ha. However, in these experiments the optimum amount of N was c. 10 kg N/ha. Furthermore, there was evidence from several of these experiments that applying N in excess of that required for yield delayed skin set and also reduced the number of tubers and thus crop value. Similarly, RB 209 generally overestimated the N requirements of processing crops. In ten experiments with Courlan, FL 2006, Hermes, Russet Burbank and Saturna grown without organic manures (Nos 1, 2, 6, 8, 17, 19, 22, 23, 33 & 34) the Field Assessment method estimated the average N requirement as 217 kg N/ha, however, the actual average requirement was 103 kg N/ha. Even very determinate crops that might be expected to give large responses to fertilizer N (Estima and Courlan with no organic manures, Nos 6, 7, 17, 18, 26 & 32) had much smaller N requirements than predicted by the Field Assessment method (103 compared with 246 kg N/ha).
These experiments clearly demonstrate that there is an opportunity to reduce the amount of N applied to all types of potato crops which would result in reduced costs and, potentially, increased yields and quality. For example, short season salad crops (and possibly seed) should receive no more than 40-50 kg N/ha even when grown on infertile soils. Similarly, for many full-season processing crops 150 kg N/ha would appear sufficient.

BPC Project Report: Evaluation of the soil nitrogen supply system
BPC improving crop management 47 © British Potato Council 2004
The analyses show that the SNS Analysis method is no better than Field Assessment method. In commercial practice it may perform much worse, since in the experiments SNS was measured in several replicate cores taken from a relatively small experimental area and thus the effects of spatial variation were minimized. Since the labour and analytical costs associated with SNS Analysis method are unlikely to be recouped in more precise N recommendations, use of this method cannot be advised.
Reference Book 209 acknowledges that the recommendation it makes are for “general guidance only” and “ specialist guidance may be needed when making decisions for specific crops”. However, these caveats are of little use to growers/agronomists who may be making N recommendations for unfamiliar varieties or for crops grown on rented land where they have limited local knowledge. In addition, RB 209 by using winter rainfall and soil type to affect N recommendation implies a correction for season. Since the performance of the Field Assessment method and the SNS Analysis method were improved by including season within the regression the implication is that this correction does not work. The results suggest that the effect of season is not related to SNS at planting since measurements of SNS did not improve the regressions. The Cultivation, Planting Date and N and Variety, N and Density experiments at CUF may help explain some of the effects of season. The Cultivation experiments suggest that factors such as soil texture, temperature and moisture content have an influence on the rate of N mineralization, particularly during the phase of rapid canopy expansion. Analysis of the Planting Date and N and Variety, N and Density experiments suggests that the potential for a crop is determined within c. 6 weeks of emergence and is related to duration and rate at which the canopy acquires N. In part this will be determined by the amount of available N in the soil, but other factors affecting root and canopy function, for example, compaction, water stress and incident radiation will also affect N acquisition and utilization by the crop. At present, our understanding of the relative importance of these factors is incomplete and is being used for the retrospective interpretation of N response results. However, continued evaluation of our experimental results is likely to lead to significant improvements in predicting crop N requirement.

BPC Project Report: Evaluation of the soil nitrogen supply system
BPC improving crop management 48 © British Potato Council 2004
Effects of soil type and cultivation on soil mineral nitrogen and nitrogen uptake by Cara
Introduction A limitation of the SNS Analysis method for establishing fertilizer N requirements is that the amount of mineral N in the soil is temporally variable. Therefore, the timing of soil sampling relative to these fluctuations inevitably dictates the amount of N fertilizer recommended. Previous work at CUF in 2001 and 2002 has shown that the sequence of cultivations used to establish potato crops could result in a doubling of N mineralization rates when compared with soils left uncultivated. Furthermore, there was evidence that the timings of these cultivations relative to soil temperature and moisture content could also affect the rates of mineralization. Circumstantial evidence found in 2002 suggested that soil texture had an influence on the rate of mineralization, with heavier textured soil mineralizing N at a slower rate than light textured soils despite larger organic matter contents. Thus soil texture may be as important a factor as organic matter content in determining soil nitrogen supply. An objective of the 2003 experiment was to verify this observation.
Materials and Methods The 2003 experiments were done on Starveacre Field at CUF. Fortuitously, this field has distinct variation in soil texture: loamy sand over coarse sand in the southeastern part of the field changing to a sandy clay loam over Gault clay in the northwestern part. Two separate cultivation experiments were located on these contrasting soils so that interactions between timing of cultivations and soil texture could be better understood. The two experiments were separated by c. 120 m and, apart from the variation in soil texture, they had similar designs and were managed in an identical way. Details of cultivations, planting and harvests are shown in Table 40. Each block of the experiments comprised the following treatments: an uncultivated control that was kept free of weeds by herbicides and hand weeding and two dates of cultivation. For each date of cultivation there were planted and unplanted plots. The treatments were allocated at random to blocks and replicated four times.
TABLE 40. TIMING OF OPERATIONS USED TO ESTABLISH THE POTATO CROPS, CUF, STARVEACRE FIELD
Operation Early Cultivation Late Cultivation Ploughing 23 April 30 May Power harrow and ridge 9 May 6 June Planting 9 May 9 June Harvest 1 22 August 22 August Harvest 2 2 October 2 October
As in previous experiments, the ploughing depth was c. 25 cm and the power harrow worked at c. 20 cm depth. Seed of Cara was planted by hand at 25 cm spacing in ridges 76 cm apart. Unlike experiments in previous years, there were no treatments that tested the effects of N fertilizer. Each plot was 6 m long by 4.3 m wide into which a planted area of 4 m by 4 rows wide (3.05 m) was sited. At harvest (22 August and 2 October) an area of 1.9 m2 was dug by hand from the central rows of each plot to measure yield and N uptake of the haulm and tubers. Soil samples (0-90 cm) were taken at regular intervals from key treatments to measure changes in SMN. Irrigation (95 mm, in c. 25 mm doses) was applied by a rain gun to both experiments to ensure uniform emergence and crop growth.

BPC Project Report: Evaluation of the soil nitrogen supply system
BPC improving crop management 49 © British Potato Council 2004
To facilitate analysis of the effects of soil texture, sites were included as a factor within the analysis of variance. Standard errors for site-to-site comparison were estimated using the variance and degrees of freedom usually attributed to blocks and therefore this analysis assumes that the block variance was similar for both experiments. Furthermore, comparisons of the effects of site and site × planting date should be made with some caution since, by necessity, sites could not be replicated or randomized.
Emergence and ground covers On average, the early-planted crops took c. 9 days longer to achieve 50 % emergence than the late-planted crops (Table 41). Similarly, due to a dry and cloddy seedbed, the crop planted on the heavier part of the field also took 9 days longer to achieve 50 % emergence than on the lighter soil. However, all treatments eventually achieved c. 100 % plant emergence. The effects of soil texture and planting date on the pattern of ground cover development are shown in Figure 5. Despite receiving no N fertilizer, all treatments reached c. 100 % ground cover. Compared with crops grown on the light textured soil, canopy expansion of crops grown on the heavier textured soil was slower although they were ultimately more persistent.

BPC Project Report: Evaluation of the soil nitrogen supply system
BPC improving crop management 50 © British Potato Council 2004
FIGURE 5. EFFECT OF SOIL TEXTURE AND PLANTING DATE ON PATTERN OF GROUND COVER DEVELOPMENT IN CARA. KEY: □, LIGHT LAND EARLY PLANTED; ■, LIGHT LAND LATE PLANTED; ∆, HEAVY LAND EARLY PLANTED AND ▲, HEAVY LAND LATE PLANTED
Components of yield and N uptake 22 August The first harvest was taken on 22 August. At this harvest the treatments (soil texture and planting date) had no significant effect on number of mainstems or number of tubers > 10 mm per stem (Table 41). Consequently, none of the treatments had any effect on tuber population > 10 mm. In agreement with the ground cover curves and estimates of integrated ground cover, tuber FW yield was smaller in late-planted crops and in crops grown on the heavier textured soil. Tuber DM concentration was not significantly affected by planting date but was smaller in crops grown on the sandy clay loam textured soil. Haulm dry weights averaged 4.2 t/ha and were independent of planting date and soil texture. Total DM yield at this harvest averaged 7.7 t/ha, and was smaller after late planting and in crops grown on the heavier part of the field, again differences that are explicable by the pattern of ground cover development in each treatment. The harvest index (tuber DW as a percentage of total DW) averaged 38 %, but varied considerably between treatments, with the harvest index being smaller in the late-planted crops and those grown on the heavier textured soil.
Total N uptake averaged 169 kg N/ha and there were no apparent differences due to soil type or planting date. However, the proportion of total N uptake in the tubers was larger in crops grown on the lighter textured soil and in earlier planted crops. As found in earlier experiments, the N harvest index was smaller than the DM harvest index indicating that the crop tends to retain N in the canopy. In consequence, tuber yields may be relatively independent of total crop N uptake as was found in other experiments at CUF.
0
20
40
60
80
100
1-Jun 1-Jul 31-Jul 30-Aug 29-Sep 29-Oct
Gro
und
cove
r (%
)

BPC Project Report: Evaluation of the soil nitrogen supply system
BPC improving crop management 51 © British Potato Council 2004
TABLE 41. EFFECT OF SOIL TYPE AND PLANTING DATE (9 MAY OR 9 JUNE) ON GROWTH AND COMPONENTS OF YIELD OF CARA. STARVEACRE FIELD, HARVESTED 22 AUGUST 2003
Light Heavy Mean Early Late Early Late S.E. Days to 50% emergence 31 29 22 43 28 2.3 Integrated ground cover (% days) 3973 6154 3144 3838 2758 245.2 Radiation absorbed (MJ/m2) 699 1080 551 682 483 44.7 Number of mainstems (000/ha) 155 166 153 145 155 10.6 Number of tubers > 10 mm (000/ha) 432 544 388 385 410 45.7 Tuber FW yield > 10 mm (t/ha) 17.1 39.0 8.6 15.6 5.2 3.37 Tuber DM concentration (%) 19.6 20.9 19.9 19.3 18.3 0.56 Tuber DW yield > 10 mm (t/ha) 3.4 8.1 1.7 3.0 0.9 0.63 Haulm DW yield (t/ha) 4.2 4.5 4.3 4.1 4.1 0.21 Total DW yield (t/ha) 7.7 12.5 6.0 7.2 5.0 0.72 DM harvest Index (%) 38 65 29 38 18 3.6 Total N uptake (kg N/ha) 169 219 142 150 164 15.5 N harvest index (%) 21 39 16 22 8 2.7
Components of yield and N uptake 2 October A final harvest was taken on the 2 October (Table 42). When standard errors are taken into account, stem and tuber populations were broadly similar at both harvests. The tuber FW yield > 10 mm averaged 32 t/ha and the effects of the treatments were similar to those at the earlier harvest. The treatments had no statistically significant effect on tuber DM concentration that averaged 21 9 %. When compared with the earlier harvest, haulm DM yield had decreased in the early-planted treatments particularly on the light textured soil.
TABLE 42. EFFECT OF SOIL TYPE AND PLANTING DATE (9 MAY OR 9 JUNE) ON GROWTH AND COMPONENTS OF YIELD OF CARA. STARVEACRE FIELD, HARVESTED 2 OCTOBER 2003
Light Heavy Mean Early Late Early Late S.E. Integrated ground cover (% days) 7720 9483 6732 7826 6837 253.1 Radiation absorbed (MJ/m2) 1141 1475 975 1151 963 44.5 Number of mainstems (000/ha) 154 177 168 133 137 10.5 Number of tubers > 10 mm (000/ha) 472 500 463 446 479 35.0 Tuber FW yield > 10 mm (t/ha) 32.4 49.7 23.3 32.1 24.5 3.68 Tuber DM concentration (%) 21.9 22.4 23.0 22.3 19.9 0.87 Tuber DW yield > 10 mm (t/ha) 7.1 11.0 5.3 7.2 4.8 0.88 Haulm DW yield (t/ha) 3.9 3.1 3.7 3.9 5.0 0.27 Total DW yield (t/ha) 11.0 14.0 9.0 11.1 9.8 0.94 DM harvest Index (%) 63 79 60 63 49 2.6 Total N uptake (kg N/ha) 169 160 160 162 198 6.4 N harvest index (%) 47 69 43 45 31 3.0
At final harvest, the total DM yield had increased to 11 t/ha and the effects of treatments were similar to those found at the early harvest. As before, the effects on total DM yield were entirely explicable

BPC Project Report: Evaluation of the soil nitrogen supply system
BPC improving crop management 52 © British Potato Council 2004
in terms of ground cover. During the interval between the two samplings the harvest index had increased to an average of 63 %. However, the harvest index was larger in the early plantings and in crops grown on the sandy textured soil. At final harvest, the average total N uptake was identical to that found at the earlier harvest (169 kg N/ha). However, between the two harvests the N uptake of the early planted crop on the light soil had decreased from 219 to 160 kg N/ha, whereas the N uptake in the other treatments had increased. Even on 2 October, on average, over half of the crops’ N was retained in the haulm, although the proportion of N in the haulm was smaller in crops grown on the lighter textured soil and those planted earlier.
Relationships between radiation absorption, DM production and N uptake The quantity of radiation absorbed by the Cara crops was estimated using measurements of ground cover and incident radiation. The amount of total DM produced per unit MJ of radiation absorbed was then calculated for each and subject to analysis of variance. This showed that the efficiency of conversion of radiation to dry matter was c. 1 g DM/MJ and was not affected by planting date or soil type. The value for conversion efficiency in the Variety, Planting density and Nitrogen experiment was 1.3 g DM/MJ. The smaller value found in the Cultivation experiment may be due to the effects of water stress particularly during August and September.
Soil Mineral Nitrogen In common with studies in 2001 and 2002 and irrespective of soil texture and time of cultivation, the amount of soil mineral N remained relatively constant from the first sampling (23 January) until the fifth sampling at the beginning of May (Table 43). Subsequently, the amount of soil mineral N in the uncultivated, light textured soil increased rapidly during May and June, remained constant up to August and then increased substantially at final harvest. On the uncultivated, heavier textured soil, soil mineral N increased at a slower but steady rate until the final sampling on 3 October. The amounts of soil mineral N in the uncultivated plots on both soil types were almost identical at the final sampling. For both soil textures, cultivations increased the amount of soil mineral N relative to the uncultivated controls and these effects persisted until October. The presence of a crop significantly reduced the amount of soil mineral N at the end of the season from an average of 283 to 50 kg N/ha. In this experiment, planting date had no effect on the size of mineral N residues in the soil at harvest.
The soil mineral N results were analysed using a split-line model to estimate the date and mineralization rate of the initial rapid phase of N release. An example of this type of analysis is shown in Figure 6

BPC Project Report: Evaluation of the soil nitrogen supply system
BPC improving crop management 53 © British Potato Council 2004
FIGURE 6. EXAMPLE OF SPLIT-LINE MODEL FITTED TO SOIL MINERAL N RESULTS FOR UNCULTIVATED LIGHT LAND AT CUF 2003. SQUARES ARE MEASURED RESULTS AND LINE IS FITTED RESULTS
For the uncultivated, lighter textured soil the mineralization rate was c. 2.7 kg N/ha/day and cultivations (early or late) increased this to 3.3 kg N/ha/day (Table 44). For the heavier textured soil, the mineralization rate of the uncultivated soil was c. 0.8 kg N/ha/day increasing to c. 1.1 kg N/ha/day when the soil was cultivated. For the lighter textured soil, the early cultivation (ploughing on 23 April) advanced the start of mineralization by about 2 weeks compared with the late cultivation and uncultivated control. Owing to the variability of the results it was not possible to estimate the start date of mineralization on the heavier soil with any accuracy, however, the results do suggest that mineralization on the heavier textured soil started 2 to 3 weeks before the lighter textured soil.
0
50
100
150
200
250
300
1-Jan 31-Jan 2-Mar 1-Apr 1-May 31-May 30-Jun 30-Jul
Soi
l min
eral
N (k
g N
/ha)
Constant = 71 kg N/ha
Initial slope = 0.1 kg N/ha/day

BPC Project Report: Evaluation of the soil nitrogen supply system
BPC improving crop management 54 © British Potato Council 2004
TABLE 43. EFFECTS OF SOIL TEXTURE, CULTIVATIONS AND CROPPING ON SOIL MINERAL NITROGEN (0-90 CM, KG N/HA). CUF, STARVEACRE FIELD 2003
Cultivated Early Cultivated late Uncultivated Unplanted Planted Unplanted Planted Unplanted S.E. 23 Jan Light 75 Heavy 75
n.a.
6 Mar Light 59 Heavy 59
n.a.
11 Apr Light 77 Heavy 82
8.8
27 Apr Light 83 Heavy 62
11.7
6 May Light 82 84 7.8 Heavy 93 80 6.5 27 May Light 143 111 11.2 Heavy 105 96 11.0 23 Jun Light 239 202 188 14.3 Heavy 187 171 142 13.7 1 Aug Light 293 205 158 25.8 Heavy 223 225 176 21.4 3 Oct Light 278 56 250 45 236 36.5 Heavy 316 50 286 47 240 32.1
In previous years, cultivations often resulted in a doubling of mineralization rates, however, in the 2003 experiment the effects were much smaller, irrespective of soil type. Cultivations stimulate mineralization by exposing organic matter that is physically protected from degradation by aerobic soil microorganisms. On the lighter textured soil, there was little visible difference between soil aggregate size before or after cultivation – in both cases the soil was almost structureless. Similarly on the heavier textured soil, whilst the cultivations did break down the larger clods, the soil remained cloddy throughout the season. Thus, for both soil textures, the sequence of cultivations may not have significantly increased the surface area of the soil exposed to N mineralizing organisms.
TABLE 44. ESTIMATES OF START DATE OF RAPID PHASE OF N MINERALIZATION AND NET MINERALIZATION RATE USING A SPLIT-LINE FUNCTION. CUF STARVEACRE FIELD 2003
Soil texture
Date of ploughing
R2
Estimated start date of mineralization and S.E.
Estimated rate of mineralization and S.E. (kg N/ha/day)
Loamy sand None 99.0 16 May 2.6 2.7 0.23 Loamy sand 23 April 99.7 4 May 1.4 3.3 0.12 Loamy sand 30 May 99.2 18 May 2.1 3.3 0.23 Sand clay loam None 93.6 18 April 23.4 0.8 0.29 Sand clay loam 23 April 91.4 13 April 26.8 1.1 0.49 Sand clay loam 30 May 95.0 16 April 20.6 1.0 0.34
Earlier work suggested that the start date of the rapid phase of mineralization was primarily dependent on soils being warm (> 13 °C) and moist. The soil results collected in 2003 support this hypothesis, since the rapid phase of mineralization did not start until late April/early May when soil

BPC Project Report: Evaluation of the soil nitrogen supply system
BPC improving crop management 55 © British Potato Council 2004
temperatures were regularly > 13 °C and there had been 31 mm of rain between 24 April and 6 May (Figure 7).
FIGURE 7. SOIL TEMPERATURE AT 10 CM (THIN LINE) AND CUMULATIVE RAINFALL AND IRRIGATION (THICK LINE) AT CUF 2003. HORIZONTAL LINE CORRESPONDS TO 13°C.
0
5
10
15
20
25
30
1-Mar 1-Apr 2-May 2-Jun 3-Jul 3-Aug 3-Sep 4-Oct
Soi
l tem
pera
ture
at 1
0 cm
(°C
)
0
50
100
150
200
250
300
350
Cum
ulat
ive
rain
fall+
irrig
atio
n (m
m)
Earlier work also suggested that large rates of N mineralization may be associated with small clay contents. For all three seasons, the pattern of soil mineral N accumulation over time was analysed using a split-line and a summary of the results from the three years is shown in Table 45. These results show that the most rapid rate of N mineralization was associated with small organic matter and small clay contents. For a particular combination of variety, season length, site and season there is only one value for optimal N application rate and N recommendation systems attempt to identify this value. Clearly, N recommendation systems that are influenced by factors other than those that determine the crop’s N requirement are likely to give misleading recommendations.
TABLE 45. SUMMARY OF SOIL PROPERTIES AND NITROGEN MINERALIZATION RATES IN UNCULTIVATED PLOTS CUF 2001-2003
Year
Clay (%)
Organic matter (%)
Mineralization rate kg N/ha/day and (S.E.)
2001 16 7.5 0.7 (± 0.28) 2002 17 4.6 1.7 (± 0.18) 2003 6 5.0 2.7 (± 0.23) 2003 21 6.1 0.8 (± 0.29)
Using regression parameters calculated from fitting a split-line to results of soil mineral N over time, the values for soil mineral N (and S.E.) were calculated for the early and late planting dates and respective emergence dates of the Cara crops grown in this experiment. From these values, SNS Indices and N recommendations were calculated using RB 209. Dates of planting and emergence were used because these represent a realistic “window” during which soil samples could be taken, dispatched, analysed, results interpreted and fertilizer spread whilst avoiding problems associated
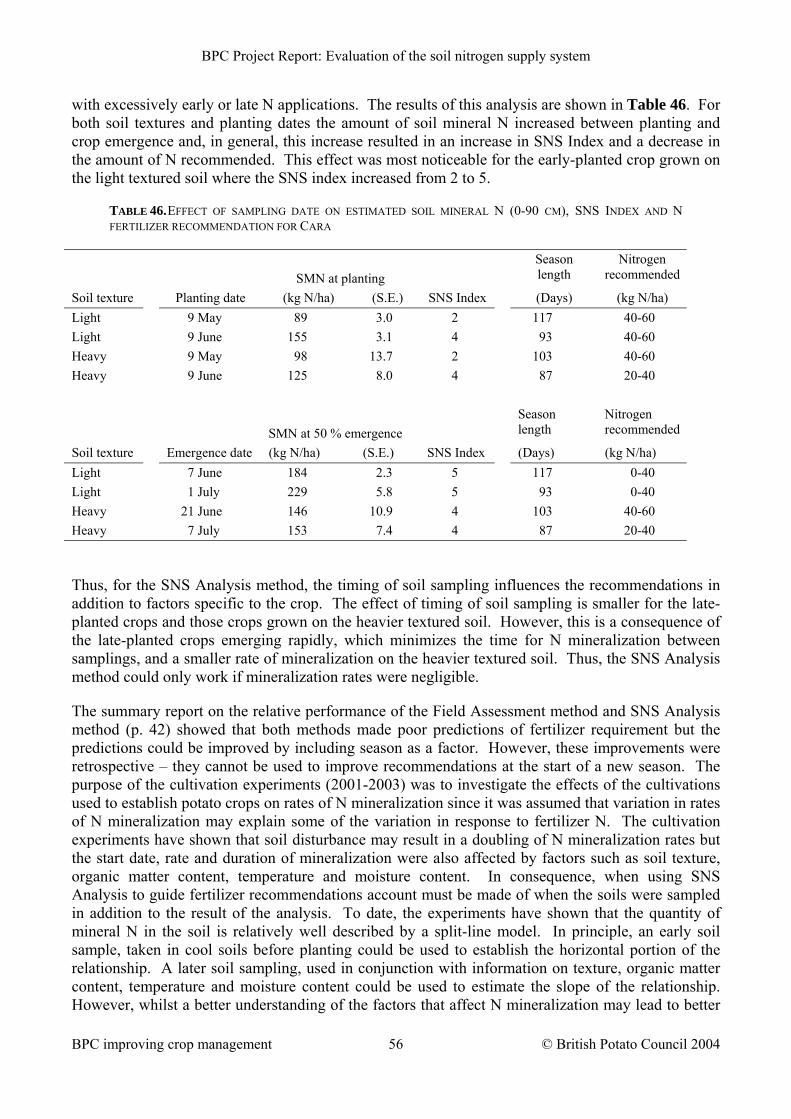
BPC Project Report: Evaluation of the soil nitrogen supply system
BPC improving crop management 56 © British Potato Council 2004
with excessively early or late N applications. The results of this analysis are shown in Table 46. For both soil textures and planting dates the amount of soil mineral N increased between planting and crop emergence and, in general, this increase resulted in an increase in SNS Index and a decrease in the amount of N recommended. This effect was most noticeable for the early-planted crop grown on the light textured soil where the SNS index increased from 2 to 5.
TABLE 46. EFFECT OF SAMPLING DATE ON ESTIMATED SOIL MINERAL N (0-90 CM), SNS INDEX AND N FERTILIZER RECOMMENDATION FOR CARA
SMN at planting
Season length
Nitrogen recommended
Soil texture Planting date (kg N/ha) (S.E.) SNS Index (Days) (kg N/ha) Light 9 May 89 3.0 2 117 40-60 Light 9 June 155 3.1 4 93 40-60 Heavy 9 May 98 13.7 2 103 40-60 Heavy 9 June 125 8.0 4 87 20-40
SMN at 50 % emergence Season
length Nitrogen recommended
Soil texture Emergence date (kg N/ha) (S.E.) SNS Index (Days) (kg N/ha) Light 7 June 184 2.3 5 117 0-40 Light 1 July 229 5.8 5 93 0-40 Heavy 21 June 146 10.9 4 103 40-60 Heavy 7 July 153 7.4 4 87 20-40
Thus, for the SNS Analysis method, the timing of soil sampling influences the recommendations in addition to factors specific to the crop. The effect of timing of soil sampling is smaller for the late-planted crops and those crops grown on the heavier textured soil. However, this is a consequence of the late-planted crops emerging rapidly, which minimizes the time for N mineralization between samplings, and a smaller rate of mineralization on the heavier textured soil. Thus, the SNS Analysis method could only work if mineralization rates were negligible.
The summary report on the relative performance of the Field Assessment method and SNS Analysis method (p. 42) showed that both methods made poor predictions of fertilizer requirement but the predictions could be improved by including season as a factor. However, these improvements were retrospective – they cannot be used to improve recommendations at the start of a new season. The purpose of the cultivation experiments (2001-2003) was to investigate the effects of the cultivations used to establish potato crops on rates of N mineralization since it was assumed that variation in rates of N mineralization may explain some of the variation in response to fertilizer N. The cultivation experiments have shown that soil disturbance may result in a doubling of N mineralization rates but the start date, rate and duration of mineralization were also affected by factors such as soil texture, organic matter content, temperature and moisture content. In consequence, when using SNS Analysis to guide fertilizer recommendations account must be made of when the soils were sampled in addition to the result of the analysis. To date, the experiments have shown that the quantity of mineral N in the soil is relatively well described by a split-line model. In principle, an early soil sample, taken in cool soils before planting could be used to establish the horizontal portion of the relationship. A later soil sampling, used in conjunction with information on texture, organic matter content, temperature and moisture content could be used to estimate the slope of the relationship. However, whilst a better understanding of the factors that affect N mineralization may lead to better

BPC Project Report: Evaluation of the soil nitrogen supply system
BPC improving crop management 57 © British Potato Council 2004
estimates of SNS it is debatable whether this will lead to significantly improved fertilizer recommendations. Variation in soil conditions and rooting from site to site will affect the ability of a crop to access the SNS and this will affect its fertilizer N requirement. Consequently, factors that are still poorly understood may be a principal cause of the variation in N requirement. Analysis of other data sets may help us understand the effects of soil structure/compaction on the release of N from organic matter and it acquisition and utilization by the crop. Thus, future research effort needs to be directed into understanding the relationship between soil conditions, root function, water and N uptake and this may allow assessment of the seasonal component at the start of the season.

BPC Project Report: Evaluation of the soil nitrogen supply system
BPC improving crop management 58 © British Potato Council 2004
Effects of planting date and N supply on yield and N uptake of Estima at CUF
Introduction Earlier studies have shown that the pattern of N uptake by potato crops could be described by a split-line model with an initial, rapid phase of N uptake followed by a slower phase. These studies showed that the initial, rapid phase of N uptake was short lived (34-53 DAE) and the change in rate of N uptake occurred, on average, in mid June. The purpose of this experiment was to investigate the effects of planting date and N supply on the duration of crop N uptake, canopy persistence and yield. The results and discussion of this experiment need to be considered with those of the Variety, Planting Density and N experiment since the methods of analysis and interpretation are similar.
Materials and Methods The experiment tested all combinations of four planting dates (3 April, 6 May, 2 June and 30 June) and three N application rates (0, 120 and 240 kg N/ha). Each treatment combination was replicated three times. The experiment was a split-plot design with sub-plots (N rates) allocated at random to main-plots (planting dates), which were, in turn, allocated at random to blocks. Estima seed was planted, by hand, at 25 cm spacing into rows 76 cm apart. Nitrogen fertilizer was applied at planting as ammonium nitrate and incorporated by raking. Crop emergence was measured every 3 to 4 days and ground cover was measured weekly. In addition, the number of main-axis leaves > 5 mm was also recorded weekly. Throughout the season, harvests were taken on selected treatments to estimate tuber and canopy DM yield and N uptake and a final harvest (1.9 m2) was taken on 6 October.
Results and Discussion Emergence and ground cover
Delaying planting from 3 April to 30 June decreased the time from planting to 50 % emergence from 37 days to 20 days, however increasing the N application rate from 0 to 240 kg N/ha had no effect (Table 47). All treatments achieved c. 100 % emergence and the effect of treatments on the pattern of ground cover development is shown in Figure 8. All treatments achieved full ground cover irrespective of planting date and N application rate. On average, full ground cover was achieved c. 31 days after emergence and was not affected by planting date or N application rate.
TABLE 47. EFFECT OF PLANTING DATE AND N APPLICATION RATE ON TIME FROM PLANTING TO 50 % EMERGENCE (DAYS) OF ESTIMA AT CUF
Nitrogen application rate (kg N/ha) 0 120 240 Mean 3 April 38.1 36.2 37.2 37.2 6 May 25.3 25.6 26.1 25.7 2 June 20.5 20.3 19.8 20.2 30 June 19.3 19.9 20.4 19.9 Mean 25.8 25.5 25.9 25.7 S.E. for Date 1.09; N rate 0.36; Date × N rate 1.24 or 0.73 when comparing the same date of planting

BPC Project Report: Evaluation of the soil nitrogen supply system
BPC improving crop management 59 © British Potato Council 2004
The effects of treatments on season-long integrated ground cover are shown in Table 48. As planting was delayed from 3 April to 30 June the integrated ground cover decreased from c. 6900 % days to 5200 % days. The potential integrated ground cover for the final planting would have been larger, however, final harvest occurred before the canopy had fully senesced.
TABLE 48. EFFECT OF PLANTING DATE AND N APPLICATION RATE ON INTEGRATED GROUND COVER (% DAYS) OF ESTIMA AT CUF
Nitrogen application rate (kg N/ha) 0 120 240 Mean 3 April 6337 6641 7642 6873 6 May 5691 6185 6470 6115 2 June 5605 5813 6451 5957 30 June 4985 5172 5519 5225 Mean 5655 5953 6521 6043 S.E. for Date 96.4; N rate 79.1; Date × N rate 161.1 or 158.1 when comparing the same date of planting
Components of yield and N uptake at final harvest
A final harvest was taken on 6 October. There was no effect of planting date or N application rate on number of stems and tubers > 10 mm which averaged 120 000/ha and 543 000/ha respectively. Overall, increasing the N application rate from 0 to 240 kg N/ha had little effect on tuber FW yield > 10 mm (Table 49). However, as planting was delayed, yields decreased from 70 t/ha (3 April) to 41 t/ha (30 June). Similarly, total DM yields were largest at the earliest planting date and smallest at the latest planting date (Table 50). Nitrogen application rate had no significant effect on total DM yield.

BPC Project Report: Evaluation of the soil nitrogen supply system
BPC improving crop management 60 © British Potato Council 2004
FIGURE 8. EFFECT OF PLANTING DATE AND N APPLICATION RATE ON GROUND COVER DEVELOPMENT IN ESTIMA. KEY: □, 0 KG N/HA; ◊, 120 KG N/HA AND ∆, 240 KG N/HA. CUF 2003.
Planted 3 April
0
20
40
60
80
100
1-May 31-May 30-Jun 30-Jul 29-Aug 28-Sep 28-Oct
Gro
und
cove
r (%
)
Planted 6 May
0
20
40
60
80
100
1-May 31-May 30-Jun 30-Jul 29-Aug 28-Sep 28-Oct
Gro
und
cove
r (%
)
Planted 2 June
0
20
40
60
80
100
1-May 31-May 30-Jun 30-Jul 29-Aug 28-Sep 28-Oct
Gro
und
cove
r (%
)
Planted 30 June
0
20
40
60
80
100
1-May 31-May 30-Jun 30-Jul 29-Aug 28-Sep 28-Oct
Gro
und
cove
r (%
)

BPC Project Report: Evaluation of the soil nitrogen supply system
BPC improving crop management 61 © British Potato Council 2004
TABLE 49. EFFECT OF PLANTING DATE AND N APPLICATION RATE ON TUBER FW YIELD > 10 MM (T/HA) OF ESTIMA AT CUF
Nitrogen application rate (kg N/ha) 0 120 240 Mean 3 April 68.2 69.3 72.3 70.0 6 May 45.8 56.5 61.9 54.8 2 June 48.7 52.5 48.4 49.9 30 June 40.1 39.8 42.6 40.8 Mean 50.7 54.5 56.3 53.9 S.E. for Date 1.27; N rate 1.63; Date × N rate 2.95 or 3.26 when comparing the same date of planting
TABLE 50. EFFECT OF PLANTING DATE AND N APPLICATION RATE ON TOTAL DW YIELD (T/HA) OF ESTIMA AT CUF
Nitrogen application rate (kg N/ha) 0 120 240 Mean 3 April 13.0 13.5 13.1 13.2 6 May 9.8 11.1 11.9 10.9 2 June 10.1 12.1 9.9 10.7 30 June 9.5 10.2 10.3 10.0 Mean 10.6 11.7 11.3 11.2 S.E. for Date 0.33; N rate 0.39; Date × N rate 0.71 or 0.77 when comparing the same date of planting
Averaged over all treatments, total N uptake was 177 kg N/ha (Table 51). Total N uptake was not significantly affected by planting date, but increasing the N application rate from 0 to 240 kg N/ha increased total N uptake from 151 to 194 kg N/ha. The effects of the treatments on DM yield and N uptake demonstrate that it is possible to change N uptake without changing yield, supporting the view that N uptake does not drive yield formation.
TABLE 51. EFFECT OF PLANTING DATE AND N APPLICATION RATE ON TOTAL N UPTAKE AT FINAL HARVEST (KG N/HA) OF ESTIMA AT CUF
Nitrogen application rate (kg N/ha) 0 120 240 Mean 3 April 152 203 214 190 6 May 128 172 189 163 2 June 166 191 168 175 30 June 160 173 207 180 Mean 151 185 194 177 S.E. for Date 7.1; N rate 6.7; Date × N rate 13.1 or 13.4 when comparing the same date of planting

BPC Project Report: Evaluation of the soil nitrogen supply system
BPC improving crop management 62 © British Potato Council 2004
Dry matter production and N uptake during the season
Radiation absorption by the crop was estimated from the product of measurements of incident radiation and ground cover. The efficiency of conversion of absorbed radiation to DM was then estimated by plotting total DM yield measured at each harvest against radiation absorbed. Final harvest results were omitted from this analysis since there had been some loss of total DM due to non-recovery of senesced material. Total DM yield was linearly related to radiation absorption (Figure 9). Nitrogen application rate had no significant effect on the efficiency of conversion but analysis of variance showed that the efficiency of conversion was smaller for the second and third plantings when compared with the first and last plantings (Table 52). It is likely that the apparent reduction in conversion efficiency was due to the middle plantings experiencing periods of water stress when actual evapotranspiration could not meet potential evapotranspiration.
FIGURE 9. RELATIONSHIP BETWEEN TOTAL DM YIELD AND RADIATION ABSORBTION FOR FOUR PLANTING DATES. KEY: ■, 3 APRIL; ♦, 6 MAY; □, 2 JUNE AND ◊, 30 JUNE OF ESTIMA AT CUF.
TABLE 52. EFFECT OF PLANTING DATE AND N APPLICATION RATE ON EFFICIENCY OF DM PRODUCTION (G/MJ) FROM PLANTING TO PENULTIMATE HARVEST OF ESTIMA AT CUF
Nitrogen application rate (kg N/ha) 0 120 240 Mean 3 April 1.36 1.49 1.45 1.43 6 May 1.15 1.28 1.38 1.27 2 June 1.19 1.29 1.32 1.27 30 June 1.51 1.64 1.34 1.50 Mean 1.30 1.43 1.37 1.37 S.E. for Date 0.032; N rate 0.037; Date × N rate 0.069 or 0.074 when comparing the same date of planting
0
200
400
600
800
1000
1200
1400
1600
0 200 400 600 800 1000 1200Radiation absorbed (MJ/m2)
Tota
l DM
yie
ld (g
/m2 )

BPC Project Report: Evaluation of the soil nitrogen supply system
BPC improving crop management 63 © British Potato Council 2004
Earlier analysis had used a split-line model to describe the relationship between N uptake and radiation absorption and this model has the advantage of having parameters that are easily understandable. A consequence of modelling N uptake and total DM production as linear relationships is that the N concentration within the DM remains constant until the “breakpoint” of the split-line relationship. However, in practice the N concentration of DM gradually decreases throughout the growing season. Furthermore, when there are relatively few harvests, the location of the “breakpoint” tends to be biased towards a particular harvest date resulting in an inaccurate estimate. For this reason the 2003 results were modelled using an exponential relationship:
N = a +b × rRA
Where N is N uptake (g N/m2), RA is radiation absorbed (MJ/m2) and a, b and r are fitted constants. For any value of RA the slope of the relationship (i.e. g N/MJ) is given by
Slope = b × log(r) × rRA
Generally, measured values of total and tuber N uptake were well described by the exponential function and an example is shown in Figure 10 (NB 1 g N/m2 = 10 kg N/ha). The change in rate of total and tuber N uptake for the same plot is shown in Figure 11. In this example, during the course of the season the rate of total N uptake decreased from 0.085 to 0.002 g N/MJ (a forty-fold decrease). However, the rate of N uptake by tubers decreased from 0.025 to 0.008 g N/MJ (a three-fold decrease). In consequence, when this particular crop had absorbed c. 490 MJ/m2 (on 25 June, 48 DAE) the rate of N uptake by the tubers exceeded the total N uptake rate. Thus, after the 25 June the canopy became a net exporter of N to the developing tubers.
FIGURE 10. EXAMPLE OF TOTAL AND TUBER N UPTAKE FOR PLOT 19 (PLANTED 3 APRIL, 120 KG N/HA). SYMBOLS ARE MEASURED VALUES (TOTAL ∆ AND TUBERS □) AND LINES ARE DERIVED FROM ESTIMATED PARAMETERS. THE FINAL VALUE FOR TOTAL N UPTAKE HAS BEEN OMITTED FROM THE ANALYSIS.
0
5
10
15
20
25
30
0 300 600 900 1200
Radiation absorbed (MJ/m2)
N u
ptak
e (g
N/m
2 )

BPC Project Report: Evaluation of the soil nitrogen supply system
BPC improving crop management 64 © British Potato Council 2004
FIGURE 11. EXAMPLE OF THE CHANGE OF RATE OF N UPTAKE FOR PLOT 19 (PLANTED 3 APRIL, 120 KG N/HA)
The effect of planting date and N application rate on the date when canopy N uptake ceased is shown in Table 53. In this experiment, increasing the N application rate had no significant effect on the date when the crop canopy ceased to accumulate N at any date of planting. Variation in planting date resulted in a 13 day variation in the cessation of canopy N accumulation, however, this variation appeared random and possible causes for this will be explored later in this section.
TABLE 53. EFFECT OF PLANTING DATE AND N APPLICATION RATE ON DATE OF CESSATION OF NET N UPTAKE BY CANOPY (DAE) OF ESTIMA AT CUF
Nitrogen application rate (kg N/ha) 0 120 240 Mean 3 April 46 45 45 45 6 May 27 33 35 32 2 June 40 37 45 41 30 June 30 37 34 34 Mean 36 38 40 38 S.E. for Date 2.2; N rate 1.9; Date × N rate 3.8 or 3.8 when comparing the same date of planting
The effect of treatments on the date of change in rate of main-axis leaf appearance is shown in Table 54. When averaged over all treatments there were 25.6 main-axis leaves when the rate of leaf production changed and 26.3 leaves at final harvest. In consequence, for all treatments the change in rate of leaf production was essentially cessation of leaf production. The timings of cessation of canopy N uptake and leaf production were broadly similar: the overall means were similar as were trends in the main effects of the treatments. Thus, these results suggest that canopy N uptake and leaf production stop at similar times. Table 55 gives estimates of the quantity of N within the crop canopy at the cessation of N uptake. Differences between planting dates, whilst statistically significant, were small and erratic. However, increasing the N application rate from 0 to 240 kg N/ha increased the amount of N in the canopy from 8.8 to 13.4 g N/m2 (i.e. from 88 to 134 kg N/ha).
0.00
0.01
0.02
0.03
0.04
0.05
0.06
0.07
0.08
0.09
0 300 600 900 1200
Radiation absorbed (MJ/m2)
Rat
e of
N u
ptak
e (g
N/M
J)
Total
Tuber

BPC Project Report: Evaluation of the soil nitrogen supply system
BPC improving crop management 65 © British Potato Council 2004
Despite this large increase in canopy N, leaf appearance ceased at a similar time to canopy N uptake suggesting that leaf appearance in Estima may be more sensitive to current N uptake than canopy N reserves.
TABLE 54. EFFECT OF PLANTING DATE AND N APPLICATION RATE ON DATE OF CHANGE IN RATE OF LEAF APPEARANCE (DAE) OF ESTIMA AT CUF
Nitrogen application rate (kg N/ha) 0 120 240 Mean 3 April 38 44 54 45 6 May 33 34 37 35 2 June 34 38 41 38 30 June 29 30 26 28 Mean 34 37 40 37 S.E. for Date 1.7; N rate 1.2; Date × N rate 2.6 or 2.3 when comparing the same date of planting
TABLE 55. EFFECT OF PLANTING DATE AND N APPLICATION RATE ON AMOUNT OF N IN CANOPY AT CESSATION OF NET N UPTAKE BY CANOPY (G N/M2) IN ESTIMA AT CUF
Nitrogen application rate (kg N/ha) 0 120 240 Mean 3 April 8.3 12.2 13.5 11.3 6 May 9.3 12.0 15.2 12.2 2 June 8.8 11.3 13.1 11.1 30 June 8.9 11.5 12.0 10.8 Mean 8.8 11.8 13.4 11.4 S.E. for Date 0.21; N rate 0.53; Date × N rate 0.89 or 1.06 when comparing the same date of planting
After canopy N uptake and leaf appearance cease, canopy persistence is dependent upon the survival of a fixed number of leaves using reserves of N within the canopy which are being continuously depleted by movement of N to the tubers. Eventually, the canopy will senesce. For the purpose of this analysis, canopy senescence was defined as the date at which ground cover had declined to 50 %. When averaged over all treatments, the onset of senescence occurred 80 DAE (Table 56).

BPC Project Report: Evaluation of the soil nitrogen supply system
BPC improving crop management 66 © British Potato Council 2004
TABLE 56. EFFECT OF PLANTING DATE AND N APPLICATION RATE ON DATE AT WHICH CANOPY HAD SENESCED TO 50 % GROUND COVER (DAE) FOR ESTIMA AT CUF
Nitrogen application rate (kg N/ha) 0 120 240 Mean 3 April 87 89 98 91 6 May 74 79 82 78 2 June 74 76 83 77 30 June 70 73 76 73 Mean 76 79 85 80 S.E. for Date 0.8; N rate 0.8; Date × N rate 1.6 or 1.6 when comparing the same date of planting
Compared with later plantings the earliest planting had a much more persistent canopy (91 compared with 76 DAE). The effect on N application rate on the date of canopy senescence was smaller but still significant. Regressions were done to test whether there was an association between the date when leaf appearance ceases or when canopy N uptake ceases and canopy persistence. These regressions showed that the dates of cessation of leaf production was a reasonable predictor of the date at which the canopy had senesced to 50 % ground cover, but cessation of canopy N uptake was less so:
Date of 50% GC = 0.82 (± 0.105) Cessation of leaf appearance + 50 (± 3.9)
R2 = 63 %; P < 0.001
Date of 50 % GC = 0.58 (± 0.140) Cessation of Canopy N uptake + 58 (± 5.4)
R2= 32 %; P < 0.001
Further analysis showed that canopy persistence was not closely related to the amount of N in the canopy when it ceased to take up N. This is surprising since it might be expected that canopies with large N reserves would be more persistent since they could supply N to the developing tubers for longer without impairing canopy size or function. However, in this experiment, the lack of association between canopy persistence and N content can be explained by two factors: first; canopies containing large amounts of N at cessation of uptake also contained large amounts of N when they had senesced to 50 % ground cover; secondly; compared with tubers produced under canopies with small N contents, the tubers produced by canopies containing large amount of N have larger rates of N uptake and thus deplete the N reserves in the canopy at faster rate.
This experiment has shown that canopy N uptake may be short-lived (ceasing c. 38 DAE) and the period of canopy N uptake corresponds to the period of leaf appearance. Furthermore once leaf appearance and canopy N uptake cease the canopy persists for c. six weeks. Compared with N application rate, date of planting had a much larger effect on the duration of canopy N uptake, leaf production and, in turn, canopy longevity. Estimates of conversion efficiency (Table 52) suggested that the second and third plantings may have experienced periods of water stress compared with the first and last plantings. Using the CUF irrigation model, daily potential evapotranspiration rates

BPC Project Report: Evaluation of the soil nitrogen supply system
BPC improving crop management 67 © British Potato Council 2004
(Etpot) were calculated for the crops receiving 120 kg N/ha (Figure 12). Large potential evapotranspiration rates are an indication that the crop canopy may be stressed since the root system may be unable to supply water at the potential rates demanded by the canopy/atmosphere. For the first planting, large Etpots were not experienced until mid-July (c. 65 DAE) and this was after leaf appearance and canopy N uptake had ceased. However, for the second and third plantings, the crop may have experienced some water stress in mid-July (c. 40 DAE) and early August (c. 45 DAE) respectively and this corresponded to the cessation of leaf production and canopy N uptake. Whilst crops planted last experienced no significant water stress (and had a large conversion efficiency) leaf production and canopy N uptake may have been curtailed by rapidly decreasing day lengths as found by Firman et al. (1995) and this resulted in a short lived canopy. Factors that exacerbate the stress experienced by the roots and canopies are likely to shorten the period of N uptake – for instance poor root growth and distribution and it is possible that such factors may have a larger effect on canopy function than N supply per se. These factors may explain the “seasonal” effects in N response found in the analyses of the soil nitrogen supply study (p. 42).
FIGURE 12. RELATIONSHIP BETWEEN GROUND COVER AND ESTIMATED DAILY POTENTIAL EVAPOTRANSPIRATION RATE FOR CROPS RECEIVING 120 KG N/HA.
Planted 6 May
0
20
40
60
80
100
1-May 1-Jun 2-Jul 2-Aug 2-Sep 3-Oct
Gro
und
cove
r (%
)
0
1
2
3
4
5
6
7
Et po
t (mm
)
Planted 3 April
0
20
40
60
80
100
1-May 1-Jun 2-Jul 2-Aug 2-Sep 3-Oct
Gro
und
cove
r (%
)
0
1
2
3
4
5
6
7
Et po
t (mm
)

BPC Project Report: Evaluation of the soil nitrogen supply system
BPC improving crop management 68 © British Potato Council 2004
Effect of variety, nitrogen application rate and planting density on canopy form and function
Introduction This experiment continued work done in 2001 and 2002 where the effects of variety, planting density and N application rate on N uptake, canopy function and yield were studied. The results of these experiments need to be considered in the context of the earlier experiments as well as the Planting Date and N experiment done at CUF in 2003.
Materials and Methods The experiment tested in factorial combination, two contrasting varieties (Cara and Estima), two plant spacings (15 and 60 cm, equivalent to 87 490 and 21 870 plants/ha) and two N application rates (0 and 300 kg N/ha). Each treatment combination was replicated four times and allocated at random to blocks. The experiment was planted by hand on 10 April. Nitrogen fertilizer was applied as ammonium nitrate at planting in a single dose and incorporated by raking. Crop emergence was measured every 3 to 4 days until 100 % emergence and ground covers were measured weekly with a grid. In addition, appearance of main-axis leaves > 5 mm was also recorded weekly on two stems per plot. Five harvests (2.29 m2) were taken during the season and a final harvest (4.57 m2) was taken on 30 September (Estima) and 7 October (Cara). At each harvest graded tuber FW and DW yield was measured. In addition, the haulm was separated into its component parts (main-axis stems and leaves and branch stems and leaves) and FW and DW yields were measured. The N concentration of tubers and haulm components were measured at each harvest.
Planted 30 June
0
20
40
60
80
100
1-May 1-Jun 2-Jul 2-Aug 2-Sep 3-Oct
Gro
und
cove
r (%
)
0
1
2
3
4
5
6
7
Et po
t (m
m)
Planted 2 June
0
20
40
60
80
100
1-May 1-Jun 2-Jul 2-Aug 2-Sep 3-Oct
Gro
und
cove
r (%
)
0
1
2
3
4
5
6
7
Et po
t (m
m)

BPC Project Report: Evaluation of the soil nitrogen supply system
BPC improving crop management 69 © British Potato Council 2004
Results and Discussion Emergence and ground covers
For all treatments, 50 % emergence was achieved 32 days after planting (12 May, Table 57), with Cara emerging slightly faster than Estima (30 DAP compared with 33 DAP) and crops receiving 300 kg N/ha emerging slightly later than crops receiving no N (33 DAP compared with 31 DAP). All crops achieved c. 100 % emergence. The effects of the treatments on total integrated ground cover are shown in Table 57. The average integrated ground cover was c. 9000 % days and this was larger than achieved in similar experiments in 2001 and 2002. When averaged over the other treatments, Cara had much larger integrated ground cover than Estima (11241 compared with 6757 % days). Increasing the plant spacing from 15 to 60 cm reduced integrated ground cover (9354 to 8644 % days) and increasing the N application rate from 0 to 300 kg N/ha increased integrated ground cover from 8211 to 9787 % days. The integrated ground cover (for Cara at 15 cm at spacing with 300 kg N/ha) was the largest recorded in this series of experiments and is equivalent to c. 4 months at 100 % ground cover.
TABLE 57. EFFECT OF VARIETY, PLANT SPACING AND N APPLICATION RATE ON DATE OF 50 % EMERGENCE AND TOTAL INTEGRATED GROUND COVER
15 cm 60 cm 0 kg /ha 300 kg/ha 0 kg/ha 300 kg/ha Mean S.E. Emergence (DAP) Cara 29.8 30.9 28.7 31.9 Estima 32.5 33.0 32.2 35.4
31.8 0.78
Ground cover (% days) Cara 10651 12326 10359 11627 Estima 6147 8291 5687 6903
8999 181.3
The effect of treatments on the pattern of ground cover development is shown in Figure 13. When averaged over other treatments, both Estima and Cara achieved full ground cover at the same time (38 DAE). Increasing the plant spacing delayed full ground cover by 11 days (33 compared with 44 DAE) and increasing the N application decreased the time to full ground cover by 3 days (40 to 37 DAE). As expected, the canopy of Estima started to senesce before Cara (78 compared with 118 DAE) and applying 300 kg N/ha delayed senescence from 88 to 110 DAE. The effect of plant spacing was much smaller: the close spacings senesced 97 DAE compared with 102 DAE for the wider spacings.
Components of yield and N uptake at final harvest
The number of mainstems averaged 125 000/ha and Cara produced more stems than Estima (Table 58). Increasing the spacing from 15 to 60 cm decreased the number of mainstems from 192 000 to 59 000/ha, but N application rate had no effect. The number of tubers > 10 mm averaged 484 00 /ha. Cara produced more tubers than Estima (511 000 compared with 457 000). Despite more than tripling the number of stems, increasing the planting density only increased the number of tubers from 363 000 to 604 000/ha.

BPC Project Report: Evaluation of the soil nitrogen supply system
BPC improving crop management 70 © British Potato Council 2004
FIGURE 13. EFFECT OF VARIETY, PLANT SPACING AND N APPLICATION RATE ON PATTERN OF GROUND COVER DEVELOPMENT. KEY: □, 15 CM 0N; ∆, 60 CM 0N ■, 15 CM 300N AND ▲, 60 CM 300N
Tuber FW yield averaged 66 t/ha compared with 47 and 54 t/ha in similar experiments in 2001 and 2002, respectively. When averaged over other treatments, yields of Cara and Estima were the same. However, tuber yields were larger at the close spacing, 72 t/ha, compared with 60 t/ha at the wide spacing. Overall, the main effect of N was to increase yield from 62 to 69 t/ha but the varieties differed in their response. Applying N to Estima increased tuber yields from 55 to 77 t/ha but applying N to Cara reduced tuber yields from 69 to 61 t/ha. These effects are entirely explained by ground cover, radiation absorption and DM partitioning. The mean tuber DM concentration was 20.7 %. Cara had a larger DM concentration than Estima (22.5 compared with 18.9 %) but plant spacing had no effect on DM concentration. Applying 300 kg N/ha decreased DM concentration in Estima but increased DM concentration from 21 to 24 % in Cara. This effect is unusual but has been found in other experiments this season. The overall total DM yield was 16.4 t/ha. The effects of
Cara
0
20
40
60
80
100
1-May 1-Jun 2-Jul 2-Aug 2-Sep 3-Oct 3-Nov
Gro
und
cove
r (%
)
Estima
0
20
40
60
80
100
1-May 1-Jun 2-Jul 2-Aug 2-Sep 3-Oct 3-Nov
Gro
und
cove
r (%
)

BPC Project Report: Evaluation of the soil nitrogen supply system
BPC improving crop management 71 © British Potato Council 2004
treatments on total DM yield are consistent with effects on ground cover and radiation absorption. The total DM yield of Cara was 19.4 t/ha compared with 13.5 t/ha for Estima. The effects of varying N application rate and planting density were similar: applying 300 kg N/ha increased total DM yield from 14.9 to 18.0 t/ha and increasing the planting density increased total DM yield from 15.2 to 17.7 t/ha. Total N uptake averaged 236 kg N/ha with Cara having larger N uptake than Estima (267 compared with 206 kg N/ha). Applying 300 kg N/ha increased total N uptake from 172 to 300 kg N/ha, whereas plant density had no effect on N uptake.
DM yield and radiation absorption
Radiation absorption was estimated from the product of fractional ground cover and incident radiation. The efficiency of conversion of absorbed radiation to DM was then estimated by plotting DM yields at each harvest against radiation absorption (
Figure 14). In common with many other experiments, total DM yield was closely and linearly related to radiation absorption. The overall efficiency was 1.30 g DM/MJ and this is a similar value to those found in previous experiments. Analysis of variance showed that neither variety, N application rate nor plant spacing affected the efficiency of conversion.

BPC Project Report: Evaluation of the soil nitrogen supply system
BPC improving crop management 72 © British Potato Council 2004
TABLE 58. EFFECT OF VARIETY, PLANTING DENSITY AND N APPLICATION RATE ON HAULM AND TUBER GROWTH. HARVESTED 30 SEPTEMBER 2003 (173 DAP) AND 7 OCTOBER 2003
Cara Estima 15 cm 60 cm 15 cm 60 cm Mean 0 300 0 300 0 300 0 300 S.E. Number of mainstems (000/ha) 125 212 247 72 85 147 162 38 40 10.3 Number of tubers > 10 mm (000/ha) 484 640 615 427 361 561 600 302 364 25.5 Tuber FW yield > 10 mm (t/ha) 65.7 70.8 67.7 67.8 54.5 59.8 87.7 50.4 66.9 4.18 Tuber DM concentration (%) 20.7 21.6 24.3 20.5 23.7 18.6 18.2 19.7 18.9 0.84 Tuber DW yield (t/ha) 13.6 15.3 16.5 13.9 13.1 11.2 16.0 9.9 13.0 1.23 Haulm FW yield (t/ha) 14.3 7.2 45.6 10.6 46.2 1.0 1.8 0.9 1.4 3.73 Haulm DW yield (t/ha) 2.85 3.83 5.80 3.89 5.14 0.80 1.32 0.83 1.19 0.334 Total DW yield (t/ha) 16.4 19.2 22.3 17.8 18.2 12.0 17.3 10.7 14.1 1.37 Harvest index (%) 84 80 74 78 72 93 92 92 91 1.3 Tuber N uptake (kg N/ha) 186 164 258 144 190 144 262 119 207 20.9 Total N uptake (kg N/ha) 236 205 361 194 309 156 292 134 237 25.4

BPC Project Report: Evaluation of the soil nitrogen supply system
BPC improving crop management 73 © British Potato Council 2004
FIGURE 14. RELATIONSHIP BETWEEN TOTAL DM YIELD AND RZADIATION ABSORPTION FROM PLANTING UNTIL PENULTIMATE HARVEST.
DM = 1.30RAR2 = 0.96
0
500
1000
1500
2000
0 300 600 900 1200 1500Radiation absorbed (MJ/m2)
Tota
l DM
yie
ld (g
/m2 )

BPC Project Report: Evaluation of the soil nitrogen supply system
BPC improving crop management 74 © British Potato Council 2004
Factors controlling N uptake and N utilization in potato crops
Analysis of results from 1992-1995 and 2001-2003
A key objective of this series of experiments was to better understand the connections between N uptake, N partitioning, canopy persistence and tuber yield. The purpose of this section is to develop ideas concerning how potato crops use N, why N requirements differ between varieties and with season length and how this knowledge may be exploited. This section will use results from BPC/CUF funded experiments in 2001-2003 and, where applicable, earlier Potato Marketing Board sponsored studies in 1992 and 1993. Some relevant details of these experiments are shown in Table 59. The effects of N application rate on total N uptake by Estima and Cara are shown in Appendix Tables 1-7 and the effects of N application rate on tuber N uptake by the two varieties are shown in Appendix Tables 8-14. Rates of N uptake were calculated by fitting exponential curves, on a plot-by-plot basis, to either total or tuber N uptake with adsorbed radiation as the independent variable. The effects of N application rate on the rate of total and tuber N uptake for Estima and Cara, are shown in Appendix Tables 15-21 and 22 –28 respectively.
TABLE 59. SELECTED DETAILS OF VARIETY AND N EXPERIMENTS AT CUF
Year Varieties N application rate (kg N/ha) Planting date Date of 50% emergence 1992 Cara, Estima 0, 60, 120, 180 & 240 10 April 15 May 1993 Cara, Estima 0, 60, 120, 180 & 240 10 March 20 April 1994 Cara, Estima 0, 60, 120, 180 & 240 21 April 8 May (Cara)
26 May (Estima) 1995 Cara, Estima 0, 120 & 240 4 April 2 May 2001 Cara, Estima 0 & 300 24 May 23 June 2002 Cara, Estima 0 & 300 3 April 16 May 2003 Cara, Estima 0 & 300 10 April 11 May
Total N uptake
Values for total N uptake for the seven variety and nitrogen experiments are shown in Appendix Tables 1-7. Generally, increasing the amount of N applied increased total N uptake. For all treatment combinations, total N uptake was initially rapid early in the season and then slowed or stopped. When comparing the same dates of sampling and N application rates, Cara generally had larger N uptakes than Estima, although these differences were not always statistically significant.
Tuber N uptake
The effects of variety and N application rate on the pattern of tuber N uptake are shown in Appendix Tables 8-14. Generally, for a given sampling date, tuber N uptake by Estima was larger than that of Cara. Increasing the N application rate tended to increase tuber N uptake in Estima. However, for Cara increasing the N application rate either had no effect or reduced tuber N uptake.
Rate of total N uptake
The effect of variety and N application rate on the rate of total N uptake is shown in Appendix Tables 15-21. For all treatments, N uptake was most rapid early in the season and progressively slowed. Thus, in 2003 (

BPC Project Report: Evaluation of the soil nitrogen supply system
BPC improving crop management 75 © British Potato Council 2004
APPENDIX TABLE 21) when 100 MJ/m2 had been absorbed the average rate of total N uptake was 54 mg N/MJ (equivalent to c. 9 kg N/ha on an average day in June), but this decreased to 5 mg N/MJ (i.e. less than 1 kg N/ha) once 900 MJ/m2 had been absorbed. The rate of total N uptake was consistently faster for Cara than for Estima and was also increased by applying nitrogen.
Rate of tuber N uptake
The effect of variety and N application rate on the rate of N uptake by tubers is shown in Appendix Tables 22-28. In contrast to the progression of total N uptake, the rate of tuber N uptake increased as the season progressed. In addition, Cara had a slower rate of tuber N uptake than Estima. Applying N reduced the rate of tuber N uptake in Cara but increased it in Estima.
A consequence of a decreasing rate of total N uptake and an increasing rate of tuber N uptake is that at a certain point in the season the rate of tuber N uptake will exceed the rate of total N uptake. Thus, although N may be taken up from the soil it is at an insufficient rate to supply the developing tubers and thus N will inevitably be withdrawn from the canopy. The effects of variety and N application rate on the date when the canopies ceased to take up N and on the amount of radiation absorbed are in Table 60 and Table 61 respectively. Generally, the canopies of Cara continued to take up N for longer than Estima. However, the effects of N application on the date at which the canopy ceased to take up N were generally smaller. Once the canopy ceases to take up N and starts to export N to the tubers, its persistence will be controlled, in part, by the amount of N it has managed to accumulate before it ceases to take up N and by the rate at which canopy N reserves are depleted by the developing tubers. The effect of variety and N application rate on the onset of canopy senescence shown in Table 62 would support this hypothesis. The canopies of Estima senesced first since they generally contained less N (Table 63) and these reserves were depleted more rapidly due to large tuber N uptake rates. Conversely, the canopies of Cara lasted longer since they had accumulated large amounts of N and rates of tuber N uptake were comparatively small particularly when N had been applied. These results would explain why, for a given length of season, determinate varieties need more N than indeterminate varieties since from early in the season they are trying to build and maintain canopies whilst at the same time N is also being used to support tuber growth. Conversely, for indeterminate varieties such as Cara, for a substantial portion of the season, most N uptake is used for canopy construction. These results also suggest that in many situations Cara may need little or no fertilizer. When N is applied to Cara, this appears to actively suppress tuber N uptake resulting in canopies containing a large proportion of the total N and dry matter. Table 64 shows the effects of variety and N application on the proportion of total DM allocated to the tubers. Estima has a larger harvest index than Cara and whilst applying 300 kg N/ha reduced the harvest index the effect was much larger in Cara.

BPC Project Report: Evaluation of the soil nitrogen supply system
BPC improving crop management 76 © British Potato Council 2004
TABLE 60. EFFECT OF VARIETY AND N APPLICATION RATE ON THE DATE OF CESSATION OF NET CANOPY N UPTAKE (DAE)
Nitrogen application rate (kg N/ha) 0 60 120 180 240 300 Mean S.E. 1992 Estima 45 41 47 59 61 51 2.0, 4.5 Cara 96 73 69 88 76 80 1993 Estima 51 53 59 60 66 58 1.3, 3.0 Cara 66 70 69 75 79 72 1994 Estima 30 38 32 42 25 34 3.9, 8.7 Cara 55 37 56 48 65 52 1995 Estima 52 53 53 53 1.1, 1.9 Cara 60 58 63 60 2001 Estima 42 51 46 2.5, 3.5 Cara 54 85 69 2002 Estima 49 55 52 1.9, 2.7 Cara 70 65 68 2003 Estima 48 55 51 1.5, 3.0 Cara 70 72 71
TABLE 61. EFFECT OF VARIETY AND N APPLICATION AMOUNT OF RADIATION ABSORBED (MJ/M2) AT CESSATION OF CANOPY N UPTAKE
Nitrogen application rate (kg N/ha) 0 60 120 180 240 300 Mean S.E. 1992 Estima 249 343 411 497 459 392 33.5, 74.9 Cara 983 833 746 1030 851 889 1993 Estima 332 404 515 526 600 475 24.6, 55.1 Cara 459 702 710 832 872 739 1994 Estima 174 210 207 250 183 205 41.7, 93.2 Cara 316 164 489 363 719 410 1995 Estima 281 390 396 355 23.0, 39.8 Cara 440 449 622 521 2001 Estima 275 430 355 24.0, 48.1 Cara 435 870 653 2002 Estima 305 482 394 28.5, 40.3 Cara 626 636 631 2003 Estima 418 546 482 25.1, 35.5 Cara 776 840 808

BPC Project Report: Evaluation of the soil nitrogen supply system
BPC improving crop management 77 © British Potato Council 2004
TABLE 62. EFFECT OF VARIETY AND N APPLICATION RATE ON THE DATE OF ONSET OF SENESCENCE (DAE)
Nitrogen application rate (kg N/ha) 0 60 120 180 240 300 Mean S.E. 1992 Estima 68 79 84 91 96 84 1.7, 3.7 Cara 106 112 121 116 121 115 1993 Estima 66 75 86 84 101 82 2.3, 5.1 Cara 125 125 135 123 137 129 1994 Estima 79 70 77 87 91 81 2.9, 6.5 Cara 149 160 165 157 168 160 1995 Estima 76 70 74 73 1.7, 2.9 Cara 106 111 112 110 2001 Estima 82 92 87 0.8, 1.1 Cara 106 116 111 2002 Estima 67 84 75 3.0, 4.3 Cara 106 141 124 2003 Estima 73 86 79 1.8, 2.5 Cara 103 136 119
TABLE 63. ESTIMATE OF AMOUNT OF N (KG N/HA) IN CANOPY AT CESSATION OF CANOPY N UPTAKE
Nitrogen application rate (kg N/ha) 0 60 120 180 240 300 Mean S.E. 1992 Estima 43 77 82 83 74 72 3.4, 7.6 Cara 87 129 133 183 174 142 1993 Estima 58 82 99 107 106 91 3.0, 6.7 Cara 91 123 148 177 198 148 1994 Estima 35 63 70 74 77 64 4.1, 9.2 Cara 41 72 126 137 170 109 1995 Estima 41 84 96 74 4.4, 7.6 Cara 67 146 187 134 2001 Estima 69 133 101 1.1, 1.6 Cara 100 310 205 2002 Estima 64 133 98 8.5, 11.9 Cara 101 255 178 2003 Estima 86 149 117 4.5, 6.3 Cara 129 290 209

BPC Project Report: Evaluation of the soil nitrogen supply system
BPC improving crop management 78 © British Potato Council 2004
TABLE 64. EFFECT OF VARIETY AND N APPLICATION RATE ON HARVEST INDEX (% OF TOTAL DM AS TUBER DM) AT CUF 2003
Cara Estima Mean 0 kg N/ha 300 kg N/ha 0 kg N/ha 300 kg N/ha S.E. 29 May 0 0 0 0 0 - 13 June 13 6 1 25 20 1.1 27 June 37 30 10 57 50 0.9 17 July 54 52 20 77 68 1.0 8 August 67 62 33 87 82 1.0 30 Sep/7 Oct 84 79 72 93 92 1.0
Within East Anglia, crop canopies are unlikely to persist beyond October due to frost. Thus, for Cara which has received N, the season will be too short for it to recoup the investment of N and DM it has made in its canopy and therefore far smaller N applications would be appropriate so that tuber yields are maximized within a typical season.
A secondary objective of this work was to try and define a pool of N within the crop whose size is related to canopy persistence. This would enable a simple measurement of N status to be related to season length, yield and supplementary N requirement. The analyses of the experiments to date may explain some difficulties underlying this objective and why other attempts have not been successful. The analyses suggest that canopy N reserves may be depleted at different rates depending on the variety and the amount of fertilizer applied. Unless these factors are taken into account, it will be impossible to relate the size of any pool of N within the crop (i.e. petiole nitrate or leaf protein) to probable canopy persistence and the requirement for supplementary N.
The analyses presented in this report appear to provide a reasonably robust framework with which to analyse the effects of N on crop canopies and tuber yield. Work will continue in 2004, to better understand the relationship between the size of canopy N reserves, tuber N uptake and canopy persistence. In particular the size of easily defined canopy N reserves (for example main-axes N uptake at tuber initiation or total canopy N at 50 DAE) in conjunction with tuber N uptake rates will be related to potential canopy persistence and tuber yield. These ideas will then be tested against independent results sets collected in earlier seasons.
Competition for N between tubers and branches
The analyses above have shown that applying N to Cara tends to suppress tuber N uptake and tuber DM accumulation and this results in large amounts of N and DM remaining in the crop canopy. Table 65 shows the effects of variety, plant spacing and N application rate on the distribution of N within canopy components (main-axes and branches) and tubers during the growing season. Uptake of N by the main-axis was always larger in Cara than in Estima and in crops grown at close spacings and, with the exception of the first sampling, main-axis N uptake was increased by application of N. For all treatments, main-axis N uptake reaches a maximum at the third harvest (27 June, c. 46 DAE) after which it decreased. At the first harvest (29 May, c. 17 DAE), N uptake by branches was small and only affected by planting density. For subsequent harvests, branch N uptake was always larger for Cara than for Estima, larger when N had been applied and larger in crops grown at 60 cm spacing compared with 15 cm spacing. Branch N uptake of Estima, grown at 15 cm spacing and given no N never exceeded 10 kg N/ha. Analysis of variance showed a difference in the varietal response to N application: when given N the branches of Cara had a disproportionately large N uptake when compared with Estima. When averaged over all treatments, maximum branch N uptake was attained

BPC Project Report: Evaluation of the soil nitrogen supply system
BPC improving crop management 79 © British Potato Council 2004
at the fourth harvest (17 July, c. 66 DAE). At harvest on 7 October (148 DAE) the branches of Cara given 300 kg N/ha and planted at 60 cm still contained 93 kg N/ha. The first harvest was taken before tuber initiation and thus tuber N uptake was zero. For the second to fifth harvests, tuber N uptake was larger in Estima than in Cara and in crops planted at 15 cm compared with 60 cm. The effect of N on tuber N uptake differed between varieties with 300 kg N/ha increasing N uptake in Estima but reducing it in Cara. In contrast to the effects on branch N uptake, the smallest tuber N uptake was found in Cara given 300 kg N/ha and planted at 60 cm spacings. At final harvest, the main effects of variety and planting density on tuber N uptake were small and non significant, however, tuber N uptake was increased by applying N.
The effects of variety, plant spacing and N application rate on the rate of N uptake by branches and tubers are shown in Table 66. The rate of N uptake by branches was faster in Cara than in Estima (3.36 compared with 1.13 kg N/ha/day), faster at 60 cm than 15 cm spacing (2.78 compared with 1.71 kg N/ha/day) and faster when with 300 kg N/ha (3.68 kg N/h/day) compared with 0 kg N/ha (0.81 kg N/ha/day). The rate of N uptake by tubers was also increased when 300 kg N/ha was applied compared with 0 kg N/ha (2.00 compared with 1.80 kg N/ha/day), but rate of tuber N uptake was smaller in Cara than in Estima (1.19 compared with 2.61 kg N/h/day) and smaller at the wide spacings when compared with the closer spacings (1.71 compared with 2.10 kg N/ha/day). Collectively these results support the conclusions made in the CUPGRA Annual Report for 2002, that branches and tubers compete for N and that there is an inverse relationship between the rate of N uptake into branches and the rate of N uptake into tubers. Increasing the plant spacing from 15 cm to 60 cm, promotes branch N uptake particularly in Cara given 300 kg N/ha and this suppresses tuber N uptake and tuber DM accumulation. At present we do not know whether N directly suppresses tuber N uptake allowing branch development or whether N, by promoting branch N uptake leads, to reduced tuber N uptake and resolving this question would be experimentally difficult. There are few reported data that can help address the question. Garner and Allard (1923, quoted by Firman et al. 1995) showed that in cultivars where tuber formation could be prevented by artificially long days, canopy growth could be prolonged almost indefinitely. This observation would support the hypothesis that the crop canopy and tubers are in competition for resources although we do not know the underlying mechanisms.

BPC Project Report: Evaluation of the soil nitrogen supply system
BPC improving crop management 80 © British Potato Council 2004
TABLE 65. EFFECT OF VARIETY, PLANT SPACING AND N APPLICATION RATE ON N UPTAKE BY MAIN-AXIS, BRANCHES AND TUBERS AT CUF 2003
Cara Estima 15 cm 60 cm 15 cm 60 cm Mean 0 kg/ha 300 kg/ha 0 kg/ha 300 kg/ha 0 kg/ha 300 kg/ha 0 kg/ha 300 kg/ha S.E. Main-axis 29 May 18 33 39 9 6 23 25 5 5 1.8 13 June 80 86 156 45 75 77 115 38 47 7.8 27 June 102 104 225 66 107 77 127 50 63 8.5 17 July 70 83 139 47 62 56 101 32 42 8.6 8 August 56 102 123 39 50 41 50 17 24 7.2 30 September 26 29 50 13 26 12 29 15 30 5.3 Branches 29 May 1 1 1 0 0 1 1 0 0 0.1 13 June 13 6 20 14 20 4 9 13 15 2.2 27 June 39 6 42 41 109 4 15 29 65 6.6 17 July 85 24 203 67 218 5 28 30 108 12.4 8 August 77 51 127 95 240 7 28 25 41 11.4 30 September 24 11 54 37 93 - - - - 7.6 Tubers 29 May 0 0 0 0 0 0 0 0 0 n.a. 13 June 6 6 2 0 0 15 19 3 3 0.8 27 June 28 27 15 15 6 41 52 31 32 2.0 17 July 70 58 49 45 17 89 127 76 100 3.9 8 August 99 92 81 65 42 107 164 111 130 6.9 30 September 186 164 258 144 190 144 262 119 207 20.9

BPC Project Report: Evaluation of the soil nitrogen supply system
BPC improving crop management 81 © British Potato Council 2004
TABLE 66. EFFECTS OF VARIETY, PLANT SPACING AND N APPLICATION RATE ON THE AVERAGE RATE OF N UPTAKE BY BRANCHES AND TUBERS IN JUNE AND JULY. CUF 2003
Variety
Spacing (cm)
N rate (kg N/ha)
Branch uptake (kg N/ha/day)
Tuber N uptake (kg N/ha/day)
Cara 15 0 0.51 1.55 Cara 15 300 5.59 1.41 Cara 60 0 1.53 1.31 Cara 60 300 5.80 0.49 Estima 15 0 0.12 2.19 Estima 15 300 0.63 3.23 Estima 60 0 1.07 2.14 Estima 60 300 2.70 2.89 Mean 2.24 1.90 S.E. 0.439 0.122
Analysis of the Variety, Nitrogen and Density experiments (2001-2003) and the Variety and Nitrogen experiments (1992-1995) have demonstrated a plausible mechanism as to the to the physiological difference underlying the response to applications of N fertilizer. Furthermore, the analyses have shown that canopy persistence, and thereby radiation absorbtion and yield, appear to be related to the relative rates of canopy and tuber N uptake in conjunction with amount of N in the canopy when it ceases to take up N. This work has, therefore, identified a pool of N with proven physiological significance, the size of which appears to be related to canopy persistence. Measurement of the size of this pool could therefore be used to predict likely canopy persistence and, if found to be deficient, supplemental N could be applied to rectify the deficiency. However, this hypothesis needs to be confirmed, with independent data sets from a wider range of varieties grown under commercial conditions.
References GARNER, W. W. & ALLARD, H. A. (1923). Further studies in photoperiodism, the response of the plant to relative length of day and night. Journal of Agricultural Research 23, 871-920.
FIRMAN, D. M., O’BRIEN, P. J. & ALLEN, E. J. (1995). Appearance and growth of individual leaves in the canopies of several potato cultivars. Journal of Agricultural Science, Cambridge 125, 379-394.

BPC Project Report: Evaluation of the soil nitrogen supply system
BPC improving crop management 82 © British Potato Council 2004
General conclusions for the experimental programme 2001 – 2003 Between 2001 and 2003, N response experiments have attempted to understand relationships between measurements of SNS and fertilizer requirement using contrasting varieties grown in different locations on varying soil types. In addition, more detailed experiments, mainly at CUF, have attempted to elucidate, the underlying processes that govern N release from soil organic matter, N uptake by the crop and the effects of that N uptake on subsequent canopy persistence and tuber yield. Conclusions from these studies are outlined below.
Irrespective of the method used to estimate N fertilizer application rate, the 7th Edition of RB 209 systematically overestimates N requirement. The results summarised in Table 37 shows that this overestimation applies to all varieties and markets. In some experiments, over application of N resulted in loss of marketable yield, reduction in tuber DM concentration, delay in skin set and, in 2003, a reduction in number of tubers. In future editions of RB 209, the N recommendations for potatoes should be reduced particularly for short season crops as outlined in Table 67.
TABLE 67. EXAMPLE OF CURRENT N RECOMMENDATION AND SUGGESTED NEW N RECOMMENDATIONS FOR POTATO CROPS GROWN ON SNS INDEX 0/1 WITHOUT ORGANIC MANURES. SEASON LENGTH IS FROM EMERGENCE TO DEFOLIATION/HARVEST. NEW RECOMMENDATIONS ASSUME GOOD SOIL CONDITIONS
Variety and determinacy group[
Season length
(Days)
Recommendation in RB 209 7th Edition
(kg N/ha)
New recommendation
(kg N/ha) Estima 1 100 240-270 200 Maris Peer 2 60 140-190 50 Lady Rosetta 2 90 140-190 120 Hermes 2 110 160-120 180 Cara 4 > 120 160-180 80
Using the SNS Analysis method was no better than the Field Assessment method in estimating fertilizer requirement. The extra costs incurred by using this system will not be recouped in more precise fertilizer recommendations and therefore its use cannot be supported.
Cultivation experiments at CUF have shown that the quantity of SMN in the soil profile (and therefore the SNS Index and N recommendation) are affected by the timing of the soil sampling in relation to the sequence of cultivations used to establish potato crops and soil properties (for example texture, organic matter content, temperature and moisture content). Whilst the studies have clearly demonstrated the importance of these factors, at present, they cannot, as yet, usefully be combined in a way that significantly improves the utility of the SNS Analysis method.
As summarised in Tables 34 and 39, the Nitrogen response experiments have shown that the effect of site and season on N requirement may be similar to the combined effects of variety, season length, previous cropping or SNS at planting. The 2003 season shows that it is possible to grow crops with average yields similar to or larger than the national average with only one fifth of the fertilizer recommended in RB 209 7th Edition. At present we do not know what components of site/season are responsible for the variation in response to N fertilizer. However, it is highly likely that poor soil conditions will increase the crops’ requirement for N whilst also limiting yield potential. There is also some evidence that late-planted crops have a faster rate of N uptake than early-planted crops and

BPC Project Report: Evaluation of the soil nitrogen supply system
BPC improving crop management 83 © British Potato Council 2004
this may reduce fertilizer requirement. A long-term objective for crop nutrition is to better understand what happened in 2003 and, where possible, to reproduce those factors in future seasons.
Analysis of the Variety, Planting density and N experiment (2001 to 2003) and the Planting date and N experiment (2003) have demonstrated a plausible mechanism as to why N requirement varies with variety and with season length. Analysis of these experiments has also shown why methods of N recommendation based on quantifying pools of N within the canopy are, at present, unreliable and why suggested new sampling protocols could be used after further development.

BPC Project Report: Evaluation of the soil nitrogen supply system
BPC improving crop management 84 © British Potato Council 2004
APPENDIX TABLE 1. EFFECT OF VARIETY AND N APPLICATION RATE (KG N/HA) ON TOTAL N UPTAKE (KG N/HA). CUF 1992
Cara Estima 0 60 120 180 240 0 60 120 180 240 S.E. 2 June 16.0 19.6 25.7 22.1 17.4 13.3 27.4 25.9 12.7 10.0 4.01 9 June 25.2 53.5 44.9 42.5 44.3 24.8 54.1 34.7 36.8 25.4 7.99 23 June 48.9 114.1 133.3 78.2 130.1 56.3 101.9 102.5 95.4 59.0 9.89 14 July 92.2 153.5 138.9 175.1 176.2 80.8 167.8 176.6 111.0 125.7 17.85 6 August 134.8 201.8 243.5 236.0 187.0 97.4 162.1 197.2 174.5 206.0 13.91 1 September 167.3 196.2 175.5 250.6 234.0 87.3 143.5 151.7 171.5 153.9 17.69
APPENDIX TABLE 2. EFFECT OF VARIETY AND N APPLICATION RATE (KG N/HA) ON TOTAL N UPTAKE (KG N/HA). CUF 1993
Cara Estima 0 60 120 180 240 0 60 120 180 240 S.E. 7 May 6.8 5.6 9.0 7.5 5.7 10.1 7.7 7.8 6.6 6.8 0.92 19 May 26.1 33.2 40.3 30.6 33.5 34.3 34.8 34.2 30.8 29.7 4.65 26 May 46.2 52.6 72.5 66.8 56.1 53.1 64.7 62.5 52.6 58.6 6.15 8 June 106.8 136.1 156.0 174.2 197.8 104.8 125.6 134.3 133.9 128.5 8.57 29 June 135.2 165.3 186.3 211.1 213.1 135.7 169.9 164.3 185.5 165.7 8.47 13 July 170.2 202.2 227.0 214.8 240.3 143.9 184.4 183.6 176.8 211.7 11.55 2 August 166.4 175.9 223.2 229.4 247.8 122.4 155.6 192.7 211.2 241.6 11.37

BPC Project Report: Evaluation of the soil nitrogen supply system
BPC improving crop management 85 © British Potato Council 2004
APPENDIX TABLE 3. EFFECT OF VARIETY AND N APPLICATION RATE (KG N/HA) ON TOTAL N UPTAKE (KG N/HA). CUF 1994
Cara Estima 0 60 120 180 240 0 60 120 180 240 S.E. 24 May 10.4 9.9 11.7 10.7 11.2 0.0 0.0 0.0 0.0 0.0 0.86 2 June 17.6 21.9 25.7 25.3 24.4 6.7 7.2 8.0 8.8 8.8 2.11 8 June 38.8 51.4 63.6 71.6 69.6 15.9 19.5 25.9 20.5 19.3 5.03 13 June 44.1 68.9 97.1 117.6 108.4 15.8 34.9 42.9 37.9 44.0 9.63 20 June 65.0 84.4 131.6 172.8 193.0 45.4 72.8 90.0 75.7 80.3 9.66 4 July 73.9 116.1 178.0 183.5 206.3 53.5 112.4 113.1 118.7 107.6 14.62 18 July 89.0 100.4 164.5 177.5 213.8 65.3 104.0 117.8 126.5 111.3 14.03
APPENDIX TABLE 4. EFFECT OF VARIETY AND N APPLICATION RATE ON TOTAL N UPTAKE (KG N/HA). CUF 1995
Cara Estima Mean 0 120 240 0 120 240 S.E. 22 May 16.2 13.0 15.8 15.9 15.5 16.9 20.4 1.77 5 June 61.4 47.8 70.8 72.4 47.3 59.6 70.7 5.29 12 June 99.9 56.2 124.7 137.8 55.3 112.0 113.3 10.62 19 June 107.5 63.1 132.3 136.7 60.9 100.0 152.2 8.41 26 June 138.4 84.8 159.4 193.6 97.3 130.4 164.7 11.65 18 July 169.4 114.7 196.6 217.2 111.9 177.1 199.3 19.95

BPC Project Report: Evaluation of the soil nitrogen supply system
BPC improving crop management 86 © British Potato Council 2004
APPENDIX TABLE 5. EFFECT OF VARIETY AND N APPLICATION RATE ON TOTAL N UPTAKE (KG N/HA). CUF 2001
Cara Estima Mean 0 kg/ha 300 kg/ha 0 kg/ha 300 kg/ha S.E. 10 July 26.7 26.9 38.4 19.3 22.2 1.72 19 July 59.6 50.3 88.4 45.3 54.4 3.73 31 July 125.2 88.1 187.1 83.6 142.0 5.55 15 August 170.4 126.1 258.8 114.7 182.1 8.93 30 August 191.7 136.9 302. 116.8 210.8 11.43 16 October 164.4 136.1 240.9 105.5 175.3 11.51
APPENDIX TABLE 6. EFFECT OF VARIETY AND N APPLICATION RATE ON TOTAL N UPTAKE (KG N/HA). CUF 2002
Cara Estima Mean 0 kg/ha 300 kg/ha 0 kg/ha 300 kg/ha S.E. 12 June 41.4 36.6 53.7 31.5 43.8 3.55 2 July 143.4 88.3 240.2 87.9 157.1 7.96 20 August 197.7 154.4 286.8 112.8 236.9 18.25 10 October 206.5 168.1 300.6 121.9 235.3 17.40
APPENDIX TABLE 7. EFFECT OF VARIETY AND N APPLICATION RATE ON TOTAL N UPTAKE (KG N/HA). CUF 2003
Cara Estima Mean 0 kg/ha 300 kg/ha 0 kg N/ha 300 kg N/ha S.E. 29 May 18.6 21.2 23.1 14.7 15.4 1.31 13 June 98.4 78.4 136.3 75.2 103.8 5.00 27 June 168.6 128.9 252.5 116.1 176.8 7.21 17 July 225.4 161.8 343.7 144.0 252.3 8.03 8 August 231.3 221.6 331.4 153.5 218.8 13.32 30 Sep/7 Oct 236.0 199.5 335.1 145.2 264.2 17.99
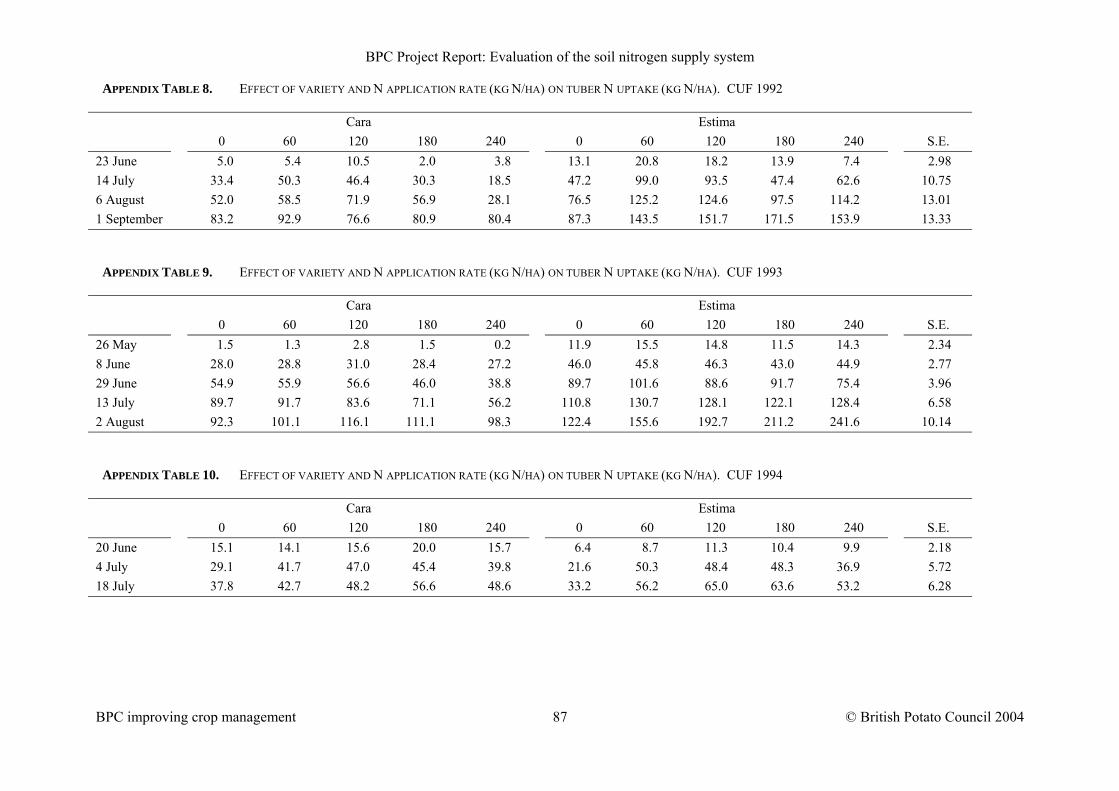
BPC Project Report: Evaluation of the soil nitrogen supply system
BPC improving crop management 87 © British Potato Council 2004
APPENDIX TABLE 8. EFFECT OF VARIETY AND N APPLICATION RATE (KG N/HA) ON TUBER N UPTAKE (KG N/HA). CUF 1992
Cara Estima 0 60 120 180 240 0 60 120 180 240 S.E. 23 June 5.0 5.4 10.5 2.0 3.8 13.1 20.8 18.2 13.9 7.4 2.98 14 July 33.4 50.3 46.4 30.3 18.5 47.2 99.0 93.5 47.4 62.6 10.75 6 August 52.0 58.5 71.9 56.9 28.1 76.5 125.2 124.6 97.5 114.2 13.01 1 September 83.2 92.9 76.6 80.9 80.4 87.3 143.5 151.7 171.5 153.9 13.33
APPENDIX TABLE 9. EFFECT OF VARIETY AND N APPLICATION RATE (KG N/HA) ON TUBER N UPTAKE (KG N/HA). CUF 1993
Cara Estima 0 60 120 180 240 0 60 120 180 240 S.E. 26 May 1.5 1.3 2.8 1.5 0.2 11.9 15.5 14.8 11.5 14.3 2.34 8 June 28.0 28.8 31.0 28.4 27.2 46.0 45.8 46.3 43.0 44.9 2.77 29 June 54.9 55.9 56.6 46.0 38.8 89.7 101.6 88.6 91.7 75.4 3.96 13 July 89.7 91.7 83.6 71.1 56.2 110.8 130.7 128.1 122.1 128.4 6.58 2 August 92.3 101.1 116.1 111.1 98.3 122.4 155.6 192.7 211.2 241.6 10.14
APPENDIX TABLE 10. EFFECT OF VARIETY AND N APPLICATION RATE (KG N/HA) ON TUBER N UPTAKE (KG N/HA). CUF 1994
Cara Estima 0 60 120 180 240 0 60 120 180 240 S.E. 20 June 15.1 14.1 15.6 20.0 15.7 6.4 8.7 11.3 10.4 9.9 2.18 4 July 29.1 41.7 47.0 45.4 39.8 21.6 50.3 48.4 48.3 36.9 5.72 18 July 37.8 42.7 48.2 56.6 48.6 33.2 56.2 65.0 63.6 53.2 6.28

BPC Project Report: Evaluation of the soil nitrogen supply system
BPC improving crop management 88 © British Potato Council 2004
APPENDIX TABLE 11. EFFECT OF VARIETY AND N APPLICATION RATE ON TUBER N UPTAKE (KG N/HA). CUF 1995
Cara Estima Mean 0 120 240 0 120 240 S.E. 5 June 7.1 1.8 2.9 1.8 11.9 11.0 13.0 1.15 12 June 16.5 6.7 8.5 6.5 16.5 30.6 30.4 3.30 19 June 23.7 8.6 11.9 10.8 24.3 32.9 53.4 4.40 26 June 45.2 32.2 29.0 15.6 63.5 55.1 75.5 7.87 18 July 86.9 46.9 64.1 49.0 92.3 132.0 137.0 13.76
APPENDIX TABLE 12. EFFECT OF VARIETY AND N APPLICATION RATE ON TUBER N UPTAKE (KG N/HA). CUF 2001
Cara Estima Mean 0 kg/ha 300 kg/ha 0 kg/ha 300 kg/ha S.E. 19 July 2.2 1.3 1.0 3.6 2.8 0.28 31 July 19.7 17.0 10.0 22.9 28.9 1.38 15 August 37.1 28.9 13.5 48.6 57.6 2.16 30 August 55.9 39.7 21.8 67.7 94.3 2.70 16 October 95.5 85.1 60.9 93.1 142.8 6.54
APPENDIX TABLE 13.EFFECT OF VARIETY AND N APPLICATION RATE ON TUBER N UPTAKE (KG N/HA). CUF 2002
Cara Estima Mean 0 kg/ha 300 kg/ha 0 kg/ha 300 kg/ha S.E. 12 June 1.1 0.3 0.0 2.1 1.8 0.31 2 July 26.3 16.7 16.5 28.7 43.1 1.68 20 August 107.6 71.9 79.7 93.4 185.1 7.27 10 October 167.6 138.0 196.3 115.4 220.8 15.73
APPENDIX TABLE 14. EFFECT OF VARIETY AND N APPLICATION RATE ON TUBER N UPTAKE (KG N/HA). CUF 2003
Cara Estima Mean 0 kg N/ha 300 kg N/ha 0 kg N/ha 300 kg N/ha S.E. 29 May - - - - - - 13 June 5.9 2.9 0.9 9.4 10.7 0.55 27 June 27.5 20.8 10.5 36.3 42.3 1.38 17 July 70.0 51.3 32.6 82.6 113.5 2.74 8 August 98.9 78.3 61.5 109.0 146.9 4.86 30 Sep/7 Oct 186.1 154.3 223.9 131.5 234.8 14.76

BPC Project Report: Evaluation of the soil nitrogen supply system
BPC improving crop management 89 © British Potato Council 2004
APPENDIX TABLE 15. EFFECT OF VARIETY AND N APPLICATION RATE (KG N/HA) ON RATE OF TOTAL N UPTAKE (MG N/MJ) FOR DIFFERENT VALUES OF ABSORBED RADIATION AT CUF 1992
Cara Estima MJ/m2 0 60 120 180 240 0 60 120 180 240 S.E. 100 20.9 35.5 42.1 33.9 44.1 27.6 40.6 45.0 31.3 38.9 7.09 300 14.9 22.0 23.1 25.1 22.7 10.9 18.8 21.0 18.6 22.4 1.64 500 11.7 14.0 13.0 19.7 13.8 4.9 8.7 10.7 12.1 13.0 1.93 700 10.0 9.3 7.6 16.2 9.4 2.4 4.0 6.0 8.7 7.6 2.31 900 9.3 6.2 4.6 13.9 6.9 - 1.9 3.7 6.9 4.5 2.47 1100 9.3 4.3 2.8 12.2 5.1 - - - - - 2.61 1300 9.8 3.0 1.8 11.0 3.9 - - - - - 2.82 APPENDIX TABLE 16. EFFECT OF VARIETY AND N APPLICATION RATE (KG N/HA) ON RATE OF TOTAL N UPTAKE (MG N/MJ) FOR DIFFERENT VALUES OF ABSORBED RADIATION AT CUF 1993
Cara Estima MJ/m2 0 60 120 180 240 0 60 120 180 240 S.E. 100 38.8 41.6 49.5 46.2 55.4 38.5 45.8 40.8 42.4 39.1 4.46 300 20.6 24.2 28.7 30.7 32.3 16.2 21.4 23.0 25.3 26.6 1.18. 500 10.9 14.7 16.7 20.4 19.5 6.8 10.0 13.5 15.2 18.4 1.38 700 5.8 9.1 9.8 13.6 12.3 2.9 4.7 8.2 9.2 13.1 1.69 900 3.1 5.8 5.8 9.1 8.0 1.2 2.2 5.1 5.6 9.6 1.68 1100 1.6 3.8 3.4 6.1 5.4 - 1.0 3.3 3.5 7.1 1.53 1300 0.9 2.5 2.0 4.1 3.8 - - - - - 1.34

BPC Project Report: Evaluation of the soil nitrogen supply system
BPC improving crop management 90 © British Potato Council 2004
APPENDIX TABLE 17. EFFECT OF VARIETY AND N APPLICATION RATE (KG N/HA) ON RATE OF TOTAL N UPTAKE (MG N/MJ) FOR DIFFERENT VALUES OF ABSORBED RADIATION AT CUF 1994
Cara Estima MJ/m2 0 60 120 180 240 0 60 120 180 240 S.E. 100 30.3 41.7 64.7 70.5 78.8 22.5 40.0 44.0 43.7 38.7 5.78 300 10.7 7.3 18.4 14.7 23.8 3.6 7.0 6.8 8.6 3.1 3.06 500 7.3 1.4 5.5 3.3 7.9 0.7 1.4 1.1 2.0 0.3 2.29 700 6.9 0.3 1.7 0.8 2.8 0.1 0.3 0.2 0.5 0.0 2.16
APPENDIX TABLE 18. EFFECT OF VARIETY AND N APPLICATION RATE (KG N/HA) ON RATE OF TOTAL N UPTAKE (MG N/MJ) FOR DIFFERENT VALUES OF ABSORBED RADIATION AT CUF 1995
Cara Estima Mean 0 120 240 0 120 240 S.E. 100 47.5 32.3 58.8 63.9 30.0 44.2 55.6 2.86 300 20.2 11.7 22.0 28.3 12.9 21.6 24.9 3.22 500 9.5 4.3 8.6 13.3 7.9 11.0 11.8 3.30 700 4.9 1.6 3.5 6.5 6.1 5.8 6.0 2.82 900 2.8 0.6 1.4 3.3 5.2 3.2 3.2 2.37 1100 1.8 0.2 0.6 1.8 - - 1.8 2.03 1300 1.3 0.0 0.3 0.9 - - - 1.79

BPC Project Report: Evaluation of the soil nitrogen supply system
BPC improving crop management 91 © British Potato Council 2004
APPENDIX TABLE 19. EFFECT OF VARIETY AND N APPLICATION RATE (KG N/HA) ON RATE OF TOTAL N UPTAKE (MG N/MJ) FOR DIFFERENT VALUES OF ABSORBED RADIATION AT CUF 2001
Cara Estima (MJ/m2) Mean 0 300 0 300 S.E. 100 54.1 41.5 75.7 38.9 60.3 1.77 300 23.2 14.5 41.5 11.0 25.6 2.47 500 11.6 5.5 25.0 3.4 12.6 2.67 700 6.6 2.2 16.5 1.1 6.6 2.43 900 4.2 1.0 11.6 0.4 3.6 2.10 1100 4.5 0.4 8.7 - -
APPENDIX TABLE 20. EFFECT OF VARIETY AND N APPLICATION RATE (KG N/HA) ON RATE OF TOTAL N UPTAKE (MG N/MJ) FOR DIFFERENT VALUES OF ABSORBED RADIATION AT CUF 2002
Cara Estima (MJ/m2) Mean 0 300 0 300 S.E. 100 52.2 35.4 81.1 36.1 56.1 3.35 300 23.1 18.1 35.1 11.3 27.8 2.93 500 11.4 9.9 16.5 3.8 15.5 2.43 700 6.2 5.8 8.0 1.4 9.4 1.86 900 3.6 3.6 4.0 0.6 6.2 1.40 1100 2.1 2.3 2.0 - - 1.05 1300 1.3 1.5 1.0 - - 0.79
APPENDIX TABLE 21. EFFECT OF VARIETY AND N APPLICATION RATE (KG N/HA) ON RATE OF TOTAL N UPTAKE (MG N/MJ) FOR DIFFERENT VALUES OF ABSORBED RADIATION AT CUF 2003
Cara Estima (MJ/m2) Mean 0 300 0 300 S.E. 100 54.4 37.2 82.2 40.1 58.1 3.28 300 27.7 23.1 42.1 16.9 28.7 1.35 500 15.1 14.7 22.0 7.8 15.7 1.81 700 8.7 9.6 11.7 3.8 9.5 1.76 900 5.2 6.4 6.4 2.0 6.2 1.54 1100 3.3 4.3 3.5 1.0 4.3 1.31 1300 2.1 3.0 2.0 0.6 3.2 1.11

BPC Project Report: Evaluation of the soil nitrogen supply system
BPC improving crop management 92 © British Potato Council 2004
APPENDIX TABLE 22. EFFECT OF VARIETY AND N APPLICATION RATE (KG N/HA) ON RATE OF TUBER N UPTAKE (MG N/MJ) FOR DIFFERENT VALUES OF ABSORBED RADIATION AT CUF 1992
Cara Estima MJ/m2 0 60 120 180 240 0 60 120 180 240 S.E. 100 7.5 6.9 8.3 5.7 1.4 12.1 17.2 17.8 8.0 15.0 1.79 300 5.9 7.0 8.2 5.4 2.1 14.6 15.8 15.7 9.9 14.8 1.31 500 5.3 7.0 8.1 5.4 3.0 20.6 14.6 14.1 12.5 14.7 2.53 700 5.5 7.1 8.1 5.8 4.5 32.8 13.5 12.8 16.4 14.7 5.90 900 6.6 7.2 8.2 7.0 6.7 - 12.6 11.8 22.2 14.9 12.89 1100 9.1 7.3 8.4 9.78 10.1 - - - - - 27.10 1300 14.0 7.0 9.0 16.0 16.0 - - - - - 55.80
APPENDIX TABLE 23. EFFECT OF VARIETY AND N APPLICATION RATE (KG N/HA) ON RATE OF TUBER N UPTAKE (MG N/MJ) FOR DIFFERENT VALUES OF ABSORBED RADIATION AT CUF 1993
Cara Estima MJ/m2 0 60 120 180 240 0 60 120 180 240 S.E. 100 9.8 7.5 7.6 4.1 4.7 15.4 13.8 9.2 7.4 8.6 1.52 300 9.2 8.0 8.1 5.3 5.5 14.3 14.2 10.7 10.1 11.0 1.02 500 8.7 8.6 8.7 6.9 6.4 13.3 14.8 12.8 13.7 14.1 0.55 700 8.1 9.2 9.4 8.9 7.6 12.6 15.4 16.0 18.7 18.2 0.77 900 7.7 10.0 10.1 11.4 8.9 12.1 16.2 20.7 25.6 23.6 1.98 1100 7.2 10.8 10.8 14.8 10.6 - 17.1 27.9 35.4 30.8 4.03 1300 6.8 11.8 11.6 19.0 12.5 - - - - - 7.38

BPC Project Report: Evaluation of the soil nitrogen supply system
BPC improving crop management 93 © British Potato Council 2004
APPENDIX TABLE 24. EFFECT OF VARIETY AND N APPLICATION RATE (KG N/HA) ON RATE OF TUBER N UPTAKE (MG N/MJ) FOR DIFFERENT VALUES OF ABSORBED RADIATION AT CUF 1994
Cara Estima MJ/m2 0 60 120 180 240 0 60 120 180 240 S.E. 100 32.5 33.3 28.0 25.4 20.5 14.3 24.6 23.7 21.5 17.6 4.81 300 6.0 8.4 11.6 11.5 10.2 6.8 9.7 11.7 10.6 9.0 1.66 500 1.8 2.9 5.0 5.6 5.2 3.3 5.3 6.2 5.5. 4.9 1.72 700 0.8 1.3 2.2 2.9 2.7 1.6 3.7 3.6 3.0 3.0 1.47
APPENDIX TABLE 25. EFFECT OF VARIETY AND N APPLICATION RATE (KG N/HA) ON RATE OF TUBER N UPTAKE (MG N/MJ) FOR DIFFERENT VALUES OF ABSORBED RADIATION AT CUF 1995
Cara Estima Mean 0 120 240 0 120 240 S.E. 100 11.3 9.2 6.4 3.5 16.8 12.8 19.0 1.46 300 10.7 7.0 7.1 4.8 12.9 14.7 17.6 1.10 500 11.1 5.4 8.2 6.7 12.6 17.1 16.5 2.55 700 12.5 4.2 9.9 9.6 15.4 20.2 15.8 4.73 900 15.2 3.4 12.5 14.1 21.8 24.2 15.3 7.98 1100 19.6 2.7 16.3 21.2 - 29.3 15.1 13.04 1300 26.7 2.2 21.6 32.7 - - - 21.12

BPC Project Report: Evaluation of the soil nitrogen supply system
BPC improving crop management 94 © British Potato Council 2004
APPENDIX TABLE 26. EFFECT OF VARIETY AND N APPLICATION RATE (KG N/HA) ON RATE OF TUBER N UPTAKE (MG N/MJ) FOR DIFFERENT VALUES OF ABSORBED RADIATION AT CUF 2001
Cara Estima (MJ/m2) Mean 0 300 0 300 S.E. 100 9.1 5.3 1.4 14.5 15.2 1.30 300 9.2 6.3 2.3 12.2 15.8 0.54 500 10.0 7.8 3.8 11.5 16.9 0.89 700 11.8 10.1 6.4 11.7 18.8 1.61 900 14.8 13.5 11.1 12.7 21.7 2.66 1100 19.1 18.6 19.6 - - 4.36
APPENDIX TABLE 27. EFFECT OF VARIETY AND N APPLICATION RATE (KG N/HA)ON RATE OF TUBER N UPTAKE (MG N/MJ) FOR DIFFERENT VALUES OF ABSORBED RADIATION AT CUF 2002
Cara Estima (MJ/m2) Mean 0 300 0 300 S.E. 100 7.2 5.0 3.9 9.6 10.2 1.22 300 8.6 5.6 4.9 11.0 12.9 1.00 500 10.7 6.8 6.4 12.9 16.8 0.72 700 13.9 8.9 8.6 15.3 22.8 1.36 900 19.0 12.8 11.8 18.5 33.0 4.18 1100 18.4 20.0 16.8 - - 11.05 1300 29.0 34.0 25.0 - - 27.20
APPENDIX TABLE 28. EFFECT OF VARIETY AND N APPLICATION RATE (KG N/HA) ON RATE OF TUBER N UPTAKE (MG N/MJ) FOR DIFFERENT VALUES OF ABSORBED RADIATION AT CUF 2003
Cara Estima (MJ/m2) Mean 0 300 0 300 S.E. 100 6.9 5.2 2.5 9.0 11.0 0.94 300 7.8 5.9 3.3 10.1 12.0 0.62 500 9.0 6.7 4.4 11.3 13.5 0.36 700 10.6 7.7 5.9 12.9 15.8 0.68 900 12.7 8.8 7.9 15.0 19.1 1.55 1100 15.6 10.1 10.7 17.6 23.9 2.97 1300 19.6 11.7 14.7 21.0 31.2 5.27