RESEARCH REPORT 487 - Health and Safety Executive · 7.2 Dynamic Testing ... BS EN 12385 Part 4...
50
HSE Health & Safety Executive Evaluation of performance deterioration in compacted strand wire ropes Prepared by the Health and Safety Laboratory for the Health and Safety Executive 2006 RESEARCH REPOR T 487
Transcript of RESEARCH REPORT 487 - Health and Safety Executive · 7.2 Dynamic Testing ... BS EN 12385 Part 4...

HSE Health & Safety
Executive
Evaluation of performance deterioration in compacted
strand wire ropes
Prepared by the Health and Safety Laboratory for the Health and Safety Executive 2006
RESEARCH REPORT 487

HSE Health & Safety
Executive
Evaluation of performance deterioration in compacted
strand wire ropes
Paul McCann BEng Health and Safety Laboratory
Harpur Hill Buxton
Derbyshire SK17 9JN
Compacted strand ropes are used by the offshore industry in a number of applications. The compacted strand construction offers improved performance compared with other stranded rope constructions, allowing its use for safety critical operations, including cranes and diving systems. However, previous work by Reading University, to evaluate the fatigue performance of galvanised compacted strand rope (HSE research project number 3422) and HSL, to evaluate the effects of variations in capping technique (HSE research project number 3596) had identified a potential deterioration in the mechanical properties of the rope over time. This deterioration occurred regardless of whether the rope was in service or storage during this time period. The rope manufacturer, was made aware of this problem and production of this type of rope was temporarily suspended while the problem was evaluated and manufacturing techniques revised. Production has now resumed using modified procedures. Field Engineering Section of the Health and Safety Laboratory (HSL) were requested by Mr J MacFarlane of Offshore Safety Division (OSD), HSE, to evaluate the extent of this problem. This investigation involved two sizes of rope, 25 mm and 32 mm diameter subjected to both dynamic and static loading.
This report and the work it describes were funded by the Health and Safety Executive (HSE). Its contents, including any opinions and/or conclusions expressed, are those of the author alone and do not necessarily reflect HSE policy.
HSE BOOKS

© Crown copyright 2006
First published 2006
All rights reserved. No part of this publication may bereproduced, stored in a retrieval system, or transmitted inany form or by any means (electronic, mechanical,photocopying, recording or otherwise) without the priorwritten permission of the copyright owner.
Applications for reproduction should be made in writing to: Licensing Division, Her Majesty's Stationery Office, St Clements House, 216 Colegate, Norwich NR3 1BQ or by email to hmsolicensing@cabinetoffice.x.gsi.gov.uk
ii

CONTENTS
1 INTRODUCTION......................................................................................... 1
2 COMPACTED STRAND ROPES................................................................ 2
3 TEST SET UP ............................................................................................. 43.1 Test Programme ...................................................................................... 43.2 The dynamic test facility .......................................................................... 43.3 The static test facility ............................................................................... 83.4 Sample preparation ................................................................................. 8
4 PREMATURE SOCKET FAILURES......................................................... 104.1 Examination of failed sockets ................................................................ 104.2 Hardness tests....................................................................................... 154.3 Charpy impact tests ............................................................................... 164.4 Tensile tests .......................................................................................... 164.5 Other premature failures........................................................................ 17
5 25 MM DIAMETER ROPE RESULTS....................................................... 185.1 25 mm static test results ........................................................................ 185.2 25mm dynamic test results .................................................................... 20
6 32 MM DIAMETER ROPE RESULTS....................................................... 246.1 32 mm static test results ........................................................................ 246.2 32 mm dynamic test results ................................................................... 266.3 32 mm samples with instrumented sockets ........................................... 29
7 COMPARISON BETWEEN 25 MM AND 32 MM ROPE ........................... 347.1 Static Testing......................................................................................... 347.2 Dynamic Testing .................................................................................... 34
8 COMMENTS ............................................................................................. 37
9 RECOMMENDATIONS............................................................................. 39
10 REFERENCES ...................................................................................... 40
iii

iv

EXECUTIVE SUMMARY
Objectives
Compacted strand ropes are used by the offshore industry in a number of applications. The compacted strand construction provides improved performance, allowing its use for safety critical operations, including cranes and diving systems.
However, previous work by Reading University, to evaluate the fatigue performance of galvanised compacted strand rope, identified a potential deterioration in the mechanical properties of the rope over time. This deterioration occurred regardless of whether the rope was in service or storage during this time period.
Field Engineering Section of the Health and Safety Laboratory (HSL) were requested by Mr. J. MacFarlane of Offshore Safety Division (OSD), HSE, to evaluate the extent of this problem. This investigation involved two sizes of rope, 25 mm and 32 mm diameter subjected to both dynamic and static loading.
Main Findings
Static testing of both sizes of wire rope, identified a general reduction in mechanical properties over time. The static breaking load is estimated to have dropped below the manufacturer’s specified minimum breaking load after four months for 25 mm rope and 16 months for 32 mm rope. In the worst case, the breaking load of the rope was 12% below the manufacturer’s specified minimum breaking load. However while this is significant, it is unlikely to have critical safety implications considering the safety factors of 5:1 quoted for these ropes.
During dynamic testing none of the 25 mm test-pieces and only three of the 32 mm test-pieces met the manufacturer’s specified minimum breaking load. Dynamic testing identified variations in rope properties during the programme but did not identify any reliable trends in rope deterioration.
The dynamic testing programme, suffered from premature failure of the sockets used to terminate the test-pieces, particularly on 32 mm rope. Failures remained ongoing throughout the test programme and premature failure occurred during 40% of the 32 mm dynamic tests. This was a dynamic effect that was not replicated during static testing. Strain measurement identified very high strain levels in the socket during dynamic testing. Evidence suggests that premature failure did not result from defective sample preparation.
Examination and testing of these sockets showed that they were compliant with RR-S-550D “Federal Specification – Sockets Wire Ropes”, the standard to which they were supplied. Metallographic examination identified that failure had occurred by a single stage overload event. The initiation point showed localised ductile failure, followed by brittle cleavage.
Examination of sockets revealed several potential initiation points including, internal socket grooves, manufacturer’s markings, manufacturing defects and a lack of tolerances on dimensional variations. It is likely that improvements could be made to socket design and quality control, but such changes would have cost implications.
v

Recommendations
The rope manufacturer, was informed of the problem of strength deterioration with a recommendation to undertake corrective actions. Production of this type of rope was temporarily suspended while manufacturing techniques were revised. Production has now resumed using modified procedures and strength deterioration is no longer a concern.
However, the premature failure of rope sockets at relatively low loads during high strain rate loading may be more significant. In service these sockets are single line components used in safety critical applications, and the effects of a premature failure could be potentially catastrophic.
The sockets used during this project were open spelter sockets in both normal and heat treated conditions. All sockets were supplied by the same manufacturer. However, this problem may not be confined to one type and size of socket. While a full investigation of the problem was beyond the scope of this project, further work investigating the reasons for premature failure in these sockets and the potential for similar behaviour in other socket types is recommended.
vi

1 INTRODUCTION
Compacted strand ropes are used by the offshore industry in a number of applications. The compacted strand construction offers improved performance compared with other stranded rope constructions, allowing its use for safety critical operations, including cranes and diving systems.
However, previous work by Reading University, to evaluate the fatigue performance of galvanised compacted strand rope (HSE research project number 3422) and HSL, to evaluate the effects of variations in capping technique (HSE research project number 3596) had identified a potential deterioration in the mechanical properties of the rope over time. This deterioration occurred regardless of whether the rope was in service or storage during this time period.
The rope manufacturer, was made aware of this problem and production of this type of rope was temporarily suspended while the problem was evaluated and manufacturing techniques revised. Production has now resumed using modified procedures.
Field Engineering Section of the Health and Safety Laboratory (HSL) were requested by Mr. J. MacFarlane of Offshore Safety Division (OSD), HSE, to evaluate the extent of this problem. This investigation involved two sizes of rope, 25 mm and 32 mm diameter subjected to both dynamic and static loading.
1

2 COMPACTED STRAND ROPES
“Compacted strand” refers to a method of producing a rope with compacted strands. The strand, consisting of round wires, is drawn through a dye or rolls, plastically deforming these wires. This process reduces strand diameter, improves contact conditions between the individual wires in each strand and the separate strands and raises mechanical properties. Compacted strand ropes are made by a number of manufacturers. A comparison between the breaking strength of compacted strand ropes and their nearest non-compacted equivalent is shown in Figure 1, this graph is based on published information.
Min
imum
bre
akin
g fo
rce
(kN
)
1500
1000
500
0
Non-compacted strand Compacted strand
Figure 2 Rope Construction 10 15 20 25 30 35 40
Rope diameter (mm)
Figure 1 Comparison of minimum breaking strength of compacted strand and non-compacted equivalent
The rope used during this project was a 34 LR, 2160 grade galvanised WSC. This is a multi-strand, low rotational (LR), compacted strand rope. The rope consists of 34 shaped strands around a central wire strand core (WSC), each consisting of seven wires. The designation 2160 identifies to the original tensile grade of the wire used. The construction of this rope is shown in Figure 2. The ropes used in this investigation were right hand lay, meaning that the strands twist in the same direction as a right hand thread while the wires in the strand twist in the opposite direction.
This project used two sizes of rope, 25 mm and 32 mm diameter. The manufacturer’s specified mechanical properties for these ropes are shown in Table 1.
Table 1 Breaking strength of compacted strand 34 LR 2160 grade galvanised
Rope dia. (mm) Mass (kg/100m) Minimum breaking strength (kN) (tonne)
25 312 572 58.3 32 505 927 94.5
At the time of testing, the relevant British Standard for stranded wire ropes was BS 302 “Stranded steel wire ropes- Parts 1 to 8”. This has subsequently been partially superseded by BS EN 12385 “Steel wire ropes – Safety – Parts 1 to 5”.
2

BS 302 Part 1 “Specification for general requirements” (1987) includes a formula for calculating minimum breaking force and specifies values for the minimum breaking force factor (K’) for different rope constructions.
Minimum Breaking Force (kN)= Breaking force factor (K’) x Rope diameter2 x wire tensile grade 1000
BS EN 12385 Part 4 “Stranded ropes for general lifting applications” (2002) quotes minimum breaking forces for this basic rope construction. A comparison of minimum breaking forces is given in Table 2. The figures quoted are for the basic rope construction and do not consider the effects of the compacted strand production method.
Table 2 Minimum breaking strengths for 34 x 7 stranded wire rope (2160 grade) Rope dia.
(mm) BS 302-1 (1987) (calculated) BS EN 12385–4 (2002)
(specified/ calculated) Mass Minimum breaking Mass Minimum breaking (kg/100m strength (kg/100m) strength
(kN) (tonne) (kN) (tonne) 25 - 429.3 43.8 284 472.5 48.2 32 - 703.4 71.7 465 774 78.9
As there had been a temporary suspension of production of compacted strand rope, 800 m of each rope diameter was manufactured as part of a special order for HSL to use during this investigation. This rope was supplied as Order number D9201488/92, full details of the ropes as supplied are shown in Table 3.
Table 3 Details of rope supplied from test certificates Rope Test certificate no. Rope no. Product Code Date Actual Actual Dia made Dia. (mm) Breaking
(mm) Load (t) 25* Z50404A/W9201708/98 Z50404A 25.034074S5B02 18/11/98 25.72 60.46
Z50404B/W9201708/98 Z50404B 25.72 60.46 32 Z50405A/W9201709/98 Z50405A 32.034074S5B01 22/10/98 33.14 96.00
* The 25 mm rope was supplied in two separate 400 m lengths
The test certificate specifies a coefficient of utilisation (or safety factor) of 5:1 for these ropes. Safe working loads for these ropes would be 11.66 tonnes and 18.9 tonnes for 25 mm and 32 mm ropes respectively.
3
3 TEST SET UP
3.1 TEST PROGRAMME
Samples from each rope diameter were tested at measured time intervals. The initial programme, proposed that each batch of tests should consist of the following:
• Three static tests to destruction.
• One dynamic test to destruction.
• Three dynamic tests without destruction.
• Three static tests taken from one end of the damaged dynamic samples above.
Prior to commencing the main test programme, commissioning tests were carried out to evaluate the viability of the test procedure and facility.
The unexpected premature failure of sockets caused a necessary deviation from the original timescales and test programme. Changes to test programme are discussed in the Results sections (Section 5, for 25 mm rope and Section 6, for 32 mm rope).
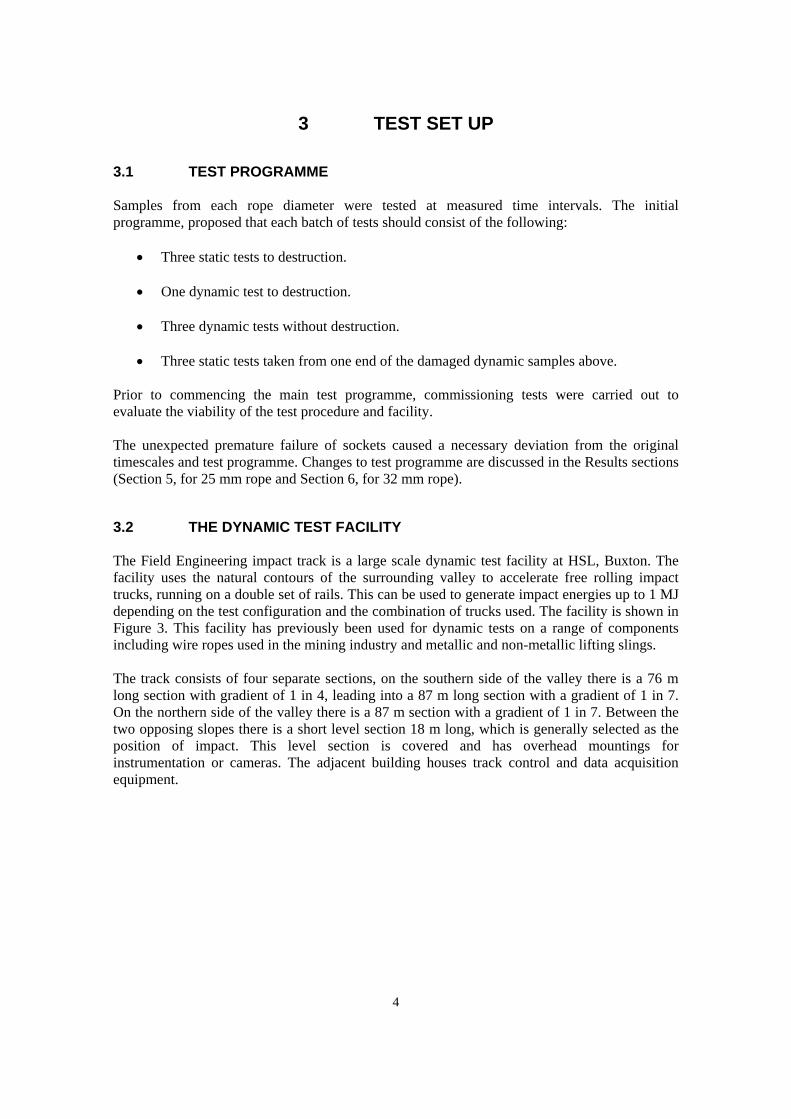
3.2 THE DYNAMIC TEST FACILITY
The Field Engineering impact track is a large scale dynamic test facility at HSL, Buxton. The facility uses the natural contours of the surrounding valley to accelerate free rolling impact trucks, running on a double set of rails. This can be used to generate impact energies up to 1 MJ depending on the test configuration and the combination of trucks used. The facility is shown in Figure 3. This facility has previously been used for dynamic tests on a range of components including wire ropes used in the mining industry and metallic and non-metallic lifting slings.
The track consists of four separate sections, on the southern side of the valley there is a 76 m long section with gradient of 1 in 4, leading into a 87 m long section with a gradient of 1 in 7. On the northern side of the valley there is a 87 m section with a gradient of 1 in 7. Between the two opposing slopes there is a short level section 18 m long, which is generally selected as the position of impact. This level section is covered and has overhead mountings for instrumentation or cameras. The adjacent building houses track control and data acquisition equipment.
4

A schematic illustration of the impact test technique is shown in Figure 3. A number of impact (or hammer) trucks are available, with different masses. The dynamic force introduced into a test-piece was controlled by varying the position on the gradient of the Southern slope from which the impact truck was released. The track has been calibrated in terms of impact speed and energy generated for each impact truck released from any given height. Losses due to friction, bearing inefficiency, etc have been taken into account.
Throughout the test programme, drop heights were varied in an attempt to control the energy applied to the test sample and limit the potential for premature failure of the rope sockets.
This programme used a single impact truck, weighing 5500 kg. This truck consists of two substantial steel plates connected by transverse members. The truck’s open structure, allows it to pass over obstructions on the track. On the inner surfaces of these plates were mounted two catcher plates. The impact surfaces of these catcher plates mount thin walled crushable tubes minimising damage and “ringing” between the catcher plates and “T” piece on impact. This truck is shown in Figure 5.
The test-piece was fixed on the level section of the track. One end of the test rope sample was connected to a fixed mounting point between the inner rails of the track. This mounting point contained an integral Strainstall type 5316, 1500 kN shear pin type loadcell serial number 64908. The loadcell mount is shown in Figure 6. Throughout the test programme, this loadcell was calibrated annually by the manufacturer, in accordance with HSL calibration procedure FE/CP/20 “Loadcells – General”. There was no significant variation in this calibration during the test period. Loadcell output was recorded using a Nicolet high speed data logger, operating at 50 kHz.
5

(a) Before release
Hammer
Disposable
Rope
Truck
Support
Test
(b) After release
Fi
Slope
xed load cell mounting Southern Northern
Slope
(c) Overhead view of hammer truck and ‘T’-piece
Figure 4 Schematic illustration of Loading mechanism during dynamic testing
The free end of the test sample was connected to a “flying” “T” piece, which is shown in Figure 5. Each rope diameter had a specific “T” piece. Prior to the test, the “T” piece was held in place on a disposable wooden support and a nominal rope tension was introduced to hold the sample
6

in the correct position and reduce rope sag. As the impact truck passed over the “T” piece, it was “collected” by the catcher plates, introducing a dynamic load.
In the event of a rope failure, the impact truck was halted by a 10.6 tonne brake truck positioned a short distance up the Northern slope. This truck bridged both rails and sat on skids covered by a high friction material.
The displacement of the “T” piece, on impact was measured using a line scanning camera (for tests carried out before the 15th August 2000) or high speed video system operating at 4,500 frames per second (for tests after the 15th August 2000). Both systems were mounted on a moveable trolley, directly above the “T” piece. Line scan camera data was analysed using software developed in house by Control and Instrumentation Section (CIS). High speed video footage was recorded by Visual Presentation Section (VPS) and analysed using OPTIMAS software.
7

On a daily basis, prior to commencing testing, the data-logger and amplifiers were calibrated using a Time 2003S dc voltage source, in accordance with HSL calibration procedure, FE/CP/38 “Digital data-loggers”. The line scan and high speed cameras were calibrated by movement of a target against a fixed scale.
Test data was analysed using Sigmaplot 2000 for Windows, version 6.10, the load data and displacement data from the linescan camera (or high speed value) were used to create load – displacement curves. An in-house Sigmaplot transform was used to calculate peak load, peak displacement and energy absorbed by the rope.
3.3 THE STATIC TEST FACILITY
Static tests were carried out using an RDP / Avery 74N8, 4 MN, long bed universal test machine with digital control, situated at HSL, Sheffield. This machine was calibrated on an annual basis to BS EN 10002 Part 2 and NAMAS specifications. There was no significant variation in this calibration during the test period.
Loading rates of 133.3 and 200 kN per minute were used for static tests on 25 mm and 32 mm samples respectively.
Rope extension under load was measured using a Wallace extensometer, a non contact optical device which could track the relative movement of two marked positions on the surface of the rope. Rope extension was measured over a gauge length of 1500 mm , across the centre of the sample. This extensometer was calibrated before every use.
Load and displacement data was recorded using a notebook PC with a logger card running HSL DAQ studio software developed in-house by Control and Instrumentation Section, HSL.
Test data was analysed using Sigmaplot 2000 for Windows, version 6.10, the load data and displacement data from the Wallace extensometer were used to create load – displacement curves. An in-house Sigmaplot transform was used to calculate peak load, peak displacement and energy absorbed by the rope.
3.4 SAMPLE PREPARATION
The test rope was stored on the reel, under cover, in a heated building. Samples were removed and prepared in batches as required.
The test samples were prepared by experienced technicians using “best practice” rope capping techniques as described in the “Ropemans” Handbook and current mining industry guidance. Sample preparation complied with BS 7035 “Code of practice for Socketing of stranded wire ropes”.
The test samples were terminated at each end, with a galvanised open spelter type socket. However, due to premature failure of these sockets (Section 4), these were replaced with higher strength, heat-treated, un-galvanised sockets). For 25 mm test-pieces, 1” sockets were used, suitable for 24 – 26 mm rope. For 32 mm test-pieces, 11/4” – 13/8” sockets suitable for 32 – 35 mm rope were used. The principal dimensions of the socket, as supplied by the manufacturer, are shown in Table 4. These dimensions are compliant with RR-S-550D “Federal Specification – Wire Ropes” (1980) socket type A.
8

As a requirement of RR-S-550D, the inner cone (or “basket”) of each socket had two circumferential grooves. These are intended to help secure the resin cone within the socket. RR-S-550D specifies the number and depth of these grooves but not their position.
Table 4 Principal dimensions of the open spelter socket (as supplied by the manufacturer)
(mouth)
A B C D E F G H I
1 2 Deep 25mm 21 85
32mm 25
A B
C
D
E F G
I H
Position of groove from
267 102 123 51.0 28.7 45.2 91.0 51.0 95.5 2.4
333 117 138 63.5 38.1 58.0 110 63.5 121 105 2.4
All dimensions in mm
RR-S-550D specifies that sockets should be manufactured from steel with a minimum tensile strength of 70,000 lbs per square inch (482.6 N/mm2) and a minimum elongation of 15%. The sockets used during this programme were purchased in several batches, minimum breaking loads for the 32 mm sockets were specified as 102.0 to 136.0 tonnes.
Sockets were secured with resin cappings (or cones). These were prepared using two part Wirelock resin capping kits. All spelter sockets were discarded after a single use. Spelter sockets were not recovered and re-used between tests.
Dynamic test samples measured nominally 15 m in length. End terminations were orientated at 90o to each other on the axis of the rope to allow connection between the load cell mounting and ‘T’ piece. Static test samples measured nominally 2.67 m in length.
Test samples were “conditioned” prior to test. Conditioning is required to fully bed the resin cones into the socket, prior to the first service loading. Early tests used a 10 tonne hanging mass for conditioning. The procedure was subsequently amended and later tests (after February 1999) used an RDP / Avery 4 MN test machine. The conditioning process involved loading samples to 20% of the minimum breaking load of the rope and holding that load for a minimum period of 5 minutes. The conditioning loads were 115 kN and 185 kN for 25 mm and 32 mm rope respectively.
Where static samples were prepared from damaged dynamic samples, they were taken from one end of the original test-piece and retained one of the original terminations. Re-capping techniques were identical to those used for preparation of the original wire rope samples. A record was kept of any broken wires found during the re-capping process.
9

4.1
4 PREMATURE SOCKET FAILURES
The test programme suffered an unexpected set back when a number of samples failed prematurely. Failure occurred in the socket termination at one end of the test rope. Premature failure occurred only during dynamic loading, during static loading there was no significant socket damage and failure always occurred in the body of the rope.
Failure occurred at loads substantially below the expected breaking load of both the rope and the socket. Failure was characterised by a longitudinal split or the ejection of a roughly hemispherical projectile from the narrow end (or “mouth”) of the socket. In many cases, the resin cone was completely fragmented and the opened out (or “brushed”) end of the wire rope was fully released.
Premature failure occurred on both sizes of sockets, however there were substantially more failures of 32 mm sockets. Failure occurred at both the moving or fixed end of the test sample, but predominated at the moving (‘T’ piece) end.
A number of these failed socket were examined by Helen Pitts of Metallurgy and Materials Section as part of support project JS2000890. The results of this investigation were originally published in two letter reports entitled “Failure of a wire rope socket” and “Examination of wire rope sockets” (1999). The findings of these reports are summarised below.
EXAMINATION OF FAILED SOCKETS
Details of the sockets examined are given in Table 5. Measured dimensions are quoted to an accuracy of +/- 0.1 mm.
Table 5 Examination of failed sockets Rope dia. Date Dynamic Position
(mm) tested Test no. of failure 320002 32 mm 28/11/98 32mm – 2 Loadcell Vss32-1 32 mm 01/02/99 32mm – 3 “T” piece Vss32-2 32 mm 01/02/99 32mm – 4 “T” piece Vss32-3 32 mm 01/02/99 32mm – 5 “T” piece Vss25-2 25 mm 02/02/99 25mm – 2 “T” piece
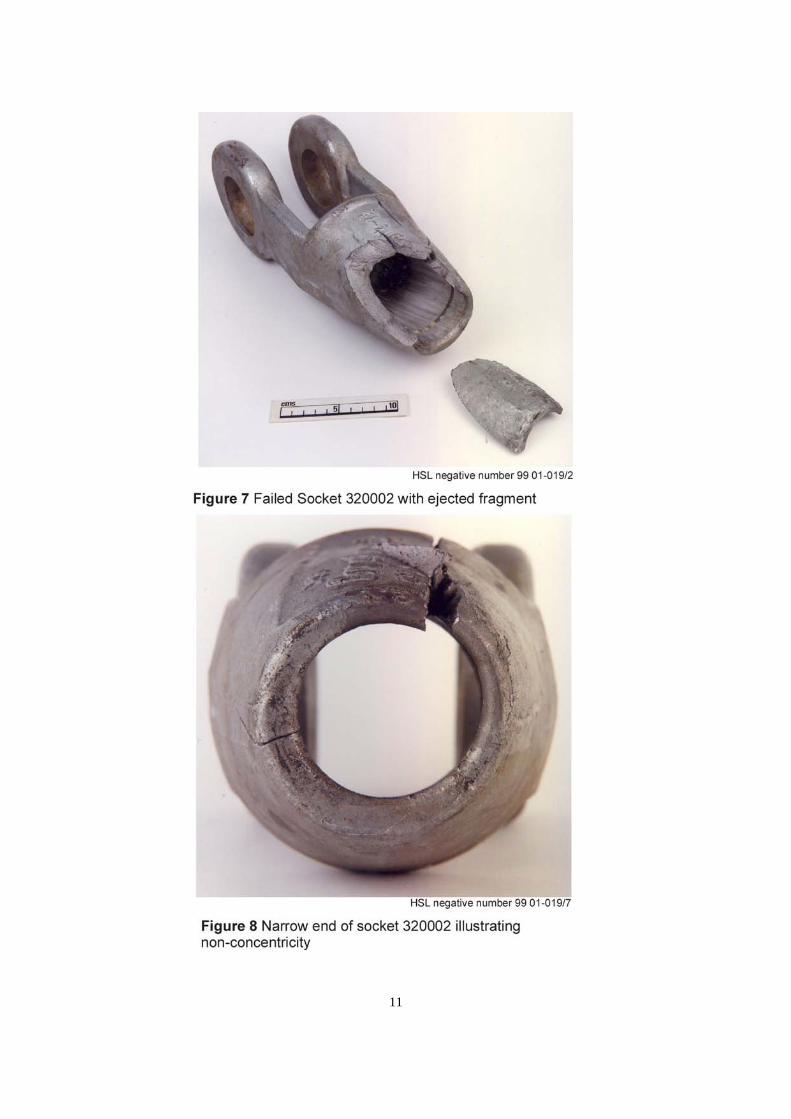
4.1.1 Socket 320002 During testing this socket failed at the loadcell attachment (fixed end). During failure, the socket ejected a fragment from the narrow end (or socket mouth). The socket and fragment are shown in Figure 7.
Measurements taken around the circumference of the narrow end revealed a variation in wall thickness between 6.5 mm and 13 mm. This variation can be seen in Figure 8. The manufacturer specifies a nominal wall thickness of 10 mm, however RR-S-550D does not specify a requirement for concentricity.
10
11

Macroscopic features on the fracture surface indicated that failure initiated near the outer wall of the socket at a position 23 mm from the socket mouth. This corresponds with the positions of three potential initiators; the position of minimum wall thickness, a circumferential internal socket groove and the external manufacturer’s stamp. The position of initiation is identified in Figure 9.
Scanning Electron Microscopy revealed that the majority of the fracture occurred by brittle cleavage with a small area of ductile microvoid coalescence near the initiation site. The socket had failed from a single stage overload. Metallography revealed a normalised structure of ferrite with bands of slightly spherodised lamellar pearlite. There were elongated inclusions and general banding indicative of the hot working associated with a forged component.
Drillings were taken for chemical analysis and these results are shown in Table 6. The federal specification RR-S-550D states that sockets should be manufactured from steel meeting material standard FED-STD-66 class 1035 or 1038, with a typical carbon content of 0.32% to 0.42% and a manganese content of 0.6% to 0.9%.
These sockets would have met the specifications for both grades. However, this socket would not have met the British standard BS 463 Part 2 “Specification for sockets for wire ropes” (1970), which specifies a maximum carbon content of 0.30%.
12

Table 6 Chemical Analysis of socket 320002
% +/- % error Carbon 0.37 0.01 Silicon 0.20 0.02 Manganese 0.72 0.02 Phosphorous 0.025 0.002 Sulphur 0.014 0.002 Chromium 0.18 0.02 Molybdenum <0.02 Nickel 0.12 0.002 Copper 0.21 0.02 Tin 0.005
4.1.2 Socket vss32-1 Vss32-1 failed in a similar manner to 320002, ejecting a fragment approximately 98 mm long from the socket mouth but also cracking along it’s entire length. Initiation occurred at a position 25 mm from the socket mouth, corresponding with a circumferential internal groove, wall thickness at this point was 10.5 mm. Failure occurred by brittle cleavage with a small ductile area at the position of initiation. The socket had failed from a single stage overload. Metallography revealed structures indicative of a forged product.
4.1.3 Socket vss32-2 Vss32-2 ejected a fragment approximately 79 mm long, failure was initiated in an area 20 mm by 8mm, immediately adjacent to the narrow end of the socket. The wall thickness at the narrow end of the socket varied between 7 mm and 10.5 mm. At the location of initiation, wall thickness was 10.5 mm. Failure occurred by brittle cleavage with a small ductile area at the position of initiation. The socket had failed from a single stage overload. Metallography revealed structures indicative of a forged product.
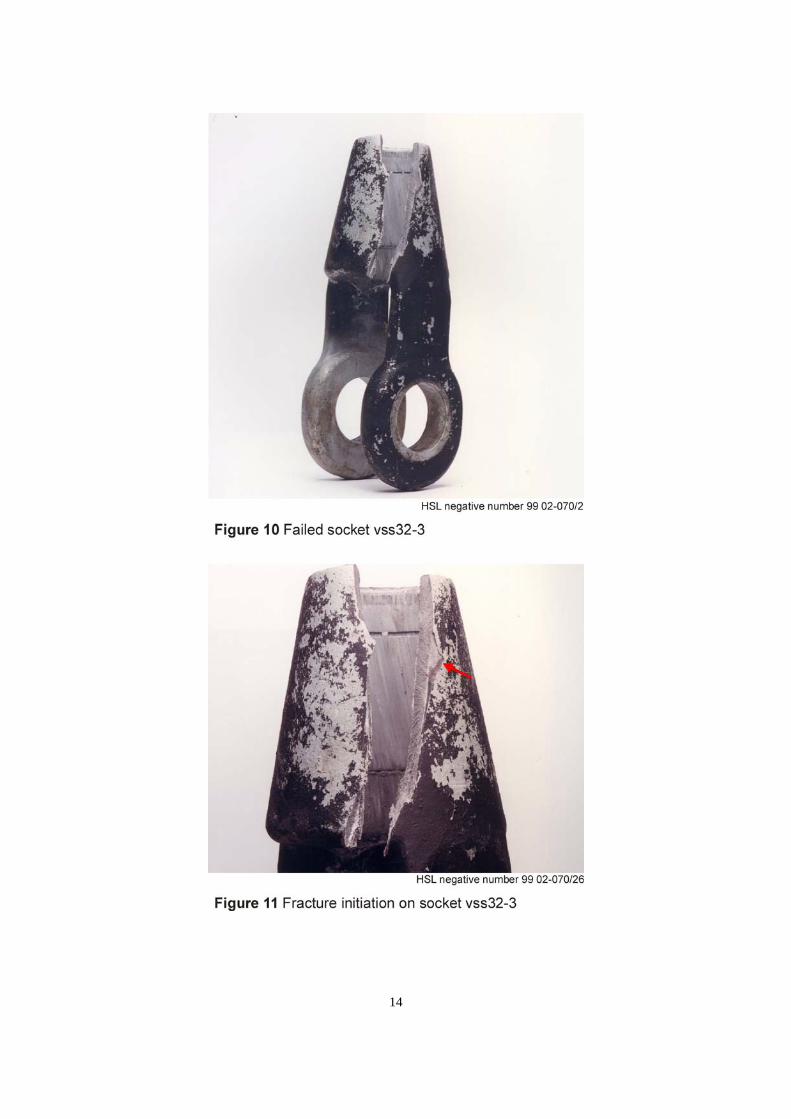
4.1.4 Socket vss32-3 Vss32-3 cracked along it’s entire length without ejecting fragments. This socket is shown in Figure 10. Failure was initiated at a position 66 mm from the socket mouth, wall thickness at this point was 17.5 mm. The fracture initiation point is shown in Figure 11. Fracture appears to have initiated at a surface defect originating from manufacture. The shape of the defect indicates that it may have been a forging lap. The socket had failed from a single stage overload.
13
14
4.2
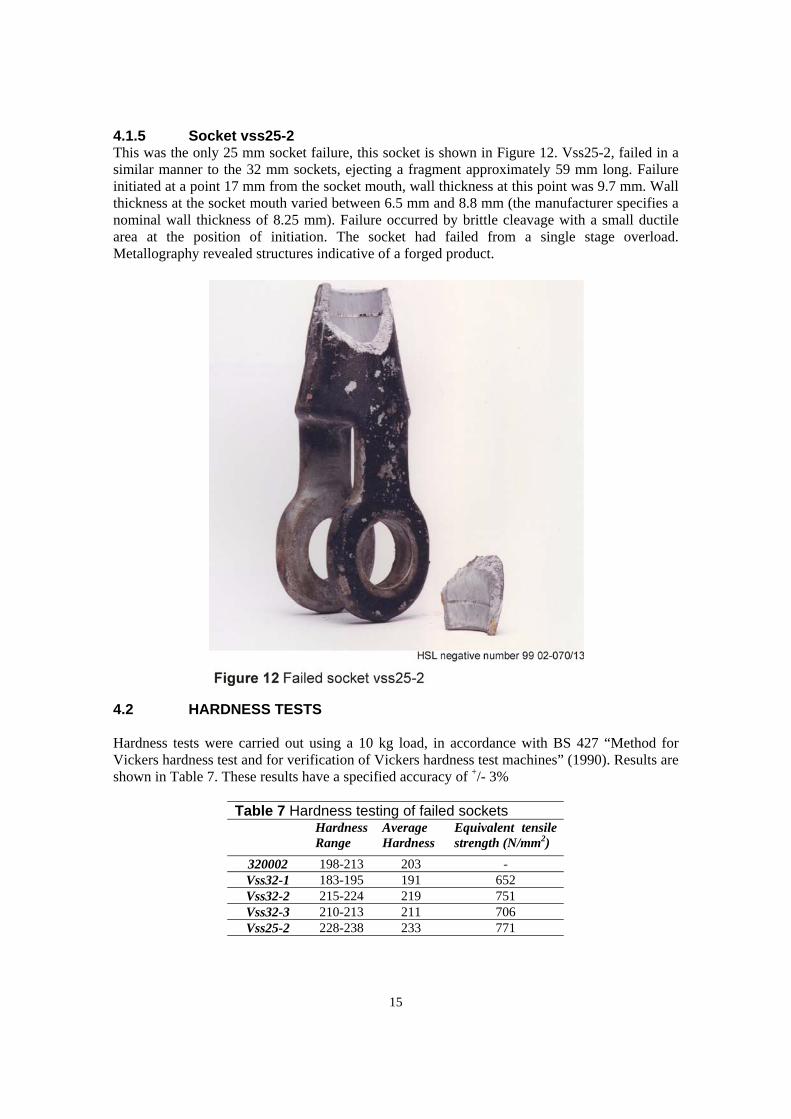
4.1.5 Socket vss25-2 This was the only 25 mm socket failure, this socket is shown in Figure 12. Vss25-2, failed in a similar manner to the 32 mm sockets, ejecting a fragment approximately 59 mm long. Failure initiated at a point 17 mm from the socket mouth, wall thickness at this point was 9.7 mm. Wall thickness at the socket mouth varied between 6.5 mm and 8.8 mm (the manufacturer specifies a nominal wall thickness of 8.25 mm). Failure occurred by brittle cleavage with a small ductile area at the position of initiation. The socket had failed from a single stage overload. Metallography revealed structures indicative of a forged product.
HARDNESS TESTS
Hardness tests were carried out using a 10 kg load, in accordance with BS 427 “Method for Vickers hardness test and for verification of Vickers hardness test machines” (1990). Results are shown in Table 7. These results have a specified accuracy of +/- 3%
Table 7 Hardness testing of failed sockets Hardness Average Equivalent tensile Range Hardness strength (N/mm2)
320002 198-213 203 -Vss32-1 183-195 191 652 Vss32-2 215-224 219 751 Vss32-3 210-213 211 706 Vss25-2 228-238 233 771
15

4.3
4.4
Hardness values were consistent with observed microstructures. Equivalent tensile strengths calculated from these results exceeded the minimum requirement of 483 N/mm2 specified in RR-S-550D.
CHARPY IMPACT TESTS
Charpy impact tests were carried out on test-pieces removed from socket vss32-1 and 320002, in accordance with BS EN 10045 Part 1 “ Charpy impact tests on metallic materials; test method (V and U notches)” (1990). Tests were carried out at ambient temperature, -5 oC, -10 oC, and -20 oC.
All samples were taken longitudinally from the body of the socket baskets. Test samples from 320002 were of the standard geometry, measuring 10 mm by 10 mm by 55 mm. Test samples from vss32-1 were of a reduced geometry, measuring 7.5 mm by 10 mm by 55 mm and results were scaled up to a 10 mm by 10 mm equivalent. Results from Charpy impact tests are shown in Table 8.
Table 8 Charpy impact testing of failed sockets Temp Energy Average 10 x 10
(oC) Range (J) Energy (J) equivalent (J) 320002 ambient 35 - 39 37 37 Vss32-1 -5 23 - 26 24 32
-10 9 - 18 14 18 -20 5 - 9 7 9
Examination of fractured surfaces identified a mixture of brittle cleavage and ductile microvoid coalescence fracture modes. There was a significant reduction in Charpy impact energies as the test temperature was reduced. Tests at –5 oC showed a reduction in impact energy of 35%. Tests at –10 oC showed a reduction in impact energy of 62%. It is possible that temperatures this low could be experienced in an offshore environment.
TENSILE TESTS
Tensile test-pieces were removed longitudinally from the body of the socket basket of socket 320002. Tensile tests were carried out in accordance with BS EN 10002 Part 1 “Tensile testing of metallic materials; method of test at ambient temperatures” (1990). Tensile results are shown in Table 9.
Table 9 Tensile testing of failed sockets Proof stress UTS Elongation
(N/mm2) (N/mm2) (%) 320002 369 - 400 601 - 617 20.0 – 22.1
These samples exceeded the tensile strength and elongation requirements (minimum 483 N/mm2
UTS and 15% elongation specified by RR-S-550D. The results were lower than the equivalent tensile strengths calculated from hardness testing.
16

4.5 OTHER PREMATURE FAILURES
Following the replacement of the basic galvanised sockets with higher strength equivalents and the modifications to the conditioning procedure, four further premature failures occurred. All of these failures occurred during tests on 32 mm rope. These sockets were identified as 32 mm tests 6, 7, 10 and 16.
A visual examination of the failed sockets identified similar features to those previously encountered and a thorough metallurgical investigation was not considered to be necessary. Failed socket 32mm-6 (320021) is shown in Figure 13.
17

5 25 MM DIAMETER ROPE RESULTS
5.1 25 MM STATIC TEST RESULTS
Static tests on 25 mm rope were carried out over an extended period of 40 months. Results for these static tests are shown in Table 10.
Table 10 Results for 25 mm Static Tests Date no. Peak Max Max Energy Notes
Load Disp* Disp (kJ) (kN) (mm) (%)
16/12/98 1 583 83 5.5 28 Unused Rope 2 583 80 5.3 29 Unused rope 3 551 70 4.7 22 Unused rope. First run aborted at 470kN (problem
experienced with loading rate).
08/12/99 4 535 35 2.3 11.2 Unused Rope 5 536 33 2.2 10.8 Unused Rope 6 537 31 2.1 9.9 Unused Rope
17/01/00 7 494 19 1.3 0.8 Sample taken from dynamic test-piece no. 7. 3 broken wires found on recapping.
8 500 40 2.7 15.0 Sample taken from dynamic test-piece no. 8 9 500 22 1.5 5.4 Sample taken from dynamic test-piece no. 9
15/01/02 10 505 25 1.7 8.4 Unused Rope 11 505 28 1.9 6.6 Unused Rope 12 497 27 1.8 7.2 Unused Rope
21/03/02 13 482 25 1.7 6.4 Sample taken from dynamic test-piece. 14 494 24 1.6 5.9 Sample taken from dynamic test-piece 15 490 26 1.7 6.1 Sample taken from dynamic test-piece
* Displacement over a gauge length of 1500 mm
All test samples failed within the body of the rope. There was some distortion of the socket in the vicinity of the pin-holes but this was not considered to be significant.
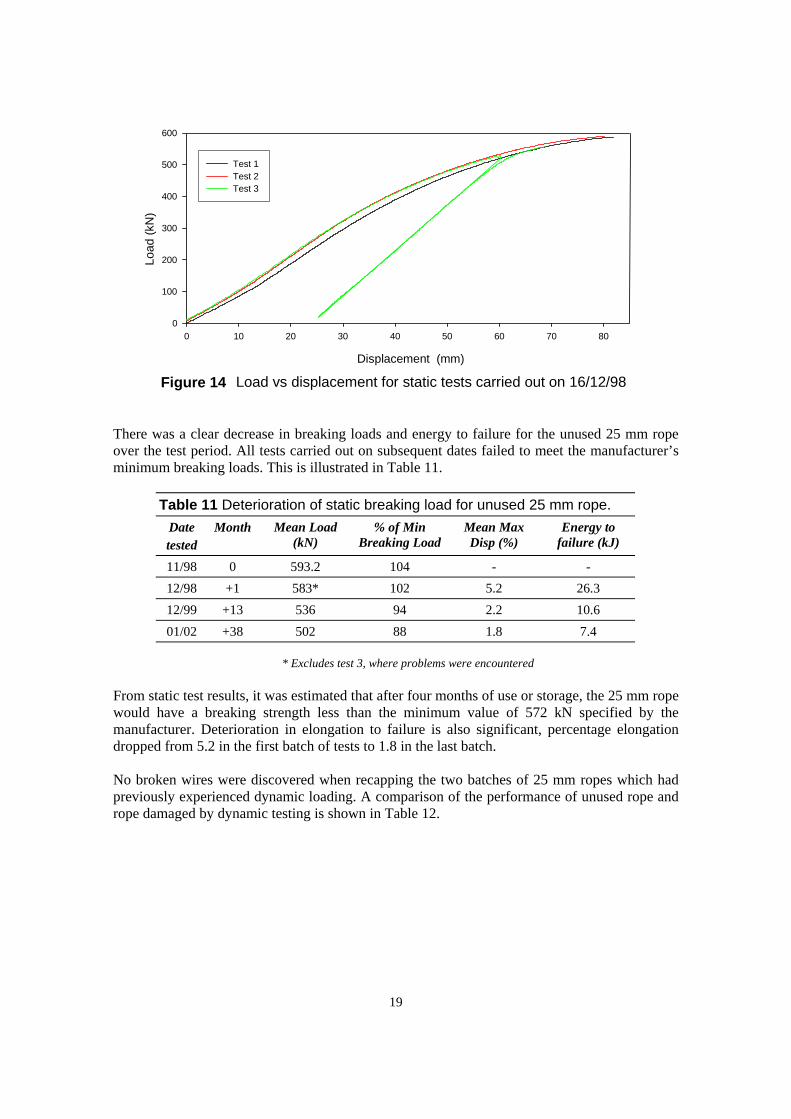
One of the three samples in the first batch, tested on 16th December 1998 was below the manufacturer’s specified minimum breaking load of 572 kN. However, problems were experienced with the test machine and this result is not conclusive. Load against displacement traces for these three tests are shown in Figure 14. All of the test samples, including damaged test-pieces, were above the minimum values for this basic construction (without dye forming) as calculated from BS302 Part 1 (429.3 kN) and BS EN 12385 Part 4 (472.5 kN).
18
Load
(kN
) 600
500
400
300
200
100
0
Test 1 Test 2 Test 3
0 10 20 30 40 50 60 70 80
Displacement (mm)
Figure 14 Load vs displacement for static tests carried out on 16/12/98
There was a clear decrease in breaking loads and energy to failure for the unused 25 mm rope over the test period. All tests carried out on subsequent dates failed to meet the manufacturer’s minimum breaking loads. This is illustrated in Table 11.
Table 11 Deterioration of static breaking load for unused 25 mm rope. Date Month Mean Load % of Min Mean Max Energy to tested (kN) Breaking Load Disp (%) failure (kJ)
11/98 0 593.2 104 - -12/98 +1 583* 102 5.2 26.3
12/99 +13 536 94 2.2 10.6
01/02 +38 502 88 1.8 7.4
* Excludes test 3, where problems were encountered
From static test results, it was estimated that after four months of use or storage, the 25 mm rope would have a breaking strength less than the minimum value of 572 kN specified by the manufacturer. Deterioration in elongation to failure is also significant, percentage elongation dropped from 5.2 in the first batch of tests to 1.8 in the last batch.
No broken wires were discovered when recapping the two batches of 25 mm ropes which had previously experienced dynamic loading. A comparison of the performance of unused rope and rope damaged by dynamic testing is shown in Table 12.
19

5.2
Table 12 Comparison of mean static test results for 25 mm rope in the unused and damaged conditions
Unused Damaged by dynamic test Date Peak Max Energy Date Peak Max Energy
Load Disp (kJ) Load Disp (kJ) (kN) (%) (kN) (%)
08/12/99 536 2.2 10.6 17/01/00 498 1.8 7.1 15/01/02 502 1.8 7.4 21/03/02 489 1.7 6.1
As expected, samples taken from damaged ropes which had been previously loaded using the Field Engineering Impact Track gave a consistently lower breaking load than unused samples from the same batch. Damaged ropes showed a clear reduction in breaking strength and energy to failure over time in a similar manner to undamaged ropes.
25MM DYNAMIC TEST RESULTS
The available impact energies for releases from each drop height used during these tests were calculated and are shown in Table 13. These figures include potential losses due to friction, etc. Release heights were varied during the test program, in an attempt to control the likelihood of premature failure of sockets.
Table 13 Impact speeds and energies for the 5500 kg truck
Drop Track Impact Total Height Distance Speed Energy
(m) (m) (m/s) (kJ) 3.0 21 6.83 128.2 3.5 25 7.45 152.6 4.9 35 8.81 213.6 5.6 40 9.42 244.1
Dynamic tests on 25 mm rope were carried out over an extended period of 38 months. Results for these tests are shown in Table 14.
Generally, the 25 mm dynamic test event had a duration of 50 – 70 milliseconds from the onset of loading until failure occurred. Where there was no failure, the time to reach the peak load value is quoted. In two cases, this event had a greater duration (up to 101.7 ms), however it should be noted that the impact events were complex in nature, with localized variations in the load / time trace, therefore quoted durations are approximate and variations are not necessarily significant.
The first and second batches of samples (tested on 2nd February 1999 and 28th April 1999) were conditioned by suspending a load of 10 tonne, lower than the conditioning load used for subsequent tests. Faulty conditioning was considered as a potential contributing factor in premature socket failure and the conditioning procedure was amended. However, socket failures continued to occur, principally on 32 mm rope.
20

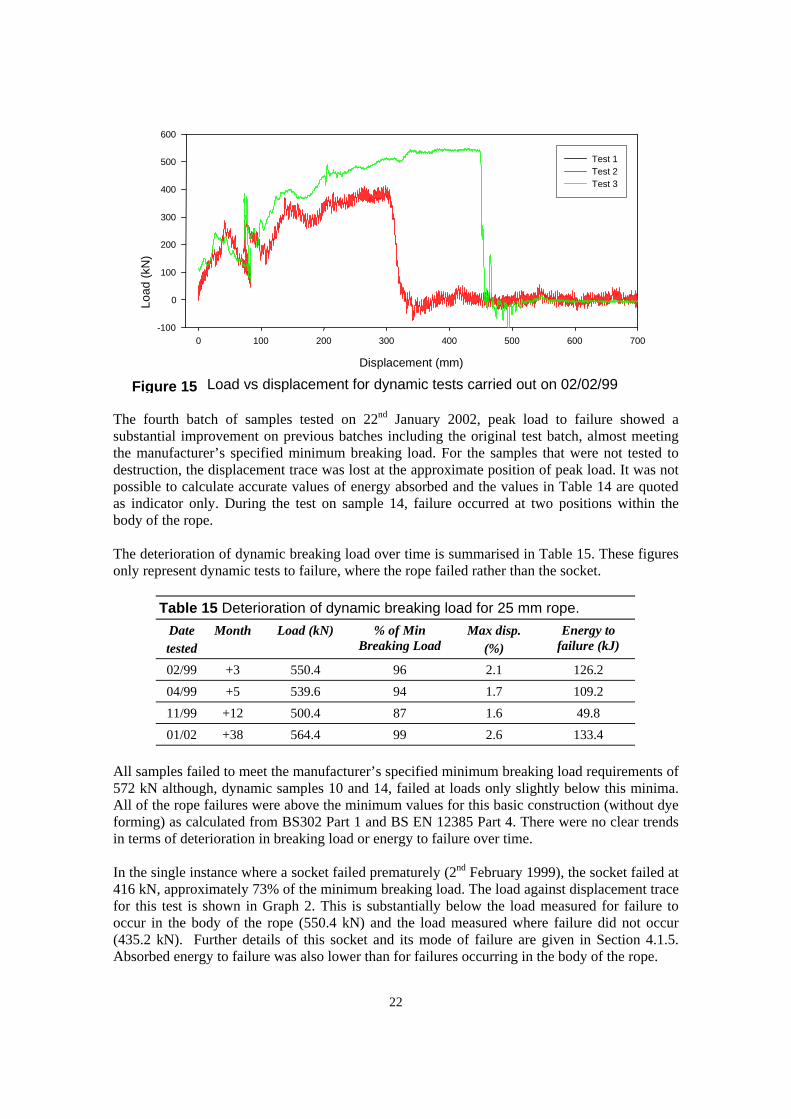
Load against displacement traces for the first batch of tests are shown in Figure 15. There are clear differences between Figures 14 and 15, which illustrate the complex nature of the dynamic event. Of particular interest are the differences between the traces for no failure (test 1), socket failure (test 2) and rope failure (test 3). In test 2, the socket failed at a much lower load and displacement than the rope failure in test 3.
The third batch of samples (tested 30th November 1999) were capped using specially supplied heat treated sockets and were proof loaded to 20% of minimum breaking load (115 kN or 11.7 t). Only one of these samples was tested to destruction. Static samples were taken from the other three dynamic ropes and tested on 17th January 2000.
Table 14 Results for 25 mm Dynamic Tests Date no. Track Time to Peak Max Max Energy Notes
distance (m)
failure (ms)
Load (kN)
Disp* (mm)
Disp (%)
(kJ)
02/02/99 1 25 - 435.2 386 2.6 72.6 No failure** 2 40 55.6 416 298 2.0 88.4 Socket failure T (moving) end 3 35 79.8 550.4 316 2.1 126.2 Rope failure
28/04/99 4 40 61.9 542.1 297 2.0 125.1 Rope failure 5 40 62.4 537 212 1.4 93.4 Rope failure
30/11/99 6 40 54.0 500.4 241 1.6 93.9 Sample tested to destruction. Rope failure. 7 25 51.2 471.6 234 1.6 49.8 No failure** 8 25 50.6 451.9 254 1.7 44.6 No failure** 9 25 88.8 483.7 234 1.6 50.3 No failure**
22/01/02 10 40 56.3 569.2 387 2.6 132.0 Sample tested to destruction. Rope failure. 11 21 101.7 498.6 310 2.1 - No failure**. Partial displacement.
12 21 67.5 525.5 306 2.0 19.0 No failure**. Partial displacement. 13 21 63.6 527.5 302 2,0 23.0 No failure**. Partial displacement. 14 40 59.1 559.5 373 2.5 134.9 Sample tested to destruction. Rope failure
in two positions
* Displacement at point of failure or maximum extension of sample under load. ** Where no failure is recorded, then the test was not to destruction. In this case, time to peak load is quoted
instead of time to failure. Displacement lost at peak load, absorbed energy quoted as indicator only.
21
600
500
400
300
200
100
0
-100 0 100 200 300 400 500 600 700
Displacement (mm)
Figure 15 Load vs displacement for dynamic tests carried out on 02/02/99
)Lo
ad (k
NTest 1 Test 2 Test 3
The fourth batch of samples tested on 22nd January 2002, peak load to failure showed a substantial improvement on previous batches including the original test batch, almost meeting the manufacturer’s specified minimum breaking load. For the samples that were not tested to destruction, the displacement trace was lost at the approximate position of peak load. It was not possible to calculate accurate values of energy absorbed and the values in Table 14 are quoted as indicator only. During the test on sample 14, failure occurred at two positions within the body of the rope.
The deterioration of dynamic breaking load over time is summarised in Table 15. These figures only represent dynamic tests to failure, where the rope failed rather than the socket.
Table 15 Deterioration of dynamic breaking load for 25 mm rope. Date Month Load (kN) % of Min Max disp. Energy to tested Breaking Load (%) failure (kJ)
02/99 +3 550.4 96 2.1 126.2
04/99 +5 539.6 94 1.7 109.2
11/99 +12 500.4 87 1.6 49.8
01/02 +38 564.4 99 2.6 133.4
All samples failed to meet the manufacturer’s specified minimum breaking load requirements of 572 kN although, dynamic samples 10 and 14, failed at loads only slightly below this minima. All of the rope failures were above the minimum values for this basic construction (without dye forming) as calculated from BS302 Part 1 and BS EN 12385 Part 4. There were no clear trends in terms of deterioration in breaking load or energy to failure over time.
In the single instance where a socket failed prematurely (2nd February 1999), the socket failed at 416 kN, approximately 73% of the minimum breaking load. The load against displacement trace for this test is shown in Graph 2. This is substantially below the load measured for failure to occur in the body of the rope (550.4 kN) and the load measured where failure did not occur (435.2 kN). Further details of this socket and its mode of failure are given in Section 4.1.5. Absorbed energy to failure was also lower than for failures occurring in the body of the rope.
22
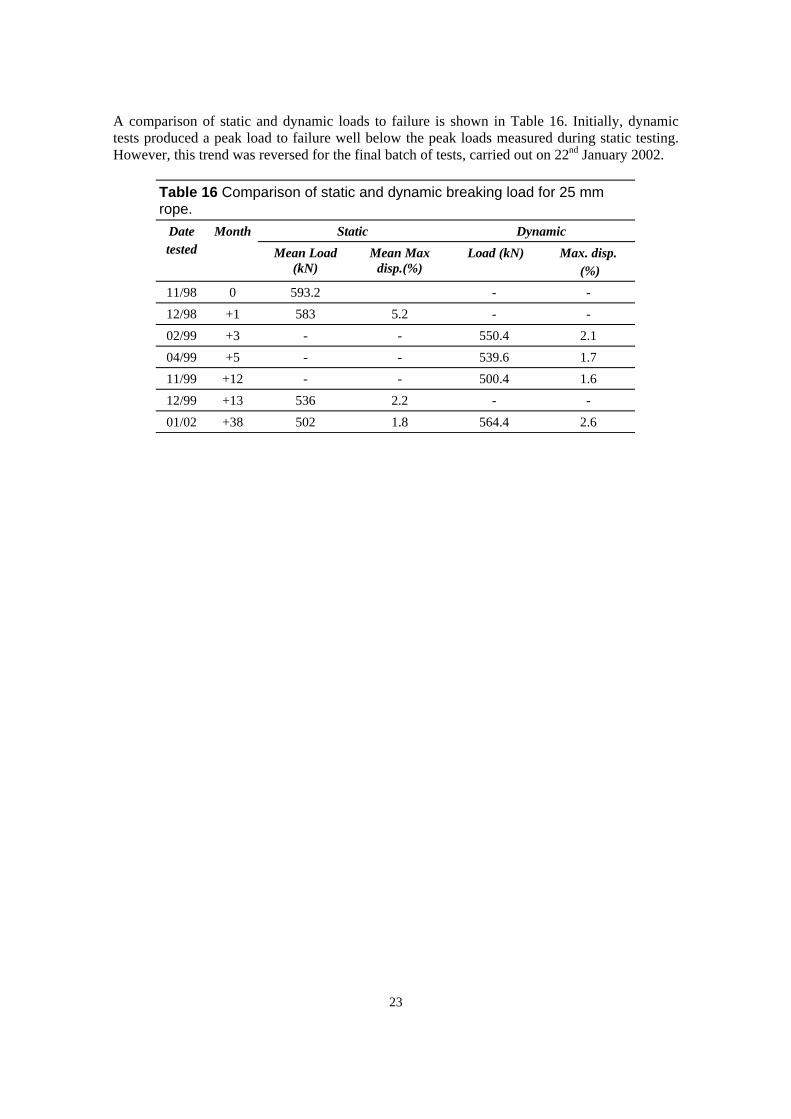
A comparison of static and dynamic loads to failure is shown in Table 16. Initially, dynamic tests produced a peak load to failure well below the peak loads measured during static testing. However, this trend was reversed for the final batch of tests, carried out on 22nd January 2002.
Table 16 Comparison of static and dynamic breaking load for 25 mm rope.
Date Month Static Dynamic tested Mean Load Mean Max Load (kN) Max. disp.
(kN) disp.(%) (%) 11/98 0 593.2 - -12/98 +1 583 5.2 - -02/99 +3 - - 550.4 2.1
04/99 +5 - - 539.6 1.7
11/99 +12 - - 500.4 1.6
12/99 +13 536 2.2 - -01/02 +38 502 1.8 564.4 2.6
23
6 32 MM DIAMETER ROPE RESULTS
6.1 32 MM STATIC TEST RESULTS
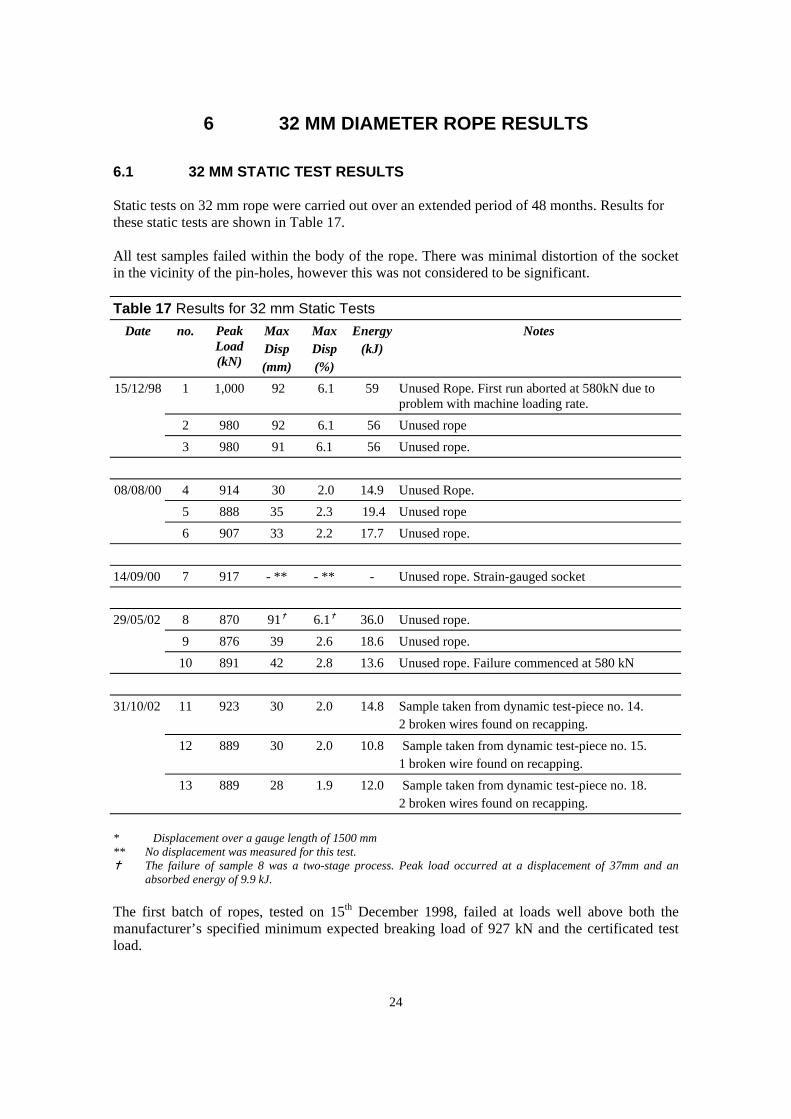
Static tests on 32 mm rope were carried out over an extended period of 48 months. Results for these static tests are shown in Table 17.
All test samples failed within the body of the rope. There was minimal distortion of the socket in the vicinity of the pin-holes, however this was not considered to be significant.
Table 17 Results for 32 mm Static Tests Date no. Peak Max Max Energy Notes
Load (kN)
Disp (mm)
Disp (%)
(kJ)
15/12/98 1 1,000 92 6.1 59 Unused Rope. First run aborted at 580kN due to problem with machine loading rate.
2 980 92 6.1 56 Unused rope 3 980 91 6.1 56 Unused rope.
08/08/00 4 914 30 2.0 14.9 Unused Rope. 5 888 35 2.3 19.4 Unused rope 6 907 33 2.2 17.7 Unused rope.
14/09/00 7 917 - ** - ** - Unused rope. Strain-gauged socket
29/05/02 8 870 91 6.1 36.0 Unused rope. 9 876 39 2.6 18.6 Unused rope.
10 891 42 2.8 13.6 Unused rope. Failure commenced at 580 kN
31/10/02 11 923 30 2.0 14.8 Sample taken from dynamic test-piece no. 14. 2 broken wires found on recapping.
12 889 30 2.0 10.8 Sample taken from dynamic test-piece no. 15. 1 broken wire found on recapping.
13 889 28 1.9 12.0 Sample taken from dynamic test-piece no. 18. 2 broken wires found on recapping.
* Displacement over a gauge length of 1500 mm ** No displacement was measured for this test.
The failure of sample 8 was a two-stage process. Peak load occurred at a displacement of 37mm and an absorbed energy of 9.9 kJ.
The first batch of ropes, tested on 15th December 1998, failed at loads well above both the manufacturer’s specified minimum expected breaking load of 927 kN and the certificated test load.
24

25
The second batch of rope samples were not tested until 8th August 2000, this delay resulting from the problems encountered with premature failure of the 32 mm sockets during dynamic tests. This batch showed a significant drop off in terms of peak loads and displacements and failed at a load below the manufacturer’s specified minimum breaking strength, as did all subsequent batches. The third batch of samples tested on the 29th May 2002 are shown in Figure 16. The failure of sample 8 occurred as a two-stage process. Partial failure and peak load occurred at a displacement of 37 mm and an absorbed energy of 9.9 kJ, however, final failure occurred at a lower load but much greater extension (91 mm). Under certain lighting conditions the Wallace extensometer experienced problems with contrast, resulting in difficulties in distinguishing between the optical target and it’s background and a noisy data signal.
The fourth batch of tests (tested 31st October 2002) were comparable with the third batch of tests (tested 29th May 2002). However, it should also be noted that this was damaged rope from dynamic test-pieces and that samples were known to contain broken wires. All of the test samples, including damaged test-pieces, were above the minimum values for this basic construction (without dye forming) as calculated from BS302 Part 1 (703.4 kN) and BS EN 12385 Part 4 (774 kN). There was a general decrease in breaking load of the unused 32 mm rope over time. This is shown in Table 18.
Table 18 Deterioration of static breaking load for unused 32 mm rope. Date tested
Month Mean Load (kN)
% of Min Breaking Load
Mean Max. disp. (%)
Energy to failure (kJ)
10/98 0 942 102 - - 12/98 +2 986.7 106 6.1 57 08/00 +22 903 97 2.2 17.3 05/02 +43 879 95 2.7* 16.1*
* Excludes sample 8
Figure 16 Load vs displacement for static tests carried out on 29/05/02Displacement (mm)
0 10 20 30 40 50 60 70 80
Load
(kN
)
0
100
200
300
400
500
600
700
800
900
1000
Test 8Test 9Test 10
6.2
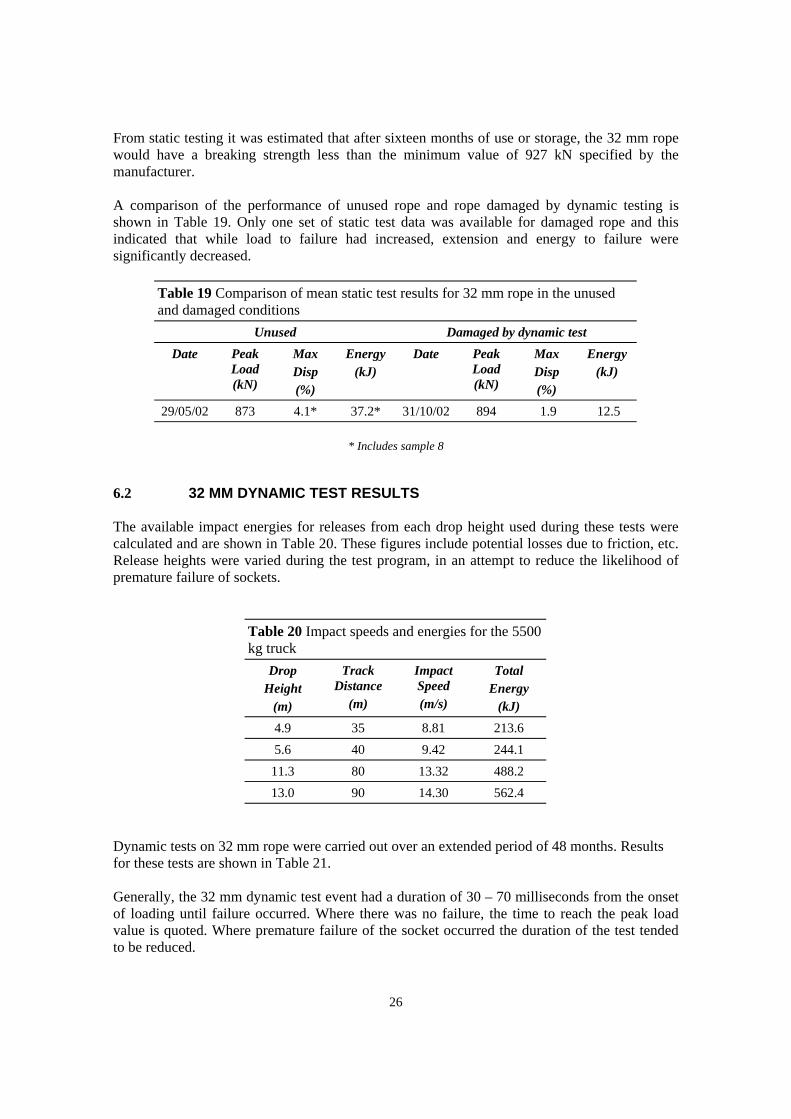
From static testing it was estimated that after sixteen months of use or storage, the 32 mm rope would have a breaking strength less than the minimum value of 927 kN specified by the manufacturer.
A comparison of the performance of unused rope and rope damaged by dynamic testing is shown in Table 19. Only one set of static test data was available for damaged rope and this indicated that while load to failure had increased, extension and energy to failure were significantly decreased.
Table 19 Comparison of mean static test results for 32 mm rope in the unused and damaged conditions
Unused Damaged by dynamic test Date Peak Max Energy Date Peak Max Energy
Load Disp (kJ) Load Disp (kJ) (kN) (%) (kN) (%)
29/05/02 873 4.1* 37.2* 31/10/02 894 1.9 12.5
* Includes sample 8
32 MM DYNAMIC TEST RESULTS
The available impact energies for releases from each drop height used during these tests were calculated and are shown in Table 20. These figures include potential losses due to friction, etc. Release heights were varied during the test program, in an attempt to reduce the likelihood of premature failure of sockets.
Table 20 Impact speeds and energies for the 5500 kg truck
Drop Track Impact Total Height Distance Speed Energy
(m) (m) (m/s) (kJ) 4.9 35 8.81 213.6
5.6 40 9.42 244.1
11.3 80 13.32 488.2
13.0 90 14.30 562.4
Dynamic tests on 32 mm rope were carried out over an extended period of 48 months. Results for these tests are shown in Table 21.
Generally, the 32 mm dynamic test event had a duration of 30 – 70 milliseconds from the onset of loading until failure occurred. Where there was no failure, the time to reach the peak load value is quoted. Where premature failure of the socket occurred the duration of the test tended to be reduced.
26

While testing the initial batches of samples, serious problems were encountered with premature failure of the rope sockets used. These sockets failed at loads considerably below the minimum breaking load, for example; test sample 4 failed at a load of 576.6 kN, approximately 62% of the minimum breaking load. These unexpected circumstances made it necessary to deviate from the project plan, evaluate the ramifications of this problem and verify the suitability of the socket type being used.
Table 21 Results for 32 mm Dynamic Tests Date no. Track Time to Peak Max Max Energy Notes
Distance (m)
failure (ms)
Load (kN)
Disp* (mm)
Disp (%)
(kJ)
26/11/98 1 90 30.4 775 169 1.1 121.4 Rope failure at fixed end.
2 90 52.8 668 - - - Socket failure at fixed end. No displacement.
01/02/99 3 90 30.8 756.5 195 1.3 102.8 Socket failure T (moving) end. 4 90 - - - - - Socket failure T (moving) end. No data.
5 40 47.4 576.6 118 0.8 27.5 Socket failure T (moving) end. Partial displacement.
25/06/99 6 80 29.5 780 253 1.7 127.2 Socket failure T (moving) end
30/11/99 7 80 23.0 752 - - -Socket failure T (moving) end. No displacement.
8 80 - 417 338 2.2 - Rope failure. Partial data.
15/08/00 9 90 33.4 873 361 2.4 164.0 Rope failure
13/09/00 10 90 31.1 776 - - - Socket failure (T) end. Straingauged socket
26/07/01 11 40 - - - - - Rope failure at socket. No data. 12 35 62.8 824 289 1.9 146.4 Partial rope failure 300 mm from fixed end.
13 35 65.5 830 293 2.0 147.4 Partial rope failure.
14/10/02 14 40 65.7 885.0 392 2.6 94.2 No failure **. 15 40 65.5 927.0 725 4.8 165.0 No failure **. 16 40 46.9 985.5 589 3.9 158.0 Socket failure at fixed end.
17 40 63.2 901.0 558 3.7 220.0 Rope Failure. 18 40 58.9 1066.0 453 3.0 86.0 No failure **.
* Displacement at point of failure or maximum extension of sample under load. ** Where no failure is recorded, then the test was not to destruction. In this case, time to peak load is quoted
instead of time to failure. Partial results only. No displacement measured for this test.
27

The failure of the 32 mm dynamic sockets and the unpredictable nature of these tests led to further complications, especially in terms of survivability of the normally robust impact track instrumentation and the reliability of data gathering.
The first three batches of samples (tests 1 to 7) were conditioned by suspending a load of 10 tonne, substantially lower than the load used for subsequent tests. Faulty conditioning was considered as a potential contributing factor in premature socket failure and the conditioning procedure was subsequently amended.
Socket failures continued after the replacement of the galvanized sockets with heat treated equivalents and changes to the proof loading technique (although in reduced numbers). This suggests that these were not the only causes of premature failure.
Particular problems were encountered during test batches 2 (1st February 1999) when a general failure of the loadcell occurred. Without load data, displacement data could not be correctly interpreted. Problems were again encountered during test batches 4 (30th November 1999) and 6 (26th July 2001), when the instrumentation wiring was severed during the test.
From the fifth batch onwards (15th August 2000), samples were prepared using specially supplied heat treated sockets and were proof loaded to 20% of their minimum breaking load (185 kN or 18.8 t). However, socket failures continued, although to a lesser extent. One sample in the fourth batch (26th July 2001) and one sample in the fifth batch (14th October 2002) failed prematurely in the socket. In both cases, failure occurred in heat treated sockets with improved mechanical properties.
The seventh batch of samples tested on 14th October 2002, appeared to show an improvement on earlier test results. Load against displacement for these tests is shown in Figure 17. However, the high number of socket failures which occurred during the early stages of the 32 mm rope dynamic testing have made it difficult to draw any clear conclusions in terms of rope deterioration.
Load
(kN
)
1000
800
600
400
200
0
test 14 Test 15 Test 16 Test 17 Test 18
0 100 200 300 400 500 600 700
Displacement (mm)
Figure 17 Load vs displacement for dynamic tests carried out on 14/10/02
Where the sockets failed prematurely, the socket failed well below the loads required for failure in the body of the rope. In the worst case a socket failed at 576.6 kN, 62% of the manufacturer’s specified minimum breaking strength for this rope.
28

6.3
The change in dynamic breaking load over time is summarised in Table 22. These figures only represent dynamic tests to failure, where the rope failed rather than the socket. All samples failed to meet the manufacturer’s specified minimum breaking load requirements of 927 kN. All of the rope failures were above the minimum values for this basic construction (without dye forming) as calculated from BS302 Part 1 and BS EN 12385 Part 4. Although test 1 was only barely above the minimum breaking load of 774 kN specified by BS EN 12385. These results appear to indicate that breaking load of the rope increased over time, however due to problems with premature failure, the number of available results is limited and this trend may be misleading.
Table 22 Deterioration of dynamic breaking load for 32 mm rope. Date Month Load % of Min Max. disp. Energy to tested (kN) Breaking Load (%) failure (kJ)
11/98 +1 775 84 1.1 121.4
08/00 +22 873 94 2.4 164.0
10/02 +48 901 97 3.7 220.0
A comparison of static and dynamic loads to failure is shown in Table 23. Initially, dynamic tests produced a peak load to failure well below the peak loads measured during static testing. However, this trend was reversed for the final batches of tests, carried out in May and October 2002.
Table 23 Comparison of static and dynamic breaking load for 32 mm rope.
Date Month Static Dynamic tested Mean Load Mean Max Load (kN) Max. disp.
(kN) disp.(%) (%) 10/98 0 942 - - -11/98 +1 - - 775 1.1
12/98 +2 987 6.1 - -08/00 +22 903 2.2 873 2.4
05/02 +43 879 2.7 - -10/02 +48 - - 901 3.7
32 MM SAMPLES WITH INSTRUMENTED SOCKETS
In order to better understand the mechanism of premature socket failure, two 32 mm rope samples (one dynamic test-piece and one static test-piece) were prepared, each with one instrumented socket. The objective of this work was to initiate premature socket failure in the dynamic test-piece and compare strain levels between dynamic and static loading.
Samples were prepared as per other test-pieces, each sample using one galvanised and one higher strength socket. Basic galvanised sockets were used for the instrumented socket rather than the higher strength alternatives to help initiate failure. Prior to application of the strain gauges, dimensions and concentricity of the sockets were measured. These dimensions are shown in Table 24.
29

The two sockets were both slightly non-concentric. The wall thickness measured at all locations was greater than the nominal figure of 10 mm quoted by the manufacturer.
Table 24 Dimensions of instrumented sockets Socket Strain- Wall thickness Concentricity
gauge (mm) Static A 12.66 Top 11.98 (SS) B 16.00
C 19.76 D 22.64 E 16.23
11.96 12.36
10.19 Dynamic A 12.54 Top 11.92
(SD) B 16.05 C 19.12 D 22.56 E 16.10
11.75 11.89
10.44
Ten strain-gauges, consisting of five 90o rosettes, were attached to the socket, by trained technicians. This allowed measurement of both longitudinal and hoop strains. The position and orientation of these gauges are shown in Figure 18. Clearly gauges had to be placed on flat prepared surfaces and could not be placed on or near the potential initiation sites identified by metallurgical examination of the failed sockets (See Section 4). Strain gauges were calibrated by the application of a range of precision resistors, up to 10,000 microstrain.
During dynamic testing, instrumentation cables made it necessary to position the instrumented socket at the fixed end of the rope.
Load was measured as in previous tests. Displacement measurements were not taken. Load and strain data was recorded using a Nicolet high speed data logger, operating at 50 kHz. The data-logger and amplifiers were calibrated using a Time 2003S dc voltage source, in accordance with HSL calibration procedure, FE/CP/38 “Digital data-loggers”.
The dynamic test was carried out on 13th September 2000. The static test was carried out on 14th
September 2000. The static test-piece failed at a load of 917 kN, failure occurring in the body of the rope. The dynamic test-piece failed at a load of 776 kN, failure occurring in the moving socket.
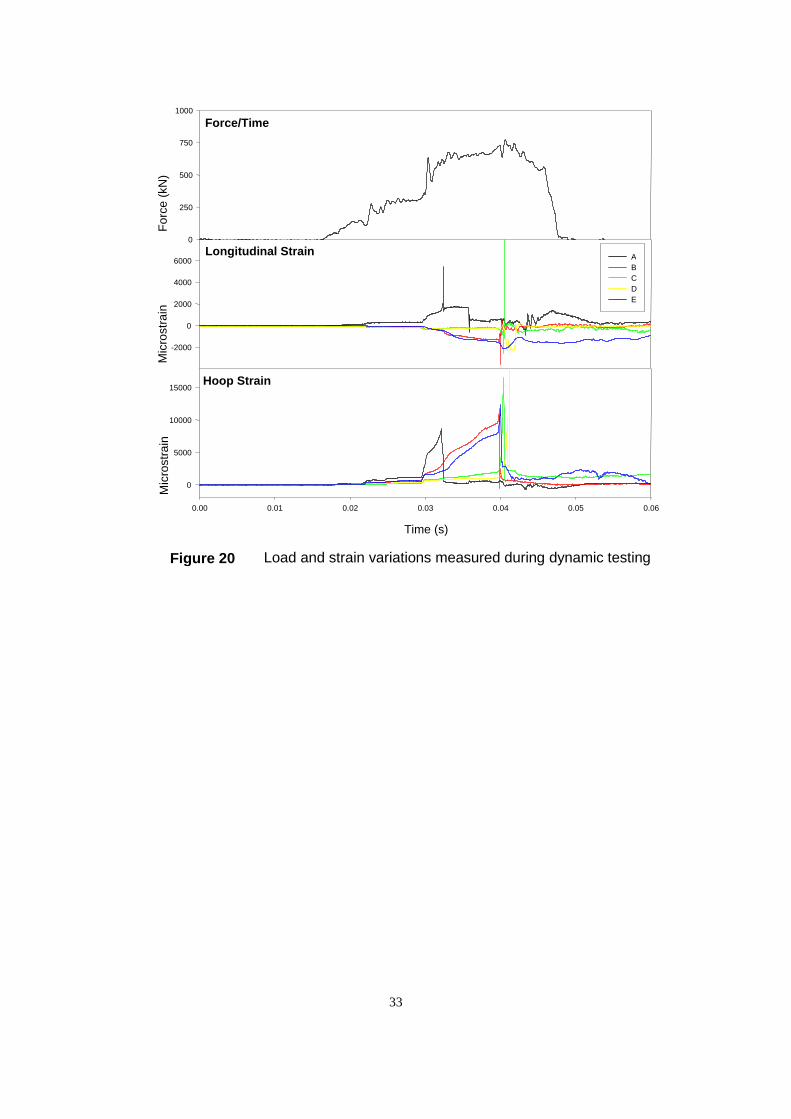
For the static test, the variation of both load and microstrain against time are shown in Figure 19. For the dynamic test, the variation of both load and microstrain against time is shown in Figure 20. A summary of peak loads and maximum strain values is given in Table 25.
In both static and dynamic tests, the measured hoop strain was substantially greater than the longitudinal strain. Measured microstrain in the dynamic socket was generally higher than in the static socket.
30

Table 25 Summary of peak loads and microstrain in the test socket during static and dynamic testing Load Hoop Strain Longitudinal Strain
(kN) A B C D E A B C D E Static 918 2325 5818 3671 -27 9724 645 27 253 1781 176 Max
473 281 117 -306 397 -336 -1045 -773 0 -568 Min Dynamic 776 8654 11822 16517 10276 12339 2080 540 252 241 26 Max
-1377 -495 -53 0 -146 -887 -1620 -1290 -2583 -2132 Min
TOP FACE
A B C D
E
25 105
140
28 56
84
56
E
112
BOTTOM FACE
Figure 18 Strain gauge positions for tests on instrumented sockets During the static test, hoop strain reached levels where localised plastic deformation would be expected to occur at positions A, B, C and E. The highest levels of hoop strain were recorded at positions B and E, diametrically opposite each other, 56 mm from the socket mouth. The lowest hoop strain was recorded at position D, adjacent to the wide part of the cone. The greatest longitudinal strain was recorded at position D, however, from strain levels at this position, it is unlikely that localised yielding was taking place.
31

32
Strain traces for the dynamic test were complex in nature. Hoop strains reached levels where localised deformation and subsequent failure would be expected to occur. Hoop strain was high at all gauge positions, particularly in the mid-sections of the cone. The highest longitudinal strains were compressive in nature, which could be expected given the nature of the event. The highest longitudinal compressive strain was, once again, measured at position D.
It should be noted that at higher levels of strain, (greater than 10,000 microstrain) these strain gauges would be outside their operating envelope. Measurements of higher levels of strain are likely to be non-linear and would not produce an accurate measurement of strain.
Force/Time
Forc
e (k
N)
0
250
500
750
1000
Longitudinal Strain
Mic
rost
rain
-2000
0
2000
4000
6000
Hoop Strain
Time (s)
0 50 100 150 200 250 300 350 400 450 500
Mic
rost
rain
0
5000
10000
15000
ABCD
E
Figure 19 Load and strain variations measured during static testing
0
250
500
750
1000
-2000
0
2000
4000
6000 A B C D E
Hoop Strain
0
5000
10000
15000
Force/Time
Forc
e (k
N)
Longitudinal Strain
Mic
rost
rain
M
icro
stra
in
0.00 0.01 0.02 0.03 0.04 0.05 0.06
Time (s)
Figure 20 Load and strain variations measured during dynamic testing
33

7.2
7 COMPARISON BETWEEN 25 MM AND 32 MM ROPE
7.1 STATIC TESTING
A comparison of load, displacement and energy for failure during static testing on both sizes of rope is shown in Table 26. For comparison purposes, the age of the rope under test has been broken down into 12 month periods. As expected, the larger rope generally gave higher loads and energies absorbed to failure. Percentage elongation to failure was slightly greater for 32 mm than 25 mm rope.
Deterioration over time was more significant for 25 mm rope than for 32 mm rope. The 25 mm rope suffered a 16% loss in strength (based on manufacturer’s specified minimum breaking load) over a period of 38 months, while the 32 mm rope suffered a 7% loss over 43 months. Without detailed knowledge of production variables, it is not possible to propose an explanation for the differences in severity of deterioration.
Table 26 Comparison of load, displacement and energy for failure during static tests on 25 mm and 32 mm unused rope
25 mm rope 32 mm rope Age Mean % Min. Mean Mean Mean % Min. Mean Mean
(Month) Load Break disp. Energy Load Break disp. Energy (kN) Load (%) (kJ) (kN) Load (%) (kJ)
0 593.2 104 - - 942 102 - -1 to 12 583* 102 5.2 26.3 986.7 106 6.1 57 13 to 24 536 94 2.2 10.6 903 97 2.2 17.3 37 to 48 502 88 1.8 7.4 879 95 2.7** 16.1
* Excludes 25 mm test 3 where technical problems were encountered ** Excludes 32mm test 8 which failed in two stages
DYNAMIC TESTING
A comparison of load, displacement and energy for both rope and socket failure during dynamic testing on both sizes of rope is shown in Table 27. For comparison purposes, the age of the rope under test has been broken down into 12 month periods.
As expected, the larger rope generally gave higher loads and energies absorbed to failure. Breaking loads expressed as a percentage of manufacturer’s minimum specified breaking load where comparable between the two rope sizes. There were no clear indications of any trends in these results.It should be noted that many ropes were not tested to failure and that some of these figures represent single results.
In order to control the potential for both rope and socket failure, it was necessary to vary the drop height (and, therefore, the available energy and rate of loading) throughout the test programme. This was less significant on 25 mm rope, where all tests to failure took place from a release position of 35 m to 40 m, than for 32 mm rope where tests to failure took place from a release height between 35 m and 90 m.
34

Table 27 Comparison of load, displacement and energy for rope and socket failures during dynamic tests on 25 mm and 32 mm rope
Rope failures (excluding partial failures) 25 mm rope 32 mm rope
Age Time to Mean % Min. Mean Mean Time to Mean % Min. Mean Mean (Month) failure Load Break disp. Energy failure Load Break disp. Energy
(ms) (kN) Load (%) (kJ) (ms) (kN) Load (%) (kJ) 1 to 12 68.0 543.2 95 1.8 108.3 30.4 775.0 84 1.1 121.4
13 to 24 54.0 500.4 87 1.6 93.9 33.4 873.0 94 2.4 164.0 37 to 48 57.7 564.4 99 2.6 133.4 63.2 901.0 97 3.7 220.0
Socket failures 25 mm rope 32 mm rope
Age Time to Mean % Min. Mean Mean Time to Mean % Min. Mean Mean (Month) failure Load Break disp. Energy failure Load Break disp. Energy
(ms) (kN) Load (%) (kJ) (ms) (kN) Load (%) (kJ) 1 to 12 55.6 416.0 73 2.0 88.4 40.1 695.3 75 1.2 112.1
13 to 24 - - - - - 27.0 764.0 82 - -37 to 48 - - - - - 46.9 985.5 106 3.9 158.0
The earlier tests on 32 mm rope carried out during the first 24 months, showed a much shorter time to failure. During these tests, the release point was 90 m compared with 40 m used in later tests and the rate of loading was correspondingly higher.
As a result of variations in release height, the dynamic tests were not generally comparable. However in the later stages of the programme, tests were carried out on both sizes of rope using a release height of 40 m. A comparison of the results for these tests is shown in Table 28.
As expected, 32mm rope gave greater loads, extensions and energies to failure, the single socket failure occurred at a load above the manufacturer’s specified minimum breaking load. No other significant trends were identified
Table 28 Comparison of dynamic tests with a release height of 40 m (energy available 244.1 kJ)
25 mm rope 32 mm rope Age Load % Min. Disp. Mean Type of Load % Min. Disp. Energy Type of
(Month (kN) Break (%) Energy failure (kN) Break (%) (kJ) failure Load (kJ) Load
37-48 498.6 87 2.1 132.0 None 885.0 92 2.6 94.2 None 525.5 92 2.0 - None 927 100 4.8 165.0 None 527.5 92 2.0 - None 1066 115 3.9 158.0 None 569.2 100 2.6 132.0 Rope 901 97 3.0 158.0 Rope 559.5 98 2.5 134.9 Rope 985.5 106 3.90 220.0 Socket
35

Socket failures predominated on 32 mm rope sockets with only a single instance of failure on 25 mm sockets. While it seems likely that this was a genuine size effect, there was insufficient information to explain the causes.
36

8 COMMENTS
8.1 Static testing of both sizes of wire rope, identified a general reduction in breaking load, extension to failure and energy absorbed to failure over time.
8.2 During this test programme the static breaking load for both rope sizes dropped below the manufacturer’s specified minimum breaking load. This is estimated to have occurred after four months for 25 mm rope and 16 months for 32 mm rope.
8.3 The worst deterioration encountered resulted in a static breaking load which was 12% below the manufacturer’s specified minimum breaking load. While significant, this is unlikely to have critical safety implications considering the coefficients of utilisation (or safety factors) of 5:1 quoted for these ropes.
8.4 During dynamic testing none of the 25 mm test-pieces met the manufacturer’s specified minimum breaking load.
8.5 Dynamic testing of 25 mm rope identified variations in rope properties during the programme but did not identify any consistent trends in rope deterioration.
8.6 During dynamic testing of 32 mm ropes, only three samples met the manufacturer’s specified minimum breaking load. All three of these samples were in the final batch.
8.7 Dynamic testing of 32 mm rope appeared to identify an improvement in rope properties over time. However, these tests were beset with technical problems resulting from premature failure of sockets and the identified trends in rope deterioration may not be reliable.
8.8 All of the test samples, including damaged test-pieces, were above the minimum values for the basic non dye formed version of this rope construction, as calculated from BS 302-1 (1987) and BS EN 12385-4 (2002).
8.9 The dynamic testing of 32 mm rope, suffered from premature failure of the sockets used to terminate the test-pieces. Premature failure occurred during 40% of dynamic tests. There was a single premature failure of a 25 mm socket. This was a dynamic effect that was not replicated during static testing. Strain measurement identified very high strain levels in the socket during dynamic testing.
8.10 Modifications to the procedures used to make samples did not prevent premature failures occurring. Evidence suggests that premature failure did not result from defective sample preparation.
8.11 Examination and testing of these sockets showed that they were compliant with RR-S-550D “Federal Specification – Sockets Wire Ropes”, the standard to which they were supplied.
8.12 Metallographic examination of several failed sockets identified that failure had occurred by a single stage overload event. The initiation point showed localised ductile failure, followed by brittle cleavage.
37

8.13 Examination of sockets revealed several potential initiation points including, internal socket grooves, manufacturer’s markings, manufacturing defects and a lack of tolerances on dimensional variations. It is likely that improvements could be made to socket design and quality control, but such changes would have cost implications.
8.14 This work did not fully identify the cause or implications of these premature failures. It is possible that other types of sockets may suffer similar problems when subjected to dynamic loading
38

9 RECOMMENDATIONS
Since this work was initiated, the manufacturer has altered their manufacturing processes and strength loss over time is no longer believed to be a concern.
Premature failures in the sockets used to terminate wire rope samples were ongoing throughout the test programme. The problem of premature failure was not solved by changes to preparation procedures or the use of higher strength sockets. Failures occurred primarily on the 32 mm socket size.
The sockets failed unexpectedly at relatively low loads during high strain rate loading. In service these sockets are single line components and the effects of a premature failure could be potentially catastrophic.
The sockets used during this project were open spelter sockets in both normal and heat treated conditions. All sockets were supplied by the same manufacturer. However, this problem may not be confined to one type and size of socket. While a full investigation of the problem was beyond the scope of this project, further work investigating this phenomenon would be advisable.
39

10 REFERENCES
BS 302 - 1 Stranded steel wire ropes- Part 1: Specification for general requirements (1987)
BS EN 12385-1 Steel wire ropes – Safety – Part 1: General requirements (2002)
BS EN 12385-2 Steel wire ropes – Safety – Part 2: Definitions, designation and classification. (2002)
BS EN 12385-4 Steel wire ropes – Safety - Part 4: Stranded ropes for general lifting applications(2002)
BS 7035 Code of practice for Socketing of stranded wire ropes (1989)
Ropeman’s Handbook (1980) NCB
Notes for guidance on the resin capping of wire ropes (1994) British Coal Corporation
RR-S-550D Federal Specification – Sockets, Wire Ropes (1980 Amended 1986)
HSL Letter Report Failure of a Wire Rope Socket H. Pitts (1999)
HSL Letter Report Examination of Wire Rope Sockets H.Pitts (1999)
BS 463 Part 2 Specification for sockets for wire ropes (1970) BS 427 Method for Vickers hardness test and for verification of Vickers hardness test machines (1990)
40

BS EN 10045 Part 1 Charpy impact tests on metallic materials; test method (V and U notches) (1990)
BS EN 10002 Part 1 Tensile testing of metallic materials; method of test at ambient temperatures (1990)
41

Printed and published by the Health and Safety ExecutiveC30 1/98
Published by the Health and Safety Executive 10/06

RR 487