Research Paper NE-722 James E. Smith Linda S. Heath
42
United States Department of Agriculture Forest Service Northeastern Research Station Research Paper NE-722 James E. Smith Linda S. Heath A Model of Forest Floor Carbon Mass for United States Forest Types
Transcript of Research Paper NE-722 James E. Smith Linda S. Heath

United StatesDepartment ofAgriculture
Forest Service
NortheasternResearch Station
Research Paper NE-722
James E. SmithLinda S. Heath
A Model of Forest Floor Carbon Massfor United States Forest Types

Published by: For additional copies:
USDA FOREST SERVICE USDA Forest Service11 CAMPUS BLVD SUITE 200 Publications DistributionNEWTOWN SQUARE PA 19073-3294 359 Main Road
Delaware, OH 43015-8640October 2002 Fax: (740)368-0152
Visit our homepage at: http://www.fs.fed.us/ne
The Authors
JAMES E. SMITH and LINDA S. HEATH are research plant physiologist andresearch forester/project leader, respectively, with the Northeastern ResearchStation at Durham, New Hampshire
Abstract
We summarize a large set of published values of forest floor mass and developlarge-scale estimates of carbon mass according to region and forest type.Published values of forest floor carbon mass or information relevant to compilingsuch summaries are scarce. We present a simulation model based on observationsobtained from literature surveys for use in the 2002 version of FORCARB, a carbonbudget model for U.S. forests. The forest floor is the distinct layer of dead anddecaying plant material that accumulates on the soil surface, which lies above themineral soil and includes small woody debris. Estimates of average forest floorcarbon mass per hectare of forest applied to a 1997 summary forest inventory, sumto 4.5 Gt carbon stored in forests of the 48 contiguous United States.
Manuscript received for publication 22 April 2002

A Model of Forest Floor Carbon Massfor United States Forest Types
James E. Smith and Linda S. Heath
Acknowledgments
We thank Coeli Hoover, Steve Prisley, Eric Vance, Ruth Yanai, and Sara Duke for helpfulcomments on drafts of this manuscript. Eric Fiegenbaum provided the cover art. This workwas partly supported by the USDA Forest Service Northern Global Change Program.
Metric units and conversions
Mg = megagram, or metric tonne
= 1.102 U.S. ton, or 2,205 pounds
Mt = megatonne, 106 tonne, or teragram
Gt = gigatonne, 109 tonne, or petagram
1 hectare = 2.471 acre

1
IntroductionThe role of forests and land-use change in the globalcarbon cycle interests scientists and policy makers becauseof the contribution forests make to the large annualcarbon flux between terrestrial ecosystems and theatmosphere (Tans and White 1998). Forests and forestmanagement projects have been a central component ofproposed actions to help mitigate greenhouse gasemissions because forests can be an economical carbonsink (Rotter and Danish 2000). Our objective is todevelop equations to estimate forest floor carbon for U.S.forests based on common forest inventory variables. Littlecomprehensive data exists for forest floor carbon pools ofthe U.S.
The development of these equations is part of a largerproject to estimate forest carbon using a simulation modelcalled FORCARB (Plantinga and Birdsey 1993; Heathand Birdsey 1993). The FORCARB model accounts forcarbon in U.S. forests (Birdsey and Heath 1995) andforest products (Heath and others 1996; Skog andNicholson 1998), has been used to produce projectionsfor the 2001 U.S. Submission to the United NationsFramework Convention on Climate Change on LandUse, Land Use Change and Forestry (U.S. StateDepartment 2000), and has been used to examineuncertainty in U.S. forest carbon budgets (Smith andHeath 2000; Heath and Smith 2000). FORCARBproduces separate estimates for all forest carbon poolssuch as live trees, down dead wood, and soil organiccarbon.
Predictions of forest floor carbon mass based oncomprehensive sampling are not currently available, butsuch data are likely to accompany future forestinventories. In this study, we attempt to meet currentneeds for forest floor carbon information by developingestimates of forest floor carbon based on derivingrelationships developed from published data. Our goal isto develop and present a transparent and readily updatedsimulation model to estimate forest floor carbon massbased on forest type, regional characteristics, and forestage since a major disturbance. “Transparent” means that itis possible for users to understand how any part of theestimate affects results, that is, all parts of the equationsare clearly outlined. These estimates are applicable todeveloping a forest carbon budget of the entire U.S. or forestimating regional averages, and can be used at the standlevel in the absence of local information.
Forest FloorSparse information and the immediate need for tractablecarbon estimates are the principal considerations in thisstudy. Our approach is (1) to define the forest floor, (2) to
develop a simple conceptual structure for makingquantitative estimates, (3) to compile useful data from theliterature, and (4) to sort and summarize data to developestimates.
Forest floor definitions vary and have evolved over time.Establishing a working definition and conceptualstructure help to identify relevant information. We areinterested in broad classification variables to serve asuseful predictors of forest floor carbon. These variablesand their relative usefulness are discussed in detail below.Values summarized from the directly measuredobservations are assigned as representative of similarlyclassified forest land. Our approach is conceptuallysimilar to other approaches that extracted data and madebroad generalizations from published measurements offorest ecosystems (Vogt and others 1995; Vogt and others1996; Johnson and others 2000). We identify importantpredictors of forest floor mass from literature reviews, usethese relationships and published values to make model-based estimates, and update estimates where possible.
The forest floor includes nonliving plant mass in variousstates of mechanical and chemical decay. Large vertebratedetritus may sometimes be included in forest floorsamples, but it is generally a small part of the forest floor.Plant material includes leaves, twigs, bark, and woodystems on the forest floor. Some forests also contain asignificant amount of fine roots in the forest floor.Accumulation of plant material can form identifiablelayers above the mineral soil. Layer identities are based onstates of decomposition ranging from freshly fallen leavesand twigs, which are easily identified, to lower layers ofhumus that are at an advanced state of decomposition.The lowest layer can be amorphous and sometimes almostindistinguishable from upper layers of mineral soil(Waring and Schlesinger 1985). Organic layers above themineral soil are usually identified as Oi, Oe, and Oa
(upper to lower) or L, F, and H according to a previousclassification system (Federer 1982).
Distinctions among pools of coarse woody debris, theforest floor, and soil organic matter are necessary to avoidover- or under-counting carbon when separate estimatesare made for each. Reconciling differences in forest floordata collection was difficult as many studies featureddifferent protocols. For example, distinctions betweencoarse woody debris and the small woody material that isconsidered part of the forest floor are based on diametersof recently fallen branches and stems. Diameters rangingfrom less than a centimeter to more than 7 cm arereported as the distinction between coarse woody debrisand forest floor (Rollinger and others 1998). Also, manyreports either do not specify how a distinction was made,or they fail to identify the presence or absence of woody

2
material. The state of decomposition is also a basis fordistinguishing coarse woody debris from the forest floorbecause rotting logs eventually become classified as forestfloor. The distinction between the lowest layers of forestfloor and upper (generally A horizon) layers of mineralsoil is sometimes clear. However, purely organic layers offorest floor and organic-rich layers of the mineral soil aresometimes difficult to discern. This can be even moredifficult when mechanical mixing of layers has occurred(Ryan and others 1992). Field classifications are usuallybased on morphology and are closely related to anindividual researcher’s experience (Federer 1982).
Accumulation of forest floor mass depends on rates ofdetrital inputs and the rates of loss through processes suchas decomposition or physical damage or removal.Accumulation and loss can be spatially (Simmons andothers 1996) and temporally (Nemeth 1973)heterogeneous. Processes can be influenced by season,climate, and edaphic factors, as well as standcomposition, age and disturbance history (Schlesinger1977; Mattson and Smith 1993; Binkley 1995).
Forest floor carbon mass is related to total biomassaccumulation, but additional factors control specificcarbon content. Specific carbon content of forest floormass can vary by origin of material as well as history ofdecay or residence time in the forest floor. For example,freshly fallen wood usually contains more carbon pergram dry weight than fresh leaf litter, approximately 50percent versus 45 percent (Fassnacht and Gower 1999).Loss of carbon through respiration and changes inchemical composition with decay result in progressivelydecreasing carbon content of the more decomposedmaterial of lower forest floor layers (Huntington andothers 1989; Schiffman and Johnson 1989).Decomposition rates are principally affected by qualityand quantity of material as well as a favorablemicroenvironment (Schlesinger 1977; Hendrickson andothers 1989; Berg and others 1996). Though quantityand quality of inputs affect carbon mass stored in forestfloors, factors controlling carbon loss appear to besomewhat more important in controlling the carbon levelin temperate forests (Vogt and others 1996). We assumethat factors affecting gain and loss co-vary with foresttype, location, and other general descriptors, and thatsuch generalizations are useful for developing simpleestimates at large scales.
Regional characteristics
Numerous reviews report forest location and compositionare associated with average amount of forest floor mass(Schlesinger 1977; Vogt and others 1986; Vogt and others1995; Vogt and others 1996; Rollinger and others 1998).
For example, Vogt and others (1995) reviewed a numberof broad influences on soil and forest floor carbon. Thegoal was to identify influences on large-scale estimates.Their results demonstrated a trend of greater forest flooraccumulation along a climatic gradient from tropical totemperate to boreal forests. The result of adding evergreenand deciduous classifications suggested their usefulnessfor predicting forest floor mass. Evidence further suggeststhat additional predictor variables such as soil type,stocking, productivity, or management intensity can affectforest floors, but these variables are not as consistentlyuseful as region or forest type for making large-scaleestimates (Vogt and others 1995; Vogt and others 1996).
Climate affects accumulation and loss of forest floormass. Longer growing seasons and warmer temperaturesare associated with greater productivity and litterfall, butthey also are associated with more rapid decomposition,especially if litter retains sufficient moisture and aeration.Within a specific forest type or region, latitude orelevation gradients may be analogous to climate gradients.Estimating forest floor mass with latitude may depend onconsidering a wide range of either latitude or localenvironments (Vogt and others 1986; Vogt and others1995; Simmons and others 1996).
Forest Type by Region
Forests dominated by conifers usually accumulate moreforest floor mass than deciduous forests (Schlesinger1977; McClaugherty and others 1985; Finzi and others1998). However, a number of exceptions to this trend alsohave been noted (Perala and Alban 1982a; Grigal andOhmann 1992; Vogt and others 1995). The accumulationin softwoods is partly due to more decay-resistant litter,conditions that favor fungal decomposers, and coolertemperatures and microenvironmental conditions thatslow decomposition. Rates of litter decomposition areusually lower for softwoods than for hardwoods. Vogt andothers (1995) found generally greater forest floor mass inneedle-leaved evergreen forests than in broadleaveddeciduous forests in warm temperate regions. However,forest floor accumulation was greater in cold temperateclimates with the two forest types having similar forestfloor mass. Mixed forests of both needle-leaved evergreenand broadleaf deciduous species had significantly moreforest floor mass than either type alone.
Forest type, as described by major component species, isclearly an important factor in accumulation of forest floormass (Lang and Forman 1978; Cole and Rapp 1981;Vitousek and others 1982; Vogt and others 1986; Vogtand others 1996; Rollinger and others 1998). However,there are enough exceptions to predictive ability withinforest types to suggest that classification by type alone

3
might not be sufficient to develop a simulation model.For example, forest floor mass sampled from 40-year-oldstands of aspen, white spruce, jack pine, and red pinewere within a similar range. This included no substantialdifferences between hardwood and conifer species (Peralaand Alban 1982b). Species composition alone also canproduce apparently contradictory results. For example,sometimes the presence of alder leads to substantiallygreater forest floor mass in Douglas-fir stands in thePacific Northwest, and sometimes inclusion of alder doesnot affect accumulation (Binkley and others 1992).Including bigleaf maple in Douglas-fir stands along thecoastal range in Oregon had no affect on forest floormass. Bigleaf maple did, however, increase measuredlitterfall and rates of decomposition (Fried and others1990). Despite the many documented exceptions,location (region) and stand composition are probably themost useful estimators for forest floor mass.
Development with Age
Forest age, in years since afforestation or a majordisturbance, is assumed to be the next most usefulpredictor of forest floors after location-by-type influences.A change in land use to forests, such as afforestation ofagricultural soils, often is associated with a rapid increasein forest floor mass (Schlesinger 1977; Binkley 1995).The surface organic layer, which becomes forest floorwith afforestation, is generally greater in forests than inrecently abandoned agricultural land or old-fields(Schiffman and Johnson 1989; Homann and Grigal1996). Net forest floor mass accumulates at a relativelyrapid rate during forest development. This rate slowsconsiderably as the forest floor reaches a more maturestate between 20 and 80 or more years, depending on theforest (Switzer and others 1979; Covington 1981; Meansand others 1992; Edmonds and Chappell 1994; Smithand Resh 1999). Relatively slower rates of changecharacterize the much longer period from maturitythrough old growth. Forest floors of older undisturbedforests can sometimes be characterized as anapproximately steady state.
These estimates depend on assuming a threshold age formature forest floors based on the overstory age of a standand assigning an average carbon mass for anapproximately steady state. Covington (1981) and others(Federer 1984; Hendrickson and others 1989; Mattsonand Smith 1993; Olsson and others 1996) identifiedforest floor dynamics following harvest, and defined “fullyrecovered” Northern hardwood forest floors between 40and 60 years old. Development is much more rapid inSouthern pine forests with ages between 15 and 25 years(Nemeth 1973; Switzer and others 1979; Gholz andothers 1985; Lockaby and Taylor-Boyd 1986). Evidence
suggests that western forests tend to develop forest floormass more slowly (Smith and Resh 1999). The exceptionsin the West are forests of the Pacific Northwest west ofthe Cascades (Turner and Long 1975); Douglas-fir forestsdevelop forest floor mass relatively rapidly and continueslow increases through old growth. Differences betweenmature and old-growth forest floor mass vary by forestand region. However, approximate steady-state averagesmay be useful for long-term estimates for regions whereold-growth stands are an increasingly smaller proportionof forest area.
Effects of Disturbance
Relationships between disturbance and forest floor massdepend on severity of disturbance. Minor disturbances,such as creation of small gaps or low-intensity fires, mayhave little apparent measurable effect and can result inrapid recovery. For example, windthrow — creating smallgaps — had no long-term effect on carbon storage inforest floors of hemlock-hardwood and northern-hardwood forest in the Great Lakes region (Liechty andothers 1997). Fire effects on forest floor mass, or carbon,can vary considerably. Some regular or low-intensity fireshave little effect in reducing forest floor mass (Alban1977; Little and Ohmann 1988; Clinton and others1996), whereas most of the forest floor can be lost inmore severe fires (Dyrness and others 1989; Vose andothers 1999). Rapid recovery can occur when fire damageto overstory is limited (Bell and Binkley 1989).
Reductions in forest floor carbon are possible following aclearcut harvest. Harvests result in decreased litter inputand increased decomposition (Johnson and others 1991;Alban and others 1994; Strong 1997; Rollinger andothers 1998). Changes in decomposition are influencedby the altered microenvironment of the soil surface. Inaddition to rapid decomposition, immediate losses offorest floor with harvest may be due to mounding,mixing, and burial of organic matter (Federer 1984; Ryanand others 1992). Effects of harvesting on forest floormass and the dynamics accompanying forest regrowth canhave important consequences for estimates. If forest floormass is lost quickly after harvest, then patterns of carbonstorage will follow closely those of afforestation. Time-averaged carbon content would be considerably greater,however, if most forest floor mass remains after harvest,followed by slow decay during forest regrowth andaccumulation of new forest floor mass.
Covington (1981) described the dynamics of forest floormass for northern hardwood forests following clearcutharvesting. Forest floor organic matter decreased the first15 years following clearcutting of northern hardwoodforests in New Hampshire. A 50 percent decrease was

4
followed by a slow recovery of forest floor for about 50years before floor mass was within 5 percent of preharvestlevels. These results initiated numerous fieldmeasurements and model simulations of this effect. Somereports failed to demonstrate the same dynamics(Hendrickson and others 1989; Schiffman and Johnson1989), and others repeated the effect (Federer 1984;Snyder and Harter 1987; Mattson and Smith 1993;Johnson and others 1995), principally among northernhardwoods. Differences among most results were usuallyin the extent or timing of the minimum in forest floormass. Restoration of forest floor mass with regrowth wasdue partly to rapid recovery of litterfall, often topreharvest levels within a few years of harvest (Covingtonand Aber 1980; Schiffman and Johnson 1989; Alban andPerala 1990). Another explanation for the dynamicsdescribed by Covington (1981) is that differences amongharvest methods over time have impacted sites differentlyand forest floor mass partly reflects this record (Yanai andothers 2000).
Decomposition
Decomposition, a controlling process for netaccumulation of forest floor mass, is affected by quantityand quality of material (Schlesinger 1977; Hyvonen andothers 1998). Quantity varies with forest productivity andseason. Quality varies with the input material and depthin forest floor, with fresh litter subject to the most rapiddecomposition and humus decomposing slowly.Additionally, favorable microenvironments are functionsof temperature and moisture. Controls on decomposeractivities — temperature, moisture, and tissue chemistry— are reflected in large-scale attributes such as region,annual temperature and precipitation, latitude, elevation,and species composition (Vogt and others 1986). Thegeneral observation that forests with lower mean annualtemperatures and dominated by evergreen species tendedto have greater accumulation of forest floor (Vogt andothers 1995; Vogt and others 1996) is consistent withthese broad controls. Thus, the same broad forestcharacteristics that covary with forest floor mass — regionand type — also predict decomposition, as expected.
Literature Bases for Structuring Estimates
Based on literature and the goals of our work, we chooseto focus on region and latitude as climate analogs, andforest type (also affected by climate) as the principalpredictors of forest floor mass. Forest age, in terms ofyears since afforestation or a major disturbance, isidentified as the third general characteristic used informing these estimates. The basic assumption about ageeffects is that greater changes occur in younger forestsdeveloping toward maturity than in the years between a
mature state and old growth. “Mature” can be a difficultstate to define, but it serves to organize the format ofthese basic estimates.
Forest Floor Data from Literature
Our goal is to develop a transparent simulation model toestimate the forest floor carbon pool. The model is basedon data derived from literature searches and a series ofsimplifying assumptions. We assume that relatively small-scale numerical relationships obtained from the literaturecan be applied to determine carbon for large areas.Estimates are based on averages of published valuesgrouped according to forest and location. Relationshipsamong average values are then applied to large areasdefined by roughly similar forest composition, history,and regional characteristics.
Conceptual Organization and AssumptionsBased on Literature
Our base assumption is that mature forests, classifiedaccording to type and region, achieve an approximatelysteady state of forest floor carbon (Schlesinger 1977;Switzer and others 1979; Hough 1982; Waring andSchlesinger 1985; Lockaby and Taylor-Boyd 1986).While true steady states are unlikely, this is a necessarysimplification. The changes in forest floor mass associatedwith a progression from mature forests to old growth —40 to 60 years to hundreds of years — are likely to bemuch smaller than the accumulation during the first 20to 60 years following regrowth after harvest. Thisassumption is most appropriate for large aggregate values(summed over thousands of hectares, for example),whereas individual stands are likely to exhibit greatertemporal and spatial heterogeneity with respect to thedynamics of forest floor accumulation.
Our second assertion is that disturbances alter forest floormass (Schlesinger 1977; Dyrness and others 1989;Johnson and others 1991; Alban and others 1994; Strong1997; Rollinger and others 1998; Vose and others 1999).Any pattern of decrease or pulse increase in forest floormass following a disturbance depends on the type andseverity of the disturbance. Long-term effects depend onthe specifics of the disturbance as well as time since theevent. We also assume that over time the forest floor willreturn to the approximately steady state level of a matureforest.
Dynamics of forest regrowth following disturbance orwith afforestation are assumed to affect the forest floorcarbon pool. We assume that the early period of growthends at a threshold age for maturity and the onset of theapparent steady state. This age may vary with forest type

5
and region. We also assume that the forest floor reachesthis approximately steady state sooner than soil carbon orannual increment of tree biomass. The same time-to-recovery is applied to afforestation, regrowth, and majordisturbances (such as widespread crown fires). We assumeafforestation is accompanied by a relatively rapid increasefrom little or no surface organic layers to the mature levelof forest floor mass. Partial cutting may have the samepattern with a more rapid recovery time.
Specific Value Needs
The structure of all estimates depends on assigning forestarea to generally homogeneous groups according toregion, forest type, and age. This is the minimumclassification scheme for all values extracted from theliterature. Classifications are applied to both inputs fromforest sector projections and from empirical relationshipsidentified in the literature. Published data are used todetermine an average age and carbon content for a matureforest. Published discussions about forest floor maturityand an informal examination of the data were the basesfor assigning mature ages.
The transition from age zero to the mature forest is arelatively rapid growth phase for forest floor carbon.Regrowth also includes decaying forest floor material thatstarts at age zero with the precut mature level of carbon.Decay rates are set according to forest floor mass meanresidence times by forest type and region. The initialforest floor carbon in regenerated forests generally reacheszero by the time the forest floor has returned to themature state. Though it was not our intent, the sum ofthe two modeled estimates — rapid increase andexponential decay — at the same age qualitativelyreproduces the time course described by Covington(1981).
Identifying Published Values
The search for existing data on forest floor mass includedpeer-reviewed journals, technical reports, and theInternet. Information varied considerably amongpublications. A few directly addressed mechanisms ofcontrol on forest floor accumulation. However, the forestfloor mass data were peripheral to the main purpose ofmost of these publications. The minimum datarequirements were some description of the forest and ameasure of forest floor mass.
We made an effort to avoid duplicate observations.Research projects often use the same field site and muchof the site data can be reported in more than onepublication. Where a number of forest floor values werereported for a single site within a publication, we pooledthe values to a single observation. Separate sites in the
same forest were counted as separate observations. Thus,publications with a number of values were sometimesused as a few points and sometimes included as a singlemean, depending on our interpretation of the data. Wemade no effort to adjust for possible bias in location ofexperimental versus actual forest distribution within aforest-type by region classification. Similarly, seasonalinfluences on forest floor mass can vary, but we did notsort observations accordingly.
The values obtained from publications were as follows: adescription of forest type; mass per unit area; massidentified as carbon, organic matter (ash free weight), ordry weight; values for converting organic matter or dryweight to carbon; stand age or time since significantdisturbance; site history in terms of management ordisturbances; location, including latitude, longitude, andelevation; and a measure of decomposition or meanresidence time of forest floor material. Some discussion offorest floor definition and measurement was noted.Additional information, such as more precise speciescomposition, stand density, site productivity, othercarbon or biomass pools, or additional site history, wasoccasionally included in publications.
Our definition of forest floor does not include downcoarse woody debris and mineral soil but these mighthave been included in some observations. Publishedvalues overestimate forest floor if larger woody materialwas considered part of forest floor without beingmentioned in the method of collecting forest floormaterial. Similarly, other estimates will understate forestfloor if they exclude all fine woody material from reportedvalues. The same uncertainties exist for the distinctionbetween forest floor and the upper layer of mineral soil.Thus, precise definitions for forest floor were ostensiblyprimary considerations in extracting data from theliterature survey. Most reports provided little informationon distinctions among coarse woody debris, forest floor,and the mineral soil pools. For these, we simply relied onthe individual researcher’s experience for the vast majorityof observations. Where possible, we excluded woodymaterial greater than 7.5 cm in diameter, because this wasdefined as coarse woody debris.
Forest-type and Region Classification
These estimates are based on region and forest-typeclassifications shown in Figure 1 and Table 1, respectively.General forest types were formed on the limited numberof observations available. For example, a single pine typewas formed for the South. Additional subdivision of typesis possible in the future. Forest types not explicitlyincluded were not represented in our dataset. Setting aminimum age for a mature forest floor was a somewhatsubjective process. Ages were assigned after considering

6
reports in the literature and forest ages in growth andyield models.
Northern forest floors were defined as mature when theoverstory age was 50 years. Conifers were divided intotwo groups, pine and other conifer, which were mainlyspruce, fir, and hemlock. Aspen-birch and maple-beech-birch formed two distinct groups with a large number ofobservations in each. Other hardwoods were lumped as asingle group that included mostly oaks and some oak-hickory forests as well as miscellaneous hardwoods. Asixth type was mixed conifer-hardwood.
Southern forest floors were defined as mature at overstoryage 30 years. Pine was the only conifer classificationpossible from the dataset. All southern hardwoods werepooled to a single group, which was mostly oak-hickory.Very few bottomland hardwoods were included. A fourthtype was mixed conifer-hardwood. The large areas of pineand the likely different effects of management makesouthern pines a candidate for future subdivision of foresttypes according to origin or productivity.
Pacific Northwest forest floors were defined as maturewhen overstory age was 40 years. The west side of thePacific Northwest — the states of Oregon andWashington west of the Cascade Mountains — has a verydifferent climate than the remainder of the WesternUnited States. It is the only distinct subregion weestablished for the West. Conifers were divided into twotypes according to elevation. Higher elevation specieswere fir and hemlock. Lower elevation and coastal siteswere principally Douglas-fir, Western hemlock, and Sitkaspruce. All hardwoods were grouped as one type.
The remainder of the West was considered one largeregion and included the Rocky Mountains, theIntermountain/Great Basin, and California. The age formature forest floors was set at an overstory age of 80years. The principal division in the West was betweenmost conifers as pine or mixed conifer groups. Large areasof woodlands in the West including pinyon-juniper weremaintained as a separate group due to size of area,however few values were identified. Hardwoods andredwoods/giant sequoia were two additionalclassifications.
We found some data for Alaska forests. However, too fewreports were available for usefully classifying forests by ageor type. Thus we do not develop equations for estimatingforest floor carbon, but we did summarize values forinterior Alaska (Table 1). We assume characteristics offorest floors of southeastern Alaska are more similar tothose of the Pacific Northwest than of interior Alaska(Figure 1).
Model-Based Estimates of ForestFloor Carbon
Most published values for forest floor mass were reportedin dry weight. About 20 percent of the values werereported as carbon mass per unit area, with another 20percent reporting in terms of organic matter (that is, ash-free weight). We converted all values to megagram carbonper hectare based on ratios identified in the dataset, whichwere consistent with other reported values (Perala andAlban 1982b; Vitousek and others 1982; Huntington andothers 1989; Cromack and others 1999; Vose and others1999). Organic matter was converted to carbon by
South
WestInterior
Pacific
North
Northwest
Alaska
South
WestInterior
Pacific
North
Northwest
Alaska
Figure 1.—Regions used to classify forest types. Note that Alaska is not drawn to scale.

7
multiplying by 0.55. Mass of carbon per unit dry mass islikely to vary by region, forest type and layer or state ofdecomposition. Specific carbon contents reported in ourdataset did show distinct layer effects. However, therewere too few sites that included separate layers tocalculate averages on this basis. The layers were pooled foraverage forest floor values of the subset of the data thatincluded specific carbon content. No general trendsemerged among regional averages or between conifers andhardwoods (Table 2). We multiplied dry weight by 0.37,a ratio obtained from our dataset, to estimate forest floorcarbon.
Mean forest floor carbon for mature forests is shown inTable 1. Standard deviation, sample size, minimum andmaximum values also are presented to show availabilityand variability in the data. The mature values representthe averages where age was greater than 90 percent of theminimum age set for mature forest floors or sites wherethe researchers described the stand as mature. The ratio offorest floor mass to mass of annual input to the forest
floor, or mean residence time as described above, isprovided in Table 3. The classification system and meanvalues for forest floor carbon mass generally are consistentwith those reported by Birdsey (1992, 1996).
Latitude or Elevation Effects
Many published values included site-specific informationsuch as latitude and elevation. The expected associationwith accumulation of forest floor made these variablescandidates for an additional level of classification. Thisinformation was included with about one-third of theobservations identified as mature forest floors. Otherreports included enough information about location thatallowed us to estimate latitude. If the local topographywas relatively flat, we also estimated elevation.Preliminary regression analyses found that neither latitudenor elevation was a useful predictor of forest floor carbonwith the set of values we had obtained. Thus, latitude andelevation were not included in our model. Latitude andelevation are, however, included in the appendix of
Table 1.—Mean forest floor carbon by region and forest type for forests identified as mature.
Region and forest type Carbon Standard Sample Minimum Maximumdeviation size
(Mg/ha) (Mg/ha) (Mg/ha) (Mg/ha)
Northpine 13.8 4.6 13 5.4 19.8spruce, fir, hemlock 33.7 23.2 6 4.6 68.1mixed conifer-hardwood 29.7 26.6 5 5.4 75.0aspen-birch 10.2 6.2 13 2.3 20.9maple-beech-birch 27.7 17.8 28 2.8 89.5mixed hardwood, oak 8.2 7.3 33 2.8 34.1
Southpine 12.2 4.6 28 1.4 21.9mixed conifer-hardwood 10.3 3.6 6 6.7 16.8mixed hardwood, oak-hickory 6.0 5.7 20 0.8 24.8
Pacific NorthwestDouglas-fir, western hemlock 27.5 31.3 69 2.6 165.6fir-hemlock, higher elevation 29.5 16.3 7 16.8 55.3hardwood 9.3 7.6 4 0.9 16.9
Westpine 24.1 12.2 29 3.3 46.0redwood, sequoia 62.2 31.3 3 35.9 96.9pinyon, juniper 21.1 1.6 2 20.0 22.2mixed conifer 37.2 11.5 24 23.3 73.9hardwood 31.7 14.1 11 4.7 51.1
Interior Alaskaa
all mature 32.2 19.1 13 14.2 73.3aData for interior Alaska were few and showed no age effect; therefore, values represent all observations, not asubset determined by age.

8
Table 2.—Summary of specific carbon content of entire forest floor, all layers groupedtogether. Values are sorted according to general type or region and were taken fromobservations extracted from literature (see Table A1).
Forest type or region Ratio of carbon mass to total dry massMean Standard deviation Sample size
All values 0.370 0.0601 59
conifer 0.365 0.0525 27hardwood 0.361 0.0603 22mixed 0.402 0.0737 10
North 0.376 0.0490 26South 0.368 0.0834 14Pacific Northwest 0.355 0.0618 13West 0.379 0.0427 6
Table 3.—Mean residence time in years (forest floor mass divided by annual biomass input) forentire forest floor. Values reported as carbon, organic matter, or dry weight were pooled forthese averages. Values are sorted according to general type or region and were taken fromobservations extracted from literature (see Table A1).
Region and forest type Mean residence Standard Sample Minimum Maximumtime deviation size
(years) (years)
Northconifer 8.4 6.02 18 3.2 29.1hardwood 9.2 9.49 26 1.1 35.8
Southconifer 3.8 3.15 19 0.9 13.7hardwood 3.2 1.92 16 0.4 6.3
Pacific Northwestconifer 16.0 17.44 59 0.9 80.0hardwood 3.4 0.55 4 2.9 4.2
Westconifer 24.1 16.04 22 8.7 60.0hardwood 19.8 11.95 2 11.4 28.3
Alaskaconifer 433.0 201.0 3 220.0 620.0hardwood 24.5 5.46 5 19.7 33.2

9
observations because of their expected usefulness insimulation modeling.
Simulation Based on Stand Age
Our model is in two parts: net accumulation and decay.Net accumulation of forest floor carbon mass withincreasing age is represented as a simple model construct.Basic conditions for the model are that it passes throughthe origin, represents continuous net accumulation withage, and rate of accumulation decreases so that the lineapproaches an asymptote. We model net accumulation offorest floor carbon mass according to the followingrelationship:
Age is stand age in years, and A and B are coefficientsdescribing the line relating age and forest floor carbon mass.
This relationship conforms to our conceptual model. Thecoefficients are assigned according to the basicassumptions discussed above. We assume minimum agesrepresent mature forest floors and that means ofpublished values are representative of mature forests. Weset the upper limit for the model at the 95th percentile ofvalues for forest floor carbon mass. This is the valueassigned to coefficient A. Since average carbon mass formature forest floor represents all ages, we expect the lineto pass below the ordered pair for mature forests:(minimum age, mean carbon mass). Preliminaryregression analysis for northern hardwoods and southernpines (where many values were available) identified themean carbon mass at a point approximately 30 percentgreater than the assigned minimum age. Therefore, wemodel the relationship as passing through the orderedpair (minimum age × 1.33, mean carbon mass). Valuesfor coefficients A and B are provided in Table 4.
Table 4.—Coefficients to define modeled relationship between forest age and forest floor carbon mass(Mg/ha) for each combination of forest type by region. Columns A and B define net accumulationwith age, and C and D describe the decay curve. Regrowth is the sum of accumulation and decay.
Forest type Accumulation: Decay:
A B Ca Da
Northpine 19.1 25.6 13.8 8.4spruce, fir, hemlock 62.9 57.8 33.7 8.4mixed conifer-hardwood 65.0 79.5 29.7 8.4aspen-birch 18.4 53.7 10.2 9.2maple-beech-birch 50.4 54.7 27.7 9.2mixed hardwood, oak 24.9 134.2 8.2 9.2
Southpine 20.4 27.1 12.2 3.8mixed conifer-hardwood 15.4 20.1 10.3 3.8mixed hardwood, oak-hickory 15.3 61.8 6.0 3.2
Pacific NorthwestDouglas-fir, Western Hemlock 87.5 116.7 27.5 16.0fir-hemlock, higher elevation 53.9 44.3 29.5 16.0hardwood 16.5 41.1 9.3 3.4
Westpine 43.9 87.3 24.1 24.1redwood, sequoia 92.6 52.1 62.2 24.1pinyon, juniper 21.1mixed conifer 53.6 47.0 37.2 24.1hardwood 50.1 62.0 31.7 19.8
aValues in Columns C and D are from Tables 1 and 3, respectively.
A age
B age
×+ C e
age
D×−
Forest floor carbon (Mg/ha) = ×+
A age
B age

10
The model for the decay line is based on the averageforest floor of mature forests and regional averages forapparent decay rates. Forest floor carbon mass followingclearcutting is assumed to begin at the mature forestfloor level of carbon. Decay of forest floor mass existingprior to the clearcut is described as an exponentialfunction of years and mean residence time:
Coefficient C is average mature forest floor carbon massfrom Table 1, coefficient D is the mean residence timefrom Table 3, and e is the exponential function. Valuesfor coefficients C and D are provided in Table 4.
Total carbon mass during regrowth is the sum ofestimates from the two models — accumulation anddecay — defined in Table 4. Examples of simulatedaccumulation, decay, and totals are shown in Figure 2.
Application of Estimators
Summaries in Tables 1 and 4 provide estimates of forestfloor carbon mass per unit area for region by forest typedefinitions without and with the added influence of age,respectively. Many, but not all, forest inventorysummaries provide age or disturbance history. However,total area is common to all forest inventory data and isan essential part of carbon budgets. Estimates presentedhere complement area and age information. The totalcarbon pool is the sum across all ages and areas.
Forest types defined for Tables 1 through 4 are based ondata available in the literature. Determining estimatorsfor all forest types entails establishing a reasonably closematch of types when necessary. For example, northernmaple-beech-birch values were combined with meanresidence times for northern hardwoods to estimateforest floor response to regrowth. Similarly, thesummaries in Tables 1 and 4 must be linked to forestinventory types to estimate total carbon pool sizes.
Forest Floor Carbon Poolof the United States
Total carbon estimates were based on forest inventorydata (Smith and others 2001). The database is acompilation of extensive forest inventory data for theUnited States. We applied the model summarized inTable 4 to the 1997 forest inventory database. Theresulting estimate of forest floor carbon mass density(megagram per hectare), averaged over all forest types
Residual forest floor carbon (Mg/ha) = ×−
C e
age
D
Figure 2.—Examples of forest floor carbon estimated as afunction of stand age for three forest types. Diamondsrepresent observations with age, and x’s represent observationsnot linked to a specific forest age but identified simply asmature. The lower solid line represents estimated forest floorcarbon with afforestation. The dashed line is an estimated pathof decay following clearcut harvesting. The upper solid linerepresents net accumulation during regrowth and is the sumof afforestation and decay lines. The open circle represents theaverage mature forest floor value from Table 1.
0
20
40
60
80
0 40 80 120
Stand age (years)
Mg
C /
ha
North, maple-beech-birch
0
10
20
30
0 25 50 75
Stand age (years)
Mg
C /
ha
South, pine
0
25
50
0 50 100 150 200 250
Stand age (years)
Mg
C /
ha
West, pine

11
0 10 20 30 40
North
South
West
Pacific Northwest
Alaska (entire state)
Forest floor carbon (Mg/ha)
0 500 1000 1500 2000 2500
North
South
West
Pacific Northwest
Alaska (entire state)
Forest floor carbon (Mt)
per region and totals, are shown in Figure 3.Approximately 4.5 Gt carbon is stored in the forest floorcarbon pool in the 48 contiguous United States.
Forest floor carbon data should become increasinglyavailable from the annualized USDA Forest Service ForestInventory & Analysis Program. Assembling a databasethat can be readily reclassified and resorted is a quick and
Figure 3.—Total (A) and average forest floor carbon per hectare (B) by regionof the U.S., 1997.
A
B
simple approach to developing empirical estimates offorest floor carbon, which can be easily updated andrevised. This accomplished the goal of tractable andtransparent carbon estimates for U.S. forests, whichfocuses on actual rather than potential vegetation.Estimates are not restricted to any single form. The resultsprovide flexible, transparent forest floor carbon estimatorsfor U.S. forests.

12
Literature CitedAlban, D.H. 1977. Influence on soil properties of
prescribed burning under mature red pine. Res. Pap.NC-139. St. Paul, MN: U.S. Department ofAgriculture, Forest Service, North Central ForestExperiment Station. 8 p.
Alban, D.H.; Host, G.E.; Elioff, J.D.; Shadis, D.A. 1994.Soil and vegetation response to soil compaction andforest floor removal after aspen harvesting. Res. Pap.NC-315. St. Paul, MN: U.S. Department ofAgriculture, Forest Service, North Central ForestExperiment Station. 8 p.
Alban, D.H.; Perala, D.A. 1990. Ecosystem carbonfollowing aspen harvesting in the upper GreatLakes. In: Adams, R.D., ed. Proceedings ofsymposium: Aspen Symposium ’89; 1989 July 25-27;Duluth, MN. Gen. Tech. Rep. NC -140. St. Paul,MN: U.S. Department of Agriculture, Forest Service,North Central Forest Experiment Station: 123-131.
Bell, R.L.; Binkley, D. 1989. Soil nitrogenmineralization and immobilization in response toperiodic prescribed fire in a loblolly pineplantation. Canadian Journal of Forest Research. 19:816-820.
Berg, B.; Ekbohm, G.; Johansson, M.B.; McClaugherty,C.; Rutigliano, F.; De Santo, A.V. 1996. Maximumdecomposition limits of forest litter types: asynthesis. Canadian Journal of Botany. 74: 659-672.
Binkley, D. 1995. The influence of tree species onforest soils: processes and patterns. In: SpecialPublication 10, Wellington, New Zealand: AgronomySociety of New Zealand. 1-33.
Binkley, D.; Sollins, P.; Bell, R.; Sachs, D.; Myrold, D.1992. Biogeochemistry of adjacent conifer andalder-conifer stands. Ecology. 73: 2022-2033.
Birdsey, R.A. 1992. Carbon storage and accumulationin United States forest ecosystems. Gen. Tech. Rep.WO-59. Washington, DC: U.S. Department ofAgriculture, Forest Service. 51 p.
Birdsey, R.A. 1996. Carbon storage for major foresttypes and regions in the coterminous United States.In: Sampson, R.N.; Hair, D., eds. Forests and globalchange: Forest management opportunities formitigating carbon emissions. Washington, DC:American Forests: 1-25.
Birdsey, R.A.; Heath, L.S. 1995. Carbon changes in U.S.forests. In: Joyce, L.A., ed. Productivity of America’sforests and climate change. Gen. Tech. Rep. RM-271.Fort Collins, CO: U.S. Department of Agriculture,Forest Service, Rocky Mountain Forest and RangeExperiment Station: 56-70.
Clinton, B.D.; Vose, J.M.; Swank, W.T. 1996. Shifts inaboveground and forest floor carbon and nitrogenpools after felling and burning in the southernAppalachians. Forest Science. 42: 431-441.
Cole, D.W.; Rapp, M. 1981. Elemental cycling in forestecosystems. In: Reichle, D.E., ed. Dynamic propertiesof forest ecosystems. Cambridge, UK: CambridgeUniversity Press: 341-409.
Covington, W.W. 1981. Changes in forest floor organicmatter and nutrient content following clear cuttingin northern hardwoods. Ecology. 62: 41-48.
Covington, W.W.; Aber, J.D. 1980. Leaf productionduring secondary succession in northernhardwoods. Ecology. 61: 200-204.
Cromack, K.; Miller, R.E.; Helgerson, O.T.; Smith, R.B.;Anderson, H.W. 1999. Soil carbon and nutrients ina coastal Oregon Douglas-fir plantation with redalder. Soil Science Society of America Journal. 63:232-239.
Dyrness, C.T.; Van Cleve, K.; Levison, J.D. 1989. Theeffect of wildfire on soil chemistry in four foresttypes in interior Alaska. Canadian Journal of ForestResearch. 19: 1389-1396.
Edmonds, R.L.; Chappell, H.N. 1994. Relationshipsbetween soil organic matter and forest productivityin western Oregon and Washington. CanadianJournal of Forest Research. 24: 1101-1106.
Fassnacht, K.S.; Gower, S.T. 1999. Comparison of thelitterfall and forest floor organic matter andnitrogen dynamics of upland forest ecosystems innorth central Wisconsin. Biogeochemistry. 45: 265-284.
Federer, C.A. 1982. Subjectivity in the separation oforganic horizons of the forest floor. Soil ScienceSociety of America Journal. 46: 1090-1093.
Federer, C.A. 1984. Organic matter and nitrogencontent of the forest floor in even-aged northernhardwoods. Canadian Journal of Forest Research. 14:763-767.

13
Finzi, A.C.; Van Breemen, N.; Canham, C.D. 1998.Canopy tree-soil interactions within temperatureforests: species effects on soil carbon and nitrogen.Ecological Applications. 8: 440-446.
Fried, J.S.; Boyle, J.R.; Tappeiner, J.C.I.; Cromack, K.J.1990. Effects of bigleaf maple on soils in Douglas-fir forests. Canadian Journal of Forest Research. 20:259-266.
Gholz, H.L.; Perry, C.S.; Cropper, W.P.J.; Hendry, L.C.1985. Litterfall, decomposition, and nitrogen andphosphorus dynamics in a chronosequence of slashpine (Pinus elliottii) plantations. Forest Science. 31:463-478.
Grigal, D.F.; Ohmann, L.F. 1992. Carbon storage inupland forests of the Lake States. Soil ScienceSociety of America Journal. 56: 935-943.
Heath, L.S.; Birdsey, R.A. 1993. Carbon trends ofproductive temperate forests of the coterminousUnited States. Water, Air, and Soil Pollution. 70: 279-293.
Heath, L.S.; Birdsey, R.A.; Row, C.; Plantinga, A.J. 1996.Carbon pools and flux in U.S. forest products. In:Apps, M.J.; Price, D.T., eds. Forest Ecosystems, ForestManagement, and the Global Carbon Cycle. Berlin,Germany: Springer Verlag: 271-278.
Heath, L.S.; Smith, J.E. 2000. An assessment ofuncertainty in forest carbon budget projections.Environmental Science and Policy. 3: 73-82.
Hendrickson, O.Q.; Chatarpaul, L.; Burgess, D. 1989.Nutrient cycling following whole-tree andconventional harvest in northern mixed forest.Canadian Journal of Forest Research. 19: 725-735.
Homann, P.S.; Grigal, D.F. 1996. Below-ground organiccarbon and decomposition potential in a field-forest glacial-outwash landscape. Biology andFertility of Soils. 23: 207-214.
Hough, W.A. 1982. Phytomass and nutrients in theunderstory and forest floor of slash/longleaf pinestands. Forest Science. 28: 359-372.
Huntington, T.G.; Johnson, C.E.; Johnson, A.H.;Siccama, T.G.; Ryan, D.F. 1989. Carbon organicmatter and bulk density relationships in a forestedspodosol. Soil Science. 148: 380-386.
Hyvonen, R.; Agren, G.I.; Bosatta, E. 1998. Predictinglong-term soil carbon storage from short-terminformation. Soil Science Society of America Journal.62: 1000-1005.
Johnson, C.E.; Driscoll, C.T.; Fahey, T.J.; Siccama, T.G.;Hughes, J.W. 1995. Carbon dynamics followingclear-cutting of a northern hardwood forest. In:McFee, W.W.; Kelly, J.M., eds. Carbon forms andfunctions in forest soils. Madison, WI: Soil ScienceSociety of America: 463-488.
Johnson, C.E.; Johnson, A.H.; Huntington, T.G.;Siccama, T.G. 1991. Whole-tree clear-cutting effectson soil horizons and organic-matter pools. SoilScience Society of America Journal. 55: 497-502.
Johnson, C.M.; Zarin, D.J.; Johnson, A.H. 2000. Post-disturbance aboveground biomass accumulation inglobal secondary forests. Ecology. 81: 1395-1401.
Lang, G.E.; Forman, R.T.T. 1978. Detrital dynamics ina mature oak forest: Hutcheson Memorial Forest,New Jersey. Ecology. 59: 580-595.
Liechty, H.O.; Jurgensen, M.F.; Mroz, G.D.; Gale, M.R.1997. Pit and mound topography and its influenceon storage of carbon, nitrogen, and organic matterwithin an old-growth forest. Canadian Journal ofForest Research. 27: 1992-1997.
Little, S.N.; Ohmann, J.L. 1988. Estimating nitrogenlost from forest floor during prescribed fires inDouglas-fir/western hemlock clearcuts. ForestScience. 34: 152-164.
Lockaby, B.G.; Taylor-Boyd, J.E. 1986. Nutrientdynamics in the litter fall and forest floor of an 18-year-old loblolly pine plantation. Canadian Journalof Forest Research. 16: 1109-1112.
Mattson, K.G.; Smith, H.C. 1993. Detrital organicmatter and soil CO2 efflux in forests regeneratingfrom cutting in West Virginia. Soil Biology andBiochemistry. 25: 1241-1248.
McClaugherty, C.A.; Pastor, J.; Aber, J.D.; Melillo, J.M.1985. Forest litter decomposition in relation to soilnitrogen dynamics and litter quality. Ecology. 66:266-275.
Means, J.E.; MacMillan, P.C.; Cromack, K.J. 1992.Biomass and nutrient content of Douglas-fir logsand other detrital pools in an old-growth forest,

14
Oregon, U.S.A. Canadian Journal of Forest Research.22: 1536-1546.
Nemeth, J.C. 1973. Dry matter production in youngloblolly (Pinus teada L.) and slash pine (Pinuselliottii Engelm.) plantations. EcologicalMonographs. 43: 21-41.
Olsson, B.A.; Staaf, H.; Lundkvist, H.; Bengtsson, J.;Rosen, K. 1996. Carbon and nitrogen in coniferousforest soils after clear-felling and harvests ofdifferent intensity. Forest Ecology and Management.82: 19-32.
Perala, D.A.; Alban, D.H. 1982a. Biomass, nutrientdistribution and litterfall in Populus, Pinus andPicea stands on two different soils in Minnesota.Plant and Soil. 64: 177-192.
Perala, D.A.; Alban, D.H. 1982b. Rates of forest floordecomposition and nutrient turnover in aspen,pine, and spruce stands on two different soils. Res.Pap. NC-227. St Paul, MN: U.S. Department ofAgriculture, Forest Service, North Central ForestExperiment Station. 5 p.
Plantinga, A.J.; Birdsey, R.A. 1993. Carbon fluxesresulting from US private timberland management.Climatic Change. 23: 37-53.
Rollinger, J.L.; Strong, T.F.; Grigal, D.F. 1998. Forestedsoil carbon storage in landscapes of the NorthernGreat Lakes Region. In: Lal, R.; Kimble, J.M.; Follett,R.F.; Stewart, B.A., eds. Management of carbonsequestration in soil. Boca Raton, FL: CRC Press: 335-350.
Rotter, J.; Danish, K. 2000. Forest carbon and theKyoto Protocol’s clean development mechanism.Journal of Forestry. 98: 38-47.
Ryan, D.F.; Huntington, T.G.; Martin, C.W. 1992.Redistribution of soil nitrogen, carbon and organicmatter by mechanical disturbance during whole-tree harvesting in northern hardwoods. ForestEcology and Management. 49: 87-99.
Schiffman, P.M.; Johnson, W.C. 1989. Phytomass anddetrital carbon storage during forest regrowth inthe southeastern United States Piedmont. CanadianJournal of Forest Research. 19: 69-78.
Schlesinger, W.H. 1977. Carbon balance in terrestrialdetritus. Annual Review of Ecology and Systematics.8: 51-81.
Simmons, J.A.; Fernandez, I.J.; Briggs, R.D.; Delaney,M.T. 1996. Forest floor carbon pools and fluxesalong a regional climate gradient in Maine, USA.Forest Ecology and Management. 84: 81-95.
Skog, K.E.; Nicholson, G.A. 1998. Carbon cyclingthrough wood products: the role of wood and paperproducts in carbon sequestration. Forest ProductsJournal. 48: 75-83.
Smith, J.E.; Heath, L.S. 2000. Considerations forinterpreting probabilistic estimates of uncertaintyof forest carbon. In: Joyce, L.; Birdsey, R., eds. TheImpact of Climate Change on America’s Forests. Gen.Tech. Rep. RMRS-GTR-59. Fort Collins, CO: U.S.Department of Agriculture, Forest Service, RockyMountain Research Station: 102-111.
Smith, F.W.; Resh, S.C. 1999. Age-related changes inproduction and below-ground carbon allocation inPinus contorta forests. Forest Science. 45: 333-341.
Smith, W.B.; Vissage, J.S.; Darr, D.R.; Sheffield, R.M.2001. Forest resources of the United States, 1997.Gen. Tech. Rep. NC-219. St. Paul, MN: U.S.Department of Agriculture, Forest Service, NorthCentral Research Station. 190 p.
Strong, T.F. 1997. Harvesting intensity influences thecarbon distribution in a northern hardwoodecosystem. Res. Pap. NC-329. St. Paul, MN: U.S.Department of Agriculture, Forest Service, NorthCentral Research Station. 7 p.
Snyder, K.E.; Harter, R.D. 1987. Forest floor dynamicsin even-aged northern hardwood stands. SoilScience Society of America Journal. 51: 1381-1383.
Switzer, G.K.; Shelton, M.G.; Nelson, L.E. 1979.Successional development of the forest floor andsoil surface on upland sites of the east gulf coastalplain. Ecology. 60: 1162-1171.
Tans, P.P.; White, J.W.C. 1998. The global carbon cycle:in balance, with a little help from the plants.Science. 281: 183-184.
Turner, J.; Long, J.N. 1975. Accumulation of organicmatter in a series of Douglas-fir stands. CanadianJournal of Forest Research. 5: 681-690.
U.S. Department of State. 2000. U.S. Submission toUNFCCC on Land-Use, Land-Use Change, andForestry. <http://www.state.gov/www/global/

15
global_issues/climate/climate_2000_submiss.html> (5April 2002).
Vitousek, P.M.; Gosz, J.R.; Grier, C.C.; Melillo, J.M.;Reiners, W.A. 1982. A comparative analysis ofpotential nitrification and nitrate mobility in forestecosystems. Ecological Monographs. 52: 155-177.
Vogt, K.A.; Grier, C.C.; Vogt, D.J. 1986. Production,turnover, and nutrient dynamics of above- andbelowground detritus of world forests. Advances inEcological Research. 15: 303-377.
Vogt, K.A.; Vogt, D.J.; Brown, S.; Tilley, J.P.; Edmonds,R.L.; Silver, W.L.; Siccama, T.G. 1995. Dynamics offorest floor and soil organic matter accumulation inboreal, temperate, and tropical forests. In: Lal, R.;Kimble, J.; Levine, E.; Stewart, B.A., eds. Soilmanagement and greenhouse effect. Boca Raton, FL:CRC Lewis Publishers: 159-178.
Vogt, K.A.; Vogt, D.J.; Palmiotto, P.A.; Boon, P.; O‘Hara,J.; Asbjornsen, H. 1996. Review of root dynamics inforest ecosystems grouped by climate, climaticforest type and species. Plant and Soil. 187: 159-219.
Vose, J.M.; Swank, W.T.; Clinton, B.D.; Knoepp, J.D.;Swift, L.W. 1999. Using stand replacement fires torestore southern Appalachian pine-hardwoodecosystems: effects on mass, carbon, and nutrientpools. Forest Ecology and Management. 114: 215-226.
Waring, R.; Schlesinger, W. 1985. Forest ecosystems:concepts and management. Orlando, FL: AcademicPress. 340 p.
Yanai, R.D.; Arthur, M.A.; Siccama, T.G.; Federer, C.A.2000. Challenges of measuring forest floor organicmatter dynamics: Repeated measures from achronosequence. Forest Ecology and Management.138: 273-283.

16
Appendix
Table A1.—Forest floor carbon mass values obtained from literature.
Column headings:R Regions used for summarizing values (see Figure 1)C Carbon mass used for each observation, Mg C per hectareff Form of forest floor mass for each observation: c, as carbon; o, as ash-free organic matter converted to
carbon by multiplying by 0.55; and d, as dry weight converted to carbon by multiplying by 0.37T Forest type assigned for use in our analysis (see Tables A2, 1, and 4)D Summary of forest composition from publicationL State, province, or region (LS=Lake States, IM=Intermountain)A Years since major disturbance, or: m if information suggested mature; y, if information suggested not yet
mature; and blank indicates that information was not provided but these were assumed to be matureLa Latitude, degrees northLo Longitude, degrees westE Elevation (km)c:dw Ratio of forest floor carbon mass to dry weight, if givenmrt Mean residence time of forest floor, in years (forest floor biomass divided by annual biomass input)rf Form of biomass in mrt, if reported: c, as carbon; o, as ash-free organic matter; and d, as dry weightcite Citation
R C ff T D L Aa Laa Loa Ea c:dw mrt rf citeb
(Mg/ha) (years) (km) (years)
N p jack pine LS 0.35 99N p red pine LS 0.35 99N 4.5 d p jack pine MN 47 0.4 5.7 138N 9.6 d p jack pine MN 47 0.4 12.5 138N 8.9 d p jack pine MN 47 0.4 11.9 138N 11.5 d p pine MN 47 0.4 13.6 138N 7.7 d p white pine MN 47 0.4 10.4 138N 15.4 d p pine MA 53 42 0.4 7.8 139N 14.4 o p red pine plantation MN 90 2N 16.5 o p red pine MN m 47 95 0.4 5N 18.2 o p jack pine MN m 47 95 0.4 5N 11.4 o p red pine plantation WI 37 44 90 0.4 18N 10.1 o p red pine plantation WI 37 44 90 0.4 18N 9.7 d p jack pine plantation LS 15-43 22N 13.6 d p red pine plantation LS 21-180 22N 13.0 d p jack pine MN m 48 92 0.5 45N 18.6 d p jack pine MN m 48 92 0.5 45N 16.0 c p jack pine LS 50N 14.0 c p red pine LS 50N 13.1 d p jack pine North 83 83, vN 16.0 o p white pine MA 34-96 42 72 0.1 85N 5.5 o p white pine WI m 43 40 0.3 3.2 o 90N 16.9 c p jack pine MN 39 47 95 0.4 5.8 c 104N 13.5 c p jack pine MN 41 47 95 0.4 5.5 c 104N 15.8 c p red pine MN 39 47 95 0.4 4.7 c 104N 14.9 c p red pine MN 41 47 95 0.4 5.2 c 104N 22.9 c p red pine plantation LS 105, 112N 12.1 c p pine plantation IL 111, 114
Continued

17
N 5.4 d p red pine MN m 47 93 0.4 4.1 d 126N 19.8 c p red pine plantation MA 55 43 72 0.4 0.32 8.5 d 136N 7.6 c p shortleaf pine plantation IN 33 39 86 0.2 0.44 3.5 d 136N sf balsam fir LS 0.36 99N 18.2 o sf spruce MN m 47 95 0.4 5N 21.1 d sf hemlock MI, WI m 46 89 0.5 17N 35.5 d sf spruce - fir North 8 28, vN 35.5 d sf spruce - fir North 8 28, vN 45.9 d sf spruce - fir North 8 28, vN 42.2 d sf spruce - fir North 8 28, vN 41.3 c sf hemlock CT 42 73 0.4 38N 23.0 c sf balsam fir LS 50N 68.1 o sf eastern hemlock MI m 46 89 0.5 57N 43.0 c sf balsam fir NH m 44 72 1.3 0.38 76N 4.6 o sf hemlock WI m 43 40 0.3 6.5 o 90N 17.6 c sf spruce MN 39 47 95 0.4 7 c 104N 14.1 c sf spruce MN 41 47 95 0.4 5.8 c 104N 46.5 o sf fir NH 44 72 1.4 108N 54.3 o sf fir NH 44 72 1.4 108N 54.5 o sf fir NH 44 72 1.4 108N 64.4 o sf fir NH 44 72 1.4 108N 66.6 o sf fir NH 44 72 1.4 108N 45.5 o sf spruce fir NH 44 72 1.0 108N 47.0 c sf balsam fir NH 75 44 72 1.2 0.4 29.1 d 136N 5.4 d mx mixed, oak-pine RI m 42 72 0.1 20N 7.3 o mx mixed WI 35N 18.4 o mx conifer - hardwood ON m 45 77 0.2 56N 22.1 o mx conifer - hardwood ON 3 45 77 0.2 56N 18.0 o mx conifer - hardwood ON 3 45 77 0.2 56N 75.0 c mx hemlock - hardwood MI m 46 87 0.3 0.39 79N 25.0 c mx aspen, jack pine North m 112N 24.4 c mx oak - pine MA 65 42 70 0.0 0.42 13.8 d 136N ab aspen LS 0.32 99N 2.3 d ab paper birch MN 45 0.4 2.3 138N 14.9 o ab aspen MN m 47 95 0.4 5N 20.9 d ab aspen MI 47 47 89 0.5 4N 7.0 d ab aspen MN 60 47 93 0.4 4N 16.8 d ab aspen MN 66 47 95 0.4 4N 16.6 c ab aspen MN 70 48 94 0.4 3N 13.4 c ab aspen MN 70 48 94 0.4 3N 10.7 d ab aspen - birch North 8, 20N 15.0 c ab aspen LS 50N 11.8 d ab aspen North 81 83, vN 2.9 o ab aspen WI m 43 40 0.3 1.6 o 90N 3.1 d ab aspen WI m 46 90 0.5 1.8 d 102N 13.5 c ab aspen MN 40 47 95 0.4 6.7 c 104N 11.6 c ab aspen MN 49 47 95 0.4 6.1 c 104N 5.7 d ab trembling aspen WI 8 45 90 0.4 113N 6.3 d ab trembling aspen WI 14 45 90 0.4 113
Table A1.—Continued
Continued
R C ff T D L Aa Laa Loa Ea c:dw mrt rf citeb
(Mg/ha) (years) (km) (years)

18
N 2.7 d ab trembling aspen WI 18 45 90 0.4 113N 6.3 d ab trembling aspen WI 32 45 90 0.4 113N 2.9 d ab trembling aspen WI 63 45 90 0.4 113N 8.6 d ab birch-aspen MI m 48 89 0.2 122N 2.3 d ab birch MN m 47 93 0.4 2 d 126N mb sugar maple LS 0.29 99N 1.9 d mb maple WI 35 43 0.3 1.8 139N 9.8 d mb sugar maple MI, WI 46 89 6, vN 10.8 d mb sugar maple MI, WI 50 46 89 6, vN 18.9 d mb northern hardwood MI, WI m 46 89 0.5 17N 26.4 o mb maple - beech - birch NH 60 44 0.6 8.2 o 25N 35.8 o mb maple - beech - birch NH 1 44 71 0.7 36N 28.6 o mb maple - beech - birch NH 4 44 71 0.7 36N 22.6 o mb maple - beech - birch NH 10 44 71 0.7 36N 27.5 o mb maple - beech - birch NH 13 44 71 0.7 36N 27.0 o mb maple - beech - birch NH 24 44 71 0.7 36N 38.5 o mb maple - beech - birch NH 31 44 71 0.7 36N 25.9 o mb maple - beech - birch NH 34 44 71 0.7 36N 36.3 o mb maple - beech - birch NH 40 44 71 0.7 36N 28.6 o mb maple - beech - birch NH 44 44 71 0.7 36N 46.2 o mb maple - beech - birch NH 70 44 71 0.7 36N 38.5 o mb maple - beech - birch NH 100 44 71 0.7 36N 41.3 o mb maple - beech - birch NH 100 44 71 0.7 36N 52.3 o mb maple - beech - birch NH 100 44 71 0.7 36N 23.1 c mb beech CT 42 73 0.4 38N 21.2 c mb red maple CT 42 73 0.4 38N 12.1 c mb sugar maple CT 42 73 0.4 0.38 38N 25.7 o mb northern hardwood NH 60 44 72 0.7 8.2 o 43N 18.0 c mb sugar maple, hardwood LS 50N 47.0 o mb maple - beech - birch MI m 46 89 0.5 57N 30.0 c mb maple - beech - birch NH 65 44 72 0.6 0.34 61N 31.0 c mb northern hardwood NH m 44 72 0.6 62N 39.0 c mb northern hardwood NH 3 44 72 0.6 62N 22.0 c mb northern hardwood NH 8 44 72 0.6 62N 22.0 c mb northern hardwood MI m 46 87 0.3 0.29 79N 10.8 o mb northern hardwood LS y 86N 12.6 o mb northern hardwood LS m 86N 14.2 o mb northern hardwood LS m 86N 2.8 o mb sugar maple WI m 43 40 0.3 1.3 o 90N 14.9 c mb maple - birch ON 225 47 84 96N 20.2 c mb maple - beech - birch NY 100 44 74 96N 9.2 d mb northern hardwood MI 51 47 89 0.3 97N 14.2 d mb northern hardwood MI 51 47 89 0.3 97N 22.5 d mb northern hardwood MI 49 47 89 0.3 97N 5.4 d mb northern hardwood MI 3 47 89 0.3 97N 6.3 d mb northern hardwood MI 3 47 89 0.3 97N 6.5 d mb northern hardwood MI 3 47 89 0.3 97N 16.8 c mb northern hardwood LS 105, 112N 118.3 o mb northern hardwood NH 44 72 0.7 108
Table A1.—Continued
Continued
R C ff T D L Aa Laa Loa Ea c:dw mrt rf citeb
(Mg/ha) (years) (km) (years)

19
N 42.3 c mb maple - beech - birch ME >80 47 69 0.3 0.37 35.8 c 117N 32.7 c mb maple - beech - birch ME >80 45 68 0.1 0.44 28.7 c 117N 32.8 c mb maple - beech - birch ME >80 44 70 0.2 0.41 26.5 c 117N 27.1 c mb maple - beech - birch ME >80 44 69 0.2 0.34 19 c 117N 89.5 c mb northern hardwood NH 93 44 71 0.7 0.47 120N 72.1 c mb northern hardwood NH 3 44 71 0.7 0.4 120N 37.6 c mb northern hardwood NH 10 44 71 0.7 0.42 120N 39.4 c mb northern hardwood NH 30 44 71 0.7 0.33 120N 3.6 c mb maple IN 95 39 86 0.2 0.37 1.9 d 136N 25.1 c mb northern hardwood NH 66 44 72 0.7 0.43 12.3 d 136N 21.6 c mb maple - beech - birch NH m 44 72 0.7 8.4 c 144N 12.4 d oh oak - maple MA 80 42 0.4 7.6 139N 5.4 d oh black oak MO 20 38 91 0.4 27N 7.4 d oh black oak MO 40 38 91 0.4 27N 1.7 d oh oak WI 43 0.3 1.1 29, 139N 5.1 o oh hardwood WI 35N 30.7 c oh red oak CT 42 73 0.4 38N 12.1 c oh white ash CT 42 73 0.4 38N 16.0 c oh broad leaf deciduous LS 50N 9.2 c oh oak MN 67 45 93 0.2 58N 6.5 c oh oak MN 67 45 93 0.2 58N 4.7 c oh oak MN 67 45 93 0.2 58N 7.3 c oh oak MN 67 45 93 0.2 58N 7.0 c oh oak MN 67 45 93 0.2 58N 7.5 c oh oak MN 67 45 93 0.2 58N 4.4 c oh oak MN 67 45 93 0.2 58N 8.5 c oh upland deciduous MN y 45 93 0.2 64N 4.8 c oh upland deciduous MN y 45 93 0.2 64N 8.4 o oh mixed oak NJ 250 41 0.0 6.2 o 77N 5.8 d oh oak MO 40 38 91 0.4 82N 4.3 d oh hardwood WV 1 40 80 0.6 88N 4.8 d oh hardwood WV m 40 80 0.6 88N 4.1 d oh hardwood WV 2 40 80 0.6 88N 8.1 d oh hardwood WV m 40 80 0.6 88N 2.3 d oh hardwood WV 2 40 80 0.6 88N 5.2 d oh hardwood WV m 40 80 0.6 88N 2.8 d oh hardwood WV 4 40 80 0.6 88N 3.9 d oh hardwood WV m 40 80 0.6 88N 4.6 d oh hardwood WV 4 40 80 0.6 88N 5.9 d oh hardwood WV m 40 80 0.6 88N 6.3 d oh hardwood WV 6 40 80 0.6 88N 5.7 d oh hardwood WV m 40 80 0.6 88N 2.8 d oh hardwood WV 7 40 80 0.6 88N 4.3 d oh hardwood WV m 40 80 0.6 88N 6.5 d oh hardwood WV 7 40 80 0.6 88N 8.8 d oh hardwood WV m 40 80 0.6 88N 2.4 d oh hardwood WV 8 40 80 0.6 88N 6.3 d oh hardwood WV m 40 80 0.6 88N 5.0 d oh hardwood WV 11 40 80 0.6 88
Table A1.—Continued
Continued
R C ff T D L Aa Laa Loa Ea c:dw mrt rf citeb
(Mg/ha) (years) (km) (years)

20
N 7.6 d oh hardwood WV m 40 80 0.6 88N 2.9 d oh hardwood WV 20 40 80 0.6 88N 8.3 d oh hardwood WV m 40 80 0.6 88N 2.3 d oh hardwood WV 20 40 80 0.6 88N 3.5 d oh hardwood WV m 40 80 0.6 88N 5.6 d oh hardwood WV 23 40 80 0.6 88N 4.0 d oh hardwood WV m 40 80 0.6 88N 3.8 d oh hardwood WV 23 40 80 0.6 88N 7.8 d oh hardwood WV m 40 80 0.6 88N 5.3 d oh hardwood WV 23 40 80 0.6 88N 9.1 d oh hardwood WV m 40 80 0.6 88N 3.0 o oh white oak WI m 43 40 0.3 1.8 o 90N 33.7 o oh oak MN 50 45 93 0.2 19 o 107N 34.1 o oh oak MN 50 45 93 0.2 14.1 o 109, 77N 2.8 o oh oak - hickory MO 35-92 39 1.6 o 110, 77N 8.6 c oh oak IN 81 39 86 0.2 0.44 2.9 d 136N 19.0 c oh oak - red maple MA 50 43 72 0.4 0.32 12.2 d 136N 3.8 d oh oak North 115-120 148, vN 3.6 d oh oak North 115-120 148, vN 2.8 d oh oak North 115-120 148, vN 6.9 o conifer WI 35N 17.0 c needle leaf evergreen LS 50N 10.9 c upland conifer MN y 45 93 0.2 64N 100.0 c lowland conifer MN y 45 93 0.2 64N 31.4 c black spruce wetland MI m 46 87 0.3 92N 8.9 c black spruce wetland MI 5 46 87 0.3 92N 12.7 c black spruce wetland MI 5 46 87 0.3 92N 503.3 o cedar swamp MN 100 45 93 0.2 265 o 107N 172.2 o krummholz spruce - fir NH 44 72 1.4 108N 29.9 o krummholz spruce - fir NH 44 72 1.4 108N 47.9 o krummholz spruce - fir NH 44 72 1.4 108N 53.7 o krummholz spruce - fir NH 44 72 1.4 108N 104.0 c lowland deciduous MN y 45 93 0.2 64
S 3.0 d p pine FL 7 3.1 139S 12.2 d p pine FL 27 6.5 139S 6.9 d p loblolly pine SC 34 0.2 3.7 138S 5.4 d p loblolly pine SC 34 0.2 3.4 138S 9.7 d p shortleaf pine SC 34 0.2 7.9 138S 15.1 o p loblolly pine plantation SC 56 33 80 0.0 10S 10.3 o p loblolly pine plantation SC 56 33 80 0.0 10S 9.5 o p loblolly pine plantation SC 56 33 80 0.0 10S 16.3 o p loblolly pine plantation SC 56 13S 14.1 o p loblolly pine plantation SC 56 13S 20.9 o p loblolly pine plantation SC 56 33 80 0.0 14S 1.4 d p longleaf pine South m 31 87 0.1 1.9 d 21S 14.9 o p shortleaf pine TN 30 36 0.3 6.5 o 25S 17.2 d p pine TN 30 36 0.3 13.7 29, 139S 5.3 d p white pine NC 35 0.8 3.9 29, 139
Table A1.—Continued
Continued
R C ff T D L Aa Laa Loa Ea c:dw mrt rf citeb
(Mg/ha) (years) (km) (years)

21
S 7.8 c p loblolly pine TN m 36 84 0.2 0.29 41S 16.1 o p pitch - Virginia pine South 51, vS 13.1 o p pitch - Virginia pine South 51, vS 17.8 o p pitch - Virginia pine South 51, vS 10.1 o p slash pine plantation FL 25 52S 2.2 d p loblolly pine NC 35 0.1 1.2 53, 138S 9.2 c p slash - loblolly pine South 37 60S 9.7 o p slash pine plantation FL 16 31 82 0.0 65S 16.8 c p loblolly pine NC 19 36 79 0.2 4.3 c 66S 19.5 c p loblolly pine NC 40 36 79 0.2 5.1 c 66S 9.0 c p loblolly pine plantation NC 14 36 0.1 3 69S 13.4 d p loblolly pine plantation SC 14 74S 7.3 d p loblolly pine South 7 75, vS 5.8 d p loblolly pine South 7 75, vS 4.1 d p loblolly pine plantation LA 19 32 92 0.1 1.7 d 81S 14.4 o p loblolly pine SC 70 33 80 0.0 91S 7.6 o p longleaf pine AL 65 31 87 0.1 91S 21.9 o p longleaf pine LA 65 32 92 0.0 91S 16.0 o p longleaf - slash pine FL 65 30 82 0.0 91S 7.3 d p loblolly - shortleaf pine South 25 94, vS 13.6 o p loblolly pine VA 16 37 79 0.2 95S 8.3 o p shortleaf pine VA 16 37 79 0.2 95S 9.1 o p Virginia pine VA 16 37 79 0.2 95S 5.9 o p white pine VA 16 37 79 0.2 95S 1.4 d p loblolly - slash pine NC 5 35 77 0.0 98S 1.4 d p loblolly - slash pine NC 7 35 77 0.0 98S 2.1 d p loblolly - slash pine NC 8 35 77 0.0 1.6 98S 2.1 d p loblolly - slash pine NC 10 35 77 0.0 1.6 98S 2.1 d p loblolly - slash pine NC 11 35 77 0.0 1.6 98S 10.5 d p slash pine GA 22 32 84 0.2 103S 1.6 c p loblolly & Virginia pine VA 1 38 78 0.1 114S 1.7 c p loblolly & Virginia pine VA 2 38 78 0.1 114S 5.1 c p loblolly & Virginia pine VA 3 38 78 0.1 114S 3.5 c p loblolly & Virginia pine VA 5 38 78 0.1 114S 6.1 c p loblolly & Virginia pine VA 8 38 78 0.1 114S 4.8 c p loblolly & Virginia pine VA 11 38 78 0.1 114S 9.1 c p loblolly & Virginia pine VA 14 38 78 0.1 114S 8.6 c p loblolly & Virginia pine VA 17 38 78 0.1 114S 7.3 c p loblolly & Virginia pine VA 20 38 78 0.1 114S 10.4 c p loblolly & Virginia pine VA 23 38 78 0.1 114S 10.1 c p loblolly & Virginia pine VA 26 38 78 0.1 114S 16.2 c p loblolly & Virginia pine VA 25 38 78 0.1 114S 7.4 c p loblolly & Virginia pine VA 32 38 78 0.1 114S 7.6 c p loblolly & Virginia pine VA 34 38 78 0.1 114S 8.8 c p loblolly & Virginia pine VA 35 38 78 0.1 114S 11.8 c p loblolly & Virginia pine VA 36 38 78 0.1 114S 11.8 c p loblolly & Virginia pine VA 40 38 78 0.1 114S 14.5 c p loblolly & Virginia pine VA 46 38 78 0.1 114S 9.3 c p loblolly & Virginia pine VA 47 38 78 0.1 0.38 114
Table A1.—Continued
Continued
R C ff T D L Aa Laa Loa Ea c:dw mrt rf citeb
(Mg/ha) (years) (km) (years)

22
S 10.4 o p loblolly pine NC 55 36 79 115S 8.9 o p loblolly pine NC 55 36 79 115S 11.7 o p loblolly pine NC 55 36 79 115S 5.6 d p loblolly pine plantation MS 18 124, 81S 9.7 c p pine MS 25 33 89 0.1 125S 10.3 c p pine MS 40 33 89 0.1 125S 6.9 d p loblolly pine plantation SC 17 132S 7.7 d p loblolly pine plantation SC 18 134, 81S 11.1 d p loblolly pine plantation NC 16 143, 81S 6.1 d p loblolly pine South 12 146S 9.6 c mx conifer - hardwood NC, TN m 36 84 0.9 0.24 41S 16.8 c mx pine - hardwood NC, TN m 36 84 1.7 0.32 94, vS 6.7 d mx hardwood - pine South 40 125S 7.6 c mx mixed MS 200 33 89 0.1 125S 9.6 c mx pine - hardwood MS 130 33 89 0.1 125S 11.3 c mx pine - hardwood MS 65 33 89 0.1 140S 14.3 c mx pine - hardwood NC 35 84 1.4 0.46 140S 16.4 c mx pine - hardwood NC 35 84 1.4 0.41 140S 12.6 c mx pine - hardwood NC 35 84 1.4 0.39 141S 19.8 c mx pine - hardwood NC 35 84 1.4 0.46 141S 10.6 c mx pine - hardwood NC 35 84 1.4 0.46 141S 8.7 c mx hickory NC 35 84 1.4 0.46 138S 3.3 d hw oak SC 34 0.2 1.9 138S 5.4 d hw yellow poplar SC 34 0.2 3.7 138S 5.0 d hw mixed hardwood SC 34 0.2 3.2 139S 3.3 d hw Nyssa - Acer VA 78 1.4 139S 2.4 d hw oak - hickory VA 52 1 11S 4.2 d hw oak - hickory NC m 35 84 0.9 11S 4.3 d hw oaks NC m 35 84 0.9 16, 77S 2.3 o hw Liriodendron TN 75 36 25S 3.3 o hw Liriodendron, hardwood TN 50 36 0.2 1.4 o 25S 0.8 o hw oak - hickory TN 30-80 36 0.3 0.4 o 25S 14.9 o hw chestnut oak TN 30-80 36 0.3 5.6 o 25S 13.8 o hw oak - hickory TN 30-80 36 0.3 5.6 o 25S 5.2 o hw Liriodendron NC 60-200 35 0.8 2.2 o 29, 139S 8.7 d hw maple - oak TN 55 36 0.3 6.3 29, 139S 3.5 d hw mixed hardwood NC 35 0.9 2.2 41S 6.6 c hw mixed hardwood TN m 36 84 0.3 0.21 41S 24.8 c hw chestnut oak NC, TN m 36 84 1.0 0.34 77S 5.2 o hw oak - hickory TN 36 0.3 5.4 o 77S 5.6 o hw oak - hickory TN 36 0.3 4.6 o 77S 2.6 o hw oak - hickory GA 150 32 77S 3.7 o hw oak FL 100 28 0.0 77S 3.7 o hw oak - hickory NC 36 0.8 4.9 o 89S 7.4 o hw oak - hickory NC 4 35 83 1.0 89S 12.0 o hw oak - hickory NC 7 35 83 0.9 89S 6.3 o hw hardwood NC 50 35 83 0.9 94, vS 4.6 d hw oak - hickory South 12 94, 77S 4.5 o hw scrub oak SC 150 34 1.9 o 103
Table A1.—Continued
Continued
R C ff T D L Aa Laa Loa Ea c:dw mrt rf citeb
(Mg/ha) (years) (km) (years)

23
S 4.3 d hw hardwood GA 22 32 84 0.2 116S 3.0 d hw hardwood NC m 31 87 0.9 116S 3.6 d hw hardwood NC 0 31 87 0.9 116S 3.3 d hw pin oak NC m 31 87 0.8 118, 77S 2.6 d hw upland hardwood NC m 35 127S 7.0 c hw oak TN 36 84 0.3 0.36 133S 3.4 d hw red spruce SC 35 83 41S 53.8 c conifer - hardwood NC, TN m 36 84 1.7 0.36 41S 2.4 d Chamaecyparis VA 57 0.9 139S 2.5 d Taxodium VA 86 1 139
P 8.6 d df Douglas-fir WA 40 47 11.6 139P 5.0 d df Douglas-fir OR 44 0.3 5.6 138P 10.7 d df Douglas-fir OR 70 44 0.6 14.5 139P 2.6 d df Douglas-fir OR 43 44 2.6 139P 12.4 d df alder, Douglas-fir BC 23 50 124 0.5 12P 8.5 d df alder, Douglas-fir WA 25 48 122 0.0 12P 2.6 d df Douglas-fir BC 23 50 124 0.5 12P 7.8 d df Douglas-fir WA 25 48 122 0.0 12P 8.6 o df Douglas-fir WA 55 46 122 0.6 3.6 o 15P 16.1 o df Douglas-fir, alder WA 55 46 122 0.6 2.4 o 15P 14.3 o df Douglas-fir, conifer OR 55 45 124 0.2 3.8 o 15P 11.6 o df Douglas-fir, conifer OR 55 45 124 0.2 0.9 o 15P 5.3 d df Douglas-fir WA 26 0.3 19P 9.0 d df Douglas-fir WA 30.5 0.3 19P 9.2 d df Douglas-fir WA 33.3 0.3 19P 8.0 d df Douglas-fir WA 38 0.3 19P 120.2 o df Douglas-fir OR 450 44 0.6 35.6 o 25P 165.6 o df western hemlock OR 121 45 0.2 49 o 25P 43.1 c df Douglas-fir OR 150 44 124 0.1 0.47 26P 9.2 c df Douglas-fir OR 150 44 124 0.1 0.42 26P 3.7 c df Douglas-fir plantation OR 9 44 124 0.1 0.38 26P 6.7 c df Douglas-fir WA 38 32P 9.7 c df Douglas-fir WA 38 32P 8.7 c df Douglas-fir WA 38 32P 6.5 c df Douglas-fir OR 38 32P 8.1 c df Douglas-fir OR 38 32P 8.2 c df Douglas-fir OR 38 32P 11.9 c df western hemlock WA 32 32P 13.7 c df western hemlock WA 32 32P 10.6 c df western hemlock OR 32 32P 5.8 d df Douglas-fir OR 48 45 123 0.3 6.1 d 39P 5.5 d df Douglas-fir OR 48 45 123 0.3 4.8 d 39P 5.5 d df Douglas-fir OR 48 45 123 0.3 4.3 d 39P 6.0 d df Douglas-fir OR 48 45 123 0.3 4 d 39P 9.8 d df Douglas-fir OR 48 45 123 0.3 10.4 d 39P 5.3 d df Douglas-fir, bigleaf maple OR 48 45 123 0.3 2.9 d 39P 6.8 d df Douglas-fir, bigleaf maple OR 48 45 123 0.3 4.3 d 39P 4.5 d df Douglas-fir, bigleaf maple OR 48 45 123 0.3 3.1 d 39
Table A1.—Continued
Continued
R C ff T D L Aa Laa Loa Ea c:dw mrt rf citeb
(Mg/ha) (years) (km) (years)

24
P 4.6 d df Douglas-fir, bigleaf maple OR 48 45 123 0.3 2.4 d 39P 11.4 d df Douglas-fir, bigleaf maple OR 48 45 123 0.3 5.8 d 39P 81.4 d df western hemlock - fir BC m 49 125 0.5 40P 44.4 d df western hemlock - fir BC m 49 125 0.5 40P 55.5 d df western hemlock - fir BC m 49 125 0.6 40P 92.5 d df western hemlock - fir BC m 49 125 0.5 40P 58.1 d df Douglas-fir OR, WA m 42, 33P 11.3 d df Douglas-fir OR 44 0.3 8.6 138P 14.5 d df Douglas-fir OR 44 0.9 9.9 138P 12.6 d df hemlock - spruce OR 44 0.2 9.6 138P 78.7 o df Douglas-fir OR, WA 40 48, vP 7.9 o df Douglas-fir OR, WA 40 48, vP 8.1 d df hemlock - spruce OR 26 45 0.2 3.1 46, 139P 26.3 o df Douglas-fir OR, WA 23 49, vP 82.2 o df Douglas-fir OR, WA 80 49, vP 31.4 o df Douglas-fir OR 450 44 123 0.6 13.4 o 47P 27.1 o df Douglas-fir OR 450 44 123 0.6 10 o 47P 15.1 o df Douglas-fir OR 450 44 123 0.6 7.3 o 47P 31.3 o df Douglas-fir OR 450 44 123 0.6 12.9 o 47P 25.1 o df Douglas-fir OR 450 44 123 0.6 10.8 o 47P 14.8 d df Douglas-fir WA 47 0.5 19.5 55, 138P 8.3 d df Douglas-fir WA 47 0.2 18.3 55, 138P 13.2 d df Douglas-fir WA 47 0.2 16 55, 138P 8.8 d df Douglas-fir WA 47 0.1 12 55, 138P 28.3 d df Douglas-fir WA 47 0.1 48.1 55, 138P 2.9 c df Douglas-fir OR <30 46 123 0.38 59P 8.2 c df Douglas-fir WA 63, 32P 17.0 c df western hemlock OR 63, 32P 33.0 d df Douglas-fir, w. hemlock OR m 80P 25.7 d df Douglas-fir, w. hemlock OR m 80P 31.2 d df Douglas-fir, w. hemlock OR m 80P 36.2 d df Douglas-fir, w. hemlock OR m 80P 44.3 d df Douglas-fir, w. hemlock OR m 80P 45.4 d df Douglas-fir, w. hemlock OR m 80P 45.3 d df Douglas-fir, w. hemlock OR m 80P 59.8 d df Douglas-fir, w. hemlock WA m 80P 71.3 d df Douglas-fir, w. hemlock WA m 80P 55.2 d df Douglas-fir, w. hemlock WA m 80P 91.1 d df Douglas-fir, w. hemlock WA m 80P 31.4 c df Douglas-fir OR m 44 122 1.0 93P 18.1 d df western hemlock WA 48 124 0.1 106P 27.4 d df western hemlock WA 46 123 0.4 106P 17.8 d df western hemlock WA 48 124 0.2 106P 10.4 d df western hemlock WA 48 124 0.1 106P 14.1 d df western hemlock WA 47 124 0.2 106P 10.7 d df western hemlock WA 47 124 0.2 106P 14.8 d df western hemlock WA 48 125 0.1 106P 8.1 d df western hemlock WA 47 124 0.1 106P 17.8 d df western hemlock WA 0.9 106
Table A1.—Continued
Continued
R C ff T D L Aa Laa Loa Ea c:dw mrt rf citeb
(Mg/ha) (years) (km) (years)

25
P 30.3 d df western hemlock WA 49 122 0.7 106P 14.4 d df western hemlock WA 0.3 106P 16.3 d df western hemlock WA 47 122 0.5 106P 10.7 d df western hemlock WA 48 122 0.2 106P 11.8 d df western hemlock WA 0.1 106P 19.2 d df western hemlock WA 0.9 106P 11.5 d df western hemlock WA 0.3 106P 11.4 d df Douglas-fir OR, WA 46 129, vP 1.4 d df Douglas-fir WA 9 47 0.2 1.6 128, 139P 11.0 o df Douglas-fir WA 22 47 121 0.2 4.4 o 130P 8.4 o df Douglas-fir WA 30 47 121 0.2 3.7 o 130P 8.4 o df Douglas-fir WA 30 47 121 0.2 7.7 o 130P 9.4 o df Douglas-fir WA 42 47 121 0.2 5.3 o 130P 12.8 o df Douglas-fir WA 42 47 121 0.2 7.8 o 130P 14.6 o df Douglas-fir WA 49 47 121 0.2 12.1 o 130P 21.6 o df Douglas-fir WA 73 47 121 0.2 29.1 o 130P 8.6 c df coastal hemlock OR 120 45 124 0.2 0.41 3.4 d 136P 4.6 c df Douglas-fir WA 300 47 122 0.2 0.38 3.2 d 136P 6.4 c df Douglas-fir WA 45 47 122 0.2 0.36 5.5 d 136P 7.4 d df Douglas-fir WA 150 47 12.6 137, 139P 10.4 d df Douglas-fir WA 70 47 31.1 137, 139P 3.7 d df Douglas-fir WA 1 47 137, 139P 5.9 d df Douglas-fir WA 10 47 80 137, 139P 10.0 d df Douglas-fir WA 40 47 32.9 137, 139P 8.5 d df Douglas-fir WA 40 47 20 137, 139P 11.1 d df Douglas-fir WA 150 47 11.4 137, 139P 12.2 d df Douglas-fir WA 1 47 137, 139P 6.7 d df Douglas-fir WA 10 47 39.1 137, 139P 8.5 d df Douglas-fir WA 70 47 22.8 137, 139P 14.3 d df Douglas-fir OR, WA 100 149, vP 17.7 d fh fir, hemlock WA 23 47 1.2 31.7 139P 55.3 d fh fir, hemlock WA 180 47 1.2 68.6 139P 31.6 d fh noble fir, Douglas-fir OR 44 1.2 17.4 138P 35.1 d fh fir - hemlock OR 44 1.5 28.8 138P 21.7 c fh mountain hemlock OR 215 44 122 1.8 0.28 87P 17.7 c fh mountain hemlock OR 18 44 122 1.8 0.3 87P 16.8 c fh mountain hemlock OR 35 44 122 1.8 0.25 87P 18.3 c fh mountain hemlock OR 74 44 122 1.8 0.3 87P 19.8 d fh fir, hemlock WA 175 47 121 1.2 17.7 d 131P 50.8 c fh Pacific silver fir WA 200 47 121 1.2 0.35 66.5 d 136P 23.5 d fh fir, hemlock OR, WA m 145P 5.3 d hw red alder WA 5.2 0.3 19P 7.6 d hw red alder WA 10 0.3 19P 5.0 d hw red alder WA 11.5 0.3 19P 4.8 d hw red alder WA 13.7 0.3 19P 14.2 d hw red alder WA 24.4 0.3 19P 13.1 d hw red alder WA 28.7 0.3 19P 14.5 d hw red alder WA 40.6 0.3 19P 36.5 o hw red alder WA 30 47 0.2 4.2 o 25
Table A1.—Continued
Continued
R C ff T D L Aa Laa Loa Ea c:dw mrt rf citeb
(Mg/ha) (years) (km) (years)

26
P 1.3 d hw red alder OR, WA 14 84, vP 0.9 d hw red alder OR, WA 24 84, vP 0.9 d hw red alder OR, WA 65 84, vP 16.9 d hw elm WA 36 47 0.2 2.9 128, 139P 5.0 c hw alder WA 40 47 122 0.3 0.34 3.1 d 136P 7.0 d hw red alder OR 44 3.5 150, 138
W 9.0 c p lodgepole pine OR 100 44 121 1.7 23W 19.5 o p lodgepole pine WY m 43 110 2.9 30W 13.9 o p lodgepole pine WY 105 41 106 2.8 20.6 o 34W 13.1 o p lodgepole pine WY 105 41 106 2.8 18.8 o 34W 18.6 o p lodgepole pine WY 105 41 106 2.8 21.7 o 34W 16.9 o p lodgepole pine WY 105 41 106 2.9 19.6 o 34W 9.5 o p lodgepole pine WY 70 41 106 3.1 12 o 34W 13.1 o p lodgepole pine WY 240 41 106 3.0 11.7 o 34W 10.7 o p lodgepole pine WY 15 41 106 2.8 49.9 o 119W 8.9 o p lodgepole pine WY 30 41 106 2.8 8.7 o 119W 10.2 o p lodgepole pine WY 50 41 106 2.8 10.7 o 119W 12.0 o p lodgepole pine WY 100 41 106 2.8 13.6 o 119W 15.1 o p lodgepole pine WY 260 41 106 2.8 18.8 o 119W 45.5 d p lodgepole pine CO m 40 106 2.8 123W 34.0 d p lodgepole pine CO m 40 106 2.8 123W 31.5 d p lodgepole pine CO m 40 106 2.8 123W 27.8 d p lodgepole pine CO m 40 106 2.8 123W 27.0 d p lodgepole pine CO m 40 106 2.9 123W 36.3 d p lodgepole pine CO m 40 106 3.0 123W 33.3 d p lodgepole pine CO m 41 107 3.0 123W 40.0 d p lodgepole pine CO m 41 107 2.9 123W 33.7 d p lodgepole pine CO m 41 106 3.2 123W 41.4 d p lodgepole pine CO m 41 106 2.9 123W 23.0 d p lodgepole pine CA m 135W 15.6 o p lodgepole pine WY 85 41 106 2.8 20.3 o 147W 69.7 d p ponderosa pine CA 38 1.5 60 138W 12.1 d p ponderosa pine AZ 35 2.2 15.5 138W 2.6 d p ponderosa pine, conifer CA 37 119 1.5 1W 10.0 d p ponderosa pine IM 50 7, vW 12.0 d p ponderosa pine IM 50 7, vW 8.5 d p ponderosa pine IM 50 7, vW 5.8 d p ponderosa pine IM vW 7.7 d p ponderosa pine AZ y 37W 3.3 d p ponderosa pine MT m 67W 40.7 d p ponderosa pine, conifer CA 70 39 121 1.3 68W 4.6 d p ponderosa pine IM 49 70, vW 13.8 d p ponderosa pine IM 50 71, vW 30.7 d p ponderosa pine IM 50 71, vW 19.2 d p ponderosa pine West 73, 33W 14.8 c p ponderosa pine AZ m 34 111 2.2 0.4 72W 9.9 c p ponderosa pine AZ m 34 111 2.2 0.42 72W 11.5 d p ponderosa pine AZ 35 112 2.1 78
Table A1.—Continued
Continued
R C ff T D L Aa Laa Loa Ea c:dw mrt rf citeb
(Mg/ha) (years) (km) (years)

27
W 24.4 d p ponderosa pine AZ 35 112 2.1 78W 46.0 d p ponderosa pine CA m 135W 35.8 c p ponderosa pine NM 200 36 106 2.7 0.32 48.7 d 136W 18.1 d p ponderosa pine AZ 56 142, 139W 25.0 d p Jeffrey pine, conifer CA m 39 121 1.4 68W 34.6 d p Jeffrey pine CA m 135W 9.9 d p western white pine CA m 135W 3.3 d rs white fir, giant sequoia CA 37 119 1.8 1W 35.9 o rs Sequoia CA 100, vW 53.8 d rs giant sequoia CA m 135W 96.9 c rs giant sequoia CA m 2.3 15.2 121W 22.2 d pj singleleaf pinyon IM m 2.2 33W 20.0 d pj pinyon - juniper CA m 135W 23.2 o mc Douglas-fir, spruce, fir NM 50 35 107 2.9 13.4 o 44W 23.3 d mc Douglas-fir MT m 67W 47.0 d mc Douglas-fir, incense-cedar CA 110 39 121 1.0 68W 23.6 d mc Douglas-fir CA m 135W 25.2 d mc spruce - fir CO 350 40 106 3.6 40 d 9W 26.3 d mc cedar - hemlock ID m 67W 37.4 d mc cedar - hemlock MT m 67W 26.6 d mc subalpine fir MT m 67W 43.7 d mc spruce - fir CO m 40 106 3.1 123W 37.0 d mc spruce - fir CO m 40 106 3.0 123W 34.8 d mc spruce - fir CO m 40 106 3.2 123W 43.3 d mc spruce - fir CO m 40 106 2.8 123W 36.3 d mc spruce - fir CO m 40 106 3.0 123W 38.5 d mc spruce - fir CO m 41 107 3.0 123W 44.4 d mc spruce - fir CO m 40 106 3.4 123W 54.8 d mc spruce - fir CO m 41 106 3.3 123W 38.1 d mc spruce - fir CO m 41 106 3.0 123W 45.5 d mc spruce - fir CO m 41 106 2.8 123W 31.9 d mc incense-cedar CA m 135W 41.9 d mc mountain hemlock CA m 135W 31.6 d mc red and white fir CA m 135W 24.1 c mc spruce - fir NM 300 36 106 3.4 0.37 58.9 d 136W 19.3 d mc mixed conifer IM vW 29.1 o mc fir, cedar, pine CA m 39 121 1.3 13.3 o 54W 73.9 c mc fir - pine CA m 2.1 17 121W 34.6 c mc mixed conifer NM 200 36 106 2.7 0.42 21 d 136W 34.0 d hw aspen CO m 40 106 2.8 123W 34.4 d hw aspen CO m 40 106 2.8 123W 51.1 d hw aspen CO m 40 106 2.8 123W 37.4 d hw aspen CO m 40 106 2.8 123W 49.2 d hw aspen CO m 40 106 2.8 123W 17.8 d hw aspen CO m 41 107 2.8 123W 25.2 d hw aspen CO m 41 107 2.8 123W 33.3 d hw aspen CO m 41 107 2.8 123W 18.5 d hw aspen CO m 41 107 2.7 123W 43.3 d hw aspen CO m 41 106 2.7 123
Table A1.—Continued
Continued
R C ff T D L Aa Laa Loa Ea c:dw mrt rf citeb
(Mg/ha) (years) (km) (years)

28
W 10.0 c hw aspen NM 60 36 106 3.1 0.35 11.4 d 136W 16.2 d hw black oak CA 38 1.5 28.3 138W 13.8 d hw gambel oak West 24, 33W 20.7 d hw gambel oak AZ 35 112 2.1 78W 4.7 d hw oak, chaparral AZ m 34 111 1.6 101
A 30.2 o sw black spruce AK 130 65 148 0.3 31A 20.6 o sw white spruce AK 160 65 148 0.2 31A 73.3 o sw black spruce AK 55 65 0.5 460 o 25A 48.8 o sw black spruce (muskeg) AK 51 65 0.2 620 o 25A 65.6 o sw black spruce AK 130 64 220 o 25A 14.2 d hw aspen AK 64 0.1 20.5 138A 21.9 d hw aspen AK 64 0.1 33.2 138A 16.2 d hw birch AK 64 0.1 19.7 138A 18.2 d hw birch AK 64 0.1 23 138A 19.1 o hw aspen AK 70 65 148 0.3 31A 27.2 o hw paper birch AK 110 65 148 0.3 31A 25.5 d hw birch AK 50 64 26 139A 37.8 o hw paper birch AK 50 64 26 o 25aSome papers did not explicitly provide age, latitude, longitude, or elevation. However, a number of these also provided enoughinformation to include an approximate value; these columns include these values as well as values directly from site descriptions.bObservations with two citations are those where the primary reference was identified (the first citation) but the value was obtainedfrom another source (the second citation). Citations “v” are from an unpublished report by K. A. Vogt, 1996; on file at the USDAForest Service Northeastern Research Station, Durham, NH.
Table A1.—Continued
R C ff T D L Aa Laa Loa Ea c:dw mrt rf citeb
(Mg/ha) (years) (km) (years)

29
Table A2. —Forest types used for summarizing data.
Region Forest type Type description
North p pinesf spruce, fir, hemlockmx mixed conifer-hardwoodab aspen-birchmb maple-beech-birch, northern hardwoodoh mixed hardwood, oak, hickory
South p pinemx mixed conifer-hardwoodhw mixed hardwood, oak, hickory
Pacific Northwest df Douglas-fir, Western hemlock, Sitka sprucesfh fir-hemlock, higher elevationhw hardwood
West p piners redwood/sequoiapj pinyon/junipermc mixed coniferhw hardwood
Alaska sw softwoodhw hardwood

30
Literature Cited in Appendix
1. Agee, J.K. 1973. Prescribed fire effects on physicaland hydrologic properties of mixed-conifer forestfloor and soil. Water Resources Center, No. 143.Davis, CA: University of California. 57 p.
2. Alban, D.H. 1977. Influence on soil properties ofprescribed burning under mature red pine. Res. Pap.NC-139. St. Paul, MN: U.S. Department ofAgriculture, Forest Service, North Central ForestExperiment Station. 8 p.
3. Alban, D.H.; Host, G.E.; Elioff, J.D.; Shadis, D.A.1994. Soil and vegetation response to soilcompaction and forest floor removal after aspenharvesting. Res. Pap. NC-315. St. Paul, MN: U.S.Department of Agriculture, Forest Service, NorthCentral Forest Experiment Station. 8 p.
4. Alban, D.H.; Perala, D.A. 1990. Ecosystem carbonfollowing aspen harvesting in the upper GreatLakes. In: Adams, R.D., ed. Proceedings ofsymposium: Aspen Symposium ’89; 1989 July 25-27;Duluth, MN. Gen. Tech. Rep. NC -140. St. Paul,MN: U.S. Department of Agriculture, Forest Service,North Central Forest Experiment Station: 123-131.
5. Alban, D.H.; Perala, D.A.; Schlaegel, B.E. 1978.Biomass and nutrient distribution in aspen, pine, andspruce stands on the same soil type in Minnesota.Canadian Journal of Forest Research. 8: 290-299.
6. Albert, D.A.; Barnes, B.V. 1987. Effects ofclearcutting on the vegetation and soil of a sugarmaple-dominated ecosystem, western UpperMichigan. Forest Ecology and Management. 18: 283-298.
7. Aldon, E.F. 1968. Moisture loss and weight of theforest floor under pole-sized ponderosa pine. Journalof Forestry. 66: 70-71.
8. Alway, F.J.; Kittredge, J. 1933. The forest floor understands of aspen and paper birch. Soil Science. 35:307-312.
9. Arthur, M.A.; Fahey, T.J. 1992. Biomass and nutrientsin an Engelmann spruce-subalpine fir forest in northcentral Colorado: pools, annual production, andinternal cycling. Canadian Journal of Forest Research.22: 315-325.
10. Bell, R.L.; Binkley, D. 1989. Soil nitrogenmineralization and immobilization in response toperiodic prescribed fire in a loblolly pine
plantation. Canadian Journal of Forest Research. 19:816-820.
11. Berish, C.W.; Ragsdale, H.L. 1986. Metals in low-elevation, southern Appalachian forest floor andsoil. Journal of Environmental Quality. 15: 183-187.
12. Binkley, D. 1983. Ecosystem production inDouglas-fir plantations: interaction of red alderand site fertility. Forest Ecology and Management. 5:215-227.
13. Binkley, D. 1986. Soil acidity in loblolly pinestands with interval burning. Soil Science Society ofAmerica Journal. 50: 1590-1594.
14. Binkley, D.; Richter, D.; David, M.B.; Caldwell, B.1992a. Soil chemistry in a loblolly/longleaf pineforest with interval burning. Ecological Applications.2: 157-164.
15. Binkley, D.; Sollins, P.; Bell, R.; Sachs, D.; Myrold,D. 1992b. Biogeochemistry of adjacent conifer andalder-conifer stands. Ecology. 73: 2022-2033.
16. Blow, F.E. 1958. Quality and hydroligiccharacteristics of litter under upland oak forests ineastern Tennessee. Journal of Forestry. 53: 190-195.
17. Bockheim, J.G. 1997. Soils in hemlock-hardwoodecosystem mosaic in the Southern Lake SuperiorUplands. Canadian Journal of Forest Research. 27:1147-1153.
18. Bockheim, J.G.; Leide, J.E.; Tavella, D.S. 1986.Distribution and cycling of macronutrients in aPinus resinosa plantation fertilized with nitrogenand potassium. Canadian Journal of Forest Research.16: 778-785.
19. Bormann, B.T.; DeBell, D.S. 1981. Nitrogencontent and other soil properties related to age ofred alder stands. Soil Science Society of AmericaJournal. 45: 428-432.
20. Bourn, T.G.; Brown, J.H.J. 1971. Mixed oak forestfloor: some characteristics. Rhode Island AgriculturalExperiment Sta. Bull. 407. Kingston, RI: University ofRhode Island Agricultural Experiment Station. 10 p.
21. Boyer, W.D. 1966. Litter in longleaf pine standsthinned to prescribed densities. Res. Note SO-31.New Orleans, LA: U.S. Department of Agriculture,Forest Service, Southern Forest Experiment Station. 4p.

31
22. Brown, J.K. 1966. Forest floor fuels in red and jackpine stands. Res. Note NC-9. St. Paul, MN: U.S.Department of Agriculture, Forest Service, NorthCentral Forest Experiment Station. 4 p.
23. Busse, M.D. 1994. Downed bole-wooddecomposition in lodgepole pine forests of centralOregon. Soil Science Society of America Journal. 58:221-227.
24. Clary, W.P.; Tiedemann, A.R. 1986. Distribution ofbiomass within small tree and shrub form Quercusgambelii stands. Forest Science. 32: 234-242.
25. Cole, D.W.; Rapp, M. 1981. Elemental cycling inforest ecosystems. In: Reichle, D.E., ed. Dynamicproperties of forest ecosystems. Cambridge, UK:Cambridge University Press: 341-409.
26. Cromack, K.; Miller, R.E.; Helgerson, O.T.; Smith,R.B.; Anderson, H.W. 1999. Soil carbon andnutrients in a coastal Oregon Douglas-firplantation with red alder. Soil Science Society ofAmerica Journal. 63: 232-239.
27. Crosby, J.S. 1974. Some forest floor fuelbedcharacteristics of black oak stands in southeastMissouri. Res. Note NC-162. St. Paul, MN: U.S.Department of Agriculture, Forest Service, NorthCentral Forest Experiment Station. 4 p.
28. Czapowskyj, M.M.; Rourke, R.V.; Frank, R.M. 1977.Strip clearcutting did not degrade the site in aspruce-fir forest in central Maine. Res. Pap. NE-367.Upper Darby, PA: U.S. Department of Agriculture,Forest Service, Northeastern Forest ExperimentStation. 8 p.
29. DeAngelis, D.L.; Gardner, R.H.; Shugart, H.H.1981. Productivity of forest ecosystems studiedduring the IBP: The woodlands data set. In: Reichle,D.E., ed. Dynamic properties of forest ecosystems.International Biological Program 23. London:Cambridge University Press: 567-672.
30. DeByle, N.V. 1980. Harvesting and site treatmentinfluences on the nutrient states of lodgepole pineforests in western Wyoming. Environmentalconsequences of timber harvesting in Rocky Mountainconiferous forests: symposium proceedings; 1979 Sept.11-13; Missoula, MT. Gen. Tech. Rep. INT-90.Ogden, UT: U.S. Department of Agriculture, ForestService, Intermountain Forest and Range ExperimentStation: 137-156.
31. Dyrness, C.T.; Van Cleve, K.; Levison, J.D. 1989.The effect of wildfire on soil chemistry in fourforest types in interior Alaska. Canadian Journal ofForest Research. 19: 1389-1396.
32. Edmonds, R.L.; Chappell, H.N. 1994. Relationshipsbetween soil organic matter and forest productivityin western Oregon and Washington. CanadianJournal of Forest Research. 24: 1101-1106.
33. Everett, R.L.; Thran, D.F. 1992. Above-groundbiomass and nitrogen phosphorus and sulfurcapital in singleleaf pinyon woodlands. Journal ofEnvironmental Management. 34: 137-147.
34. Fahey, T.J. 1983. Nutrient dynamics ofaboveground detritus in lodgepole pine (PinusContorta ssp. latifolia) ecosystems, southeasternWyoming. Ecological Monographs. 53: 51-72.
35. Fassnacht, K.S.; Gower, S.T. 1999. Comparison ofthe litterfall and forest floor organic matter andnitrogen dynamics of upland forest ecosystems innorth central Wisconsin. Biogeochemistry. 45: 265-284.
36. Federer, C.A. 1982. Subjectivity in the separationof organic horizons of the forest floor. Soil ScienceSociety of America Journal. 46: 1090-1093.
37. Ffolliott, P.F. 1968. Some characteristics of theforest floor under ponderosa pine in Arizona. Res.Note RM-127. Fort Collins, CO: U.S. Department ofAgriculture, Forest Service, Rocky Mountain Forestand Range Experiment Station. 4 p.
38. Finzi, A.C.; Van Breemen, N.; Canham, C.D. 1998.Canopy tree-soil interactions within temperatureforests: species effects on soil carbon and nitrogen.Ecological Applications. 8: 440-446.
39. Fried, J.S.; Boyle, J.R.; Tappeiner, J.C.I.; Cromack,K.J. 1990. Effects of bigleaf maple on soils inDouglas-fir forests. Canadian Journal of ForestResearch. 20: 259-266.
40. Fyles, J.W.; Fyles, I.H.; Beese, W.J.; Feller, M.C.1991. Forest floor characteristics and soil nitrogenavailability on slash-burned sites in coastal BritishColombia. Canadian Journal of Forest Research. 21:1516-1522.
41. Garten, C.T.; Cooper, L.W.; Post, W.M.; Hanson, P.J.2000. Climate controls on forest soil C isotope

32
ratios in the southern Appalachian Mountains.Ecology. 81: 1108-1119.
42. Gessel, S.P.; Balci, A.N. 1965. Amount andcomposition of forest floors under Washingtonconiferous forests. In: Youngberg, C.T., ed. Forest-soilrelationships in North America. Corvalis, OR: OregonState University Press: 11-23.
43. Gosz, J.R.; Likens, G.E.; Bormann, F.H. 1976.Organic matter and nutrient dynamics of the forestfloor in the Hubbard Brook Forest. Oecologia. 22:305-320.
44. Gower, S.T.; Vogt, K.A.; Grier, C.C. 1992. Carbondynamics of Rocky Mountain Douglas-fir.Ecological Monographs. 62: 43-65.
45. Green, D.C.; Grigal, D.F. 1980. Nutrientaccumulations in Jack pine stands on deep andshallow soils over bedrock. Forest Science. 26: 325-333.
46. Grier, C.C. 1976. Biomass productivity andnitrogen-phosphorous cycles in hemlock-sprucestands of the central Oregon coast. In: Atkinson,W.A.; Zasoski, R.J., eds. Western hemlockmanagement. Seattle, WA: University of WashingtonPress: 71-81.
47. Grier, C.C.; Logan, R.S. 1977. Old-growthPseudotsuga menziesii communities of westernOregon watershed: biomass distribution andproduction budgets. Ecological Monographs. 47:373-400.
48. Grier, C.C.; McColl, J.G. 1971. Forest floorcharacteristics within a small plot in Douglas-fir inwestern Washington. Soil Science Society of AmericaProceedings. 35: 988-991.
49. Grier, C.C.; Vogt, K.A.; Keyes, M.R.; Edmonds, R.L.1981. Biomass distribution and above- and below-ground production in young and mature Abiesamabilis zone ecosystems of the WashingtonCascades. Canadian Journal of Forest Research. 11:155-167.
50. Grigal, D.F.; Ohmann, L.F. 1992. Carbon storage inupland forests of the Lake States. Soil ScienceSociety of America Journal. 56: 935-943.
51. Groeschl, D.A.; Johnson, J.E.; Smith, D.W. 1990.Forest soil characteristics following wildfire in theShenandoah National Park, Virginia. In: Nodvin,
S.C.; Waldrop, T.A., eds. Fire and environment:ecological and cultural perspectives. Gen. Tech. Rep.SE-69. Asheville, NC: U.S. Department ofAgriculture, Forest Service, Southeastern ForestExperiment Station: 129-137.
52. Harding, R.B.; Jokela, E.J. 1994. Long-term effectsof forest fertilization on site organic matternutrients. Soil Science Society of America Journal. 58:216-221.
53. Harris, W.F.; Kinerson, R.S., Jr.; Edwards, N.T. 1977.Comparison of belowground biomass of naturaldeciduous forest and loblolly pine plantations.Pedobiologia. 17: 369-381.
54. Hart, S.C.; Firestone, M.K. 1991. Forest floor-mineral soil interactions in the internal nitrogencycle of an old-growth forest. Biogeochemistry. 12:103-127.
55. Heilman, P.E. 1961. Effects of nitrogen fertilizationon the growth and nitrogen nutrition of low-siteDouglas-fir stands. Seattle, WA: University ofWashington. 213 p. Ph.D. dissertation.
56. Hendrickson, O.Q.; Chatarpaul, L.; Burgess, D.1989. Nutrient cycling following whole-tree andconventional harvest in northern mixed forest.Canadian Journal of Forest Research. 19: 725-735.
57. Hix, D.M.; Barnes, B.V. 1984. Effects of clear-cutting on the vegetation and soil of an easternhemlock dominated ecosystem, western UpperMichigan. Canadian Journal of Forest Research. 14:914-923.
58. Homann, P.S.; Grigal, D.F. 1996. Below-groundorganic carbon and decomposition potential in afield-forest glacial-outwash landscape. Biology andFertility of Soils. 23: 207-214.
59. Hopmans, P.; Chappell, H.N. 1994. Growthresponse of young, thinned Douglas-fir stands tonitrogen fertilizer in relation to soil properties andtree nutrition. Canadian Journal of Forest Research.24: 1684-1688.
60. Hough, W.A. 1982. Phytomass and nutrients in theunderstory and forest floor of slash/longleaf pinestands. Forest Science. 28: 359-372.
61. Huntington, T.G.; Ryan, D.F.; Hamburg, S.P. 1988.Estimating soil nitrogen and carbon pools in a

33
northern hardwood forest ecosystem. Soil ScienceSociety of America Journal. 52: 1162-1167.
62. Johnson, C.E.; Driscoll, C.T.; Fahey, T.J.; Siccama,T.G.; Hughes, J.W. 1995. Carbon dynamicsfollowing clear-cutting of a northern hardwoodforest. In: McFee, W.W.; Kelly, J.M., eds. Carbonforms and functions in forest soils. Madison, WI: SoilScience Society of America: 463-488.
63. Johnson, D.W.; Cole, D.W.; Bledsoe, C.S.; Cromack,K.; Edmonds, R.L.; Gessel, S.P.; Grier, C.C.; Richards,B.N.; Vogt, K.A. 1982. Nutrient cycling in thePacific Northwest. In: Edmonds, R.L., ed. Analysis ofconiferous forest ecosystems in the western UnitedStates. Stroudsburg, PA: Hutchinson Ross: 186-232.
64. Johnston, M.H.; Homann, P.S.; Engstrom, J.K.;Grigal, D.F. 1996. Changes in ecosystem carbonstorage over 40 years on an old-field/forestlandscape in east-central Minnesota. Forest Ecologyand Management. 83: 17-26.
65. Jokela, E.J.; McFee, W.W.; Stone, E.L. 1991.Micronutrient deficiency in slash pine: responseand persistence of added manganese. Soil ScienceSociety of America Journal. 55: 492-496.
66. Jorgensen, J.R.; Wells, C.G.; Metz, L.J. 1980.Nutrient changes in decomposing loblolly pineforest floor. Soil Science Society of America Journal.44: 1307-1314.
67. Jurgensen, M.F.; Harvey, A.E.; Graham, R.T.; Page,D.D.S.; Tonn, J.R.; Larsen, M.J.; Jain, T.B. 1997.Impacts of timber harvesting on soil organicmatter, nitrogen, productivity, and health of inlandNorthwest forests. Forest Science. 43: 234-251.
68. Kauffman, J.B.; Martin, R.E. 1989. Fire behavior,fuel consumption, and forest-floor changesfollowing prescribed understory fires in SierraNevada mixed conifer forests. Canadian Journal ofForest Research. 19: 455-462.
69. Kinerson, R.S.; Ralston, C.W.; Wells, C.G. 1977.Carbon cycling in a loblolly pine plantation.Oecologia. 29: 1-10.
70. Klemmedson, J.O. 1975. Nitrogen and carbonregimes in an ecosystem of young dense ponderosapine in Arizona. Forest Science. 21: 163-168.
71. Klemmedson, J.O. 1976. Effect of thinning andslash burning on nitrogen and carbon in ecosystems
of young dense ponderosa pine. Forest Science. 22:45-53.
72. Klemmedson, J.O. 1994. New Mexican locust andparent material: influence on forest floor and soilmacronutrients. Soil Science Society of AmericaJournal. 58: 974-980.
73. Klemmedson, J.L.; Schultz, A.M.; Jenny, H.; Biswell,H.H. 1962. Effect of prescribed burning of forestlitter on total soil nitrogen. Soil Science SocietyProceedings. 26: 200-202.
74. Kodama, H.E.; Van Lear, D.H. 1980. Prescribedburning and nutrient cycling relationships in youngloblolly pine plantations. Southern Journal ofApplied Forestry. 4: 118-121.
75. Lane, C.L. 1975. Forest stand conversion fromhardwoods to pines: effects on soil nutrientsmicroorganisms and forest floor weight during thefirst seven years. Forest Science. 21: 155-159.
76. Lang, G.E.; Cronan, C.S.; Reiners, W.A. 1981.Organic matter and major elements of the forestfloors and soils in subalpine balsam fir forests.Canadian Journal of Forest Research. 11: 388-399.
77. Lang, G.E.; Forman, R.T.T. 1978. Detrital dynamicsin a mature oak forest: Hutcheson Memorial Forest,New Jersey. Ecology. 59: 580-595.
78. Lefevre, R.E.; Klemmedson, J.O. 1980. Effect ofGambel oak on forest floor and soil of a ponderosapine forest. Soil Science Society of America Journal.44: 842-846.
79. Liechty, H.O.; Jurgensen, M.F.; Mroz, G.D.; Gale,M.R. 1997. Pit and mound topography and itsinfluence on storage of carbon, nitrogen, andorganic matter within an old-growth forest.Canadian Journal of Forest Research. 27: 1992-1997.
80. Little, S.N.; Ohmann, J.L. 1988. Estimatingnitrogen lost from forest floor during prescribedfires in Douglas-fir/western hemlock clearcuts.Forest Science. 34: 152-164.
81. Lockaby, B.G.; Taylor-Boyd, J.E. 1986. Nutrientdynamics in the litter fall and forest floor of an 18-year-old loblolly pine plantation. Canadian Journalof Forest Research. 16: 1109-1112.
82. Loomis, R.M. 1975. Annual changes in forest floorweights under a southeast Missouri oak stand. Res.

34
Note NC-184. St. Paul, MN: U.S. Department ofAgriculture, Forest Service, North Central ForestExperiment Station. 3 p.
83. Loomis, R.M. 1977. Jack pine and aspen forestfloors in northeastern Minnesota. Res. Note NC-222.St. Paul, MN: U.S. Department of Agriculture, ForestService, North Central Forest Experiment Station. 3 p.
84. Luken, J.; Fonda, R. 1983. Nitrogen accumulationin a chronosequence of red alder communitiesalong the Hoh River, Olympic National Park,Washington. Canadian Journal of Forest Research. 13:1228-1237.
85. Mader, D.L.; Lull, H.W. 1968. Depth, weight, andwater storage of the forest floor in white pinestands in Massachusetts. Res. Pap. NE-109. UpperDarby, PA: U.S. Department of Agriculture, ForestService, Northeastern Forest Experiment Station. 35 p.
86. Mader, D.L.; Lull, H.W.; Swenson, E.I. 1977.Humus accumulation in hardwood stands in theNortheast. Res. Bull. 648. Amherst, MA:Massachusetts Agricultural Experiment Station. 31 p.
87. Matson, P.A.; Boone, R.D. 1984. Naturaldisturbance and nitrogen mineralization: wave-form dieback of mountain hemlock in the OregonCascades. Ecology. 65: 1511-1516.
88. Mattson, K.G.; Smith, H.C. 1993. Detrital organicmatter and soil CO2 efflux in forests regeneratingfrom cutting in West Virginia. Soil Biology andBiochemistry. 25: 1241-1248.
89. Mattson, K.G.; Swank, W.T. 1989. Soil and detritalcarbon dynamics following forest cutting in theSouthern Appalachians. Biology and Fertility of Soils.7: 247-253.
90. McClaugherty, C.A.; Pastor, J.; Aber, J.D.; Melillo,J.M. 1985. Forest litter decomposition in relation tosoil nitrogen dynamics and litter quality. Ecology.66: 266-275.
91. McKee, W.H. 1982. Changes in soil fertilityfollowing prescribed burning on coastal plain pinesites. Res. Pap. SE-234. Asheville, NC: U.S.Department of Agriculture, Forest Service,Southeastern Forest Experiment Station. 23 p.
92. McLaughlin, J.W.; Liu, G.; Jurgensen, M.F.; Gale,M.R. 1996. Organic carbon characteristics in a
spruce swamp five years after harvesting. SoilScience Society of America Journal. 60: 1228-1236.
93. Means, J.E.; MacMillan, P.C.; Cromack, K.J. 1992.Biomass and nutrient content of Douglas-fir logsand other detrital pools in an old-growth forest,Oregon, U.S.A. Canadian Journal of Forest Research.22: 1536-1546.
94. Metz, L.J. 1954. Forest floor in the Piedmontregion of South Carolina. Soil Science Society ofAmerica Proceedings. 18: 335-338.
95. Metz, L.J.; Wells, C.G.; Kormanik, P.P. 1970.Comparing the forest floor and surface soil beneathfour pine species in the Virginia Piedmont. Res.Pap. SE-55. Asheville, NC: U.S. Department ofAgriculture, Forest Service, Southeastern ForestExperiment Station. 8 p.
96. Mitchell, M.J.; Foster, N.W.; Shepard, J.P.; Morrison,I.K. 1992. Nutrient cycling in Huntington Forestand Turkey Lakes deciduous stands: nitrogen andsulfur. Canadian Journal of Forest Research. 22: 457-464.
97. Mroz, G.D.; Jurgensen, M.F.; Frederick, D.J. 1985.Soil nutrient changes following whole treeharvesting on three northern hardwood sites. SoilScience Society of America Journal. 49: 1552-1557.
98. Nemeth, J.C. 1973. Dry matter production inyoung loblolly (Pinus teada L.) and slash pine(Pinus elliottii Engelm.) plantations. EcologicalMonographs. 43: 21-41.
99. Ohmann, L.F.; Grigal, D.F. 1991. Properties of soilsand tree wood tissue across a Lake States sulfatedeposition gradient. Res. Bull. NC-130. St. Paul,MN: U.S. Department of Agriculture, Forest Service,North Central Forest Experiment Station. 65 p.
100. Parsons, D.J. 1978. Fire and fuel accumulation ina giant sequoia forest. Journal of Forestry. 76: 104-105.
101. Pase, C.P. 1972. Litter production by oak-mountainmahogany chaparral in Central Arizona.Res. Note RM-214. Fort Collins, CO: U.S.Department of Agriculture, Forest Service, RockyMountain Forest and Range Experiment Station. 7 p.
102. Pastor, J.; Bockheim, J.G. 1984. Distribution andcycling of nutrients in an aspen-mixed-hardwood-

35
spodosol ecosystem in northern Wisconsin. Ecology.65: 339-353.
103. Pehl, C.E.; Shellnutt, H.E.J. 1986. Forest floor andsoil nutrient conditions in the Georgia sandhills.Georgia Forest Res. Pap. No. 62. Dry Branch, GA:Georgia Forestry Commission. 11 p.
104. Perala, D.A.; Alban, D.H. 1982. Rates of forestfloor decomposition and nutrient turnover inaspen, pine, and spruce stands on two differentsoils. Res. Pap. NC-227. St Paul, MN: U.S.Department of Agriculture, Forest Service, NorthCentral Forest Experiment Station. 5 p.
105. Perala, D.A.; Rollinger, J.L.; Wilson, D. 1995.Comparison between soil and biomass carbon inadjacent hardwood and red pine forests. WorldResource Review. 7: 231-243.
106. Radwan, M.A.; Shumway, J.S. 1983. Soil nitrogen,sulfur, and phosphorus in relation to growthresponse of western hemlock to nitrogenfertilization. Forest Science. 29: 469-477.
107. Reiners, W.A. 1972. Structure and energetics ofthree Minnesota forests. Ecological Monographs. 42:71-94.
108. Reiners, W.A.; Marks, R.H.; Vitousek, P.M. 1975.Heavy metals in subalpine and alpine soils in NewHampshire. Oikos. 26: 264-275.
109. Reiners, W.A.; Reiners, N.M. 1970. Energy andnutrient dynamics of forest floors in threeMinnesota forests. Journal of Ecology. 58: 497-519.
110. Rochow, J.J. 1975. Mineral nutrient pool andcycling in a Missouri forest. Journal of Ecology. 63:985-994.
111. Rolfe, G.L.; Boggess, W.R. 1973. Soil conditionsunder old field and forest cover in southern Illinois.Soil Science Society of America Proceedings. 37: 314-318.
112. Rollinger, J.L.; Strong, T.F.; Grigal, D.F. 1998.Forested soil carbon storage in landscapes of theNorthern Great Lakes Region. In: Lal, R.; Kimble,J.M.; Follett, R.F.; Stewart, B.A. eds. Management ofcarbon sequestration in soil. Boca Raton, FL: CRCPress: 335-350.
113. Ruark, G.A.; Bockheim, J.G. 1988. Biomass, netprimary production, and nutrient distribution for
an age sequence of Populus tremuloides ecosystems.Canadian Journal of Forest Research. 18: 435-443.
114. Schiffman, P.M.; Johnson, W.C. 1989. Phytomassand detrital carbon storage during forest regrowthin the southeastern United States Piedmont.Canadian Journal of Forest Research. 19: 69-78.
115. Schoch, P.; Binkley, D. 1986. Prescribed burningincreased nitrogen availability in a mature loblollypine stand. Forest Ecology and Management. 14: 13-22.
116. Seastedt, T.R.; Crossle, D.A.J. 1981.Microarthropod response following cable loggingand clear-cutting in the southern Appalachians.Ecology. 62: 126-135.
117. Simmons, J.A.; Fernandez, I.J.; Briggs, R.D.;Delaney, M.T. 1996. Forest floor carbon pools andfluxes along a regional climate gradient in Maine,USA. Forest Ecology and Management. 84: 81-95.
118. Sims, I.H. 1932. Litter deposition andaccumulation in the pine-oak type of the southernAppalachians. Journal of Forestry. 30: 90-91.
119. Smith, F.W.; Resh, S.C. 1999. Age-related changesin production and below-ground carbon allocationin Pinus contorta forests. Forest Science. 45: 333-341.
120. Snyder, K.E.; Harter, R.D. 1987. Forest floordynamics in even-aged northern hardwood stands.Soil Science Society of America Journal. 51: 1381-1383.
121. Stohlgren, T.J. 1988. Litter dynamics in twoSierran mixed conifer forests. I. Litterfall anddecomposition rates. Canadian Journal of ForestResearch. 18: 1127-1135.
122. Stottlemyer, R.; Toczydlowski, D. 1999. Seasonalrelationships between precipitation, forest floor,and streamwater nitrogen, Isle Royale, Michigan.Soil Science Society of America Journal. 63: 389-398.
123. Stump, L.M.; Binkley, D. 1993. Relationshipsbetween litter quality and nitrogen availability inRocky Mountain forests. Canadian Journal of ForestResearch. 23: 492-502.
124. Switzer, G.L.; Nelson, L.E. 1972. Nutrientaccumulation of cycling in loblolly pine (Pinustaeda L.) plantation ecosystems: the first twenty

36
years. Soil Science Society of America Proceedings. 36:143-147.
125. Switzer, G.K.; Shelton, M.G.; Nelson, L.E. 1979.Successional development of the forest floor andsoil surface on upland sites of the east gulf coastalplain. Ecology. 60: 1162-1171.
126. Tappeiner, J.C.; Alm, A.A. 1975. Undergrowthvegetation affects the nutrient content of litterfalland soils in red pine and birch stands in northernMinnesota. Ecology. 56: 1193-1200.
127. Trettin, C.C.; Johnson, D.W.; D. E. Todd, J. 1999.Forest nutrient and carbon pools at Walker Branchwatershed: changes during a 21-year period. SoilScience Society of America Journal. 63: 1436-1448.
128. Turner, J. 1975. Nutrient cycling in a Douglas-firecosystem with respect to age and nutrient status.Seattle, WA: University of Washington. 190 p. Ph.D.dissertation.
129. Turner, J. 1977. Effect of nitrogen availability onnitrogen cycling in a Douglas-fir stand. ForestScience. 23: 307-316.
130. Turner, J.; Long, J.N. 1975. Accumulation oforganic matter in a series of Douglas-fir stands.Canadian Journal of Forest Research. 5: 681-690.
131. Turner, J.; Singer, M.J. 1976. Nutrient distributionand cycling in a sub-alpine coniferous forestecosystem. Journal of Applied Ecology. 13: 295-301.
132. Van Lear, D.H. 1980. Effects of nitrogen,phosphorus, and lime on the forest floor andgrowth of pole-size loblolly pine. Soil ScienceSociety of America Journal. 44: 838-841.
133. Van Lear, D.H.; Danielovich, S.J. 1988. Soilmovement after broadcast burning in the southernAppalachians. Southern Journal of Applied Forestry.12: 49-53.
134. Van Lear, D.H.; Goebel, N.B. 1976. Leaf fall andforest tree characteristics in loblolly pineplantations in the South Carolina Piedmont. SoilScience Society of America Journal. 40: 116-119.
135. van Wagtendonk, J.W.; Benedict, J.M.; Sydoriak,W.M. 1998. Fuel bed characteristics of SierraNevada conifers. Western Journal of Applied Forestry.13: 73-84.
136. Vitousek, P.M.; Gosz, J.R.; Grier, C.C.; Melillo,J.M.; Reiners, W.A. 1982. A comparative analysis ofpotential nitrification and nitrate mobility in forestecosystems. Ecological Monographs. 52: 155-177.
137. Vogt, D.J. 1987. Douglas-fir ecosystems inwestern Washington: biomass and production asrelated to site quality and stand age. Seattle, WA:University of Washington. 164 p. Ph.D. dissertation.
138. Vogt, K.A.; Grier, C.C.; Vogt, D.J. 1986.Production, turnover, and nutrient dynamics ofabove- and belowground detritus of world forests.Advances in Ecological Research. 15: 303-377.
139. Vogt, K.A.; Vogt, D.J.; Palmiotto, P.A.; Boon, P.;O‘Hara, J.; Asbjornsen, H. 1996. Review of rootdynamics in forest ecosystems grouped by climate,climatic forest type and species. Plant and Soil. 187:159-219.
140. Vose, J.M.; Swank, W.T. 1993. Site preparationburning to improve southern Appalachian pine-hardwood stands: aboveground biomass, forestfloor mass, and nitrogen and carbon pools.Canadian Journal of Forest Research. 23: 2255-2262.
141. Vose, J.M.; Swank, W.T.; Clinton, B.D.; Knoepp,J.D.; Swift, L.W. 1999. Using stand replacementfires to restore southern Appalachian pine-hardwood ecosystems: effects on mass, carbon, andnutrient pools. Forest Ecology and Management. 114:215-226.
142. Welch, T.G.; Klemmedson, J.O. 1975. Influence ofthe biotic factor and parent material ondistribution of nitrogen and carbon on ponderosapine ecosystems. In: Bernier, B.; Winget, C.H., eds.Forest soils and forest land management. Quebec City,PQ: Laval University Press: 159-178.
143. Wells, C.G.; Jorgensen, J.R. 1975. Nutrient cyclingin loblolly pine plantations in forest soils and forestland management. In: Bernier, B.; Winget, C.H., eds.Forest soils and forest land management. Quebec City,PQ: Laval University Press: 137-158.
144. Whittaker, R.H.; Likens, G.E.; Bormann, F.H.;Eaton, J.S.; Siccama, T.G. 1979. The Hubbard Brookecosystem study: forest nutrient cycling andelement behavior. Ecology. 60: 203-220.
145. Williams, C.B.; Dyrness, C.T. 1967. Somecharacteristics of forest floors and soils under truefir-hemlock stands in the Cascade Range. Res. Pap.

37
PNW-37. Portland, OR: U.S. Department ofAgriculture, Forest Service, Pacific Northwest Forestand Range Experiment Station. 19 p.
146. Williston, H.L. 1965. Forest floor in loblolly pineplantations as related to stand characteristics. Res.Note SO-26. New Orleans, LA: U.S. Department ofAgriculture, Forest Service, Southern ForestExperiment Station. 3 p.
147. Yavitt, J.B.; Fahey, T.J. 1986. Litter decay andleaching from the forest floor in Pinus contorta(lodgepole pine) ecosystems. Journal of Ecology. 74:525-545.
148. Yin, X.; Perry, J.A.; Dixon, R.K. 1989. Influence ofcanopy removal on oak forest floor decomposition.Canadian Journal of Forest Research. 16: 204-214.
149. Youngberg, C.T. 1966. Forest floors in Douglas-firforests: I. Dry weight and chemical properties. SoilScience Society of America Journal. 30: 406-409.
150. Zavitkovski, J.; Newton, M. 1971. Litterfall andlitter accumulation in red alder stands in westernOregon. Plant and Soil. 35: 257-268.

Printed on Recycled Paper
Smith, James E.; Heath, Linda S. 2002. A model of forest floor carbon mass forUnited States forest types. Res. Pap. NE-722. Newtown Square, PA: U.S.Department of Agriculture, Forest Service, Northeastern Research Station. 37 p.
Includes a large set of published values of forest floor mass and develop large-scale estimates of carbon mass according to region and forest type. Estimates ofaverage forest floor carbon mass per hectare of forest applied to a 1997 summaryforest inventory, sum to 4.5 Gt carbon stored in forests of the 48 contiguous UnitedStates.
Keywords: forest carbon budget; carbon sequestration; afforestation
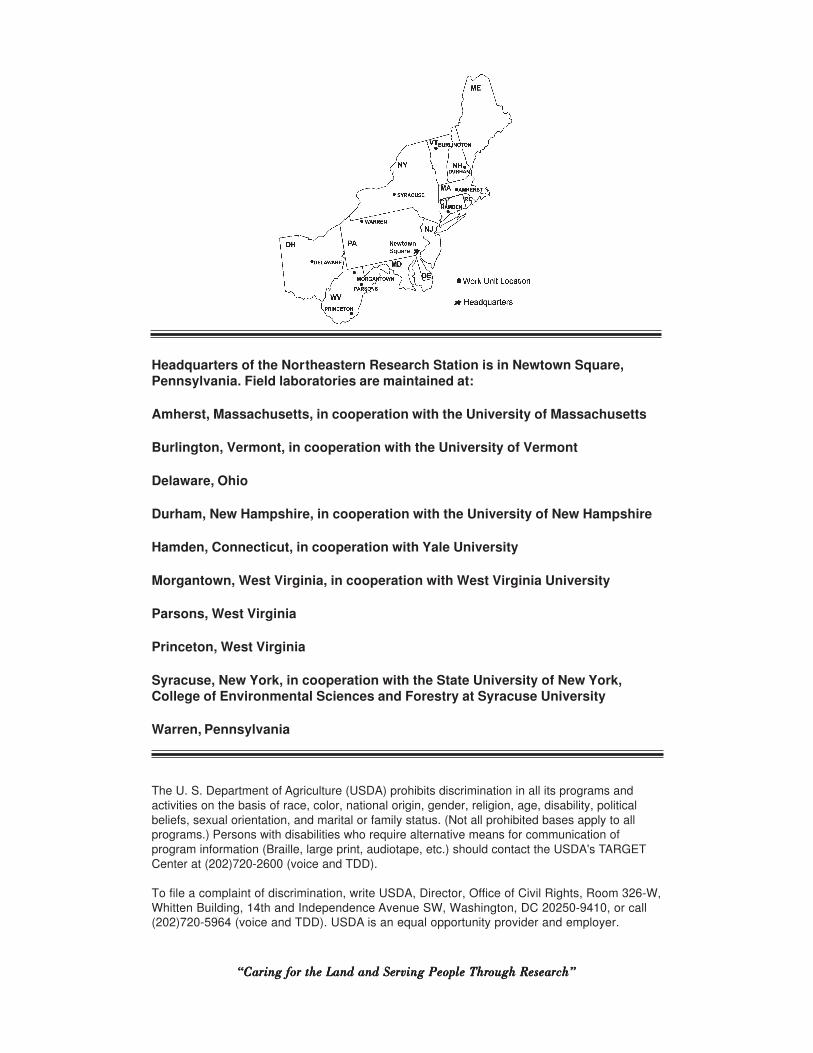
Headquarters of the Northeastern Research Station is in Newtown Square,Pennsylvania. Field laboratories are maintained at:
Amherst, Massachusetts, in cooperation with the University of Massachusetts
Burlington, Vermont, in cooperation with the University of Vermont
Delaware, Ohio
Durham, New Hampshire, in cooperation with the University of New Hampshire
Hamden, Connecticut, in cooperation with Yale University
Morgantown, West Virginia, in cooperation with West Virginia University
Parsons, West Virginia
Princeton, West Virginia
Syracuse, New York, in cooperation with the State University of New York,College of Environmental Sciences and Forestry at Syracuse University
Warren, Pennsylvania
The U. S. Department of Agriculture (USDA) prohibits discrimination in all its programs andactivities on the basis of race, color, national origin, gender, religion, age, disability, politicalbeliefs, sexual orientation, and marital or family status. (Not all prohibited bases apply to allprograms.) Persons with disabilities who require alternative means for communication ofprogram information (Braille, large print, audiotape, etc.) should contact the USDA's TARGETCenter at (202)720-2600 (voice and TDD).
To file a complaint of discrimination, write USDA, Director, Office of Civil Rights, Room 326-W,Whitten Building, 14th and Independence Avenue SW, Washington, DC 20250-9410, or call(202)720-5964 (voice and TDD). USDA is an equal opportunity provider and employer.
“Ca“Ca“Ca“Ca“Carrrrring for the Land and Seing for the Land and Seing for the Land and Seing for the Land and Seing for the Land and Serrrrrving People Thrving People Thrving People Thrving People Thrving People Through Reseaough Reseaough Reseaough Reseaough Researrrrrch”ch”ch”ch”ch”