RESEARCH Open Access Prioritization of disease microRNAs ...
9
RESEARCH Open Access Prioritization of disease microRNAs through a human phenome-microRNAome network Qinghua Jiang 1† , Yangyang Hao 1† , Guohua Wang 1 , Liran Juan 1 , Tianjiao Zhang 1 , Mingxiang Teng 1 , Yunlong Liu 2 , Yadong Wang 1* From The ISIBM International Joint Conferences on Bioinformatics, Systems Biology and Intelligent Computing (IJCBS) Shanghai, China. 3-8 August 2009 Abstract Background: The identification of disease-related microRNAs is vital for understanding the pathogenesis of diseases at the molecular level, and is critical for designing specific molecular tools for diagnosis, treatment and prevention. Experimental identification of disease-related microRNAs poses considerable difficulties. Computational analysis of microRNA-disease associations is an important complementary means for prioritizing microRNAs for further experimental examination. Results: Herein, we devised a computational model to infer potential microRNA-disease associations by prioritizing the entire human microRNAome for diseases of interest. We tested the model on 270 known experimentally verified microRNA-disease associations and achieved an area under the ROC curve of 75.80%. Moreover, we demonstrated that the model is applicable to diseases with which no known microRNAs are associated. The microRNAome-wide prioritization of microRNAs for 1,599 disease phenotypes is publicly released to facilitate future identification of disease-related microRNAs. Conclusions: We presented a network-based approach that can infer potential microRNA-disease associations and drive testable hypotheses for the experimental efforts to identify the roles of microRNAs in human diseases. Background The identification of genes associated with human dis- eases is an important goal of biomedical research. Recently, a number of computational methods have been developed to predict or prioritize disease-related protein-coding genes [1-23]. Most approaches are based on the idea that dysfunctions of functionally related pro- tein-coding genes tend to be associated with phenotypi- cally similar diseases [1,2,6,12,13,15,16,18-22]. These protein-coding genes linked to similar diseases usually interact with each other or participate in the common biological modules. Network-based approaches have also been employed to predict or prioritize new candidate disease genes based upon network linkages with known disease genes [1-3,12,23]. These approaches typically start with constructing a gene-gene association network based on one or more types of genomic and proteomic information, and then prioritize candidate protein-cod- ing genes based on network proximity to known dis- ease-related genes. For example, Franke et al . and Linghu et al. separately constructed a functional linkage network (FLN) by integrating multiple types of data, such as protein-protein interaction, microarray and Gene Ontology annotation data, and utilized the FLN for disease gene prioritization [7,23]. Lage et al. con- structed a human phenome-interactome network and scored each candidate protein based on the involvement of its direct network neighbors in similar diseases [1]. The biological interpretation of a high-scoring candidate was that the candidate was likely to be involved in the molecular mechanism of the disorder of interest. * Correspondence: [email protected] † Contributed equally 1 Center for Biomedical Informatics, School of Computer Science and Technology, Harbin Institute of Technology, Harbin, Heilongjiang, 150001, China Jiang et al. BMC Systems Biology 2010, 4(Suppl 1):S2 http://www.biomedcentral.com/1752-0509/4/S1/S2 © 2010 Wang et al; licensee BioMed Central Ltd. This is an open access article distributed under the terms of the Creative Commons Attribution License (http://creativecommons.org/licenses/by/2.0), which permits unrestricted use, distribution, and reproduction in any medium, provided the original work is properly cited.
Transcript of RESEARCH Open Access Prioritization of disease microRNAs ...
RESEARCH Open Access
Prioritization of disease microRNAs through ahuman phenome-microRNAome networkQinghua Jiang1†, Yangyang Hao1†, Guohua Wang1, Liran Juan1, Tianjiao Zhang1, Mingxiang Teng1, Yunlong Liu2,Yadong Wang1*
From The ISIBM International Joint Conferences on Bioinformatics, Systems Biology and IntelligentComputing (IJCBS)Shanghai, China. 3-8 August 2009
Abstract
Background: The identification of disease-related microRNAs is vital for understanding the pathogenesis ofdiseases at the molecular level, and is critical for designing specific molecular tools for diagnosis, treatment andprevention. Experimental identification of disease-related microRNAs poses considerable difficulties. Computationalanalysis of microRNA-disease associations is an important complementary means for prioritizing microRNAs forfurther experimental examination.
Results: Herein, we devised a computational model to infer potential microRNA-disease associations by prioritizingthe entire human microRNAome for diseases of interest. We tested the model on 270 known experimentallyverified microRNA-disease associations and achieved an area under the ROC curve of 75.80%. Moreover, wedemonstrated that the model is applicable to diseases with which no known microRNAs are associated. ThemicroRNAome-wide prioritization of microRNAs for 1,599 disease phenotypes is publicly released to facilitate futureidentification of disease-related microRNAs.
Conclusions: We presented a network-based approach that can infer potential microRNA-disease associations anddrive testable hypotheses for the experimental efforts to identify the roles of microRNAs in human diseases.
BackgroundThe identification of genes associated with human dis-eases is an important goal of biomedical research.Recently, a number of computational methods havebeen developed to predict or prioritize disease-relatedprotein-coding genes [1-23]. Most approaches are basedon the idea that dysfunctions of functionally related pro-tein-coding genes tend to be associated with phenotypi-cally similar diseases [1,2,6,12,13,15,16,18-22]. Theseprotein-coding genes linked to similar diseases usuallyinteract with each other or participate in the commonbiological modules. Network-based approaches have alsobeen employed to predict or prioritize new candidate
disease genes based upon network linkages with knowndisease genes [1-3,12,23]. These approaches typicallystart with constructing a gene-gene association networkbased on one or more types of genomic and proteomicinformation, and then prioritize candidate protein-cod-ing genes based on network proximity to known dis-ease-related genes. For example, Franke et al. andLinghu et al. separately constructed a functional linkagenetwork (FLN) by integrating multiple types of data,such as protein-protein interaction, microarray andGene Ontology annotation data, and utilized the FLNfor disease gene prioritization [7,23]. Lage et al. con-structed a human phenome-interactome network andscored each candidate protein based on the involvementof its direct network neighbors in similar diseases [1].The biological interpretation of a high-scoring candidatewas that the candidate was likely to be involved in themolecular mechanism of the disorder of interest.
* Correspondence: [email protected]† Contributed equally1Center for Biomedical Informatics, School of Computer Science andTechnology, Harbin Institute of Technology, Harbin, Heilongjiang, 150001,China
Jiang et al. BMC Systems Biology 2010, 4(Suppl 1):S2http://www.biomedcentral.com/1752-0509/4/S1/S2
© 2010 Wang et al; licensee BioMed Central Ltd. This is an open access article distributed under the terms of the Creative CommonsAttribution License (http://creativecommons.org/licenses/by/2.0), which permits unrestricted use, distribution, and reproduction inany medium, provided the original work is properly cited.

Growing evidence indicates that microRNAs playimportant roles in the development and progression ofhuman diseases, and are critical for the prognosis, diag-nosis and the evaluation of treatment responses forthese diseases [24-37]. Jiang et al. and Lu et al. indepen-dently developed two manually curated database–miR2-Disease [38] and Human MicroRNA Disease Database(HMDD) [39], which aim at providing a comprehensiveresource of experimentally verified microRNA-diseaseassociations. However, one major issue in microRNAstudies is the lack of bioinformatics methods to inferpotential microRNA-disease associations that can guidefurther biological experiments.MicroRNAs exert their biological functions through
suppression of their target genes [40]. Accumulatingstudies indicate that microRNAs usually perform relatedfunctions by targeting either the same genes or func-tionally related genes in a coordinated manner[34,35,41-48]. It has become an increasingly importantand informative approach to analyze biological systemsand disease mechanisms in networks of genes and dis-eases [6,12,21,49,50]. Establishing a functional relation-ship between two microRNAs by their target genes andfurther constructing a functionally related microRNA
network will be useful for understanding the roles ofmicroRNAs in diseased states.Herein, we propose a computational approach to infer
potential microRNA-disease associations by prioritizingthe entire human microRNAome for diseases of interest.It was a logical extension of previous network-basedmethod for predicting or prioritizing disease-related pro-tein-coding genes. We first constructed a functionallyrelated microRNA network (Figure 1A ) and a humanphenome-microRNAome network (Figure 1B). We sub-sequently examined whether functionally related micro-RNAs tend to be associated with phenotypically similardiseases and prioritized microRNAs for human diseases.
ResultsConstruction of human phenome-microRNAome networkIn order to prioritize the entire microRNAome for dis-eases, we constructed a functionally related microRNAnetwork by assuming that two microRNAs are functionallyrelated if the overlap between their target genes was statis-tically significant (Figure 1A). A p-value from Fisher’sExact Test was used to evaluate the overlap, and wasadjusted by the Benjamini-Hochberg correction [51,52].Two microRNAs were considered to be functionally
Figure 1 Construction and application of a human phenome-microRNAome network. (A) Construction of a functionally related microRNAnetwork. An edge is placed between two microRNAs if they share significant number of target genes. (B) Application of the phenome-microRNAome network to infer new microRNA-disease associations. A gray edge connects known disease-related microRNA to thecorresponding disease. Disease 2 has a related microRNA (miR-6), and disease 4 doesn’t have any related microRNAs. The red dash linesrepresent the potential microRNA-disease associations that might be predicted by this network model.
Jiang et al. BMC Systems Biology 2010, 4(Suppl 1):S2http://www.biomedcentral.com/1752-0509/4/S1/S2
Page 2 of 9

related if the adjusted p-value was less than 0.001. Follow-ing this strategy, and using microRNA-target dataset pre-dicted by Probability of Interaction by Target Accessibility(PITA) [53], we obtained a functionally related microRNAnetwork that included 9,249 relationships (edges) between514 microRNAs (nodes). We subsequently constructed ahypothetical human phenome-microRNAome network byintegrating the microRNA network with a phenome net-work [1,12,20] using 270 experimentally verified micro-RNA-disease associations (Figure 1B).
Functionally related microRNAs tend to be associatedwith phenotypically similar diseasesOur model was based on the notion that functionallyrelated microRNAs tend to be associated with phenoty-pically similar diseases. We examined it by addressingtwo questions: (1) whether disease pairs associated withcommon microRNAs are phenotypically more similar,as opposed to randomly selected phenotype pairs; and(2) whether the microRNA pairs associated with com-mon diseases are functionally more related. Because wehave constructed a functionally related microRNA net-work, the functional relatedness between two micro-RNAs can be measured through the number of sharednetwork neighbors and the length of the shortest pathin the microRNA network. We chose to use these twomeasures mainly based on the standpoint that, in afunctional network, if two nodes are less distant from
each other or share more neighbors, they are function-ally more related. Herein, we used the function e-x toconvert the length of the shortest path to the degree offunctional relatedness between two microRNAs.A total of 349 disease pairs were identified to be asso-
ciated with common microRNAs, and 1,252 microRNApairs were found to be associated with common diseases.To evaluate the statistical significance of the phenotypicsimilarity between diseases associated with commonmicroRNAs, we generated 10,000 negative control sets andcalculated an average phenotypic similarity score for eachset containing 349 disease pairs that were randomlysampled from the human phenome. The average phenoty-pic similarity score between diseases associated with com-mon microRNAs was significantly higher than thesimilarity of randomly selected phenotype pairs from thehuman phenome (p < 10-4, Figure 2A). In a similar man-ner, we generated another 10,000 negative control sets andcalculated the average functional relatedness for each setcontaining 1,252 microRNA pairs randomly sampled fromthe microRNA network. The microRNA pairs associatedwith common diseases shared more common networkneighbors (p < 10-4, Figure 2B), and were less distant fromeach other in the microRNA network (p < 10-4, Figure 2C).
Performance evaluationIn order to assess the power of our model to infermicroRNA-disease associations by prioritizing the entire
Figure 2 Functionally related microRNAs tend to be associated with Phenotypically similar diseases. (A) The observed averagephenotypic similarity score (arrow) of 349 phenotype pairs associated with common microRNAs and the distribution of expected averagephenotypic similarity scores (curve) of 10,000 random control sets containing the same number of randomly sampled phenotype pairs (p<10-4).(B, C) The observed average functional relatedness (arrow) of 1,252 microRNA pairs associated with common diseases and the distribution of theexpected average functional relatedness (curve) of 10,000 random control sets containing the same number of randomly sampled microRNApairs (p<10-4). The measures for functional relatedness between microRNAs are the average number of shared network neighbors and a functionvalue that is derived from the shortest path length.
Jiang et al. BMC Systems Biology 2010, 4(Suppl 1):S2http://www.biomedcentral.com/1752-0509/4/S1/S2
Page 3 of 9

microRNAome, we performed the leave-one-out cross-validation on 270 known experimentally verified micro-RNA-disease associations. Each association was left outonce as the testing case, being referred to as <m, d>.For the disease d, the microRNA m was termed ‘defec-tor’ microRNA. We prioritized the entire microRNAomeaccording to the scores derived from the scoring system.Note that the score can be computed only for all micro-RNAs in the microRNA network, which was termed theranked microRNAome. If the ranking of the ‘defector’microRNA exceeds a given threshold, the model suc-cessfully predicts the experimentally verified association<m, d>.We calculated the sensitivity and specificity for each
threshold. Sensitivity refers to the percentage of the
‘defector’ microRNAs whose ranking is higher than agiven threshold, namely the ratio of the successfullypredicted experimentally verified microRNA-disease asso-ciations to the total experimentally verified microRNA-disease associations. Specificity refers to the percentageof microRNAs that are below the threshold. The samecomputational strategies were applied by Endeavour [13]and GeneWanderer [2]. A receiver-operating characteris-tics (ROC) curve was plotted by varying the threshold,and the standard area under curve (AUC) was calculated.When our model was tested on 270 experimentally veri-fied microRNA-disease associations, an AUC of 75.80%was achieved (red curve in Figure 3), suggesting that ourmodel can recover the known experimentally verifiedmicroRNA-disease associations, and therefore has the
Figure 3 Leave-one-out cross-validation results. The red curve was derived from 270 experimentally verified microRNA-disease associations.The blue curve represents the performance of the model to prioritize microRNAs for diseases with which no microRNAs have beenexperimentally verified to be associated. The green curve was obtained from 270 randomly generated microRNA-disease associations.
Jiang et al. BMC Systems Biology 2010, 4(Suppl 1):S2http://www.biomedcentral.com/1752-0509/4/S1/S2
Page 4 of 9
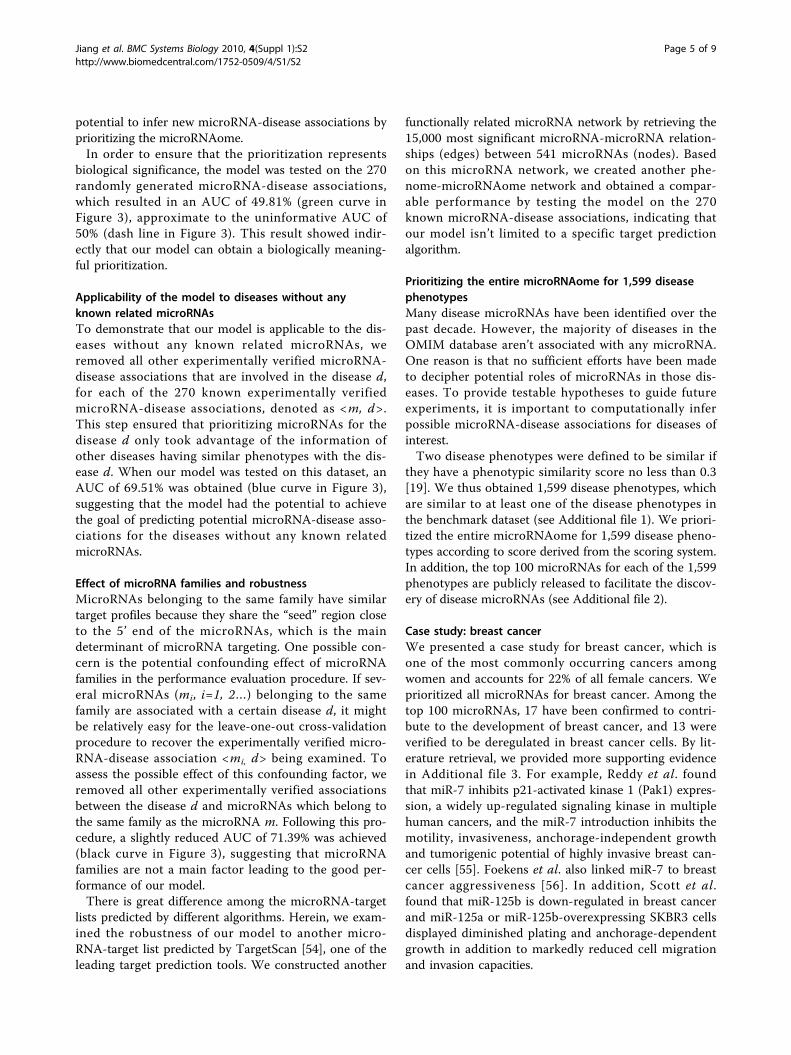
potential to infer new microRNA-disease associations byprioritizing the microRNAome.In order to ensure that the prioritization represents
biological significance, the model was tested on the 270randomly generated microRNA-disease associations,which resulted in an AUC of 49.81% (green curve inFigure 3), approximate to the uninformative AUC of50% (dash line in Figure 3). This result showed indir-ectly that our model can obtain a biologically meaning-ful prioritization.
Applicability of the model to diseases without anyknown related microRNAsTo demonstrate that our model is applicable to the dis-eases without any known related microRNAs, weremoved all other experimentally verified microRNA-disease associations that are involved in the disease d,for each of the 270 known experimentally verifiedmicroRNA-disease associations, denoted as <m, d>.This step ensured that prioritizing microRNAs for thedisease d only took advantage of the information ofother diseases having similar phenotypes with the dis-ease d. When our model was tested on this dataset, anAUC of 69.51% was obtained (blue curve in Figure 3),suggesting that the model had the potential to achievethe goal of predicting potential microRNA-disease asso-ciations for the diseases without any known relatedmicroRNAs.
Effect of microRNA families and robustnessMicroRNAs belonging to the same family have similartarget profiles because they share the “seed” region closeto the 5’ end of the microRNAs, which is the maindeterminant of microRNA targeting. One possible con-cern is the potential confounding effect of microRNAfamilies in the performance evaluation procedure. If sev-eral microRNAs (mi, i=1, 2…) belonging to the samefamily are associated with a certain disease d, it mightbe relatively easy for the leave-one-out cross-validationprocedure to recover the experimentally verified micro-RNA-disease association <mi, d> being examined. Toassess the possible effect of this confounding factor, weremoved all other experimentally verified associationsbetween the disease d and microRNAs which belong tothe same family as the microRNA m. Following this pro-cedure, a slightly reduced AUC of 71.39% was achieved(black curve in Figure 3), suggesting that microRNAfamilies are not a main factor leading to the good per-formance of our model.There is great difference among the microRNA-target
lists predicted by different algorithms. Herein, we exam-ined the robustness of our model to another micro-RNA-target list predicted by TargetScan [54], one of theleading target prediction tools. We constructed another
functionally related microRNA network by retrieving the15,000 most significant microRNA-microRNA relation-ships (edges) between 541 microRNAs (nodes). Basedon this microRNA network, we created another phe-nome-microRNAome network and obtained a compar-able performance by testing the model on the 270known microRNA-disease associations, indicating thatour model isn’t limited to a specific target predictionalgorithm.
Prioritizing the entire microRNAome for 1,599 diseasephenotypesMany disease microRNAs have been identified over thepast decade. However, the majority of diseases in theOMIM database aren’t associated with any microRNA.One reason is that no sufficient efforts have been madeto decipher potential roles of microRNAs in those dis-eases. To provide testable hypotheses to guide futureexperiments, it is important to computationally inferpossible microRNA-disease associations for diseases ofinterest.Two disease phenotypes were defined to be similar if
they have a phenotypic similarity score no less than 0.3[19]. We thus obtained 1,599 disease phenotypes, whichare similar to at least one of the disease phenotypes inthe benchmark dataset (see Additional file 1). We priori-tized the entire microRNAome for 1,599 disease pheno-types according to score derived from the scoring system.In addition, the top 100 microRNAs for each of the 1,599phenotypes are publicly released to facilitate the discov-ery of disease microRNAs (see Additional file 2).
Case study: breast cancerWe presented a case study for breast cancer, which isone of the most commonly occurring cancers amongwomen and accounts for 22% of all female cancers. Weprioritized all microRNAs for breast cancer. Among thetop 100 microRNAs, 17 have been confirmed to contri-bute to the development of breast cancer, and 13 wereverified to be deregulated in breast cancer cells. By lit-erature retrieval, we provided more supporting evidencein Additional file 3. For example, Reddy et al. foundthat miR-7 inhibits p21-activated kinase 1 (Pak1) expres-sion, a widely up-regulated signaling kinase in multiplehuman cancers, and the miR-7 introduction inhibits themotility, invasiveness, anchorage-independent growthand tumorigenic potential of highly invasive breast can-cer cells [55]. Foekens et al. also linked miR-7 to breastcancer aggressiveness [56]. In addition, Scott et al.found that miR-125b is down-regulated in breast cancerand miR-125a or miR-125b-overexpressing SKBR3 cellsdisplayed diminished plating and anchorage-dependentgrowth in addition to markedly reduced cell migrationand invasion capacities.
Jiang et al. BMC Systems Biology 2010, 4(Suppl 1):S2http://www.biomedcentral.com/1752-0509/4/S1/S2
Page 5 of 9

DiscussionWe demonstrated that the method we proposed achievedgood performance in recovering known, experimentallyverified microRNA-disease associations. Using the model,we prioritized the entire microRNAome for 1,599 dis-eases, most of which have not been linked to any micro-RNAs. The power of our model can be attributed toseveral factors. First, we constructed a functionallyrelated microRNA network, which can capture the biolo-gical characteristics of some microRNAs that tend toexert the same or similar functions by the inhibition ofcommon target genes in a coordinated manner. Second,we took full advantage of large-scale phenotype similarityscore information, whose significance has been con-firmed in several previous studies aiming at the identifi-cation of disease-related protein-coding genes [1,12].Third, we used experimentally verified microRNA-dis-ease associations, which allow connecting the human dis-ease network with the microRNA network, and thereforeprovide underlying knowledge for the role of microRNAin disease pathogenesis.
There are several potential limitations. First, theknown experimentally verified microRNA-disease asso-ciations were insufficient. Second, the functionallyrelated microRNA network was constructed based onthe standpoint that two microRNAs are functionallyrelated if the number of shared target genes is statisti-cally significant. In reality, two microRNAs may befunctionally related when their target genes reside inthe same cellular pathways or functional modules[43,57], rather than overlap significantly. Therefore,integrating other bioinformatics sources such as GeneOntology annotation and protein-protein interactionnetwork data might improve model performance. Inaddition, modeling rules connecting phenotype withmicroRNA network may represent an important step onthe path of the emerging field of “network medicine”[21,58].
ConclusionsEvidence continually reinforces the notion that function-ally related protein-coding genes are usually associated
Figure 4 Steps in prioritizing the entire microRNAome for a disease of interest. First, a virtual pull-down of each candidate generates ahypothetical microRNA module, defined as a given microRNA (the center of the module) plus its direct network neighbors in the functionallyrelated microRNA network. Second, in each microRNA module, the microRNAs linked to diseases that have similar phenotypes with the diseasebeing investigated are identified. Finally, all candidates are scored and prioritized.
Jiang et al. BMC Systems Biology 2010, 4(Suppl 1):S2http://www.biomedcentral.com/1752-0509/4/S1/S2
Page 6 of 9
with phenotypically similar diseases. Based on thisnotion, many innovative methodologies have been pro-posed to predict or prioritize protein-coding genes forcomplex diseases [1-3,7,11,12]. In this study, we studiedthe functional correlation of microRNAs and found thatdisease pairs associated with common microRNAs werephenotypically more similar, and the microRNA pairslinked to common diseases were functionally morerelated. We further constructed an integrated phenome-microRNAome network, through which we devised amethod that can recover the known experimentally veri-fied microRNA-disease associations and prioritize theentire microRNAome for 1,599 diseases. The top 100microRNAs for each of the 1,599 diseases are releasedpublicly, which will provide testable hypotheses to guidefurther experiments and contribute to the identificationof true disease-related microRNAs.
MethodsData sourcesWe downloaded the disease phenotype similarity scoresfrom the MimMiner [19], developed by Driel et al. whocomputed a phenotype similarity score for each pheno-type pair by the text mining analysis of their phenotypedescriptions in the Online Mendelian Inheritance inMan (OMIM) database [59]. The disease phenotype net-work was constructed based on the similarity score.Two phenotypes were considered to be similar and werelinked by an edge if their similarity score was no lessthan 0.3. The similarity score is equal to 1 if two pheno-types are identical. The phenotypic similarity score hasbeen successfully used to predict or prioritize disease-related protein-coding genes [3,12].PITA [53] is a leading microRNA target prediction
approach that considers multiple factors, such as seedpairing, site number, overall predicted pairing stabilityand predicted site accessibility. We downloaded thePITA target catalog version 6 (3/15 flank ALL 31-Aug-08) and retrieved 145,872 predicted associations between670 microRNAs and 14,826 target genes with a scoreless than -10.0, a threshold suggested by PITA, In addi-tion, we downloaded 205,587 associations between 675microRNAs and 11,758 target genes predicted by Tar-getScan (version5.1, conserved sites) [54], another lead-ing target prediction algorithm.miR2Disease [38] and HMDD [39] databases provide
comprehensive resources for microRNA deregulation inhuman disease. From these databases, we selected 270high-quality experimentally verified microRNA-diseaseassociations that microRNA deregulation has beenexperimentally verified to contribute to the diseasedevelopment. For instance, Ma et al. reported thathighly expressed miR-10b initiates tumor invasion andmetastasis in breast cancer through translational
inhibition of HOXD10, and eventually increases expres-sion of RHOC, a pro-metastatic gene [60]. The 270associations (see Additional file 1) were used as thebenchmark dataset for the performance evaluation ofour model.microRNA family dataset was retrieved from miRBase
database [61].
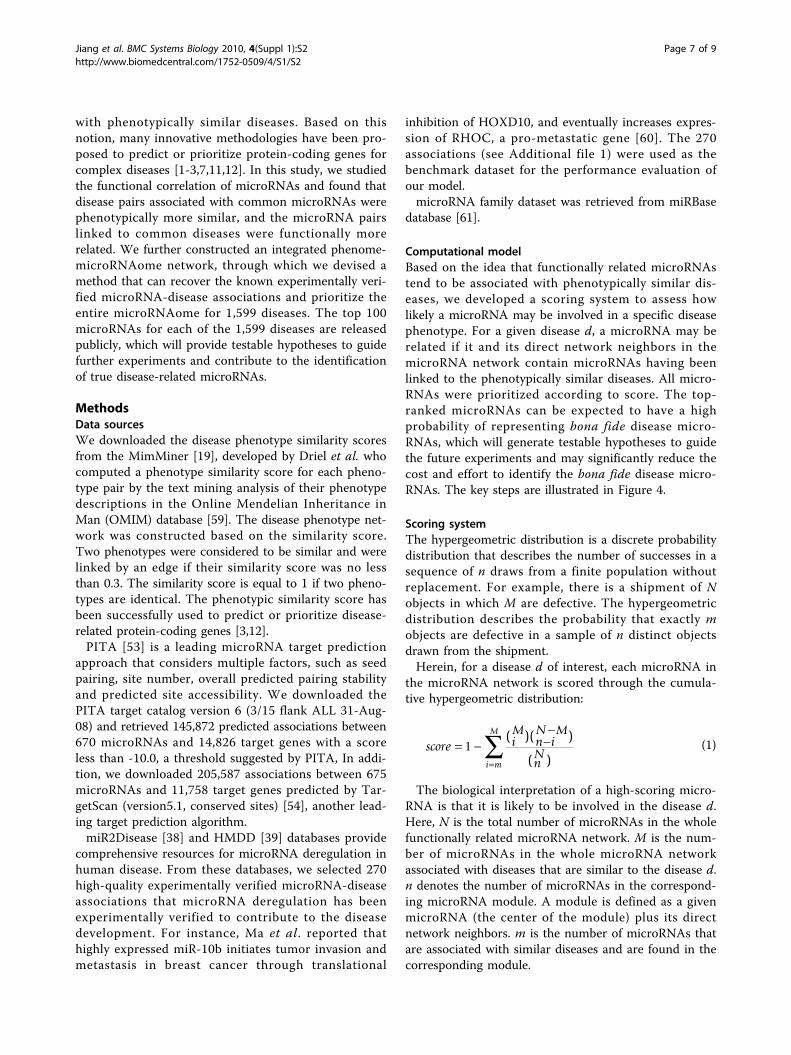
Computational modelBased on the idea that functionally related microRNAstend to be associated with phenotypically similar dis-eases, we developed a scoring system to assess howlikely a microRNA may be involved in a specific diseasephenotype. For a given disease d, a microRNA may berelated if it and its direct network neighbors in themicroRNA network contain microRNAs having beenlinked to the phenotypically similar diseases. All micro-RNAs were prioritized according to score. The top-ranked microRNAs can be expected to have a highprobability of representing bona fide disease micro-RNAs, which will generate testable hypotheses to guidethe future experiments and may significantly reduce thecost and effort to identify the bona fide disease micro-RNAs. The key steps are illustrated in Figure 4.
Scoring systemThe hypergeometric distribution is a discrete probabilitydistribution that describes the number of successes in asequence of n draws from a finite population withoutreplacement. For example, there is a shipment of Nobjects in which M are defective. The hypergeometricdistribution describes the probability that exactly mobjects are defective in a sample of n distinct objectsdrawn from the shipment.Herein, for a disease d of interest, each microRNA in
the microRNA network is scored through the cumula-tive hypergeometric distribution:
score iM
n iN M
nN
i m
M
= − −−
=∑1
( )( )
( )(1)
The biological interpretation of a high-scoring micro-RNA is that it is likely to be involved in the disease d.Here, N is the total number of microRNAs in the wholefunctionally related microRNA network. M is the num-ber of microRNAs in the whole microRNA networkassociated with diseases that are similar to the disease d.n denotes the number of microRNAs in the correspond-ing microRNA module. A module is defined as a givenmicroRNA (the center of the module) plus its directnetwork neighbors. m is the number of microRNAs thatare associated with similar diseases and are found in thecorresponding module.
Jiang et al. BMC Systems Biology 2010, 4(Suppl 1):S2http://www.biomedcentral.com/1752-0509/4/S1/S2
Page 7 of 9

Additional file 1: 270 experimentally verified microRNA-diseaseassociations.Each line represents an association between a microRNAand a disease.
Additional file 2: 100 top-ranked microRNAs for each of 1,599diseases.Each line represents a potential association between microRNAand disease, including MIM ID, microRNA ID and score.
Additional file 3: Literature evidence to support the top 100microRNAs for breast cancer.
AcknowledgementsThe authors also thank Dr. George Malacinski and Tongbin Li for theirvaluable suggestions. This work is supported by the China 863 High-TechProgram 2007AA02Z302 (Y.L.), China Natural Science Foundation (60973078to Y.W. 60671013 to Y.W., and 60901075 to G.W.), the U.S. National Institutesof Health grants AA017941 (Y.L.), and CA113001 (Y.L.). The authors also thankthe wonderful gift from the 100 Voices of Hope Project.This article has been published as part of BMC Systems Biology Volume 4Supplement 1, 2010: Proceedings of the ISIBM International JointConferences on Bioinformatics, Systems Biology and Intelligent Computing(IJCBS). The full contents of the supplement are available online athttp://www.biomedcentral.com/1752-0509/4?issue=S1.
Author details1Center for Biomedical Informatics, School of Computer Science andTechnology, Harbin Institute of Technology, Harbin, Heilongjiang, 150001,China . 2Center for Computational Biology and Bioinformatics, IndianaUniversity School of Medicine, Indianapolis, IN 46202, USA.
Authors’ contributionsYW and YL conceived and designed the experiments. QJ, YH, GW, TZ andMT performed the experiments and analyzed the data. QJ, YW and YL wrotethe paper.
Competing interestsThe authors declare that they have no competing interests
Published: 28 May 2010
References1. Lage K, Karlberg EO, Storling ZM, Olason PI, Pedersen AG, Rigina O,
Hinsby AM, Tumer Z, Pociot F, Tommerup N, et al: A human phenome-interactome network of protein complexes implicated in geneticdisorders. Nat Biotechnol 2007, 25:309-316.
2. Kohler S, Bauer S, Horn D, Robinson PN: Walking the interactome forprioritization of candidate disease genes. Am J Hum Genet 2008,82:949-958.
3. Ala U, Piro RM, Grassi E, Damasco C, Silengo L, Oti M, Provero P,Di Cunto F: Prediction of human disease genes by human-mouseconserved coexpression analysis. PLoS Comput Biol 2008, 4:e1000043.
4. Gaulton KJ, Mohlke KL, Vision TJ: A computational system to selectcandidate genes for complex human traits. Bioinformatics 2007,23:1132-1140.
5. George RA, Liu JY, Feng LL, Bryson-Richardson RJ, Fatkin D, Wouters MA:Analysis of protein sequence and interaction data for candidate diseasegene prediction. Nucleic Acids Res 2006, 34:e130.
6. Goh KI, Cusick ME, Valle D, Childs B, Vidal M, Barabasi AL: The humandisease network. Proc Natl Acad Sci U S A 2007, 104:8685-8690.
7. Franke L, van Bakel H, Fokkens L, de Jong ED, Egmont-Petersen M,Wijmenga C: Reconstruction of a functional human gene network, withan application for prioritizing positional candidate genes. Am J HumGenet 2006, 78:1011-1025.
8. Scharfe C, Lu HH, Neuenburg JK, Allen EA, Li GC, Klopstock T, Cowan TM,Enns GM, Davis RW: Mapping gene associations in human mitochondriausing clinical disease phenotypes. PLoS Comput Biol 2009, 5:e1000374.
9. Adie EA, Adams RR, Evans KL, Porteous DJ, Pickard BS: Speeding diseasegene discovery by sequence based candidate prioritization. BMCBioinformatics 2005, 6:55.
10. Freudenberg J, Propping P: A similarity-based method for genome-wideprediction of disease-relevant human genes. Bioinformatics 2002,18(Suppl 2):S110-115.
11. Oti M, Snel B, Huynen MA, Brunner HG: Predicting disease genes usingprotein-protein interactions. Journal of Medical Genetics 2006, 43.
12. Wu X, Jiang R, Zhang MQ, Li S: Network-based global inference of humandisease genes. Mol Syst Biol 2008, 4:189.
13. Aerts S, Lambrechts D, Maity S, Van Loo P, Coessens B, De Smet F,Tranchevent LC, De Moor B, Marynen P, Hassan B, et al: Gene prioritizationthrough genomic data fusion (vol 24, pg 537, 2006). Nature Biotechnology2006, 24:719-719.
14. Lopez-Bigas N, Ouzounis CA: Genome-wide identification of genes likelyto be involved in human genetic disease. Nucleic Acids Research 2004,32:3108-3114.
15. Radivojac P, Peng K, Clark WT, Peters BJ, Mohan A, Boyle SM, Mooney SD:An integrated approach to inferring gene-disease associations inhumans. Proteins 2008, 72:1030-1037.
16. Perez-Iratxeta C, Wjst M, Bork P, Andrade MA: G2D: a tool for mininggenes associated with disease. BMC Genet 2005, 6:45.
17. Adie EA, Adams RR, Evans KL, Porteous DJ, Pickard BS: SUSPECTS: enablingfast and effective prioritization of positional candidates. Bioinformatics2006, 22:773-774.
18. Perez-Iratxeta C, Bork P, Andrade MA: Association of genes to geneticallyinherited diseases using data mining. Nature Genetics 2002, 31:316-319.
19. van Driel MA, Bruggeman J, Vriend G, Brunner HG, Leunissen JA: A text-mining analysis of the human phenome. Eur J Hum Genet 2006,14:535-542.
20. Oti M, Huynen MA, Brunner HG: Phenome connections. Trends Genet 2008,24:103-106.
21. Zanzoni A, Soler-Lopez M, Aloy P: A network medicine approach tohuman disease. FEBS Lett 2009.
22. Oti M, Brunner HG: The modular nature of genetic diseases. Clin Genet2007, 71:1-11.
23. Linghu B, Snitkin ES, Hu Z, Xia Y, Delisi C: Genome-wide prioritization ofdisease genes and identification of disease-disease associations from anintegrated human functional linkage network. Genome Biol 2009, 10:R91.
24. Calin GA, Croce CM: MicroRNA signatures in human cancers. Nat RevCancer 2006, 6:857-866.
25. Esquela-Kerscher A, Trang P, Wiggins JF, Patrawala L, Cheng A, Ford L,Weidhaas JB, Brown D, Bader AG, Slack FJ: The let-7 microRNA reducestumor growth in mouse models of lung cancer. Cell Cycle 2008, 7:759-764.
26. Huang Q, Gumireddy K, Schrier M, le Sage C, Nagel R, Nair S, Egan DA, Li A,Huang G, Klein-Szanto AJ, et al: The microRNAs miR-373 and miR-520cpromote tumour invasion and metastasis. Nat Cell Biol 2008, 10:202-210.
27. Lu J, Getz G, Miska EA, Alvarez-Saavedra E, Lamb J, Peck D, Sweet-Cordero A, Ebert BL, Mak RH, Ferrando AA, et al: MicroRNA expressionprofiles classify human cancers. Nature 2005, 435:834-838.
28. Markou A, Tsaroucha EG, Kaklamanis L, Fotinou M, Georgoulias V,Lianidou ES: Prognostic value of mature microRNA-21 and microRNA-205overexpression in non-small cell lung cancer by quantitative real-timeRT-PCR. Clin Chem 2008, 54:1696-1704.
29. Nasser MW, Datta J, Nuovo G, Kutay H, Motiwala T, Majumder S, Wang B,Suster S, Jacob ST, Ghoshal K: Down-regulation of micro-RNA-1 (miR-1) inlung cancer. Suppression of tumorigenic property of lung cancer cellsand their sensitization to doxorubicin-induced apoptosis by miR-1. J BiolChem 2008, 283:33394-33405.
30. Slack FJ, Weidhaas JB: MicroRNA in cancer prognosis. N Engl J Med 2008,359:2720-2722.
31. Yang B, Lin H, Xiao J, Lu Y, Luo X, Li B, Zhang Y, Xu C, Bai Y, Wang H, et al:The muscle-specific microRNA miR-1 regulates cardiac arrhythmogenicpotential by targeting GJA1 and KCNJ2. Nat Med 2007, 13:486-491.
32. Yu SL, Chen HY, Chang GC, Chen CY, Chen HW, Singh S, Cheng CL, Yu CJ,Lee YC, Chen HS, et al: MicroRNA signature predicts survival and relapsein lung cancer. Cancer Cell 2008, 13:48-57.
33. Chen RW, Bemis LT, Amato CM, Myint H, Tran H, Birks DK, Eckhardt SG,Robinson WA: Truncation in CCND1 mRNA alters miR-16-1 regulation inmantle cell lymphoma. Blood 2008, 112:822-829.
34. Duisters RF, Tijsen AJ, Schroen B, Leenders JJ, Lentink V, van der Made I,Herias V, van Leeuwen RE, Schellings MW, Barenbrug P, et al: miR-133 andmiR-30 regulate connective tissue growth factor: implications for a role
Jiang et al. BMC Systems Biology 2010, 4(Suppl 1):S2http://www.biomedcentral.com/1752-0509/4/S1/S2
Page 8 of 9

of microRNAs in myocardial matrix remodeling. Circ Res 2009,104:170-178, 176p following 178.
35. Miller TE, Ghoshal K, Ramaswamy B, Roy S, Datta J, Shapiro CL, Jacob S,Majumder S: MicroRNA-221/222 confers tamoxifen resistance in breastcancer by targeting p27Kip1. J Biol Chem 2008, 283:29897-29903.
36. Weinberg MS, Wood MJ: Short non-coding RNA biology andneurodegenerative disorders: novel disease targets and therapeutics.Hum Mol Genet 2009, 18:R27-39.
37. Xin FX, Li M, Balch C, Thomson M, Fan MY, Liu Y, Hammond SM, Kim S,Nephew KP: Computational analysis of microRNA profiles and theirtarget genes suggests significant involvement in breast cancerantiestrogen resistance. Bioinformatics 2009, 25:430-434.
38. Jiang Q, Wang Y, Hao Y, Juan L, Teng M, Zhang X, Li M, Wang G, Liu Y:miR2Disease: a manually curated database for microRNA deregulation inhuman disease. Nucleic Acids Res 2009, 37:D98-104.
39. Lu M, Zhang Q, Deng M, Miao J, Guo Y, Gao W, Cui Q: An analysis ofhuman microRNA and disease associations. PLoS ONE 2008, 3:e3420.
40. Bartel DP: MicroRNAs: genomics, biogenesis, mechanism, and function.Cell 2004, 116:281-297.
41. Georges SA, Biery MC, Kim SY, Schelter JM, Guo J, Chang AN, Jackson AL,Carleton MO, Linsley PS, Cleary MA, Chau BN: Coordinated regulation ofcell cycle transcripts by p53-Inducible microRNAs, miR-192 and miR-215.Cancer Res 2008, 68:10105-10112.
42. Lee Y, Samaco RC, Gatchel JR, Thaller C, Orr HT, Zoghbi HY: miR-19, miR-101 and miR-130 co-regulate ATXN1 levels to potentially modulate SCA1pathogenesis. Nat Neurosci 2008, 11:1137-1139.
43. Packer AN, Xing Y, Harper SQ, Jones L, Davidson BL: The bifunctionalmicroRNA miR-9/miR-9* regulates REST and CoREST and isdownregulated in Huntington’s disease. J Neurosci 2008, 28:14341-14346.
44. Zhao JJ, Lin JH, Yang H, Kong W, He LL, Ma X, Coppola D, Cheng JQ:MicroRNA-221/222 Negatively Regulates Estrogen Receptor alpha and IsAssociated with Tamoxifen Resistance in Breast Cancer. Journal ofBiological Chemistry 2008, 283:31079-31086.
45. Mayoral RJ, Pipkin ME, Pachkov M, van Nimwegen E, Rao A, Monticelli S:MicroRNA-221-222 regulate the cell cycle in mast cells. J Immunol 2009,182:433-445.
46. Gabor B, Katalin O, Farkas IJ: Human microRNAs co-silence in well-separated groups and have different predicted essentialities.Bioinformatics 2009, 25:1063-1069.
47. Xu JZ, Wong CW: A computational screen for mouse signaling pathwaystargeted by microRNA clusters. Rna-a Publication of the Rna Society 2008,14:1276-1283.
48. Mookherjee S, Sinha M, Mukhopadhyay S, Bhattacharyya N, Mohanty P:MicroRNA Interaction network in human: implications of clusteredmicroRNA in biological pathways and genetic diseases. Arxiv preprintarXiv:09014211 2009.
49. Ideker T, Sharan R: Protein networks in disease. Genome Res 2008,18:644-652.
50. Barabasi AL, Oltvai ZN: Network biology: understanding the cell’sfunctional organization. Nat Rev Genet 2004, 5:101-113.
51. Benjamini Y, Hochberg Y: Controlling the False Discovery Rate - aPractical and Powerful Approach to Multiple Testing. Journal of the RoyalStatistical Society Series B-Methodological 1995, 57:289-300.
52. Benjamini Y, Yekutieli D: The control of the false discovery rate inmultiple testing under dependency. Annals of Statistics 2001,29:1165-1188.
53. Kertesz M, Iovino N, Unnerstall U, Gaul U, Segal E: The role of siteaccessibility in microRNA target recognition. Nat Genet 2007,39:1278-1284.
54. Lewis BP, Shih IH, Jones-Rhoades MW, Bartel DP, Burge CB: Prediction ofmammalian microRNA targets. Cell 2003, 115:787-798.
55. Reddy SD, Ohshiro K, Rayala SK, Kumar R: MicroRNA-7, a homeobox D10target, inhibits p21-activated kinase 1 and regulates its functions. CancerRes 2008, 68:8195-8200.
56. Foekens JA, Sieuwerts AM, Smid M, Look MP, de Weerd V, Boersma AW,Klijn JG, Wiemer EA, Martens JW: Four miRNAs associated withaggressiveness of lymph node-negative, estrogen receptor-positivehuman breast cancer. Proc Natl Acad Sci U S A 2008, 105:13021-13026.
57. Crosby ME, Kulshreshtha R, Ivan M, Glazer PM: MicroRNA regulation ofDNA repair gene expression in hypoxic stress. Cancer Res 2009,69:1221-1229.
58. Barabasi AL: Network medicine–from obesity to the “diseasome”. N Engl JMed 2007, 357:404-407.
59. Hamosh A, Scott AF, Amberger JS, Bocchini CA, McKusick VA: OnlineMendelian Inheritance in Man (OMIM), a knowledgebase of humangenes and genetic disorders. Nucleic Acids Res 2005, 33:D514-517.
60. Ma L, Teruya-Feldstein J, Weinberg RA: Tumour invasion and metastasisinitiated by microRNA 10b in breast cancer. Nature 2007, 449:682-U682.
61. Griffiths-Jones S, Saini HK, van Dongen S, Enright AJ: miRBase: tools formicroRNA genomics. Nucleic Acids Res 2008, 36:D154-158.
doi:10.1186/1752-0509-4-S1-S2Cite this article as: Jiang et al.: Prioritization of disease microRNAsthrough a human phenome-microRNAome network. BMC SystemsBiology 2010 4(Suppl 1):S2.
Submit your next manuscript to BioMed Centraland take full advantage of:
• Convenient online submission
• Thorough peer review
• No space constraints or color figure charges
• Immediate publication on acceptance
• Inclusion in PubMed, CAS, Scopus and Google Scholar
• Research which is freely available for redistribution
Submit your manuscript at www.biomedcentral.com/submit
Jiang et al. BMC Systems Biology 2010, 4(Suppl 1):S2http://www.biomedcentral.com/1752-0509/4/S1/S2
Page 9 of 9