RESEARCH Open Access Modern geographical … Open Access Modern geographical reconnaissance of...
12
RESEARCH Open Access Modern geographical reconnaissance of target populations in malaria elimination zones Gerard C Kelly 1* , Jeffrey Hii 2 , William Batarii 3 , Wesley Donald 4 , Erick Hale 3 , Johnny Nausien 4 , Scott Pontifex 5 , Andrew Vallely 1 , Marcel Tanner 6 , Archie Clements 1 Abstract Background: Geographical Reconnaissance (GR) operations using Personal Digital Assistants (PDAs) and Global Positioning Systems (GPS) have been conducted in the elimination provinces of Temotu, Solomon Islands and Tafea, Republic of Vanuatu. These operations aimed to examine modern approaches to GR to define the spatial distribution of target populations to support contemporary malaria elimination interventions. Methods: Three GR surveys were carried out covering the outer islands of Temotu Province (October - November, 2008); Santa Cruz Island, Temotu Province (February 2009) and Tanna Island, Tafea Province (July - September 2009). Integrated PDA/GPS handheld units were used in the field to rapidly map and enumerate households, and collect associated population and household structure data to support priority elimination interventions, including bed net distribution, indoor residual spraying (IRS) and malaria case surveillance. Data were uploaded and analysed in customized Geographic Information System (GIS) databases to produce household distribution maps and generate relevant summary information pertaining to the GR operations. Following completion of field operations, group discussions were also conducted to review GR approaches and technology implemented. Results: 10,459 households were geo-referenced and mapped. A population of 43,497 and 30,663 household structures were recorded during the three GR surveys. The spatial distribution of the population was concentrated in coastal village clusters. Survey operations were completed over a combined total of 77 field days covering a total land mass area of approximately 1103.2 km 2 . An average of 45 households, 118 structures and a population of 184 people were recorded per handheld device per day. Geo-spatial household distribution maps were also produced immediately following the completion of GR fieldwork. An overall high acceptability of modern GR techniques and technology was observed by both field operations staff and communities. Conclusion: GR implemented using modern techniques has provided an effective and efficient operational tool for rapidly defining the spatial distribution of target populations in designated malaria elimination zones in Solomon Islands and Vanuatu. The data generated are being used for the strategic implementation and scaling-up of priority interventions, and will be essential for establishing future surveillance using spatial decision support systems. Background Following recent international attention, renewed politi- cal commitment and dedication of resources, the concept of malaria elimination and a refocusing of intensive malaria control is now back on the world agenda [1]. Recent global malaria maps have illustrated patterns of worldwide malaria endemicity, highlighting opportunistic areas for malaria elimination and intensified malaria con- trol [2]. As part of this increased focus, current strategies for the reduction of the global burden of malaria and the eventual elimination of the disease have been outlined in the Roll Back Malaria (RBM) Global Malaria Action Plan (GMAP). These include: the scaling up and sustainment of intensive malaria control operations; progressively eliminating malaria from the endemic margins inward (i.e. shrinking the malaria map); and the continuation of research into new tools and approaches to malaria con- trol and elimination [3,4]. * Correspondence: [email protected] 1 Pacific Malaria Initiative Support Centre, Australian Centre for International and Tropical Health, School of Population Health, University of Queensland, Brisbane, Australia Full list of author information is available at the end of the article Kelly et al. Malaria Journal 2010, 9:289 http://www.malariajournal.com/content/9/1/289 © 2010 Kelly et al; licensee BioMed Central Ltd. This is an Open Access article distributed under the terms of the Creative Commons Attribution License (http://creativecommons.org/licenses/by/2.0), which permits unrestricted use, distribution, and reproduction in any medium, provided the original work is properly cited.
Transcript of RESEARCH Open Access Modern geographical … Open Access Modern geographical reconnaissance of...

RESEARCH Open Access
Modern geographical reconnaissance of targetpopulations in malaria elimination zonesGerard C Kelly1*, Jeffrey Hii2, William Batarii3, Wesley Donald4, Erick Hale3, Johnny Nausien4, Scott Pontifex5,Andrew Vallely1, Marcel Tanner6, Archie Clements1
Abstract
Background: Geographical Reconnaissance (GR) operations using Personal Digital Assistants (PDAs) and GlobalPositioning Systems (GPS) have been conducted in the elimination provinces of Temotu, Solomon Islands andTafea, Republic of Vanuatu. These operations aimed to examine modern approaches to GR to define the spatialdistribution of target populations to support contemporary malaria elimination interventions.
Methods: Three GR surveys were carried out covering the outer islands of Temotu Province (October - November,2008); Santa Cruz Island, Temotu Province (February 2009) and Tanna Island, Tafea Province (July - September2009). Integrated PDA/GPS handheld units were used in the field to rapidly map and enumerate households, andcollect associated population and household structure data to support priority elimination interventions, includingbed net distribution, indoor residual spraying (IRS) and malaria case surveillance. Data were uploaded and analysedin customized Geographic Information System (GIS) databases to produce household distribution maps andgenerate relevant summary information pertaining to the GR operations. Following completion of field operations,group discussions were also conducted to review GR approaches and technology implemented.
Results: 10,459 households were geo-referenced and mapped. A population of 43,497 and 30,663 householdstructures were recorded during the three GR surveys. The spatial distribution of the population was concentratedin coastal village clusters. Survey operations were completed over a combined total of 77 field days covering atotal land mass area of approximately 1103.2 km2. An average of 45 households, 118 structures and a populationof 184 people were recorded per handheld device per day. Geo-spatial household distribution maps were alsoproduced immediately following the completion of GR fieldwork. An overall high acceptability of modern GRtechniques and technology was observed by both field operations staff and communities.
Conclusion: GR implemented using modern techniques has provided an effective and efficient operational tool forrapidly defining the spatial distribution of target populations in designated malaria elimination zones in SolomonIslands and Vanuatu. The data generated are being used for the strategic implementation and scaling-up of priorityinterventions, and will be essential for establishing future surveillance using spatial decision support systems.
BackgroundFollowing recent international attention, renewed politi-cal commitment and dedication of resources, the conceptof malaria elimination and a refocusing of intensivemalaria control is now back on the world agenda [1].Recent global malaria maps have illustrated patterns ofworldwide malaria endemicity, highlighting opportunistic
areas for malaria elimination and intensified malaria con-trol [2]. As part of this increased focus, current strategiesfor the reduction of the global burden of malaria and theeventual elimination of the disease have been outlined inthe Roll Back Malaria (RBM) Global Malaria Action Plan(GMAP). These include: the scaling up and sustainmentof intensive malaria control operations; progressivelyeliminating malaria from the endemic margins inward(i.e. shrinking the malaria map); and the continuation ofresearch into new tools and approaches to malaria con-trol and elimination [3,4].
* Correspondence: [email protected] Malaria Initiative Support Centre, Australian Centre for Internationaland Tropical Health, School of Population Health, University of Queensland,Brisbane, AustraliaFull list of author information is available at the end of the article
Kelly et al. Malaria Journal 2010, 9:289http://www.malariajournal.com/content/9/1/289
© 2010 Kelly et al; licensee BioMed Central Ltd. This is an Open Access article distributed under the terms of the Creative CommonsAttribution License (http://creativecommons.org/licenses/by/2.0), which permits unrestricted use, distribution, and reproduction inany medium, provided the original work is properly cited.
To achieve the desired outcomes of the GMAP, it isessential that all of these strategies proceed concurrently[3]. As malaria control operations intensify and anincreasing number of national programmes movetowards the goal of elimination, the scaling-up of inter-ventions, such as indoor residual spraying (IRS) andlong-lasting insecticidal bed nets (LLIN), are essential.Similarly, as these interventions are rolled out, so willthe need to adopt effective and practical operationaltools for the coordination, monitoring and surveillanceof key activities within target areas.Geographical Reconnaissance (GR) involves census,
mapping and sampling procedures to determine thequantity, location and accessibility of settlements withintarget areas. It provides the basis for the selection offield centres and depots, for designing schedules anditineraries of operations, planning deployment of trans-port, and assessing completion of planned activities [5].GR has traditionally been used in malaria control anderadication programmes to identify target areas andenumerate populations for the coordination, implemen-tation and quality control of operations. During themalaria eradication era of the 1950-60s, GR involvedconducting detailed paper-based censuses and surveys ofall households; sampling and measuring selected build-ing structures; and developing locality-sketch maps ofsettlements using compass and pacing techniques [5,6].GR can also be used to define as accurately as possiblethe geographical limits of malaria epidemics especiallyfoci and assess epidemic potential [7,8].Traditional GR operations required specialist skills,
training and equipment in survey, navigation and carto-graphy [5,6]. As such, a major disadvantage of tradi-tional paper-based GR has been the time-consumingand resource-intensive processes involved, often limitingthe willingness of programme managers to undertakesuch activities. However, with the growing availability ofspatial data and access to geographic information system(GIS) technology, the applicability of mapping and spa-tial analysis in vector-borne disease management is nowwell established [9-20]. The use of Personal DigitalAssistants (PDAs) and Global Positioning Systems (GPS)in the field has proven to be an accurate and cost-effective approach to the collection and geo-positioningof data at a household level [21-25]. Through the com-bination of baseline spatial data and integrated handheldPDA/GPS technology, GR can now be implementedmore efficiently.To support the global elimination strategy of shrinking
the malaria map from the endemic margins inward [3],progressive elimination programmes in Solomon Islandsand Vanuatu have been implemented with support fromthe Pacific Malaria Initiative (PacMI) programme,funded by the Australian Agency for International
Development (AusAID). This programme aims to sup-port the National Vector Borne Disease Control Pro-grammes (NVBDCP) of the two countries to scale upintensified control nationwide and to eliminate malariain selected provinces. The main interventions are uni-versal household LLIN distribution and focal IRS. Elimi-nation activities have commenced in Temotu Provincein Solomon Islands and Tafea Province in Vanuatu [26].To date, little research has addressed the approach,
relevance and feasibility of GR within current-daymalaria elimination frameworks. The aims of this studywere to examine a modern approach to GR using digitalgeospatial survey technology and explore its applicationin contemporary malaria elimination programmes. Tosupport this study, GR operations were conducted inthe elimination provinces of the Solomon Islands andVanuatu. Additional aims of these operations were todefine and quantify the target populations and house-hold structures; to provide a framework for the plan-ning, implementation and monitoring of nominatedelimination interventions; and to establish a foundationfrom which future malaria elimination surveillance activ-ities can be carried out in these remote communities.
MethodsSurvey area(s)Baseline GR operations were conducted in the malariaelimination provinces of Solomon Islands and Vanuatu(Figure 1). Two separate surveys were carried out inTemotu Province, Solomon Islands, covering all islandsexcept the remote Polynesian islands of Tikopia andAnuta, which are known to be malaria-free. Operationswere conducted in the outer islands of Temotu fromOctober-November 2008 (GR Operation 1), and on themain island of Santa Cruz during February 2009 (GROperation 2). In Vanuatu, GR operations were con-ducted in the previously designated focal coastal IRSzone and northern health zone 2 of Tanna, Tafea Pro-vince, from July-September 2009 (GR Operation 3).Approval to conduct GR activities was provided by theMinistries of Health in each country, who formallyrequested support for these activities through in-countrytechnical and development partners (i.e. WHO, Pac-MISC). Fieldwork was conducted by NVBDCP staff,with technical assistance from WHO and PacMISC.
Development of spatial data collection systemsSelection of hardware and software was based upon theexisting government systems and operational capacitywithin Solomon Islands and Vanuatu; practicality anddurability of equipment in the field; and maximizingintegration across all levels of data collection, manage-ment and analysis. Hardware included Trimble Juno ST(Trimble Navigation Limited, Sunnyvale, CA) handheld
Kelly et al. Malaria Journal 2010, 9:289http://www.malariajournal.com/content/9/1/289
Page 2 of 12

PDA units with integrated GPS and Durabook (Gamma-Tech Computer Corp., Fremont, CA) notebook compu-ters for data management and daily backup. ArcPad 7.0(ESRI, Redlands, CA) software was used for data collec-tion and field mapping operations, with post-fieldworkdata storage, backup and analysis using both MicrosoftAccess (Microsoft Corporation, Redmond, WA) andMapInfo Professional 8.0 (Pitney Bowes Software Inc.,Troy, NY). Otterbox casings were also used in the fieldto provide a protective cover for the handheld PDA/GPS units. Handheld PDA/GPS devices, accompanyingsoftware and protective casing were purchased prior tothe GR operations, each collectively costing approxi-mately $1500 per unit. All other hardware and softwarewas sourced from existing Ministry of Health resources.Collaborative agreements were developed between the
NVBDCP and relevant Government GIS data custodians(i.e. the Ministry of Lands in both countries) to gainaccess and share data between the Ministries. Thesedata were then adapted to produce standardized baselinetopographic maps. To aid general reconnaissancethroughout the household surveys, these maps wereuploaded onto the handheld PDA units as underlying
GIS-based ArcPad maps. These were used to provide abase from which households could be rapidly mapped,surveyed and viewed in the field in relation to surround-ing features such as watercourses, coastlines, and localinfrastructure.Digital data collection forms (Figure 2) were developed
in ArcPad in consultation with relevant stakeholders.These forms contained the following information:
i) Household identification and enumeration▪ A unique identification number for everyhousehold▪ Village name and name of the head of thehousehold.
ii) The number, gender and ages of individuals resid-ing in each householdiii) The number and types of structures (sleepinghouses, kitchens, storage sheds, etc.) per householdiv) The number of mosquito nets currently in thehousehold, and the number and sizes of new LLINsdistributed (if relevant).v) The geographical coordinates of the household(Projection: Longitude/Latitude WGS 84)
Figure 1 General Location map of Geographical Reconnaissance Operation Areas.
Kelly et al. Malaria Journal 2010, 9:289http://www.malariajournal.com/content/9/1/289
Page 3 of 12
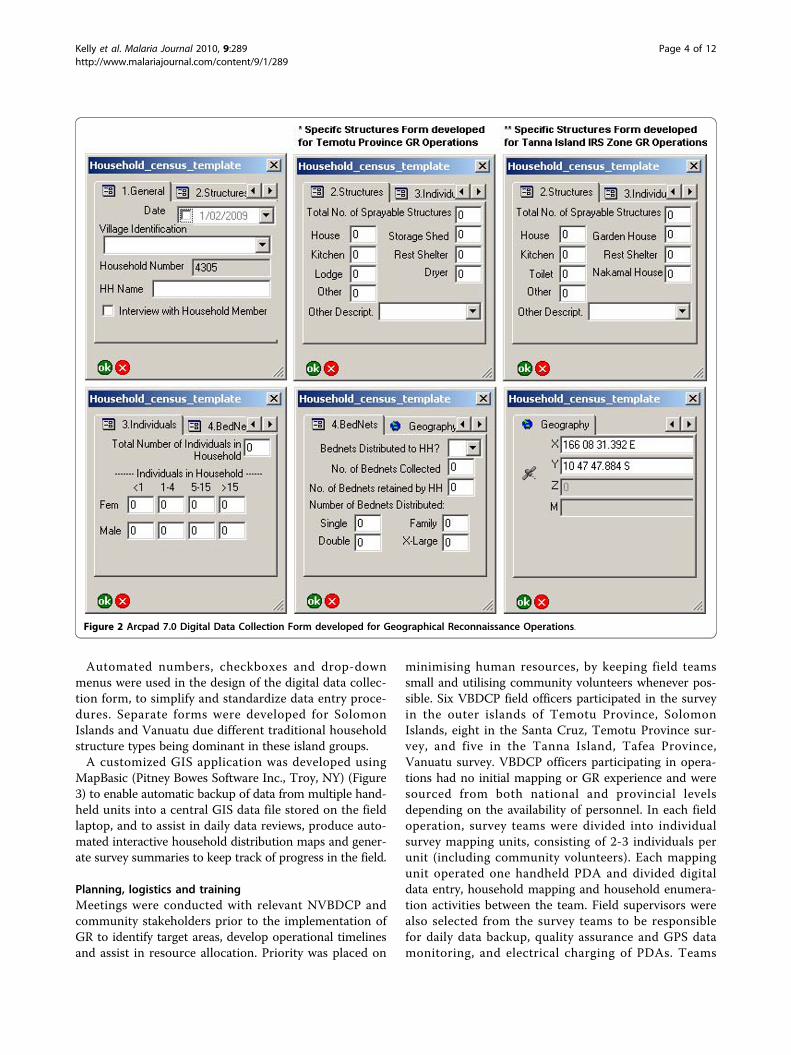
Automated numbers, checkboxes and drop-downmenus were used in the design of the digital data collec-tion form, to simplify and standardize data entry proce-dures. Separate forms were developed for SolomonIslands and Vanuatu due different traditional householdstructure types being dominant in these island groups.A customized GIS application was developed using
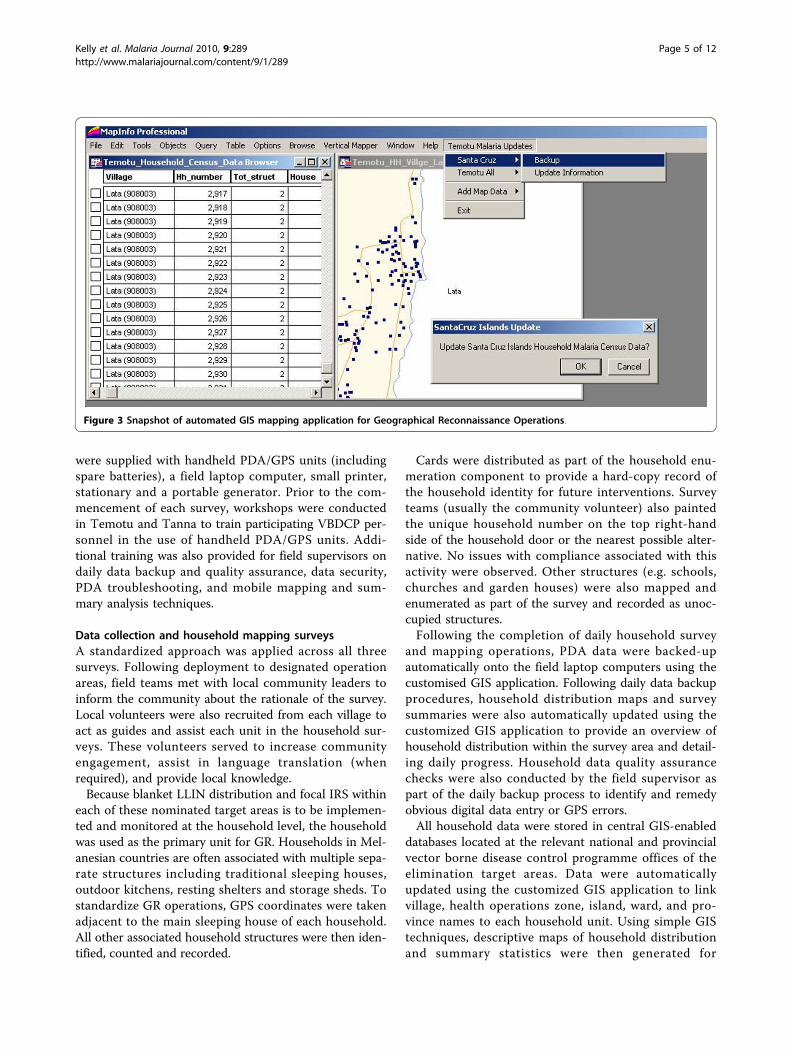
MapBasic (Pitney Bowes Software Inc., Troy, NY) (Figure3) to enable automatic backup of data from multiple hand-held units into a central GIS data file stored on the fieldlaptop, and to assist in daily data reviews, produce auto-mated interactive household distribution maps and gener-ate survey summaries to keep track of progress in the field.
Planning, logistics and trainingMeetings were conducted with relevant NVBDCP andcommunity stakeholders prior to the implementation ofGR to identify target areas, develop operational timelinesand assist in resource allocation. Priority was placed on
minimising human resources, by keeping field teamssmall and utilising community volunteers whenever pos-sible. Six VBDCP field officers participated in the surveyin the outer islands of Temotu Province, SolomonIslands, eight in the Santa Cruz, Temotu Province sur-vey, and five in the Tanna Island, Tafea Province,Vanuatu survey. VBDCP officers participating in opera-tions had no initial mapping or GR experience and weresourced from both national and provincial levelsdepending on the availability of personnel. In each fieldoperation, survey teams were divided into individualsurvey mapping units, consisting of 2-3 individuals perunit (including community volunteers). Each mappingunit operated one handheld PDA and divided digitaldata entry, household mapping and household enumera-tion activities between the team. Field supervisors werealso selected from the survey teams to be responsiblefor daily data backup, quality assurance and GPS datamonitoring, and electrical charging of PDAs. Teams
Figure 2 Arcpad 7.0 Digital Data Collection Form developed for Geographical Reconnaissance Operations.
Kelly et al. Malaria Journal 2010, 9:289http://www.malariajournal.com/content/9/1/289
Page 4 of 12
were supplied with handheld PDA/GPS units (includingspare batteries), a field laptop computer, small printer,stationary and a portable generator. Prior to the com-mencement of each survey, workshops were conductedin Temotu and Tanna to train participating VBDCP per-sonnel in the use of handheld PDA/GPS units. Addi-tional training was also provided for field supervisors ondaily data backup and quality assurance, data security,PDA troubleshooting, and mobile mapping and sum-mary analysis techniques.
Data collection and household mapping surveysA standardized approach was applied across all threesurveys. Following deployment to designated operationareas, field teams met with local community leaders toinform the community about the rationale of the survey.Local volunteers were also recruited from each village toact as guides and assist each unit in the household sur-veys. These volunteers served to increase communityengagement, assist in language translation (whenrequired), and provide local knowledge.Because blanket LLIN distribution and focal IRS within
each of these nominated target areas is to be implemen-ted and monitored at the household level, the householdwas used as the primary unit for GR. Households in Mel-anesian countries are often associated with multiple sepa-rate structures including traditional sleeping houses,outdoor kitchens, resting shelters and storage sheds. Tostandardize GR operations, GPS coordinates were takenadjacent to the main sleeping house of each household.All other associated household structures were then iden-tified, counted and recorded.
Cards were distributed as part of the household enu-meration component to provide a hard-copy record ofthe household identity for future interventions. Surveyteams (usually the community volunteer) also paintedthe unique household number on the top right-handside of the household door or the nearest possible alter-native. No issues with compliance associated with thisactivity were observed. Other structures (e.g. schools,churches and garden houses) were also mapped andenumerated as part of the survey and recorded as unoc-cupied structures.Following the completion of daily household survey
and mapping operations, PDA data were backed-upautomatically onto the field laptop computers using thecustomised GIS application. Following daily data backupprocedures, household distribution maps and surveysummaries were also automatically updated using thecustomized GIS application to provide an overview ofhousehold distribution within the survey area and detail-ing daily progress. Household data quality assurancechecks were also conducted by the field supervisor aspart of the daily backup process to identify and remedyobvious digital data entry or GPS errors.All household data were stored in central GIS-enabled
databases located at the relevant national and provincialvector borne disease control programme offices of theelimination target areas. Data were automaticallyupdated using the customized GIS application to linkvillage, health operations zone, island, ward, and pro-vince names to each household unit. Using simple GIStechniques, descriptive maps of household distributionand summary statistics were then generated for
Figure 3 Snapshot of automated GIS mapping application for Geographical Reconnaissance Operations.
Kelly et al. Malaria Journal 2010, 9:289http://www.malariajournal.com/content/9/1/289
Page 5 of 12
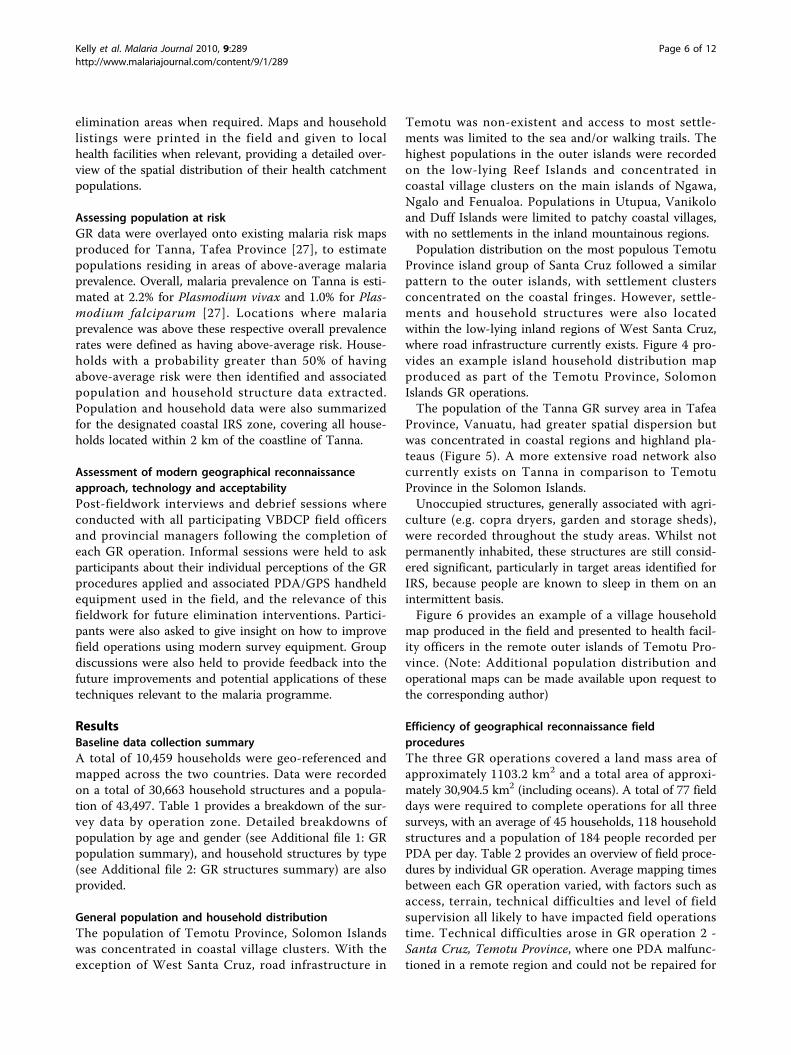
elimination areas when required. Maps and householdlistings were printed in the field and given to localhealth facilities when relevant, providing a detailed over-view of the spatial distribution of their health catchmentpopulations.
Assessing population at riskGR data were overlayed onto existing malaria risk mapsproduced for Tanna, Tafea Province [27], to estimatepopulations residing in areas of above-average malariaprevalence. Overall, malaria prevalence on Tanna is esti-mated at 2.2% for Plasmodium vivax and 1.0% for Plas-modium falciparum [27]. Locations where malariaprevalence was above these respective overall prevalencerates were defined as having above-average risk. House-holds with a probability greater than 50% of havingabove-average risk were then identified and associatedpopulation and household structure data extracted.Population and household data were also summarizedfor the designated coastal IRS zone, covering all house-holds located within 2 km of the coastline of Tanna.
Assessment of modern geographical reconnaissanceapproach, technology and acceptabilityPost-fieldwork interviews and debrief sessions whereconducted with all participating VBDCP field officersand provincial managers following the completion ofeach GR operation. Informal sessions were held to askparticipants about their individual perceptions of the GRprocedures applied and associated PDA/GPS handheldequipment used in the field, and the relevance of thisfieldwork for future elimination interventions. Partici-pants were also asked to give insight on how to improvefield operations using modern survey equipment. Groupdiscussions were also held to provide feedback into thefuture improvements and potential applications of thesetechniques relevant to the malaria programme.
ResultsBaseline data collection summaryA total of 10,459 households were geo-referenced andmapped across the two countries. Data were recordedon a total of 30,663 household structures and a popula-tion of 43,497. Table 1 provides a breakdown of the sur-vey data by operation zone. Detailed breakdowns ofpopulation by age and gender (see Additional file 1: GRpopulation summary), and household structures by type(see Additional file 2: GR structures summary) are alsoprovided.
General population and household distributionThe population of Temotu Province, Solomon Islandswas concentrated in coastal village clusters. With theexception of West Santa Cruz, road infrastructure in
Temotu was non-existent and access to most settle-ments was limited to the sea and/or walking trails. Thehighest populations in the outer islands were recordedon the low-lying Reef Islands and concentrated incoastal village clusters on the main islands of Ngawa,Ngalo and Fenualoa. Populations in Utupua, Vanikoloand Duff Islands were limited to patchy coastal villages,with no settlements in the inland mountainous regions.Population distribution on the most populous Temotu
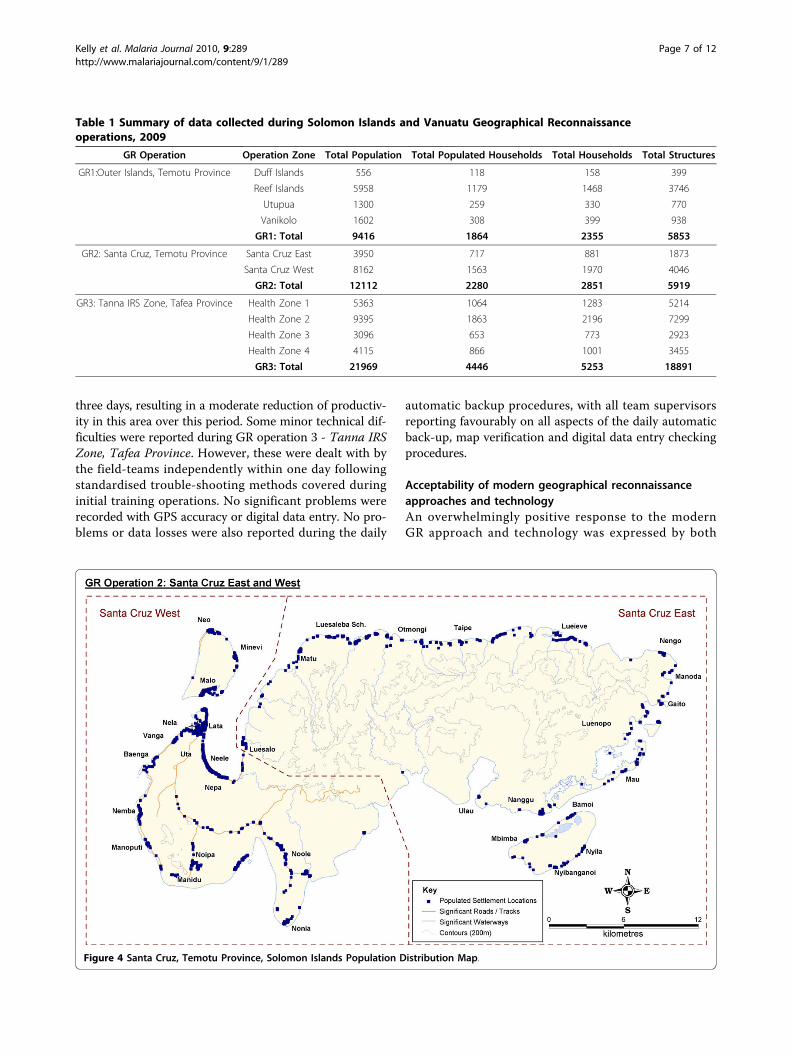
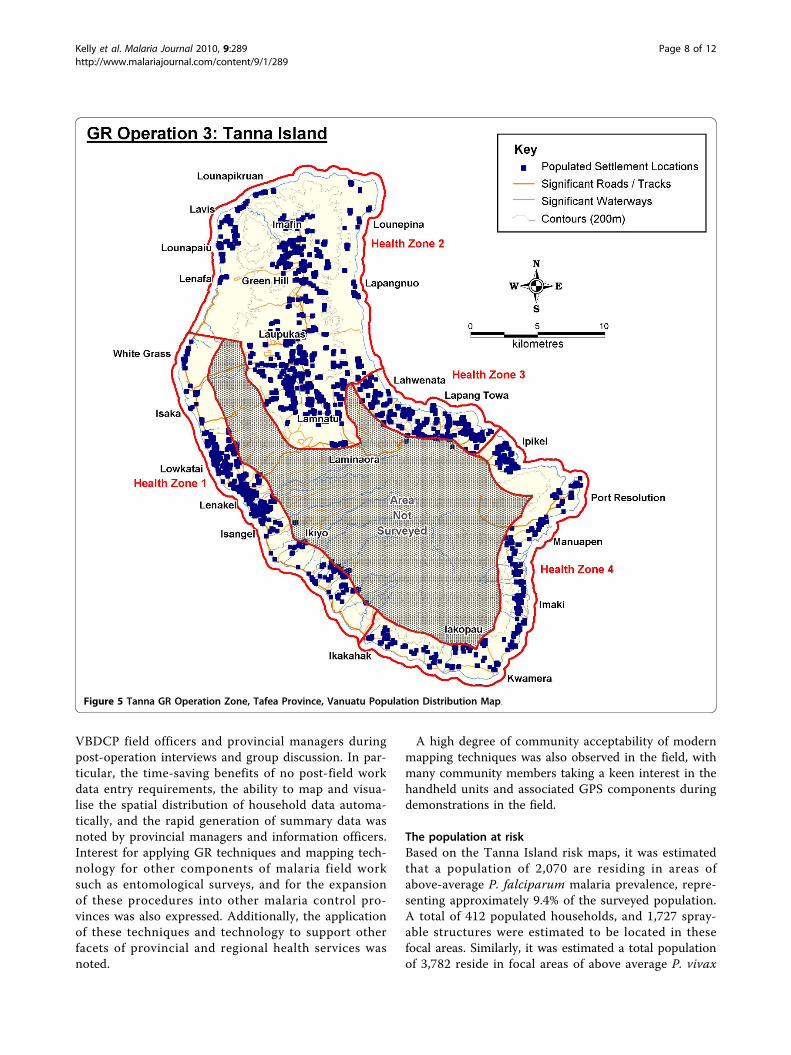
Province island group of Santa Cruz followed a similarpattern to the outer islands, with settlement clustersconcentrated on the coastal fringes. However, settle-ments and household structures were also locatedwithin the low-lying inland regions of West Santa Cruz,where road infrastructure currently exists. Figure 4 pro-vides an example island household distribution mapproduced as part of the Temotu Province, SolomonIslands GR operations.The population of the Tanna GR survey area in Tafea
Province, Vanuatu, had greater spatial dispersion butwas concentrated in coastal regions and highland pla-teaus (Figure 5). A more extensive road network alsocurrently exists on Tanna in comparison to TemotuProvince in the Solomon Islands.Unoccupied structures, generally associated with agri-
culture (e.g. copra dryers, garden and storage sheds),were recorded throughout the study areas. Whilst notpermanently inhabited, these structures are still consid-ered significant, particularly in target areas identified forIRS, because people are known to sleep in them on anintermittent basis.Figure 6 provides an example of a village household
map produced in the field and presented to health facil-ity officers in the remote outer islands of Temotu Pro-vince. (Note: Additional population distribution andoperational maps can be made available upon request tothe corresponding author)
Efficiency of geographical reconnaissance fieldproceduresThe three GR operations covered a land mass area ofapproximately 1103.2 km2 and a total area of approxi-mately 30,904.5 km2 (including oceans). A total of 77 fielddays were required to complete operations for all threesurveys, with an average of 45 households, 118 householdstructures and a population of 184 people recorded perPDA per day. Table 2 provides an overview of field proce-dures by individual GR operation. Average mapping timesbetween each GR operation varied, with factors such asaccess, terrain, technical difficulties and level of fieldsupervision all likely to have impacted field operationstime. Technical difficulties arose in GR operation 2 -Santa Cruz, Temotu Province, where one PDA malfunc-tioned in a remote region and could not be repaired for
Kelly et al. Malaria Journal 2010, 9:289http://www.malariajournal.com/content/9/1/289
Page 6 of 12
three days, resulting in a moderate reduction of productiv-ity in this area over this period. Some minor technical dif-ficulties were reported during GR operation 3 - Tanna IRSZone, Tafea Province. However, these were dealt with bythe field-teams independently within one day followingstandardised trouble-shooting methods covered duringinitial training operations. No significant problems wererecorded with GPS accuracy or digital data entry. No pro-blems or data losses were also reported during the daily
automatic backup procedures, with all team supervisorsreporting favourably on all aspects of the daily automaticback-up, map verification and digital data entry checkingprocedures.
Acceptability of modern geographical reconnaissanceapproaches and technologyAn overwhelmingly positive response to the modernGR approach and technology was expressed by both
Table 1 Summary of data collected during Solomon Islands and Vanuatu Geographical Reconnaissanceoperations, 2009
GR Operation Operation Zone Total Population Total Populated Households Total Households Total Structures
GR1:Outer Islands, Temotu Province Duff Islands 556 118 158 399
Reef Islands 5958 1179 1468 3746
Utupua 1300 259 330 770
Vanikolo 1602 308 399 938
GR1: Total 9416 1864 2355 5853
GR2: Santa Cruz, Temotu Province Santa Cruz East 3950 717 881 1873
Santa Cruz West 8162 1563 1970 4046
GR2: Total 12112 2280 2851 5919
GR3: Tanna IRS Zone, Tafea Province Health Zone 1 5363 1064 1283 5214
Health Zone 2 9395 1863 2196 7299
Health Zone 3 3096 653 773 2923
Health Zone 4 4115 866 1001 3455
GR3: Total 21969 4446 5253 18891
Figure 4 Santa Cruz, Temotu Province, Solomon Islands Population Distribution Map.
Kelly et al. Malaria Journal 2010, 9:289http://www.malariajournal.com/content/9/1/289
Page 7 of 12
VBDCP field officers and provincial managers duringpost-operation interviews and group discussion. In par-ticular, the time-saving benefits of no post-field workdata entry requirements, the ability to map and visua-lise the spatial distribution of household data automa-tically, and the rapid generation of summary data wasnoted by provincial managers and information officers.Interest for applying GR techniques and mapping tech-nology for other components of malaria field worksuch as entomological surveys, and for the expansionof these procedures into other malaria control pro-vinces was also expressed. Additionally, the applicationof these techniques and technology to support otherfacets of provincial and regional health services wasnoted.
A high degree of community acceptability of modernmapping techniques was also observed in the field, withmany community members taking a keen interest in thehandheld units and associated GPS components duringdemonstrations in the field.
The population at riskBased on the Tanna Island risk maps, it was estimatedthat a population of 2,070 are residing in areas ofabove-average P. falciparum malaria prevalence, repre-senting approximately 9.4% of the surveyed population.A total of 412 populated households, and 1,727 spray-able structures were estimated to be located in thesefocal areas. Similarly, it was estimated a total populationof 3,782 reside in focal areas of above average P. vivax
Figure 5 Tanna GR Operation Zone, Tafea Province, Vanuatu Population Distribution Map.
Kelly et al. Malaria Journal 2010, 9:289http://www.malariajournal.com/content/9/1/289
Page 8 of 12

risk, representing 17.2% of the surveyed population. 713populated households and 2,953 spray-able structureswere also located in these areas. A total population of13,818 and 12,453 spray-able structures were recordedin the designated coastal IRS intervention zone onTanna, geo-referenced to a total of 3,365 individualhousehold units.
DiscussionTo guide elimination interventions in these regions theNVBDCP of both countries highlighted a need for thecollection of reliable, accurate and programme-specificdata at a household level; particularly as relevant geo-spatial census data was unavailable at the level of preci-sion required for the designated target elimination areas.
Modern GR approaches and technologies were used todevelop rapid and accurate field-based procedures forthe collection, spatial definition and mapping of malariaelimination target populations. As these survey areas arelocated in remote Pacific islands, an emphasis wasplaced upon minimising the external resources (includ-ing human) required to undertake such operations andempowering local vector control programmes by intro-ducing effective, user-friendly tools to support and effi-ciently guide the increased operational demandsassociated with malaria elimination.In the context of the target elimination areas, the
coastal concentration and isolation of populations with-out roads and reliable infrastructure, transportation andaccess are likely to be limiting factors to the success of
Figure 6 Example Village Household Distribution Map.
Table 2 Solomon Islands and Vanuatu Geographical Reconnaissance field procedures summary, 2009
GROperation
ApproxLandArea(km2)
Numberof PDA/GPS units
SurveyDays
AverageHouseholds
Mapped (per PDAper Day)
AverageStructures
Recorded (perPDA per Day)
AveragePopulation
Recorded (perPDA per Day)
TechnicalDifficultiesduring
Operation
TechnicalField
Supervisionprovided
GR1:OuterIslands,TemotuProvince
79.63 2 19 61.97 154.03 247.92 No Yes
GR2: SantaCruz, TemotuProvince
546.6 4 18 39.6 82.21 167.9 Moderate No
GR3: TannaIRS Zone,Tafea
Province
476.97 4 40 32.83 116.28 136.74 Minor Partial
Kelly et al. Malaria Journal 2010, 9:289http://www.malariajournal.com/content/9/1/289
Page 9 of 12
elimination. Sound planning will be essential to ensureinterventions are efficiently and effectively carried outacross all target areas. Data compiled and collected dur-ing GR activities will enable programme managers tovisualize the spatial distribution of populations to assistin the delineation of operational zones, the developmentof intervention timelines, and identifying transportationroutes and access strategies. Relevant data pertaining tothese priority interventions such as populations requir-ing LLINs and the total number of spray-able structureswithin focal IRS zones will assist in the accurate alloca-tion of resources to designated operational zones.Household checklists and maps will also provide fieldofficers with a detailed mechanism for conducting andmonitoring priority interventions in target areas toensure maximum coverage is achieved. Reporting willalso be enhanced as the progress and coverage of inter-ventions can be mapped and visualized at the householdlevel.Population and household structure results from GR
operations carried out in the respective eliminationzones illustrate the significant amount of detailed datathat can be collected over large geographical areas bysmall teams and within short timeframes, highlightingthe efficiency of modern approaches to GR. Whilstthere is an increased need for pre-operation trainingwhen using the handheld units for data collection [21],the time and opportunity costs associated with traininghave been seen as valuable investments in buildinghuman resource capacity within the national malariaprogrammes of both countries. It is expected that as thetechnical competencies and experiences of field officersin the operation of these digital handheld devicesincreases, the lag time associated with troubleshootingtechnical difficulties in the field will be reduced. Sincethe completion of these initial GR operations, additionalPDA/GPS based surveys have now been independentlyconducted by VBDCP officers in these regions andexpanding into other provinces, reflecting the highacceptability, willingness and capacity of these pro-grammes to now implement GR operations using thesemodern techniques and technologies.Observations from the respective GR operations indi-
cate a high willingness and capacity of VBDCP fieldstaff to adopt and successfully utilize modern mobilemapping technology following initial basic training andtechnical guidance. The adoption of a simple custo-mized GIS-based application to automate data back-upand mapping updates on a daily basis has also provideda rapid and effective mechanism for VBDCP staff tomonitor progress and edit data easily in the field. Ashousehold mapping and PDA data entry operationswere lead by VBDCP staff well known within theirrespective target communities, it is also likely this had
an influence on the high level of community acceptabil-ity and compliance observed in the field, emphasisingthe importance of building local programme capacity toindependently drive contemporary intervention strate-gies and approaches. Ethical approval was not soughtfor GR operations as they were considered routineoperational activities of the national malaria pro-grammes in both countries, with all collected data man-aged as per confidentiality requirements of therespective Ministries of Health.Whilst some data entry errors are expected as a result
of the digital data entry at the point of collectionapproach, previous research suggests such errors areminimal when compared to traditional paper-based sur-veys [22,24,25]. The cost-benefit of adopting handheldtechnology for field-based data collection has also beenwell established in earlier previous large-scale fieldresearch [21,22,24,25]. Relatively high-end handheldunits were purchased prior to the implementation ofthese surveys with the anticipation of being usedthroughout all facets of elimination interventions. Whilstthese specific units were somewhat expensive, they havebeen considered a viable investment as part of therespective national malaria programmes to support allroutine field operations, mapping and data collection.With the growing availability of mapping and data col-lection software (including freeware and open source),as well as handheld and mobile phone technology cap-able of running GPS and data collection applications,alternative affordable technologies are also accessible toa wider market looking to implement GR principles.Additional benefits such as the increased accuracy and
resolution of GR data collected, and the immediateavailability of summary information and maps relevantfor priority elimination interventions also make inte-grated PDA/GPS handheld technologies favourable;overcoming constraining issues associated with tradi-tional paper-based methodologies including low accu-racy, and slow transaction times to verify data andprepare operational maps following fieldwork. The highportability of handheld PDA technology also providedconsiderable benefits in remote and difficult terrainwhere access and transportation posed significant logis-tical challenges.In addition to the traditional applications of defining
target populations and providing operational support,GR also provides an effective mechanism for furtherstrengthening current-day priority monitoring and eva-luation interventions such as detailed surveillance andcase investigation. Malaria elimination requires robustand efficient surveillance mechanisms with full geogra-phical coverage of target areas [28]. Active surveillanceof high-prevalence foci is also essential for successfullyinterrupting malaria transmission [29]. The application
Kelly et al. Malaria Journal 2010, 9:289http://www.malariajournal.com/content/9/1/289
Page 10 of 12

of modern geo-spatial technology for GR can empowerlocal programmes to carry-out detailed mapping anddata collection operations in target areas efficiently andaccurately. Data collected during the GR operations nowprovides a spatial framework to not only guide keyinterventions such as LLIN distribution and IRS, butalso carry-out surveillance and investigation at a house-hold level across entire populations living in eliminationareas.When coupled with additional tools such as malaria
risk maps, entomology and mobility data, and localand historical knowledge of malaria transmission, stra-tegic active surveillance can also be targeted and prior-itized in key focal locations following GR operations. Itis anticipated that the compilation of such data willprovide the foundation for the establishment andexpansion of spatial decision support systems (SDSS)in these elimination provinces. A SDSS developed fromthe ground up, offers the potential to provide a user-friendly tool to equip locally-based programmes inmeeting the demands associated with the scaling-up ofinterventions and surveillance operations in malariaelimination as well as intensified malaria controlregions.
ConclusionThis study demonstrated a contemporary approach toGR to spatially define and enumerate target populationsusing modern geospatial survey technology. The focuswas building inter-departmental capacity to indepen-dently carry-out GR operations to support priority inter-ventions in the malaria elimination provinces inSolomon Islands and Vanuatu. This approach has pro-vided an effective mechanism for rapidly and accuratelydefining target populations where these interventionshave been scheduled to take place. Data collected andmodern techniques adopted during GR have empoweredlocal VBDCP programmes with effective decision mak-ing and operational tools to coordinate and monitorscaled-up elimination interventions with the goal ofensuring universal coverage, and providing a foundationfor future surveillance activities. Following the highacceptability and success of these initial GR operations,both the Solomon Islands and the Republic of VanuatuVector Borne Disease Control Programmes are nowdedicated to the expansion and further refinement ofGR using modern mapping techniques and integratedPDA/GPS handheld technologies, illustrating the highacceptability of these approaches and providing a basisfor the future expansion of a comprehensive and inte-grated SDSS to guide progressive malaria elimination inthe pacific.
Additional material
Additional file 1: Demographic description of the population ofSolomon Islands and Vanuatu Geographical Reconnaissanceoperation areas, 2009. Data provides a detailed demographicdescription by age and gender of the population recorded within eachgeographical reconnaissance operation area
Additional file 2: Household structures summary table of SolomonIslands and Vanuatu Geographical Reconnaissance operation areas,2009. Data provides a detailed breakdown of the number of structuresrecorded by type within each individual geographical reconnaissanceoperation area.
AcknowledgementsWe would like to thank the hard work of the individuals from the SolomonIslands and Vanuatu National Vector Borne Disease Control Programs whoassisted with the GR fieldwork, including Andrew Newa, Luke Osimane,Carlwyn Tengemoana, Manasseh Haridi and Cal Jere from the SolomonIslands; and Rueban Sumaki, James Amon, Aaron Tebi, Kevin Marafi and TomIavis from the Vanuatu fieldwork teams. Additionally, we acknowledge theNVBDCP Directors Albino Bobogare (Solomon Islands) and George Taleo(Vanuatu), and provincial VBDCP supervisors Robert Raoga (Temotu) andHarry Iata (Tafea) for their enthusiasm and support in trialling thesetechniques in their respective jurisdictions. Finally, we thank the volunteersand communities of Temotu and Tafea provinces for their contribution,cooperation and overwhelming support in making these operations thesuccess they have been.A.C.A.C. is supported by a Career Development Award from the AustralianNational Health and Medical Research Council (#631619).
Author details1Pacific Malaria Initiative Support Centre, Australian Centre for Internationaland Tropical Health, School of Population Health, University of Queensland,Brisbane, Australia. 2Malaria, Other Vectorborne and Parasitic Diseases,Regional Office for the Western Pacific, World Health Organization, SanLazaro Hospital Compound, Manila, Philippines. 3National Vector BorneDisease Control Programme, Ministry of Health, Honiara, Solomon Islands.4National Vector Borne Disease Control Programme, Ministry of Health, PortVila, Republic of Vanuatu. 5Statistics and Demography Programme,Secretariat of the Pacific Community, Noumea, New Caledonia. 6SwissTropical & Public Health Institute, 4002 Basel, Switzerland & University ofBasel, Basel, Switzerland.
Authors’ contributionsAuthors that participated in the conception of the study design were GKand JH. Field training was conducted by GK. Field research operations werecoordinated by EH, GK, JN, WB, & WD. SP provided technical guidance andsupport. ACAC provided guidance on the scientific aspects of the study andprovided detailed commentary on manuscript drafts. Additional scientificand technical guidance was provided by AV, JH & MT. Manuscript draftingwas carried out by GK with support from all authors. All authors read andapproved the final manuscript.
Competing interestsThe authors declare that they have no competing interests.
Received: 16 July 2010 Accepted: 20 October 2010Published: 20 October 2010
References1. Tanner M, de Savigny D: Malaria eradication back on the table. Bull World
Health Organ 2008, 86:82.2. Hay SI, Guerra CA, Gething PW, Patil AP, Tatem AJ, Noor AM, Kabaria CW,
Manh BH, Elyazar IR, Brooker S, Smith DL, Moyeed RA, Snow RW: A worldmalaria map: Plasmodium falciparum endemicity in 2007. PLoS Med 2009,6:0286-0302.
Kelly et al. Malaria Journal 2010, 9:289http://www.malariajournal.com/content/9/1/289
Page 11 of 12
3. Feachem RGA, Phillips AA, Targett GA, Eds: Shrinking the Malaria Map AProspectus on Malaria Elimination. San Francisco: The Global HealthGroup, Global Health Sciences, University of California 2009.
4. GMAP: The Global Malaria Action Plan Roll Back Malaria Partnership 2008.5. WHO: Geographical reconnaissance for malaria eradication programmes
Geneva: World Health Organization 1965.6. Huang Hairoi MJ: Field manual for geographical reconnaissance and spraying
operations Malaria Control Programme, Department of Public Health, PapuaNew Guinea 1980.
7. Najera JA, Kouznetsov RL, Delacollette C: Malaria epidemics, detection andcontrol, forecasting and prevention. Geneva: World Health Organization.Division of Control of Tropical Diseases 1998.
8. Guintran JO, Delacollette C, Trigg P: Systems for the early detection ofmalaria epidemic in Africa. An analysis of current practicies and futurepriorities. World Health Organization 2006.
9. Lozano-Fuentes S, Elizondo-Quiroga D, Farfan-Ale JA, Lorono-Pino MA,Garcia-Rejon J, Gomez-Carro S, Lira-Zumbardo V, Najera-Vazquez R,Fernandez-Salas I, Calderon-Martinez J, Dominguez-Galera M, Mis-Avila P,Morris N, Coleman M, Moore CG, Beaty BJ, Eisen L: Use of Google Earth tostrengthen public health capacity and facilitate management of vector-borne diseases in resource-poor environments. Bull World Health Organ2008, 86:718-725.
10. Tim US: The application of GIS in environmental health sciences:opportunities and limitations. Environ Res 1995, 71:75-88.
11. Chang AY, Parrales ME, Jimenez J, Sobieszczyk ME, Hammer SM,Copenhaver DJ, Kulkarni RP: Combining Google Earth and GIS mappingtechnologies in a dengue surveillance system for developing countries.Int J Health Geogr 2009, 8:49.
12. Chansang C, Kittayapong P: Application of mosquito sampling count andgeospatial methods to improve dengue vector surveillance. Am J TropMed Hyg 2007, 77:897-902.
13. Daash A, Srivastava A, Nagpal BN, Saxena R, Gupta SK: Geographicalinformation system (GIS) in decision support to control malaria–a casestudy of Koraput district in Orissa, India. J Vector Borne Dis 2009, 46:72-74.
14. Eisen L, Lozano-Fuentes S: Use of mapping and spatial and space-timemodeling approaches in operational control of Aedes aegypti anddengue. PLoS Negl Trop Dis 2009, 3:e411.
15. Kitron U: Landscape ecology and epidemiology of vector-borne diseases:tools for spatial analysis. J Med Entomol 1998, 35:435-445.
16. Saxena R, Nagpal BN, Srivastava A, Gupta SK, Dash AP: Application ofspatial technology in malaria research & control: some new insights.Indian J Med Res 2009, 130:125-132.
17. Shirayama Y, Phompida S, Shibuya K: Geographic information system (GIS)maps and malaria control monitoring: intervention coverage and healthoutcome in distal villages of Khammouane province, Laos. Malar J 2009,8:217.
18. Srivastava A, Nagpal BN, Joshi PL, Paliwal JC, Dash AP: Identification ofmalaria hot spots for focused intervention in tribal state of India: a GISbased approach. Int J Health Geogr 2009, 8:30.
19. Stensgaard AS, Saarnak CF, Utzinger J, Vounatsou P, Simoonga C,Mushinge G, Rahbek C, Mohlenberg F, Kristensen TK: Virtual globes andgeospatial health: the potential of new tools in the management andcontrol of vector-borne diseases. Geospat Health 2009, 3:127-141.
20. Zhang W, Wang L, Fang L, Ma J, Xu Y, Jiang J, Hui F, Wang J, Liang S,Yang H, Cao W: Spatial analysis of malaria in Anhui province, China.Malar J 2008, 7:206.
21. Shirima K, Mukasa O, Schellenberg JA, Manzi F, John D, Mushi A, Mrisho M,Tanner M, Mshinda H, Schellenberg D: The use of personal digitalassistants for data entry at the point of collection in a large householdsurvey in southern Tanzania. Emerg Themes Epidemiol 2007, 4:5.
22. Fletcher LA, Erickson DJ, Toomey TL, Wagenaar AC: Handheld computers.A feasible alternative to paper forms for field data collection. Eval Rev2003, 27:165-178.
23. Vanden Eng JL, Wolkon A, Frolov AS, Terlouw DJ, Eliades MJ, Morgah K,Takpa V, Dare A, Sodahlon YK, Doumanou Y, Hawley WA, Hightower AW:Use of handheld computers with global positioning systems forprobability sampling and data entry in household surveys. Am J TropMed Hyg 2007, 77:393-399.
24. Yu P, de Courten M, Pan E, Galea G, Pryor J: The development andevaluation of a PDA-based method for public health surveillance datacollection in developing countries. Int J Med Inform 2009, 78:532-542.
25. Forster D, Behrens RH, Campbell H, Byass P: Evaluation of a computerizedfield data collection system for health surveys. Bull World Health Organ1991, 69:107-111.
26. The Pacific Malaria Initiative Survey Group on behalf of the Ministries ofHealth of Vanuatu and Solomon Islands: Malaria on isolated Melanesianislands prior to the initiation of malaria elimination activities. MalariaJournal 2010, 9:218.
27. Reid H, Vallely A, Taleo G, Tatem A, Kelly G, Riley I, Harris I, Henri I,Iamaher S, Clements A: Baseline spatial distribution of malaria prior to anelimination programme in Vanuatu. Malaria Journal 2010, 9:150.
28. WHO: Malaria elimination - A field manual for low and moderate endemiccountries Geneva: World Health Organization 2007.
29. WHO: Guidelines on the elimination of residual foci of malaria transmissionGeneva: World Health Organization 2007.
doi:10.1186/1475-2875-9-289Cite this article as: Kelly et al.: Modern geographical reconnaissance oftarget populations in malaria elimination zones. Malaria Journal 20109:289.
Submit your next manuscript to BioMed Centraland take full advantage of:
• Convenient online submission
• Thorough peer review
• No space constraints or color figure charges
• Immediate publication on acceptance
• Inclusion in PubMed, CAS, Scopus and Google Scholar
• Research which is freely available for redistribution
Submit your manuscript at www.biomedcentral.com/submit
Kelly et al. Malaria Journal 2010, 9:289http://www.malariajournal.com/content/9/1/289
Page 12 of 12