Research on Relationship between Financial Inclusion … · Research on Relationship between...
12
7 International Journal of Innovation and Economics Development, vol. 4, issue 1, pages 7-18, April 2018 International Journal of Innovation and Economic Development ISSN 1849-7020 (Print) ISSN 1849-7551 (Online) URL: http://dx.doi.org/10.18775/ijied.1849-7551-7020.2015.41.2001 DOI: 10.18775/ijied.1849-7551-7020.2015.41.2001 Volume 4 Issue 1 April, 2018 Pages 7-18 Research on Relationship between Financial Inclusion and Economic Growth of Rwanda: Evidence from Commercial Banks with ARDL Approach 1 Moïse Bigirimana, 2 Xu Hongyi 2 School of Management, Wuhan University of Technology, PR China 1 School of Economics and Business Studies, Kigali Independent University ULK, Rwanda Abstract: This study examines the relationship between financial inclusion and economic growth of Rwanda using annual data from 2004 to 2016. We used ARDL as it is a new approach to the problem of testing the existence of a level relationship between a dependent variable and a set of regressors, when it is not known with certainty whether the underlying regressors are trend- or first-difference stationary as developed by Pesaran. The results of our study revealed that there is long-run relationship between financial inclusion and economic growth of Rwanda. Keywords: Financial inclusion, Economic growth, Commercial bank, ARDL 1. Introduction The government of Rwanda has got rapid growth since 2000 and has set vision 2020 where service industry was given more emphasis to boost economic growth. It is in this line that they have set a target of having 90% of Rwandans financially included by the year 2020. Different strategies were put in place to increase financial inclusion in Rwanda. Among these strategies, we can mention licensing different foreign commercial banks and creating SACCOs for each sector among 416 sectors in Rwanda. It is of great importance for researchers to know whether the efforts that the government of Rwanda has put in yielded results. It is in this context that we have conducted this research about financial inclusion and economic growth of Rwanda. Although financial inclusion has become topical on the global policy agenda for sustainable development, economic literature on financial inclusion is still in its infancy (Park & Mercado, 2015). When measuring access and use of financial services two indicators were used by Beck et al (2007) i.e the number of branches and ATMs per capita and per square kilometer for 89countries(Beck, Demirguc-Kunt, & Martinez Peria, 2007). This poses a problem as the size of countries vary. A small country may show a good number of ATMs per kilometer just because it is small. The number of branches may be big for a big country and still more people do not have access. This research considers only one country to facilitate use of more indicators and show the real impact of financial institutions on financial inclusion and the relationship between financial inclusion and economic growth in Rwanda. 2. Literature Review Different authors have defined financial inclusion as being able to get access to formal financial institutions or using financial services. See (Bayero, 2015; Naceur et al., 2015; Zins & Weill, 2016;Diniz, Birochi, & Pozzebon, 2012).
Transcript of Research on Relationship between Financial Inclusion … · Research on Relationship between...
7
International Journal of Innovation and Economics Development, vol. 4, issue 1, pages 7-18, April 2018
International Journal of Innovation and Economic Development
ISSN 1849-7020 (Print)
ISSN 1849-7551 (Online)
URL: http://dx.doi.org/10.18775/ijied.1849-7551-7020.2015.41.2001 DOI: 10.18775/ijied.1849-7551-7020.2015.41.2001
Volume 4
Issue 1
April, 2018 Pages 7-18
Research on Relationship between Financial
Inclusion and Economic Growth of Rwanda:
Evidence from Commercial Banks with ARDL
Approach
1Moïse Bigirimana, 2Xu Hongyi
2School of Management, Wuhan University of Technology, PR China
1School of Economics and Business Studies, Kigali Independent University ULK, Rwanda
Abstract: This study examines the relationship between financial inclusion and economic
growth of Rwanda using annual data from 2004 to 2016. We used ARDL as it is a new approach
to the problem of testing the existence of a level relationship between a dependent variable
and a set of regressors, when it is not known with certainty whether the underlying regressors
are trend- or first-difference stationary as developed by Pesaran. The results of our study
revealed that there is long-run relationship between financial inclusion and economic growth
of Rwanda.
Keywords: Financial inclusion, Economic growth, Commercial bank, ARDL
1. Introduction
The government of Rwanda has got rapid growth since 2000 and has set vision 2020 where
service industry was given more emphasis to boost economic growth. It is in this line that they
have set a target of having 90% of Rwandans financially included by the year 2020. Different
strategies were put in place to increase financial inclusion in Rwanda. Among these strategies,
we can mention licensing different foreign commercial banks and creating SACCOs for each
sector among 416 sectors in Rwanda. It is of great importance for researchers to know whether
the efforts that the government of Rwanda has put in yielded results. It is in this context that
we have conducted this research about financial inclusion and economic growth of Rwanda.
Although financial inclusion has become topical on the global policy agenda for sustainable
development, economic literature on financial inclusion is still in its infancy (Park & Mercado,
2015).
When measuring access and use of financial services two indicators were used by Beck et al
(2007) i.e the number of branches and ATMs per capita and per square kilometer for
89countries(Beck, Demirguc-Kunt, & Martinez Peria, 2007). This poses a problem as the size of
countries vary. A small country may show a good number of ATMs per kilometer just because
it is small. The number of branches may be big for a big country and still more people do not
have access. This research considers only one country to facilitate use of more indicators and
show the real impact of financial institutions on financial inclusion and the relationship between
financial inclusion and economic growth in Rwanda.
2. Literature Review Different authors have defined financial inclusion as being able to get access to formal financial
institutions or using financial services. See (Bayero, 2015; Naceur et al., 2015; Zins & Weill,
2016;Diniz, Birochi, & Pozzebon, 2012).

Moïse Bigirimana, Xu Hongyi
Research on Relationship between Financial Inclusion and Economic Growth of Rwanda: Evidence from
Commercial Banks with ARDL Approach
8
On this basis, the role played by commercial banks is worthy to discuss. Research has shown
that banks increase growth (Chakraborty & Ray, 2006). Financial intermediation promotes
growth (Bencivenga & Smith, 1991).What is amazing is that some researches show that that
tighter bank competition enhances the occurrence of bank failures. Thus, measures that
increase bank competition could undermine financial stability (Fungáčová & Weill, 2013). Again,
microfinance loans reduce poverty and foster economic growth (Berhane & Gardebroek, 2011),
micro-loans increase employment (Baldi, Guido and Sipilova, 2014). (Liang & Reichert, 2012)
concluded that that growth in NBFIs has a statistically significant negative impact on economic
growth. Vaithilingam, Guru, & Shanmugam (2003) found that an increase in commercial bank
loans to the private sector has a direct effect on real income. According to (Mandel & Seydl,
2016) loan supply exerts a notable drag on economic activity. Not only ordinary banks contribute
to economic growth but also Islamic banks Daly & Frikha (2016). Most recently, Kim, Yu, &
Hassan (2018) found that financial inclusion has a positive effect on economic growth. It is
evidenced by many authors that financial inclusion is of paramount importance. Demirgüc-Kant
& Klapper (2012) said that inclusive financial systems benefit poor people and other
disadvantaged groups. Mandel & Seydl (2016) showed that financial inclusion contributes
positively to financial stability.
It is important to highlight what literature says about financial inclusion and economic growth.
Most researchers have focused on role financial development on economic growth rather than
financial inclusion and economic growth. For example, (Claessens & Laeven, 2003) show that
financial development contributes to economic growth. They share the share the view with many
authors who agreed that financial development causes economic growth ,see ( Shahbaz,
Rehman, & Muzaffar, 2015; Sehrawat & Giri, 2012; Shahbaz & Mafizur Rahman, 2014; Anwar
& Sun, 2011).
Masoud & Hardaker (2012) emphasized that stock market development (as part of financial
development) has a significant effect on economic growth. Valickova, Havranek, & Horvath
(2015) also showed that stock markets support faster economic growth than other financial
intermediaries. Durusu-Ciftci, Ispir, & Yetkiner (2016) showed that debt from credit markets
and equity from stock markets are two long-run determinants of GDP per capita. According to
R. King & Levine (1993), at the cross-country level, evidence indicates that various measures
of financial development (including assets of the financial intermediaries, liquid liabilities of
financial institutions, domestic credit to private sector, stock and bond market capitalization)
are robustly and positively related to economic growth. Shan, Morris, & Sun (2001) also said
that there is little support for the hypothesis that finance “leads” growth, and caution must be
exercised in making general conclusions about this relationship. Rousseau & D’Onofrio (2013)
found unidirectional links from financial development to measures of real activity for about two-
thirds of Sub Saharan African countries.
According to Sehrawat & Giri (2016) financial development and economic growth cause rural-
urban income inequality. Financial inclusion is complementary to economic growth as the two
contribute toward poverty alleviation (Onaolapo, 2015). Literature shows that access to finance
is associated with faster growth (Beck, DemirgüÇ-Kunt, & Maksimovic, 2005). These differences
in findings and need for focus on financial inclusion motivated us to conduct a research on
financial inclusion and economic growth.
3. Methodology The study takes into consideration 13 years from 2004 to 2016. Three dimensions of financial
inclusion were used to measure financial inclusion. These are access, penetration and usage as
they are recommended by many authors as indicators of financial inclusion. This refers to Global
financial inclusion database (Demirguc-Kunt, Klapper, Singer, & Van Oudheusden, 2015) as
Moïse Bigirimana, Xu Hongyi
Research on Relationship between Financial Inclusion and Economic Growth of Rwanda: Evidence from
Commercial Banks with ARDL Approach
9
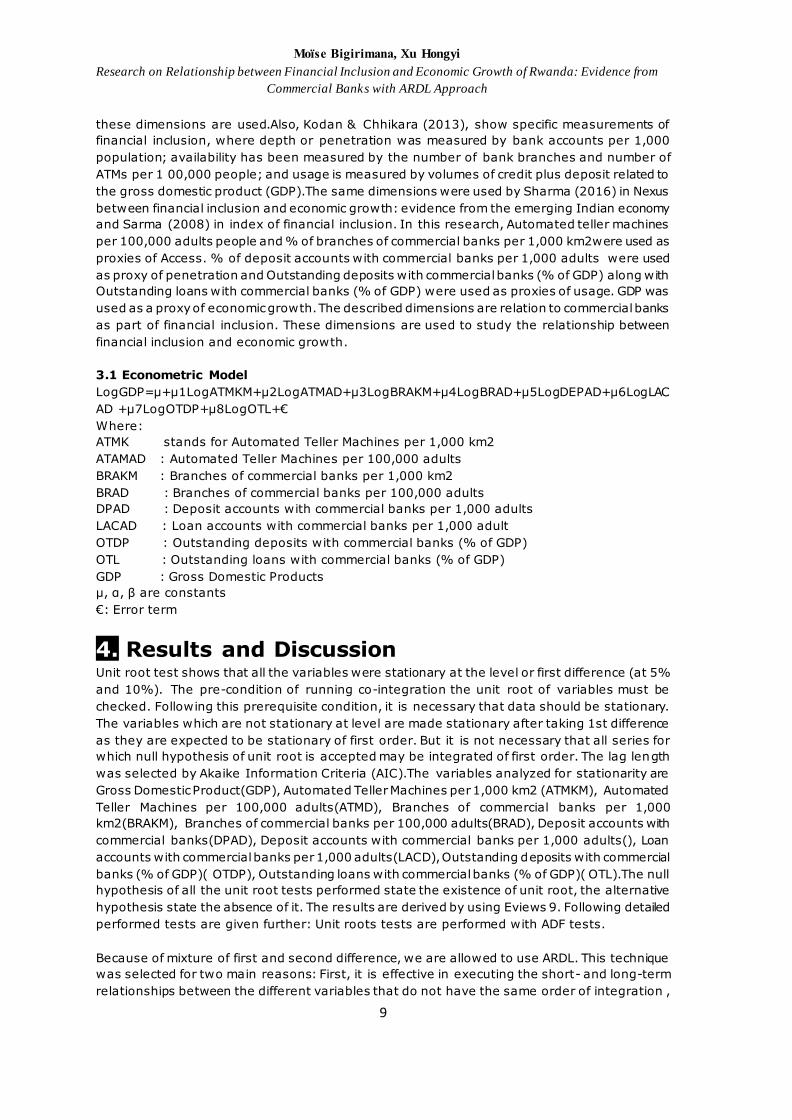
these dimensions are used.Also, Kodan & Chhikara (2013), show specific measurements of
financial inclusion, where depth or penetration was measured by bank accounts per 1,000
population; availability has been measured by the number of bank branches and number of
ATMs per 1 00,000 people; and usage is measured by volumes of credit plus deposit related to
the gross domestic product (GDP).The same dimensions were used by Sharma (2016) in Nexus
between financial inclusion and economic growth: evidence from the emerging Indian economy
and Sarma (2008) in index of financial inclusion. In this research, Automated teller machines
per 100,000 adults people and % of branches of commercial banks per 1,000 km2were used as
proxies of Access. % of deposit accounts with commercial banks per 1,000 adults were used
as proxy of penetration and Outstanding deposits with commercial banks (% of GDP) along with
Outstanding loans with commercial banks (% of GDP) were used as proxies of usage. GDP was
used as a proxy of economic growth. The described dimensions are relation to commercial banks
as part of financial inclusion. These dimensions are used to study the relationship between
financial inclusion and economic growth.
3.1 Econometric Model
LogGDP=µ+µ1LogATMKM+µ2LogATMAD+µ3LogBRAKM+µ4LogBRAD+µ5LogDEPAD+µ6LogLAC
AD +µ7LogOTDP+µ8LogOTL+€
Where:
ATMK stands for Automated Teller Machines per 1,000 km2
ATAMAD : Automated Teller Machines per 100,000 adults
BRAKM : Branches of commercial banks per 1,000 km2
BRAD : Branches of commercial banks per 100,000 adults
DPAD : Deposit accounts with commercial banks per 1,000 adults
LACAD : Loan accounts with commercial banks per 1,000 adult
OTDP : Outstanding deposits with commercial banks (% of GDP)
OTL : Outstanding loans with commercial banks (% of GDP)
GDP : Gross Domestic Products
µ, α, β are constants
€: Error term
4. Results and Discussion Unit root test shows that all the variables were stationary at the level or first difference (at 5%
and 10%). The pre-condition of running co-integration the unit root of variables must be
checked. Following this prerequisite condition, it is necessary that data should be stationary.
The variables which are not stationary at level are made stationary after taking 1st difference
as they are expected to be stationary of first order. But it is not necessary that all series for
which null hypothesis of unit root is accepted may be integrated of first order. The lag length
was selected by Akaike Information Criteria (AIC).The variables analyzed for stationarity are
Gross Domestic Product(GDP), Automated Teller Machines per 1,000 km2 (ATMKM), Automated
Teller Machines per 100,000 adults(ATMD), Branches of commercial banks per 1,000
km2(BRAKM), Branches of commercial banks per 100,000 adults(BRAD), Deposit accounts with
commercial banks(DPAD), Deposit accounts with commercial banks per 1,000 adults(), Loan
accounts with commercial banks per 1,000 adults(LACD), Outstanding deposits with commercial
banks (% of GDP)( OTDP), Outstanding loans with commercial banks (% of GDP)( OTL).The null
hypothesis of all the unit root tests performed state the existence of unit root, the alternative
hypothesis state the absence of it. The results are derived by using Eviews 9. Following detailed
performed tests are given further: Unit roots tests are performed with ADF tests.
Because of mixture of first and second difference, we are allowed to use ARDL. This technique
was selected for two main reasons: First, it is effective in executing the short- and long-term
relationships between the different variables that do not have the same order of integration ,
Moïse Bigirimana, Xu Hongyi
Research on Relationship between Financial Inclusion and Economic Growth of Rwanda: Evidence from
Commercial Banks with ARDL Approach
10
provided that such variables are stationary in level; I (0), and/or they are stationary in the first
difference; I (1). Second, the ARDL approach can remove the problems associated with omitted
variables and auto-correlation. Third, it can be useful for a small sample size application. The
same reason is shared by other researchers such as Adel & Imen (2018) and Shahzad, Jan, Ali,
& Ullah (2018).
We used ARDL as it is a new approach to the problem of testing the existence of a level
relationship between a dependent variable and a set of regressors, when it is not known with
certainty whether the underlying regressors are the trend- or first-difference stationary
(Pesaran, Shin, & Smith, 2001).This has been used widely by different as it is the best and new
approach(Goh, Sam, & Mcnown, 2017; Tursoy & Faisal, 2017; Bildirici & Ozaksoy, 2017; Murthy
& Okunade, 2016).
The results of ARDL, the bound test for co-integration test reveals that there is long run
relationship between Gross Domestic Product, Automated teller Machines per adult people,
Automated teller Machines per square km, Bank branches per adult people, Branches per square
km, deposits accounts per adults people, loan accounts per adults people, Outstanding loans,
and Outstanding deposits per adults people at 5percent level of significance. F-statistic of
6.100343 is bigger than the upper bound critical value of 3.97; therefore the null hypothesis of
no co-integration is rejected at 1% level of significance which testifies the presence of the long-
run relationship between GDP and all the explanatory variables.
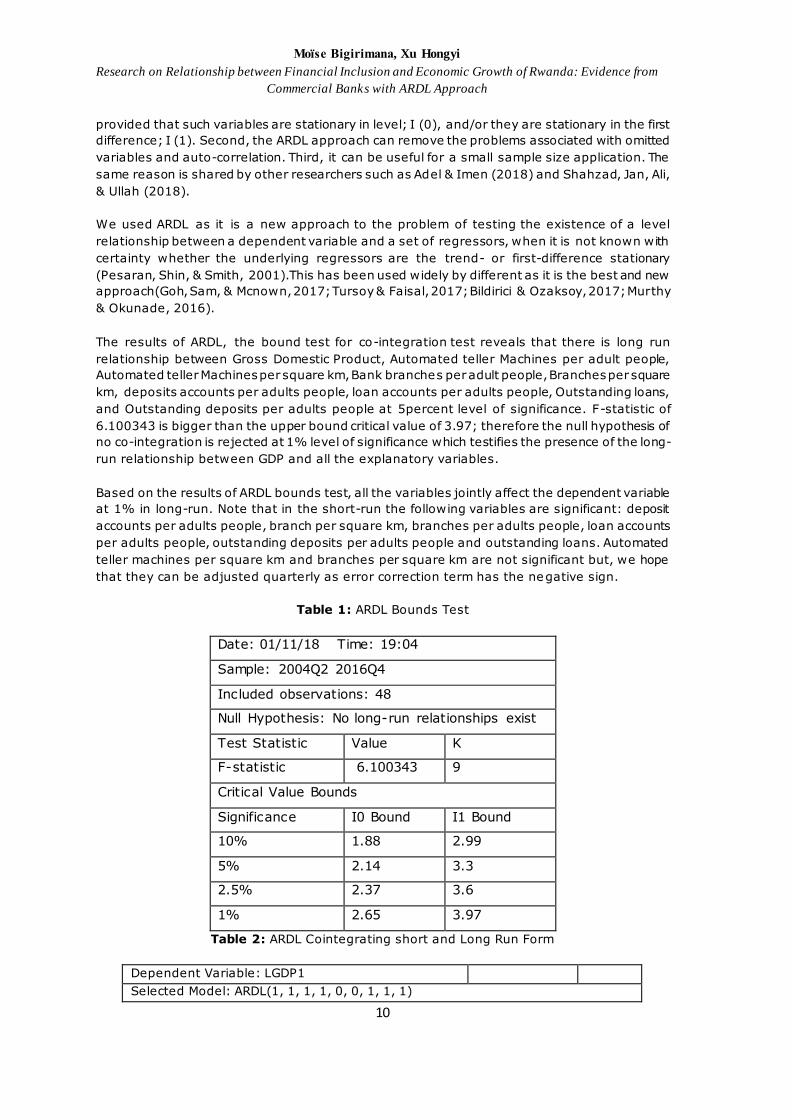
Based on the results of ARDL bounds test, all the variables jointly affect the dependent variable
at 1% in long-run. Note that in the short-run the following variables are significant: deposit
accounts per adults people, branch per square km, branches per adults people, loan accounts
per adults people, outstanding deposits per adults people and outstanding loans. Automated
teller machines per square km and branches per square km are not significant but, we hope
that they can be adjusted quarterly as error correction term has the negative sign.
Table 1: ARDL Bounds Test
Date: 01/11/18 Time: 19:04
Sample: 2004Q2 2016Q4
Included observations: 48
Null Hypothesis: No long-run relationships exist
Test Statistic Value K
F-statistic 6.100343 9
Critical Value Bounds
Significance I0 Bound I1 Bound
10% 1.88 2.99
5% 2.14 3.3
2.5% 2.37 3.6
1% 2.65 3.97
Table 2: ARDL Cointegrating short and Long Run Form
Dependent Variable: LGDP1
Selected Model: ARDL(1, 1, 1, 1, 0, 0, 1, 1, 1)
Moïse Bigirimana, Xu Hongyi
Research on Relationship between Financial Inclusion and Economic Growth of Rwanda: Evidence from
Commercial Banks with ARDL Approach
11
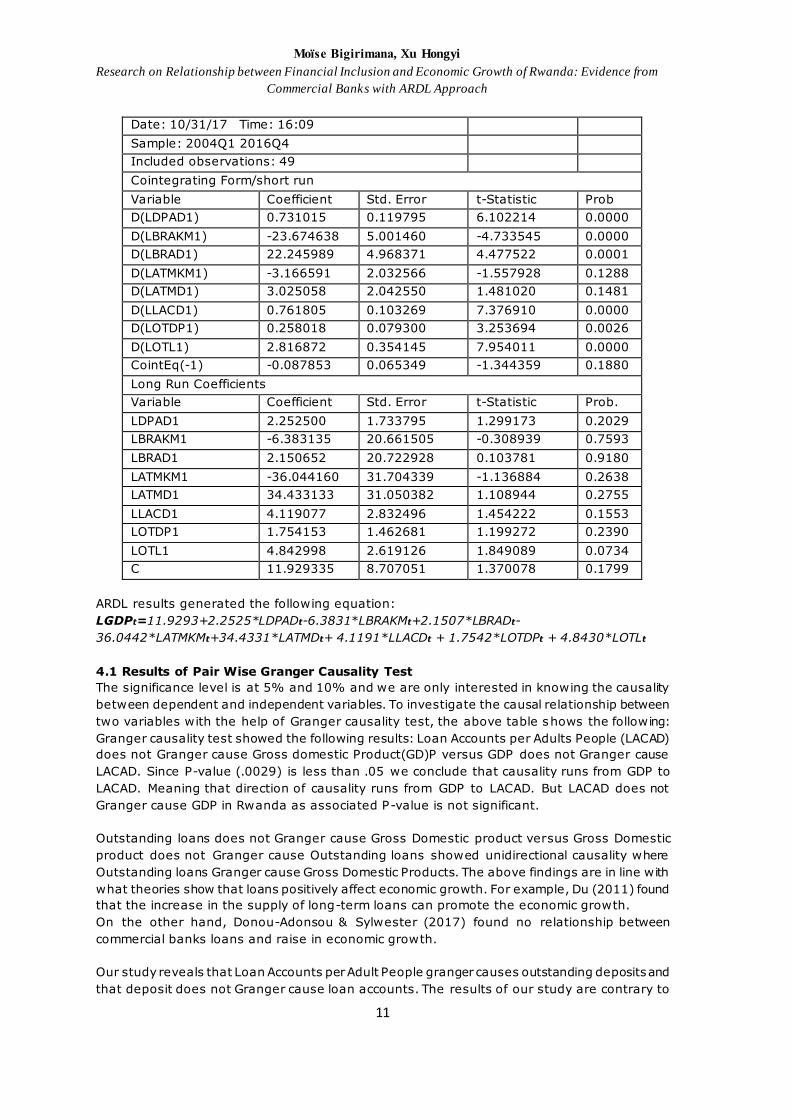
Date: 10/31/17 Time: 16:09
Sample: 2004Q1 2016Q4
Included observations: 49
Cointegrating Form/short run
Variable Coefficient Std. Error t-Statistic Prob
D(LDPAD1) 0.731015 0.119795 6.102214 0.0000
D(LBRAKM1) -23.674638 5.001460 -4.733545 0.0000
D(LBRAD1) 22.245989 4.968371 4.477522 0.0001
D(LATMKM1) -3.166591 2.032566 -1.557928 0.1288
D(LATMD1) 3.025058 2.042550 1.481020 0.1481
D(LLACD1) 0.761805 0.103269 7.376910 0.0000
D(LOTDP1) 0.258018 0.079300 3.253694 0.0026
D(LOTL1) 2.816872 0.354145 7.954011 0.0000
CointEq(-1) -0.087853 0.065349 -1.344359 0.1880
Long Run Coefficients
Variable Coefficient Std. Error t-Statistic Prob.
LDPAD1 2.252500 1.733795 1.299173 0.2029
LBRAKM1 -6.383135 20.661505 -0.308939 0.7593
LBRAD1 2.150652 20.722928 0.103781 0.9180
LATMKM1 -36.044160 31.704339 -1.136884 0.2638
LATMD1 34.433133 31.050382 1.108944 0.2755
LLACD1 4.119077 2.832496 1.454222 0.1553
LOTDP1 1.754153 1.462681 1.199272 0.2390
LOTL1 4.842998 2.619126 1.849089 0.0734
C 11.929335 8.707051 1.370078 0.1799
ARDL results generated the following equation:
LGDPt=11.9293+2.2525*LDPADt-6.3831*LBRAKMt+2.1507*LBRADt-
36.0442*LATMKMt+34.4331*LATMDt+ 4.1191*LLACDt + 1.7542*LOTDPt + 4.8430*LOTLt
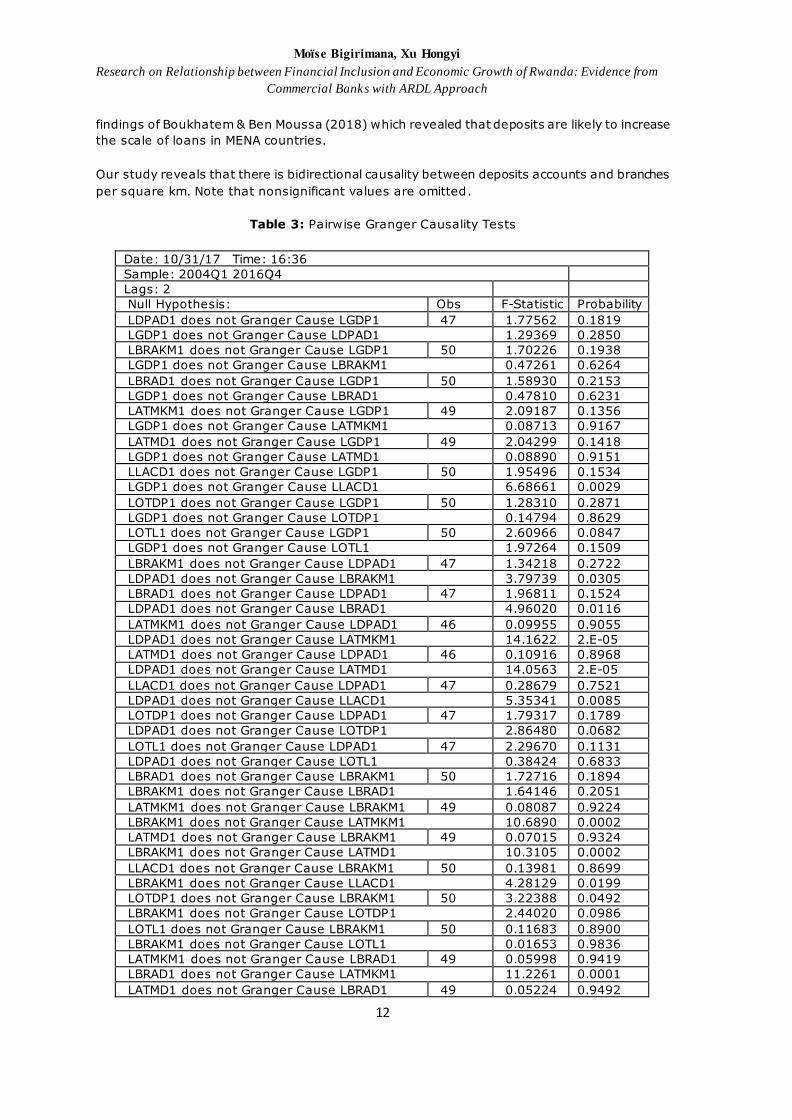
4.1 Results of Pair Wise Granger Causality Test
The significance level is at 5% and 10% and we are only interested in knowing the causality
between dependent and independent variables. To investigate the causal relationship between
two variables with the help of Granger causality test, the above table shows the following:
Granger causality test showed the following results: Loan Accounts per Adults People (LACAD)
does not Granger cause Gross domestic Product(GD)P versus GDP does not Granger cause
LACAD. Since P-value (.0029) is less than .05 we conclude that causality runs from GDP to
LACAD. Meaning that direction of causality runs from GDP to LACAD. But LACAD does not
Granger cause GDP in Rwanda as associated P-value is not significant.
Outstanding loans does not Granger cause Gross Domestic product versus Gross Domestic
product does not Granger cause Outstanding loans showed unidirectional causality where
Outstanding loans Granger cause Gross Domestic Products. The above findings are in line with
what theories show that loans positively affect economic growth. For example, Du (2011) found
that the increase in the supply of long-term loans can promote the economic growth.
On the other hand, Donou-Adonsou & Sylwester (2017) found no relationship between
commercial banks loans and raise in economic growth.
Our study reveals that Loan Accounts per Adult People granger causes outstanding deposits and
that deposit does not Granger cause loan accounts. The results of our study are contrary to
Moïse Bigirimana, Xu Hongyi
Research on Relationship between Financial Inclusion and Economic Growth of Rwanda: Evidence from
Commercial Banks with ARDL Approach
12
findings of Boukhatem & Ben Moussa (2018) which revealed that deposits are likely to increase
the scale of loans in MENA countries.
Our study reveals that there is bidirectional causality between deposits accounts and branches
per square km. Note that nonsignificant values are omitted.
Table 3: Pairwise Granger Causality Tests
Date: 10/31/17 Time: 16:36
Sample: 2004Q1 2016Q4
Lags: 2
Null Hypothesis: Obs F-Statistic Probability
LDPAD1 does not Granger Cause LGDP1 47 1.77562 0.1819
LGDP1 does not Granger Cause LDPAD1 1.29369 0.2850
LBRAKM1 does not Granger Cause LGDP1 50 1.70226 0.1938
LGDP1 does not Granger Cause LBRAKM1 0.47261 0.6264
LBRAD1 does not Granger Cause LGDP1 50 1.58930 0.2153
LGDP1 does not Granger Cause LBRAD1 0.47810 0.6231
LATMKM1 does not Granger Cause LGDP1 49 2.09187 0.1356
LGDP1 does not Granger Cause LATMKM1 0.08713 0.9167
LATMD1 does not Granger Cause LGDP1 49 2.04299 0.1418
LGDP1 does not Granger Cause LATMD1 0.08890 0.9151
LLACD1 does not Granger Cause LGDP1 50 1.95496 0.1534
LGDP1 does not Granger Cause LLACD1 6.68661 0.0029
LOTDP1 does not Granger Cause LGDP1 50 1.28310 0.2871
LGDP1 does not Granger Cause LOTDP1 0.14794 0.8629
LOTL1 does not Granger Cause LGDP1 50 2.60966 0.0847
LGDP1 does not Granger Cause LOTL1 1.97264 0.1509
LBRAKM1 does not Granger Cause LDPAD1 47 1.34218 0.2722
LDPAD1 does not Granger Cause LBRAKM1 3.79739 0.0305
LBRAD1 does not Granger Cause LDPAD1 47 1.96811 0.1524
LDPAD1 does not Granger Cause LBRAD1 4.96020 0.0116
LATMKM1 does not Granger Cause LDPAD1 46 0.09955 0.9055
LDPAD1 does not Granger Cause LATMKM1 14.1622 2.E-05
LATMD1 does not Granger Cause LDPAD1 46 0.10916 0.8968
LDPAD1 does not Granger Cause LATMD1 14.0563 2.E-05
LLACD1 does not Granger Cause LDPAD1 47 0.28679 0.7521
LDPAD1 does not Granger Cause LLACD1 5.35341 0.0085
LOTDP1 does not Granger Cause LDPAD1 47 1.79317 0.1789
LDPAD1 does not Granger Cause LOTDP1 2.86480 0.0682
LOTL1 does not Granger Cause LDPAD1 47 2.29670 0.1131
LDPAD1 does not Granger Cause LOTL1 0.38424 0.6833
LBRAD1 does not Granger Cause LBRAKM1 50 1.72716 0.1894
LBRAKM1 does not Granger Cause LBRAD1 1.64146 0.2051
LATMKM1 does not Granger Cause LBRAKM1 49 0.08087 0.9224
LBRAKM1 does not Granger Cause LATMKM1 10.6890 0.0002
LATMD1 does not Granger Cause LBRAKM1 49 0.07015 0.9324
LBRAKM1 does not Granger Cause LATMD1 10.3105 0.0002
LLACD1 does not Granger Cause LBRAKM1 50 0.13981 0.8699
LBRAKM1 does not Granger Cause LLACD1 4.28129 0.0199
LOTDP1 does not Granger Cause LBRAKM1 50 3.22388 0.0492
LBRAKM1 does not Granger Cause LOTDP1 2.44020 0.0986
LOTL1 does not Granger Cause LBRAKM1 50 0.11683 0.8900
LBRAKM1 does not Granger Cause LOTL1 0.01653 0.9836
LATMKM1 does not Granger Cause LBRAD1 49 0.05998 0.9419
LBRAD1 does not Granger Cause LATMKM1 11.2261 0.0001
LATMD1 does not Granger Cause LBRAD1 49 0.05224 0.9492
Moïse Bigirimana, Xu Hongyi
Research on Relationship between Financial Inclusion and Economic Growth of Rwanda: Evidence from
Commercial Banks with ARDL Approach
13
LBRAD1 does not Granger Cause LATMD1 10.9240 0.0001
LLACD1 does not Granger Cause LBRAD1 50 0.09494 0.9096
LBRAD1 does not Granger Cause LLACD1 4.27167 0.0200
LOTDP1 does not Granger Cause LBRAD1 50 2.93081 0.0636
LBRAD1 does not Granger Cause LOTDP1 2.22517 0.1198
LOTL1 does not Granger Cause LBRAD1 50 0.07187 0.9308
LBRAD1 does not Granger Cause LOTL1 0.00158 0.9984
LATMD1 does not Granger Cause LATMKM1 49 4.59461 0.0154
LATMKM1 does not Granger Cause LATMD1 4.46010 0.0172
LLACD1 does not Granger Cause LATMKM1 49 1.27014 0.2909
LATMKM1 does not Granger Cause LLACD1 3.05354 0.0573
LOTDP1 does not Granger Cause LATMKM1 49 2.94759 0.0629
LATMKM1 does not Granger Cause LOTDP1 3.60674 0.0354
LOTL1 does not Granger Cause LATMKM1 49 0.30334 0.7399
LATMKM1 does not Granger Cause LOTL1 1.84394 0.1702
LLACD1 does not Granger Cause LATMD1 49 1.26936 0.2911
LATMD1 does not Granger Cause LLACD1 2.86424 0.0677
LOTDP1 does not Granger Cause LATMD1 49 2.75521 0.0746
LATMD1 does not Granger Cause LOTDP1 3.58046 0.0363
LOTL1 does not Granger Cause LATMD1 49 0.31533 0.7312
LATMD1 does not Granger Cause LOTL1 1.76704 0.1827
LOTDP1 does not Granger Cause LLACD1 50 2.39624 0.1026
LLACD1 does not Granger Cause LOTDP1 2.74491 0.0750
LOTL1 does not Granger Cause LLACD1 50 0.87565 0.4236
LLACD1 does not Granger Cause LOTL1 2.60951 0.0847
LOTL1 does not Granger Cause LOTDP1 50 1.90321 0.1609
LOTDP1 does not Granger Cause LOTL1 3.13334 0.0532
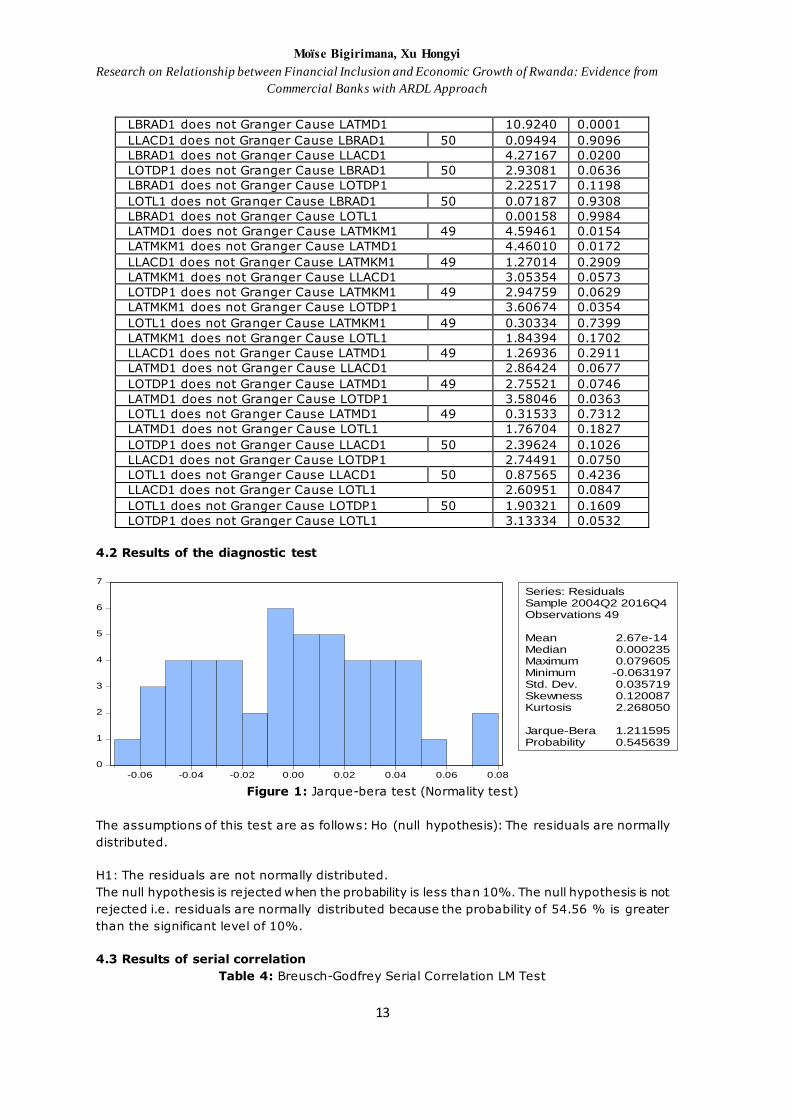
4.2 Results of the diagnostic test
0
1
2
3
4
5
6
7
-0.06 -0.04 -0.02 0.00 0.02 0.04 0.06 0.08
Series: ResidualsSample 2004Q2 2016Q4Observations 49
Mean 2.67e-14Median 0.000235Maximum 0.079605Minimum -0.063197Std. Dev. 0.035719Skewness 0.120087Kurtosis 2.268050
Jarque-Bera 1.211595Probability 0.545639
Figure 1: Jarque-bera test (Normality test)
The assumptions of this test are as follows: Ho (null hypothesis): The residuals are normally
distributed.
H1: The residuals are not normally distributed.
The null hypothesis is rejected when the probability is less than 10%. The null hypothesis is not
rejected i.e. residuals are normally distributed because the probability of 54.56 % is greater
than the significant level of 10%.
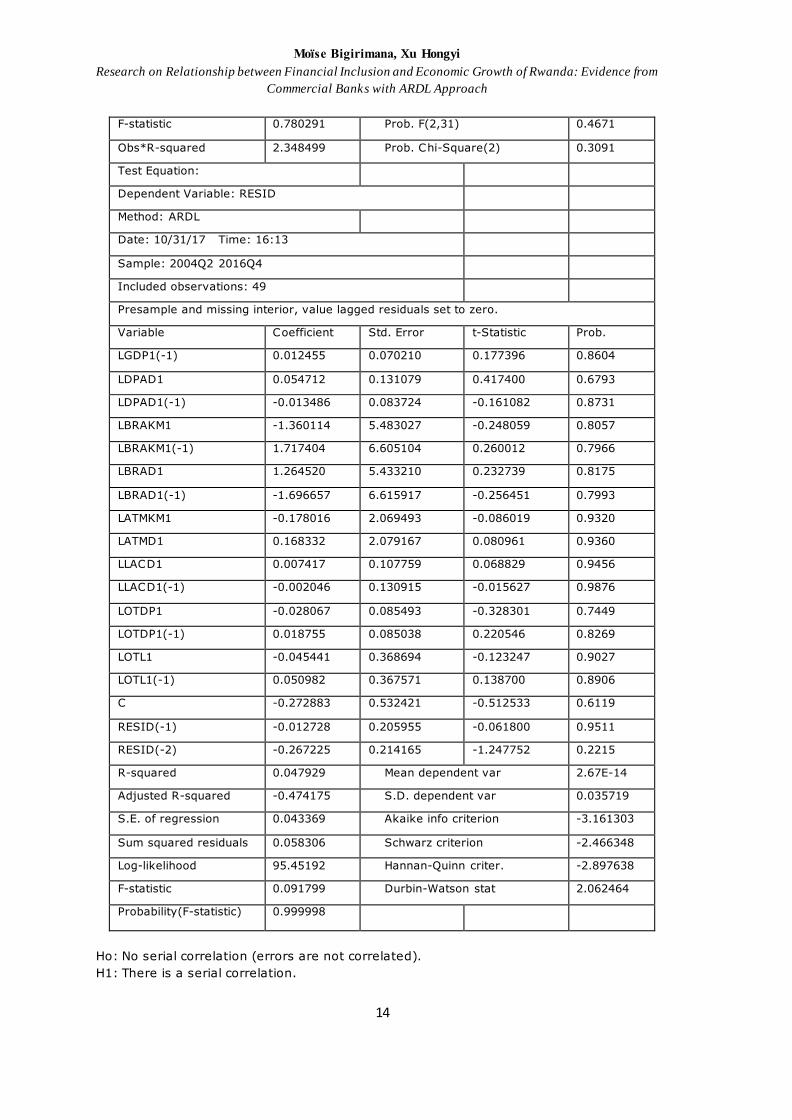
4.3 Results of serial correlation
Table 4: Breusch-Godfrey Serial Correlation LM Test
Moïse Bigirimana, Xu Hongyi
Research on Relationship between Financial Inclusion and Economic Growth of Rwanda: Evidence from
Commercial Banks with ARDL Approach
14
F-statistic 0.780291 Prob. F(2,31) 0.4671
Obs*R-squared 2.348499 Prob. Chi-Square(2) 0.3091
Test Equation:
Dependent Variable: RESID
Method: ARDL
Date: 10/31/17 Time: 16:13
Sample: 2004Q2 2016Q4
Included observations: 49
Presample and missing interior, value lagged residuals set to zero.
Variable Coefficient Std. Error t-Statistic Prob.
LGDP1(-1) 0.012455 0.070210 0.177396 0.8604
LDPAD1 0.054712 0.131079 0.417400 0.6793
LDPAD1(-1) -0.013486 0.083724 -0.161082 0.8731
LBRAKM1 -1.360114 5.483027 -0.248059 0.8057
LBRAKM1(-1) 1.717404 6.605104 0.260012 0.7966
LBRAD1 1.264520 5.433210 0.232739 0.8175
LBRAD1(-1) -1.696657 6.615917 -0.256451 0.7993
LATMKM1 -0.178016 2.069493 -0.086019 0.9320
LATMD1 0.168332 2.079167 0.080961 0.9360
LLACD1 0.007417 0.107759 0.068829 0.9456
LLACD1(-1) -0.002046 0.130915 -0.015627 0.9876
LOTDP1 -0.028067 0.085493 -0.328301 0.7449
LOTDP1(-1) 0.018755 0.085038 0.220546 0.8269
LOTL1 -0.045441 0.368694 -0.123247 0.9027
LOTL1(-1) 0.050982 0.367571 0.138700 0.8906
C -0.272883 0.532421 -0.512533 0.6119
RESID(-1) -0.012728 0.205955 -0.061800 0.9511
RESID(-2) -0.267225 0.214165 -1.247752 0.2215
R-squared 0.047929 Mean dependent var 2.67E-14
Adjusted R-squared -0.474175 S.D. dependent var 0.035719
S.E. of regression 0.043369 Akaike info criterion -3.161303
Sum squared residuals 0.058306 Schwarz criterion -2.466348
Log-likelihood 95.45192 Hannan-Quinn criter. -2.897638
F-statistic 0.091799 Durbin-Watson stat 2.062464
Probability(F-statistic) 0.999998
Ho: No serial correlation (errors are not correlated).
H1: There is a serial correlation.

Moïse Bigirimana, Xu Hongyi
Research on Relationship between Financial Inclusion and Economic Growth of Rwanda: Evidence from
Commercial Banks with ARDL Approach
15
The results show that there is no serial correlation up to the 16th lag because all probabilities
are more than 10% level of significance under correlogram of residuals squared and correlogram
–q-statistics. Our results show that error terms are not serially correlated.
-20
-15
-10
-5
0
5
10
15
20
2008 2009 2010 2011 2012 2013 2014 2015 2016
CUSUM 5% Significance
Figure 2: Stability test
Figure 2 shows that the CUSUM plot cross the 5% critical lines. Therefore, we can safely conclude
that the estimated parameters for the short-dynamics and long-run of the gross domestic
products in Rwanda are stable.
5. Conclusion and Recommendations The objective of this research is to study the relationship between financial inclusion and
economic growth of Rwanda. We used different financial inclusion indicators taking into account
only commercial banks. Our research covers 13 years from 2004 to 2016. We applied ARDL
approach and Granger causality tests in this research.
The results of ARDL, the bound test for co-integration test reveal that there is long-run
relationship between Gross Domestic Product, Automated teller Machines per adult people,
Automated teller Machines per square km, Bank branches per adult people, Branches per square
km, deposits accounts per adults people, loan accounts per adults people, Outstanding loans,
and Outstanding deposits per adults people at 5percent level of significance. The calculated F-
statistic of 6.100343 is bigger than the upper bound critical value of 3.97; therefore the null
hypothesis of no co-integration is rejected even bellow at 1% level of significance which testifies
the presence of a long-run relationship between GDP and all explanatory variables.
Based on the results of ARDL bounds test, all the variables jointly affect the dependent variable
at 1% in the long-run. Note that in the short-run the following variables are significant: deposit
accounts per adults people, branch per square km, branches per adults people, loan accounts
per adults people, outstanding deposits per adults people and outstanding loans. Automated
teller machines per square km and branches per square km are not significant, but we hope
that they can be adjusted quarterly as error correction term has the negative sign.
Granger causality test showed the following results: Loan Accounts per Adults People (LACAD)
does not Granger cause Gross domestic Product (GDP) versus GDP does not Granger cause
LACAD. Since P-value (.0029) is less than .05 we conclude that causality runs from GDP to
LACAD, meaning that direction of causality runs from GDP to LACAD. But LACAD does not
Granger cause GDP in Rwanda as associated P-value is not significant. Outstanding loans does
not Granger cause Gross Domestic product versus Gross Domestic product does not Granger
cause Outstanding loans showed unidirectional causality where Outstanding loans Granger
cause Gross Domestic Products. This is in line with what theories show that loans cause
Moïse Bigirimana, Xu Hongyi
Research on Relationship between Financial Inclusion and Economic Growth of Rwanda: Evidence from
Commercial Banks with ARDL Approach
16
economic growth. We found that there is bidirectional causality between deposits accounts and
branches per square km.
ARDL results showed that all the dependent variables explain independent variable. On the basis
of ARDL and Granger causality test, we find that financial inclusion cause economic growth in
Rwanda. As the results of our study revealed that commercial banks loans contributes to
economic growth of Rwanda, the government of Rwanda should set policies that ease loan
access for more people to take loans. This would boost financial inclusion as well as economic
growth.
References Adel, I., & Imen, G. (2018). Does public expenditure on education promote Tunisian and
Moroccan GDP per capita? ARDL approach. The Journal of Finance and Data Science, 1–13.
Anwar, S., & Sun, S. (2011). Financial development, foreign investment and economic
growth in Malaysia. Journal of Asian Economics, 22(4), 335–342. Crossref
Bahmani-oskooee, M., Halicioglu, F., & Hegerty, S. W. (2016). Mexican bilateral trade and
the J-curve: An application of the nonlinear ARDL model. Economic Analysis and Policy.
Crossref
Baldi, Guido and Sipilova, V. (2014). How Big Are the Employment Effects of Microloans ?
Evidence from a Case Study in Latvia. Theoretical and Practical Research in Economic Field,
V(1), 17–31.
Bayero, M. A. (2015). Effects of cashless economy policy on financial inclusion in Nigeria: An
exploratory study. Procedia -Social and Behavioral Sciences Global Conference on Business
& Social Science, 172, 49–56. Crossref
Beck, T., DemirgüÇ-Kunt, A., & Maksimovic, V. (2005). Financial and Legal Constraints to
Growth: Does Firm Size Matter? The Journal of Finance, 60(1), 137–177. Crossref
Beck, T., Demirguc-Kunt, A., & Martinez Peria, M. S. (2007). Reaching out: Access to and
use of banking services across countries. Journal of Financial Economics, 85(1), 234–266.
Crossref
Bencivenga, V., & Smith, B. (1991). Financial intermediation and endogenous growth. The
Review of Economic Studies, 58(2), 195–209. Crossref
Berhane, G., & Gardebroek, C. (2011). Does microfinance reduce rural poverty? Evidence-
based on household panel data from northern Ethiopia. American Journal of Agricultural
Economics, 93(1), 43–55. Crossref
Bildirici, M., & Ozaksoy, F. (2017). The relationship between woody biomass consumption
and economic growth : Nonlinear ARDL and causality. Journal of Forest Economics, 27, 60–
69. Crossref
Boukhatem, J., & Ben Moussa, F. (2018). The effect of Islamic banks on GDP growth: Some
evidence from selected MENA countries. Borsa Istanbul Review. Crossref
Chakraborty, S., & Ray, T. (2006). Bank-based versus market-based financial systems: A
growth-theoretic analysis. Journal of Monetary Economics, 53(2), 329–350. Crossref
Claessens, S., & Laeven, L. (2003). Financial Development, Property Rights, and Growth.
Journal of Finance, 58(6), 2401–2436. Crossref
Daly, S., & Frikha, M. (2016). Banks and economic growth in developing countries : What
about Islamic banks ? Cogent Economics&finance, 4(1), 1–26.
Demirgüc-Kant, A., & Klapper, L. (2012). Financial Inclusion in Africa: An Overview. The
World Bank: Policy Research Working Paper 6088, (June). Crossref
Demirguc-Kunt, A., Klapper, L., Singer, D., & Van Oudheusden, P. (2015). The Global Findex
Database 2014: Measuring Financial Inclusion around the World. World Bank Policy Research
Working Paper, 7255(April. Crossref

Moïse Bigirimana, Xu Hongyi
Research on Relationship between Financial Inclusion and Economic Growth of Rwanda: Evidence from
Commercial Banks with ARDL Approach
17
Diniz, E., Birochi, R., & Pozzebon, M. (2012). Triggers and barriers to financial inclusion: The
use of ICT-based branchless banking in an Amazon county. Electronic Commerce Research
and Applications, 11(5), 484–494. Crossref
Donou-Adonsou, F., & Sylwester, K. (2017). Growth effect of banks and microfinance:
Evidence from developing countries. Quarterly Review of Economics and Finance, 64, 44–56.
Crossref
Du, W. (2011). The investigation on the relationship between the problem of long ‐term loan
and economic growth. China Finance Review International, 1(2), 187–198. Crossref
Durusu-Ciftci, D., Ispir, M. S., & Yetkiner, H. (2016). Financial Development and Economic
Growth: Some Theory and More Evidence. Journal of Policy Modeling.
Fousekis, P., Katrakilidis, C., & Trachanas, E. (2015). Vertical price transmission in the US
beef sector : Evidence from the nonlinear ARDL model. Economic Modelling. Crossref
Fungáčová, Z., & Weill, L. (2013). Does competition influence bank failures? Evidence from
Russia. Economics of Transition, 21(2), 301–322. Crossref
Goh, S. K., Sam, C. Y., & Mcnown, R. (2017). Re-examining Foreign Direct Investment,
Exports, and Economic Growth in Asian Economies Using a Bootstrap ARDL Test for
Cointegration. Journal of Asian Economics. Crossref
Kim, D., Yu, J., & Hassan, M. K. (2018). Research in International Business and Finance
Financial inclusion and economic growth in OIC countries. Research in International Business
and Finance, 43, 1–14. Crossref
King, R., & Levine, R. (1993). Finance and Growth Schumpeter Might Be Right. The Quarterly
Journal of Economics, 108(3), 717–737. Crossref
Kodan, A. S. K., & Chhikara, K. S. (2013). A Theoretical and Quantitative Analysis of Financial
Inclusion and Economic Growth. Management and Labour Studies, 38(1–2), 103–133.
Liang, H. Y., & Reichert, A. K. (2012). The impact of banks and non-bank financial institutions
on economic growth. Service Industries Journal, 32(5), 699–717. Crossref
Mandel, B. R., & Seydl, J. (2016). Credit conditions and economic growth : Recent evidence
from US banks. Economics Letters, 147, 63–67. Crossref
Masoud, N., & Hardaker, G. (2012). The impact of financial development on economic
growth: Empirical analysis of emerging market countries. Studies in Economics and Finance,
29(3), 148–173. Crossref
Murthy, V. N. R., & Okunade, A. A. (2016). Determinants of U.S. Health Expenditure :
Evidence from autoregressive distributed lag ( ARDL ) approach to cointegration. Economic
Modelling, 59, 67–73. Crossref
Naceur, S. Ben, Barajas, A., & Massara, A. (2015). Can Islamic Banking Increase Financial
Inclusion ? International Monetary Fund, WP/15/31, 1–41. Crossref
Onaolapo, A. R. (2015). Effects of financial inclusion on the economic growth of Nigeria
(1982-2012). International Journal of Business and Management Review, 3(8), 11–28.
Park, C., & Mercado, R. V. (2015). Financial Inclusion, Poverty, and Income Inequality in
Developing Asia.ADB ECONOMICS WORKING PAPERS SERIES. ADBEconomics Working Paper
Series, (426). Crossref
Pesaran, M. H., Shin, Y., & Smith, R. J. (2001). Bounds testing approaches to the analysis
of level relationships. Journal of Applied Econometrics, 16(3), 289–326. Crossref
Rousseau, P. L., & D’Onofrio, A. (2013). Monetization, financial development, and growth:
Time series evidence from 22 Countries in Sub-Saharan Africa. World Development, 51, 132–
153. Crossref
Sarma, M. (2008). Index of Financial Inclusion. Indian Council for Research on International
Economic Relations Working Paper No 215, 1–26.
Sehrawat, M., & Giri, A. K. (2012). The impact of financial development on economic growth.
Studies in Economics and Finance, 29(3), 148–173. Crossref
Sehrawat, M., & Giri, A. K. (2016). Panel data analysis of financial development, economic
growth, and rural-urban income inequality. International Journal of Social Economics,
43(10), 998–1015. Crossref
Moïse Bigirimana, Xu Hongyi
Research on Relationship between Financial Inclusion and Economic Growth of Rwanda: Evidence from
Commercial Banks with ARDL Approach
18
Shahbaz, M., & Mafizur Rahman, M. (2014). Exports, financial development and economic
growth in Pakistan. International Journal of Development Issues, 13(2), 155–170. Crossref
Shahbaz, M., Rehman, I. U., & Muzaffar, A. T. (2015). Re-visiting financial development and
economic growth nexus: The role of capitalization in Bangladesh.South African Journal of
Economics, 83(3), 452–471. Crossref
Shahzad, M., Jan, A. U., Ali, S., & Ullah, R. (2018). Supply response analysis of tobacco
growers in Khyber Pakhtunkhwa: An ARDL approach. Field Crops Research, 218(January),
195–200. Crossref
Shan, J. Z., Morris, A. G., & Sun, F. (2001). Financial Development and Economic Growth:
An Egg‐and‐Chicken Problem? Review of International Economics, 9(3), 443–454. Crossref
Sharma, D. (2016). Nexus between financial inclusion and economic growth: evidence from
the emerging Indian economy. Journal of Financial Economic Policy, 8(1), 1–10. Crossref
Tursoy, T., & Faisal, F. (2017). The impact of gold and crude oil prices on stock market in
Turkey : Empirical evidences from ARDL bounds test and combined cointegration. Resources
Policy, (October), 0–1. Crossref
Vaithilingam, S., Guru, B. K., & Shanmugam, B. (2003). Bank Lending and Economic Growth
in Malaysia Bank Lending and Economic Growth in Malaysia. Journal of Asia-Pacific Business,
5, 51–69. Crossref
Valickova, P., Havranek, T., & Horvath, R. (2015). Financial development and economic
growth: A meta-analysis. Journal of Economic Surveys, 29(3), 506–526. Crossref
Zins, A., & Weill, L. (2016).The determinants of financial inclusion in Africa. Review of
Development Finance, 6(1), 46–57. Crossref