Research on redistributive effects of Croatian fiscal system Ivica Urban Institute of Public...
22
Research on redistributive effects of Croatian fiscal system Ivica Urban Institute of Public Finance
-
Upload
amelia-thomas -
Category
Documents
-
view
228 -
download
0
Transcript of Research on redistributive effects of Croatian fiscal system Ivica Urban Institute of Public...

Research on redistributive effects of Croatian fiscal system
Ivica Urban
Institute of Public Finance
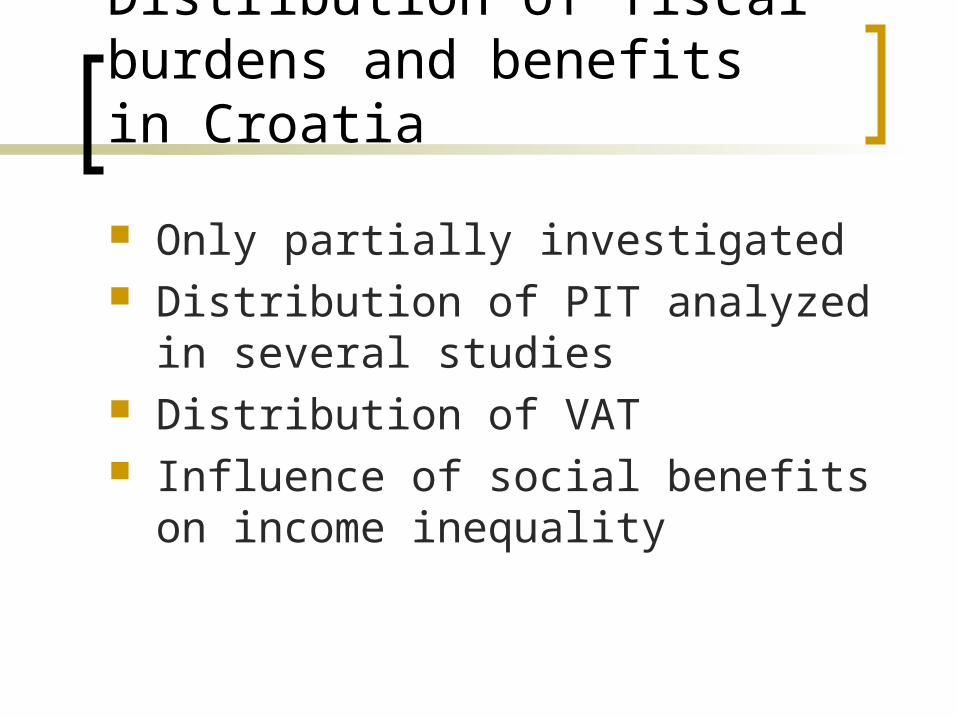
Distribution of fiscal burdens and benefits in Croatia
Only partially investigated Distribution of PIT analyzed in several
studies Distribution of VAT Influence of social benefits on income
inequality
Distribution of fiscal burdens and benefits in Croatia
No attempt to provide combined incidence calculation for several tax and benefit instruments

Income inequality in Croatia
World Bank (2006), Nestić (2005), World Bank (2001)
Disposable income inequality in Croatia is low in comparison with other transition countries
What is the influence of government on distribution of income?

Theses for research
Government redistributive policies are one of the prime determinants of disposable income inequality in Croatia
The largest part of income redistribution process is achieved through the public pension system
Fiscal instruments are highly efficient in reducing inequality (well-targeted and introducing low horizontal inequalities)

“Inequality” studies
Kesselman & Cheung (2004): Tax Incidence, Progressivity, and Inequality in Canada
Computable general equilibrium (CGE) Fiscal incidence (FINC) and Inequality (INEQ) studies: analyze
single tax forms or groups of taxes and/or benefits

“Inequality” studies
Assumptions (deficiencies, restrictions, problems with...)
a) inclusion only of direct taxes and benefits in analysis; exclusion of indirect taxes and in-kind government benefits,
b) income earners cannot shift the burden of personal taxes,
c) existence of taxes and transfers does not affect market incomes,
d) annual instead of lifetime perspective
“Inequality” studies: examples
Kim & Lambert (2007): Redistributive Effect of US Taxes and Public Transfers, 1994-2004
Immervoll et al. (2005): Household incomes and redistribution in the European Union: quantifying the equalising properties of taxes and benefits

Methodology
NX DGV
NN DGR
RVGGRE NX
bg
bg
V
n
j
jB
jm
i
iT
i
111
= Kakwani progressivity index of taxes T
V = Vertical effect
R = Reranking effect
GX = Gini coefficient of pre-fiscal income
GN = Gini coefficient of post-fiscal income
RE = Redistributive effect
= Kakwani regressivity index of benefitsB
NTN GGi
NBN GGj
Lambert (1986, 2001):
Immervoll et al. (2005):
DN = Concentration coefficient of post-fiscal income

Alternative approaches
A B C D
Method: Decomposition of vertical effect
Exclusion of one-by-one instrument from the base
Decomposition of vertical effect
Exclusion of one-by-one instrument from the base
Reference income: Pre-TB Pre-TB Post-TB Post-TB
Methods:
1. Lambert (1986) – Decomposition of vertical effect
2. Immervoll et al. (2005) – “Exclusion” of one-by-one instrument from the reference base
Reference income base:
1. Pre-TB income
2. Post-TB income

Equivalent incomes
iii eYy /
iii childrenadultse 3.05.05.0

Defining groups of households
EM = employed or self-employed, UN = unemployed or inactive; EL = the elder
Type Characterization Equivalent units in 2005 (%)
Fully employed EM 0, UN 0, EL 0 33.5 Mixed EM 0, UN 0, EL 0 32.5 Workless EM 0, UN 0, EL 0 16.2 Elder only EM 0, UN 0, EL 0 17.8

Distribution of income, taxes and benefits in 2005 (1)
-50
-40
-30
-20
-10
0
10
20
30
40
50
60
70
80
90
100
Fully employed Mixed Workless Elder only
PIT
SSC
Non means-testedbenefits
Means-testedbenefits
Pensions (<65)
Pensions (65&>)
Total marketincome (after tax)

Distribution of income, taxes and benefits in 2005 (2)
0.0
0.1
0.2
0.3
0.4
0.5
0.6
0.7
0.8
0.9
1.0
Fully employed Mixed Workless Elder only
Non means-testedbenefits
Means-testedbenefits
Pensions (<65)
Pensions (65&>)
Other (periodic)private income
Non-taxable marketincome
Taxable marketincome (after tax)

Entropy index decomposition
0,0
0,1
0,2
0,3
0,4
0,5
0,6
0,7
Pre-TB Post-TB Pre-TB Post-TB
En
tro
py
ind
ex
Within-group
Between-group
Inequality
5.0 0.2

Distribution of income, taxes and benefits in 2005 (3)
6
16
26
51
13 1216
23
36
0.50
10
20
30
40
50
60
1 2 3 4 5
Quintile groups
Pe
rce
nt o
f th
e to
tal
Pre-TB income Disposable income
3
13
24
60
39
20
129 6
0.40
10
20
30
40
50
60
70
1 2 3 4 5
Quintile groups
Per
cent
of
the
tota
l
SSC and PIT Pensions and benefits

Inequality measures
0.0
0.2
0.4
0.6
0.8
5.1 2 3
RE
R
DN
R+DN=GN
RE+R+DN=GX

Decomposition of redistributive effect
0.0 0.2 0.4 0.6 0.8 1.0
Post-TB
Pre-TB
Ref
eren
ce i
nco
me
bas
e
Contribution
Pens(65&>) Pens(<65) PIT Child AFamSuppA SSC-PensF SSC-HealthF Other

Preliminary conclusions
Croatian system of direct taxes, pensions and social benefits seems to be highly redistributive
Public pensions are the most contributive instrument, followed by SSC and PIT
Unfinished research, still lot to do

Fiscal system coverage
PIT and SSC = 38% of total general government revenue
Public pensions and cash benefits = 34% of total expenditures (2006)
Huge part of fiscal system is still outside the coverage of this analysis

Further issues (1)
How does Croatian fiscal system stand in comparison with EU countries in terms of achieving equity goals?
Are the individual instruments and the system as a whole enough redistributive?
Are there some instruments that are not equitable? Should taxes be more progressive?
Can the overall redistributive effect be significantly altered through increase (decrease) of the PIT rate schedule progressivity?

Further issues (2)
How can total welfare be increased keeping the amount of expenditures and taxes unchanged?
What equity role have public pensions now, and how it should be in future?
How can other fiscal instruments be included into current model to obtain more comprehensive picture of fiscal incidence?