Research Methods Revision January 2010. Research Methods Revision BATs describe the different types...
28
Research Methods Revision January 2010
-
Upload
rosa-perry -
Category
Documents
-
view
222 -
download
3
Transcript of Research Methods Revision January 2010. Research Methods Revision BATs describe the different types...

Research Methods Revision
January 2010

Research Methods Revision
BATs describe the different types of experimental
and non-experimental techniques in Psychological research.
evaluate the strengths and weaknesses of each type of technique
Identify ethical issues and how to deal with them
Identify and use descriptive stats
Research Methods Revision
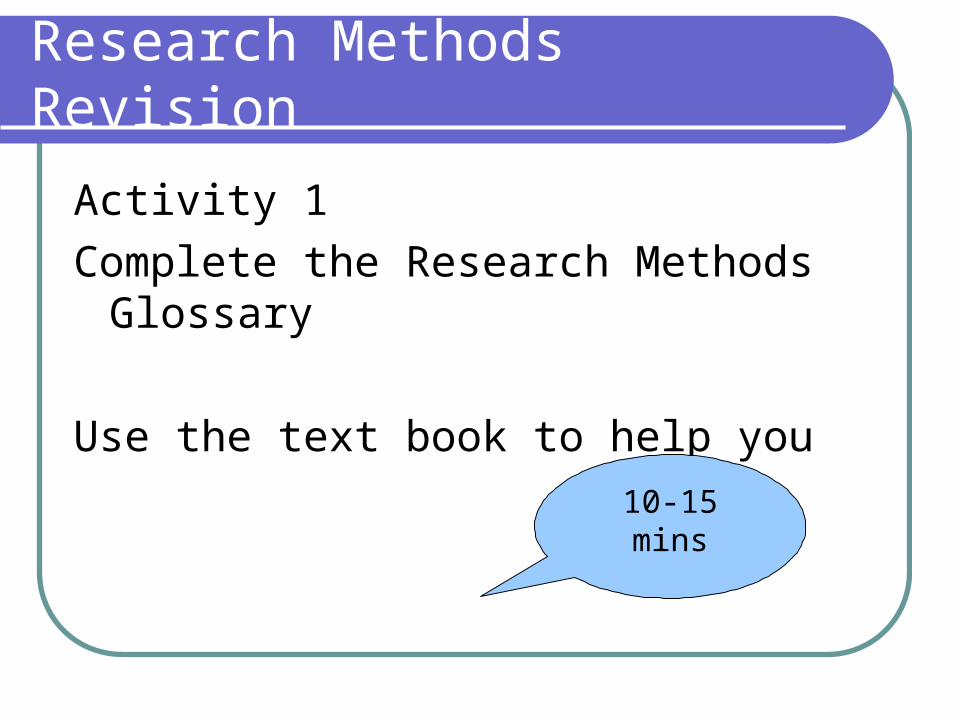
Activity 1
Complete the Research Methods Glossary
Use the text book to help you
10-15 mins
Research Methods Revision
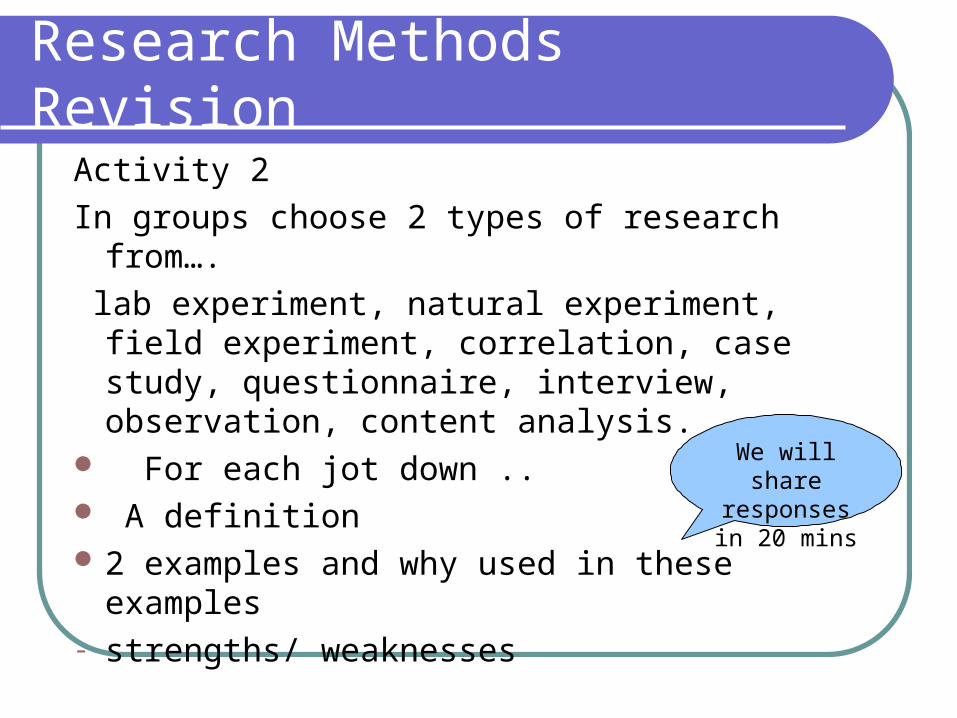
Activity 2
In groups choose 2 types of research from….
lab experiment, natural experiment, field experiment, correlation, case study, questionnaire, interview, observation, content analysis.
For each jot down .. A definition 2 examples and why used in these examples- strengths/ weaknesses
We will share responses in
20 mins

Research Methods Revision
Activity 3
Complete the ‘Defending the design’ worksheet
10 mins

Research Methods Revision
Activity 4 Ethics Match the cards Write the answers in correct order on the
blank sheet
15-20 mins

Research Methods Revision
Activity 5 Ethics Choose 2 pieces of research from the
Attachments and Memory topics Highlight the ethical issues in each Say how they were or could have been
dealt with 15-20 mins
4 Research Methods 8
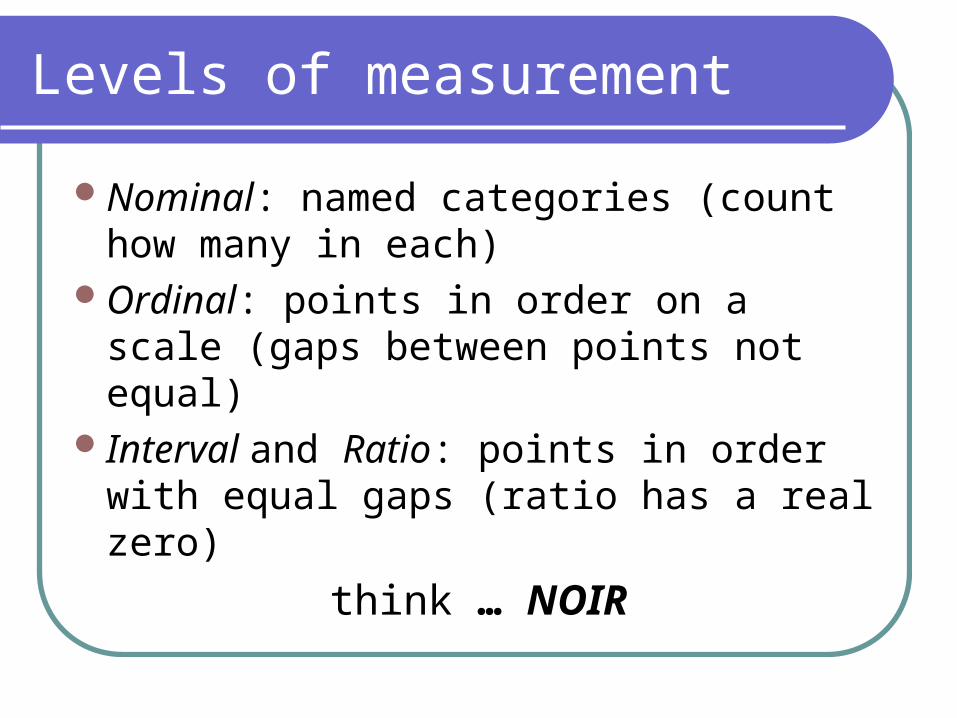
Levels of measurement
Nominal: named categories (count how many in each)
Ordinal: points in order on a scale (gaps between points not equal)
Interval and Ratio: points in order with equal gaps (ratio has a real zero)
think … NOIR

Which levels of measurement are being used in each of the
following tests?
4 Research Methods 9
Levels of measurement

How securely attached is your child?
Tick all of the following which apply:
4 Research Methods 10
• s/he runs to me when upset• s/he hides behind me when
frightened• s/he will play away from me
only if s/he can see me• s/he brings me things to
show me

How good is your memory?
Tick one of the following:Excellent – I remember everythingVery good – I remember all the important
thingsOkayPoor – I forget some important stuffTerrible – I forget a lot
4 Research Methods 11

Parasocial attachments
Which of these TV and video characters are you attached to?
4 Research Methods 12

How quickly does a child cry when left alone?
Timed in seconds from
the departure of the
primary carer
4 Research Methods 13

Does repetition help recall?
Number of repetitions of a nonsense syllable and its effect on accuracy of recall
4 Research Methods 14
NCL PJX
FRK GMW QSZ
MYCBDK

Improving eyewitness testimony
Which of the following factors do you think is most important in improving eyewitness recall?
4 Research Methods 15
• Immediate access to pen and paper to jot down what they can remember
• Helping them by asking them guiding questions• Returning eyewitnesses to the
scene of the crime• Using scene reconstruction to
help them to feel the same as they did at the time
• Letting them discuss what has happened with other witnesses

Are these subjects sciences?
BiologyGeography PsychologyREPhysics
4 Research Methods 16
4 Research Methods 17
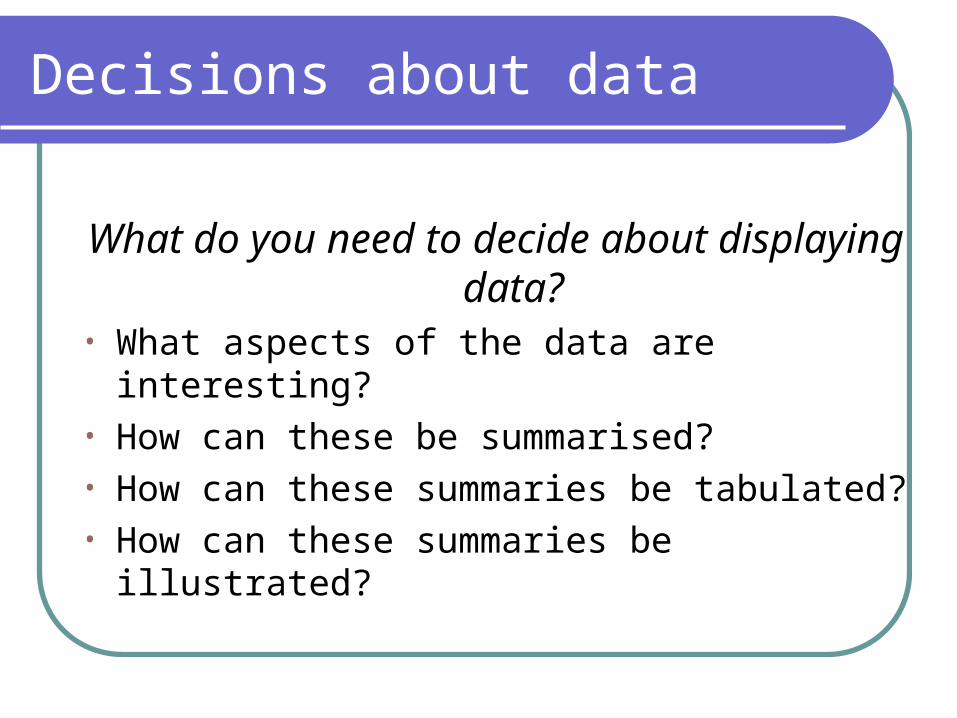
Decisions about data
What do you need to decide about displaying data?
• What aspects of the data are interesting?• How can these be summarised?• How can these summaries be tabulated?• How can these summaries be illustrated?

Presenting numerical data
Summary data tables:• tables should include totals or a measure of
central tendency (mean, median or mode)• where appropriate, tables should include a
measure of spread (eg range or standard deviation)
• Remember that the choice of measures of central tendency and spread depend on the level of measurement
4 Research Methods 18

Measures of central tendency and spread
Measure of central tendency:• Mode: for nominal data• Median: for ordinal data• Mean: for interval or ratio data
Measure of spread:• Range: for ordinal data• Standard deviation: for interval or ratio data
4 Research Methods 19

Illustrating data: graphs and charts
• Bar charts• Histograms• Line graphs• Scatterplots
4 Research Methods 20

Bar charts
• used to present totals and averages
• bars must be separated in space
• title & axis labels
4 Research Methods 21
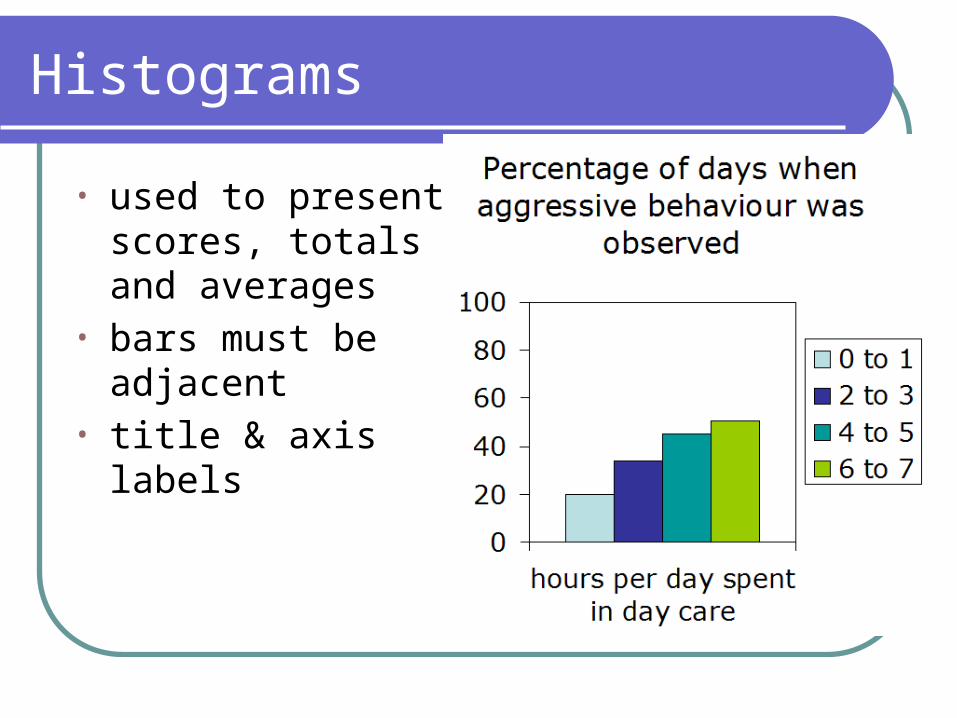
Histograms
• used to present scores, totals and averages
• bars must be adjacent
• title & axis labels
4 Research Methods 22

Line graphs
4 Research Methods 23

Scatterplots
4 Research Methods 24

Scatterplots
4 Research Methods 25

Scatterplots
4 Research Methods 26

Scatterplots
4 Research Methods 27

Plenary
Pub quiz Use Quick Quiz round 1Mark Round 1Round 2Mark round 2