
Research Institute - credit-suisse.com · 31 Hermes Intl. 53 31 Yes Bank 30% 67 31 Raia Drogasil On...
44
September 2017 Research Institute Thought leadership from Credit Suisse Research and the world’s foremost experts The CS Family 1000
-
Upload
hoangthuan -
Category
Documents
-
view
215 -
download
0
Transcript of Research Institute - credit-suisse.com · 31 Hermes Intl. 53 31 Yes Bank 30% 67 31 Raia Drogasil On...
September 2017
Research InstituteThought leadership from Credit Suisse Research
and the world’s foremost experts
The CS Family 1000

Introduction
Family-owned businesses are among the most important building blocks of a nation’s economy and have gradually come under the radar of leading experts and academics. From small and mid-sized organizations to multinational corporations, family-run businesses set high performance standards and bear lessons to be learned for the broader business community. In this extended update of our 2015 Family Business Report, we explore the key factors behind family-business decision-making and ultimately their long-term success.
In both mature and emerging countries, family-owned businesses make a substantial contribution to economic development and represent a core fundament of long-term, sustainable growth. The top league of these businesses is known worldwide, among them BMW, Nike, Roche, Tata Group or Walmart. However, most observers are likely to underestimate just how successful many of the less publicly known family businesses have been over the past decades.
In our 2015 family-business-focused report, we established that family-owned companies outperform equity-markets across the globe. On a sector-adjusted basis, this outperformance equaled an annual average of 4.5% between 2006 and 2015. This year, we have taken an even closer look at these impressively performing businesses and expanded the sample by 10% to nearly 1,000 companies. Our detailed and extended update confirms our past results: since 2006, the companies evaluated have generated a cumulative return of 126%, which equals
an outperformance of the MSCI AC World Index by 55%. More precisely, family-owned businesses have outperformed non-family-owned companies in every region and in every sector assessed. Geographically, Europe shows the strongest annual-average sector-adjusted outperformance at 5.1%.
Having confirmed a superior business performance of family-run companies across sectors and geographies throughout the past decade, our interest turned to the underlying reasons. Following a comprehensive analysis, we came to conclude that conservative growth targets combined with organic cash-flow or equity investments are among the key performance drivers and tend to produce sizeable, sustainable returns. Furthermore, the family-owned businesses in our assessment pay specific attention to capital preservation, while at the same time – especially in the USA and Asia – they invest more in research and development than their non-family-owned peers. In fact, especially in Asia (excluding Japan), family-owned businesses have tripled their research and development investment in the past four years.
We hope that you find our findings valuable and wish you an insightful, enjoyable read.
Urs Rohner Chairman of the Board of Directors Credit Suisse Group AG
02 Introduction
06 Family-owned companies as an asset class
08 Family-owned companies outperform10 Degree of ownership does not appear
to matter
06 The family-owned 1,000 database
Authors
15
22
29
35
CO
VER
PH
OTO
: IS
TOC
KP
HO
TO.C
OM
/MED
IAP
HO
TOS
The CS Family 1000 3
12
29 Potential areas of concern
04 The CS Family 1000
22 The view from a family-ownedcompany perspective
22 What differentiates family-owned companies?
15 The family-owned business model
18 Growth and cash flow arguments also hold by sector
15 Why do family-owned companies outperform?
19 Stronger financial performance across all sizes
29 Concerns related to family-ownedcompanies
35 The Asian family business model
Chinese family-owned companiesperform best
Eugene KlerkMaria BhattiRichard KersleyBrandon Vair
Contributors
Akanksha KharbandaAmit Phillips
35
42 General disclaimer / Important information
For more information, contact: Richard Kersley, Head Global Thematic Research, Credit Suisse Investment Banking,[email protected], or
Michael O’Sullivan, Chief Investment Officer, International Wealth Management, Credit Suisse,michael.o’[email protected]
10 Returns of young versus older family- owned companiesValuation, style and family-ownedcompanies

Family-owned companies outperform non-family-owned peers…
Since early 2006, our “Family 1000” universe* has outperformed broader equity markets by an annual average of around 400 basis points (bp) per year. We define family-owned companies as follows: (1) direct shareholding by founders or descendants of at least 20%, (2) voting rights held by founders or descendants of at least 20%. We have found that, family-owned companies outperformed in every region (annual excess returns ranged from 310 bp in non-Japan Asia to 510 bp in Europe) and in every sector.
…supported by superior growth and profitability
The financial performance of family-owned companies is superior to that of non-family-owned businesses across the globe. Revenue and EBITDA growth is stronger, EBITDA margins are higher, cash flow returns are better (14% relative to non-family-owned) and momentum in gearing is more moderate.
Family-owned companies also appear to have a greater focus on innovation as research and development (R&D) spending is higher. Funding for R&D is made easier as family-owned companies have lower pay-out ratios. Reviewing growth and cash flow returns by sector and size (small versus large-caps) suggest that the “family factor” is largely universal.
Family-owned companies have a longer-term and conservative focus
We have conducted a proprietary survey of over 100 family-owned companies across ten countries focused on strategy, growth expectations and key characteristics of family-owned companies. The survey showed a strong preference by family-owned companies for conservative growth with new investments largely financed through organic cash flows or equity. Over 90% of the companies
interviewed believe they have greater focus on quality long-term growth than non-family-owned peers. The propensity to use long-term financial parameters as targets for management remuneration also increases with the family/founder shareholding.
Corporate governance slightly weaker, but does it matter?
We have assessed corporate governance credentials of family-owned companies by applying the proprietary performance based incentive scorecard as developed by HOLT®. This assessment suggests that family-owned companies score slightly lower than non-family-owned companies when it comes to corporate governance standards. While a strong corporate governance structure can help identify whether a firm is correctly incentivizing its management, it is not the only mechanism through which companies can generate superior cash flow returns.
Succession risk may be overstated
Our analysis shows that first and second generation family-owned companies generated higher risk-adjusted returns than older peers over the past ten years. While some might believe that this is due to succession-related challenges, we would caution against this. First, we show that younger family-owned companies tend to be small-cap growth stocks, which has been a strong performing style and, second, family-owned companies themselves do not see succession planning as one of their key concerns at all.
4 The CS Family 1000
The CS Family 1000
In this report, the Credit Suisse Research Institute extends its assessment of family-owned businesses by analyzing financial and share-price performance on a regional, sector and size basis, as well as on a global level. To test our findings and conclusions, we have performed comprehen-sive interviews with over 100 family-owned companies across ten countries. While multiple factors play a role when it comes to company performance, we establish a positive correlation with family ownership.

The CS Family 1000 5
Who are the family-owned companies?
Source: Datastream, Credit Suisse Research; Annual average revenue growth and share-price returns for 2014–2017; USD 2 bn market cap threshold.Family-owned company defined as (1) direct shareholding by founders or descendants of at least 20%; (2) voting rights held by founders or descendants of at least 20%.
Top 50 companies by market cap. Top 50 companies by revenue growth Top 50 companies by share-price returns
Company Mkt. cap. Company Avg. rev. Mkt. cap. Company Avg. share Mkt. cap. (USD bn) growth* (USD bn) price returns* (USD bn)
1 Alphabet 651 1 Opko Health 141% 4 1 China Evergrande 109% 512 Facebook 500 2 Holitech Technology 115% 5 2 Geely Automobile Hdg. 99% 283 Alibaba Group 456 3 Kaile Science & Tech. Hubei 95% 3 3 Hanmi Science 89% 54 Samsung Electronics 303 4 Ck Hutchison Holdings 85% 50 4 Bajaj Finance 89% 175 Berkshire Hathaway 245 5 Nanjing Xinjiekou Dpste. 69% 7 5 Sunac China Holdings 84% 196 Wal Mart Stores 240 6 Altice A 61% 33 6 Hengtong Optic-Electric 70% 67 Anheuser-Busch Inbev 235 7 Geely Automobile 58% 28 7 Bajaj Finserv 70% 148 Oracle 200 8 Berli Jucker 53% 6 8 Hanmi Pharm 69% 49 Comcast 198 9 Hubei Biocause Pharm. 52% 6 9 Nanjing Xinjiekou Dpste. 67% 710 Roche Holding 179 10 Tesla 47% 62 10 Country Garden Holdings 65% 3911 Toyota Motor 176 11 Jd.Com 47% 65 11 Kingboard Laminates Hdg. 64% 512 Lvmh 139 12 Facebook Class 47% 500 12 Kingston Financial Group 56% 613 Sap 134 13 Zhongtian 47% 5 13 Scien.Games 51% 414 Inditex 120 14 China Evergrande 45% 51 14 Gp Finance Galicia 49% 715 L'Oreal 119 15 Alibaba Group 44% 456 15 Dewan Housing Finance 48% 316 Reynolds American 93 16 Oriental Energy 42% 3 16 Seria 45% 417 Softbank Group 90 17 Molson Coors Brewing 39% 16 17 Aac Technologies Hdg. 45% 2218 Nike 88 18 Natco Pharma 39% 2 18 Yes Bank 45% 6719 Reliance Industries 83 19 Tpg Telecom 37% 4 19 Zhej.Wanfeng Auto Wheel 44% 620 Baidu 82 20 Hengtong Optic-Electric 36% 6 20 Britannia Inds. 44% 821 Tata Consultancy Svs. 74 21 Country Garden Holdings 35% 39 21 Telesites B-1 44% 222 Yes Bank 67 22 Gp Finance Galicia 34% 7 22 Kose 43% 723 Jd.Com 65 23 Fibra Danhos Reit 34% 2 23 T V S Motor 42% 524 Tesla 62 24 Bajaj Finance 34% 17 24 Kaile Science And Tech. Hubei 42% 325 Bmw 61 25 Pik Group 34% 4 25 Zhejiang Supor 42% 526 Heineken 58 26 Aac Technologies Hdg. 33% 22 26 Ashok Leyland 42% 527 Christian Dior 57 27 Exor Ord 32% 16 27 Fangda Special Stl.Tech. 41% 328 Henkel Pref. 56 28 Reliance Capital 32% 3 28 Nine Dragons Paper Hdg. 41% 1029 Enterprise Prds 56 29 Genting Hong Kong 32% 2 29 Ipsen 41% 1230 Ford Motor 56 30 Arca Continental 31% 12 30 Straumann Hldg. 41% 1031 Hermes Intl. 53 31 Yes Bank 30% 67 31 Raia Drogasil On 41% 832 China Evergrande 51 32 Fujian Newland Computer 30% 3 32 Minth Group 39% 633 Las Vegas Sands 50 33 Kotak Mahindra Bank 30% 30 33 Shenzhou Intl.Gp.Hdg. 39% 1234 Simon Property Group 50 34 Yanlord Land Group 29% 3 34 Hanergy Thin Film Power Group 39% 2135 Kering 50 35 Eurofins Scientific 28% 11 35 Eicher Motors 38% 1436 Ck Hutchison Holdings 50 36 Regeneron Pharms. 27% 47 36 Jiangsu Hengrui Medicine 37% 2537 Jardine Strategic Hdg. 49 37 China Med.Sy.Hdg 26% 4 37 Long Yuan Construction Gp. 37% 238 Sun Hung Kai Properties 49 38 Corp Moctezuma 26% 4 38 Sinar Mas Multiartha 37% 539 Regeneron Pharms. 47 39 Sun Pharm.Industries 26% 19 39 Partners Group Holding 37% 1840 Carnival 47 40 Azrieli Group 26% 7 40 Eurofins Scientific 36% 1141 Richemont N 46 41 Aurobindo Pharma 26% 7 41 Man Wah Holdings 35% 442 Jardine Matheson Hdg. 46 42 Zhejiang Huahai Pharm. 26% 3 42 Natco Pharma 35% 243 Fresenius 45 43 Zhej.Wanfeng Auto Wheel 25% 6 43 Agile Group Hdg. 35% 644 America Movil 41 44 Meidu Energy 25% 3 44 Hubei Biocause Pharm. 35% 645 Estee Lauder 41 45 Alsea De Cv 25% 3 45 Kangmei Pharm. 34% 1546 Hennes & Mauritz 40 46 Ashok Leyland 25% 5 46 Smith (Ao) 34% 1047 Country Garden Holdings 39 47 Redrow 24% 3 47 Lee & Man Paper Mnfg. 34% 648 A P Moller - Maersk 38 48 Lithia Motors 24% 3 48 Biomerieux 33% 1049 Lafargeholcim 37 49 Press Metal 24% 3 49 Holitech Technology 33% 550 Pernod-Ricard 36 50 Dewan Housing Finance 24% 3 50 Kaz Minerals 32% 4

Family-owned companies as an asset class
Our assessment suggests that the investment case for family-owned companies remains compelling as they have outperformed non-family-owned companies globally by around 400 basis points per year since 2006. Importantly, this impressive performance occurred in every region and sector of our analysis. While younger family-owned companies outperformed their more mature peers, we do not necessarily see this as proof of “succession risk,” but more likely a reflection of the more small-cap growth profile of younger family-owned companies. The degree of share ownership by the founder or family does not appear to be a key driver for performance.
The family-owned 1,000 database
In order to deepen our understanding of the family-owned factor, we revisited our 2015 database of around 900 family-owned companies with the aim to expand the included family-owned companies. The criteria we use to define a company as “family-owned” are:
ȩ Direct shareholding by founders or descendants of at least 20%.
ȩ Voting rights held by founders or descendants of at least 20%.
Our review of the database has allowed us to increase the number of family-owned companies globally to almost 1,000 (i.e. “The CS Family 1,000 database”). The majority of companies included in our database are located in emerging markets (EMs), with Asia alone contributing 536 or 56% of the total (see Figure 1).
Europe and the USA, on the other hand, are represented by “just” 311 companies combined. At USD 6.9 billion, we note that the average size of family-owned companies in Asia is substantially smaller than that of companies in Europe (USD 13 billion) and the USA (USD 21.7 billion).
On a country basis, we find that most of the family-owned companies are located in China (167), the USA (121), India (108) and France (70) (see Figure 3). However, in terms of average size, the ranking changes much more in favor of developed markets. The average market capitalization of family-owned companies is greatest in Spain (USD 30 billion), the Netherlands (USD 30 billion), Japan (USD 24 billion) and Switzerland (USD 22 billion) (see Figure 4).
In our view, the reasons why publicly listed family-owned companies appear more frequently in emerging markets might include:
ȩ The fact that family-owned companies across global emerging markets are much younger
6 The CS Family 1000
Figure 2
Family-owned companies by regional market cap
Source: Credit Suisse Research
Figure 1
Number of family-owned companies by region
Source: Credit Suisse Research
Europe, 190, 20%
USA, 121, 12%
APxJ, 536, 56%
Latam, 63, 6%
EMEA, 39, 4%Japan, 16, 2%
USA 27%
APxJ 38%
Europe 25%
Japan 4%Latam 4% EMEA 2%
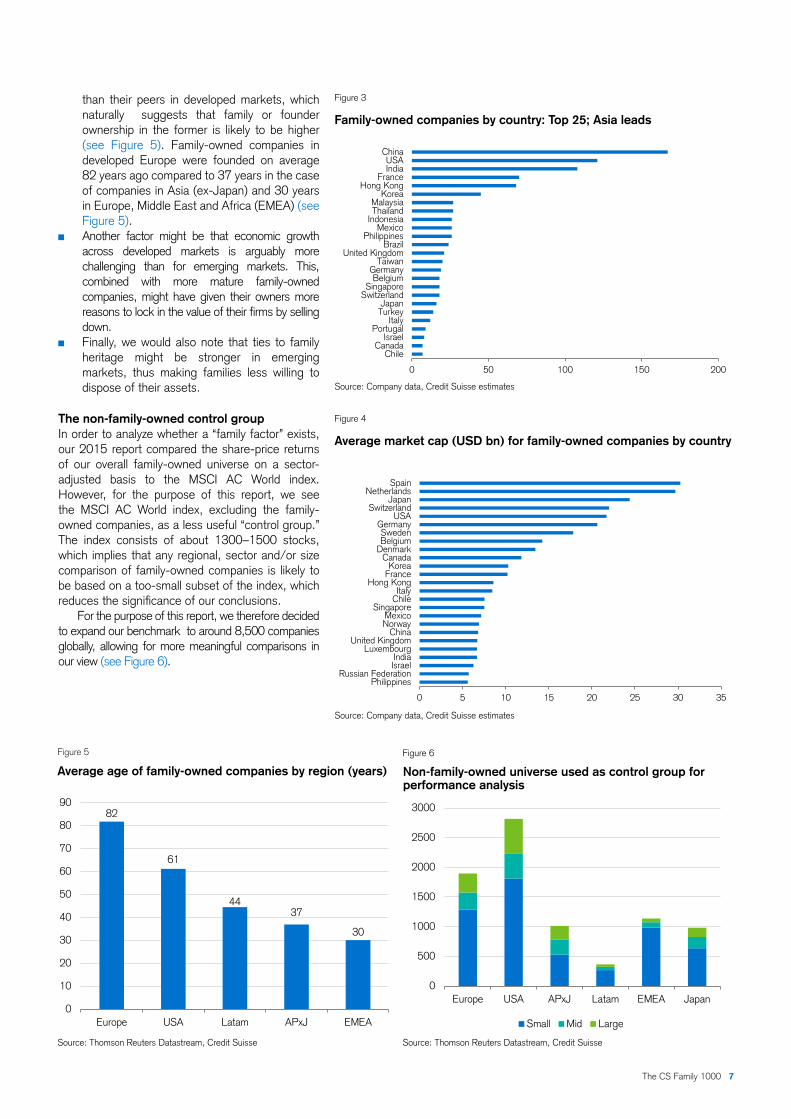
Figure 3
Family-owned companies by country: Top 25; Asia leads
Source: Company data, Credit Suisse estimates
Figure 4
Average market cap (USD bn) for family-owned companies by country
Source: Company data, Credit Suisse estimates
0 50 100 150 200
ChinaUSAIndia
FranceHong Kong
KoreaMalaysiaThailand
IndonesiaMexico
PhilippinesBrazil
United KingdomTaiwan
GermanyBelgium
SingaporeSwitzerland
JapanTurkey
ItalyPortugal
IsraelCanada
Chile
0 5 10 15 20 25 30 35
SpainNetherlands
JapanSwitzerland
USAGermanySwedenBelgium
DenmarkCanada
KoreaFrance
Hong KongItaly
ChileSingapore
MexicoNorway
ChinaUnited Kingdom
LuxembourgIndiaIsrael
Russian FederationPhilippines
than their peers in developed markets, which naturally suggests that family or founder ownership in the former is likely to be higher (see Figure 5). Family-owned companies in developed Europe were founded on average 82 years ago compared to 37 years in the case of companies in Asia (ex-Japan) and 30 years in Europe, Middle East and Africa (EMEA) (see Figure 5).
ȩ Another factor might be that economic growth across developed markets is arguably more challenging than for emerging markets. This, combined with more mature family-owned companies, might have given their owners more reasons to lock in the value of their firms by selling down.
ȩ Finally, we would also note that ties to family heritage might be stronger in emerging markets, thus making families less willing to dispose of their assets.
The non-family-owned control groupIn order to analyze whether a “family factor” exists, our 2015 report compared the share-price returns of our overall family-owned universe on a sector-adjusted basis to the MSCI AC World index. However, for the purpose of this report, we see the MSCI AC World index, excluding the family-owned companies, as a less useful “control group.” The index consists of about 1300–1500 stocks, which implies that any regional, sector and/or size comparison of family-owned companies is likely to be based on a too-small subset of the index, which reduces the significance of our conclusions.
For the purpose of this report, we therefore decided to expand our benchmark to around 8,500 companies globally, allowing for more meaningful comparisons in our view (see Figure 6).
The CS Family 1000 7
Source: Thomson Reuters Datastream, Credit Suisse
Figure 6
Non-family-owned universe used as control group for performance analysis
Source: Thomson Reuters Datastream, Credit Suisse
Figure 5
Average age of family-owned companies by region (years)
82
61
4437
30
0
10
20
30
40
50
60
70
80
90
Europe USA Latam APxJ EMEA
0
500
1000
1500
2000
2500
3000
Europe USA APxJ Latam EMEA Japan
Small Mid Large
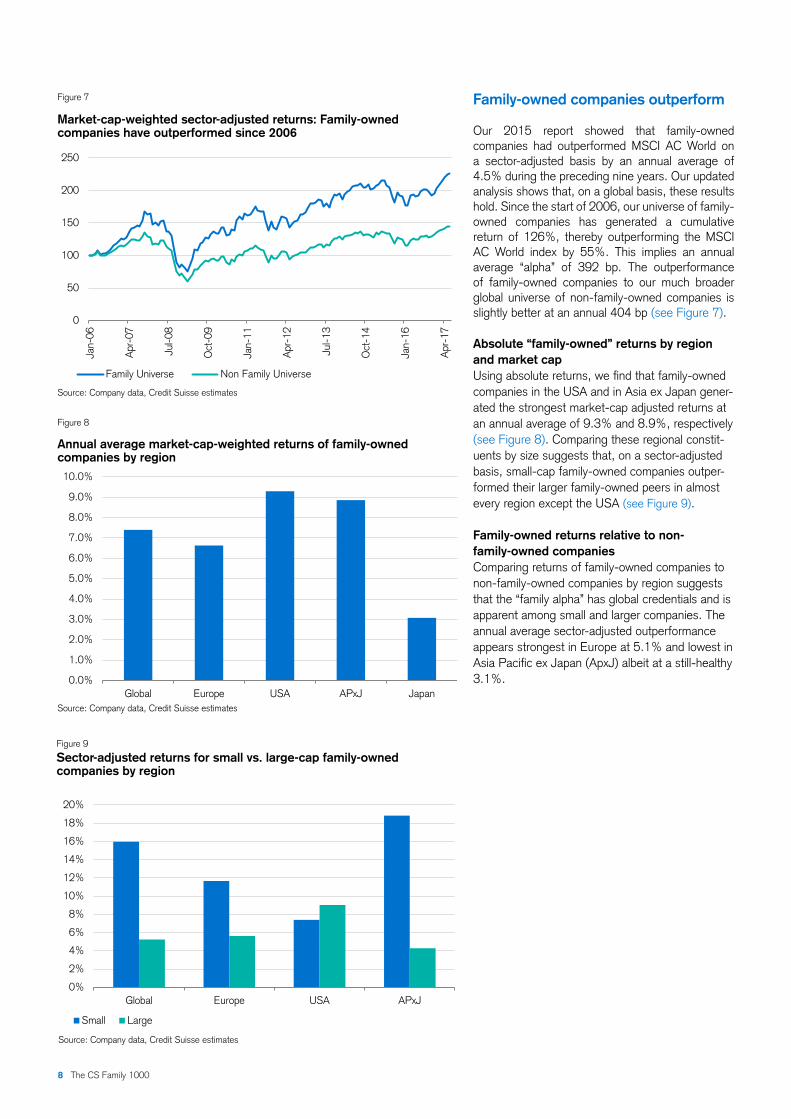
Family-owned companies outperform
Our 2015 report showed that family-owned companies had outperformed MSCI AC World on a sector-adjusted basis by an annual average of 4.5% during the preceding nine years. Our updated analysis shows that, on a global basis, these results hold. Since the start of 2006, our universe of family-owned companies has generated a cumulative return of 126%, thereby outperforming the MSCI AC World index by 55%. This implies an annual average “alpha” of 392 bp. The outperformance of family-owned companies to our much broader global universe of non-family-owned companies is slightly better at an annual 404 bp (see Figure 7).
Absolute “family-owned” returns by region and market capUsing absolute returns, we find that family-owned companies in the USA and in Asia ex Japan gener-ated the strongest market-cap adjusted returns at an annual average of 9.3% and 8.9%, respectively (see Figure 8). Comparing these regional constit-uents by size suggests that, on a sector-adjusted basis, small-cap family-owned companies outper-formed their larger family-owned peers in almost every region except the USA (see Figure 9).
Family-owned returns relative to non- family-owned companiesComparing returns of family-owned companies to non-family-owned companies by region suggests that the “family alpha” has global credentials and is apparent among small and larger companies. The annual average sector-adjusted outperformance appears strongest in Europe at 5.1% and lowest in Asia Pacific ex Japan (ApxJ) albeit at a still-healthy 3.1%.
8 The CS Family 1000
Figure 9
Sector-adjusted returns for small vs. large-cap family-owned companies by region
Source: Company data, Credit Suisse estimates
Figure 8
Annual average market-cap-weighted returns of family-owned companies by region
Source: Company data, Credit Suisse estimates
Figure 7
Market-cap-weighted sector-adjusted returns: Family-owned companies have outperformed since 2006
Source: Company data, Credit Suisse estimates
0.0%
1.0%
2.0%
3.0%
4.0%
5.0%
6.0%
7.0%
8.0%
9.0%
10.0%
Global Europe USA APxJ Japan
0
50
100
150
200
250
Jan-
06
Apr
-07
Jul-0
8
Oct
-09
Jan-
11
Apr
-12
Jul-1
3
Oct
-14
Jan-
16
Apr
-17
Family Universe Non Family Universe
0%
2%
4%
6%
8%
10%
12%
14%
16%
18%
20%
Global Europe USA APxJ
Small Large

Risk versus return: Family-owned versus non-family-ownedWhile share-price returns for family-owned companies appear strong relative to their respective non-family-owned peers, the question is also whether these returns have been generated with equal or even lower volatility. Figure 10 clearly shows that this is the case. Risk-adjusted returns (returns divided by their standard deviation) for family-owned companies since January 2006 have in almost all cases been superior to those of equities more broadly.
Family-owned companies outperformed in every sectorIn order to assess whether the family factor is sector-driven, we have also calculated share-price returns by sector for our family-owned companies and compared these to non-family-owned companies in the same sector. These calculations suggest that, on a global basis, family-owned companies across all sectors tend to outperform their non-family-owned peers within the same sector (see Figure 11).
Sectors where family-owned companies have historically tended to generate the strongest relative returns are energy, financials and technology. Relative returns are lowest for telecoms, albeit still positive at 0.2%. When reviewing these sector returns by region and size, we find that small-cap family-owned companies tend to perform better than their non-family-owned peers for all 11 major sectors. This is especially true for non-Japan Asian companies.
Figure 11
Annual average returns for family-owned companies by sector
Source: Company data, Credit Suisse estimates
Figure 10
Information ratio: Family-owned risk-adjusted returns broadly superior to global equities since January 2006
Source: Company data, Credit Suisse estimates
8.1%
7.2%
3.9%
3.3%
2.4% 2.2%1.8%
1.2% 0.9% 0.8%0.2%
0.0%
1.0%
2.0%
3.0%
4.0%
5.0%
6.0%
7.0%
8.0%
9.0%
Ene
rgy
Fina
ncia
ls
Tech
Rea
l Est
ate
Util
ities
Hea
lthcare
Indu
stria
l
Mat
eria
ls
Con
.Sta
ple
Con
.Dis
cr
Telc
o
The CS Family 1000 9
-0.4 -0.2 0.0 0.2 0.4 0.6 0.8 1.0
Japan: SmallGlobal: SmallAPxJ: SmallUSA: LargeUSA: Small
Europe: SmallEurope: Mid
Global: LargeGlobal: MidAPxJ: Mid
MSCI AC WAPxJ: Large
Japan: LargeUSA: Mid
Europe: LargeJapan: Mid
Istockphoto.com/ roibu

Figure 12
Family-owned share-price performance apparently not related to the stake that is held by the founder or his/her family
Source: Company data, Credit Suisse estimates
Figure 14
Generational ownership: Asia and EMs
Source: Company data, Credit Suisse estimates
Figure 13
Generational ownership Europe and USA
Source: Company data, Credit Suisse estimates
0%
5%
10%
15%
20%
25%
30%
35%
40%
Europe USA
Gen 1 Gen 2 Gen 3 Gen 4 Gen 5+
0.0%
10.0%
20.0%
30.0%
40.0%
50.0%
60.0%
Asia Latam EMEA
Gen 1 Gen 2 Gen 3 Gen 4 Gen 5+
Degree of ownership does not seem to matter
We also reviewed whether the family-owned share-price outperformance is linked to the degree of family ownership. Figure 12 shows that although the highest returns were achieved by companies with the highest family ownership (>70%) we do not believe that a straightforward relationship between these two variables can be identified. It appears to us that the notion of family control through “day-to-day” or board membership involvement might be more relevant than the percentage held in the company by the founder or his/her family.
Returns of young versus older family- owned companies
A concern of significant importance to family businesses is succession planning, not least owing to the relevance and involvement of founders and their families in the running of their companies. This includes decisions relating to whether ownership should be passed to existing family members in order to preserve the family legacy or in fact to non-family members, which may be in the best interest of the business itself. At the forefront of investor concerns is when a business passes through different generations, whether or not this will have an impact on the value of the company and its wealth-generating ability as commitment to the business reduces as it passes from the founder.
In our analysis, we assume each generation lasts approximately 25 years. Of our current family-owned database, more than 70% are in their first or second generation. The number of companies in their fourth, fifth or older generation is less than 20% of the current number of first generation family-owned companies. From a regional perspective, we find that family-owned companies in Europe and the USA
50
100
150
200
250
300
350
Jan-
06
Jul-0
6
Jan-
07
Jul-0
7
Jan-
08
Jul-0
8
Jan-
09
Jul-0
9
Jan-
10
Jul-1
0
Jan-
11
Jul-1
1
Jan-
12
Jul-1
2
Jan-
13
Jul-1
3
Jan-
14
Jul-1
4
Jan-
15
Jul-1
5
Jan-
16
Jul-1
6
Jan-
17
Price performance by ownership, market weighted, sector adjusted
<=30% 30%-40% 40%-50% 50%-60% 60-70% +70%
10 The CS Family 1000
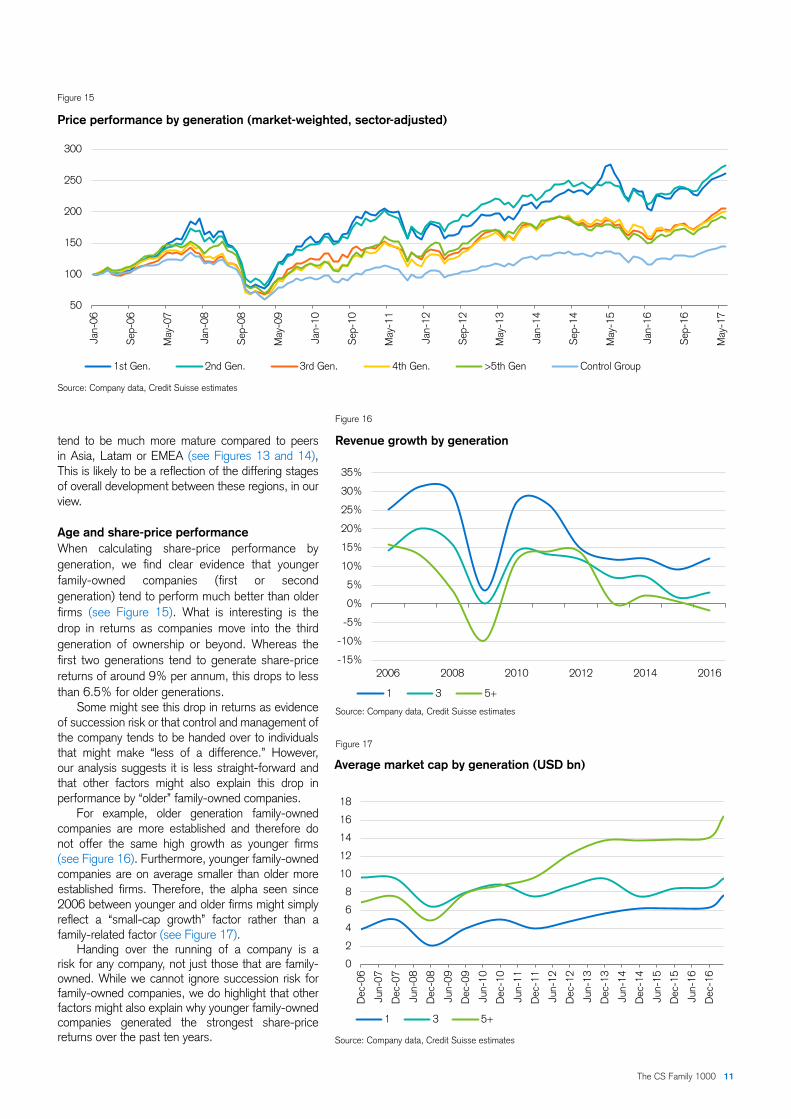
Figure 17
Average market cap by generation (USD bn)
Source: Company data, Credit Suisse estimates
Figure 16
Revenue growth by generation
Source: Company data, Credit Suisse estimates
Figure 15
Price performance by generation (market-weighted, sector-adjusted)
Source: Company data, Credit Suisse estimates
-15%
-10%
-5%
0%
5%
10%
15%
20%
25%
30%
35%
2006 2008 2010 2012 2014 2016
1 3 5+
0
2
4
6
8
10
12
14
16
18
Dec
-06
Jun-
07
Dec
-07
Jun-
08
Dec
-08
Jun-
09
Dec
-09
Jun-
10
Dec
-10
Jun-
11
Dec
-11
Jun-
12
Dec
-12
Jun-
13
Dec
-13
Jun-
14
Dec
-14
Jun-
15
Dec
-15
Jun-
16
Dec
-16
1 3 5+
tend to be much more mature compared to peers in Asia, Latam or EMEA (see Figures 13 and 14), This is likely to be a reflection of the differing stages of overall development between these regions, in our view.
Age and share-price performanceWhen calculating share-price performance by generation, we find clear evidence that younger family-owned companies (first or second generation) tend to perform much better than older firms (see Figure 15). What is interesting is the drop in returns as companies move into the third generation of ownership or beyond. Whereas the first two generations tend to generate share-price returns of around 9% per annum, this drops to less than 6.5% for older generations.
Some might see this drop in returns as evidence of succession risk or that control and management of the company tends to be handed over to individuals that might make “less of a difference.” However, our analysis suggests it is less straight-forward and that other factors might also explain this drop in performance by “older” family-owned companies.
For example, older generation family-owned companies are more established and therefore do not offer the same high growth as younger firms (see Figure 16). Furthermore, younger family-owned companies are on average smaller than older more established firms. Therefore, the alpha seen since 2006 between younger and older firms might simply reflect a “small-cap growth” factor rather than a family-related factor (see Figure 17).
Handing over the running of a company is a risk for any company, not just those that are family-owned. While we cannot ignore succession risk for family-owned companies, we do highlight that other factors might also explain why younger family-owned companies generated the strongest share-price returns over the past ten years.
50
100
150
200
250
300
Jan-
06
Sep
-06
May
-07
Jan-
08
Sep
-08
May
-09
Jan-
10
Sep
-10
May
-11
Jan-
12
Sep
-12
May
-13
Jan-
14
Sep
-14
May
-15
Jan-
16
Sep
-16
May
-17
1st Gen. 2nd Gen. 3rd Gen. 4th Gen. >5th Gen Control Group
The CS Family 1000 11
Valuation, style and family-owned companies
As we explore later, the relative financial performance of family-owned companies supports their relative share-price returns seen since 2006 in our view. In order to see whether there is also valuation support for family-owned companies, we have used traditional valuation analysis, but also applied the HOLT® valuation framework, which uses a discounted cash flow approach.
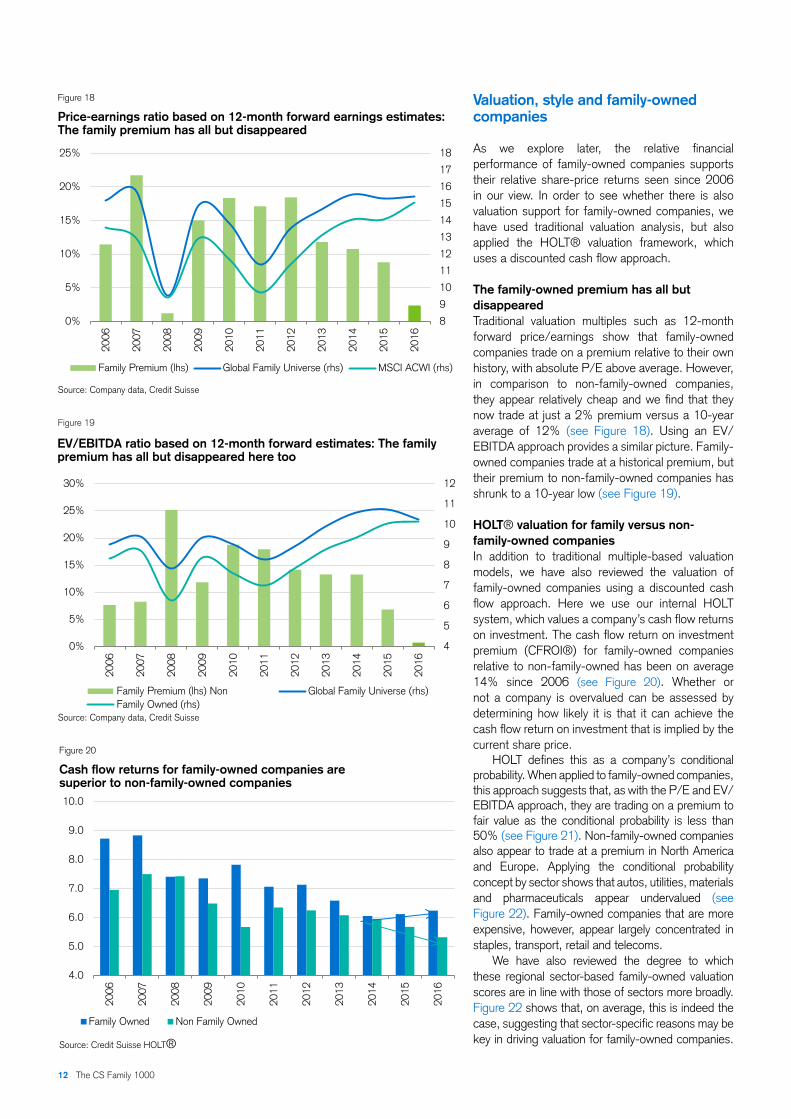
The family-owned premium has all but disappearedTraditional valuation multiples such as 12-month forward price/earnings show that family-owned companies trade on a premium relative to their own history, with absolute P/E above average. However, in comparison to non-family-owned companies, they appear relatively cheap and we find that they now trade at just a 2% premium versus a 10-year average of 12% (see Figure 18). Using an EV/EBITDA approach provides a similar picture. Family-owned companies trade at a historical premium, but their premium to non-family-owned companies has shrunk to a 10-year low (see Figure 19).
HOLT® valuation for family versus non- family-owned companiesIn addition to traditional multiple-based valuation models, we have also reviewed the valuation of family-owned companies using a discounted cash flow approach. Here we use our internal HOLT system, which values a company’s cash flow returns on investment. The cash flow return on investment premium (CFROI®) for family-owned companies relative to non-family-owned has been on average 14% since 2006 (see Figure 20). Whether or not a company is overvalued can be assessed by determining how likely it is that it can achieve the cash flow return on investment that is implied by the current share price.
HOLT defines this as a company’s conditional probability. When applied to family-owned companies, this approach suggests that, as with the P/E and EV/EBITDA approach, they are trading on a premium to fair value as the conditional probability is less than 50% (see Figure 21). Non-family-owned companies also appear to trade at a premium in North America and Europe. Applying the conditional probability concept by sector shows that autos, utilities, materials and pharmaceuticals appear undervalued (see Figure 22). Family-owned companies that are more expensive, however, appear largely concentrated in staples, transport, retail and telecoms.
We have also reviewed the degree to which these regional sector-based family-owned valuation scores are in line with those of sectors more broadly. Figure 22 shows that, on average, this is indeed the case, suggesting that sector-specific reasons may be key in driving valuation for family-owned companies.
Figure 19
EV/EBITDA ratio based on 12-month forward estimates: The family premium has all but disappeared here too
Source: Company data, Credit Suisse
Figure 18
Price-earnings ratio based on 12-month forward earnings estimates: The family premium has all but disappeared
Source: Company data, Credit Suisse
8
9
10
11
12
13
14
15
16
17
18
0%
5%
10%
15%
20%
25%
2006
2007
2008
2009
2010
2011
2012
2013
2014
2015
2016
Family Premium (lhs) Global Family Universe (rhs) MSCI ACWI (rhs)
4
5
6
7
8
9
10
11
12
0%
5%
10%
15%
20%
25%
30%
2006
2007
2008
2009
2010
2011
2012
2013
2014
2015
2016
Global Family Universe (rhs)Family Premium (lhs) Non Family Owned (rhs)
12 The CS Family 1000
Figure 20
Cash flow returns for family-owned companies are superior to non-family-owned companies
Source: Credit Suisse HOLT®
4.0
5.0
6.0
7.0
8.0
9.0
10.0
2006
2007
2008
2009
2010
2011
2012
2013
2014
2015
2016
Family Owned Non Family Owned

Figure 22
Conditional probability by sector: Undervalued family-owned compa-nies tend to be in the autos, utilities, materials and pharma sectors
Source: Company data, Credit Suisse estimates
20 25 30 35 40 45 50 55 60 65
H&P ProTransportation
RetailingTelco
ConsDurF,B&T
ConsServFoodRetailCapGoods
EnergyDivFinMedia
SoftwareReal Estate
HardwarePharma
MaterialsUtilities
Autos
Family Owned Universe MSCI AC World
There are, however, a number of sectors where we observe valuation differences between family and non-family-owned companies:
ȩ Sectors where family-owned companies are substantially cheaper than non-family-owned companies such as pharma.
ȩ The sectors where family-owned companies are expensive relative to non-family-owned stocks include retail, telecoms, consumer durables and energy companies.
Our analysis of the share-price returns for family-owned companies clearly shows that they outperform broader markets. They may not be cheap on an absolute basis, but are more attractive relative to broader markets now than during most of the past ten years. In the next chapter, we review some of the possible reasons for the family outperformance.
The CS Family 1000 13
Figure 21
Conditional probability by region
Source: Company data, Credit Suisse estimates
40 50 60
EMEA
Latam
Japan
AxJp
Europe
N.America
MSCI AC World
30
Family Owned Universe MSCI AC World
Shutterstock.com/ Akin Akarsu

14 The CS Family 1000 Shutterstock.com/ Albert Karimov
The family-owned business model
The financial performance of family-owned companies provides support for their strong relative share-price performance. Revenue growth of family-owned companies has been higher than for non- family-owned peers for each of the past ten years, EBITDA margins are higher and cash flow returns are stronger too. In addition, family-owned companies tend to focus more on future growth as below-average pay-out ratios support in-line-to-above capex intensity and above-average R&D spending.
Why do family-owned companies outperform?
The obvious question when looking at the outperformance of family-owned companies is why? Academic work as well as studies carried out by various consultancy firms typically highlight that successful family-owned companies manage to combine their view of ownership and control with a sense of direction. As a result, the commonly held opinion is that this drives family-owned companies to take a “longer-term view” toward earnings and profitability compared to non-family-owned peers.
This in turn might make their growth or profitability profile more robust and allow their share prices to outperform those of non-family-owned peers. We have analyzed a range of financial metrics for the constituents of our family-owned company database and compared these with non-family-owned peers to identify whether their financial performance is indeed more robust and, if so, whether this could help explain the outperformance we have observed in the previous pages.
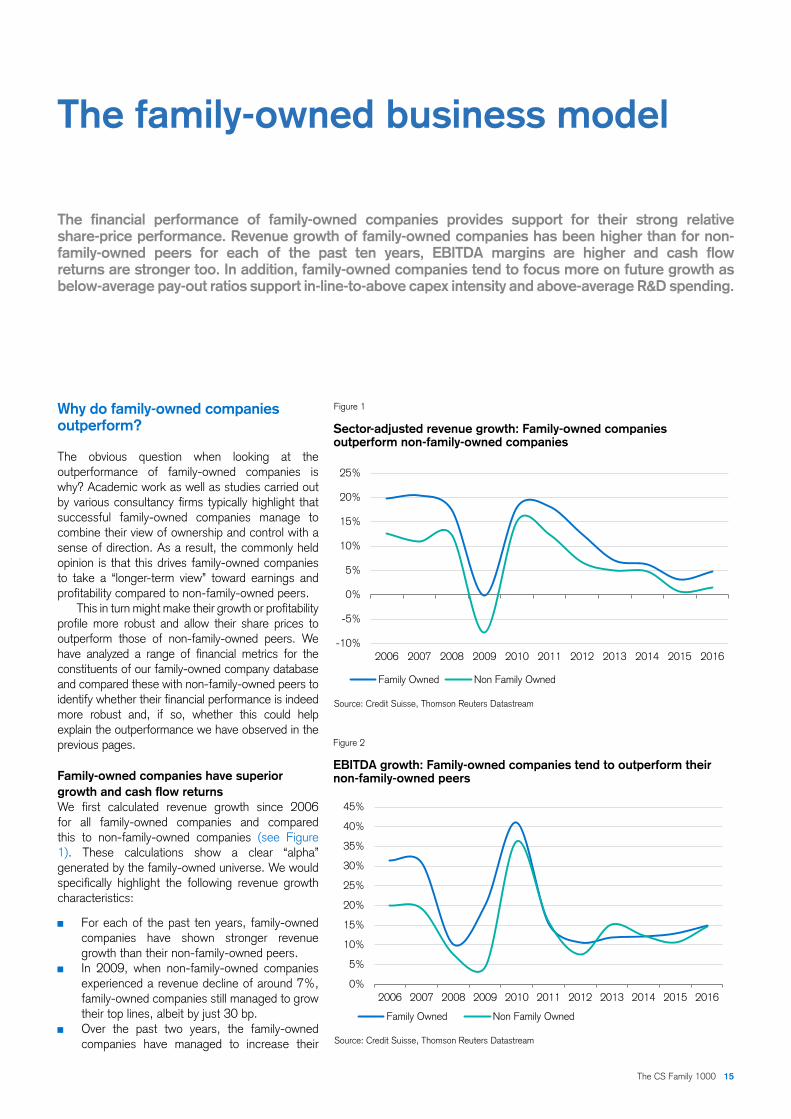
Family-owned companies have superior growth and cash flow returns We first calculated revenue growth since 2006 for all family-owned companies and compared this to non-family-owned companies (see Figure 1). These calculations show a clear “alpha” generated by the family-owned universe. We would specifically highlight the following revenue growth characteristics:
ȩ For each of the past ten years, family-owned companies have shown stronger revenue growth than their non-family-owned peers.
ȩ In 2009, when non-family-owned companies experienced a revenue decline of around 7%, family-owned companies still managed to grow their top lines, albeit by just 30 bp.
ȩ Over the past two years, the family-owned companies have managed to increase their
Figure 1
Sector-adjusted revenue growth: Family-owned companies outperform non-family-owned companies
Source: Credit Suisse, Thomson Reuters Datastream
Figure 2
EBITDA growth: Family-owned companies tend to outperform their non-family-owned peers
Source: Credit Suisse, Thomson Reuters Datastream
-10%
-5%
0%
5%
10%
15%
20%
25%
2006 2007 2008 2009 2010 2011 2012 2013 2014 2015 2016
Family Owned Non Family Owned
0%
5%
10%
15%
20%
25%
30%
35%
40%
45%
2006 2007 2008 2009 2010 2011 2012 2013 2014 2015 2016
Family Owned Non Family Owned
The CS Family 1000 15
top-line growth differential to 370 bp in 2016 from 320 bp in 2013, and 250 bp in 2014.
ȩ Family-owned companies generated a high risk-adjusted revenue growth (i.e. annual average revenue growth divided by the standard deviation of this growth), which might indeed be a result of taking more of a longer-term view with regard to investment decisions.
ȩ We have also analyzed revenue growth differentials between family and non-family-owned companies on a regional basis. Generally speaking, we find that the revenue growth “alpha” is apparent across all main regions.
EBITDA growth turning more quicklySector-adjusted EBITDA growth calculations show that family-owned companies managed to maintain their top-line outperformance in regard to profitability. Growth during the financial crisis did fall, but, at 11% in 2008, it was still far better than the 3% generated by non-family-owned companies. The more recent EBITDA growth profile has also been stronger and more stable (Figure 2).
The ability to generate stronger and more stable revenue and EBITDA growth arguably provides a strong platform for value creation, which, relative to non-family-owned companies, does support outperformance.
Greater focus on balance sheet strengthIn addition to having more robust growth metrics, we also find that family-owned companies are more conservative toward the funding of this growth.
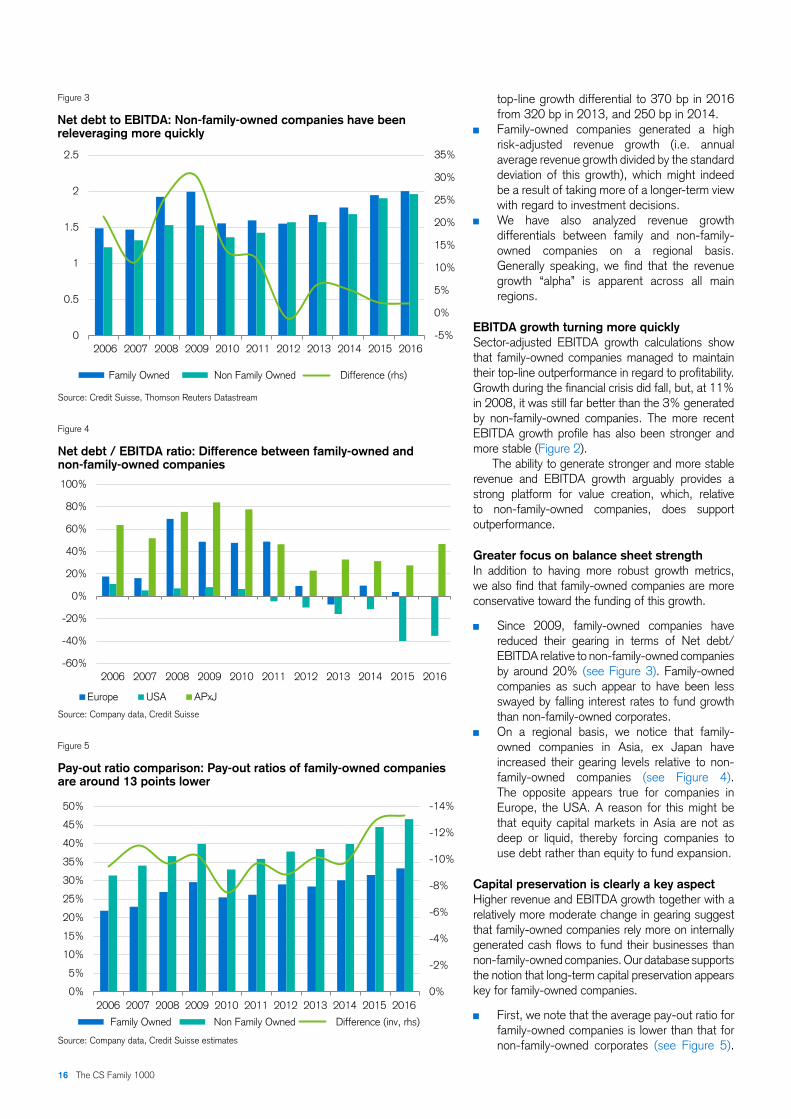
ȩ Since 2009, family-owned companies have reduced their gearing in terms of Net debt/EBITDA relative to non-family-owned companies by around 20% (see Figure 3). Family-owned companies as such appear to have been less swayed by falling interest rates to fund growth than non-family-owned corporates.
ȩ On a regional basis, we notice that family-owned companies in Asia, ex Japan have increased their gearing levels relative to non-family-owned companies (see Figure 4). The opposite appears true for companies in Europe, the USA. A reason for this might be that equity capital markets in Asia are not as deep or liquid, thereby forcing companies to use debt rather than equity to fund expansion.
Capital preservation is clearly a key aspectHigher revenue and EBITDA growth together with a relatively more moderate change in gearing suggest that family-owned companies rely more on internally generated cash flows to fund their businesses than non-family-owned companies. Our database supports the notion that long-term capital preservation appears key for family-owned companies.
ȩ First, we note that the average pay-out ratio for family-owned companies is lower than that for non-family-owned corporates (see Figure 5).
Figure 3
Net debt to EBITDA: Non-family-owned companies have been releveraging more quickly
Source: Credit Suisse, Thomson Reuters Datastream
Figure 4
Net debt / EBITDA ratio: Difference between family-owned and non-family-owned companies
Source: Company data, Credit Suisse
Figure 5
Pay-out ratio comparison: Pay-out ratios of family-owned companies are around 13 points lower
Source: Company data, Credit Suisse estimates
-5%
0%
5%
10%
15%
20%
25%
30%
35%
0
0.5
1
1.5
2
2.5
2006 2007 2008 2009 2010 2011 2012 2013 2014 2015 2016
Family Owned Non Family Owned Difference (rhs)
-60%
-40%
-20%
0%
20%
40%
60%
80%
100%
2006 2007 2008 2009 2010 2011 2012 2013 2014 2015 2016
Europe USA APxJ
-14%
-12%
-10%
-8%
-6%
-4%
-2%
0%0%
5%
10%
15%
20%
25%
30%
35%
40%
45%
50%
2006 2007 2008 2009 2010 2011 2012 2013 2014 2015 2016
Family Owned Non Family Owned Difference (inv, rhs)
16 The CS Family 1000
Our analysis shows that these results are largely true across most regions, suggesting that this is indeed an almost global characteristic of family-owned companies.
ȩ Second, we note that family-owned companies have more stable pay-out ratios than non-family-owned companies. This approach is not only smooth through the cycle, but also suggests that, in downturns, family-owned companies do not have to rely as much on external funds to support dividends, which also helps to reduce gearing volatility and increase the predictability of their financial returns.
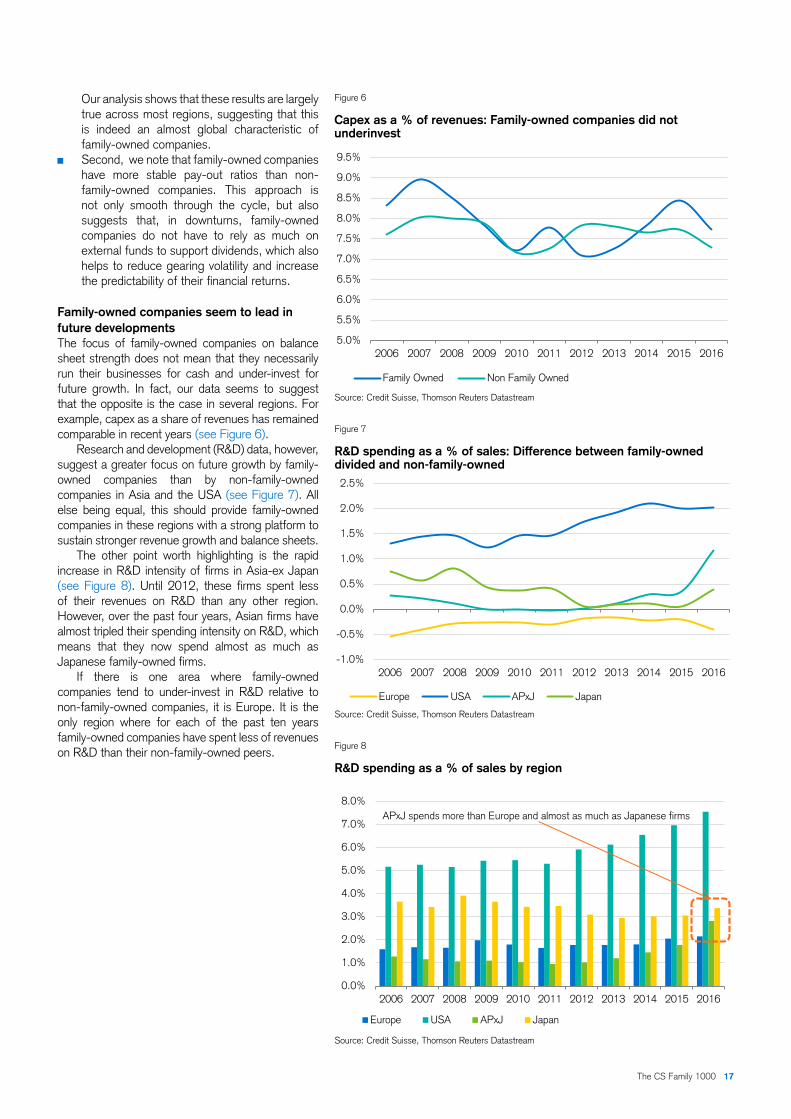
Family-owned companies seem to lead in future developmentsThe focus of family-owned companies on balance sheet strength does not mean that they necessarily run their businesses for cash and under-invest for future growth. In fact, our data seems to suggest that the opposite is the case in several regions. For example, capex as a share of revenues has remained comparable in recent years (see Figure 6).
Research and development (R&D) data, however, suggest a greater focus on future growth by family-owned companies than by non-family-owned companies in Asia and the USA (see Figure 7). All else being equal, this should provide family-owned companies in these regions with a strong platform to sustain stronger revenue growth and balance sheets.
The other point worth highlighting is the rapid increase in R&D intensity of firms in Asia-ex Japan (see Figure 8). Until 2012, these firms spent less of their revenues on R&D than any other region. However, over the past four years, Asian firms have almost tripled their spending intensity on R&D, which means that they now spend almost as much as Japanese family-owned firms.
If there is one area where family-owned companies tend to under-invest in R&D relative to non-family-owned companies, it is Europe. It is the only region where for each of the past ten years family-owned companies have spent less of revenues on R&D than their non-family-owned peers.
Figure 6
Capex as a % of revenues: Family-owned companies did not underinvest
Source: Credit Suisse, Thomson Reuters Datastream
Figure 7
R&D spending as a % of sales: Difference between family-owned divided and non-family-owned
Source: Credit Suisse, Thomson Reuters Datastream
Figure 8
R&D spending as a % of sales by region
Source: Credit Suisse, Thomson Reuters Datastream
5.0%
5.5%
6.0%
6.5%
7.0%
7.5%
8.0%
8.5%
9.0%
9.5%
2006 2007 2008 2009 2010 2011 2012 2013 2014 2015 2016
Family Owned Non Family Owned
-1.0%
-0.5%
0.0%
0.5%
1.0%
1.5%
2.0%
2.5%
2006 2007 2008 2009 2010 2011 2012 2013 2014 2015 2016
Europe USA APxJ Japan
0.0%
1.0%
2.0%
3.0%
4.0%
5.0%
6.0%
7.0%
8.0%
2006 2007 2008 2009 2010 2011 2012 2013 2014 2015 2016
Europe USA APxJ Japan
APxJ spends more than Europe and almost as much as Japanese firms
The CS Family 1000 17

Margins are superior tooIn addition to stronger revenue growth, we note that family-owned companies have also become superior to non-family-owned companies in terms of margin development (see Figure 9). Since 2013, we calculate that average EBITDA margins increased by almost 300 bp, putting them some 250 bp ahead of non-family-owned companies.
Superior cash flow returns The combination of stronger growth, better margin momentum and relatively better gearing dynamics has allowed family-owned companies to also start generating higher cash flow returns than non-family-owned peers. Our database suggests that cash flow returns on investment (CFROI) for family-owned companies have been improving slightly since 2014, whereas the opposite is the case for non-family-owned companies (see Figure 10).
Last year, family-owned companies across all three key regions (USA, Europe and APxJ) produced CFROIs that were higher than those generated by their non-family-owned peers.
Growth and cash flow arguments also hold by sector
We have also compared the relative financial performance between family and non-family-owned companies on a sector basis to see whether a sector bias exists. Our calculations suggest that this is not the case.
ȩ Higher growth: For example, sales growth for family-owned companies tends to be higher than for non-family corporates across all sectors on a 10-year and 5-year basis (Figure 11).
ȩ More conservative pay-out: In the case of pay-out ratios, we find that, with the exception of consumer discretionary stocks, family-owned companies tend to retain more of their cash in all sectors.
ȩ Gearing more of a mixed bag: As far as leverage is concerned, we find a more diverse picture when comparing family and non-family-owned companies on a sector basis. There is, however, consistency within sectors.
18 The CS Family 1000
Figure 9
EBITDA margins for family-owned companies have recovered more than for peers
Source: Credit Suisse, Thomson Reuters Datastream
Figure 11
Sales growth differential by sector: Family-owned companies have tended to grow faster than non-family-owned in almost all sectors
Source: Credit Suisse, Thomson Reuters Datastream
-4%
-2%
0%
2%
4%
6%
8%
10%
Con
sDis
cr.
Con
sSta
ple
Ene
rgy
Hea
lthca
re
Indu
stria
ls
Tech
Mat
eria
ls
Rea
l est
ate
Telc
o
Util
ities
10yr 5yr 2016
13%
14%
15%
16%
17%
18%
19%
20%
2006
2007
2008
2009
2010
2011
2012
2013
2014
2015
2016
Family Owned Non Family Owned
Figure 10
Cash flow returns for family-owned companies are superior to non-family-owned companies
Source: Credit Suisse HOLT®
4.0
5.0
6.0
7.0
8.0
9.0
10.0
2006
2007
2008
2009
2010
2011
2012
2013
2014
2015
2016
Family Owned Non Family Owned
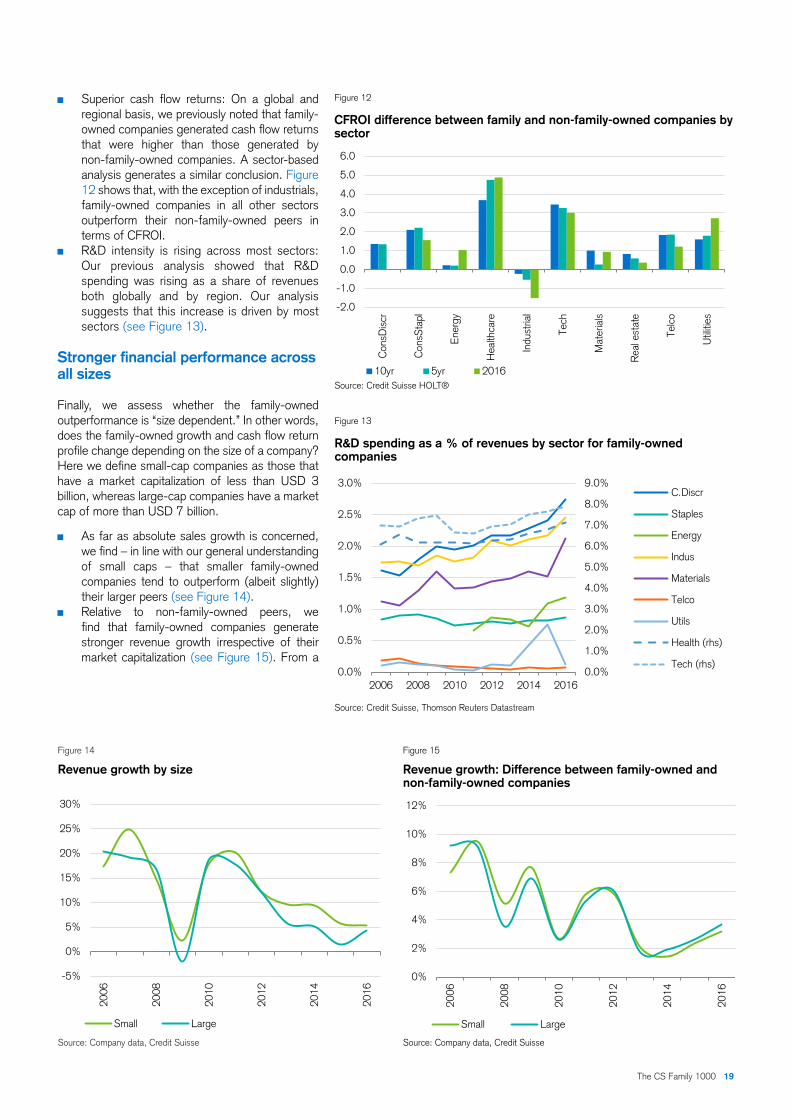
ȩ Superior cash flow returns: On a global and regional basis, we previously noted that family-owned companies generated cash flow returns that were higher than those generated by non-family-owned companies. A sector-based analysis generates a similar conclusion. Figure 12 shows that, with the exception of industrials, family-owned companies in all other sectors outperform their non-family-owned peers in terms of CFROI.
ȩ R&D intensity is rising across most sectors: Our previous analysis showed that R&D spending was rising as a share of revenues both globally and by region. Our analysis suggests that this increase is driven by most sectors (see Figure 13).
Stronger financial performance across all sizes
Finally, we assess whether the family-owned outperformance is “size dependent.” In other words, does the family-owned growth and cash flow return profile change depending on the size of a company? Here we define small-cap companies as those that have a market capitalization of less than USD 3 billion, whereas large-cap companies have a market cap of more than USD 7 billion.
ȩ As far as absolute sales growth is concerned, we find – in line with our general understanding of small caps – that smaller family-owned companies tend to outperform (albeit slightly) their larger peers (see Figure 14).
ȩ Relative to non-family-owned peers, we find that family-owned companies generate stronger revenue growth irrespective of their market capitalization (see Figure 15). From a
Figure 12
CFROI difference between family and non-family-owned companies by sector
Source: Credit Suisse HOLT®
Figure 13
R&D spending as a % of revenues by sector for family-owned companies
Source: Credit Suisse, Thomson Reuters Datastream
-2.0
-1.0
0.0
1.0
2.0
3.0
4.0
5.0
6.0
Con
sDis
cr
Con
sSta
pl
Ene
rgy
Hea
lthca
re
Indu
stria
l
Tech
Mat
eria
ls
Rea
l est
ate
Telc
o
Util
ities
10yr 5yr 2016
0.0%
1.0%
2.0%
3.0%
4.0%
5.0%
6.0%
7.0%
8.0%
9.0%
0.0%
0.5%
1.0%
1.5%
2.0%
2.5%
3.0%
2006 2008 2010 2012 2014 2016
C.Discr
Staples
Energy
Indus
Materials
Telco
Utils
Health (rhs)
Tech (rhs)
Figure 15
Revenue growth: Difference between family-owned and non-family-owned companies
Source: Company data, Credit Suisse
Figure 14
Revenue growth by size
Source: Company data, Credit Suisse
The CS Family 1000 19
-5%
0%
5%
10%
15%
20%
25%
30%
2006
2008
2010
2012
2014
2016
Small Large
0%
2%
4%
6%
8%
10%
12%
2006
2008
2010
2012
2014
2016
Small Large
growth perspective, we therefore conclude that the “family factor” does not appear to be size-dependent.
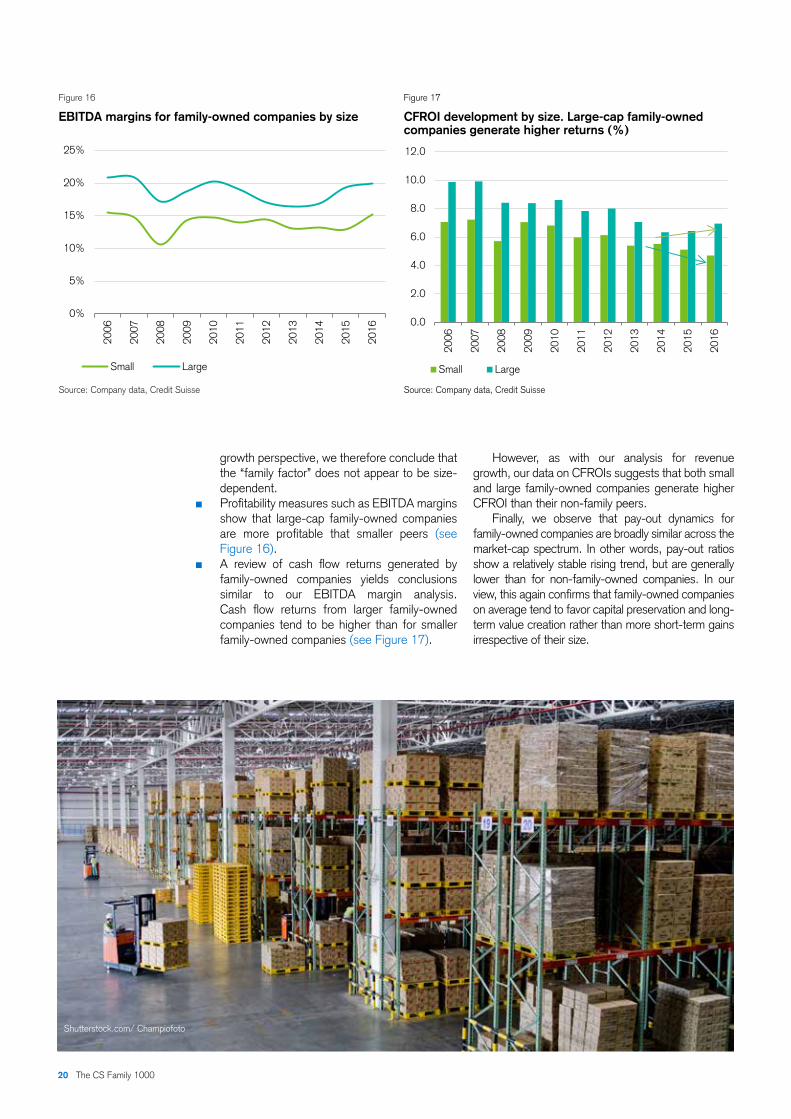
ȩ Profitability measures such as EBITDA margins show that large-cap family-owned companies are more profitable that smaller peers (see Figure 16).
ȩ A review of cash flow returns generated by family-owned companies yields conclusions similar to our EBITDA margin analysis. Cash flow returns from larger family-owned companies tend to be higher than for smaller family-owned companies (see Figure 17).
Figure 17
CFROI development by size. Large-cap family-owned companies generate higher returns (%)
Source: Company data, Credit Suisse
Figure 16
EBITDA margins for family-owned companies by size
Source: Company data, Credit Suisse
20 The CS Family 1000
0%
5%
10%
15%
20%
25%
2006
2007
2008
2009
2010
2011
2012
2013
2014
2015
2016
Small Large
0.0
2.0
4.0
6.0
8.0
10.0
12.0
2006
2007
2008
2009
2010
2011
2012
2013
2014
2015
2016
Small Large
However, as with our analysis for revenue growth, our data on CFROIs suggests that both small and large family-owned companies generate higher CFROI than their non-family peers.
Finally, we observe that pay-out dynamics for family-owned companies are broadly similar across the market-cap spectrum. In other words, pay-out ratios show a relatively stable rising trend, but are generally lower than for non-family-owned companies. In our view, this again confirms that family-owned companies on average tend to favor capital preservation and long-term value creation rather than more short-term gains irrespective of their size.
Shutterstock.com/ Champiofoto

The CS Family 1000 21Istockphoto.com/ Renato Arap
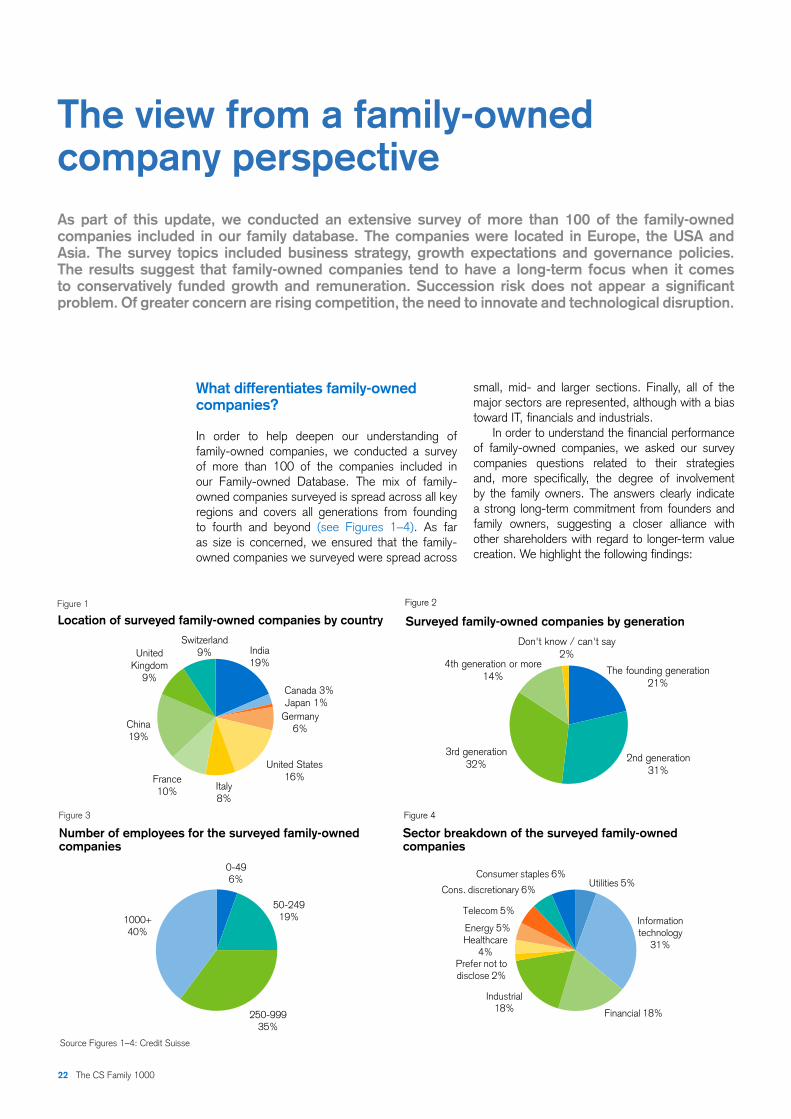
The view from a family-owned company perspectiveAs part of this update, we conducted an extensive survey of more than 100 of the family-owned companies included in our family database. The companies were located in Europe, the USA and Asia. The survey topics included business strategy, growth expectations and governance policies. The results suggest that family-owned companies tend to have a long-term focus when it comes to conservatively funded growth and remuneration. Succession risk does not appear a significant problem. Of greater concern are rising competition, the need to innovate and technological disruption.
What differentiates family-owned companies?
In order to help deepen our understanding of family-owned companies, we conducted a survey of more than 100 of the companies included in our Family-owned Database. The mix of family-owned companies surveyed is spread across all key regions and covers all generations from founding to fourth and beyond (see Figures 1–4). As far as size is concerned, we ensured that the family-owned companies we surveyed were spread across
small, mid- and larger sections. Finally, all of the major sectors are represented, although with a bias toward IT, financials and industrials.
In order to understand the financial performance of family-owned companies, we asked our survey companies questions related to their strategies and, more specifically, the degree of involvement by the family owners. The answers clearly indicate a strong long-term commitment from founders and family owners, suggesting a closer alliance with other shareholders with regard to longer-term value creation. We highlight the following findings:
Figure 2
Surveyed family-owned companies by generation
Figure 1
Location of surveyed family-owned companies by country
Source Figures 1–4: Credit Suisse
Sector breakdown of the surveyed family-owned companies
Number of employees for the surveyed family-owned companies
Figure 4Figure 3
India19%
Canada 3%Japan 1%
Germany6%
United States16%
Italy8%
France10%
China19%
United Kingdom
9%
Switzerland9%
The founding generation21%
2nd generation31%
3rd generation32%
4th generation or more14%
Don't know / can't say2%
0-496%
50-24919%
250-99935%
1000+40%
Utilities 5%
Information technology
31%
Financial 18%
Industrial18%
Prefer not to disclose 2%
Healthcare 4%
Energy 5%
Telecom 5%
Cons. discretionary 6%
Consumer staples 6%
22 The CS Family 1000

Figure 6
“Which key parameter is incorporated in your company’s senior management remuneration program?”
Source: Company data, Credit Suisse estimates
Figure 5
“Please signal your agreement with the following characteristics of family-owned companies relative to non-family-owned companies”
Source: Company data, Credit Suisse estimates
1. Remuneration policies support the long-termfocus, especially as family ownership increasesAs part of our assessment of family-ownedcompanies’ strategies, we asked them how theyremunerate their senior management. The surveyclearly shows that a small majority (52%) doesindeed have a focus on long-term financial ornon-financial metrics (see Figure 6). Multi-yeargrowth targets appear most popular with 35%of companies, indicating that these are the keyparameter for management remuneration.
When we analyze the responses by region, we find that Asian family-owned companies have a greater focus on longer-term remuneration policies for their senior management than their peers in North America or Europe (see Figure 7). On the other hand, European family-owned companies incorporate non-
financial metrics into their remuneration policies, which is something we did not find for family-owned companies elsewhere.
One interesting aspect of our analysis is the fact that family ownership correlates with longer-term remuneration policies. Sixty-one percent of companies where the family holds a 50% or higher stake have a long-term financial or non-financial remuneration policy. This compares to just 43% of companies where the family holds a 20%–30% stake (see Figure 8).
2. Family involvement is significant andconsistent over timeFamily involvement with the business is on averagesignificant, given that almost 70% of the companiessurveyed have two or more family members on their
Figure 8
Key parameters adopted for senior management remuneration by family shareholding
Source: Company data, Credit Suisse
Figure 7
Key remuneration parameters by region: Asia is more long-term-focused than the USA
Source: Company data, Credit Suisse
60% 80% 100%
Greater leadership loyalty toward the firm
More stable company strategy
Quality long-term growth over short-term profits
Long-term commitment to internal shareholders
Sense of long-term commitment to customers
Greater focus on balance sheet strength
Leaner company structure and culture
Succession is of greater concern
More efficient decision-making process
Long-term commitment to external shareholders
0%
10%
20%
30%
40%
50%
Europe Asia North America
Mostly long term revenue or earnings growth based (multi year)Mostly short term revenue or earnings growth based (12 months)Mostly short term cash flow-based targets (12 months)Mostly long term cash flow-based targets (multi year)Our remuneration relies more on non-financial metrics
0%
10%
20%
30%
40%
50%
60%
70%
Long termtargets
20-30%
Long termtargets
30-50%
Long termtargets
more than50%
Short termtargets
20-30%
Short termtargets
30-50%
Short termtargets
more than50%
Revenue/Earnings growth cash flow non-financial
The CS Family 1000 23
0%
5%
10%
15%
20%
25%
30%
35%
40%
Mostly long-term revenueor earnings
growth based(multi-year)
Mostly short-term revenueor earnings
growth based(12 months)
Mostly short-term cashflow-basedtargets (12
months)
Mostly long-term cashflow-based
targets (multi-year)
Ourremunerationrelies more onnon-financial
metrics
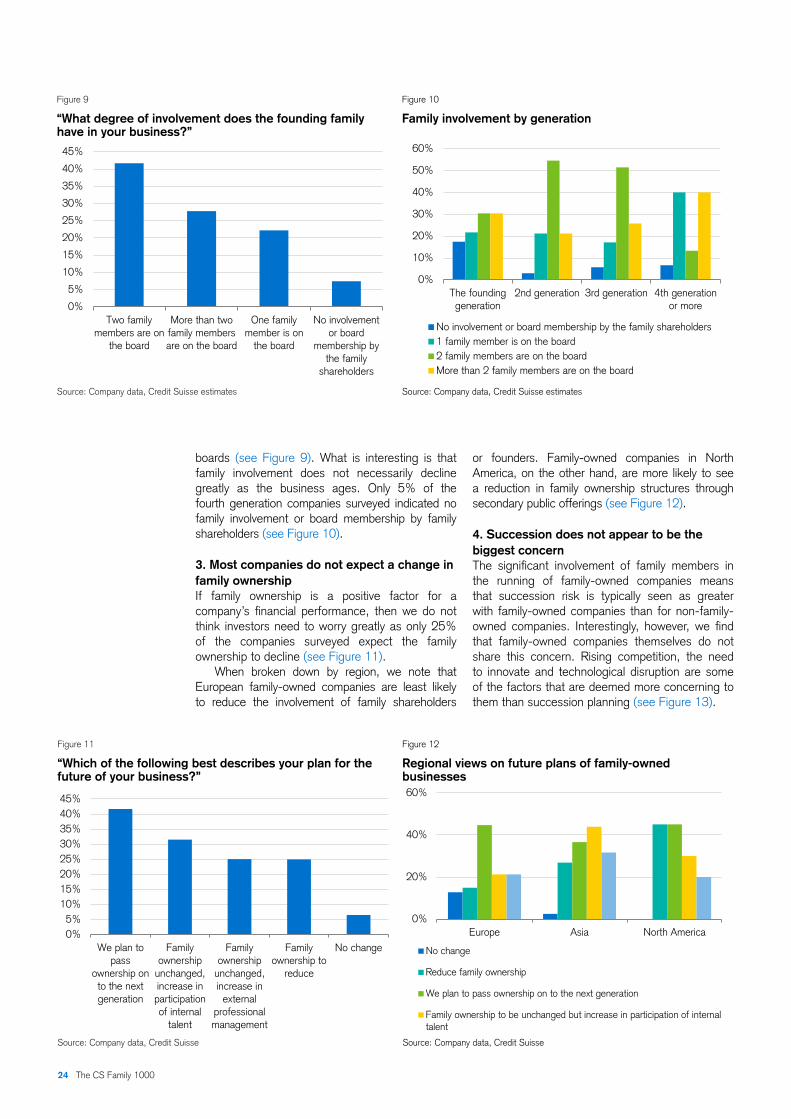
Figure 10
Family involvement by generation
Source: Company data, Credit Suisse estimates
Figure 9
“What degree of involvement does the founding family have in your business?”
Source: Company data, Credit Suisse estimates
Figure 12
Regional views on future plans of family-owned businesses
Source: Company data, Credit Suisse
Figure 11
“Which of the following best describes your plan for the future of your business?”
Source: Company data, Credit Suisse
boards (see Figure 9). What is interesting is that family involvement does not necessarily decline greatly as the business ages. Only 5% of the fourth generation companies surveyed indicated no family involvement or board membership by family shareholders (see Figure 10).
3. Most companies do not expect a change infamily ownershipIf family ownership is a positive factor for acompany’s financial performance, then we do notthink investors need to worry greatly as only 25%of the companies surveyed expect the familyownership to decline (see Figure 11).
When broken down by region, we note that European family-owned companies are least likely to reduce the involvement of family shareholders
or founders. Family-owned companies in North America, on the other hand, are more likely to see a reduction in family ownership structures through secondary public offerings (see Figure 12).
4. Succession does not appear to be thebiggest concernThe significant involvement of family members inthe running of family-owned companies meansthat succession risk is typically seen as greaterwith family-owned companies than for non-family-owned companies. Interestingly, however, we findthat family-owned companies themselves do notshare this concern. Rising competition, the needto innovate and technological disruption are someof the factors that are deemed more concerning tothem than succession planning (see Figure 13).
0%
5%
10%
15%
20%
25%
30%
35%
40%
45%
Two familymembers are on
the board
More than twofamily membersare on the board
One familymember is on
the board
No involvementor board
membership bythe family
shareholders
0%
10%
20%
30%
40%
50%
60%
The foundinggeneration
2nd generation 3rd generation 4th generationor more
No involvement or board membership by the family shareholders1 family member is on the board2 family members are on the boardMore than 2 family members are on the board
0%5%
10%15%20%25%30%35%40%45%
We plan topass
ownership onto the nextgeneration
Familyownership
unchanged,increase inparticipationof internal
talent
Familyownership
unchanged,increase in
externalprofessionalmanagement
Familyownership to
reduce
No change
0%
20%
40%
60%
Europe Asia North America
No change
Reduce family ownership
We plan to pass ownership on to the next generation
Family ownership to be unchanged but increase in participation of internaltalent
24 The CS Family 1000

5. Revenue growth is expected to stay strong and above equity averagesWhen asked about their expected annual revenue growth rates, we found that a majority of the family-owned companies surveyed believe this to be 10% or more (see Figure 14). Interestingly, we note the shift toward higher revenue growth: 75% of the companies surveyed expect revenues to increase by 10% or more during each of the next three years, up from 60% last year.
While the overall result indicates a bullish outlook for family-owned revenue growth, we note that this is especially true for family-owned companies in North America, where 90% of our surveyed companies expect revenue growth of more than 10% during each of the next three years (see Figure 15). Such a top-line growth performance would clearly be above the equity market average as consensus estimates imply revenue growth for the MSCI World Index of 5.3% per annum for the next three years. Clearly what companies expect and what they ultimately achieve can be two very different things. However, premium revenue growth has been the experience to date.
6. Funding of growth through conservative channelsEarlier analysis in this report showed that the financial performance of family-owned companies implied a greater focus on leverage and margins. We asked the survey companies about their policies toward funding of growth, acquisitions and new investments and found that more than 45% of them preferred internally generated funds over loans, debt or issuing new equity (see Figure 16).Interestingly, we also observe that this preference for internally generated funds remains as family-owned companies age. If anything, the share of respondents that prefer internally generated funds even increases somewhat with age (see Figure 17).
When asked to rate the importance of certain financing options available for a family business, we not only observe that retained earnings are indeed preferred over external funding. More interestingly perhaps is that, if outside financing is required, family-linked financing is preferred over every other external funding proposition (see Figure 18).
Figure 13
“What concerns you most over the next five years?”
Source: Company data, Credit Suisse
Figure 14
“What is your historical and expected annual revenue growth rate?” (% of respondents)
Source: Company data, Credit Suisse
Figure 15
“What is your expected annual revenue growth rate?” (% of respondents by region)
Source: Company data, Credit Suisse
0%
10%
20%
30%
40%
50%
60%
70%
80%
90%
100%
Industrycompetition
Retainingtalent/staff
The need toinnovate
Macro-economicconditions
Technologicaldisruption
Geo-politicaluncertainty
Successionplanning
The threat ofgreater
regulation
5 (Very concerning) 4 3 2 1 (not of great concern)
0%
5%
10%
15%
20%
25%
30%
35%
40%
45%
50%
Less than 5% 5-10% 10-20% More than 20%
Last year Next 3 years
0%
10%
20%
30%
40%
50%
60%
Europe Asia North America
Less than 5% 5-10% 10-20% More than 20%
The CS Family 1000 25

7. Adoption of ESG related policies: Europelags, Asia leadsCorporates around the world are increasinglyfocused on environmental policies, good corporategovernance and improving their social policies. All ofthis has more recently received greater attention with the adoption of 17 Sustainable Development Goalsby the United Nations. Against this background, wealso asked family-owned companies whether theyhave (developed) policies aimed at environmental,social and governance (ESG)-related issues. Oursurvey suggests that just under 50% of family-ownedcompanies have indeed incorporated environmentallyrelated policies in their business strategies. On
Figure 17
“How do you typically fund new investments?” (% of respondents by generation)
Source: Company data, Credit Suisse estimates
Figure 16
“How do you typically fund new investments?” (% of respondents)
Source: Company data, Credit Suisse estimates
Figure 18
“Rate the following financing options from 1 (=most) to 6 (=least)”
Source: Company data, Credit Suisse estimates
average, we find that European companies have been slower to adopt ESG related policies, especially compared to family-owned companies in Asia (see Figure 19).
We also reviewed whether the adoption rate of ESG policies is related to where the company is in its lifecycle. Internally focused policies such as those with a social or governance angle appear uncorrelated to a company’s age. With regard to the adoption rate of environmentally related policies, we find that this rate increases from generation to generation. Some 60% of fourth generation family-owned companies have adopted these policies compared to just 43% of family-owned companies that are still in their first generation.
0%5%
10%15%20%25%30%35%40%45%50%
Largelythroughinternallygenerated
funds
Largelythrough
the use ofbankloans
By issuingnew equity
Largelythrough
the use ofdebt
financing
Don'tknow /cannot
say
Otherfinancingmethod
0%
20%
40%
60%
The foundinggeneration
2nd generation 3rd generation 4th generation ormore
Largely through internally generated fundsLargely through the use of bank loansBy issuing new equityLargely through the use of debt financingOther financing method
0%
10%
20%
30%
40%
50%
60%
70%
80%
90%
100%
Family financing Retained earnings Bank loans External equity Corporate bonds
1 2 3 4 5
26 The CS Family 1000

8. Adoption of green technologies has been the most popular sustainable strategy so farWe also asked our survey companies which steps they had taken over the past three years to make their business processes more sustainable. Here again, we find that European family-owned companies lag behind their US and especially their Asian peers. The adoption of “green technologies” has been the area of choice for companies focusing on sustainability (see Figure 21). On the other hand, the adoption of the much broader UN sustainability goals remains relatively unpopular, with just 20% of European firms and 37% of Asian family-owned companies having done so.
Figure 19
“Does your business have a sustainability strategy?”
Source: Company data, Credit Suisse
Figure 20
Adoption rate of ESG policies by age of family-owned company
Source: Company data, Credit Suisse
Figure 21
“Which of the following steps have you taken to make your business processes more sustainable?”
Source: Company data, Credit Suisse
0%
10%
20%
30%
40%
50%
60%
Europe Asia North America
Environmental-related issues Social issues Governance-related issues
0%
10%
20%
30%
40%
50%
60%
70%
The foundinggeneration
2nd generation 3rd generation 4th generation ormore
Environmental-related issues Social issues Governance-related issues
0%
10%
20%
30%
40%
50%
60%
70%
Reviewed thesupply chain for
sustainabilityand humane
practices
Introduced"green"
technologies
Reduced yourglobal footprintagainst "climatechange" issues
Startedfollowing the
UNsustainabilitydevelopment
goals
Introduced anew/revised
corporate valuestatement foryour company
Europe Asia North America
The CS Family 1000 27

28 Family Business Model 2017 Shutterstock.com/ pinholeimaging

Potential areas of concern
Concerns that investors sometimes raise in relation to family businesses tend to focus on perceived weaker governance and accounting quality. Using the full HOLT® governance dataset for our US family-owned companies we conclude that governance may be marginally weaker but that this does not seem to impact share-price returns. Financial metrics appear to have the upper hand (at least for now). As for accounting quality, we find no evidence that this is weaker for family-owned companies in any region. If anything, the opposite seems to be true.
Concerns related to family-owned companies
In this section of the report, we review the relevance of some of the key concerns that investors tend to raise in relation to family businesses. These mostly focus on the quality of corporate governance and accounting. The emotional ties that family owners have in relation to the running of the business may, according to some investors, impact procedures of best practice, favoritism toward family members and provide controlling family shareholders with too much control over the business, thus reaping rewards to the detriment of smaller shareholders.
1. Corporate governance
Establishing good corporate governance practices provides shareholders and future investors with greater transparency of the business and can play
a role in reducing tensions that may arise between shareholders and management who are responsible for the day-to-day running of the company. Here we address whether family-run companies have good corporate governance and the importance of disclosure in relation to management remuneration. While this question is relatively broad and can often be accustomed to a high degree of subjectivity, we use the Credit Suisse HOLT® proprietary framework on corporate governance as an objective measure to analyze whether CEO compensation aligns itself with the value and the extent to which value is created in an organization.
The breadth of management data available under HOLT is substantial for US companies and we thus use US family businesses as a meaningful proxy for our universe to illustrate whether in fact these companies have sound corporate governance structures and the importance of such structures in the investment process.
Figure 1
Average management incentive scores vs. relative share-price returns of family-owned and non-family-owned firms
Source: Company data, Credit Suisse estimates
The CS Family 1000 29
-15%
-10%
-5%
0%
5%
10%
15%
-3
-2
-1
0
1
2
3
IT Financials ConsumerStaples
ConsumerDiscretionary
Healthcare Industrials Materials TelecomServices
Energy
US Family Businesses Control Group Return (rhs)

Corporate governance in US family busi-nesses is slightly weaker than for non-family- owned companiesThe HOLT Management Incentive Scorecard provides an overall score against each company, enabling users to analyze how well the CEO’s performance-based incentives are aligned with shareholder value creation. The management incentive scorecard consists of a series of 13 metrics, in which companies are graded in order to determine their overall score and ultimate ranking versus peer groups. The final scores are then totaled and range from +7 (best) to –8 (worst). Scores between 7 and 4 are deemed good, between 0 and 3 are said to be average and below –1 is poor.
Taking the management incentive scores for 117 of the 121 US companies in our family business universe, we find that the median score in the past year is 1 and has remained at this level over the last five years. These companies have a score that is deemed as average although it is important to highlight that this is toward the lower end of the scale. In comparison, our control group of US non-family businesses has a score of 2. Although still in the average range, it is higher than the family-owned companies. In Figure 1, we compare the management incentive scores for our US family-owned companies versus our non-family-owned control group and the relative share-price returns across their respective sectors. We find that our family-owned companies score better in consumer staples, materials and telecoms.. Interestingly, we note that in the sectors where the family-owned companies scored worst relative to the control group our family universe did outperform in terms of share-price performance (e.g., IT, financials, healthcare and industrials).
Table 1 provides a summary across the 13 key governance criteria for our family companies versus our control group. Overall, we find that our US family businesses score a lower percentage on
positive criteria and score higher percentages on negative criteria, thus leading to a lower management incentive score in comparison to our control group. Three areas where our US family businesses score weaker than our control group are: “no disclosure,” “no financial targets” and “no long-term plan.”
One of the factors underpinning the relatively lower score for our universe of family-owned companies is that 60% of them do not include long-term plan metrics. This compares to 53% of companies in our control group do not include long-term plan metrics.
The second biggest factor influencing the lower management incentive score is that 31% of US family-owned companies do not include financial targets compared to 17% of companies in our control group. The lack of long-term plan metrics and failure to disclose any targets or goals can impinge on investor confidence in family-run companies as there is a lack of visibility with regard to the future success of the business.
Thirdly, 16% of the US family companies that we have analyzed fail to provide any disclosure in relation to how management is compensated. According to HOLT, this lack of transparency is an indicator of poor corporate governance and these firms therefore receive the lowest score of –7. On the other hand, only 5% of companies in our control group fail to provide adequate disclosure in relation to performance metrics.
Lower use of earnings-only remuneration policies Supportive of governance in family-owned companies is the fact that only a small minority have an earnings-only-based approach. Management can often feel undue pressure to meet investor expectations, particularly in situations where remuneration is tied to earnings performance and in periods where earnings are highly vulnerable to losses. It is under these circumstances that the possibility of earnings manipulation is increased. The use of earnings-based metrics (e.g., EPS) only as a tool for measuring performance ignores the importance of the balance sheet and can enable management to manipulate accounting policies to boost performance in the near term. In the case of our US family-run companies, we find 12% of companies focusing on the use of earnings metrics only, which is at similar levels to our control group, perhaps highlighting a shared view in relation to the importance of the balance sheet.
In conclusion, as far as US family-owned companies are concerned, we see their corporate governance scores as (just) average and slightly weaker than for non-family-owned companies.
But does good corporate governance structure matter?Figure 2 shows the price performance of our US family-owned companies versus our control group of non-family-owned companies. Despite the median management incentive score for our family-owned companies being lower, the universe has seen an
Table 1
Percentage scores across key governance criteria
Source: Company data, Credit Suisse estimates
Pos
itive
US family businesses Control group
Operating metrics 82% 89%Return metric 18% 29%Growth metric (sales) 37% 37%Long-term operating metrics 39% 43%Long-term performance period 7% 9%TSR benchmark period 13% 34%
Neg
ative
No disclosure 16% 5%No financial targets 31% 17%No long-term plan 60% 53%Non-operating metrics only 1% 4%TSR benchmark period 13% 11%Stock options/dilution 1% 6%Earnings metric only 12% 12%
30 The CS Family 1000
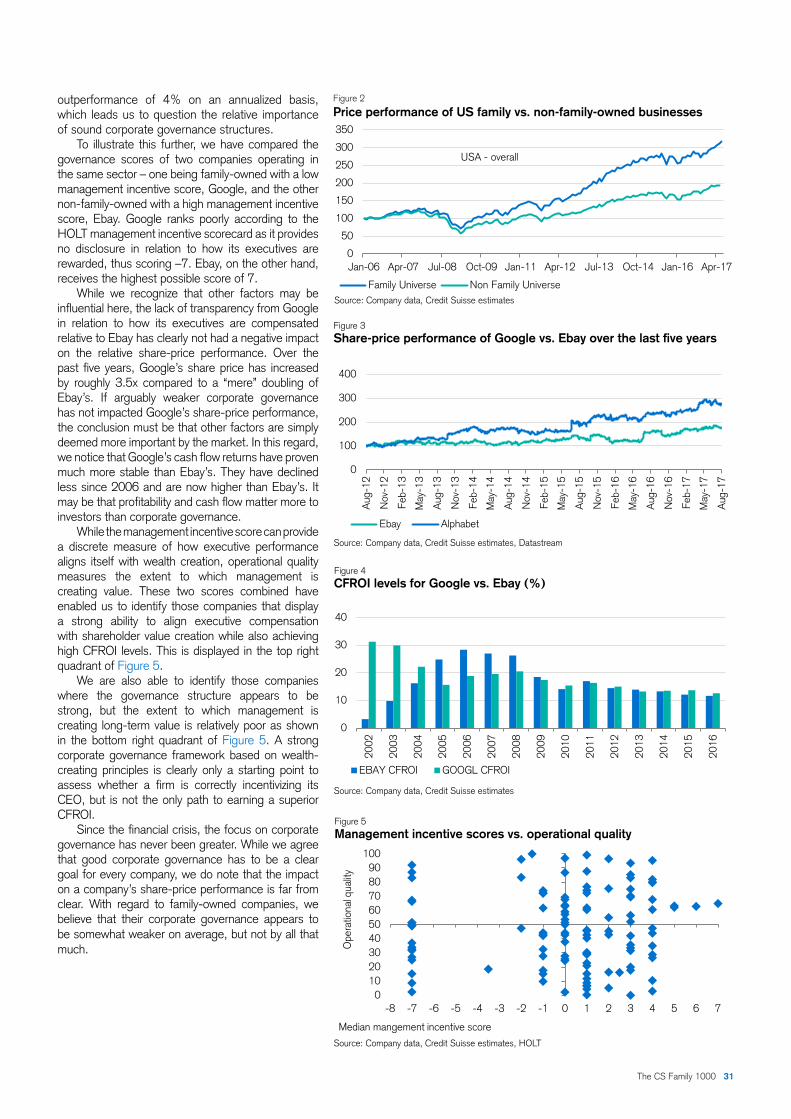
outperformance of 4% on an annualized basis, which leads us to question the relative importance of sound corporate governance structures.
To illustrate this further, we have compared the governance scores of two companies operating in the same sector – one being family-owned with a low management incentive score, Google, and the other non-family-owned with a high management incentive score, Ebay. Google ranks poorly according to the HOLT management incentive scorecard as it provides no disclosure in relation to how its executives are rewarded, thus scoring –7. Ebay, on the other hand, receives the highest possible score of 7.
While we recognize that other factors may be influential here, the lack of transparency from Google in relation to how its executives are compensated relative to Ebay has clearly not had a negative impact on the relative share-price performance. Over the past five years, Google’s share price has increased by roughly 3.5x compared to a “mere” doubling of Ebay’s. If arguably weaker corporate governance has not impacted Google’s share-price performance, the conclusion must be that other factors are simply deemed more important by the market. In this regard, we notice that Google’s cash flow returns have proven much more stable than Ebay’s. They have declined less since 2006 and are now higher than Ebay’s. It may be that profitability and cash flow matter more to investors than corporate governance.
While the management incentive score can provide a discrete measure of how executive performance aligns itself with wealth creation, operational quality measures the extent to which management is creating value. These two scores combined have enabled us to identify those companies that display a strong ability to align executive compensation with shareholder value creation while also achieving high CFROI levels. This is displayed in the top right quadrant of Figure 5.
We are also able to identify those companies where the governance structure appears to be strong, but the extent to which management is creating long-term value is relatively poor as shown in the bottom right quadrant of Figure 5. A strong corporate governance framework based on wealth-creating principles is clearly only a starting point to assess whether a firm is correctly incentivizing its CEO, but is not the only path to earning a superior CFROI.
Since the financial crisis, the focus on corporate governance has never been greater. While we agree that good corporate governance has to be a clear goal for every company, we do note that the impact on a company’s share-price performance is far from clear. With regard to family-owned companies, we believe that their corporate governance appears to be somewhat weaker on average, but not by all that much.
Figure 2
Price performance of US family vs. non-family-owned businesses
Figure 3Share-price performance of Google vs. Ebay over the last five years
Figure 4CFROI levels for Google vs. Ebay (%)
Figure 5Management incentive scores vs. operational quality
Source: Company data, Credit Suisse estimates, HOLT
Source: Company data, Credit Suisse estimates
Source: Company data, Credit Suisse estimates, Datastream
Source: Company data, Credit Suisse estimates
0
50
100
150
200
250
300
350
Jan-06 Apr-07 Jul-08 Oct-09 Jan-11 Apr-12 Jul-13 Oct-14 Jan-16 Apr-17
USA - overall
Family Universe Non Family Universe
0
100
200
300
400A
ug-1
2
Nov
-12
Feb-
13
May
-13
Aug
-13
Nov
-13
Feb-
14
May
-14
Aug
-14
Nov
-14
Feb-
15
May
-15
Aug
-15
Nov
-15
Feb-
16
May
-16
Aug
-16
Nov
-16
Feb-
17
May
-17
Aug
-17
Ebay Alphabet
0
10
20
30
40
2002
2003
2004
2005
2006
2007
2008
2009
2010
2011
2012
2013
2014
2015
2016
EBAY CFROI GOOGL CFROI
The CS Family 1000 31
0102030405060708090
100
-8 -7 -6 -5 -4 -3 -2 -1 0 1 2 3 4 5 6 7
Ope
ratio
nal q
ualit
y
Median mangement incentive score
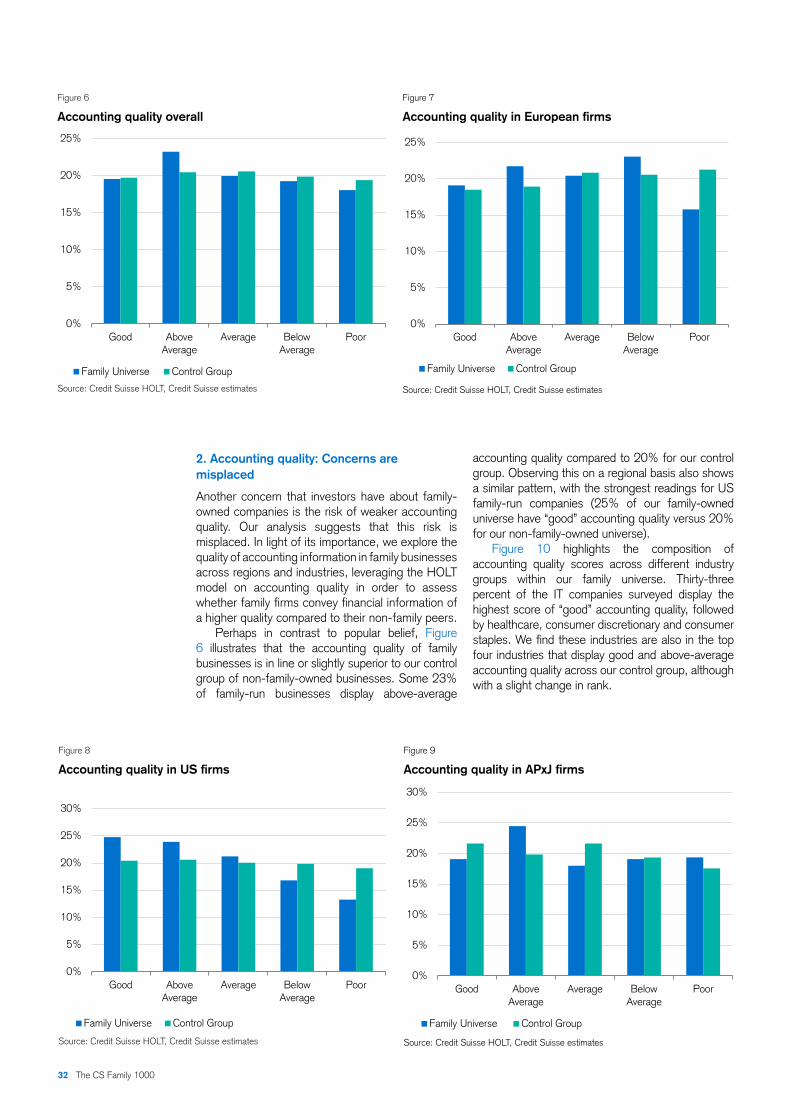
2. Accounting quality: Concerns aremisplaced
Another concern that investors have about family-owned companies is the risk of weaker accounting quality. Our analysis suggests that this risk is misplaced. In light of its importance, we explore the quality of accounting information in family businesses across regions and industries, leveraging the HOLT model on accounting quality in order to assess whether family firms convey financial information of a higher quality compared to their non-family peers.
Perhaps in contrast to popular belief, Figure 6 illustrates that the accounting quality of family businesses is in line or slightly superior to our control group of non-family-owned businesses. Some 23% of family-run businesses display above-average
accounting quality compared to 20% for our control group. Observing this on a regional basis also shows a similar pattern, with the strongest readings for US family-run companies (25% of our family-owned universe have “good” accounting quality versus 20% for our non-family-owned universe).
Figure 10 highlights the composition of accounting quality scores across different industry groups within our family universe. Thirty-three percent of the IT companies surveyed display the highest score of “good” accounting quality, followed by healthcare, consumer discretionary and consumer staples. We find these industries are also in the top four industries that display good and above-average accounting quality across our control group, although with a slight change in rank.
Figure 7
Accounting quality in European firms
Source: Credit Suisse HOLT, Credit Suisse estimates
Figure 6
Accounting quality overall
Source: Credit Suisse HOLT, Credit Suisse estimates
Figure 9
Accounting quality in APxJ firms
Source: Credit Suisse HOLT, Credit Suisse estimates
Figure 8
Accounting quality in US firms
Source: Credit Suisse HOLT, Credit Suisse estimates
32 The CS Family 1000
0%
5%
10%
15%
20%
25%
Good AboveAverage
Average BelowAverage
Poor
Family Universe Control Group
0%
5%
10%
15%
20%
25%
Good AboveAverage
Average BelowAverage
Poor
Family Universe Control Group
0%
5%
10%
15%
20%
25%
30%
Good AboveAverage
Average BelowAverage
Poor
Family Universe Control Group
0%
5%
10%
15%
20%
25%
30%
Good AboveAverage
Average BelowAverage
Poor
Family Universe Control Group
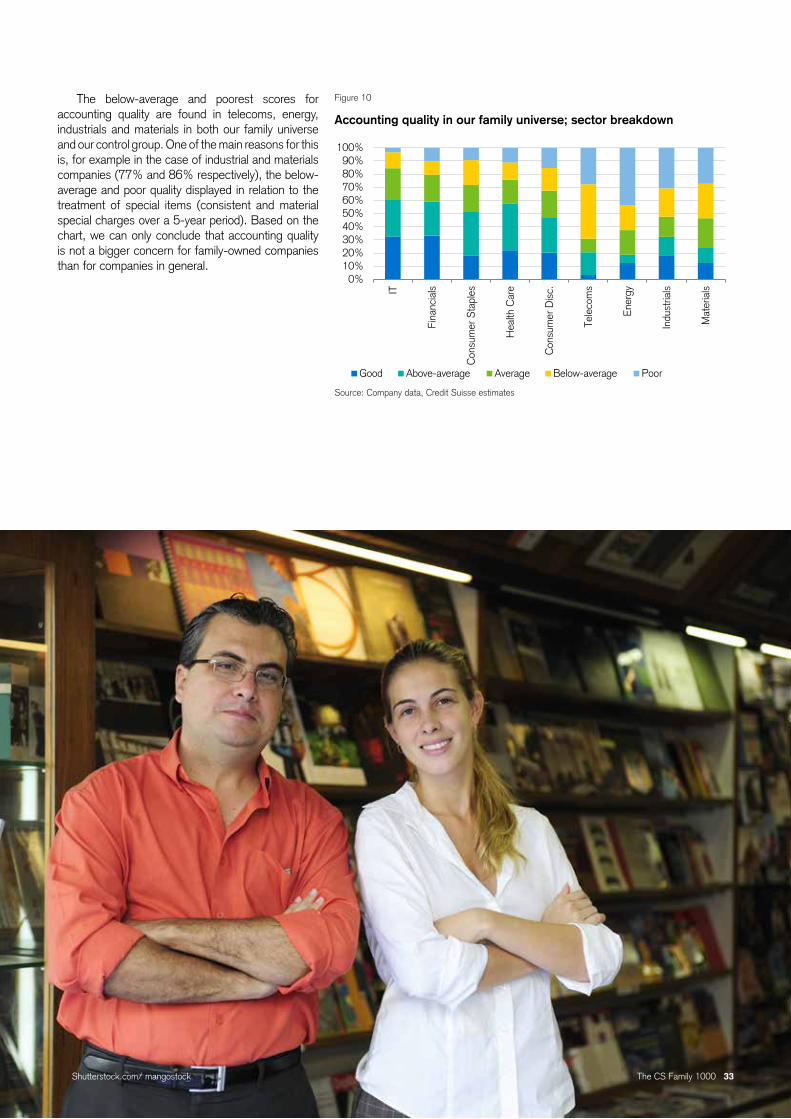
The below-average and poorest scores for accounting quality are found in telecoms, energy, industrials and materials in both our family universe and our control group. One of the main reasons for this is, for example in the case of industrial and materials companies (77% and 86% respectively), the below-average and poor quality displayed in relation to the treatment of special items (consistent and material special charges over a 5-year period). Based on the chart, we can only conclude that accounting quality is not a bigger concern for family-owned companies than for companies in general.
Figure 10
Accounting quality in our family universe; sector breakdown
Source: Company data, Credit Suisse estimates
The CS Family 1000 33
0%10%20%30%40%50%60%70%80%90%
100%
IT
Fina
ncia
ls
Con
sum
er S
tapl
es
Hea
lth C
are
Con
sum
er D
isc.
Tele
com
s
Ene
rgy
Indu
stria
ls
Mat
eria
ls
Good Above-average Average Below-average Poor
Shutterstock.com/ mangostock

34 The CS Family 1000 Istockphoto.com/ Mlenny
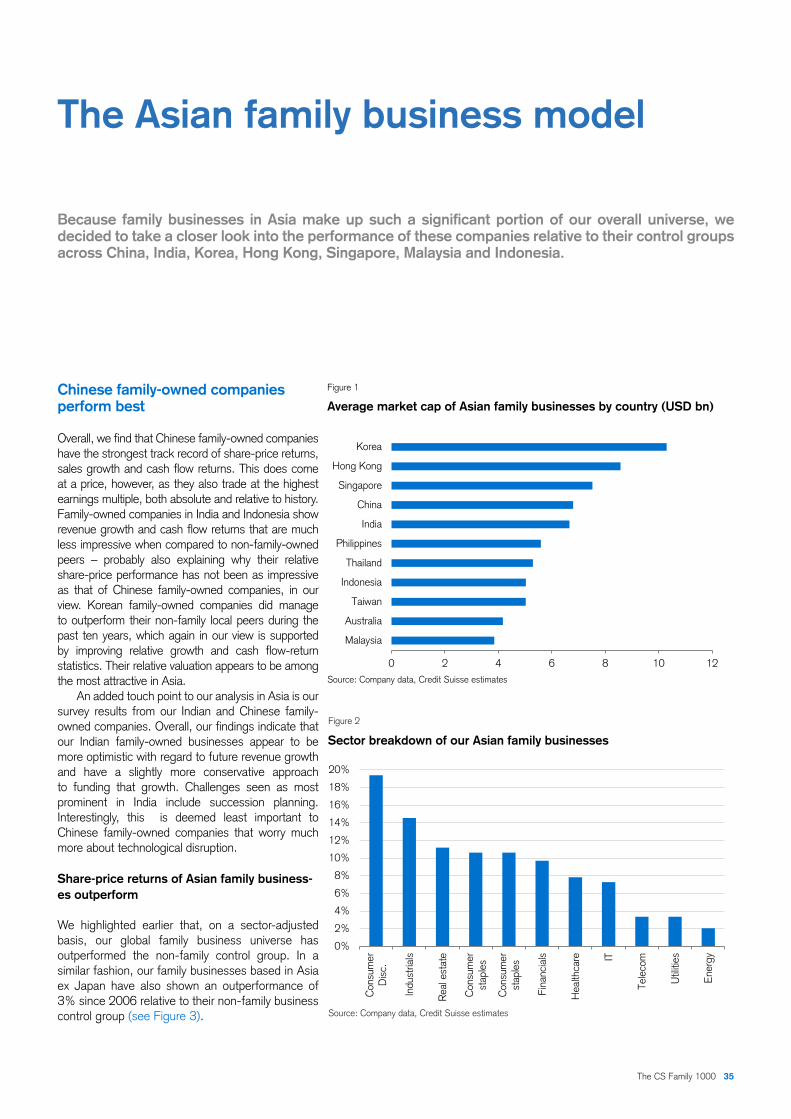
The Asian family business model
Because family businesses in Asia make up such a significant portion of our overall universe, we decided to take a closer look into the performance of these companies relative to their control groups across China, India, Korea, Hong Kong, Singapore, Malaysia and Indonesia.
Chinese family-owned companies perform best
Overall, we find that Chinese family-owned companies have the strongest track record of share-price returns, sales growth and cash flow returns. This does come at a price, however, as they also trade at the highest earnings multiple, both absolute and relative to history. Family-owned companies in India and Indonesia show revenue growth and cash flow returns that are much less impressive when compared to non-family-owned peers – probably also explaining why their relative share-price performance has not been as impressive as that of Chinese family-owned companies, in our view. Korean family-owned companies did manage to outperform their non-family local peers during the past ten years, which again in our view is supported by improving relative growth and cash flow-return statistics. Their relative valuation appears to be among the most attractive in Asia.
An added touch point to our analysis in Asia is our survey results from our Indian and Chinese family-owned companies. Overall, our findings indicate that our Indian family-owned businesses appear to be more optimistic with regard to future revenue growth and have a slightly more conservative approach to funding that growth. Challenges seen as most prominent in India include succession planning. Interestingly, this is deemed least important to Chinese family-owned companies that worry much more about technological disruption.
Share-price returns of Asian family business-es outperform
We highlighted earlier that, on a sector-adjusted basis, our global family business universe has outperformed the non-family control group. In a similar fashion, our family businesses based in Asia ex Japan have also shown an outperformance of 3% since 2006 relative to their non-family business control group (see Figure 3).
Figure 1
Average market cap of Asian family businesses by country (USD bn)
Source: Company data, Credit Suisse estimates
0 2 4 6 8 10 12
Korea
Hong Kong
Singapore
China
India
Philippines
Thailand
Indonesia
Taiwan
Australia
Malaysia
Figure 2
Sector breakdown of our Asian family businesses
Source: Company data, Credit Suisse estimates
0%
2%
4%
6%
8%
10%
12%
14%
16%
18%
20%
Con
sum
erD
isc.
Indu
stria
ls
Rea
l est
ate
Con
sum
erst
aple
s
Con
sum
erst
aple
s
Fina
ncia
ls
Hea
lthca
re IT
Tele
com
Util
ities
Ene
rgy
The CS Family 1000 35
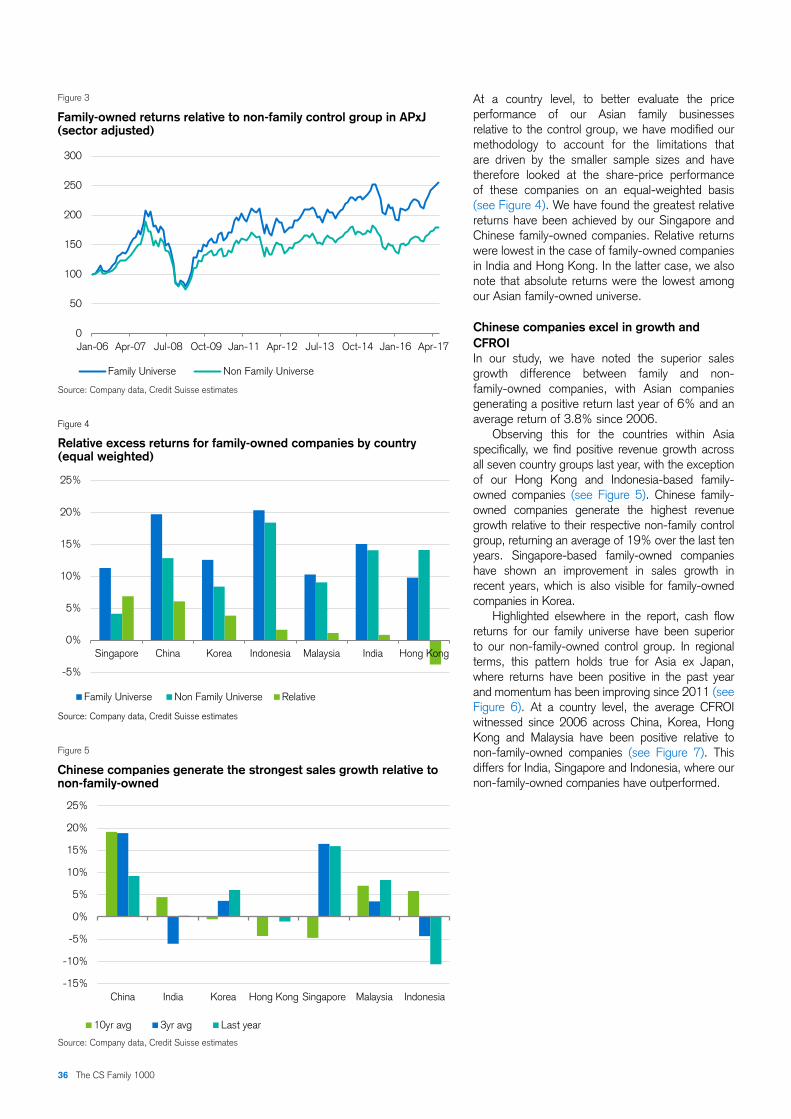
At a country level, to better evaluate the price performance of our Asian family businesses relative to the control group, we have modified our methodology to account for the limitations that are driven by the smaller sample sizes and have therefore looked at the share-price performance of these companies on an equal-weighted basis (see Figure 4). We have found the greatest relative returns have been achieved by our Singapore and Chinese family-owned companies. Relative returns were lowest in the case of family-owned companies in India and Hong Kong. In the latter case, we also note that absolute returns were the lowest among our Asian family-owned universe.
Chinese companies excel in growth and CFROIIn our study, we have noted the superior sales growth difference between family and non-family-owned companies, with Asian companies generating a positive return last year of 6% and an average return of 3.8% since 2006.
Observing this for the countries within Asia specifically, we find positive revenue growth across all seven country groups last year, with the exception of our Hong Kong and Indonesia-based family-owned companies (see Figure 5). Chinese family-owned companies generate the highest revenue growth relative to their respective non-family control group, returning an average of 19% over the last ten years. Singapore-based family-owned companies have shown an improvement in sales growth in recent years, which is also visible for family-owned companies in Korea.
Highlighted elsewhere in the report, cash flow returns for our family universe have been superior to our non-family-owned control group. In regional terms, this pattern holds true for Asia ex Japan, where returns have been positive in the past year and momentum has been improving since 2011 (see Figure 6). At a country level, the average CFROI witnessed since 2006 across China, Korea, Hong Kong and Malaysia have been positive relative to non-family-owned companies (see Figure 7). This differs for India, Singapore and Indonesia, where our non-family-owned companies have outperformed.
Figure 3
Family-owned returns relative to non-family control group in APxJ (sector adjusted)
Source: Company data, Credit Suisse estimates
0
50
100
150
200
250
300
Jan-06 Apr-07 Jul-08 Oct-09 Jan-11 Apr-12 Jul-13 Oct-14 Jan-16 Apr-17
Family Universe Non Family Universe
Figure 5
Chinese companies generate the strongest sales growth relative to non-family-owned
Source: Company data, Credit Suisse estimates
Figure 4
Relative excess returns for family-owned companies by country (equal weighted)
Source: Company data, Credit Suisse estimates
-5%
0%
5%
10%
15%
20%
25%
Singapore China Korea Indonesia Malaysia India Hong Kong
Family Universe Non Family Universe Relative
-15%
-10%
-5%
0%
5%
10%
15%
20%
25%
China India Korea Hong Kong Singapore Malaysia Indonesia
10yr avg 3yr avg Last year
36 The CS Family 1000

APxJ family-owned companies trade at a premiumTo understand whether the relative financial performance of family-owned companies across Asia has been reflected in share prices, we also reviewed valuation multiples (see Figure 8). Similar to the findings for our global family universe, family-owned companies in APxJ have traded at a premium relative to non-family-owned companies since 2006, recording a 10-year average of 8%. An exception to this was during the financial crisis of 2008, where family-owned companies in APxJ traded at a discount of –7% relative to non-family-owned companies.
Figure 8
12-month forward P/E for family-owned vs.non-family-owned in APxJ
Source: Company data, Credit Suisse estimates
Figure 9
Median 12-month forward P/E since 2006 for our Asian countries
Source: Company data, Credit Suisse estimates
Figure 6
Cash flow return difference by region
Source: Company data, Credit Suisse estimates
Figure 7
Absolute average CFROI for our Asian family businesses vs. non-family businesses
Source: Company data, Credit Suisse estimates
At a country level, our Chinese, Indian and Indonesian family-owned companies appear to be the most expensive, trading at high absolute multiples (see Figure 9). Relative to their respective control groups, we find that Chinese family-owned companies trade at a much wider premium currently than they have done historically. It seems that their relative financial performance has therefore been captured relatively strongly in valuation terms.
On the other hand, family-owned companies in Korea, Hong Kong and Singapore appear much cheaper. Absolute multiples are lower than for family-owned companies elsewhere and their valuation relative to non-family-owned peers is also below the 10-year average.
-2.5
-2.0
-1.5
-1.0
-0.5
0.0
0.5
1.0
1.5
2.0
2.5
2006 2008 2010 2012 2014 2016
Europe USA APxJ
0
2
4
6
8
10
12
14
16
18
2006
2007
2008
2009
2010
2011
2012
2013
2014
2015
2016
Family Business Universe Non Family Universe
0.00
1.00
2.00
3.00
4.00
5.00
6.00
7.00
8.00
9.00
Chi
na
Indi
a
Kor
ea
Hon
g K
ong
Sin
gapo
re
Mal
aysi
a
Indo
nesi
a
Family Business Universe Non Family Universe
The CS Family 1000 37
-30%
-20%
-10%
0%
10%
20%
30%
40%
0
2
4
6
8
10
12
14
16
18
China Korea Singapore Indonesia
Non Family UniverseFamily Business Universe Current Premium (rhs) Historical Premium (rhs)

Figure 11
What percentage of your company is owned by family members or the founders?
Source: Company data, Credit Suisse estimates
Figure 10
Which generation do the current owners of the business represent?
Source: Company data, Credit Suisse estimates
What do our Chinese and Indian family businesses think?In order to provide more context to the Asian family-owned business model, we interviewed 20 family businesses in both China and India from our universe. Figures 10–13 highlight the profile of these companies, showing that the Indian companies surveyed are more mature, with 60% of our Indian family businesses in their third generation compared to 30% of our Chinese companies. However, the percentage of family ownership is at similar levels in both countries. More than half of the Indian and Chinese family companies that we surveyed generate revenues in excess of USD 500 million, with the majority of these businesses located across sectors of IT, financials and industrials.
Indian companies boast optimism for future revenue growthThe overall results from our survey highlighted a bullish stance from our family-owned companies, with the majority expecting revenue growth over the next three years to be more than 10%.
Aspirations for future revenue growth over the next three years remain particularly strong for India, with more than half of the companies surveyed expecting to generate revenues of more than 20% over the next three years. While for our Chinese companies, none indicated revenue growth beyond 20%, relative to their own history, Chinese companies still appear to be bullish with 65% expecting growth of between 10% and 20%.
Figure 13
Which of the following sectors best describes your business?
Source: Company data, Credit Suisse estimates
Figure 12
What is your company’s annual revenue?
Source: Company data, Credit Suisse estimates
0%
10%
20%
30%
40%
50%
60%
The foundinggeneration
2nd generation 3rd generation 4th generationor more
India China
0%
10%
20%
30%
40%
50%
60%
20-30% 30-50% More than 50%
India China
0%
5%
10%
15%
20%
25%
30%
Less than$250million
$250million to
$500million
$500million to$1 billion
$1 to $5billion
$5 to $10billion
Greaterthan $10
billion
India China
38 The CS Family 1000
0%
5%
10%
15%
20%
25%
30%
35%
Util
ities
Info
rmat
ion
Tech
nolo
gy
Fina
ncia
l
Indu
stria
l
Hea
lthca
re
Ener
gy
Tele
com
Con
sum
erdi
scre
tiona
ry
Con
sum
erst
aple
s
India China
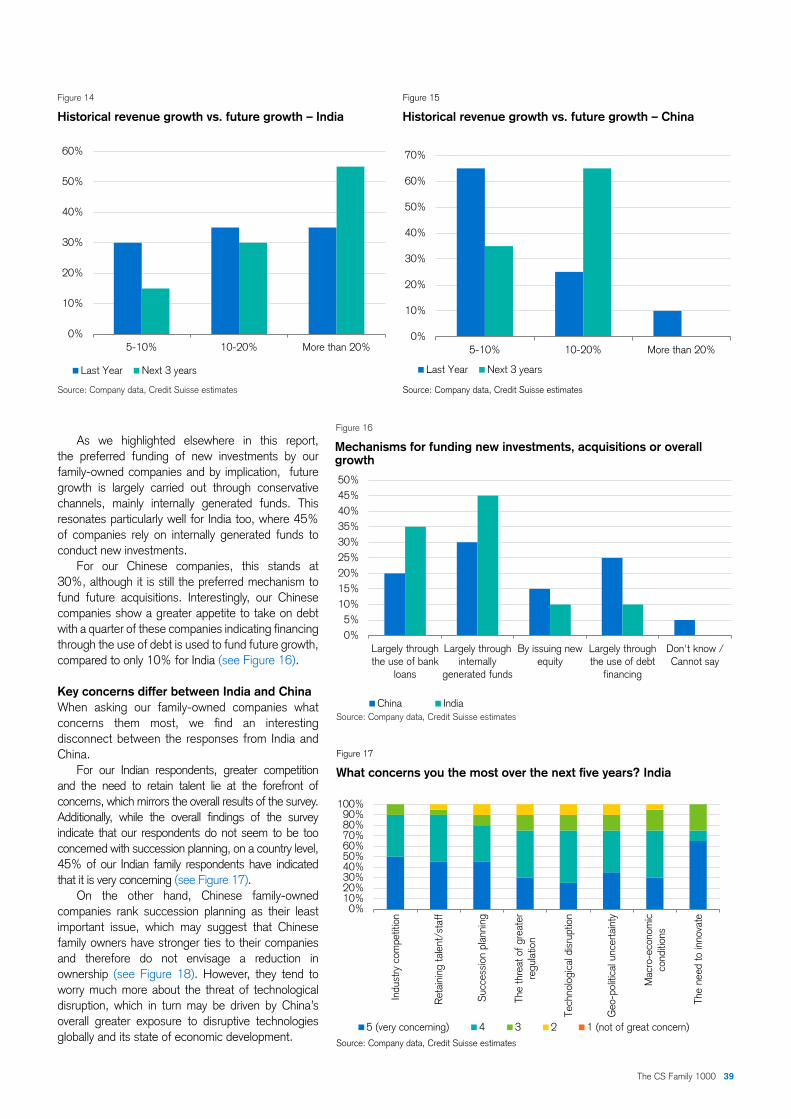
Figure 15
Historical revenue growth vs. future growth – China
Source: Company data, Credit Suisse estimates
Figure 14
Historical revenue growth vs. future growth – India
Source: Company data, Credit Suisse estimates
As we highlighted elsewhere in this report, the preferred funding of new investments by our family-owned companies and by implication, future growth is largely carried out through conservative channels, mainly internally generated funds. This resonates particularly well for India too, where 45% of companies rely on internally generated funds to conduct new investments.
For our Chinese companies, this stands at 30%, although it is still the preferred mechanism to fund future acquisitions. Interestingly, our Chinese companies show a greater appetite to take on debt with a quarter of these companies indicating financing through the use of debt is used to fund future growth, compared to only 10% for India (see Figure 16).
Key concerns differ between India and ChinaWhen asking our family-owned companies what concerns them most, we find an interesting disconnect between the responses from India and China.
For our Indian respondents, greater competition and the need to retain talent lie at the forefront of concerns, which mirrors the overall results of the survey. Additionally, while the overall findings of the survey indicate that our respondents do not seem to be too concerned with succession planning, on a country level, 45% of our Indian family respondents have indicated that it is very concerning (see Figure 17).
On the other hand, Chinese family-owned companies rank succession planning as their least important issue, which may suggest that Chinese family owners have stronger ties to their companies and therefore do not envisage a reduction in ownership (see Figure 18). However, they tend to worry much more about the threat of technological disruption, which in turn may be driven by China’s overall greater exposure to disruptive technologies globally and its state of economic development.
0%
10%
20%
30%
40%
50%
60%
5-10% 10-20% More than 20%
Last Year Next 3 years
0%
10%
20%
30%
40%
50%
60%
70%
5-10% 10-20% More than 20%
Last Year Next 3 years
Figure 17
What concerns you the most over the next five years? India
Source: Company data, Credit Suisse estimates
Figure 16
Mechanisms for funding new investments, acquisitions or overall growth
Source: Company data, Credit Suisse estimates
0%5%
10%15%20%25%30%35%40%45%50%
Largely throughthe use of bank
loans
Largely throughinternally
generated funds
By issuing newequity
Largely throughthe use of debt
financing
Don't know /Cannot say
China India
0%10%20%30%40%50%60%70%80%90%
100%
Indu
stry
com
petit
ion
Ret
aini
ng ta
lent
/sta
ff
Suc
cess
ion
plan
ning
The
thre
at o
f gre
ater
regu
latio
n
Tech
nolo
gica
l dis
rupt
ion
Geo
-pol
itica
l unc
erta
inty
Mac
ro-e
cono
mic
cond
ition
s
The
need
to in
nova
te
5 (very concerning) 4 3 2 1 (not of great concern)
The CS Family 1000 39
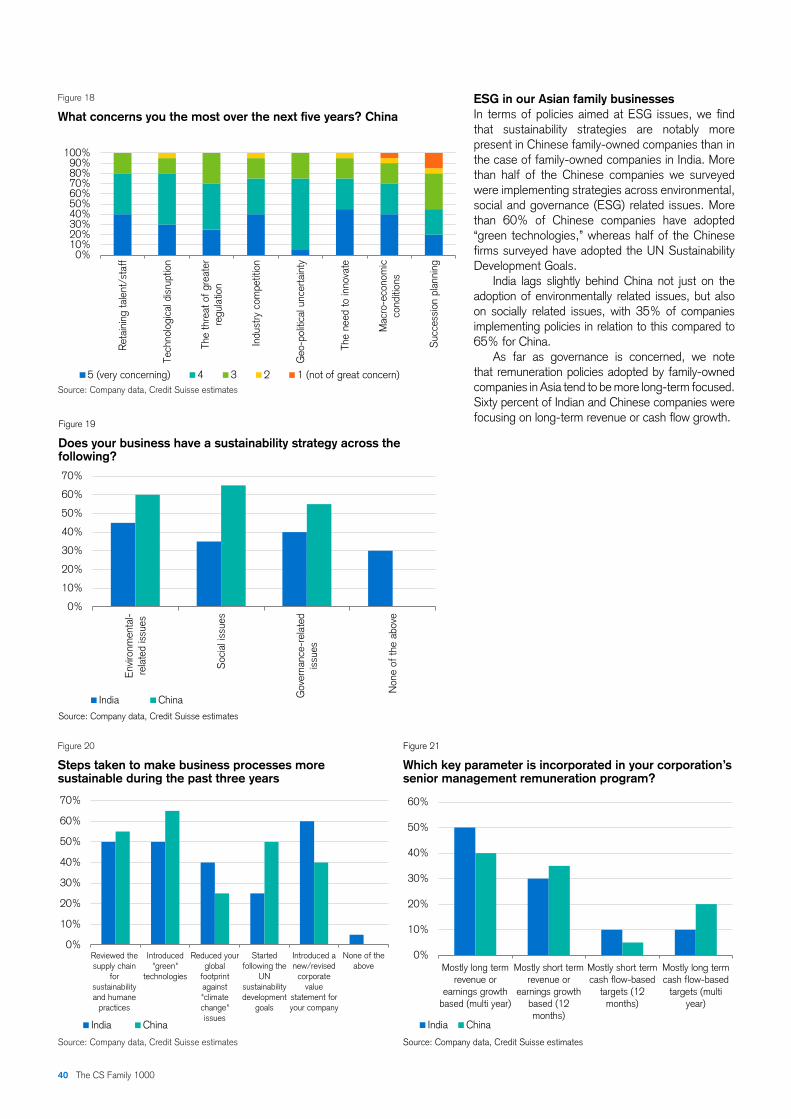
Figure 21
Which key parameter is incorporated in your corporation’s senior management remuneration program?
Source: Company data, Credit Suisse estimates
Figure 20
Steps taken to make business processes more sustainable during the past three years
Source: Company data, Credit Suisse estimates
ESG in our Asian family businessesIn terms of policies aimed at ESG issues, we find that sustainability strategies are notably more present in Chinese family-owned companies than in the case of family-owned companies in India. More than half of the Chinese companies we surveyed were implementing strategies across environmental, social and governance (ESG) related issues. More than 60% of Chinese companies have adopted “green technologies,” whereas half of the Chinese firms surveyed have adopted the UN Sustainability Development Goals.
India lags slightly behind China not just on the adoption of environmentally related issues, but also on socially related issues, with 35% of companies implementing policies in relation to this compared to 65% for China.
As far as governance is concerned, we note that remuneration policies adopted by family-owned companies in Asia tend to be more long-term focused. Sixty percent of Indian and Chinese companies were focusing on long-term revenue or cash flow growth.
Figure 19
Does your business have a sustainability strategy across the following?
Source: Company data, Credit Suisse estimates
Figure 18
What concerns you the most over the next five years? China
Source: Company data, Credit Suisse estimates
0%10%20%30%40%50%60%70%80%90%
100%
Ret
aini
ng ta
lent
/sta
ff
Tech
nolo
gica
l dis
rupt
ion
The
thre
at o
f gre
ater
regu
latio
n
Indu
stry
com
petit
ion
Geo
-pol
itica
l unc
erta
inty
The
need
to in
nova
te
Mac
ro-e
cono
mic
cond
ition
s
Suc
cess
ion
plan
ning
5 (very concerning) 4 3 2 1 (not of great concern)
0%
10%
20%
30%
40%
50%
60%
70%
Env
ironm
enta
l-re
late
d is
sues
Soc
ial i
ssue
s
Gov
erna
nce-
rela
ted
issu
es
Non
e of
the
abov
e
India China
0%
10%
20%
30%
40%
50%
60%
70%
Reviewed thesupply chain
forsustainabilityand humane
practices
Introduced"green"
technologies
Reduced yourglobal
footprintagainst"climatechange"issues
Startedfollowing the
UNsustainabilitydevelopment
goals
Introduced anew/revised
corporatevalue
statement foryour company
None of theabove
India China
0%
10%
20%
30%
40%
50%
60%
Mostly long termrevenue or
earnings growthbased (multi year)
Mostly short termrevenue or
earnings growthbased (12months)
Mostly short termcash flow-based
targets (12months)
Mostly long termcash flow-based
targets (multiyear)
India China
40 The CS Family 1000
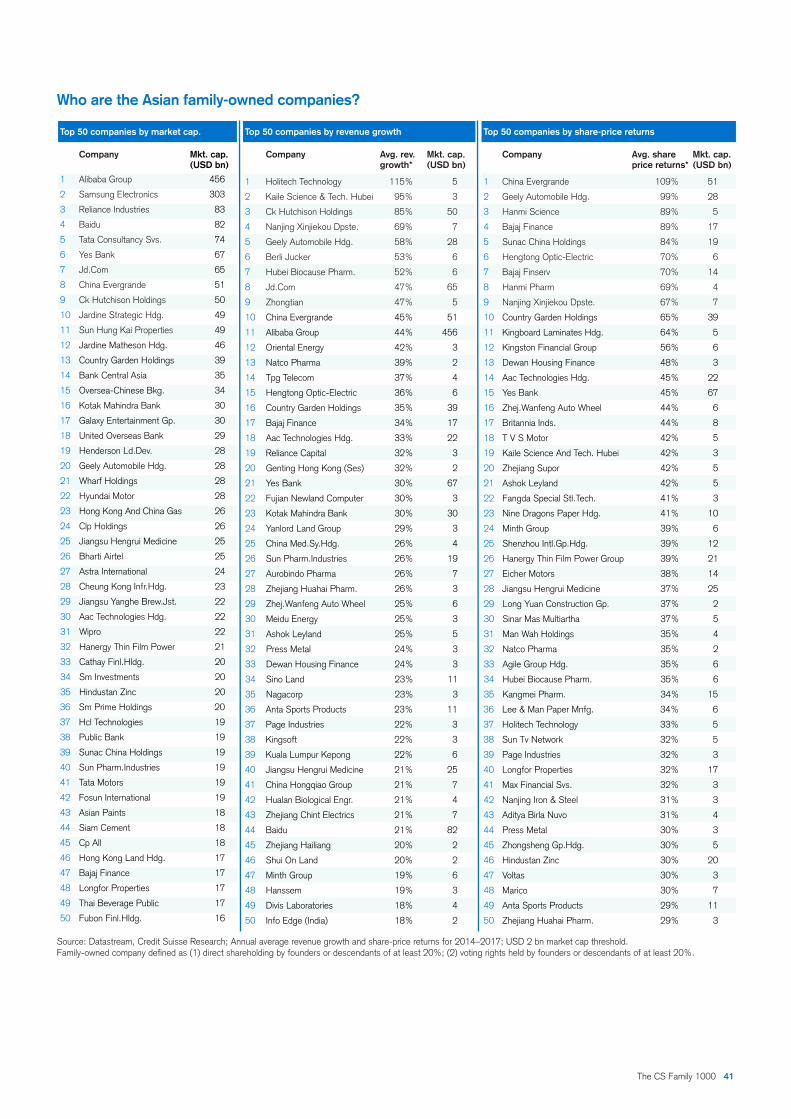
Who are the Asian family-owned companies?
Source: Datastream, Credit Suisse Research; Annual average revenue growth and share-price returns for 2014–2017; USD 2 bn market cap threshold.Family-owned company defined as (1) direct shareholding by founders or descendants of at least 20%; (2) voting rights held by founders or descendants of at least 20%.
Top 50 companies by market cap. Top 50 companies by revenue growth Top 50 companies by share-price returns
Company Mkt. cap. Company Avg. rev. Mkt. cap. Company Avg. share Mkt. cap. (USD bn) growth* (USD bn) price returns* (USD bn)
1 Alibaba Group 456 1 Holitech Technology 115% 5 1 China Evergrande 109% 512 Samsung Electronics 303 2 Kaile Science & Tech. Hubei 95% 3 2 Geely Automobile Hdg. 99% 283 Reliance Industries 83 3 Ck Hutchison Holdings 85% 50 3 Hanmi Science 89% 54 Baidu 82 4 Nanjing Xinjiekou Dpste. 69% 7 4 Bajaj Finance 89% 175 Tata Consultancy Svs. 74 5 Geely Automobile Hdg. 58% 28 5 Sunac China Holdings 84% 196 Yes Bank 67 6 Berli Jucker 53% 6 6 Hengtong Optic-Electric 70% 67 Jd.Com 65 7 Hubei Biocause Pharm. 52% 6 7 Bajaj Finserv 70% 148 China Evergrande 51 8 Jd.Com 47% 65 8 Hanmi Pharm 69% 49 Ck Hutchison Holdings 50 9 Zhongtian 47% 5 9 Nanjing Xinjiekou Dpste. 67% 710 Jardine Strategic Hdg. 49 10 China Evergrande 45% 51 10 Country Garden Holdings 65% 3911 Sun Hung Kai Properties 49 11 Alibaba Group 44% 456 11 Kingboard Laminates Hdg. 64% 512 Jardine Matheson Hdg. 46 12 Oriental Energy 42% 3 12 Kingston Financial Group 56% 613 Country Garden Holdings 39 13 Natco Pharma 39% 2 13 Dewan Housing Finance 48% 314 Bank Central Asia 35 14 Tpg Telecom 37% 4 14 Aac Technologies Hdg. 45% 2215 Oversea-Chinese Bkg. 34 15 Hengtong Optic-Electric 36% 6 15 Yes Bank 45% 6716 Kotak Mahindra Bank 30 16 Country Garden Holdings 35% 39 16 Zhej.Wanfeng Auto Wheel 44% 617 Galaxy Entertainment Gp. 30 17 Bajaj Finance 34% 17 17 Britannia Inds. 44% 818 United Overseas Bank 29 18 Aac Technologies Hdg. 33% 22 18 T V S Motor 42% 519 Henderson Ld.Dev. 28 19 Reliance Capital 32% 3 19 Kaile Science And Tech. Hubei 42% 320 Geely Automobile Hdg. 28 20 Genting Hong Kong (Ses) 32% 2 20 Zhejiang Supor 42% 521 Wharf Holdings 28 21 Yes Bank 30% 67 21 Ashok Leyland 42% 522 Hyundai Motor 28 22 Fujian Newland Computer 30% 3 22 Fangda Special Stl.Tech. 41% 323 Hong Kong And China Gas 26 23 Kotak Mahindra Bank 30% 30 23 Nine Dragons Paper Hdg. 41% 1024 Clp Holdings 26 24 Yanlord Land Group 29% 3 24 Minth Group 39% 625 Jiangsu Hengrui Medicine 25 25 China Med.Sy.Hdg. 26% 4 25 Shenzhou Intl.Gp.Hdg. 39% 1226 Bharti Airtel 25 26 Sun Pharm.Industries 26% 19 26 Hanergy Thin Film Power Group 39% 2127 Astra International 24 27 Aurobindo Pharma 26% 7 27 Eicher Motors 38% 1428 Cheung Kong Infr.Hdg. 23 28 Zhejiang Huahai Pharm. 26% 3 28 Jiangsu Hengrui Medicine 37% 2529 Jiangsu Yanghe Brew.Jst. 22 29 Zhej.Wanfeng Auto Wheel 25% 6 29 Long Yuan Construction Gp. 37% 230 Aac Technologies Hdg. 22 30 Meidu Energy 25% 3 30 Sinar Mas Multiartha 37% 531 Wipro 22 31 Ashok Leyland 25% 5 31 Man Wah Holdings 35% 432 Hanergy Thin Film Power 21 32 Press Metal 24% 3 32 Natco Pharma 35% 233 Cathay Finl.Hldg. 20 33 Dewan Housing Finance 24% 3 33 Agile Group Hdg. 35% 634 Sm Investments 20 34 Sino Land 23% 11 34 Hubei Biocause Pharm. 35% 635 Hindustan Zinc 20 35 Nagacorp 23% 3 35 Kangmei Pharm. 34% 1536 Sm Prime Holdings 20 36 Anta Sports Products 23% 11 36 Lee & Man Paper Mnfg. 34% 637 Hcl Technologies 19 37 Page Industries 22% 3 37 Holitech Technology 33% 538 Public Bank 19 38 Kingsoft 22% 3 38 Sun Tv Network 32% 539 Sunac China Holdings 19 39 Kuala Lumpur Kepong 22% 6 39 Page Industries 32% 340 Sun Pharm.Industries 19 40 Jiangsu Hengrui Medicine 21% 25 40 Longfor Properties 32% 1741 Tata Motors 19 41 China Hongqiao Group 21% 7 41 Max Financial Svs. 32% 342 Fosun International 19 42 Hualan Biological Engr. 21% 4 42 Nanjing Iron & Steel 31% 343 Asian Paints 18 43 Zhejiang Chint Electrics 21% 7 43 Aditya Birla Nuvo 31% 444 Siam Cement 18 44 Baidu 21% 82 44 Press Metal 30% 345 Cp All 18 45 Zhejiang Hailiang 20% 2 45 Zhongsheng Gp.Hdg. 30% 546 Hong Kong Land Hdg. 17 46 Shui On Land 20% 2 46 Hindustan Zinc 30% 2047 Bajaj Finance 17 47 Minth Group 19% 6 47 Voltas 30% 348 Longfor Properties 17 48 Hanssem 19% 3 48 Marico 30% 749 Thai Beverage Public 17 49 Divis Laboratories 18% 4 49 Anta Sports Products 29% 1150 Fubon Finl.Hldg. 16 50 Info Edge (India) 18% 2 50 Zhejiang Huahai Pharm. 29% 3
The CS Family 1000 41
General disclaimer / Important informationThis document was produced by and the opinions expressed are those of Credit Suisse (“CS”) as of the date of writing and are subject to change. It has been prepared solely for information purposes and for the use of the recipient. It does not constitute an offer or an invitation by or on behalf of CS to any person to buy or sell any security. Nothing in this material constitutes investment, legal, accounting or tax advice, or a representation that any investment or strategy is suitable or appropriate to your individual circumstances, or otherwise constitutes a personal recommendation to you. The price and value of investments mentioned and any income that might accrue may fluctuate and may fall or rise. Any reference to past performance is not a guide to the future.
The information and analysis contained in this document have been compiled or arrived at from sources believed to be reliable but CS does not make any representation as to their accuracy or completeness and does not accept liability for any loss arising from the use hereof. A Credit Suisse Group company may have acted upon the information and analysis contained in this publication before being made available to clients of CS. In-vestments in emerging markets are speculative and considerably more volatile than investments in established markets. Some of the main risks are political risks, economic risks, credit risks, currency risks and market risks. Investments in foreign currencies are subject to exchange rate fluctua-tions. Any questions about topics raised in this piece or your investments should be made directly to your local relationship manager or other advisers. Before entering into any transaction, you should consider the suitability of the transaction to your particular circumstances and independently review (with your professional advisers as necessary) the specific financial risks as well as legal, regulatory, credit, tax and accounting consequences. This document may provide the addresses of, or contain hyperlinks to, websites. Except to the extent to which the report refers to website material of CS, CS has not reviewed any such site and takes no responsibility for the content contained therein. Such address or hyperlink (including addresses or hyperlinks to CS's own website material) is provided solely for your convenience and information and the content of any such website does not in any way form part of this document. Accessing such website or following such link through this report or CS's website shall be at your own risk.
This report is issued and distributed in European Union (except Switzerland): by Credit Suisse (UK) Limited and Credit Suisse Securities (Europe) Limited. Credit Suisse Securities (Europe) Limited and Credit Suisse (UK) Limited, both authorized by the Prudential Regulation Authority and regu-lated by the Financial Conduct Authority and the Prudential Regulation Authority, are associated but independent legal entities within Credit Suisse; Germany: Credit Suisse Securities (Europe) Limited Nied-erlassung Frankfurt am Main regulated by the Bundesanstalt fuer Finanzdienstleistung-saufsicht ("BaFin"); United States and Canada: Credit Suisse Securities (USA) LLC; Switzerland: Credit Suisse AG authorized and regulated by the Swiss Financial Market Supervisory Authority (FINMA); Brazil: Banco de Investimentos Credit Suisse (Brasil) S.A or its affiliates; Mexico: Banco Credit Suisse (México), S.A. (transactions related to the securities mentioned in this report will only be effected in compliance with applicable regula-tion); Japan: by Credit Suisse Securities (Japan) Limited, Financial Instruments Firm, Director-General of Kanto Local Finance Bu-reau ( Kinsho) No. 66, a member of Japan Securities Dealers Association, The Financial Futures Association of Japan, Japan Investment Advisers Association, Type II Financial Instruments Firms Association; Hong Kong: Credit Suisse (Hong Kong) Limited; Australia: Credit Suisse Equities (Australia) Limited; Thai-land: Credit Suisse Securities (Thailand) Limited, regulated by the Office of the Securities and Exchange Commission, Thailand, having registered address at 990 Abdulrahim Place, 27th Floor, Unit 2701, Rama IV Road, Silom, Bangrak, Bangkok10500, Thailand, Tel. +66 2614 6000; Malay-sia: Credit Suisse Securities (Malaysia) Sdn Bhd, Credit Suisse AG, Singapore Branch; India: Credit Suisse Securities (India) Private Limited (CIN no.U67120MH1996PTC104392) regulated by the Securities and Exchange Board of India as Research Analyst (registration no. INH 000001030) and as Stock Broker (registration no. INB230970637; INF230970637; INB010970631; INF010970631), having registered address at 9th Floor, Ceejay House, Dr.A.B. Road, Worli, Mumbai - 18, India, T- +91-22 6777 3777; South Korea: Credit Suisse Securities (Europe) Limited, Seoul Branch; Taiwan: Credit Suisse AG Taipei Securities Branch; Indonesia: PT Credit Suisse Securities Indonesia; Philippines: Credit
Suisse Securities (Philippines) Inc., and elsewhere in the world by the relevant authorized affiliate of the above.
Additional Regional Disclaimers Hong Kong: Credit Suisse (Hong Kong) Limited (“CSHK”) is licensed and regulated by the Securities and Futures Commission of Hong Kong under the laws of Hong Kong, which differ from Australian laws. CSHKL does not hold an Australian financial services license (AFSL) and is exempt from the requirement to hold an AFSL under the Corporations Act 2001 (the Act) under Class Order 03/1103 published by the ASIC in respect of finan-cial services provided to Australian wholesale clients (within the meaning of section 761G of the Act). Research on Taiwanese securities produced by Credit Suisse AG, Taipei Securities Branch has been prepared by a registered Senior Business Person. Malaysia: Research provided to residents of Malaysia is authorized by the Head of Research for Credit Suisse Securities (Malaysia) Sdn Bhd, to whom they should direct any queries on +603 2723 2020. Singapore: This report has been prepared and issued for distribution in Singapore to institutional investors, accredited investors and expert investors (each as defined under the Financial Advisers Regulations) only, and is also distributed by Credit Suisse AG, Singapore branch to overseas investors (as defined under the Financial Advisers Regulations). By virtue of your status as an institutional investor, accredited investor, expert investor or overseas investor, Credit Suisse AG, Singapore branch is exempted from comply-ing with certain compliance requirements under the Financial Advisers Act, Chapter 110 of Singapore (the “FAA”), the Financial Advisers Regulations and the relevant Notices and Guidelines issued thereunder, in respect of any financial advisory service which Credit Suisse AG, Singapore branch may provide to you. UAE: This information is being distributed by Credit Suisse AG (DIFC Branch), duly licensed and regulated by the Dubai Financial Services Authority (“DFSA”). Related financial services or products are only made available to Professional Clients or Market Counterparties, as defined by the DFSA, and are not intended for any other persons. Credit Suisse AG (DIFC Branch) is located on Level 9 East, The Gate Building, DIFC, Dubai, United Arab Emirates. UK: The protec-tions made available by the Financial Conduct Authority and/or the Prudential Regulation Authority for retail clients do not apply to investments or services provided by a person outside the UK, nor will the Financial Services Compensation Scheme be available if the issuer of the investment fails to meet its obligations. To the extent communicated in the United Kingdom (“UK”) or capable of having an effect in the UK, this document consti-tutes a financial promotion which has been approved by Credit Suisse (UK) Limited which is authorized by the Prudential Regulation Authority and regulated by the Financial Conduct Authority and the Prudential Regulation Authority for the conduct of investment business in the UK. The regis-tered address of Credit Suisse (UK) Limited is Five Cabot Square, London, E14 4QR. Please note that the rules under the UK’s Financial Services and Markets Act 2000 relating to the protection of retail clients will not be applicable to you and that any potential compensation made available to “eligible claimants” under the UK’s Financial Services Compensation Scheme will also not be available to you. Tax treatment depends on the individ-ual circumstances of each client and may be subject to changes in future EU: This report has been produced by subsidiaries and affiliates of Credit Suisse operating under its Global Markets Division and/or International Wealth Management Division.
42 The CS Family 1000
The CS Family 1000 43
Istockphoto.com/ roibu
HOLT disclaimerThe HOLT methodology does not assign ratings or a target price to a security. It is an analytical tool that involves use of a set of proprietary quantitative algo-rithms and warranted value calculations, collectively called the HOLT valuation model, that are consistently applied to all the companies included in its database. Third-party data (including consensus earnings estimates) are systematically translated into a number of default variables and incorporated into the algorithms available in the HOLT valuation model. The source financial statement, pricing, and earnings data provided by outside data vendors are subject to quality control and may also be adjusted to more closely measure the underlying economics of firm performance. These adjustments provide consistency when analyzing a single company across time, or analyzing multiple companies across industries or national borders. The default scenario that is produced by the HOLT valuation model establishes a warranted price for a security, and as the third-party data are updated, the warranted price may also change. The default variables may also be adjusted to produce alternative warranted prices, any of which could occur. The warranted price is an algorithmic output applied systematically across all companies based on historical levels and volatility of returns. Additional information about the HOLT methodology is available on request CFROI, CFROE, HOLT, HOLT Lens, HOLTfolio, HOLTSelect, HS60, ValueSearch, Signal Flag, Forecaster, “Clarity is Confidence” and “Powered by HOLT” are trademarks or registered trademarks of Credit Suisse Group AG or its affiliates in the United States and other countries. HOLT is a corporate performance and valuation advisory service of Credit Suisse.
This document may not be reproduced either in whole, or in part, without the written permission of the authors and Credit Suisse. © 2017 Credit Suisse Group AG and/or its affiliates. All rights reserved.
Important MSCI Disclosures The MSCI sourced information is the exclusive property of Morgan Stanley Capital International Inc. (MSCI). Without prior written permission of MSCI, this in-formation and any other MSCI intellectual property may not be reproduced, re-disseminated or used to create and financial products, including any indices. This information is provided on an “as is” basis. The user assumes the entire risk of any use made of this information. MSCI, its affiliates and any third party involved in, or related to, computing or compiling the information hereby expressly disclaim all warranties of originality, accuracy, completeness, merchantability or fitness for a particular purpose with respect to any of this information. Without limiting any of the foregoing, in no event shall MSCI, any of its affiliates or any third party involved in, or related to, computing or compiling the information have any liability for any damages of any kind. MSCI, Morgan Stanley Capital International and the MSCI indexes are services marks of MSCI and its affiliates.The Global Industry Classification Standard (GICS) was developed by and is the exclusive property of Morgan Stanley Capital International Inc. and Standard & Poor’s. GICS is a service mark of MSCI and S&P and has been licensed for use by Credit Suisse.Important disclosures regarding companies or other issuers that are the subject of this report are available on Credit Suisse’s disclosure website at https://rave.credit-suisse.com/disclosures or by calling +1 (877) 291-2683.

CREDIT SUISSE AGResearch InstituteParadeplatz 8CH-8070 ZurichSwitzerlandresearch.institute@credit-suisse.comwww.credit-suisse.com/researchinstitute
Also published by the Research Institute
Fat: The New Health ParadigmSeptember 2015
The End of Globalization or a more Multipolar World?September 2015
Global Wealth Report 2015October 2015
How Corporate Governance MattersJanuary 2016
Credit Suisse GlobalInvestment ReturnsYearbook 2016February 2016
Emerging Consumer Survey 2016March 2016
The CS Gender 3000: The Reward for ChangeSeptember 2016
Global Wealth Report 2016November 2016
The Next FrontierDecember 2016
The Future of Monetary PolicyJanuary 2017
Getting over GlobalizationJanuary 2017
Credit Suisse GlobalInvestment ReturnsYearbook 2017February 2017
Emerging Consumer Survey 2017March 2017
CSRI Special Report:The Chinese Consumer in 2017April 2017
Switzerland: A Financial Market HistoryJune 2017