Research indices using web scraped data: May 2016 update
34
Research indices using web scraped data: May 2016 update 23/05/2016 Research indices using web scraped data: May 2016 update Robert Breton, Tanya Flower, Matthew Mayhew, Elizabeth Metcalfe, Natasha Milliken, Christopher Payne, Thomas Smith, Joe Winton and Ainslie Woods 1. Introduction The Consumer Prices Index (CPI) is produced monthly by the Office for National Statistics (ONS). The index measures the change in price of a fixed basket of approximately 700 goods and services. Prices for around 520 of these items are collected by price collectors from stores across the country. The remaining prices are collected centrally through websites, catalogues and by phone. This is often referred to as traditional price collection in index number literature. As part of the drive towards innovation and exploiting existing sources of data we are currently investigating alternative sources of data for consumer price statistics. This was a key recommendation in Paul Johnson’s UK Consumer price statistics: A review (2015). This message was also highlighted in the Independent review of UK economic statistics (2016), led by Professor Sir Charles Bean, which called for the establishment of a new Data Science Campus to increase ONS capability in this area. In January 2014, we set up a Big Data Project to investigate the benefits and the challenges of using such data and the associated technologies within official statistics. The prices pilot was one of four practical pilots set up to provide us with first-hand experience in handling big data. The pilot uses web scraping techniques to collect prices. Web scrapers are software tools for extracting data from web pages. The growth of online retailing over recent years means that price information for many goods and services can now be found online. Last year we published two research articles that looked at how web scraped data can be used to form price indices. The first article – Trial consumer price indices using web scraped data (Breton R, et. al. 2015a) – presented experimental price indices from June 2014 to April 2015. The indices included chained daily and unit price indices at daily, weekly, fortnightly and monthly frequencies, and a fixed base index which followed CPI methodology as closely as possible. The second article – Research indices using web scraped data (Breton R, et. al. 2015b) extended the time series for these indices to June 2015, and introduced a new index compiled using the GEKS – Jevons formula (GEKSJ). Office for National Statistics 1
Transcript of Research indices using web scraped data: May 2016 update

Research indices using web scraped data: May 2016 update 23/05/2016
Research indices using web scraped data: May 2016 update Robert Breton, Tanya Flower, Matthew Mayhew, Elizabeth Metcalfe, Natasha Milliken,
Christopher Payne, Thomas Smith, Joe Winton and Ainslie Woods
1. Introduction
The Consumer Prices Index (CPI) is produced monthly by the Office for National Statistics (ONS).
The index measures the change in price of a fixed basket of approximately 700 goods and
services. Prices for around 520 of these items are collected by price collectors from stores across
the country. The remaining prices are collected centrally through websites, catalogues and by
phone. This is often referred to as traditional price collection in index number literature.
As part of the drive towards innovation and exploiting existing sources of data we are currently
investigating alternative sources of data for consumer price statistics. This was a key
recommendation in Paul Johnson’s UK Consumer price statistics: A review (2015). This message
was also highlighted in the Independent review of UK economic statistics (2016), led by Professor
Sir Charles Bean, which called for the establishment of a new Data Science Campus to increase
ONS capability in this area.
In January 2014, we set up a Big Data Project to investigate the benefits and the challenges of
using such data and the associated technologies within official statistics. The prices pilot was one
of four practical pilots set up to provide us with first-hand experience in handling big data. The pilot
uses web scraping techniques to collect prices. Web scrapers are software tools for extracting data
from web pages. The growth of online retailing over recent years means that price information for
many goods and services can now be found online.
Last year we published two research articles that looked at how web scraped data can be used to
form price indices. The first article – Trial consumer price indices using web scraped data (Breton
R, et. al. 2015a) – presented experimental price indices from June 2014 to April 2015. The indices
included chained daily and unit price indices at daily, weekly, fortnightly and monthly frequencies,
and a fixed base index which followed CPI methodology as closely as possible. The second article
– Research indices using web scraped data (Breton R, et. al. 2015b) extended the time series for
these indices to June 2015, and introduced a new index compiled using the GEKS – Jevons
formula (GEKSJ).
Office for National Statistics 1

Research indices using web scraped data: May 2016 update 23/05/2016
This paper presents the next phase of the research. The use of machine learning techniques for
classification and cleaning was one of the areas for development identified in the previous articles.
Here, we discuss recent progress that we have made in applying supervised and unsupervised
machine learning techniques to the web scraped data. We also present analysis into using
imputation as a means of reducing the impact of missing prices in the data. Finally, the
experimental price indices presented in the previous articles are updated to February 2016.
1.1 Background
As discussed in previous work (Breton R, et. al. 2015b), alternative sources of data have the
potential to greatly improve the quality and efficiency of consumer price indices. As well as web
scraping, scanner data is another potential source of data. Scanner data are datasets collected by
retailers as products are scanned through the till, including both price and quantity data.
However, it must be noted that there are important differences between the more traditional
collection of price data, and these alternative data sources (Table 1). While there are a number of
advantages to using web scraped and scanner data, these differences must be taken into account
when using these data sources to form price indices.
Table 1: Properties of different data sources
Property Traditional collection Web scraped Scanner data
Collection Majority collected through
local collection,
supplemented with
manual central collection
through websites,
catalogues and by phone
Automated web scraping
of retailers website. Data
could either be collected
in-house or supplied by a
third party
Collected in store at point
of purchase. Could be
supplied directly by the
retailer or via a third
party
Location Multiple locations across
the country from multiple
retailers (small to large)
Prices from online
retailers, generally only
medium to large retailers
Prices from retailers
which collect transaction
data, generally only
medium to large retailers
Timing Prices collected around a
single day of the month
(index day)
Price collected daily Price and quantity
collected for every
transaction, could be
supplied in aggregate
format
Sample Price collectors select
representative products
Prices scraped for all
products
All transaction data
collected for all products
Checks Manual checks and
automatic validation
Impractical to manually
check prices and
classifications, use data
Impractical to manually
check prices and
classifications, use data
Office for National Statistics 2

Research indices using web scraped data: May 2016 update 23/05/2016
science techniques like
machine learning
science techniques like
machine learning
Time series Match products over time High product churn High product churn
Cost High cost Potential cost savings per
price quote, but the
processing, maintenance
and storage costs need to
be considered. There is
also the potential cost of
acquiring the data from a
third party
Potential cost savings
per price quote, but the
processing, maintenance
and storage costs need
to be considered. There
is also the potential cost
of acquiring the data
from a third party
Size Small-medium collection Large collection Large collection
Timeliness Publication takes place
about a month after data
collection
If web scraping is run in-
house, price indices can
be calculated almost
instantaneously after data
collection depending on
processing speed
Unknown, depending on
contract with third party
supplier
As part of our overall strategy for incorporating alternative data sources into consumer price
statistics, we are continuing discussions with retailers to provide point of sale scanner data.
However, retailers have been largely unwilling to provide scanner data. Our experiences with
scanner data to date are reported in Initial report on experiences with scanner data in ONS (Bird D,
et. al. 2014).
Due to lack of progress with scanner data, we have continued our investigations into using web
scraped data. The cleaning, processing, storage and price index methodologies that we develop
using web scraped data will be useful in the event of ONS procuring scanner data in the future.
There are also a number of benefits that web scraping can provide over and above scanner data,
notably that if the data are collected centrally, it can be processed in a more timely manner than
waiting for data supplied by third parties.
In Section 2 of this paper we discuss the processes involved in calculating ONS web scraped
grocery price indices. Section 3 discusses the limitations of the data and, in Section 4, we present
an analysis of each of the different indices. We present conclusions and ideas for future work in
Sections 5 and 6 respectively. Methodologies are presented in Appendix 1, and charts for each of
the web scraped items and aggregate indices are presented in the Appendix 2 workbook.
Office for National Statistics 3

Research indices using web scraped data: May 2016 update 23/05/2016
2. ONS Web Scraped Grocery Prices: Index Calculation System
There are a number of steps involved in the development of experimental research indices using
web scraped data. From the first step of collecting price data from online retailers, to the final
production of indices, each step requires solutions to problems such as data storage, classification
and processing, cleaning and manipulation of atypical data (also known as ‘data wrangling’). In
particular, we have made increasing use of machine learning techniques, which are methods of
data analysis that automate the process of building analytical models to learn and predict from the
input data. For this paper, we have looked at supervised machine learning, which uses ‘training
data’ (a dataset where the classifications are marked as correct or incorrect) to learn analytical
rules that will generate the structure in the main dataset, and unsupervised machine learning,
which does not need training data and instead can ‘learn’ the most appropriate structure from the
main dataset itself.
Figure 1 presents a simplified flow diagram of the current system. Each step on the diagram is
discussed in more detail in the following sections. The process of data collection and extraction is
described in Section 2.1. Section 2.2 goes on to discuss the progress that we have made
regarding supervised machine learning, in particular how it can be used to identify misclassified
products. Further checks are covered in Section 2.3, specifically, looking at how cluster analysis
can help identify erroneous products within the data. Finally, the method we have used to impute
price data where products are temporarily unavailable or there has been a problem with the web
scraping technology is described in Section 2.4.
Figure 1: ONS Web Scraped Grocery Prices: Index Calculation System
Office for National Statistics 4

Research indices using web scraped data: May 2016 update 23/05/2016
2.1 Data collection and extraction
ONS’s Big Data pilot for prices has developed prototype web scrapers for three online supermarket
chains: Tesco, Sainsbury and Waitrose, who account for approximately 50% share of the grocery
market (Kantar World Panel, 2016). These scrapers were programmed in Python using the scrapy
module. Every day at 5.00 am the web scrapers automatically extract prices for 33 items in the CPI
basket. While the current local collection item descriptions are tightly defined to ensure it is easy to
find comparable replacements, the web scrapers collect prices from a broader range of products
because the websites do not distinguish between these criteria. For example, the web scraped
data for the item vodka, 70 cl bottle may contain products that have different volumes to 70cl.
The web scraper uses the websites own classification structure to identify suitable products that fit
within the CPI item description. The number of products extracted within each item category varies
depending on the number of products stocked by each supermarket. On average over the period,
approximately 5,000 price quotes are extracted by the web scrapers per day for the 33 items
(approximately 150,000 a month), which is a larger collection of prices than is gathered under the
traditional approach (approximately 6,800 a month for the specified 33 items). Alongside the
product’s price, the product name and offer (discount) information are also extracted by the
scrapers. Discounts are only recorded in the data if they are available to everyone, for example a
single product discount such as a reduced price. Multi-buys and other discounts are not included.
While this paper does not consider the impact of discounts, the data are being used to investigate
the effects of discounting in other project work.
Prices have been collected from all three supermarkets on most days since June 2014, apart from
a longer break in October 2015 which will be discussed in more detail in Box 1. Missing data were
mainly caused by retailers making structural changes to their websites which requires a
corresponding alteration to the web scraper code. Because this is experimental technology, it can
take a number of days before the scrapers are operational again. Missing days were also caused
by internet outages or other IT system failures. To minimise the risk of this creating breaks in the
time series, web scrapers are run from two ONS locations (Newport and Titchfield). The aim is that
if there is a break in one series, the data collected can be merged in from the other location. While
theoretically there may be price differences caused by web scraping in different parts of the
country, early research has shown no price differences exist between these locations.
Despite the success of the web scrapers in collecting large volumes of data, there are still a
number of outstanding issues, which are considered in more detail in Section 3.
2.2 Supervised machine learning (classification)
Classifying prices effectively is a key challenge highlighted by this pilot. The CPI aggregation
structure is based on the international classification system for household consumption
expenditure known as COICOP (classification of individual consumption by purpose). Below the
COICOP level, representative items are selected for which prices are collected. When we scrape
prices data, we do not have a pre-defined map which links items to product descriptions.
Therefore, we need to apply supervised machine learning techniques to classify these data.
Office for National Statistics 5

Research indices using web scraped data: May 2016 update 23/05/2016
Each supermarket that we scrape data from has its own product classification structure, which is
updated frequently. For example, the item apples (dessert), per kg, could be found by navigating to
‘Groceries’ → ‘Fresh Fruit’ → ‘Apples and Pears’. We use the supermarkets’ categorisation that is
closest to the item as a starting point in our classification system. However, there are a number of
products within these categories which would not be consistent with the item definition. In our
example ‘apples’, the supermarkets’ page may also include products such as fruit multipacks,
pears and toffee apples. Therefore, we need a system for classifying products into the correct
COICOP category, and removing products that do not fit the item description.
The approach trialled in the previous article (Breton R, et. al. 2015b) was to use simple search and
exclusion terms. For example, we may want to include products from the supermarkets’ apple
category which contain the word ‘apple’. However, inconsistent items such as toffee apples would
also be included. To solve this, we could manually create lists of filter words for each class, for
example by including exclusion words such as ‘toffee’, ‘pear’ and ‘strawberry’. Although this
method does work, it is labour intensive. Each of the 33 CPI item indices that we currently scrape
would need its own set of filter terms, and these lists would need to be maintained and adapted for
new products and website classification changes. It would be even more resource intensive if we
were to extend the method to the whole CPI basket.
We therefore need a more efficient solution to this problem. In particular, supervised machine
learning allows us to derive an algorithm that learns from training data and can create filtering rules
automatically, such that we do not have to specify new inclusion or exclusion terms every time a
new product appears. The algorithm we have chosen to use in this instance is the Support Vector
Machine (SVM). While there are other methods, the SVM was chosen because it performed best in
terms of accuracy, measured using the F11 score.
The training data have been used to teach the SVM how to predict the ‘correctness’ of the CPI item
classification, which are initially generated by the supermarkets’ classification system. To form
these training data, specialist price collectors were given thousands of examples for each of the 33
CPI item indices that we currently scrape data for. The collectors assigned a label of (1) for a
consistent classification and (0) for an inconsistent classification (Table 2).
Table 2: Generating training data for supervised machine learning; apples (dessert), per kg
CPI Label Item description Manual classification (0 for
inconsistent, 1 for consistent)
Apples, dessert, per PINK LADY APPLES 4S 1
kg
Apples, dessert, per APPLE, KIWI & STRAWBERRY 0
kg 160G
Apples, dessert, per TESCO PACK 4 APPLES 1
kg
1 An F1 score calculates the accuracy of an algorithm, based on whether or not the algorithm accurately
predicts the classifications of unseen data. The quality and size of the training data are also important.
6Office for National Statistics

Research indices using web scraped data: May 2016 update 23/05/2016
Once the assignment was complete, 80% of the data are used to train the SVM. The remaining
20% of the data are used to test accuracy and generate the F1 score. This is required because the
algorithm needs to be tested on unseen data that has been correctly classified.
As a result of the training data, the SVM learns to associate certain words and tokens with the
correct CPI item classification. For example, for apples, it learns terms that have a positive
relationship (e.g. ‘apple’) and negative relationship (e.g. ‘kiwi’, ‘strawberry’). It can then analyse
product names: if there are enough words and tokens with a positive relationship, that classification
is then deemed to be correct. Common words and tokens that add no predictive value are
excluded from the algorithm.
The process detailed above creates a classifier for each of the 33 CPI item indices that we scrape
price data for. Each classifier contains all the rules that the SVM has learnt from the training data.
As new data is scraped from each website, it is fed through the classifier and assigned a flag if the
SVM believes it is incorrectly classified. Those with an ‘incorrect’ flag can be identified in further
cleaning steps, and potentially be excluded from index creation and analysis. Furthermore, the
classifier can be periodically updated by fitting the SVM with new training examples. Figure 2
shows this process as a flow diagram.
Figure 2: Classification flow diagram using supervised machine learning
The classifiers have an average accuracy of around 85% (F1 score) over the 33 CPI items. The
speed and the low resource required to build such a system has demonstrated the usefulness of
applying supervised machine learning to the classification of alternative data sources. However,
there are a number of ways in which the classifiers can be improved, such as using more training
data and including a wider use of natural language processing, for example investigating links
between common sets of words.
Once the SVM has run, the data are saved and an automated email report is generated. The report
has counts for each item category and each supermarket. Other errors are identified through
descriptive statistics, or simply by manually inspecting the data.
Office for National Statistics 7

Research indices using web scraped data: May 2016 update 23/05/2016
2.3 Unsupervised cluster based anomaly detection
Following the classification step, further checking of the data takes place. This step is required
because while the classification algorithm used does classify the data effectively, it is still possible
that there are a number of misclassifications contained within the data that could introduce a bias.
This procedure also identifies anomalous data, such as a loaf of bread priced at £100. Ideally, a
manual check would be the best way to find these errors, but given the volume of the data this is
not time and cost effective. Therefore, an automated method of error detection has been
developed using unsupervised machine learning techniques. The method and results are
summarised below. For further information, please see the upcoming release in the ONS Survey
Methodology Bulletin No. 75: Mayhew M, Clews G (2016).
For the method to be applied, the assumption is made that these errors follow a different
distribution to correctly classified data (i.e. the prices fall in the tails of the distribution). Therefore, if
these different distributions can be identified it will then be possible to label the data as potential
misclassifications or anomalous prices. The identification of the different distributions can be done
by using an unsupervised machine learning technique called cluster analysis. The clusters are
sensitive to heterogeneity in the underlying data, which means that data from different distributions
will be assigned to different clusters. While there are many different clustering algorithms to choose
from, it was decided to use Density-based Spatial Clustering of Applications with Noise (DBSCAN).
DBSCAN is not as sensitive to the choice of distance measures, initial ‘means’ or the shape of the
clusters as other popular clustering algorithms are.
The products were clustered according to their price, with similarly priced products being placed in
the same clusters. This is appropriate here because we are not measuring price growth of these
clusters, rather that misclassified products and erroneous prices are identified correctly. DBSCAN
requires two input parameters in order to classify data into a cluster: the maximum difference
allowed for neighbouring products in the same cluster, and the minimum number of points for a
cluster to be formed. We changed the maximum difference according to the COICOP division the
products were assigned to, with products classified in Division 1 – Food & Non-Alcoholic
Beverages being set to a maximum of £0.10 and products assigned to Division 2 – Alcoholic
Beverages & Tobacco being set to a maximum of £1.00. This was to account for the spread of
alcohol prices being larger than for food and non-alcoholic beverages. The minimum number of
points was set to 5 for both sets of products. Figure 3 shows an example of how clusters are
formed using some sample data for the item apples (dessert), per kg.
Office for National Statistics 8

Research indices using web scraped data: May 2016 update 23/05/2016
Figure 3: Example cluster formation for the item apples (dessert), per kg
To clean the data, two sets of clusters are calculated: a set of ‘training’ clusters which were
produced on the first month of collection, and a set of ‘full’ clusters which were calculated over all
21 months that data have been collected for (June 2014 – February 2016). The first month was
chosen to ‘train’ the clusters because during the development of the web scrapers the first period
of data were closely checked for errors. The limitation to this approach to calculate ‘full’ clusters is
that given more data, the clusters are likely to change in size and shape. Therefore, it is entirely
possible that clusters may merge, or a new cluster may form between existing clusters. This could
happen due to a new product being introduced on the market at prices between the old products.
To take account of this effect, the ‘full’ clusters are matched to the ‘training’ clusters so products
retain their initial cluster assignment across time. From this, any clusters which did not exist in their
entirety in the training month are labelled as errors. The problem with this approach is that new
products may be classified as errors because they do not fit into previously defined clusters. For
future work, we may look to optimise the parameters of the clustering algorithm to solve this issue,
and to refresh the ‘training’ cluster annually.
Figure 4 demonstrates the clustering results for the item apples (dessert), per kg. The different
colours represent the different clusters, with the larger black points showing prices which the
clustering algorithm identifies as anomalous. There are three product sections of these
misclassified prices, which correspond to:
1. Apple Multipacks and Pears
2. Rhubarb, Strawberries and Apple Multipacks
3. Easter Eggs, Wines and Fish
Office for National Statistics 9

Research indices using web scraped data: May 2016 update 23/05/2016
The supermarkets’ website recommender system may display other fruit when you navigate to
apples, in the hope that if the customer is looking for apples they might want to buy other fruit or
vegetables as well. The slightly more unusual products seen in the last section may have been
included because the websites were trying to boost the sales of these items in the run up to Easter,
and therefore were advertising them on different product pages on the website. This example
demonstrates the benefit of using clustering to validate the results of the supervised machine
learning. Including these items in the index would upwardly bias the price level, as these products
had much higher prices per kg than the target apple products.
Figure 4: Prices for apples (dessert), per kg, separated into clusters
For this paper, we use the results of this exercise to validate the SVM classification algorithm
detailed in Section 2.2. This ensures that new products are still retained for index calculation. After
the algorithm has been applied, the labels given to the product during the clustering step are
compared to those given in the classification step. This comparison creates four different
categories: agreement in correct classification, agreement in correct misclassification, new product,
and disagreement in classification. The last two then require further manual checking to see
whether the product is actually new, or to understand why the machine learning algorithms
disagree with each other. In future, this manual checking will be automated, and reduce as the
parameters in the model are optimised. Currently, the accuracy of the process is 85%, as
measured by the F1 score used in Section 2.2 to measure the accuracy of the SVM algorithm.
Across the time period, the total percentage of products that were classified as anomalous or
misclassifications after this validation step was 25%. These prices have therefore been removed
from the dataset, reducing the number of prices used in our analysis from 3.4 million to 2.5 million.
Office for National Statistics 10
Research indices using web scraped data: May 2016 update 23/05/2016
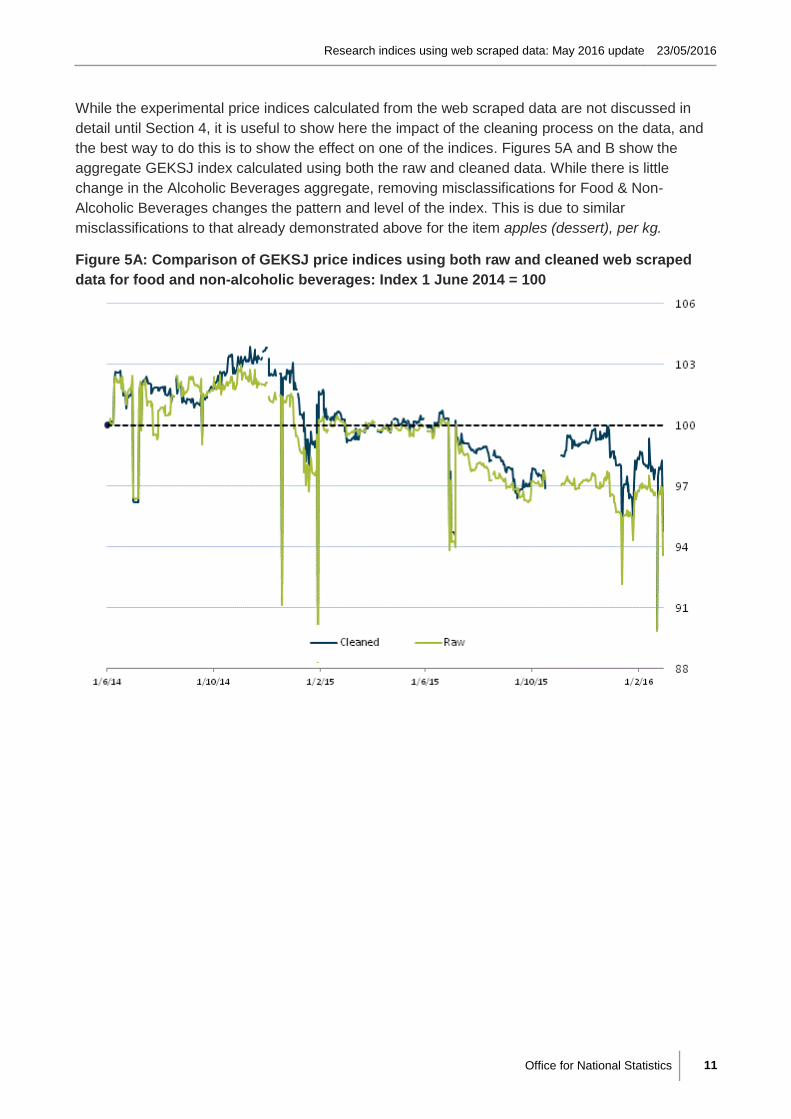
While the experimental price indices calculated from the web scraped data are not discussed in
detail until Section 4, it is useful to show here the impact of the cleaning process on the data, and
the best way to do this is to show the effect on one of the indices. Figures 5A and B show the
aggregate GEKSJ index calculated using both the raw and cleaned data. While there is little
change in the Alcoholic Beverages aggregate, removing misclassifications for Food & Non-
Alcoholic Beverages changes the pattern and level of the index. This is due to similar
misclassifications to that already demonstrated above for the item apples (dessert), per kg.
Figure 5A: Comparison of GEKSJ price indices using both raw and cleaned web scraped
data for food and non-alcoholic beverages: Index 1 June 2014 = 100
Office for National Statistics 11

Research indices using web scraped data: May 2016 update 23/05/2016
Figure 5B: Comparison of GEKSJ price indices using both raw and cleaned web scraped
data for alcoholic beverages: Index 1 June 2014 = 100
2.4 Imputation
The last stage of the data wrangling process is imputation. There are a number of reasons why
there might be missing prices in the web scraped dataset: a product is no longer available, a
product is temporarily unavailable (out of stock), or there was an error in the collection (“scraper
break”). Where a product is out of stock or there has been a scraper break, imputation can be used
to deal with temporarily missing prices.
A number of imputation methods have been tested on the web scraped dataset (Mayhew M,
2016b) and as a result the following rules have been applied to missing prices:
1. If a product is unavailable then a price will be carried forward for a maximum of three days
2. If a scraper break is identified then a price will be carried forward for a maximum of seven days
3. Otherwise, prices should not be imputed and if all product prices are missing from certain days, this will be shown as a dotted line in the series
Carrying forward prices performed best in the simulation study conducted in Mayhew M (2016b).
This makes sense as there are relatively few price changes day to day. In fact, it can be seen that
across the web scraped data set, prices only change on average every 120 days.
Office for National Statistics 12

Research indices using web scraped data: May 2016 update 23/05/2016
Imputing missing prices in the case of a scraper break is necessary as we are compensating for
not being able to collect data due to a technical issue. As set out in Box 1, the majority of scraper
breaks do not last longer than 7 days, so imputation of prices in these instances helps us reduce
breaks in the series. The decision to impute prices in the case of out of stock items is less clear
cut. In measuring inflation, we aim to record the price of items which are available to consumers on
a particular day and imputing for out of stock items may seem contrary to this. However, while the
online supermarkets scraped by ONS operate national pricing policies, the stock availability is local
and the ONS scrapers will only collect prices for products available in Newport and Titchfield,
disregarding the stock levels in other parts of the country. The decision to impute for missing prices
aims to address this, and produce a price index representative of UK prices.
As in Section 2.3, it is useful to show here the impact of the imputation process on the data, and
the best way to do this is to show the effect on one of the indices. Figures 6A and B show the
aggregate GEKSJ calculated using both the cleaned and imputed data. Again, for Alcoholic
Beverages there is not much difference between the two sources. However, for Food & Non-
Alcoholic Beverages, the imputation smoothes out irregularities in the index. This is because a
missing price causes a 0 index to be recorded on that date for that product, downwardly biasing
the aggregate index.
Figure 6A: Comparison of GEKSJ price indices using both cleaned and imputed web
scraped data for food and non-alcoholic beverages: Index 1 June 2014 = 100
Office for National Statistics 13

Research indices using web scraped data: May 2016 update 23/05/2016
Figure 6B: Comparison of GEKSJ price indices using both cleaned and imputed web scraped data for alcoholic beverages: Index 1 June 2014 = 100
Office for National Statistics 14

Research indices using web scraped data: May 2016 update 23/05/2016
Box 1: Scraper breaks
Table 3 shows the frequency of scraper breaks by break length for the three online retailers, for
scrapers operated from the Newport site. While we are still developing the web scraping
technology, it is reassuring to see that 75% of scraper breaks last only 1 day, and apart from two
major breaks, no break has been longer than a week. The majority of scraper breaks are caused
by lab failures, detailed in the right hand side column. These are occasions when the servers that
host the web scrapers fail due to internet outages or other IT system failures, and therefore cannot
collect prices from any of the online supermarkets. The rest of the breaks are caused by changes
to the websites’ configuration, which means that the scrapers have to be adapted to deal with the
new classification structure. These can take time to fix, and result in no prices being collected from
that website in the mean time.
Table 3: Length of Newport scraper breaks by supermarket, Jun 2014 – Feb 2016
Break Length
(days)
Frequency of breaks Number of
scraper breaks
caused by lab
failure Sainsbury’s Tesco Waitrose
1 22 15 16 12
2 1 2 1 1
3 1 2 2 21
4 1 0 0 0
6 1 1 0 0
7 1 1 0 0
26 1 0 0 0
34 1 1 1 1
Notes: 1) This number is greater than the number of three day breaks in the Sainsbury’s web scraper as the
three day lab break is part of a longer break in the Sainsbury’s web scraper.
Figure 7 shows the number of prices collected daily using the Newport scraper from each online
retailer over the time period to February 2016. As well as clearly identifying the smaller sample size
from Waitrose because of the infinite scrolling problem, it also paints a clear picture of where the
web scrapers have broken. As well as total breaks, where no prices have been collected from any
supermarket for a particular day, Figure 7 also shows where there are partial breaks in the web
scrapers. In particular, the reduction in sample size for Sainsbury’s from November 2015 onwards
is clear. This is because Sainsbury’s adjusted the structure of its website, notably increasing the
Office for National Statistics 15

Research indices using web scraped data: May 2016 update 23/05/2016
use of JavaScript. The programming language used to run the scrapers, Python, is not well suited
to scraping websites that contain lots of JavaScript content, and therefore since November we
have only been able to scrape the first page of the Sainsbury’s website (similar to the Waitrose
infinite scrolling problem, detailed above).
Figure 7: Number of price quotes collected per day using the Newport scraper, by
supermarket, Jun 2014 – Feb 2016.
These issues highlight the technical difficulties in web scraping as a method of data collection.
While most of these issues can be overcome, it is difficult to continuously maintain the web
scrapers given the regular changes that occur to website structure. It should be noted however that
we have recently been able to solve the infinite scrolling problem on the Waitrose website, and
problems on the Sainsbury’s website have also been resolved. These will be reflected in the next
publication.
3. Data limitations
Web scraping price data clearly offers a number of benefits. It has the potential to reduce collection
costs, and increase the frequency and number of products that are represented in the basket. It
also has the potential to deepen our understanding of price behaviour through additional and
higher frequency indices.
However, the data are different (which does not imply worse) to traditionally collected price data.
This means that there are a number of limitations and caveats that should be applied to the data.
These prevent conclusions being drawn on supermarket’s online price behaviour or comparisons
to national inflation rates.
Office for National Statistics 16

Research indices using web scraped data: May 2016 update 23/05/2016
This section is split into general limitations to using web scraped data, and those specific to the
work that we are doing at ONS, in particular, problems that we have encountered with the web
scrapers we have programmed.
General limitations to web scraped data:
The terms and conditions for certain websites imply that web scraping may not be an
acceptable use of the website. Further, it is thought that some websites use blocking
technologies to prevent scraping. Therefore, prices cannot be scraped from all online retailers.
All prices are scraped regardless of expenditure. This means that we collect the prices of all
products that are available, but we do not know which products have been bought and in what
quantities. This makes it necessary to treat all products equally. In traditional price collection
price collectors select items that are representative of what consumers buy2, and low
expenditure products would not normally be considered.
Prices are collected daily rather than on an index day each month, as in traditional CPI
collection. While the large volume of data offers many benefits in terms of increasing the
number of price quotes, and decreasing the effects of outliers, this limits the extent to which
comparisons may be drawn with published CPI indices.
Products are matched across periods using product names; however, these can change over
time. In traditional price collection, a price collector would easily be able to identify if a product is
the same, following a change of description. Current matching methods are unable to identify
description changes. Again, the volume of the data means that comparable replacements3
cannot easily be found for unmatched products.
Typically, we see very high levels of product churn (i.e. products coming in and out of stock) in
high volume price data. This means that, for some items, sample sizes are very small. This
problem is particularly acute where the methodology requires items to be matched over the
length of the time series, for example in the unit price index.
The volume of the data makes traditional cleaning methods unworkable. While work has
progressed significantly on developing appropriate cleaning and classification procedures, it is
still possible that there are a number of misclassifications and erroneous prices contained within
the data.
Limitations to ONS web scraping process:
Prices have only been scraped from three large stores with an online presence. By contrast, in
the CPI, prices are collected across a wide range of stores from across the country. This
accounts for variations in price caused by differences between regions and for different sizes of
store.
The Waitrose website has an infinite scrolling system, wherein a maximum of 24 items are listed
on a page. If there are more than 24 items, these are loaded sequentially via user activation of
the scroll bar. While this problem has been solved recently, the web scrapers have previously
not been able to replicate this user action, and therefore this has limited the data collection to
the first 24 items listed under each category for the period covered by this article.
2 Price collectors use the shelf space devoted to a product, product knowledge, and engage with the retailer to identify
popular items that are regularly in stock. 3
A product similar enough to the original that it can be considered to be the same
17Office for National Statistics

Research indices using web scraped data: May 2016 update 23/05/2016
As well as the infinite scrolling problem on websites, changes to website structure and
technology failures on the computers and servers we use to scrape the data can cause an
interruption to the data collection, termed a ‘scraper break’.
4. Analysis
The web scraped data are used to construct price indices referenced to June 2014 = 100. Data
before this date are not considered due to early development issues with the web scraper, which
failed to collect prices on several days. While the previous articles calculated indices from the
standardised price per unit (for example, the price per kilogram or price per litre), this update uses
the prices given for each product. Theoretically the two should show the same price growth,
although this relies on consistent recording and calculation of the standardised price. To mitigate
this problem, and to align with price index number theory, it was decided to use actual prices in this
update. Products are not weighted by retailer in the compilation of indices: each item price index is
formed using the Jevons elementary aggregate formula. Published CPI weights (Beeson J, 2016)
are used to produce higher level aggregates of the 33 item indices.
There are many ways that web scraped price data could be compiled to form a price index. The
high frequency of the data creates additional challenges in this respect. In this section, we first look
at two basic methods of constructing price indices, the daily chained and the unit price index. We
then move on to look at the GEKSJ, which might be more suitable for the type of high frequency
data that is collected by the scrapers. Finally, we look at an index that is constructed in such a way
as to make it as comparable as possible to the published CPI, although the caveats and limitations
above still apply. In particular, for indices that are published on a daily and weekly basis, the gap in
the data in October 2015 is caused by the scraper break, detailed in Box 1, annotated by a dotted
line.
4.1 Daily chained and unit price indices
The first two methods presented here are the daily chained and the unit price index. The daily
chained index is constructed from bilateral daily indices, which are chained together to form a
continuous index. The number of prices that can be included in the index is high because products
only have to be in the sample for each pair of consecutive days. The second is a unit price index,
where an average price is calculated for the period (weekly or monthly), and used to construct a
direct fixed basket index. In contrast to the daily chained, only products which have a unit price in
all periods can be used as a result of this fixed based model. This significantly reduces the number
of prices that can be used in the calculation of the index. It also means that, in the future, the index
will be subject to revisions as more periods of data become available and products drop out of the
sample. The construction of these indices is covered in detail in Appendix A1.2 and A1.3.
Office for National Statistics 18

Research indices using web scraped data: May 2016 update 23/05/2016
Figure 8 shows the daily chained and unit price index presented on a weekly and monthly
frequency. In both the daily chained and unit price index, we see that prices are, on average,
decreasing for both food and non-alcoholic beverages, and alcoholic beverages. Decreasing food
prices are consistent with what has been observed in the CPI, which has seen largely negative
contributions from food prices over the period since February 2015. While we may not expect
these indices to behave in the same way as the CPI (Section 4.3), supermarkets have been
engaged in a price war since the beginning of 2015, and have therefore reduced prices accordingly
to attract consumers. These indices provide evidence for this behaviour.
Figure 8: Comparison of daily chained index with unit price index
Food and non-alcoholic beverages Alcoholic beverages
Weekly: Index 2 June 2014 = 100
Monthly: Index June 2014 = 100
For both food and non-alcoholic beverages, and alcoholic beverages, prices decrease at a similar
level in both the daily chained and unit price indices. For alcoholic beverages, there are some large
price movements in January 2015 and January 2016 for both indices. At the item level, these
changes are predominantly driven by price increases for vodka, rum and whisky. This could be in
part due to the increase in alcohol prices that is generally seen in January following the Christmas
sales (as measured in the CPI).
Office for National Statistics 19
Research indices using web scraped data: May 2016 update 23/05/2016
The unit price index is a fixed base index, and therefore only products which have a unit price in
every period are included in the index calculation (a unit price is calculated if there is at least one
price in the period). This reduces the sample size dramatically. This effect increases as the
frequency increases because higher frequencies mean that products need to match in more
periods. Therefore, we do not calculate the unit price index on a daily basis. The basket refresh
which takes place in January 2015 and January 2016 increases the sample size in line with current
CPI practice. This is, essentially, rebasing the sample and therefore chain links are necessary to
form a continuous time series.
Small samples are not an issue for the daily chained index, which allows us to make use of more
data by matching only on consecutive days. Prices for products which come in and out of stock
frequently will be better captured: products only need to be matched over two days, rather than
over the whole period in the case of the fixed base unit price index. However, sub-annual chaining
on a frequent basis may not be ideal. One solution to this is to use the Gini, Eltetö and Köves, and
Szulc (GEKS) method for chaining. This is explored in more detail in Section 4.2 below.
4.2 GEKSJ index
A GEKS index (originally proposed by Gini, Eltetö, Köves and Szulc) is one possible solution to the
issues with high frequency data discussed in Section 4.1. The GEKS method essentially takes the
geometric mean of all bilateral indices between the base period and the current period (see
Appendix A1.3 for more detail). GEKS indices are free from chaining issues but make use of more
data than the daily chained index, as prices do not have to be matched on consecutive days. Here,
we use the Jevons elementary aggregate formula to calculate the price relative and therefore we
refer to this approach as the GEKS Jevons price index (GEKSJ).
Since the last article, we have made improvements to the way the GEKSJ has been calculated on
our system. We have also carried out further analysis on which method of imputation introduces
the smallest amount of bias into the index, and have concluded that the rules discussed above in
Section 2.4 are sufficient for this purpose. Therefore, the only gap in the GEKSJ time series now is
due to the scraper break in October 2015.
Figures 9A and B show the GEKSJ and the daily chained price index presented on a daily
frequency. In both the GEKSJ and daily chained price index, we see that prices are, on average,
decreasing for both food and non-alcoholic beverages, and alcoholic beverages. Again, this is
consistent with what has been observed over the period since 2015. Both indices show similar
trends over time. At the item level, the level shift at the beginning of the series for food and non-
alcoholic beverages between GEKSJ and the daily chained is caused by a sharp increase in the
price of yoghurt, fromage frais.
It is notable that the GEKSJ series is more volatile than the daily chained price index for alcoholic
beverages over the first half of the time series. Some of the spikes are consistent with scraper
breaks for the Tesco and Sainsbury’s web scrapers, and therefore the GEKSJ time series may be
biased towards more expensive products from the Waitrose scraper. The daily chained may not
pick up on these products because they do not appear on consecutive days, if the scraper break is
only for a day.
Office for National Statistics 20

Research indices using web scraped data: May 2016 update 23/05/2016
Figure 9A: Comparison of GEKSJ and daily chained price indices for food and non-alcoholic beverages: Index 1 June 2014 = 100
88
91
94
97
100
103
106
1/6/14 1/10/14 1/2/15 1/6/15 1/10/15 1/2/16
Daily chained GEKSJ
Figure 9B: Comparison of GEKSJ and daily chained price indices for alcoholic beverages: Index 1 June 2014 = 100
Office for National Statistics 21
Research indices using web scraped data: May 2016 update 23/05/2016
At the item level, most products follow a similar trend for both the GEKSJ and the daily chained. In
particular, the price for strawberries per kg follows a strong seasonal trend in both the GEKSJ and
the daily chained, although the daily chained is at a lag and price increases over the winter months
are slightly subdued compared to the GEKSJ. Seasonality in other fresh fruit and vegetables is
less clear cut.
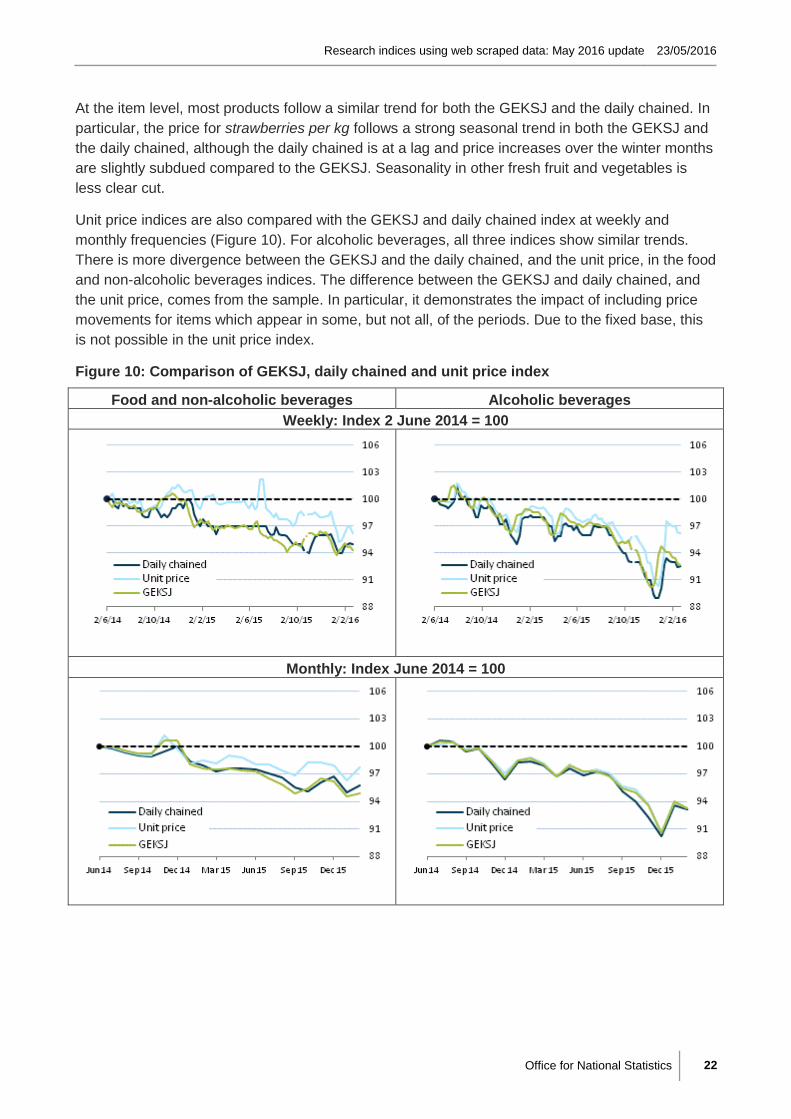
Unit price indices are also compared with the GEKSJ and daily chained index at weekly and
monthly frequencies (Figure 10). For alcoholic beverages, all three indices show similar trends.
There is more divergence between the GEKSJ and the daily chained, and the unit price, in the food
and non-alcoholic beverages indices. The difference between the GEKSJ and daily chained, and
the unit price, comes from the sample. In particular, it demonstrates the impact of including price
movements for items which appear in some, but not all, of the periods. Due to the fixed base, this
is not possible in the unit price index.
Figure 10: Comparison of GEKSJ, daily chained and unit price index
Food and non-alcoholic beverages Alcoholic beverages
Weekly: Index 2 June 2014 = 100
Monthly: Index June 2014 = 100
Office for National Statistics 22

Research indices using web scraped data: May 2016 update 23/05/2016
Misclassifications in the data will affect a GEKSJ index at all time points. This is because a GEKS
index uses all historic information to calculate the current index. A rolling window GEKS (such as
the Rolling Year GEKS, or ‘RYGEKS’ index, proposed by Diewert WE, Fox KJ, and Ivancic L,
2011) would remove erroneous classifications once the window moves past these errors. In future
publications of this research, indices will be revised as classifications improve, so this should not
cause ongoing problems. We are investigating the use of a RYGEKS index, but it is still under
development at this stage due to the short length of the price time series.
4.3 Comparison with CPI
There are many reasons why it is not appropriate to draw direct comparisons between the price
indices presented in the sections above, and the published CPI. These reasons include differences
in:
the data collection techniques,
where the data are collected from,
when the data are collected,
the magnitude of data collected, and
the different sampling techniques.
In the previous article (Breton R, et. al. 2015b), we presented a web scraped CPI that has been
developed to minimise these differences and, hence, be as comparable as possible. There are,
however, still limitations to the extent to which published CPI data can be compared with the web
scraped CPI, which are discussed in more detail in the previous article. However, it is still a useful
exercise to examine the extent to which we can use web scraped data as a possible supplement to
existing data collection, and therefore in this section we update the analysis.
A special aggregate of published CPI item indices is constructed, using only the items that have
been collected in the web scraping pilot. This allows us to compare the web scraped CPI with
published CPI data directly. Nevertheless, despite the steps taken, we would expect the web
scraped CPI and the published CPI to be different, given that many methodological differences
remain.
The results for both the food and non-alcoholic beverages, and alcoholic beverages (shown in
Figures 11A and B respectively), suggest similar trends within both the published CPI and the web
scraped CPI. This is particularly true for the alcoholic beverages indices, which have very similar
dynamics over time with the two indices matching very well between September 2014 and
December 2014, and October 2015 and February 2016. Outside of these periods, the two indices
continue to show similar movements, but with greater differences in the extent to which the price
changes.
Office for National Statistics 23

Research indices using web scraped data: May 2016 update 23/05/2016
Figure 11A: Comparison of CPI for food and non-alcoholic beverages calculated using the
web scraped data and a special aggregate of the published CPI item indices: Index June
2014 = 100
Figure 11B: Comparison of CPI for alcoholic beverages calculated using the web scraped
data and a special aggregate of the published CPI item indices: Index June 2014 = 100
Office for National Statistics 24
Research indices using web scraped data: May 2016 update 23/05/2016
In summary, there are some surprisingly strong similarities between the web scraped CPI and the
published CPI results over the whole time period, despite the many differences in the collection
methods. There are, however, still many problems with the web scraped data and the collection
process. Further work is needed to improve our understanding of the relationship between the web
scraped data and the published CPI data.
5. Conclusions
Since May 2014, we have been scraping prices from the websites of Tesco, Sainsbury’s and
Waitrose. This represents a significant achievement in terms of developing innovative techniques
to make use of alternative sources of price data. Over a period of nearly two years we have
collected around 5,000 price quotes daily for 33 CPI items. This gives us access to unprecedented
volumes of price data.
Since our last published update in September, we have made a number of improvements to the
way we classify and clean the high volume of price data that are collected. We are now using
sophisticated machine learning techniques to identify misclassified items. These results are then
validated using unsupervised cluster based anomaly detection, which returns a much more
accurate and reliable source of price data than that used in previous updates. Further work has
also been carried out on the best method to impute prices in the case of out of stock products or
failures in the web scraping technology.
However, there remain a number of limitations to using this data to construct price indices. In
particular, website changes can take a number of days to fix, which therefore means continuous
time series of prices data are currently unattainable. Compiling data of this nature into price indices
presents a unique set of challenges to the price statistician, which must be resolved before the
data can be put to effective use. The construction of basic chained daily and unit price indices
demonstrates this problem. We may see differences in price levels or price dynamics depending
on the choice of index compilation method or COICOP category.
The GEKSJ index is one proposed solution to high frequency index number problems. Unlike the
unit price index, it makes more use of available data and follows a similar pattern to the daily
chained. However, it looks to be influenced by large price changes, in particular for alcoholic
beverages. This may be due to the impact of scraper breaks on the series, but further research is
required to investigate this.
Finally, we also considered how the data could be used to make comparisons with CPI data. A
web scraped CPI was developed for food and non-alcoholic beverages, and alcoholic beverages.
These followed traditional CPI methodology as closely as possible to minimise differences due to
the data collection method. In this index, we saw a similar long-term trend to published CPI data,
with some differences in price movements.
This work contributes to a growing body of research into large alternative sources of price data,
and its results are useful in developing methods for scanner data, as well as web scraped data.
Despite the issues faced in producing price indices, web scraped data have the potential to deepen
our understanding of price movements in the groceries sector in the medium term and, in the long
term, improve the way prices are collected for national consumer price indices. There remains, of
course, much work to be done in this area.
Office for National Statistics 25
Research indices using web scraped data: May 2016 update 23/05/2016
6. Future work
This section focuses on the planned methodological developments for ONS web scrapers in the
next 6-12 months. We will continue to update price indices on an ad-hoc basis, as and when
progress is made in any of the below areas.
Continuing work is also being undertaken on understanding the extent to which alternative data
sources can supplement and replace the traditional collection for price statistics. This includes
exploring ways to automate aspects of price collection, or assist in collection of attribute
information for hedonic quality adjustment. This work will be covered in a future article.
6.1 Streamlining the data wrangling process
The current process of data wrangling is quite resource intensive and is run in many different
stages (Figure 1, Section 2). Future work will aim to link these together to create an automated
system that can be run in a single process. In particular, the manual checks will feed back into the
training data, so the quality of training data will improve with each check. Fixed algorithms will also
feed into the data extraction stage to correct for common mistakes in the data before the cleaning
stages. For example, a simple check can be run to ensure the units of measurement are correct for
each product.
6.2 Improved cleaning and classification algorithms
Improvements to the current algorithms used to clean and classify will also be investigated. The
current clustering method used to identify erroneous prices requires manual checking to ensure
that new products coming into the sample are not seen as errors. The parameters used can be
optimized to ensure that these errors are reduced, as well as making improvements to the cluster
matching procedure. Further improvements to the training data used for the supervised machine
learning will also be made. Manual checks will also be carried out on a sample of collected data
each month, to check the accuracy of the mapping process.
In addition, the web scrapers are being edited to collect retailer’s product codes4. Using these
codes along with the product description should help to improve the quality of matching, as well as
utilizing more of the available data. We can also increase the collection of product attributes that
means we can utilize more data for the purposes of matching and the formation of clusters.
6.3 Additional development of scrapers
Since the last article was published, the work plan for the web scraping project has changed to
focus more on improving the current web scrapers, rather than expanding the collection to more
CPI items. We have recently been able to solve the infinite scrolling problem on the Waitrose
website, and problems on the Sainsbury’s website have also been resolved. These will be reflected
in the next publication.
4 Product codes can be changed over time. Old product codes can also be reassigned to new items. For this reason
product codes are unsuitable as the sole identifier for matching.
26Office for National Statistics
Research indices using web scraped data: May 2016 update 23/05/2016
6.4 Publication of new indices on a more timely basis
We are currently working with ONS digital team to develop a method of publishing more timely
experimental indices on the ONS website. Further, we are planning to explore the possibility of
new regular outputs such as the daily indices, and what the interpretation of these should be.
6.5 New methodology
We are working on a new methodology which is an alternative approach to aggregating large data
sets into price indices: Clustering Large datasets Into Price (CLIP) indices. The CLIP uses all the
data available by creating groups (or clusters) of similar products and calculating the price change
of these groups over time. The CLIP will continue to be developed and applied to the web scraped
grocery data.
We are also working with a number of academics to develop new methods of calculating price
change. For example, researchers have recently built a time series model of price change using
our web scraped data.
Finally, we are continuing to investigate applying existing prices methodology to our data.
Research by other National Statistics Institutes such as the Netherlands and New Zealand has
suggested a number of other alternative methods of calculating price indices. For example, the
FEWS index (fixed effects with a window splice) has been developed in New Zealand and applied
to web scraped electronics data with promising results (Krsinich F, 2014).
6.6 New data sources for web scraping
ONS purchased a sample of web scraped data covering the period January 2012 – December
2014. These data cover the same 33 items, and enables us to compare our web scraped data with
that scraped by a private sector company, who have been running their web scrapers for many
years. Early research looks promising, and we are now in the process of purchasing more data to
enable a longer comparison between the two sources.
This work will feed through into a project that looks at the different options for web scraping, in
particular whether we should continue with our in-house web scrapers for grocery prices, or look to
a third party to source the data in the future.
7. References
Bird D, et. al. (2014): ‘Initial report on experiences with scanner data in ONS’, [online], [accessed
16 May 2016], available from: http://www.ons.gov.uk/ons/rel/cpi/consumer-price-indices/initial
report-on-experiences-with-scanner-data-in-ons/index.html
Beeson J (2016): ‘Consumer prices index and retail prices index - updating weights, 2016’, [online],
[accessed 16 May 2016], available from:
https://www.ons.gov.uk/economy/inflationandpriceindices/articles/consumerpricesindexandretailpri
cesindexupdatingweights/2016
Bean C (2016): ‘Independent Review of UK Economic Statistics’, [online], [accessed 8 April 2016],
available at: https://www.gov.uk/government/publications/independent-review-of-uk-economic
statistics-final-report
Office for National Statistics 27

Research indices using web scraped data: May 2016 update 23/05/2016
Breton R, et. al. (2015a): ‘Trial consumer price indices using web scraped data’, [online], [accessed
8 April 2016], available at:
http://webarchive.nationalarchives.gov.uk/20160105160709/http://www.ons.gov.uk/ons/rel/cpi/cons
umer-price-indices/experimental-consumer-price-indices-using-web-scraped-data/index.html
Breton R, et. al. (2015b): ‘Research indices using web scraped data, [online], [accessed 8 April
2016], available at: http://www.ons.gov.uk/ons/rel/cpi/consumer-price-indices/research-indices
using-web-scraped-price-data/index.html
Diewert WE, Fox KJ, Ivancic L (2011): ‘Scanner Data, Time Aggregation and the Construction of
Price Indexes’, Journal of Econometrics 161 pp 24-35
Johnson P (2015): ‘UK Consumer Price Statistics: A Review’, [online], [accessed 8 April 2016],
available at: http://www.statisticsauthority.gov.uk/reports---correspondence/current-reviews/range
of-prices-statistics.html
Kantar World Panel (2016): ‘Grocery Market Share, GB’, [online], [accessed 12 May 2016],
available at: http://www.kantarworldpanel.com/en/grocery-market-share/great-britain
Krsinich F (2014): ‘The FEWS index: Fixed effects with a window splice; non-revisable quality-
adjusted price indexes with no characteristic information’, [online], [accessed 16 May 2016],
available at:
http://www.unece.org/fileadmin/DAM/stats/documents/ece/ces/ge.22/2014/New_Zealand_
_FEWS.pdf
Mayhew M, Clews G (2016): ‘Using machine learning techniques to clean web scraped price data
via cluster analysis’, ONS Survey Methodology Bulletin No.75 ‘Article in press’
Mayhew M (2016): ‘Imputing web scraped prices’, [online], [accessed 23 May 2016], available at:
https://www.ons.gov.uk/file?uri=/economy/inflationandpriceindices/methodologies/imputingwebscra
pedprices/imputingwebscrapedpricesmayhewm.pdf
ONS (2014): ‘Consumer price indices – technical manual’, [online], [accessed 16 May 2016],
available at: http://www.ons.gov.uk/ons/rel/cpi/consumer-price-indices---technical
manual/2014/index.html
Appendix 1: Methodology
A1 Daily indices
For all Daily Indices, the price variable is the actual price of the product on that day.
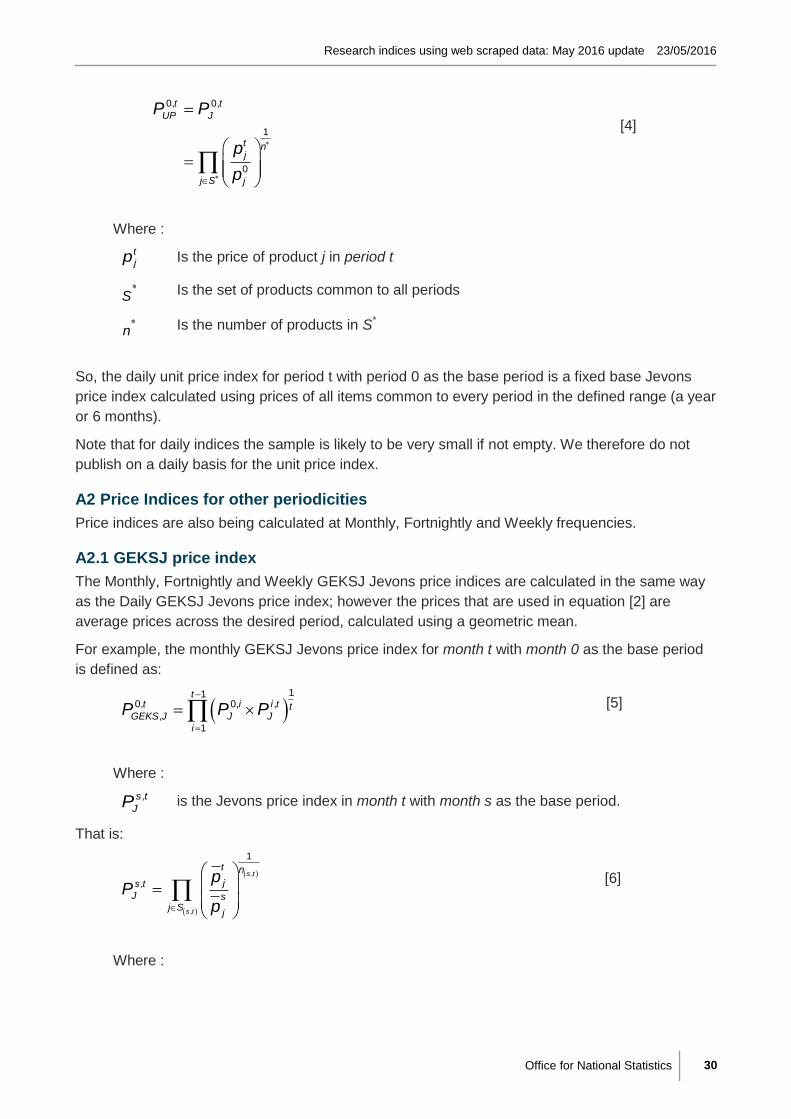
A1.1 GEKSJ Jevons (GEKSJ) price index
The GEKSJ price index for period t with period 0 as the base period is defined as:
11
0, 0, , 1,
1
tt i i t t
GEKS J J J
i
P P P
[1]
Where :
Office for National Statistics 28

Research indices using web scraped data: May 2016 update 23/05/2016
,s t
JP is the Jevons price index in period t with period s as the base period.
That is:
,
,
1
,s t
s t
t njs t
J sj S j
pP
p
[2]
Where :
t
jp Is the price of product j in period t
,s tS
,s tn
Is the set of products common to both period s and period t
Is the number of products in S(s,t)
So, the GEKSJ Jevons price index for period t with period 0 as the base period is the geometric
mean of the chained Jevons price indices between period 0 and period t with every intermediate
point (i = 1,...,t-1) as a link period.
Note that the GEKSJ Jevons price index uses prices for any products that are common to each
pair of periods (S(s,t)).
A1.2 Daily Chained Jevons Price index
The Daily Chained Jevons Price index or period t with period 0 as the base period is defined as:
0, 0, 1 1,
1,
1
t t t t
DC DC J
ti i
J
i
P P P
P
[3]
Where :
,s t
JP is the Jevons price index in period t with period s as the base period as
defined in equation 2 above.
So, in each period, the daily chained Jevons price index for period t with period 0 as the base
period is the Jevons price index for period t with period t-1 as the base period, multiplied by the
daily chained Jevons price index for period t-1 with period 0 as the base period.
The daily chained Jevons price index is constructed from daily Jevons price indices, where the
index for each day is based on the previous day using prices of all items common to the two
periods.
A1.3 Unit price index
A daily unit price index is equivalent to a fixed basket Jevons Price Index, that is:
Office for National Statistics 29
Research indices using web scraped data: May 2016 update 23/05/2016
[4]
0, 0,
1
0
t t
UP J
t nj
j S j
P P
p
p
Where :
t
jp
S
n
Is the price of product j in period t
Is the set of products common to all periods
Is the number of products in S*
So, the daily unit price index for period t with period 0 as the base period is a fixed base Jevons
price index calculated using prices of all items common to every period in the defined range (a year
or 6 months).
Note that for daily indices the sample is likely to be very small if not empty. We therefore do not
publish on a daily basis for the unit price index.
A2 Price Indices for other periodicities
Price indices are also being calculated at Monthly, Fortnightly and Weekly frequencies.
A2.1 GEKSJ price index
The Monthly, Fortnightly and Weekly GEKSJ Jevons price indices are calculated in the same way
as the Daily GEKSJ Jevons price index; however the prices that are used in equation [2] are
average prices across the desired period, calculated using a geometric mean.
For example, the monthly GEKSJ Jevons price index for month t with month 0 as the base period
is defined as:
11
0, 0, ,
,
1
tt i i t t
GEKS J J J
i
P P P [5]
Where :
,s t
JP is the Jevons price index in month t with month s as the base period.
That is:
,
,
1
,s t
s t
t n
js t
J sj S
j
pP
p
[6]
Where :
Office for National Statistics 30

Research indices using web scraped data: May 2016 update 23/05/2016
Is the geometric mean of the nt daily prices (k = 1…nt) of product j in
month t
1
t
t k nj j
k t
p p
,s tS
,s tn
Is the set of products common to both month s and month t
Is the number of products in S(s,t)
A2.2 Daily Chained Jevons Price Index
The Monthly, Fortnightly and Weekly versions of the Daily Chained Jevons Price index take the
geometric mean of the value of the Daily Chained Jevons Price index across the Month, Fortnight
or Week respectively.
A2.3 Unit Price Index
The Monthly, Fortnightly and Weekly unit price indices are calculated in the same way as the Daily
unit price index; however the prices that are used in equation [4] are average prices across the
desired period, calculated using a geometric mean. That is:
0, 0,
1
0
t t
UP J
t n
j
j Sj
P P
p
p
[7]
Where :
1
t
t k nj j
k t
p p
S
n
Is the geometric mean of the nt daily prices (k = 1…nt) of product j
in month t
Is the set of products common to all periods
Is the number of products in S*
A3 CPI (using web scraped data)
Sampling by index day
The CPI collection takes place on the second or third Tuesday of every month. To emulate this,
web-scraped data is sub-setted on these dates.
Classification problems
The web scrapers collect all products under a supermarket's product classification; for example,
the scraper will navigate to 'Whisky' on the supermarket's website and then collect all the products
under this classification. Unfortunately, the supermarkets frequently put other products under
'Whisky', such as Rum. This is a common issue across the supermarket categories. For these
series, the misclassifications were removed using the experimental automated machine learning
Office for National Statistics 31
Research indices using web scraped data: May 2016 update 23/05/2016
algorithm discussed in section 7.1. The classification was then checked manually for this sample to
ensure accuracy.
Basket update
The CPI basket of goods and services is updated once a year in February, and the associated
weights above item level are updated once a year in January. To emulate this process the same
approach is taken with the web scraped CPI.
Tracking products through time
In an attempt to emulate the CPI local collection, each specific web scraped product collected from
a specific retailer is followed from one month to the next. This restricts the web scraped products
used to those that have been collected every month (for the 2014 and 2015 baskets separately). If
a product is considered to have missing data, then it is not used in index construction. This enables
every product to be followed. It is important to note that this approach effectively retrospectively
matches products across time, and it will result in revisions as more time periods are included. This
approach is not employed in the production of the CPI.
Missing data
In order to increase the number of products that can be followed through time, a variety of
techniques are employed to handle missing data. These approximate current CPI processes for
handling missing data as closely as possible. This also increases the sample size and reduces the
probability of Not Missing At Random (NMAR) products introducing bias into the sample. These
techniques are:
Product description. Product descriptions collected by the web scraper are used to follow items
through time. However, supermarkets make regular changes to their product descriptions, and
this does not necessarily imply a change in the products quality, function or appearance. To
reduce the number of times this occurs, any unnecessary words within the product description
are removed; for example, the shop's name.
Collect across three days. The Consumer Price Indices Technical Manual (ONS, 2014) states
that, "in practice, local collection for the CPI, CPIH, RPI and RPIJ is carried out on the day
before and day after Index Day as well as Index Day, as it is not practically possible to collect
every price in one day. If it is not possible to collect a product on index day, the CPI collection
would collect on the next day" (apart from fresh fruit and vegetables, which are always collected
on index day itself). For the web scraped data, when a product is not collected on index day, the
product is searched for the day after Index day, and then the day before index day.
Comparable replacements. ONS (2014, p.32) also states that, "if a chosen product is
temporarily out of stock, no price is recorded and a T code is used. If it is out of stock for three
consecutive months, the collector should choose a replacement product which matches the item
description". The replacement product chosen by the CPI price collectors are as similar as
possible to the original item chosen in that store.
A similar process using big data techniques is put in place for the web scraped data. When a
product is not available on either index day, the day after index day, or the day before index
day, a comparable replacement is identified within the same category of product, and from the
same supermarket, from these three days. The replacement can be selected from the pool of
Office for National Statistics 32

Research indices using web scraped data: May 2016 update 23/05/2016
matched or unmatched products. To choose a comparable replacement, the product description
of the missing product is compared to each of the potential replacement items' product
description. This comparison is conducting using fuzzy string matching (from the Fuzzywuzzy
library in Python). This measures the size of the differences between strings (product
descriptions). In cases when a sufficient match is not available from any of the three days
around index day, no comparable replacement is made and the product is still classed as
missing.
Temporarily missing. As stated above, if a product is missing from the CPI local collection, it is
considered temporarily missing for three consecutive months. When this occurs the price from
the previous month is used as a temporary price for this product. If there are still missing data
after each of the previously discussed methods have been applied, then this approach is used.
For the web scraped data, however, only one month of prices is brought forward. This is to
minimise the introduction of fabricated stability, caused by the high churn rate of web scraped
products.
Complete-case. If, after applying each of the previous methods, a product is still considered to
have missing data, then this product is not used. This enables every product to be followed
across time and, hence, broadly comparable to CPI methodology.
Compilation
Price indices are compiled at the lower level using the geometric mean of price relatives (the
Jevons formula): Equation 2 above setting s = 0.
A4 Aggregation
Indices for higher level aggregates are constructed from lower level indices using published CPI
expenditure weights, wk (Beeson J, 2016). This is applied consistently to all index types described
above. For any index: ,
t
X kP where X is the index type (Daily Chained, GEKSJ, Unit Price, etc.), and
k is the COICOP Class (or Group) belonging to COICOP Group (or Division) K, the higher level
Index is constructed as:
0, 0,
, ,
t tkX K X k
k K k
k K
wP P
w
[8]
Expenditure weights are applied to the unchained indices. 2014 weights are used from June 2014
to January 2015, 2015 weights are used from January 2015 to January 2016, and 2016 weights
are used from January 2016 to February 2016. The resulting aggregates are then chained at
COICOP Division level. In the weekly and fortnightly series, 2015 weights are introduced in week
commencing 29 December 2015 and 2016 weights are introduced in the week commencing 28
December 2016. At the Division level, a single chain link is applied for most index types in January
2015 and January 2016. For the two CPI Series (Section 4.3) a double chain link is used in
January and February, as in the CPI. The single and double chain links are described in detail in
the CPI technical manual (ONS, 2014).
Office for National Statistics 33

Research indices using web scraped data: May 2016 update 23/05/2016
A5 Basket Refresh and Linking
For the May 2016 publication, price indices will be calculated for the period June 2014 to February
2016 inclusive.
For the Unit Price Index, the longer the time span for which indices are calculated, the smaller the
sample of available prices. This is because indices are calculated for a common sample of
products. To address this it was decided to update the sample each January and link the series
together. This process also occurs in the CPI calculated using the web scraped data.
Office for National Statistics 34