RESEARCH Cap & Discount Rate Report - SAPOA · The latest SAPOA Cap & Discount Rate Survey...
17
RESEARCH Cap & Discount Rate Report
Transcript of RESEARCH Cap & Discount Rate Report - SAPOA · The latest SAPOA Cap & Discount Rate Survey...

RESEARCHCap & Discount Rate Report

T: (011) 883 0679 F: (011) 883 0684Email: [email protected]: www.sapoa.org.za
Key Research Findings
The latest SAPOA Cap & Discount Rate Survey indicates that for the six months to May 2017, the All Property discount rate strengthened slightly to 14.3% from 14.6% in November while the aggregate cap rate strengthened by 40bps to 9.0%.
South Africa’s long bond yield has now weakened by 160bps since May 2013– a move which isn’t yet being mirrored by capitalisation & discount rates although these moved down in line with bond yields during the past 6 months.
While the recent inflation drop and rand stability has strengthened the case for an interest rate cut, the SA Reserve Bank kept rates on hold during its May MPC meeting citing weak domestic growth and the recent credit downgrades as near term concerns.
Supporting this notion is the fact that the latest IPD figures suggest that valuers aren’t passing the full rental growth achieved by properties through to its capital growth- implying negative sentiment among valuers.
The fact that capitalisation and discount rates haven’t followed the long bond yield since mid-2013 raises some questions around the current pricing of risk.
History has shown just how volatile the long bond yield can be – and just how quick and steep the move in it can be- and a weakening bond yield remains a downside risk to property valuations given its sensitivity to external variables such as the exchange rate and capital flows.
The current spread between the cap rate and long bond yield, though expanded since November 2016, still suggests limited room for yield compression – in other words limited room for further capital upside as a result of a re-pricing of risk.
The aggregate discount rate strengthened by 30bps over the past six months but an analysis of the underlying property types suggests a mixed picture with almost as many segments weakening as there are strengthening.
Discount rate declines were also reported for decentralised offices, light manufacturing and warehousing which indicates the lower relative return investors are demanding from assets with a lower perceived risk.
While valuers have ratcheted up their assumptions around perpetual cost growth over the past several years the most recent six month period saw minimal adjustments to assumed operating cost growth as Eskom’s modest 2.2% tariff increase comes into effect on the 1st of July 2017.
On a segment level, the Retail Warehouse and lower grade office segments saw increases in their assumed operating cost growth.
Decentralised offices and most industrial segments saw some uptick in their perpetual market rental growth assumption which could result in a re-rating down the line as valuers are seemingly taking a more bullish view of the segment’s fundamental factors.
MAY 2017CAP & DISCOUNT RATE REPORT
02

T: (011) 883 0679 F: (011) 883 0684Email: [email protected]: www.sapoa.org.za
The latest SAPOA Cap & Discount Rate Survey indicates that for the six months to May 2017, the All Property discount rate strengthened slightly to 14.3% from 14.6% in November while the aggregate cap rate strengthened by 40bps to 9.0% (Figure 1).
South Africa’s long bond yield has now weakened by 160bps since May 2013– a move which isn’t yet being mirrored by capitalisation & discount rates although these moved down in line with bond yields during the past 6 months.
While the recent inflation drop and rand stability has strengthened the case for an interest rate cut, the SA Reserve Bank kept rates on hold during its May MPC meeting citing weak domestic growth and the recent credit downgrades as near term concerns.
Supporting this notion is the fact that the latest IPD figures suggest that valuers aren’t passing the full rental growth achieved by properties through to its capital growth- implying negative sentiment among valuers.
On aggregate, capital growth grew by 2.6% for the 12 months ended December 2016 while basic rental grew by 6.2% during this period – leaving 360bps of return on the table. The reason for this may vary depending on the asset but quality assets could be seen as fully priced currently while secondary assets’ fundamentals aren’t as strong with higher vacancy rates and weaker rental growth prospects.
Cap & discount rates appear to have bottomed out
Fig 1: Long term trend – Valuation metrics1995-2017
7,0%
8,6%
5,0%
7,0%
9,0%
11,0%
13,0%
15,0%
17,0%
19,0%
21,0%
23,0%
95 97 99 01 03 05 07 09 11 13 15
Discount Rate Cap Rate Long bond yield
Source: MSCI Real Estate
Fig 1: Long term trend – Valuation metrics1995-2017
MAY 2017CAP & DISCOUNT RATE REPORT
03

T: (011) 883 0679 F: (011) 883 0684Email: [email protected]: www.sapoa.org.za
The fact that capitalisation and discount rates haven’t followed the long bond yield since mid-2013 raises some questions around the current pricing of risk. The current spread between the All Property discount rate and long bond yield implies a lower level of market risk – or in other words, investors demanding a lower return in excess of the riskless rate. The current spread is similar to that of 2006/07 when real GDP growth exceeded 5%. (Figure 2).
History has shown just how volatile the long bond yield can be – and just how quick and steep the move in it can be- and a weakening bond yield remains a downside risk to property valuations given its sensitivity to external variables such as the exchange rate and capital flows.
The current spread between the cap rate and long bond yield, though expanded since November 2016, still suggests limited room for yield compression – in other words limited room for further capital upside as a result of a re-pricing of risk (Figure 3). The current cap rate/long bond differential is not too far off the levels recorded at the top of the economic cycle in 2007 – but without the same robust macroeconomic fundamentals raising questions around the current level of pricing.
While the current perceived mispricing in the market isn’t necessarily going to lead to a correction in capital values, it is something to be aware of as we approach the peak of the current interest rate up-cycle and places an increased emphasis on factors that have the potential to offset value declines such as higher retention rates, longer leases and tight operating cost management.
Weakening long bond yield remains a risk
3,00%
4,00%
5,00%
6,00%
7,00%
8,00%
9,00%
95 97 99 01 03 05 07 09 11 13 15
Lower perceived near term riskLower return demanded in excess of riskless rate
Higher perceived near term risk
Recession
-2,00%
-1,00%
0,00%
1,00%
2,00%
3,00%
4,00%
95 97 99 01 03 05 07 09 11 13 15
Fig 3: Limited room for yield compressionCap Rate/Long bond yield Spread
More room for yield compression
Limited room for yield compression
Fig 2: Lower risk demanded in excess of risk free rate – despite economic & policy headwindsDiscount Rate/Long bond yield Spread
Fig 3: Limited room for yield compressionCap Rate/Long bond yield Spread
Source: MSCI Real Estate, SAPOA, SARB
MAY 2017CAP & DISCOUNT RATE REPORT
04
T: (011) 883 0679 F: (011) 883 0684Email: [email protected]: www.sapoa.org.za
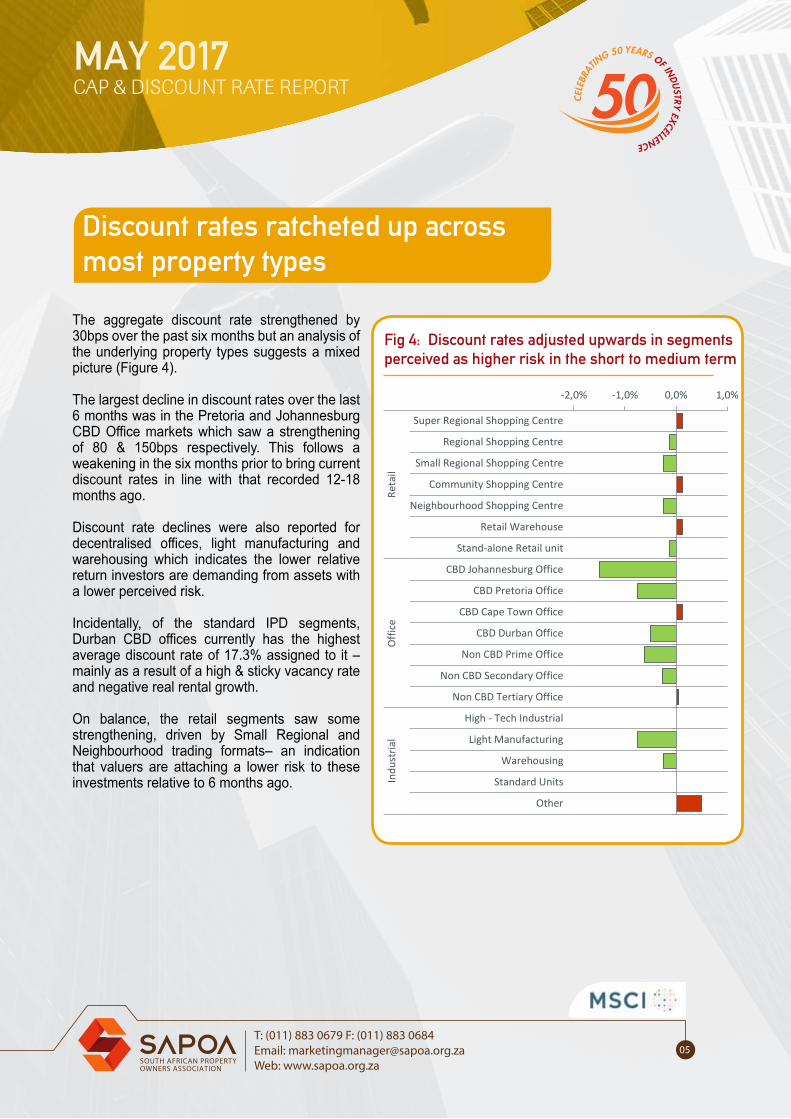
The aggregate discount rate strengthened by 30bps over the past six months but an analysis of the underlying property types suggests a mixed picture (Figure 4).
The largest decline in discount rates over the last 6 months was in the Pretoria and Johannesburg CBD Office markets which saw a strengthening of 80 & 150bps respectively. This follows a weakening in the six months prior to bring current discount rates in line with that recorded 12-18 months ago.
Discount rate declines were also reported for decentralised offices, light manufacturing and warehousing which indicates the lower relative return investors are demanding from assets with a lower perceived risk.
Incidentally, of the standard IPD segments, Durban CBD offices currently has the highest average discount rate of 17.3% assigned to it – mainly as a result of a high & sticky vacancy rate and negative real rental growth.
On balance, the retail segments saw some strengthening, driven by Small Regional and Neighbourhood trading formats– an indication that valuers are attaching a lower risk to these investments relative to 6 months ago.
Discount rates ratcheted up across most property types
-2,0% -1,0% 0,0% 1,0%
Super Regional Shopping Centre
Regional Shopping Centre
Small Regional Shopping Centre
Community Shopping Centre
Neighbourhood Shopping Centre
Retail Warehouse
Stand-alone Retail unit
CBD Johannesburg Office
CBD Pretoria Office
CBD Cape Town Office
CBD Durban Office
Non CBD Prime Office
Non CBD Secondary Office
Non CBD Tertiary Office
High - Tech Industrial
Light Manufacturing
Warehousing
Standard Units
Other
Reta
ilO
ffice
Indu
stria
l
Fig 4: Discount rates adjusted upwards in segments perceived as higher risk in the short to medium term
MAY 2017CAP & DISCOUNT RATE REPORT
05

T: (011) 883 0679 F: (011) 883 0684Email: [email protected]: www.sapoa.org.za
While valuers have ratcheted up their assumptions around perpetual cost growth over the past several years the most recent six month period saw minimal adjustments to assumed operating cost growth (Figure 6) as Eskom’s modest 2.2% tariff increase comes into effect on the 1st of July 2017.
On a segment level, the Retail Warehouse and lower grade office segments saw increases in their assumed operating cost growth.
Decentralised offices and most industrial segments saw some uptick in their perpetual market rental growth assumption which could result in a re-rating down the line as valuers are seemingly taking a more bullish view of the segment’s fundamental factors.
Cost growth assumption up– rental growth flat
4,50%
5,50%
6,50%
7,50%
8,50%
9,50%
08 09 10 11 12 13 14 15 16 17
Estimated market rental growth
Estimated market operating cost growth
Fig 5: Perpetual operating cost growth assumption ticking up while market rental growth assumption is flat
-2,0% 0,0% 2,0%
Super Regional Shopping Centre
Regional Shopping Centre
Small Regional Shopping Centre
Community Shopping Centre
Neighbourhood Shopping Centre
Retail Warehouse
Stand-alone Retail unit
CBD Johannesburg Office
CBD Pretoria Office
CBD Cape Town Office
CBD Durban Office
Non CBD Prime Office
Non CBD Secondary Office
Non CBD Tertiary Office
High - Tech Industrial
Light Manufacturing
Warehousing
Standard Units
Other
Reta
ilO
ffice
Indu
stria
l
Assumed market rental growth Assumed operating cost growth
Fig 6: Cost assumptions ratcheted up in most office & industrial segments
MAY 2017CAP & DISCOUNT RATE REPORT
06

T: (011) 883 0679 F: (011) 883 0684Email: [email protected]: www.sapoa.org.za
Property Type
Reta
ilO
ffice
Indu
stria
lO
ther
Min Max Median Average
Super Regional Shopping CentreRegional Shopping CentreSmall Regional Shopping CentreCommunity Shopping CentreNeighbourhood Shopping CentreRetail WarehouseStand alone Retail unitAll Retail
CBD Johannesburg OfficeCBD Pretoria OfficeCBD Cape Town OfficeCBD Durban OfficeNon CBD Prime OfficeNon CBD Secondary OfficeNonCBD Tertiary OfficeAll Office
High -Tech IndustrialLight ManufacturingWarehousingStandard UnitsAll Industrial
13,8%14,0%13,5% 14,0%
15,0%
13,5%13,5%12,5%13,2%13,5%13,0%15,0%
12,3%12,5%11,5%12,8%13,3%13,0%14,0%
16,5%16,0%19,0%17,0%
15,0%
17,0%17,0%16,5%17,3%15,8%17,0%17,0%
13,5%13,8%17,5%16,5%16,0%17,0%14,8%
14,0%14,5%14,5%15,0%
15,0%
15,0%15,3%14,6%15,5%13,9%14,6%16,0%
12,5%12,8%13,3%13,8%14,0%14,1%14,4%
14,5%14,8%15,2%15,3%
15,0%
15,4%15,3%14,6%15,3%14,2%14,8%16,0%
12,6%12,9%13,7%14,0%14,3%14,6%14,4%
Other
Market Discount Rate
MAY 2017CAP & DISCOUNT RATE REPORT
07
T: (011) 883 0679 F: (011) 883 0684Email: [email protected]: www.sapoa.org.za
Reta
ilO
ffice
Indu
stria
lO
ther
Super Regional Shopping CentreRegional Shopping CentreSmall Regional Shopping CentreCommunity Shopping CentreNeighbourhood Shopping CentreRetail WarehouseStand alone Retail unitAll Retail
CBD Johannesburg OfficeCBD Pretoria OfficeCBD Cape Town OfficeCBD Durban OfficeNon CBD Prime OfficeNon CBD Secondary OfficeNonCBD Tertiary OfficeAll Office
High -Tech IndustrialLight ManufacturingWarehousingStandard UnitsAll Industrial
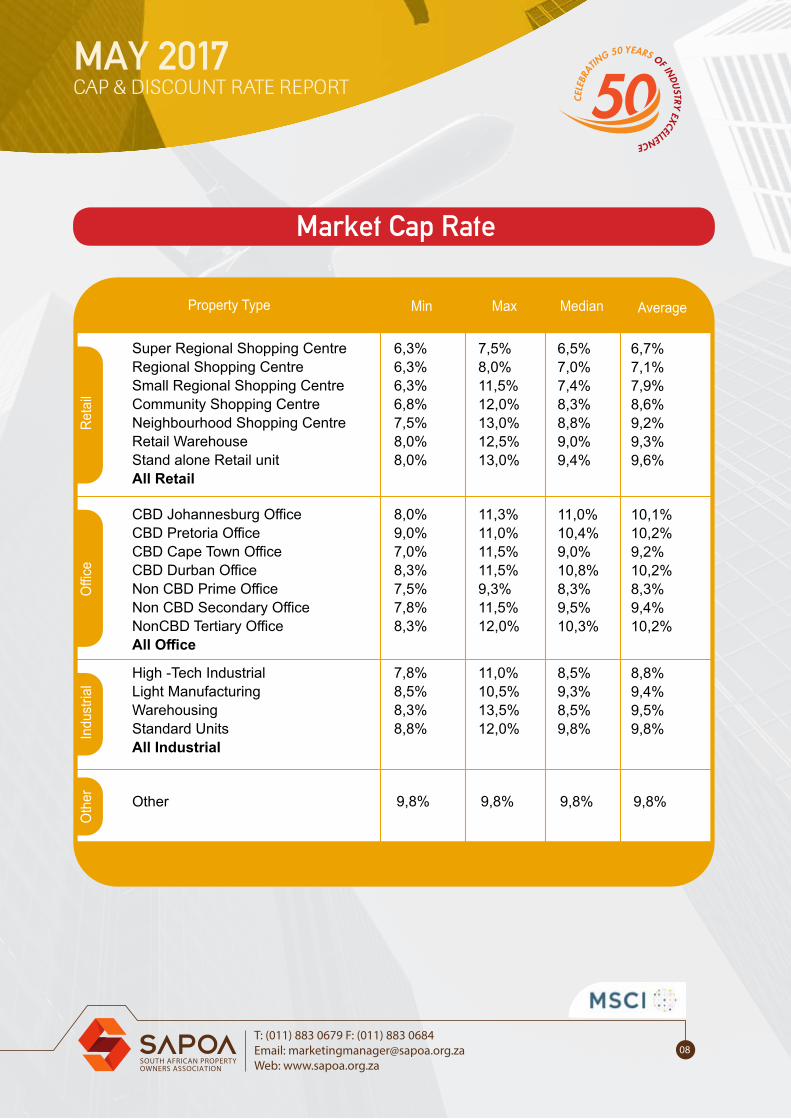
7,8%8,5%8,3%8,8%
9,8%
8,0%9,0%7,0%8,3%7,5%7,8%8,3%
6,3%6,3%6,3%6,8%7,5%8,0%8,0%
11,0%10,5%13,5%12,0%
9,8%
11,3%11,0%11,5%11,5%9,3%11,5%12,0%
7,5%8,0%11,5%12,0%13,0%12,5%13,0%
8,5%9,3%8,5%9,8%
9,8%
11,0%10,4%9,0%10,8%8,3%9,5%10,3%
6,5%7,0%7,4%8,3%8,8%9,0%9,4%
8,8%9,4%9,5%9,8%
9,8%
10,1%10,2%9,2%10,2%8,3%9,4%10,2%
6,7%7,1%7,9%8,6%9,2%9,3%9,6%
Other
Market Cap Rate
Property Type Min Max Median Average
MAY 2017CAP & DISCOUNT RATE REPORT
08

T: (011) 883 0679 F: (011) 883 0684Email: [email protected]: www.sapoa.org.za
Reta
ilO
ffice
Indu
stria
lO
ther
Super Regional Shopping CentreRegional Shopping CentreSmall Regional Shopping CentreCommunity Shopping CentreNeighbourhood Shopping CentreRetail WarehouseStand alone Retail unitAll Retail
CBD Johannesburg OfficeCBD Pretoria OfficeCBD Cape Town OfficeCBD Durban OfficeNon CBD Prime OfficeNon CBD Secondary OfficeNonCBD Tertiary OfficeAll Office
High -Tech IndustrialLight ManufacturingWarehousingStandard UnitsAll Industrial
5,0%5,0%4,0%3,0%
5,5%
5,0%5,0%4,8%5,0%5,5%5,0%5,0%
6,0%5,0%5,0%5,0%5,0%4,5%4,5%
8,0%8,0%8,0%8,0%
5,5%
6,0%8,0%8,0%6,0%8,0%8,0%8,0%
7,0%8,0%7,0%6,0%8,0%8,0%8,0%
6,0%6,0%6,0%6,0%
5,5%
5,5%5,8%6,0%5,3%6,0%6,0%6,0%
6,0%6,0%5,9%5,9%6,0%6,0%6,0%
6,0%6,1%6,1%5,9%
5,5%
5,6%6,1%6,3%5,4%6,2%6,0%6,3%
6,2%6,1%5,8%5,6%6,1%6,1%6,1%
Other
Market Rental Growth Rate
Property Type Min Max Median Average
MAY 2017CAP & DISCOUNT RATE REPORT
9

T: (011) 883 0679 F: (011) 883 0684Email: [email protected]: www.sapoa.org.za
Reta
ilO
ffice
Indu
stria
lO
ther
Super Regional Shopping CentreRegional Shopping CentreSmall Regional Shopping CentreCommunity Shopping CentreNeighbourhood Shopping CentreRetail WarehouseStand alone Retail unitAll Retail
CBD Johannesburg OfficeCBD Pretoria OfficeCBD Cape Town OfficeCBD Durban OfficeNon CBD Prime OfficeNon CBD Secondary OfficeNonCBD Tertiary OfficeAll Office
High -Tech IndustrialLight ManufacturingWarehousingStandard UnitsAll Industrial
6,5%6,5%5,3%6,5%
7,5%
7,0%6,0%6,0%7,3%7,0%6,0%6,0%
7,0%7,0%7,0%7,0%7,0%7,0%7,0%
8,0%8,0%8,0%8,0%
7,5%
7,5%9,0%8,0%7,5%8,0%8,0%8,0%
7,5%8,0%8,0%8,0%8,0%8,0%8,0%
7,0%7,3%7,0%7,0%
7,5%
7,0%7,0%7,0%7,4%7,0%7,1%7,3%
7,0%7,0%7,0%7,0%7,0%7,5%7,3%
7,3%7,3%7,1%7,2%
7,5%
7,1%7,3%7,2%7,4%7,3%7,2%7,3%
7,1%7,3%7,2%7,2%7,4%7,4%7,4%
Other
Property Expenditure Growth
Property Type Min Max Median Average
MAY 2017CAP & DISCOUNT RATE REPORT
10

T: (011) 883 0679 F: (011) 883 0684Email: [email protected]: www.sapoa.org.za
Reta
ilO
ffice
Indu
stria
lO
ther
Super Regional Shopping CentreRegional Shopping CentreSmall Regional Shopping CentreCommunity Shopping CentreNeighbourhood Shopping CentreRetail WarehouseStand alone Retail unitAll Retail
CBD Johannesburg OfficeCBD Pretoria OfficeCBD Cape Town OfficeCBD Durban OfficeNon CBD Prime OfficeNon CBD Secondary OfficeNonCBD Tertiary OfficeAll Office
High -Tech IndustrialLight ManufacturingWarehousingStandard UnitsAll Industrial
8,3%9,0%8,5%9,3%
11,5%
8,5%8,5%9,5%7,5%8,0%8,3%8,8%
6,5%6,8%6,8%7,3%8,0%8,5%8,5%
11,5%11,0%14,0%12,5%
11,5%
13,5%11,8%11,0%12,0%10,3%12,0%12,5%
8,0%8,5%12,0%12,5%13,5%13,0%13,5%
9,5%9,3%9,0%10,4%
11,5%
11,5%11,3%9,6%11,8%8,4%9,3%11,8%
7,0%7,5%7,6%8,5%9,3%9,1%9,3%
9,7%9,9%10,3%10,5%
11,5%
10,9%10,7%9,9%10,4%8,8%9,7%11,0%
7,1%7,5%8,3%9,0%9,7%9,9%10,1%
Other
Exit Cap Rate
Property Type Min Max Median Average
MAY 2017CAP & DISCOUNT RATE REPORT
11

T: (011) 883 0679 F: (011) 883 0684Email: [email protected]: www.sapoa.org.za
Property Type
Reta
ilO
ffice
Indu
stria
lO
ther
Total
Super Regional Shopping CentreRegional Shopping CentreSmall Regional Shopping CentreCommunity Shopping CentreNeighbourhood Shopping CentreRetail WarehouseStand alone Retail unitAll Retail
CBD Johannesburg OfficeCBD Pretoria OfficeCBD Cape Town OfficeCBD Durban OfficeNon CBD Prime OfficeNon CBD Secondary OfficeNonCBD Tertiary OfficeAll Office
High -Tech IndustrialLight ManufacturingWarehousingStandard UnitsAll Industrial
9131014
3
825
23172
3411111055
Other
Number of Transactions
MAY 2017CAP & DISCOUNT RATE REPORT
12

T: (011) 883 0679 F: (011) 883 0684Email: [email protected]: www.sapoa.org.za
For more than 40 years, MSCI’s research-based indexes and analytics have helped the world’s leading investors build and manage better portfolios.
Clients rely on our offerings for deeper insights into the drivers of performance and risk in their portfolios, broad asset class coverage and innovative research.
Our line of products and services includes indexes, analytical models, data, real estate benchmarks and ESG research.
MSCI serves 98 of the top 100 largest money managers, according to the most recent P&I ranking.
For more information, visit us at www.msci.com
Report compiled by:
ABOUT MSCI
MAY 2017CAP & DISCOUNT RATE REPORT
13

T: (011) 883 0679 F: (011) 883 0684Email: [email protected]: www.sapoa.org.za
NOTICE AND DISCLAIMERThis document and all of the information contained in it, including without limitation all text, data, graphs, charts (collectively, the “Information”) is the property of MSCI Inc. or its subsidiaries (collectively, “MSCI”), or MSCI’s licensors, direct or indirect suppliers or any third party involved in making or compiling any Information (collectively, with MSCI, the “Information Providers”) and is provided for informational purposes only. The Information may not be modified, reverse-engineered, reproduced or redisseminated in whole or in part without prior written permission from MSCI.
The Information may not be used to create derivative works or to verify or correct other data or information. For example (but without limitation), the Information zmay not be used to create indexes, databases, risk models, analytics, software, or in connection with the issuing, offering, sponsoring, managing or marketing of any securities, portfolios, financial products or other investment vehicles utilizing or based on, linked to, tracking or otherwise derived from the Information or any other MSCI data, information, products or services.
The user of the Information assumes the entire risk of any use it may make or permit to be made of the Information. NONE OF THE INFORMATION PROVIDERS MAKES ANY EXPRESS OR IMPLIED WARRANTIES OR REPRESENTATIONS WITH RESPECT TO THE INFORMATION (OR THE RESULTS TO BE OBTAINED BY THE USE THEREOF), AND TO THE MAXIMUM EXTENT PERMITTED BY APPLICABLE LAW, EACH INFORMATION PROVIDER EXPRESSLY DISCLAIMS ALL IMPLIED WARRANTIES (INCLUDING, WITHOUT LIMITATION, ANY IMPLIED WARRANTIES OF ORIGINALITY, ACCURACY, TIMELINESS, NON-INFRINGEMENT, COMPLETENESS, MERCHANTABILITY AND FITNESS FOR A PARTICULAR PURPOSE) WITH RESPECT TO ANY OF THE INFORMATION.
Without limiting any of the foregoing and to the maximum extent permitted by applicable law, in no event shall any Information Provider have any liability regarding any of the Information for any direct, indirect, special, punitive, consequential (including lost profits) or any other damages even if notified of the possibility of such damages. The foregoing shall not exclude or limit any liability that may not by applicable law be excluded or limited, including without limitation (as applicable), any liability for death or personal injury to the extent that such injury results from the negligence or willful default of itself, its servants, agents or sub-contractors.
Information containing any historical information, data or analysis should not be taken as an indication or guarantee of any future performance, analysis, forecast or prediction. Past performance does not guarantee future results. The Information should not be relied on and is not a substitute for the skill, judgment and experience of the user, its management, employees, advisors and/or clients when making investment and other business decisions. All Information is impersonal and not tailored to the needs of any person, entity or group of persons.None of the Information constitutes an offer to sell (or a solicitation of an offer to buy), any security, financial product or other investment vehicle or any trading strategy.
It is not possible to invest directly in an index. Exposure to an asset class or trading strategy or other category represented by an index is only available through third party investable instruments (if any) based on that index. MSCI does not issue, sponsor, endorse, market, offer, review or otherwise express any opinion regarding any fund, ETF, derivative or other security, investment, financial product or trading strategy that is based on, linked to or seeks to provide an investment return related to the performance of any MSCI index (collectively, “Index Linked Investments”). MSCI makes no assurance that any Index Linked Investments will accurately track index performance or provide positive investment returns. MSCI Inc. is not an investment adviser or fiduciary and MSCI makes no representation regarding the advisability of investing in any Index Linked Investments.
MAY 2017CAP & DISCOUNT RATE REPORT
14

T: (011) 883 0679 F: (011) 883 0684Email: [email protected]: www.sapoa.org.za
NOTICE AND DISCLAIMER...continuedIndex returns do not represent the results of actual trading of investible assets/securities. MSCI maintains and calculates indexes, but does not manage actual assets. Index returns do not reflect payment of any sales charges or fees an investor may pay to purchase the securities underlying the index or Index Linked Investments. The imposition of these fees and charges would cause the performance of an Index Linked Investment to be different than the MSCI index performance.
The Information may contain back tested data. Back-tested performance is not actual performance, but is hypothetical. There are frequently material differences between back tested performance results and actual results subsequently achieved by any investment strategy.
Constituents of MSCI equity indexes are listed companies, which are included in or excluded from the indexes according to the application of the relevant index methodologies. Accordingly, constituents in MSCI equity indexes may include MSCI Inc., clients of MSCI or suppliers to MSCI. Inclusion of a security within an MSCI index is not a recommendation by MSCI to buy, sell, or hold such security, nor is it considered to be investment advice.
Data and information produced by various affiliates of MSCI Inc., including MSCI ESG Research Inc. and Barra LLC, may be used in calculating certain MSCI indexes. More information can be found in the relevant index methodologies on www.msci.com.MSCI receives compensation in connection with licensing its indexes to third parties. MSCI Inc.’s revenue includes fees based on assets in Index Linked Investments. Information can be found in MSCI Inc.’s company filings on the Investor Relations section of www.msci.com.
MSCI ESG Research Inc. is a Registered Investment Adviser under the Investment Advisers Act of 1940 and a subsidiary of MSCI Inc. Except with respect to any applicable products or services from MSCI ESG Research, neither MSCI nor any of its products or services recommends, endorses, approves or otherwise expresses any opinion regarding any issuer, securities, financial products or instruments or trading strategies and MSCI’s products or services are not intended to constitute investment advice or a recommendation to make (or refrain from making) any kind of investment decision and may not be relied on as such. Issuers mentioned or included in any MSCI ESG Research materials may include MSCI Inc., clients of MSCI or suppliers to MSCI, and may also purchase research or other products or services from MSCI ESG Research. MSCI ESG Research materials, including materials utilized in any MSCI ESG Indexes or other products, have not been submitted to, nor received approval from, the United States Securities and Exchange Commission or any other regulatory body.
Any use of or access to products, services or information of MSCI requires a license from MSCI. MSCI, Barra, RiskMetrics, IPD, FEA, InvestorForce, and other MSCI brands and product names are the trademarks, service marks, or registered trademarks of MSCI or its subsidiaries in the United States and other jurisdictions. The Global Industry Classification Standard (GICS) was developed by and is the exclusive property of MSCI and Standard & Poor’s. “Global Industry Classification Standard (GICS)” is a service mark of MSCI and Standard & Poor’s.
MAY 2017CAP & DISCOUNT RATE REPORT
15

T: (011) 883 0679 F: (011) 883 0684Email: [email protected]: www.sapoa.org.za
SURVEY CONTRIBUTORS
MAY 2017CAP & DISCOUNT RATE REPORT
16

SAPOA - South African Property Owners Association
T: (011) 883 0679 - F: (011) 883 0684Email: [email protected]: www.sapoa.org.za
Physical: Paddock View, Hunt’s End Office Park, 36 Wierda Road West, Wierda Valley, Sandton
Postal: P O Box 78544, Sandton 2146