Research Article Weather Features Associated with Aircraft Icing Conditions: A Case...
19
Research Article Weather Features Associated with Aircraft Icing Conditions: A Case Study Sergio Fernández-González, José Luis Sánchez, Estíbaliz Gascón, Laura López, Eduardo García-Ortega, and Andrés Merino Atmospheric Physics Group, IMA, University of Le´ on, 24071 Le´ on, Spain Correspondence should be addressed to Jos´ e Luis S´ anchez; [email protected] Received 2 October 2013; Accepted 26 December 2013; Published 20 February 2014 Academic Editors: S. Ghosh and Q. Wang Copyright © 2014 Sergio Fern´ andez-Gonz´ alez et al. is is an open access article distributed under the Creative Commons Attribution License, which permits unrestricted use, distribution, and reproduction in any medium, provided the original work is properly cited. In the context of aviation weather hazards, the study of aircraſt icing is very important because of several accidents attributed to it over recent decades. On February 1, 2012, an unusual meteorological situation caused severe icing of a C-212-200, an aircraſt used during winter 2011-2012 to study winter cloud systems in the Guadarrama Mountains of the central Iberian Peninsula. Observations in this case were from a MP-3000A microwave radiometric profiler, which acquired atmospheric temperature and humidity profiles continuously every 2.5 minutes. A Cloud Aerosol and Precipitation Spectrometer (CAPS) was also used to study cloud hydrometeors. Finally, ice nuclei concentration was measured in an isothermal cloud chamber, with the goal of calculating concentrations in the study area. Synoptic and mesoscale meteorological conditions were analysed using the Weather Research and Forecasting (WRF) model. It was demonstrated that topography influenced generation of a mesolow and gravity waves on the lee side of the orographic barrier, in the region where the aircraſt experienced icing. Other factors such as moisture, wind direction, temperature, atmospheric stability, and wind shear were decisive in the appearance of icing. is study indicates that icing conditions may arise locally, even when the synoptic situation does not indicate any risk. 1. Introduction e main consequences of aircraſt icing are unusual loss of liſt, such as a reduction in the rate of rise, an increase of friction, or rapid ice accumulation on windows, wings, or measurement instruments on the aircraſt [1]. e analysis of aircraſt icing is very important because of the numerous air crashes it has caused over recent decades [2]. Supercooled large drops (SLD) are drops of size greater than 50 m in a liquid state at temperatures below 0 ∘ C and constitute the principal source of aircraſt icing. is is because such drops can freeze on aircraſt structures that are unprotected or inadequately protected by anti-icing systems [3]. ere are two possible mechanisms of SLD formation. e first is when frozen hydrometeors melt upon transiting regions with temperatures above freezing (oſten called “warm noses”) and reenter regions of subfreezing temperatures (resupercooling). e second mechanism is when liquid droplets form through a condensation process and grow into SLD by collision-coalescence processes, a cycle in which tem- peratures are less than 0 ∘ C[4, 5]. e first mechanism is oſten associated with warm frontal passage [6]. However, Strapp et al. [7] pointed out that approximately 75% of freezing precipitation events are a result of the second mechanism. High humidity and updraſts are essential for the growth of supercooled water droplets, although there are other factors involved [8]. For efficient production of SLD by collision- coalescence processes, a mixing process is necessary [9]. Korolev and Isaac [10] claim that isobaric mixing produced by vertical air currents, which can produce supersaturation, may accelerate droplet growth to form SLD. is mechanism is favoured by an inversion layer near cloud top. Wind shear is another factor favouring SLD development because it induces mixing, which accelerates droplet growth and reduces the total number of drops [11]. At temperatures around −10 ∘ C, efficiency of the nucle- ation process is very low, because of weak activity of freezing Hindawi Publishing Corporation e Scientific World Journal Volume 2014, Article ID 279063, 18 pages http://dx.doi.org/10.1155/2014/279063
Transcript of Research Article Weather Features Associated with Aircraft Icing Conditions: A Case...

Research ArticleWeather Features Associated with Aircraft Icing ConditionsA Case Study
Sergio Fernaacutendez-Gonzaacutelez Joseacute Luis Saacutenchez Estiacutebaliz Gascoacuten Laura LoacutepezEduardo Garciacutea-Ortega and Andreacutes Merino
Atmospheric Physics Group IMA University of Leon 24071 Leon Spain
Correspondence should be addressed to Jose Luis Sanchez jlsanchezunileones
Received 2 October 2013 Accepted 26 December 2013 Published 20 February 2014
Academic Editors S Ghosh and Q Wang
Copyright copy 2014 Sergio Fernandez-Gonzalez et al This is an open access article distributed under the Creative CommonsAttribution License which permits unrestricted use distribution and reproduction in any medium provided the original work isproperly cited
In the context of aviation weather hazards the study of aircraft icing is very important because of several accidents attributed toit over recent decades On February 1 2012 an unusual meteorological situation caused severe icing of a C-212-200 an aircraftused during winter 2011-2012 to study winter cloud systems in the Guadarrama Mountains of the central Iberian PeninsulaObservations in this case were from a MP-3000A microwave radiometric profiler which acquired atmospheric temperature andhumidity profiles continuously every 25 minutes A Cloud Aerosol and Precipitation Spectrometer (CAPS) was also used to studycloud hydrometeors Finally ice nuclei concentration was measured in an isothermal cloud chamber with the goal of calculatingconcentrations in the study area Synoptic and mesoscale meteorological conditions were analysed using the Weather Researchand Forecasting (WRF) model It was demonstrated that topography influenced generation of a mesolow and gravity waves onthe lee side of the orographic barrier in the region where the aircraft experienced icing Other factors such as moisture winddirection temperature atmospheric stability and wind shear were decisive in the appearance of icing This study indicates thaticing conditions may arise locally even when the synoptic situation does not indicate any risk
1 Introduction
The main consequences of aircraft icing are unusual loss oflift such as a reduction in the rate of rise an increase offriction or rapid ice accumulation on windows wings ormeasurement instruments on the aircraft [1] The analysis ofaircraft icing is very important because of the numerous aircrashes it has caused over recent decades [2]
Supercooled large drops (SLD) are drops of size greaterthan 50 120583m in a liquid state at temperatures below 0∘Cand constitute the principal source of aircraft icing This isbecause such drops can freeze on aircraft structures that areunprotected or inadequately protected by anti-icing systems[3]
There are two possible mechanisms of SLD formationThe first is when frozen hydrometeors melt upon transitingregionswith temperatures above freezing (often called ldquowarmnosesrdquo) and reenter regions of subfreezing temperatures(resupercooling) The second mechanism is when liquid
droplets form through a condensation process and grow intoSLD by collision-coalescence processes a cycle in which tem-peratures are less than 0∘C [4 5]The first mechanism is oftenassociated with warm frontal passage [6] However Strappet al [7] pointed out that approximately 75 of freezingprecipitation events are a result of the second mechanism
Highhumidity andupdrafts are essential for the growth ofsupercooled water droplets although there are other factorsinvolved [8] For efficient production of SLD by collision-coalescence processes a mixing process is necessary [9]Korolev and Isaac [10] claim that isobaric mixing producedby vertical air currents which can produce supersaturationmay accelerate droplet growth to form SLDThis mechanismis favoured by an inversion layer near cloud topWind shear isanother factor favouring SLDdevelopment because it inducesmixing which accelerates droplet growth and reduces thetotal number of drops [11]
At temperatures around minus10∘C efficiency of the nucle-ation process is very low because of weak activity of freezing
Hindawi Publishing Corporatione Scientific World JournalVolume 2014 Article ID 279063 18 pageshttpdxdoiorg1011552014279063
2 The Scientific World Journal
nuclei at those temperatures [12]Thus thismechanism is notpronounced in clouds with tops at temperatures above minus15∘CRauber and Grant [13] indicated that supercooled liquidwater (SLW) layers are common in orographic cloud systemswith cloud tops at temperatures as low as minus31∘C The causeof this phenomenon can be explained by imbalances betweenliquid water content (LWC) input by condensation and thenucleation rate which is very slow [14] To this it must beadded that the freezing nuclei concentration is several ordersof magnitude lower than that of condensation nuclei [15]
The average glaciation time in stratiform clouds is around10 minutes [16]Therefore if the hydrometeor residence timeis much smaller than the characteristic glaciation time it isexpected that virtually all hydrometeors will remain in theliquid phaseThis is explained by Korolev and Isaac [10] whoposit that SLD formed in updrafts have an average life of a fewtenths of a second
The processes discussed above are modified by terrainmaking it necessary to perform a comprehensive mesoscaleanalysis The importance of atmospheric flow modificationcaused by mountains depends on several parameters suchas mountain height and shape atmospheric stability windspeed and direction [17] On the lee side of mountainsan area of weaker wind or eddy shedding can appear [18]and mountain waves can form [19] Various works [20 21]have shown the formation of mesolows on the lee side ofseveral mountain ranges of the Iberian Peninsula a result ofa windflow perpendicular to the orographic barrier
Reinking et al [22] indicated that prefrontal flow isforced to ascend when it passes over an orographic barrierOrographic lifting produces regions of LWCaccumulation onthe windward slope After passing the orographic barrier airdescends abruptly and generates a cloudless area because ofthe Foehn effect Subsequently the flow rises suddenly gen-erating the characteristic gravity waves Gravity waves formregions of short-lived but considerable amounts of LWC [23]
Numerical weather forecastingmodels are unable to fore-cast the concentration of SLD accurately because commonlyused parameterizations generally overestimate the amount offrozen water content and underestimate the concentration ofsupercooled liquid water [24]
Consequently field campaigns using research aircraft tomeasure in situ supercooled liquid water and frozen watercontent are very important to improve the accuracy ofnumerical models The vast majority of such field projectshave been carried out in the USA and Canada [1 25 26] withsome exceptions as in Germany [27]
Under the TECOAGUAproject a series of flight plans hasbeen designed to collect scientific data from in-cloud systemscapable of producing rainfall duringwinterThese flightswereexecuted by a C-212-200 aircraft belonging to the NationalInstitute for Aerospace Technology (INTA) One goal of thisproject was to fly in an icing environment to understandicing conditions that are not infrequent near Madrid-Barajasairport
As noted by Baumgardner et al [28] the Cloud Aerosoland Precipitation Spectrometer (CAPS) is suitable for mea-suring microphysical variables within clouds so it wasdecided to install this instrument on the project aircraft
with the aim of measuring SLD concentration This probeis capable of measuring hydrometeor concentration and size(and distinguishing their phase) aerosols LWC temperaturerelative humidity (RH) and vapour density among othervariables
On February 1 2012 the aircraft took off from the Tor-rejon de Ardoz military base (Madrid) and began collectingvalid data at 1257 (all times UTC) The aircraft flew northwith the goal of collecting data on the north side of theCentral System Flying over the Lozoya Valley at altitudeabout 3500 msl the aircraft penetrated a region with highSLD concentration and temperatures around minus12∘C andLWC as much as 044 gm3 This caused ice accumulation onthe profile of the aircraft wings forcing termination of theresearch flight
The objective of the present study is to analyse thesynoptic situation and mesoscale conditions during the dayof this aircraft icing To do this weather conditions weremeasured by the available instrumentation and the synopticand mesoscale factors causing the icing were analyzed usingthe Weather Research and Forecasting (WRF) model
2 Experimental Design and Methodology
21 Study Area Icing of the C-212-200 aircraft on February1 2012 occurred while attempting to cross the GuadarramaMountains This mountain range is between the provincesof Segovia and Madrid in central Spain The orientation ofridges and valleys is predominantly southwest-northeastThesouthwest end of the range is at 40∘221015840N 4∘181015840W and itsnortheast end at 41∘41015840N 3∘441015840W
Elevations in these mountains are well in excess of2000msl The mountains are separated in the middle witha higher range to the north and lower one to the south TheLozoyaValley is between these two ranges It is over this valley(Figure 1) where the aircraft traversed the region of high SLDconcentration that caused rapid icing and flight termination
22 Instrumentation
221 MP-3000A Microwave Radiometric Profiler For the2011-12 winter field project a hyperspectral multichannelmicrowave radiometer (MMWRMP-3000A)was installed at1880msl in theGuadarramaMountains (location in Figure 1)The instrument continuously measured vertical profiles oftemperature humidity LWC and water vapour density (withtemporal resolution approximately 25 minutes) to 10 kmheight The MP-3000A was manufactured by RadiometricsBoulder Colorado USA Characteristics of this instrumentand retrieved profiles are described in Sanchez et al [29]
222 CAPS The C-212-200 aircraft carried the CAPS underthe left wing during the field project The CAPS consists offive probes First is a Cloud and Aerosol Spectrometer (CAS)which measures aerosols and hydrometeor size distributionsbetween 051 and 50 120583m Second is a Cloud Imaging ProbeGrayscale (CIP-GS) which can measure hydrometeors from25 to 1550120583m and represent 2D images of hydrometeors
The Scientific World Journal 3
Madrid
Guadarrama mountains
(km)
Radiometer
SPAIN
Segovia
Torrejonairport
Cloud chamber
Lozoya valley
1
2
3
4
N
56
7
8
9
Light icing
Severe icing
High 2500
Low 500
0 10 205
Figure 1Map of GuadarramaMountainsMadrid Aircraft trajectory plus radiometer and cloud chamber locations have been superimposed
The advantage of the grey scale is that it gives additionaldetails on ice crystal characteristics and more importantlyit better defines the depth of field and permits more accu-rate hydrometeor identification Third is the LWD detector(LWC-Hotwire) probe which estimates atmospheric LWCaccurately between 001 and 3 gm3 Finally therewas a sensortomeasure airspeed and another tomeasure temperature andRH A more detailed explanation of the CAPS is found inBaumgardner et al [30]
223 Isothermal Cloud Chamber An isothermal cloudchamber was used to measure ice nuclei concentration of theair mass over the Guadarrama Mountains This instrumentwas installed at ground level at Lozoya Reservoir (location in
Figure 1) in the Lozoya Valley where the aircraft experiencedicing This cloud chamber has a tank with volume 11 L Theice nuclei concentration was measured at minus23∘C because ofthe low concentrations recorded at warmer temperatures inprevious Iberian Peninsula field projectsThe procedure usedin the campaign was described in Castro et al [31] Thisinstrument is only capable of taking static measurements soseveral measurements were taken during the study day toanalyze the evolution of ice nuclei concentration
3 Observation
The aircraft took off from Torrejon Airport at 1257 onFebruary 1 2012 The aim of this flight was to investigate
4 The Scientific World Journal
expected icing conditions from the approach of a cold front tothe study area Upon approach to theGuadarramaMountains(1310) the aircraft began to experience light icing Icingconditions were worst after reaching the Lozoya Valley (1315)and consequently the aircraft experienced severe icing andthe pilot was forced to abort the mission and return to theairportThe aircraft continued to encounter severe icing until1319 when it exited the valley Light icing occurred near theGuadarrama Mountains until 1322 when the aircraft finallyexited cloudThe aircraft landed at Torrejon at 1331Theflightpath is shown in Figure 1 The icing episode was recorded bythe instrumentation as follows
31 MP-3000A Radiometer Atmospheric stability was con-tinuously monitored by the MP-3000A microwave radio-metric profiler Figure 2 shows vertical profiles at differenttimes At 0900 on February 1 it was observed that thenocturnal inversion had not dissipated at low levels Therewas practically neutral stability from 720 hPa to 630 hPawhere there was a transition layer to greater stability at levels600 hPa and above There was neutral static stability (nearlyunstable) between 750 and 600 hPa abovewhichwas a strongstable layer
At 1245 when the aircraft neared the zone of interestlayers near the ground were saturated and the inversionhad weakened considerably Vertical profiles generally indi-cated an increasingly unstable atmosphere Subsequently themost unstable atmospheric layer developed from 750 hPa to600 hPa There was a progressive increase of moisture in thislayer during preflight (1200 to 1300) There were clouds inthis layer and this was where the aircraft experienced icing(CAPS detected a region with high SLD concentration at650 hPa) From 1315 to 1330 around which time the aircraftexperienced severe icing the temperature and dew pointtemperature curves between 750 and 600 hPa were closeindicating cloudiness Subsequent profiles (1345ndash1400) indi-cated lesser instability and humidity so we conclude that theaircraft crossed the Lozoya Valley during the most favourableconditions for aircraft icing all day
Above the aforementioned unstable layer (just below600 hPa) was a more stable region that persisted the entireday representing a weak thermal inversion This layer pre-vented updrafts in the Lozoya Valley from reaching higherlevels and favoured formation of vertical shear Bernstein[32] showed that stably stratified conditions are conducive toformation of regions of high SLD concentration This wouldfavour shear near cloud tops which causes intense mixingand thereby efficient and rapid SLD formation [33]
The thermodynamic profile revealed the absence of aldquowarm layerrdquo indicating that SLD causing aircraft icing wereformed by condensation followed by collision-coalescencethe entire process occurring at temperatures colder than 0∘CThese profiles match ldquotype Ardquo described by Bernstein [32] inwhich the entire atmosphere has subfreezing temperaturesincluding the saturated layer
The MMWR data permit continuous calculation of sta-bility indices and determination of the presence or absenceof convection Although there are many indices that can
be applied to this purpose in summer there are few suchfor winter application Most Unstable Convective AvailablePotential Energy (MUCAPE) has been widely used as avariation on CAPE in studies of winter convection [34ndash36]This index represents the total potential energy available tothe most unstable air parcel within the lowest 300 mb whilebeing lifted to its level of free convection To obtain thisindex CAPE must first be computed by lifting parcels fromeach level in the humidity and temperature profiles ThenMUCAPE is taken as the greatest CAPE encountered that isthe most unstable parcel
For continuous monitoring the radiometer data wereused Intermediate values of MUCAPE were recorded inthe hours before the flight (100ndash200 Jkg) but these valuesdeclined to 0 Jkg at 1300 (Figure 3) These values are inad-equate for convective development [37 38]
32 CAPS Hydrometeor size distributions from data col-lected by the CAPS during the flight of February 1 wereanalyzed in the region of aircraft icing The gamma distribu-tion function was chosen for these distributions because itfaithfully represents droplet size distributions within cloudsThis function was defined by Ulbrich [39] and was selectedbecause it better represents larger droplets The functionhas three parameters dependent on time (and space in theEulerian case) the concentration of particles their averagediameter and spectrumwidth [40]Theparameters were esti-mated following the maximum likelihood method definedby Wilks [41] The gamma distribution function has beenused for representation of the size distribution of cloudhydrometeors [42]The Lilliefors test [43] was used to ensuregoodness of fit at the 005 level of significance
Average hydrometeor size distributions were calculatedevery 30 seconds CAPSmeasurements in cloud are shown inTable 1 Images from the CIP (part of CAPS) for each periodin Table 1 are shown in Figure 4 These nine measurementscorrespond to the highlighted circles along the trajectory inFigure 1 described previously in Section 21 Correspondingdrop size distributions are shown in Figure 5 for which agamma distribution function has been applied
Initially the predominant droplet size waslt25 120583mAs theaircraft approached position 1 an increasingly large numberof hydrometeors with size 25ndash50120583m were measured At thattime the aircraft experienced light icing but no loss of liftThis period corresponds with the three first times of Table 1and first three images of Figure 4 Curves of the hydrometeorsize distribution (curves 1 2 and 3 in Figure 5) did not fit thegamma distribution
Approaching position 3 the aircraft suddenly reachedan area with a high concentration of droplets with size 50ndash100 120583m This produced severe icing forcing the pilot to turnaround toward the south He tried to climb out of cloud butthe SLD concentration at heights around 3800ndash3900msl waseven greater than 200mbelowThere the aircraft encounteredthe worst icing conditions This cloud had large quantitiesof LWC and SLD at temperatures around minus12∘C freezingliquid drops as soon as they contacted the aircraft fuselageThe severe icing corresponds with the 4th 5th and 6th time
The Scientific World Journal 5
200
250
300
400
500
600
700
800850
minus40 minus30 minus20 minus10 0 10
(∘C)
(hPa
)
900
(a)
200
250
300
400
500
600
700
800850
minus40 minus30 minus20 minus10 0 10
(∘C)
(hPa
)
1245
(b)
200
250
300
400
500
600
700
800850
minus40 minus30 minus20 minus10 0 10
(∘C)
(hPa
)
1300
(c)
200
250
300
400
500
600
700
800850
minus40 minus30 minus20 minus10 0 10
(∘C)
(hPa
)1315
(d)
200
250
300
400
500
600
700
800850
minus40 minus30 minus20 minus10 0 10
(∘C)
(hPa
)
1330
(e)
200
250
300
400
500
600
700
800850
minus40 minus30 minus20 minus10 0 10
(∘C)
(hPa
)
451345
(f)
Figure 2 Skew-Tlog-P diagram of radiometer data at 900 1245 1300 1315 1330 and 1345 on February 1 2012 Temperature (red lines)dew point (blue dashed lines)
6 The Scientific World Journal
Table1Va
riables
measuredby
CAPS
andgammad
istrib
utionparameters
Time
(UTC
)Latitud
e(∘ )
Long
itude
(∘ )High
(masl)
Temperature
(K)
LWC
(gm
3 )Num
bero
fparticlesb
ysiz
eranges
119873119905
MVD
(120583m)Λ
(cmminus1 )120583
Gam
ma
distr
ibutionfit
0ndash25
25ndash50
50ndash75
75ndash100
100ndash
125
125ndash150
150ndash
175
175ndash200
131155
4083
minus364
3585
2617
006
1082
842
11
00
0117
09
015
980
NO
1312
55
4087
minus368
3600
2615
012
1943
330
286
43
21
2317
11018
1585
NO
1314
21
4092
minus373
3570
2616
016
2157
392
297
66
66
2609
65019
1732
NO
1315
51
4095
minus377
3589
2616
021
1941
1284
513
179
9863
4024
4142
180
052
988
YES
1318
02
4095
minus369
3894
2603
028
1467
985
1174
689
315
9939
154783
526
112
532
YES
1318
3240
93
minus367
3895
2598
035
2573
2051
1296
440
104
2212
86506
302
062
1302
YES
1319
45
4090
minus359
3922
2595
011
1649
763
249
5313
53
12736
34034
1014
NO
13210
040
87
minus352
3897
2596
011
1619
878
363
8416
31
12965
39040
937
NO
132227
4082
minus344
3891
2613
002
865
273
557
00
00
1200
5024
614
NO
The Scientific World Journal 7
0
50
100
150
200
250
900
915
930
945
100
010
15
103
010
45
110
011
15
113
011
45
120
012
15
123
012
45
130
013
15
133
013
45
140
014
15
143
014
45
150
015
15
153
015
45
160
0
MU
CAPE
(Jk
g)
Figure 3 Evolution of MUCAPE index during February 1 2013
131551131421131255131155 131802 131832 131945 132100 132227
Light icing Light icingServere icing1550120583m
Figure 4 Images captured by CIP when aircraft experienced icing
steps of Table 1 The LWC increased to more than 02 gm3with peaks 044 gm3 The table indicates the huge amountsof SLD and hydrometeors over 50 120583m In the 4th 5th and6th images of Figure 4 it is seen that SLD were larger thanthe small supercooled droplets in the other images Figure 5shows how the 4th 5th and 6th curves adjusted to thegamma distribution unlike the remaining times This is veryimportant because it indicates that if the size distribution ofsupercooled liquid droplets follows the gamma distributionwe can expect moderate to severe icing if it does not do solight icing is the maximum expected
After exiting the Lozoya Valley and the cloud with SLDtoward the south average drop size gradually decreased topredominant droplets smaller than 25 120583m with light icingThis period corresponds with the 7th 8th and 9th times ofTable 1 the images in Figure 4 and curves in Figure 5 The
images captured by the CIP droplet size distributions andvalues in Table 1 for times 7 8 and 9 are similar to times 1 2and 3 except that the temperature was slightly cooler becausethe aircraft ascended to 3800ndash3900msl
Microphysical conditions observed over the Lozoya Val-ley by the aircraft during February 1 are consistent with thosedescribed by Ellrod and Bailey [44] They stated that icingis linked with temperatures between 0 and minus20∘C liquid- ormixed-phase clouds volume median diameter greater than30 120583m LWC gt 02 gm3 weak updrafts to replenish super-cooled liquid water and clouds of considerable thicknessSLD can be very dangerous to aviation because they canaccumulate beyond the capabilities of current deicing bootsThis significantly reduces aircraft performance which cannotbe alleviated by ice protection devices such as pneumaticboots [45] This occurred during the case study
8 The Scientific World Journal
0123456789
25 50 75 100 125 150 175 200
123
456
789
Drop size (120583m)
N(D
)
Figure 5 Gamma distribution curves for each of the nine times ofTable 1 and Figure 4
Cober et al [1] described favourable environmentsfor SLD development in which supercooled liquid waterdroplets greater than 50 120583m form following melting andsubsequent resupercooling or via condensation processes fol-lowed by collision-coalescence which occurred in our caseSevere icing is formed by an updraft that provides sufficientwater vapour to maintain SLD growth while existing shearnear the cloud top supports collision-coalescence processesresponsible for its formation
These results agree with those of Rauber and Tokay[14] They asserted that when the concentration of freezingnuclei is low cloud top temperature is relatively warm (aboveminus20∘C) with weak updrafts and the likelihood of a LWC layerat cloud top is high Based on data from scientific flights infield studies Sand et al [46] found that only 4 of icingreports were at temperatures below minus20∘C with about 50between minus12∘C and minus8∘C Vidaurre and Hallet [47] notedthat liquid-only clouds dominate at subfreezing temperaturesclose to 0∘C whereas ice-only clouds predominate belowminus20∘C
33 Isothermal Cloud Chamber Observations Two measure-ments with the isothermal cloud chamber were taken onFebruary 1 The first was at 958 resulting in a concentrationof 24 INL (IN are ice nuclei) The second was around flighttime at 1329 showing a decrease to 16 INL (Figure 6) Thethermal inversion during the morning which disappearedafter midday may have been responsible for the high icenuclei concentration of the first measurement The breakingof the inversion layer at the surface allowed dispersionof IN to higher levels of the troposphere The surface INconcentration at 1329 was representative of that during theflight because there was no inversion layer below 600 hPa
These values are extremely low compared with thosereported by other authors After taking nearly 1000 measure-ments in the northwestern Iberian Peninsula Castro et al [31]obtained an average of 125 INL active at minus23∘C on days withmaritime air masses Our relatively sparse IN represents an
Figure 6 Measurement of ice nuclei from isothermal cloud cham-ber at 1329
obstacle to glaciation which was a determining factor for thelarge numbers of SLD during the flight and near absence ofhydrometeors in the solid phase
At 600 hPa near the cloud tops the temperature wasslightlywarmer thanminus20∘CThis temperaturewas sufficientlywarm to prevent activation of most of the IN hinderingoptimal glaciation
4 Meteorological Analysis
WRF and othermesoscalemodels have been used for analysisof aircraft icing episodes [48 49] In this paper weather con-ditions generating icing of the C-212-200 aircraft on February1 were simulated by the WRF mesoscale model version311 [50] Initial and boundary conditions were furnished bythe National Centers for Environmental Prediction (NCEP)reanalysis which has spatial resolution 1∘ [51]
Three nested domains were defined D01 covers south-western Europe with 98 grids in both the eastwest andnorthsouth directions This domain has spatial resolution27 km and temporal resolution 3 hours and was used for thesynoptic description
Temporal resolution of domainD02 is 1 hour It covers theentire Iberian Peninsula with 125 grid points in the eastwestdirection and 107 northsouth points with spatial resolution9 km
To analyze in detail the mesoscale factors that influencedformation of icing conditions domain D03 was used Thisdomain facilitates accurate representation of weather con-ditions in the study area because it has spatial resolution3 km and temporal resolution 1 hour Figure 7 shows the threedomains D02 and D03 were used in mesoscale analysis D01for synoptic analysis The cross section axis is perpendicularto GuadarramaMountains Mesoscale models are commonly
The Scientific World Journal 9
Cross section D03
41∘30998400N
41∘N
41∘30998400N
40∘N
39∘30998400N
5∘30998400W 5∘W 4∘30998400W 4∘W 3∘30998400W 3∘W 2∘30998400W
Altitude (msl )600400 800 1000 1200 1400 1600 1800
WRF domain configuration
WRF domain configuration
WRF domain configurationD01
50∘N
55∘N
45∘N
40∘N
35∘N
20∘W 15∘W 10∘W 5∘W 0∘
D02
D03
Cross section D02
Terrain height200 400 600 800 1000 1200 1400 1600 1800 2000
43∘N
42∘N
41∘N
40∘N
39∘N
38∘N
37∘N
8∘W 6∘W 4∘W 2∘W 0∘
Figure 7 Nested domains used in WRF simulation Axis from cross section from N to S is overlaid on D02 and D03
used in forecasting and evaluation of in-cloud icing condi-tions [52]
For parameterization of microphysical processes theWRF NewThompson graupel scheme [53] was chosen since
it considers graupel and typical ice water concentrations inmountainous areas during winter Further we used the Noahland surface model [54] and Eta surface layer scheme definedby Janjic [55] For longwave radiation the Rapid Radiative
10 The Scientific World Journal
Geopotential (gpm) at 500hPaSea level pressure (hPa)
50∘N
45∘N
40∘N
35∘N
20∘W 15∘W 10∘W 5∘W 0∘ 5∘ESea level pressure contours 980 to 1040 by 2
Geopotential (gpm)5300 5400 5500 5600 5700
10241028
1035
1032
1028
1024
1020
1016
1020
1016
1024H1026
L1015
Figure 8 Sea level pressure and geopotential height at 500 hPamodeled by WRF for domain D01
Transfer Model [56] was used along with the scheme ofDudhia [57] for shortwave radiation
41 Synoptic Overview From domain D01 it was found thatthe synoptic situation in Europewas dominated by a powerfulSiberian anticyclone (Figure 8) forcing a dry and very coldnortheast wind into Central Europe Northwest winds werepredominant during the morning over the Iberian Peninsula
Figure 9 depicts RH and wind at 300 hPa Progress ofa dry intrusion induced the advection of moist air over thepeninsula in a manner similar to the pattern shown byBrowning [58] This dry intrusion is caused by a dynamictropopause anomaly which is derived from the jet streamA weak cold front associated with the anomaly crossed theIberian Peninsula from north to south during the studyday This synoptic pattern was associated with aircraft icingby Bernstein et al [59] The situation coincided with thosereported by Bernstein et al [11] who related the leadingedges of arctic and cold fronts to in-flight icing episodescited in pilot reportsThis also fits the ldquoArctic Frontrdquo synopticpattern described by Rauber et al [60] who indicated thatthis pattern is the most common in freezing precipitationepisodes
There was another anomaly to the west of Lisbon at 1200Aweakened branch thereof penetrated the Iberian Peninsulaat latitudes slightly south of Madrid The two anomaliestended to associate causing the accumulation and ascent ofmoist air in a strip between the two
Relative humidity () at 300hPa
50∘N
45∘N
40∘N
35∘N
20∘W 15∘W 10∘W 5∘W 0∘ 5∘E
Relative humidity ()20 40 60 80
Wind (msminus1) at 300hPa
Figure 9 Relative humidity and wind at 300 hPa modeled by WRFin domain D01
The formation of dynamic tropopause anomalies is con-nected with the position of the jet stream Its location can beidentified by the strong winds shown in Figure 9 depictedby wind barbs The incursion of a subtropical anticyclonenorth of the Azores displaced the jet stream northwardwhile the powerful Siberian anticyclone pushed it southwardproducing strong jet curvatureThe jet streamwas not clearlydefined near the Iberian Peninsula but was separated into twobranches One was west of Portugal and the other crossedthe Pyrenees and moved toward the Mediterranean Thebranches were associated with the two dynamic tropopauseanomalies described above
42 Mesoscale The orographic forcing of the GuadarramaMountains can be seen more clearly by increasing the modelresolution This forcing helped determine the generationand modification of factors that triggered mesoscale weatherconditions supporting the icing In the following the causesof the icing are analyzed
421 Dynamic Tropopause Anomalies From domain D02(see Figure 7) the vertical cross section of potential vorticity(PV) andRH is shown in Figure 10 in which the two dynamictropopause anomalies are evident A high PV region 75 kmsouth of the Guadarrama Mountains corresponds to theanomaly observed to the southwest of Lisbon This anomalyappears responsible for themidtroposphere dry air mass overthe southern half of the Iberian Peninsula A deeper anomalywas north of the Guadarrama Mountains corresponding to
The Scientific World Journal 11
Grid pointsGrid points
00
1515
10090807060504030201000
0 20 40 60 80 0 20 40 60 80 0 20 40 60 80
0
0
15
Hei
ght (
km)
10090807060504030201000
Hei
ght (
km)
10090807060504030201000
Hei
ght (
km)
Relative humidity ()Potential vorticity (PVU)
Guadarrama mountains Guadarrama mountains Guadarrama mountains10 30 50 70 90 10 30 50 70 90 10 30 50 70 90
Potential vorticity contours minus 15 to 15 by 15
Relative humidity ()
Figure 10 Cross section of relative humidity and potential vorticity in domain D02
the backside of the dry intrusion west of ItalyThe rear of thatanomaly moved southward pushing an air mass with highhumidity ahead of it The convergence of the two anomaliesaccumulated moisture at the centre of the Iberian PeninsulaSubstantial moisture is essential for SLD formation [2]
Nevertheless updrafts over the Guadarrama Mountainscannot be attributed to the dynamic tropopause anomaliesbecause updrafts remained stationary on the lee side of themountains throughout the day while the anomalies movedto the south Therefore we conclude that the anomalies werenot the main cause of the updraft that accumulated SLD overthe Lozoya Valley The backside of the anomaly at flight timeremained north of the Iberian Peninsula its effects were notobserved in the mountains until after 1800
Associated with this anomaly was an advancing coldfront This front swept across the peninsula during theafternoon of February 1 resulting in ascent of the warm andwet air mass above a wedge of cold and dry air Reinking etal [22] stated that the ascent of a warm air mass over a coldone provides moisture and upwelling processes necessary forcollision-coalescence growth
422 Mesolow By increasing model resolution in domainD03 it was observed that surface winds were perpendicularto the GuadarramaMountains during the flight This formeda mesolow on their lee side caused by a phenomenon knownas an orographic dipole This is a mesoscale structure causedby flowperpendicular to amountain barrier forming anoma-lous positive pressure on the windward side and a depressionon the lee side Associated with the mesolow surface windhad a cyclonic rotation on the lee side (Figure 11) whichtriggeredwind convergence in the area of severe aircraft icing
Orographic dipole formation is explained by separationof the boundary layer a well-known phenomenon in fluiddynamics [61] According to this theory a steady streamencountering an obstacle generates a stagnation point anda pair of vortices one is anticyclonic and upstream of theobstacle and the other is cyclonic and downstream [62]In such a 3D flow situation additional effects should be
Aircraft trajectory
41∘30998400N
41∘N
41∘30998400N
40∘N
39∘30998400N
5∘30998400W 5∘W 4∘30998400W 4∘W 3∘30998400W 3∘W 2∘30998400W
Terrain height (m)
Sea level pressure contours 990 to 1030 by 1
500 750 1000 1250 1500 1750 2000
Terrain height (m)Wind (kts)
Sea level pressure (hPa)
1016
1016 1014
10141014
1014
Figure 11 Terrain height sea level pressure and surface wind indomain D03 Aircraft trajectory has been superimposed
considered such as stratification wave breaking turbulenceand vertical wind shear [63]
423 Updrafts and Gravity Waves In the same area asthe mesolow an updraft appears in images produced bythe WRF This coincides with formation of the cloud bandresponsible for the aircraft icing Geresdi et al [64] indicatedthat icing regions often are associated with mesoscale upliftwith vertical speeds around 5ndash20 cm sminus1 In the vertical cross
12 The Scientific World Journal
z-wind component (ms) at 650hPa
Terrain height (m)Aircra trajectory
500 750 1000 1250 1500 1750 2000
41∘30998400N
41∘N
41∘30998400N
40∘N
39∘30998400N
5∘30998400W 5∘W 4∘30998400W 4∘W 3∘30998400W 3∘W 2∘30998400W
(a)
Grid points NorthSouth
minus125 minus075 minus025 025 075 125H
eigh
t (km
)
Aircra trajectory
z-wind component (ms minus1)
z-wind component (ms minus1)
80
0 5 10 15 20 25
70
60
50
40
30
20
10
00
(b)
Figure 12 Vertical (z) wind component at 650 hPa (a) and on a cross section (b) of domain D03 Aircraft trajectory has been superimposed
section of Figure 12 two updrafts are evident on the lee side ofthe Guadarrama Mountains These updrafts are also seen inthe vertical (z) wind component at 650 hPa the level at whichthe aircraft experienced icing
Coupled with the orographic dipole mountain waves arecommon in regions of static stability (as shown by radiometerdata) when the wind is perpendicular to the orographicbarrier This barrier offers resistance to passage of the flowUnable to pass through the barrier air tends to accumulateresulting in loss of energy and wind speed reduction Thisincreases pressure on the windward side by wind conver-gence Air passing through the mountains descends into thevalley on the lee side and is then forced upward generatingmountain waves Away from the mountains beyond a calmzone the flow accelerates producing divergence and a result-ing pressure decrease [65] The orographic dipole tends tostrengthen updrafts generated by gravity waves
Politovich [25] noted that orographic forcing may triggerconvection embedded in stratiform clouds which facilitatesthe ascent of SLD and their accumulation at cloud tops Ikedaet al [66] also asserted that strong flow perpendicular to amountain barrier amplified vertical motions (up to 2ms)above local ridges forming embedded convection
Petersen et al [67] indicated that if mountains aresufficiently high to block the prevailing flow a mesolowor eddy shedding on the lee side is likely In the WRFsimulation a mesolow was produced on the leeward sideof the Guadarrama Mountains owing to partial blockage ofthe perpendicular flow The increase of PV caused by the
mountains and accumulated at the mesolow reduced geopo-tential height at midtropospheric levels [68] Additional PVmay have come from approach of the cold front and dynamictropopause anomaly discussed above This caused a stronggradient of geopotential height to the lee of the mountains asdetected by an increase of wind speed and change in directionat midtroposphere generating strong shearThis is consistentwith Rauber [69] who claimed that gravity wave appearancein orographic cloud systems is usually associated with sub-sidence and strong shear at cloud tops Here we should alsonote the cyclonic gyre of surface wind on the lee side of theGuadarrama Mountains associated with the mesolow
424 Atmospheric Stability We also analyzed EquivalentPotential Vorticity (EPV) to determine the existence ofConditional Symmetric Instability (CSI) After confirmingthat there was no negative EPV during the flight and nosignificant values of convective indices (analyzed using con-tinuous radiometer measurements) the presence of convec-tion was dismissed We therefore conclude that the observedupdraftswere caused bymountainwaves strengthened by themesolow
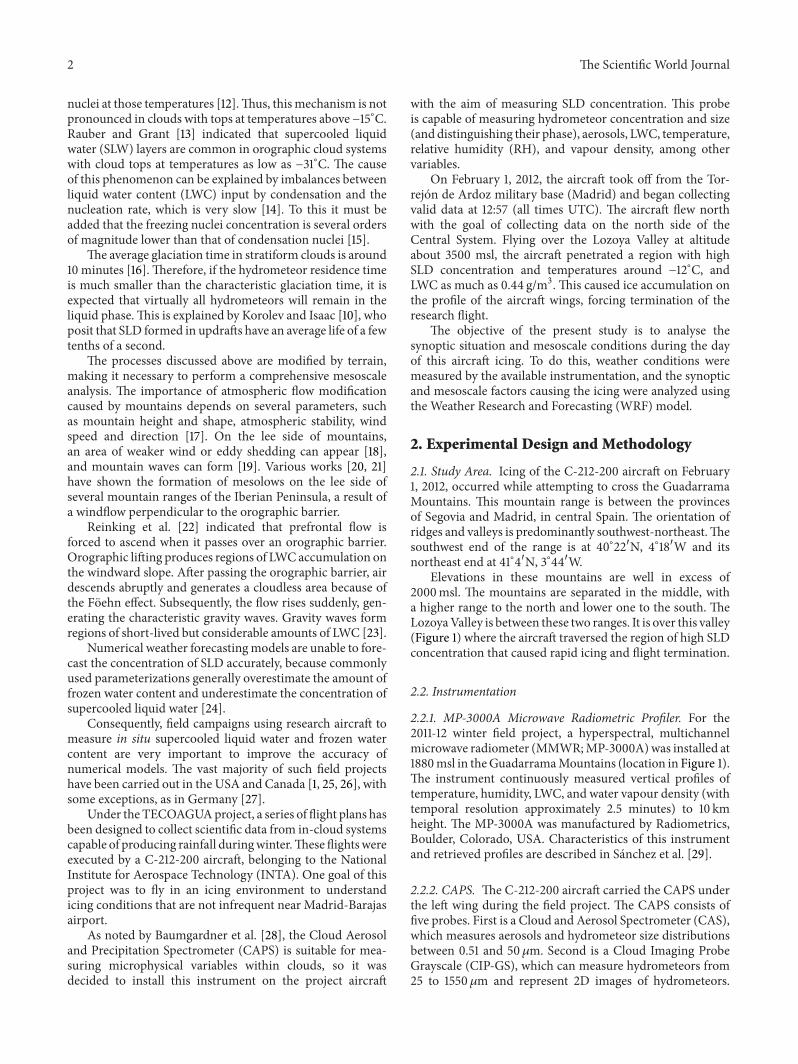
As seen in Figure 13 depicting differential equivalentpotential temperature (deth) there was strong stability nearthe surface with a thermal inversion in various areas ofD03 Immediately above that inversion was a stable layerwhich reached about 3000msl Most notable is the neutralstability layer located between 3 and 4 km which allowed
The Scientific World Journal 13
deth (Ckm)
Grid pointsSouth North
Hei
ght (
km)
Atmospheric stabilityUnstable Stable
Aircraft trajectory
80
70
60
50
40
30
20
10
00
0 5 10 15 20 25
0 15 3 45
Figure 13 Cross section of deth in D03
gravity wave development Above this there was anotherstable layer that prevented vertical development of the gravitywaves above 4 km Moreover ripples caused by gravity wavescan be discerned Figure 13 portrays a small unstable regioncoincident with the mesolow The situation observed by theradiometer matches that modeled by the WRF because ifwe represent deth in cross section around 409∘N (wherethe aircraft experienced icing) there was a neutral layer(almost unstable) from 2500 to 4000msl Immediately above4000msl there was a stable layer
Pobanz et al [8] argued that shear above cloud top ina thermodynamically stable atmosphere can form a dynam-ically unstable layer and thereby turbulence and risk ofKelvin-Helmholtz waves as well as entrainment of subsatu-rated air and mixing which favour SLD formation Marwitz[70] had a similar theory He affirmed that wind shearinduced dynamical instability in gravity waves However thestable layer above 600 hPa blocked further ascent of air andthereby that of SLD Therefore the layer with greatest SLDaccumulation formed immediately below this layer
The nearly neutral static stability together with weakupdrafts associated with mountains may be associated withproduction of SLW in this layer as pointed out by Pobanzet al [8] They claimed that a neutral or weakly unstableatmosphere promotes SLD formation A static stability layerpromotes generation of mountain waves Orographic liftingis greater in a neutral atmosphere than in a stable onefostering greater accumulation of SLD and LWC near cloudtop Furthermore within a neutral stability region cloud
tops do not reach high altitudes This is conducive to a lowconcentration of ice crystals which facilitates the presence ofSLD [71]
On the morning of February 1 2012 there was a stableatmosphere with a strong inversion layer near the surface asexplained in the observation sectionHowever the conditionswere increasingly unstable on the lee side of the GuadarramaMountains which were associated with formation of themesolow In addition the cold front linked with the dynamictropopause anomaly was approaching As was the case inthe present study several authors have indicated that atransition from stable to more unstable conditions supportsSLD formation [23 72]
425 Temperature Figure 14 represents temperature at650 hPa near the aircraft icing altitude Temperature therewas about minus12∘C an optimal value for such icing This isbecausemost freezing nuclei are not active and the nucleationprocess is therefore inefficient [12 15]
The figure shows that over the Lozoya Valley where thefirst mountain wave was located there was a band with lowertemperatures than adjacent regions A few miles south therewas another cold band collocated with a second mountainwave Contiguous with these two regions there were threebands with warmer temperatures than expected at this alti-tude these correspond to subsidence regions produced by themountainwaves Awave cloud occurs between themaximumand minimum vertical velocity where temperatures are lessthan the undisturbed mean value [73]
426 LiquidWater Content The cloud band over the LozoyaValley shown in Figure 15 was responsible for the severeicing of the C-212-200 The aircraft was at 3500msl (pressure650 hPa) heading north Arriving about 407∘N the aircraftentered cloud (mesolow area and secondmountainwave) andexperienced light to moderate icing (supercooled dropletssmaller than 50120583mandLWCabout 01 gm3) through 408∘NUpon reaching 409∘N the aircraft reached the first mountainwave and a region of severe icing (supercooled large dropletsgreater than 50120583m and LWC about 04 gm3) forcing themission abort
Figure 15 explains why the aircraft experienced light icingin the first cloud because LWC was low Later upon enteringthe zone of greater LWC there was severe icing coincidentwith the region of high SLD concentration Just before theaircraft turnaround a region with smaller droplets and lowLWC was evident in images produced by the CIP-GS probeThis region corresponded with the northernmost mountainwave Back to the south the aircraft reentered the region ofhigher LWC and SLD again enduring severe icing The pilotascended from 3500 to 3800msl in an attempt to get abovecloud but as seen by the WRF output cloud tops clearlyexceeded this altitude
During the return flight the icing changed from moder-ate to light south of 408∘N and around407∘Nthe craft exitedthe cloudThere the pilot activated the anti-icing systems thatdetached the ice accumulated on the wing profile
14 The Scientific World Journal
41∘30998400N
41∘N
40∘30998400N
40∘N
39∘30998400N
5∘30998400W 5∘W 4∘30998400W 4∘W 3∘30998400W 3∘W 2∘30998400W
Terrain height contours 0 to 2000 by 250
Aircraft trajectory
minus125 minus12 minus115 minus11 minus105 minus10 minus95
1000
1000
1000
1500
1000
1000
1000
1500
500
500
500
) at 650hPa
Temperature (C)
Temperature (C
Figure 14 Temperature at 650 hPa in D03 Aircraft trajectory has been superimposed
41∘30998400N
41∘N
41∘30998400N
40∘N
39∘30998400N
5∘30998400W 5∘W 4∘30998400W 4∘W 3∘30998400W 3∘W 2∘30998400W
Terrain height (m)250 500 750 1000 1250 1500 1750 2000
Liquid water content (gkg) at 650hPa
Aircraft trajectory
(a)
50
40
30
20
10
000 5 10 15 20 25
Grid pointsSouth North
Cloud water mixing ratio (gkg)
Cloud water mixing ratio (gkg)
0025 01 0175 025 0325 04
Hei
ght (
km)
Aircraft trajectory
(b)
Figure 15 Liquid water content at 650 hPa (a) and on a cross section (b) of domain D03 Aircraft trajectory has been superimposed
The Scientific World Journal 15
A cloudless band just downwind of the GuadarramaMountains is evident in the WRF output This band wascaused by Foehn windThese winds cause descending air andheating by compression on the lee side dissipating the cloudsSubsequently the air is forced to rise by mountain waves(with additional ascent caused by the mesolow in our case)This rising air cools by expansion forming clouds associatedwith mountain waves after reaching the dew point level [22]These authors showed that gravity waves produce significantamounts of supercooled LWC
The region of aircraft icing had stratiform clouds withweak updrafts Politovich [25] stated that when such cloudshave maritime characteristics (as in this case because thedominant air mass was maritime arctic) such as highhumidity and very low IN concentration hindering ice crystalformation they create an environment conducive to icing
The updraft in the Guadarrama Mountains was themain cause of SLD accumulation in the region of aircrafticing because it provided liquid water mixing and timefor collision-coalescence processes The updraft also allowedSLD accumulation because it obstructed precipitation [74]The updraft was generated by mountain waves and strength-ened by the mesolow in the lee of the mountains
After analyzing the D03 output of WRF we concludedthat the severe icing of the C-212-200 aircraft was caused bymountain waves The aircraft first crossed the second (south-ernmost) mountain wave experiencing light to moderateicing since the updraft there was less intense and there wasless LWC However the aircraft reached the northernmostmountain wave over the Lozoya Valley experiencing severeicing caused by updrafts greater than 1ms and LWC inexcess of 04 gm3 In addition the high SLD concentrationcaused ice accretion in areas unprotected by anti-icing sys-tems forcing flight termination Stationary gravity waves arecommonly dominated by cloud droplets smaller than 20 120583mbut in 2ms updrafts drop sizes between 50 and 500 120583m canprevail generating the greatest risk of aircraft icing [75]
5 Conclusions
In summary severe icing of a C-212-200 aircraft during anapproach to the Guadarrama Mountains on February 1 2012occurred as a result of several factors
(i) Temperatures encountered by the aircraft at 3500mslwere optimal for icing around minus12∘C This facttogether with a low IN concentration (measured atthe surface of Lozoya Valley by an isothermal cloudchamber during the flight) hindered the nucleationprocess Furthermore the radiometer registered astable layer just below 600 hPa This weak ther-mal inversion favoured formation of vertical shearincreasing collision-coalescence process efficiencyLWC presence was detected by CAPS observationwhich demonstrates that most of the hydrometeors inthe gravity wave over the Lozoya Valley were liquid
(ii) In the WRF simulation a dynamic tropopauseanomaly approaching from north of the IberianPeninsula pushed a warm andmoist air mass ahead of
it Secondarily another dynamic tropopause anomalysouthwest of the peninsula supported moisture accu-mulation in the central peninsula Airflow perpendic-ular to the Guadarrama Mountains during the hoursbefore the flight formed a downwind mesolow iden-tified by an area of low pressure and a cyclonic gyreThis mesolow favoured convergence and updraftsin the region of aircraft icing Together with themesolow mountain waves were the main cause ofupdrafts in the lee of the Guadarrama MountainsThese updrafts provided LWC sufficient time formixing and SLD accumulation A neutral atmo-sphere below 4 km altitude permitted the formationof gravity waves Further a stable layer above thisaltitude blocked development of these gravity wavesso a layer of high concentration of SLD and LWCappeared just beneath cloud top
The combination of all these factors created an optimalenvironment for aircraft icing in a small region a few kilome-tres downwind of the GuadarramaMountains between 3500and 4000msl
Conflict of Interests
The authors declare that there is no conflict of interestsregarding the publication of this paper
Acknowledgments
This paper was supported by the following Grants TECO-AGUA Micrometeocom and Granimetro (CGL2010-15930)and LE220A11-2 and LE003B009 awarded by the Junta deCastilla y Leon and MINECO Special thanks are due toRoberto Weigand Angel Guerrero Steven Hunter AnalisaWeston and Lauren Giera The authors would like to thankCanal de Isabel II Gestion INTA and CLAEX for thefacilities Sergio Fernandez-Gonzalez acknowledges the grantsupported from the FPU program
References
[1] S G Cober G A Isaac and J W Strapp ldquoCharacterizationsof aircraft icing environments that include supercooled largedropsrdquo Journal of Applied Meteorology vol 40 no 11 pp 1984ndash2002 2001
[2] B C Bernstein FMcDonoughM K Politovich et al ldquoCurrenticing potential algorithm description and comparison withaircraft observationsrdquo Journal of Applied Meteorology vol 44no 7 pp 969ndash986 2005
[3] F T Lynch and A Khodadoust ldquoEffects of ice accretions onaircraft aerodynamicsrdquo Progress in Aerospace Sciences vol 37no 8 pp 669ndash767 2001
[4] S G Cober J W Strapp and G A Isaac ldquoAn example of super-cooled drizzle drops formed through a collision-coalescenceprocessrdquo Journal of Applied Meteorology vol 35 no 12 pp2250ndash2260 1996
[5] J Marwitz M Politovich B Bernstein et al ldquoMeteorologicalconditions associated with the ATR72 aircraft accident near
16 The Scientific World Journal
Roselawn Indiana on 31October 1994rdquoBulletin of theAmericanMeteorological Society vol 78 no 1 pp 41ndash52 1997
[6] J-M Carriere C Lainard C Le Bot and F Robart ldquoAclimatological study of surface freezing precipitation inEuroperdquoMeteorological Applications vol 7 no 3 pp 229ndash238 2000
[7] J W Strapp R A Stuart and G A Isaac ldquoA Canadianclimatology of freezing precipitation and a detailed studyusing data from St Johnrsquos Newfoundlandrdquo in Proceedings ofInternational Conferences On Aircraft Inflight Icing pp 45ndash56Federal Aviation Administration Springfield Va USA 1996
[8] B M Pobanz J D Marwitz and M K Politovich ldquoConditionsassociated with large-drops regionsrdquo Journal of Applied Meteo-rology vol 33 no 11 pp 1366ndash1372 1994
[9] R M Rasmussen I Geresdi G Thompson K Manningand E Karplus ldquoFreezing drizzle formation in stably stratifiedlayer clouds the role of radiative cooling of cloud dropletscloud condensation nuclei and ice initiationrdquo Journal of theAtmospheric Sciences vol 59 no 4 pp 837ndash860 2002
[10] A V Korolev and G A Isaac ldquoDrop growth due to highsupersaturation caused by isobaric mixingrdquo Journal of theAtmospheric Sciences vol 57 no 10 pp 1675ndash1685 2000
[11] B C Bernstein T A Omeron M K Politovich and FMcDonough ldquoSurfaceweather features associatedwith freezingprecipitation and severe in-flight aircraft icingrdquo AtmosphericResearch vol 46 no 1-2 pp 57ndash73 1998
[12] G J Huffman and G A Norman Jr ldquoThe supercooled warmrain process and the specification of freezing precipitationrdquoMonthly Weather Review vol 116 no 11 pp 2172ndash2182 1988
[13] R M Rauber and L O Grant ldquoThe characteristics anddistribution of cloud water over the mountains of northernColorado during wintertime storms Part II spatial distributionandmicrophysical characteristicsrdquo Journal of ClimateampAppliedMeteorology vol 25 no 4 pp 489ndash504 1986
[14] R M Rauber and A Tokay ldquoAn explanation for the existenceof supercooled water at the top of cold cloudsrdquo Journal of theAtmospheric Sciences vol 48 no 8 pp 1005ndash1023 1991
[15] D C Rogers ldquoMeasurements of natural ice nuclei with acontinuous flow diffusion chamberrdquo Atmospheric Research vol29 no 3-4 pp 209ndash228 1993
[16] AV Korolev G A Isaac S G Cober JW Strapp and JHallettldquoMicrophysical characterization of mixed-phase cloudsrdquoQuar-terly Journal of the Royal Meteorological Society vol 129 no 587pp 39ndash65 2003
[17] GN Petersen J E Kristjansson andH Olafsson ldquoThe effect ofupstream wind direction on atmospheric flow in the vicinity ofa large mountainrdquoQuarterly Journal of the Royal MeteorologicalSociety vol 131 no 607 pp 1113ndash1128 2005
[18] M H Bauer G J Mayr I Vergeiner and H Pichler ldquoStronglynonlinear flow over and around a three-dimensional mountainas a function of the horizontal aspect ratiordquo Journal of theAtmospheric Sciences vol 57 no 24 pp 3971ndash3991 2000
[19] R B Smith S Skubis J D Doyle A S Broad C Kiemle andH Volkert ldquoMountain waves over Mont Blanc influence of astagnant boundary layerrdquo Journal of the Atmospheric Sciencesvol 59 no 13 pp 2073ndash2092 2002
[20] C Ramis R Romero V Homar S Alonso and M AlarconldquoDiagnosis and numerical simulation of a torrential precipita-tion event in Catalonia (Spain)rdquo Meteorology and AtmosphericPhysics vol 69 no 1-2 pp 1ndash21 1998
[21] E Garcıa-Ortega L Fita R Romero L Lopez C Ramis andJ L Sanchez ldquoNumerical simulation and sensitivity study of a
severe hailstorm in northeast SpainrdquoAtmospheric Research vol83 no 2-4 pp 225ndash241 2007
[22] R F Reinking J B Snider and J L Coen ldquoInfluences of storm-embedded orographic gravity waves on cloud liquid water andprecipitationrdquo Journal of Applied Meteorology vol 39 no 6 pp733ndash759 2000
[23] W A Cooper and J D Marwitz ldquoWinter storms over the SanJuan mountains Part III seeding potentialrdquo Journal of AppliedMeteorology vol 19 no 8 pp 942ndash949 1980
[24] P A Vaillancourt A Tremblay S G Cober and G A IsaacldquoComparison of aircraft observations with mixed-phase cloudsimulationsrdquo Monthly Weather Review vol 131 no 4 pp 656ndash671 2002
[25] M K Politovich ldquoAircraft icing caused by large supercooleddropletsrdquo Journal of AppliedMeteorology vol 28 no 9 pp 856ndash868 1989
[26] S G Cober and G A Isaac ldquoCharacterization of aircraft icingenvironments with Supercooled Large Drops for application tocommercial aircraft certificationrdquo Journal of Applied Meteorol-ogy and Climatology vol 51 no 2 pp 265ndash284 2012
[27] T Hauf and F Schroder ldquoAircraft icing research flights inembedded convectionrdquo Meteorology and Atmospheric Physicsvol 91 no 1ndash4 pp 247ndash265 2006
[28] D Baumgardner J L Brenguier A Bucholtz et al ldquoAirborneinstruments to measure atmospheric aerosol particles cloudsand radiation a cookrsquos tour of mature and emerging technol-ogyrdquo Atmospheric Research vol 102 no 1-2 pp 10ndash29 2011
[29] J L Sanchez R Posada E Garcıa-Ortega L Lopez and JL Marcos ldquoA method to improve the accuracy of continuousmeasuring of vertical profiles of temperature and water vapordensity by means of a ground-based microwave radiometerrdquoAtmospheric Research vol 122 pp 43ndash54 2013
[30] D Baumgardner H Jonsson W Dawson D OrsquoConnor and RNewton ldquoThe cloud aerosol and precipitation spectrometer anew instrument for cloud investigationsrdquoAtmospheric Researchvol 59-60 pp 251ndash264 2001
[31] A Castro J L Marcos J Dessens J L Sanchez and R FraileldquoConcentration of ice nuclei in continental and maritime airmasses in Leon (Spain)rdquo Atmospheric Research vol 47-48 pp155ndash167 1998
[32] B C Bernstein ldquoRegional and local influences on freezingdrizzle freezing rain and ice pellet eventsrdquo Weather andForecasting vol 15 no 5 pp 485ndash508 2000
[33] A V Korolev G A Isaac J W Strapp S G Cober and H WBarker ldquoIn situ measurements of liquid water content profilesin midlatitude stratiform cloudsrdquoQuarterly Journal of the RoyalMeteorological Society vol 133 no 628 pp 1693ndash1699 2007
[34] D M Schultz and J A Knox ldquoBanded convection caused byfrontogenesis in a conditionally symmetrically and inertiallyunstable environmentrdquo Monthly Weather Review vol 135 no6 pp 2095ndash2110 2007
[35] R S Schumacher D M Schultz and J A Knox ldquoConvec-tive snowbands downstream of the rocky mountains in anenvironment with conditional dry symmetric and inertialinstabilitiesrdquoMonthlyWeather Review vol 138 no 12 pp 4416ndash4438 2010
[36] J T Moore A C Czarnetzki and P S Market ldquoHeavyprecipitation associated with elevated thunderstorms formed ina convectively unstable layer aloftrdquoMeteorological Applicationsvol 5 no 4 pp 373ndash384 1998
The Scientific World Journal 17
[37] K L Horgan D M Schultz J E Hales Jr S F Corfidi and RH Johns ldquoA five-year climatology of elevated severe convectivestorms in the United States east of the Rocky MountainsrdquoWeather and Forecasting vol 22 no 5 pp 1031ndash1044 2007
[38] E Koffi M Schneebeli E Brocard and C Matzler ldquoTheuse of radiometer derived convective indices in thunderstormnowcastingrdquo IAP Research Report 2007-02-MW Institut furangewandte Physik Universitat Bern 2007
[39] C W Ulbrich ldquoNatural variations in the analytical form ofthe raindrop size distributionrdquo Journal of Climate amp AppliedMeteorology vol 22 no 10 pp 1764ndash1775 1983
[40] T L Clark ldquoA study in cloud phase parameterization using thegamma distributionrdquo Journal of the Atmospheric Sciences vol31 pp 142ndash155 1973
[41] D S Wilks Statistical Methods in the Atmospheric SciencesAcademic Press 1995
[42] A V Korolev G A Isaac I P Mazin and H W BarkerldquoMicrophysical properties of continental clouds from in situmeasurementsrdquo Quarterly Journal of the Royal MeteorologicalSociety vol 127 no 576 pp 2117ndash2151 2001
[43] H L Crutcher ldquoA note on the possible misuse of theKolmogorov-Smirnov testrdquo Journal of Applied Meteorology vol14 no 8 pp 1600ndash1603 1975
[44] G P Ellrod and A A Bailey ldquoAssessment of aircraft icingpotential and maximum icing altitude from geostationarymeteorological satellite datardquo Weather and Forecasting vol 22no 1 pp 160ndash174 2007
[45] R Ashenden W Lindberg J D Marwitz and B Hoxie ldquoAirfoilperformance degradation by supercooled cloud drizzle andrain drop icingrdquo Journal of Aircraft vol 33 no 6 pp 1040ndash10461996
[46] W R Sand W A Cooper M K Politovich and D L VealldquoIcing conditions encountered by a research aircraftrdquo Journal ofClimate amp Applied Meteorology vol 23 no 10 pp 1427ndash14401984
[47] G Vidaurre and J Hallett ldquoIce and water content of stratiformmixed-phase cloudrdquo Quarterly Journal of the Royal Meteorolog-ical Society vol 135 no 642 pp 1292ndash1306 2009
[48] G D Modica S T Heckman and R M Rasmussen ldquoAnapplication of an explicit microphysics mesoscale model to aregional icing eventrdquo Journal of AppliedMeteorology vol 33 no1 pp 53ndash64 1994
[49] J Reisner R M Rasmussen and R T Bruintjes ldquoExplicitforecasting of supercooled liquid water in winter storms usingthe MM5 mesoscale modelrdquo Quarterly Journal of the RoyalMeteorological Society vol 124 no 548 pp 1071ndash1107 1998
[50] W C Skamarock M L Weisman J B Klemp et al ldquoAdescription of the advanced research WRF version 2rdquo NCARTech 2005
[51] E KalnayMKanamitsu R Kistler et al ldquoTheNMCNCAR40-year reanalysis projectrdquo Bulletin of the American MeteorologicalSociety vol 76 pp 1ndash37 1996
[52] B E K Nygaard J E Kristjansson and L Makkonen ldquoPredic-tion of in-cloud icing conditions at ground level using theWRFmodelrdquo Journal of AppliedMeteorology and Climatology vol 50no 12 pp 2445ndash2459 2011
[53] G Thompson P R Field R M Rasmussen and W D HallldquoExplicit forecasts of winter precipitation using an improvedbulk microphysics scheme Part II implementation of a newsnow parameterizationrdquo Monthly Weather Review vol 136 no12 pp 5095ndash5115 2008
[54] F Chen and J Dudhia ldquoCoupling and advanced land surface-hydrology model with the Penn State-NCAR MM5 modelingsystem Part I model implementation and sensitivityrdquoMonthlyWeather Review vol 129 no 4 pp 569ndash585 2001
[55] Z Janjic The Surface Layer Parameterization in the NCEPEta Model World Meteorological Organization-publicationsWMO TD 4-4 1996
[56] E J Mlawer S J Taubman P D Brown M J Iacono and S AClough ldquoRadiative transfer for inhomogeneous atmospheresRRTM a validated correlated-k model for the longwaverdquoJournal of Geophysical Research D vol 102 no 14 pp 16663ndash16682 1997
[57] J Dudhia ldquoNumerical study of convection observed duringthe Winter Monsoon Experiment using a mesoscale two-dimensionalmodelrdquo Journal of theAtmospheric Sciences vol 46no 20 pp 3077ndash3107 1989
[58] KA Browning ldquoThedry intrusion perspective of extra-tropicalcyclone developmentrdquoMeteorological Applications vol 4 no 4pp 317ndash324 1997
[59] B C Bernstein T A Omeron F Mcdonough and M K Poli-tovich ldquoThe relationship between aircraft icing and synoptic-scale weather conditionsrdquo Weather and Forecasting vol 12 no4 pp 742ndash762 1997
[60] R M Rauber L S Olthoff M K Ramamurthy D Miller andK E Kunkel ldquoA synoptic weather pattern and sounding-basedclimatology of freezing precipitation in the United States East ofthe Rocky Mountainsrdquo Journal of Applied Meteorology vol 40no 10 pp 1724ndash1747 2001
[61] Y-L Lin N-H Lin and R P Weglarz ldquoNumerical modelingstudies of lee mesolows mesovortices and mesocyclones withapplication to the formation of Taiwan mesolowsrdquoMeteorologyand Atmospheric Physics vol 49 no 1-4 pp 43ndash67 1992
[62] G K Batchelor An Introduction to Fluid Dynamics CambridgeUniversity Press Cambridge UK 1967
[63] R B Smith ldquoHydrostatic airflow over mountainsrdquo Advances inGeophysics vol 31 pp 1ndash41 1989
[64] I Geresdi R Rasmussen W Grabowski and B BernsteinldquoSensitivity of freezing drizzle formation in stably stratifiedclouds to ice processesrdquo Meteorology and Atmospheric Physicsvol 88 no 1-2 pp 91ndash105 2005
[65] S E Koch and C OrsquoHandley ldquoOperational forecasting anddetection of mesoscale gravity wavesrdquoWeather and Forecastingvol 12 no 2 pp 253ndash281 1997
[66] K Ikeda R M Rasmussen W D Hall and G ThompsonldquoObservations of freezing drizzle in extratropical cyclonicstorms during IMPROVE-2rdquo Journal of the Atmospheric Sci-ences vol 64 no 9 pp 3016ndash3043 2007
[67] G N Petersen H Olafsson and J E Kristjansson ldquoFlow inthe lee of idealized mountains and greenlandrdquo Journal of theAtmospheric Sciences vol 60 no 17 pp 2183ndash2195 2003
[68] C C Epifanio and D R Durran ldquoLee-vortex formation in free-slip stratified flow over ridges Part II mechanisms of vorticityand PV production in nonlinear viscous wakesrdquo Journal of theAtmospheric Sciences vol 59 no 7 pp 1166ndash1181 2002
[69] R M Rauber ldquoCharacteristics of cloud ice and precipitationduring wintertime storms over the mountains of northernColoradordquo Journal of Climate amp Applied Meteorology vol 26no 4 pp 488ndash524 1987
[70] JDMarwitz ldquoWinter storms over the San JuanMountains PartI dynamical processesrdquo Journal of Applied Meteorology vol 19no 8 pp 913ndash926 1980
18 The Scientific World Journal
[71] W A Cooper and C P R Saunders ldquoWinter storms over theSan Juan Mountains Part II microphysical processesrdquo Journalof Applied Meteorology vol 19 no 8 pp 927ndash941 1980
[72] K Sassen R M Rauber and J B Snider ldquoMultiple remote sen-sor observations of supercooled liquid water in a winter stormat Beaver Utahrdquo Journal of Climate amp Applied Meteorology vol25 no 6 pp 825ndash834 1986
[73] Z Cui A M Blyth K N Bower J Croisier and T ChoulartonldquoAircraftmeasurements of wave cloudsrdquoAtmospheric Chemistryand Physics vol 12 no 20 pp 9881ndash9892 2012
[74] N Song and J Marwitz ldquoA numerical study of the warmrain process in orographic cloudsrdquo Journal of the AtmosphericSciences vol 46 no 22 pp 3479ndash3486 1989
[75] R F Reinking A S Frisch B W Orr D L Korn L RBissonnette and G Roy ldquoRemote sensing observation of effectsof mountain blocking on travelling gravity-shear waves andassociated cloudsrdquo Boundary-Layer Meteorology vol 109 no 3pp 255ndash284 2003
Submit your manuscripts athttpwwwhindawicom
Hindawi Publishing Corporationhttpwwwhindawicom Volume 2014
ClimatologyJournal of
EcologyInternational Journal of
Hindawi Publishing Corporationhttpwwwhindawicom Volume 2014
EarthquakesJournal of
Hindawi Publishing Corporationhttpwwwhindawicom Volume 2014
Hindawi Publishing Corporationhttpwwwhindawicom
Applied ampEnvironmentalSoil Science
Volume 2014
Mining
Hindawi Publishing Corporationhttpwwwhindawicom Volume 2014
Journal of
Hindawi Publishing Corporation httpwwwhindawicom Volume 2014
International Journal of
Geophysics
OceanographyInternational Journal of
Hindawi Publishing Corporationhttpwwwhindawicom Volume 2014
Journal of Computational Environmental SciencesHindawi Publishing Corporationhttpwwwhindawicom Volume 2014
Journal ofPetroleum Engineering
Hindawi Publishing Corporationhttpwwwhindawicom Volume 2014
GeochemistryHindawi Publishing Corporationhttpwwwhindawicom Volume 2014
Journal of
Atmospheric SciencesInternational Journal of
Hindawi Publishing Corporationhttpwwwhindawicom Volume 2014
OceanographyHindawi Publishing Corporationhttpwwwhindawicom Volume 2014
Advances in
Hindawi Publishing Corporationhttpwwwhindawicom Volume 2014
MineralogyInternational Journal of
Hindawi Publishing Corporationhttpwwwhindawicom Volume 2014
MeteorologyAdvances in
The Scientific World JournalHindawi Publishing Corporation httpwwwhindawicom Volume 2014
Paleontology JournalHindawi Publishing Corporationhttpwwwhindawicom Volume 2014
ScientificaHindawi Publishing Corporationhttpwwwhindawicom Volume 2014
Hindawi Publishing Corporationhttpwwwhindawicom Volume 2014
Geological ResearchJournal of
Hindawi Publishing Corporationhttpwwwhindawicom Volume 2014
Geology Advances in
2 The Scientific World Journal
nuclei at those temperatures [12]Thus thismechanism is notpronounced in clouds with tops at temperatures above minus15∘CRauber and Grant [13] indicated that supercooled liquidwater (SLW) layers are common in orographic cloud systemswith cloud tops at temperatures as low as minus31∘C The causeof this phenomenon can be explained by imbalances betweenliquid water content (LWC) input by condensation and thenucleation rate which is very slow [14] To this it must beadded that the freezing nuclei concentration is several ordersof magnitude lower than that of condensation nuclei [15]
The average glaciation time in stratiform clouds is around10 minutes [16]Therefore if the hydrometeor residence timeis much smaller than the characteristic glaciation time it isexpected that virtually all hydrometeors will remain in theliquid phaseThis is explained by Korolev and Isaac [10] whoposit that SLD formed in updrafts have an average life of a fewtenths of a second
The processes discussed above are modified by terrainmaking it necessary to perform a comprehensive mesoscaleanalysis The importance of atmospheric flow modificationcaused by mountains depends on several parameters suchas mountain height and shape atmospheric stability windspeed and direction [17] On the lee side of mountainsan area of weaker wind or eddy shedding can appear [18]and mountain waves can form [19] Various works [20 21]have shown the formation of mesolows on the lee side ofseveral mountain ranges of the Iberian Peninsula a result ofa windflow perpendicular to the orographic barrier
Reinking et al [22] indicated that prefrontal flow isforced to ascend when it passes over an orographic barrierOrographic lifting produces regions of LWCaccumulation onthe windward slope After passing the orographic barrier airdescends abruptly and generates a cloudless area because ofthe Foehn effect Subsequently the flow rises suddenly gen-erating the characteristic gravity waves Gravity waves formregions of short-lived but considerable amounts of LWC [23]
Numerical weather forecastingmodels are unable to fore-cast the concentration of SLD accurately because commonlyused parameterizations generally overestimate the amount offrozen water content and underestimate the concentration ofsupercooled liquid water [24]
Consequently field campaigns using research aircraft tomeasure in situ supercooled liquid water and frozen watercontent are very important to improve the accuracy ofnumerical models The vast majority of such field projectshave been carried out in the USA and Canada [1 25 26] withsome exceptions as in Germany [27]
Under the TECOAGUAproject a series of flight plans hasbeen designed to collect scientific data from in-cloud systemscapable of producing rainfall duringwinterThese flightswereexecuted by a C-212-200 aircraft belonging to the NationalInstitute for Aerospace Technology (INTA) One goal of thisproject was to fly in an icing environment to understandicing conditions that are not infrequent near Madrid-Barajasairport
As noted by Baumgardner et al [28] the Cloud Aerosoland Precipitation Spectrometer (CAPS) is suitable for mea-suring microphysical variables within clouds so it wasdecided to install this instrument on the project aircraft
with the aim of measuring SLD concentration This probeis capable of measuring hydrometeor concentration and size(and distinguishing their phase) aerosols LWC temperaturerelative humidity (RH) and vapour density among othervariables
On February 1 2012 the aircraft took off from the Tor-rejon de Ardoz military base (Madrid) and began collectingvalid data at 1257 (all times UTC) The aircraft flew northwith the goal of collecting data on the north side of theCentral System Flying over the Lozoya Valley at altitudeabout 3500 msl the aircraft penetrated a region with highSLD concentration and temperatures around minus12∘C andLWC as much as 044 gm3 This caused ice accumulation onthe profile of the aircraft wings forcing termination of theresearch flight
The objective of the present study is to analyse thesynoptic situation and mesoscale conditions during the dayof this aircraft icing To do this weather conditions weremeasured by the available instrumentation and the synopticand mesoscale factors causing the icing were analyzed usingthe Weather Research and Forecasting (WRF) model
2 Experimental Design and Methodology
21 Study Area Icing of the C-212-200 aircraft on February1 2012 occurred while attempting to cross the GuadarramaMountains This mountain range is between the provincesof Segovia and Madrid in central Spain The orientation ofridges and valleys is predominantly southwest-northeastThesouthwest end of the range is at 40∘221015840N 4∘181015840W and itsnortheast end at 41∘41015840N 3∘441015840W
Elevations in these mountains are well in excess of2000msl The mountains are separated in the middle witha higher range to the north and lower one to the south TheLozoyaValley is between these two ranges It is over this valley(Figure 1) where the aircraft traversed the region of high SLDconcentration that caused rapid icing and flight termination
22 Instrumentation
221 MP-3000A Microwave Radiometric Profiler For the2011-12 winter field project a hyperspectral multichannelmicrowave radiometer (MMWRMP-3000A)was installed at1880msl in theGuadarramaMountains (location in Figure 1)The instrument continuously measured vertical profiles oftemperature humidity LWC and water vapour density (withtemporal resolution approximately 25 minutes) to 10 kmheight The MP-3000A was manufactured by RadiometricsBoulder Colorado USA Characteristics of this instrumentand retrieved profiles are described in Sanchez et al [29]
222 CAPS The C-212-200 aircraft carried the CAPS underthe left wing during the field project The CAPS consists offive probes First is a Cloud and Aerosol Spectrometer (CAS)which measures aerosols and hydrometeor size distributionsbetween 051 and 50 120583m Second is a Cloud Imaging ProbeGrayscale (CIP-GS) which can measure hydrometeors from25 to 1550120583m and represent 2D images of hydrometeors
The Scientific World Journal 3
Madrid
Guadarrama mountains
(km)
Radiometer
SPAIN
Segovia
Torrejonairport
Cloud chamber
Lozoya valley
1
2
3
4
N
56
7
8
9
Light icing
Severe icing
High 2500
Low 500
0 10 205
Figure 1Map of GuadarramaMountainsMadrid Aircraft trajectory plus radiometer and cloud chamber locations have been superimposed
The advantage of the grey scale is that it gives additionaldetails on ice crystal characteristics and more importantlyit better defines the depth of field and permits more accu-rate hydrometeor identification Third is the LWD detector(LWC-Hotwire) probe which estimates atmospheric LWCaccurately between 001 and 3 gm3 Finally therewas a sensortomeasure airspeed and another tomeasure temperature andRH A more detailed explanation of the CAPS is found inBaumgardner et al [30]
223 Isothermal Cloud Chamber An isothermal cloudchamber was used to measure ice nuclei concentration of theair mass over the Guadarrama Mountains This instrumentwas installed at ground level at Lozoya Reservoir (location in
Figure 1) in the Lozoya Valley where the aircraft experiencedicing This cloud chamber has a tank with volume 11 L Theice nuclei concentration was measured at minus23∘C because ofthe low concentrations recorded at warmer temperatures inprevious Iberian Peninsula field projectsThe procedure usedin the campaign was described in Castro et al [31] Thisinstrument is only capable of taking static measurements soseveral measurements were taken during the study day toanalyze the evolution of ice nuclei concentration
3 Observation
The aircraft took off from Torrejon Airport at 1257 onFebruary 1 2012 The aim of this flight was to investigate
4 The Scientific World Journal
expected icing conditions from the approach of a cold front tothe study area Upon approach to theGuadarramaMountains(1310) the aircraft began to experience light icing Icingconditions were worst after reaching the Lozoya Valley (1315)and consequently the aircraft experienced severe icing andthe pilot was forced to abort the mission and return to theairportThe aircraft continued to encounter severe icing until1319 when it exited the valley Light icing occurred near theGuadarrama Mountains until 1322 when the aircraft finallyexited cloudThe aircraft landed at Torrejon at 1331Theflightpath is shown in Figure 1 The icing episode was recorded bythe instrumentation as follows
31 MP-3000A Radiometer Atmospheric stability was con-tinuously monitored by the MP-3000A microwave radio-metric profiler Figure 2 shows vertical profiles at differenttimes At 0900 on February 1 it was observed that thenocturnal inversion had not dissipated at low levels Therewas practically neutral stability from 720 hPa to 630 hPawhere there was a transition layer to greater stability at levels600 hPa and above There was neutral static stability (nearlyunstable) between 750 and 600 hPa abovewhichwas a strongstable layer
At 1245 when the aircraft neared the zone of interestlayers near the ground were saturated and the inversionhad weakened considerably Vertical profiles generally indi-cated an increasingly unstable atmosphere Subsequently themost unstable atmospheric layer developed from 750 hPa to600 hPa There was a progressive increase of moisture in thislayer during preflight (1200 to 1300) There were clouds inthis layer and this was where the aircraft experienced icing(CAPS detected a region with high SLD concentration at650 hPa) From 1315 to 1330 around which time the aircraftexperienced severe icing the temperature and dew pointtemperature curves between 750 and 600 hPa were closeindicating cloudiness Subsequent profiles (1345ndash1400) indi-cated lesser instability and humidity so we conclude that theaircraft crossed the Lozoya Valley during the most favourableconditions for aircraft icing all day
Above the aforementioned unstable layer (just below600 hPa) was a more stable region that persisted the entireday representing a weak thermal inversion This layer pre-vented updrafts in the Lozoya Valley from reaching higherlevels and favoured formation of vertical shear Bernstein[32] showed that stably stratified conditions are conducive toformation of regions of high SLD concentration This wouldfavour shear near cloud tops which causes intense mixingand thereby efficient and rapid SLD formation [33]
The thermodynamic profile revealed the absence of aldquowarm layerrdquo indicating that SLD causing aircraft icing wereformed by condensation followed by collision-coalescencethe entire process occurring at temperatures colder than 0∘CThese profiles match ldquotype Ardquo described by Bernstein [32] inwhich the entire atmosphere has subfreezing temperaturesincluding the saturated layer
The MMWR data permit continuous calculation of sta-bility indices and determination of the presence or absenceof convection Although there are many indices that can
be applied to this purpose in summer there are few suchfor winter application Most Unstable Convective AvailablePotential Energy (MUCAPE) has been widely used as avariation on CAPE in studies of winter convection [34ndash36]This index represents the total potential energy available tothe most unstable air parcel within the lowest 300 mb whilebeing lifted to its level of free convection To obtain thisindex CAPE must first be computed by lifting parcels fromeach level in the humidity and temperature profiles ThenMUCAPE is taken as the greatest CAPE encountered that isthe most unstable parcel
For continuous monitoring the radiometer data wereused Intermediate values of MUCAPE were recorded inthe hours before the flight (100ndash200 Jkg) but these valuesdeclined to 0 Jkg at 1300 (Figure 3) These values are inad-equate for convective development [37 38]
32 CAPS Hydrometeor size distributions from data col-lected by the CAPS during the flight of February 1 wereanalyzed in the region of aircraft icing The gamma distribu-tion function was chosen for these distributions because itfaithfully represents droplet size distributions within cloudsThis function was defined by Ulbrich [39] and was selectedbecause it better represents larger droplets The functionhas three parameters dependent on time (and space in theEulerian case) the concentration of particles their averagediameter and spectrumwidth [40]Theparameters were esti-mated following the maximum likelihood method definedby Wilks [41] The gamma distribution function has beenused for representation of the size distribution of cloudhydrometeors [42]The Lilliefors test [43] was used to ensuregoodness of fit at the 005 level of significance
Average hydrometeor size distributions were calculatedevery 30 seconds CAPSmeasurements in cloud are shown inTable 1 Images from the CIP (part of CAPS) for each periodin Table 1 are shown in Figure 4 These nine measurementscorrespond to the highlighted circles along the trajectory inFigure 1 described previously in Section 21 Correspondingdrop size distributions are shown in Figure 5 for which agamma distribution function has been applied
Initially the predominant droplet size waslt25 120583mAs theaircraft approached position 1 an increasingly large numberof hydrometeors with size 25ndash50120583m were measured At thattime the aircraft experienced light icing but no loss of liftThis period corresponds with the three first times of Table 1and first three images of Figure 4 Curves of the hydrometeorsize distribution (curves 1 2 and 3 in Figure 5) did not fit thegamma distribution
Approaching position 3 the aircraft suddenly reachedan area with a high concentration of droplets with size 50ndash100 120583m This produced severe icing forcing the pilot to turnaround toward the south He tried to climb out of cloud butthe SLD concentration at heights around 3800ndash3900msl waseven greater than 200mbelowThere the aircraft encounteredthe worst icing conditions This cloud had large quantitiesof LWC and SLD at temperatures around minus12∘C freezingliquid drops as soon as they contacted the aircraft fuselageThe severe icing corresponds with the 4th 5th and 6th time
The Scientific World Journal 5
200
250
300
400
500
600
700
800850
minus40 minus30 minus20 minus10 0 10
(∘C)
(hPa
)
900
(a)
200
250
300
400
500
600
700
800850
minus40 minus30 minus20 minus10 0 10
(∘C)
(hPa
)
1245
(b)
200
250
300
400
500
600
700
800850
minus40 minus30 minus20 minus10 0 10
(∘C)
(hPa
)
1300
(c)
200
250
300
400
500
600
700
800850
minus40 minus30 minus20 minus10 0 10
(∘C)
(hPa
)1315
(d)
200
250
300
400
500
600
700
800850
minus40 minus30 minus20 minus10 0 10
(∘C)
(hPa
)
1330
(e)
200
250
300
400
500
600
700
800850
minus40 minus30 minus20 minus10 0 10
(∘C)
(hPa
)
451345
(f)
Figure 2 Skew-Tlog-P diagram of radiometer data at 900 1245 1300 1315 1330 and 1345 on February 1 2012 Temperature (red lines)dew point (blue dashed lines)
6 The Scientific World Journal
Table1Va
riables
measuredby
CAPS
andgammad
istrib
utionparameters
Time
(UTC
)Latitud
e(∘ )
Long
itude
(∘ )High
(masl)
Temperature
(K)
LWC
(gm
3 )Num
bero
fparticlesb
ysiz
eranges
119873119905
MVD
(120583m)Λ
(cmminus1 )120583
Gam
ma
distr
ibutionfit
0ndash25
25ndash50
50ndash75
75ndash100
100ndash
125
125ndash150
150ndash
175
175ndash200
131155
4083
minus364
3585
2617
006
1082
842
11
00
0117
09
015
980
NO
1312
55
4087
minus368
3600
2615
012
1943
330
286
43
21
2317
11018
1585
NO
1314
21
4092
minus373
3570
2616
016
2157
392
297
66
66
2609
65019
1732
NO
1315
51
4095
minus377
3589
2616
021
1941
1284
513
179
9863
4024
4142
180
052
988
YES
1318
02
4095
minus369
3894
2603
028
1467
985
1174
689
315
9939
154783
526
112
532
YES
1318
3240
93
minus367
3895
2598
035
2573
2051
1296
440
104
2212
86506
302
062
1302
YES
1319
45
4090
minus359
3922
2595
011
1649
763
249
5313
53
12736
34034
1014
NO
13210
040
87
minus352
3897
2596
011
1619
878
363
8416
31
12965
39040
937
NO
132227
4082
minus344
3891
2613
002
865
273
557
00
00
1200
5024
614
NO
The Scientific World Journal 7
0
50
100
150
200
250
900
915
930
945
100
010
15
103
010
45
110
011
15
113
011
45
120
012
15
123
012
45
130
013
15
133
013
45
140
014
15
143
014
45
150
015
15
153
015
45
160
0
MU
CAPE
(Jk
g)
Figure 3 Evolution of MUCAPE index during February 1 2013
131551131421131255131155 131802 131832 131945 132100 132227
Light icing Light icingServere icing1550120583m
Figure 4 Images captured by CIP when aircraft experienced icing
steps of Table 1 The LWC increased to more than 02 gm3with peaks 044 gm3 The table indicates the huge amountsof SLD and hydrometeors over 50 120583m In the 4th 5th and6th images of Figure 4 it is seen that SLD were larger thanthe small supercooled droplets in the other images Figure 5shows how the 4th 5th and 6th curves adjusted to thegamma distribution unlike the remaining times This is veryimportant because it indicates that if the size distribution ofsupercooled liquid droplets follows the gamma distributionwe can expect moderate to severe icing if it does not do solight icing is the maximum expected
After exiting the Lozoya Valley and the cloud with SLDtoward the south average drop size gradually decreased topredominant droplets smaller than 25 120583m with light icingThis period corresponds with the 7th 8th and 9th times ofTable 1 the images in Figure 4 and curves in Figure 5 The
images captured by the CIP droplet size distributions andvalues in Table 1 for times 7 8 and 9 are similar to times 1 2and 3 except that the temperature was slightly cooler becausethe aircraft ascended to 3800ndash3900msl
Microphysical conditions observed over the Lozoya Val-ley by the aircraft during February 1 are consistent with thosedescribed by Ellrod and Bailey [44] They stated that icingis linked with temperatures between 0 and minus20∘C liquid- ormixed-phase clouds volume median diameter greater than30 120583m LWC gt 02 gm3 weak updrafts to replenish super-cooled liquid water and clouds of considerable thicknessSLD can be very dangerous to aviation because they canaccumulate beyond the capabilities of current deicing bootsThis significantly reduces aircraft performance which cannotbe alleviated by ice protection devices such as pneumaticboots [45] This occurred during the case study
8 The Scientific World Journal
0123456789
25 50 75 100 125 150 175 200
123
456
789
Drop size (120583m)
N(D
)
Figure 5 Gamma distribution curves for each of the nine times ofTable 1 and Figure 4
Cober et al [1] described favourable environmentsfor SLD development in which supercooled liquid waterdroplets greater than 50 120583m form following melting andsubsequent resupercooling or via condensation processes fol-lowed by collision-coalescence which occurred in our caseSevere icing is formed by an updraft that provides sufficientwater vapour to maintain SLD growth while existing shearnear the cloud top supports collision-coalescence processesresponsible for its formation
These results agree with those of Rauber and Tokay[14] They asserted that when the concentration of freezingnuclei is low cloud top temperature is relatively warm (aboveminus20∘C) with weak updrafts and the likelihood of a LWC layerat cloud top is high Based on data from scientific flights infield studies Sand et al [46] found that only 4 of icingreports were at temperatures below minus20∘C with about 50between minus12∘C and minus8∘C Vidaurre and Hallet [47] notedthat liquid-only clouds dominate at subfreezing temperaturesclose to 0∘C whereas ice-only clouds predominate belowminus20∘C
33 Isothermal Cloud Chamber Observations Two measure-ments with the isothermal cloud chamber were taken onFebruary 1 The first was at 958 resulting in a concentrationof 24 INL (IN are ice nuclei) The second was around flighttime at 1329 showing a decrease to 16 INL (Figure 6) Thethermal inversion during the morning which disappearedafter midday may have been responsible for the high icenuclei concentration of the first measurement The breakingof the inversion layer at the surface allowed dispersionof IN to higher levels of the troposphere The surface INconcentration at 1329 was representative of that during theflight because there was no inversion layer below 600 hPa
These values are extremely low compared with thosereported by other authors After taking nearly 1000 measure-ments in the northwestern Iberian Peninsula Castro et al [31]obtained an average of 125 INL active at minus23∘C on days withmaritime air masses Our relatively sparse IN represents an
Figure 6 Measurement of ice nuclei from isothermal cloud cham-ber at 1329
obstacle to glaciation which was a determining factor for thelarge numbers of SLD during the flight and near absence ofhydrometeors in the solid phase
At 600 hPa near the cloud tops the temperature wasslightlywarmer thanminus20∘CThis temperaturewas sufficientlywarm to prevent activation of most of the IN hinderingoptimal glaciation
4 Meteorological Analysis
WRF and othermesoscalemodels have been used for analysisof aircraft icing episodes [48 49] In this paper weather con-ditions generating icing of the C-212-200 aircraft on February1 were simulated by the WRF mesoscale model version311 [50] Initial and boundary conditions were furnished bythe National Centers for Environmental Prediction (NCEP)reanalysis which has spatial resolution 1∘ [51]
Three nested domains were defined D01 covers south-western Europe with 98 grids in both the eastwest andnorthsouth directions This domain has spatial resolution27 km and temporal resolution 3 hours and was used for thesynoptic description
Temporal resolution of domainD02 is 1 hour It covers theentire Iberian Peninsula with 125 grid points in the eastwestdirection and 107 northsouth points with spatial resolution9 km
To analyze in detail the mesoscale factors that influencedformation of icing conditions domain D03 was used Thisdomain facilitates accurate representation of weather con-ditions in the study area because it has spatial resolution3 km and temporal resolution 1 hour Figure 7 shows the threedomains D02 and D03 were used in mesoscale analysis D01for synoptic analysis The cross section axis is perpendicularto GuadarramaMountains Mesoscale models are commonly
The Scientific World Journal 9
Cross section D03
41∘30998400N
41∘N
41∘30998400N
40∘N
39∘30998400N
5∘30998400W 5∘W 4∘30998400W 4∘W 3∘30998400W 3∘W 2∘30998400W
Altitude (msl )600400 800 1000 1200 1400 1600 1800
WRF domain configuration
WRF domain configuration
WRF domain configurationD01
50∘N
55∘N
45∘N
40∘N
35∘N
20∘W 15∘W 10∘W 5∘W 0∘
D02
D03
Cross section D02
Terrain height200 400 600 800 1000 1200 1400 1600 1800 2000
43∘N
42∘N
41∘N
40∘N
39∘N
38∘N
37∘N
8∘W 6∘W 4∘W 2∘W 0∘
Figure 7 Nested domains used in WRF simulation Axis from cross section from N to S is overlaid on D02 and D03
used in forecasting and evaluation of in-cloud icing condi-tions [52]
For parameterization of microphysical processes theWRF NewThompson graupel scheme [53] was chosen since
it considers graupel and typical ice water concentrations inmountainous areas during winter Further we used the Noahland surface model [54] and Eta surface layer scheme definedby Janjic [55] For longwave radiation the Rapid Radiative
10 The Scientific World Journal
Geopotential (gpm) at 500hPaSea level pressure (hPa)
50∘N
45∘N
40∘N
35∘N
20∘W 15∘W 10∘W 5∘W 0∘ 5∘ESea level pressure contours 980 to 1040 by 2
Geopotential (gpm)5300 5400 5500 5600 5700
10241028
1035
1032
1028
1024
1020
1016
1020
1016
1024H1026
L1015
Figure 8 Sea level pressure and geopotential height at 500 hPamodeled by WRF for domain D01
Transfer Model [56] was used along with the scheme ofDudhia [57] for shortwave radiation
41 Synoptic Overview From domain D01 it was found thatthe synoptic situation in Europewas dominated by a powerfulSiberian anticyclone (Figure 8) forcing a dry and very coldnortheast wind into Central Europe Northwest winds werepredominant during the morning over the Iberian Peninsula
Figure 9 depicts RH and wind at 300 hPa Progress ofa dry intrusion induced the advection of moist air over thepeninsula in a manner similar to the pattern shown byBrowning [58] This dry intrusion is caused by a dynamictropopause anomaly which is derived from the jet streamA weak cold front associated with the anomaly crossed theIberian Peninsula from north to south during the studyday This synoptic pattern was associated with aircraft icingby Bernstein et al [59] The situation coincided with thosereported by Bernstein et al [11] who related the leadingedges of arctic and cold fronts to in-flight icing episodescited in pilot reportsThis also fits the ldquoArctic Frontrdquo synopticpattern described by Rauber et al [60] who indicated thatthis pattern is the most common in freezing precipitationepisodes
There was another anomaly to the west of Lisbon at 1200Aweakened branch thereof penetrated the Iberian Peninsulaat latitudes slightly south of Madrid The two anomaliestended to associate causing the accumulation and ascent ofmoist air in a strip between the two
Relative humidity () at 300hPa
50∘N
45∘N
40∘N
35∘N
20∘W 15∘W 10∘W 5∘W 0∘ 5∘E
Relative humidity ()20 40 60 80
Wind (msminus1) at 300hPa
Figure 9 Relative humidity and wind at 300 hPa modeled by WRFin domain D01
The formation of dynamic tropopause anomalies is con-nected with the position of the jet stream Its location can beidentified by the strong winds shown in Figure 9 depictedby wind barbs The incursion of a subtropical anticyclonenorth of the Azores displaced the jet stream northwardwhile the powerful Siberian anticyclone pushed it southwardproducing strong jet curvatureThe jet streamwas not clearlydefined near the Iberian Peninsula but was separated into twobranches One was west of Portugal and the other crossedthe Pyrenees and moved toward the Mediterranean Thebranches were associated with the two dynamic tropopauseanomalies described above
42 Mesoscale The orographic forcing of the GuadarramaMountains can be seen more clearly by increasing the modelresolution This forcing helped determine the generationand modification of factors that triggered mesoscale weatherconditions supporting the icing In the following the causesof the icing are analyzed
421 Dynamic Tropopause Anomalies From domain D02(see Figure 7) the vertical cross section of potential vorticity(PV) andRH is shown in Figure 10 in which the two dynamictropopause anomalies are evident A high PV region 75 kmsouth of the Guadarrama Mountains corresponds to theanomaly observed to the southwest of Lisbon This anomalyappears responsible for themidtroposphere dry air mass overthe southern half of the Iberian Peninsula A deeper anomalywas north of the Guadarrama Mountains corresponding to
The Scientific World Journal 11
Grid pointsGrid points
00
1515
10090807060504030201000
0 20 40 60 80 0 20 40 60 80 0 20 40 60 80
0
0
15
Hei
ght (
km)
10090807060504030201000
Hei
ght (
km)
10090807060504030201000
Hei
ght (
km)
Relative humidity ()Potential vorticity (PVU)
Guadarrama mountains Guadarrama mountains Guadarrama mountains10 30 50 70 90 10 30 50 70 90 10 30 50 70 90
Potential vorticity contours minus 15 to 15 by 15
Relative humidity ()
Figure 10 Cross section of relative humidity and potential vorticity in domain D02
the backside of the dry intrusion west of ItalyThe rear of thatanomaly moved southward pushing an air mass with highhumidity ahead of it The convergence of the two anomaliesaccumulated moisture at the centre of the Iberian PeninsulaSubstantial moisture is essential for SLD formation [2]
Nevertheless updrafts over the Guadarrama Mountainscannot be attributed to the dynamic tropopause anomaliesbecause updrafts remained stationary on the lee side of themountains throughout the day while the anomalies movedto the south Therefore we conclude that the anomalies werenot the main cause of the updraft that accumulated SLD overthe Lozoya Valley The backside of the anomaly at flight timeremained north of the Iberian Peninsula its effects were notobserved in the mountains until after 1800
Associated with this anomaly was an advancing coldfront This front swept across the peninsula during theafternoon of February 1 resulting in ascent of the warm andwet air mass above a wedge of cold and dry air Reinking etal [22] stated that the ascent of a warm air mass over a coldone provides moisture and upwelling processes necessary forcollision-coalescence growth
422 Mesolow By increasing model resolution in domainD03 it was observed that surface winds were perpendicularto the GuadarramaMountains during the flight This formeda mesolow on their lee side caused by a phenomenon knownas an orographic dipole This is a mesoscale structure causedby flowperpendicular to amountain barrier forming anoma-lous positive pressure on the windward side and a depressionon the lee side Associated with the mesolow surface windhad a cyclonic rotation on the lee side (Figure 11) whichtriggeredwind convergence in the area of severe aircraft icing
Orographic dipole formation is explained by separationof the boundary layer a well-known phenomenon in fluiddynamics [61] According to this theory a steady streamencountering an obstacle generates a stagnation point anda pair of vortices one is anticyclonic and upstream of theobstacle and the other is cyclonic and downstream [62]In such a 3D flow situation additional effects should be
Aircraft trajectory
41∘30998400N
41∘N
41∘30998400N
40∘N
39∘30998400N
5∘30998400W 5∘W 4∘30998400W 4∘W 3∘30998400W 3∘W 2∘30998400W
Terrain height (m)
Sea level pressure contours 990 to 1030 by 1
500 750 1000 1250 1500 1750 2000
Terrain height (m)Wind (kts)
Sea level pressure (hPa)
1016
1016 1014
10141014
1014
Figure 11 Terrain height sea level pressure and surface wind indomain D03 Aircraft trajectory has been superimposed
considered such as stratification wave breaking turbulenceand vertical wind shear [63]
423 Updrafts and Gravity Waves In the same area asthe mesolow an updraft appears in images produced bythe WRF This coincides with formation of the cloud bandresponsible for the aircraft icing Geresdi et al [64] indicatedthat icing regions often are associated with mesoscale upliftwith vertical speeds around 5ndash20 cm sminus1 In the vertical cross
12 The Scientific World Journal
z-wind component (ms) at 650hPa
Terrain height (m)Aircra trajectory
500 750 1000 1250 1500 1750 2000
41∘30998400N
41∘N
41∘30998400N
40∘N
39∘30998400N
5∘30998400W 5∘W 4∘30998400W 4∘W 3∘30998400W 3∘W 2∘30998400W
(a)
Grid points NorthSouth
minus125 minus075 minus025 025 075 125H
eigh
t (km
)
Aircra trajectory
z-wind component (ms minus1)
z-wind component (ms minus1)
80
0 5 10 15 20 25
70
60
50
40
30
20
10
00
(b)
Figure 12 Vertical (z) wind component at 650 hPa (a) and on a cross section (b) of domain D03 Aircraft trajectory has been superimposed
section of Figure 12 two updrafts are evident on the lee side ofthe Guadarrama Mountains These updrafts are also seen inthe vertical (z) wind component at 650 hPa the level at whichthe aircraft experienced icing
Coupled with the orographic dipole mountain waves arecommon in regions of static stability (as shown by radiometerdata) when the wind is perpendicular to the orographicbarrier This barrier offers resistance to passage of the flowUnable to pass through the barrier air tends to accumulateresulting in loss of energy and wind speed reduction Thisincreases pressure on the windward side by wind conver-gence Air passing through the mountains descends into thevalley on the lee side and is then forced upward generatingmountain waves Away from the mountains beyond a calmzone the flow accelerates producing divergence and a result-ing pressure decrease [65] The orographic dipole tends tostrengthen updrafts generated by gravity waves
Politovich [25] noted that orographic forcing may triggerconvection embedded in stratiform clouds which facilitatesthe ascent of SLD and their accumulation at cloud tops Ikedaet al [66] also asserted that strong flow perpendicular to amountain barrier amplified vertical motions (up to 2ms)above local ridges forming embedded convection
Petersen et al [67] indicated that if mountains aresufficiently high to block the prevailing flow a mesolowor eddy shedding on the lee side is likely In the WRFsimulation a mesolow was produced on the leeward sideof the Guadarrama Mountains owing to partial blockage ofthe perpendicular flow The increase of PV caused by the
mountains and accumulated at the mesolow reduced geopo-tential height at midtropospheric levels [68] Additional PVmay have come from approach of the cold front and dynamictropopause anomaly discussed above This caused a stronggradient of geopotential height to the lee of the mountains asdetected by an increase of wind speed and change in directionat midtroposphere generating strong shearThis is consistentwith Rauber [69] who claimed that gravity wave appearancein orographic cloud systems is usually associated with sub-sidence and strong shear at cloud tops Here we should alsonote the cyclonic gyre of surface wind on the lee side of theGuadarrama Mountains associated with the mesolow
424 Atmospheric Stability We also analyzed EquivalentPotential Vorticity (EPV) to determine the existence ofConditional Symmetric Instability (CSI) After confirmingthat there was no negative EPV during the flight and nosignificant values of convective indices (analyzed using con-tinuous radiometer measurements) the presence of convec-tion was dismissed We therefore conclude that the observedupdraftswere caused bymountainwaves strengthened by themesolow
As seen in Figure 13 depicting differential equivalentpotential temperature (deth) there was strong stability nearthe surface with a thermal inversion in various areas ofD03 Immediately above that inversion was a stable layerwhich reached about 3000msl Most notable is the neutralstability layer located between 3 and 4 km which allowed
The Scientific World Journal 13
deth (Ckm)
Grid pointsSouth North
Hei
ght (
km)
Atmospheric stabilityUnstable Stable
Aircraft trajectory
80
70
60
50
40
30
20
10
00
0 5 10 15 20 25
0 15 3 45
Figure 13 Cross section of deth in D03
gravity wave development Above this there was anotherstable layer that prevented vertical development of the gravitywaves above 4 km Moreover ripples caused by gravity wavescan be discerned Figure 13 portrays a small unstable regioncoincident with the mesolow The situation observed by theradiometer matches that modeled by the WRF because ifwe represent deth in cross section around 409∘N (wherethe aircraft experienced icing) there was a neutral layer(almost unstable) from 2500 to 4000msl Immediately above4000msl there was a stable layer
Pobanz et al [8] argued that shear above cloud top ina thermodynamically stable atmosphere can form a dynam-ically unstable layer and thereby turbulence and risk ofKelvin-Helmholtz waves as well as entrainment of subsatu-rated air and mixing which favour SLD formation Marwitz[70] had a similar theory He affirmed that wind shearinduced dynamical instability in gravity waves However thestable layer above 600 hPa blocked further ascent of air andthereby that of SLD Therefore the layer with greatest SLDaccumulation formed immediately below this layer
The nearly neutral static stability together with weakupdrafts associated with mountains may be associated withproduction of SLW in this layer as pointed out by Pobanzet al [8] They claimed that a neutral or weakly unstableatmosphere promotes SLD formation A static stability layerpromotes generation of mountain waves Orographic liftingis greater in a neutral atmosphere than in a stable onefostering greater accumulation of SLD and LWC near cloudtop Furthermore within a neutral stability region cloud
tops do not reach high altitudes This is conducive to a lowconcentration of ice crystals which facilitates the presence ofSLD [71]
On the morning of February 1 2012 there was a stableatmosphere with a strong inversion layer near the surface asexplained in the observation sectionHowever the conditionswere increasingly unstable on the lee side of the GuadarramaMountains which were associated with formation of themesolow In addition the cold front linked with the dynamictropopause anomaly was approaching As was the case inthe present study several authors have indicated that atransition from stable to more unstable conditions supportsSLD formation [23 72]
425 Temperature Figure 14 represents temperature at650 hPa near the aircraft icing altitude Temperature therewas about minus12∘C an optimal value for such icing This isbecausemost freezing nuclei are not active and the nucleationprocess is therefore inefficient [12 15]
The figure shows that over the Lozoya Valley where thefirst mountain wave was located there was a band with lowertemperatures than adjacent regions A few miles south therewas another cold band collocated with a second mountainwave Contiguous with these two regions there were threebands with warmer temperatures than expected at this alti-tude these correspond to subsidence regions produced by themountainwaves Awave cloud occurs between themaximumand minimum vertical velocity where temperatures are lessthan the undisturbed mean value [73]
426 LiquidWater Content The cloud band over the LozoyaValley shown in Figure 15 was responsible for the severeicing of the C-212-200 The aircraft was at 3500msl (pressure650 hPa) heading north Arriving about 407∘N the aircraftentered cloud (mesolow area and secondmountainwave) andexperienced light to moderate icing (supercooled dropletssmaller than 50120583mandLWCabout 01 gm3) through 408∘NUpon reaching 409∘N the aircraft reached the first mountainwave and a region of severe icing (supercooled large dropletsgreater than 50120583m and LWC about 04 gm3) forcing themission abort
Figure 15 explains why the aircraft experienced light icingin the first cloud because LWC was low Later upon enteringthe zone of greater LWC there was severe icing coincidentwith the region of high SLD concentration Just before theaircraft turnaround a region with smaller droplets and lowLWC was evident in images produced by the CIP-GS probeThis region corresponded with the northernmost mountainwave Back to the south the aircraft reentered the region ofhigher LWC and SLD again enduring severe icing The pilotascended from 3500 to 3800msl in an attempt to get abovecloud but as seen by the WRF output cloud tops clearlyexceeded this altitude
During the return flight the icing changed from moder-ate to light south of 408∘N and around407∘Nthe craft exitedthe cloudThere the pilot activated the anti-icing systems thatdetached the ice accumulated on the wing profile
14 The Scientific World Journal
41∘30998400N
41∘N
40∘30998400N
40∘N
39∘30998400N
5∘30998400W 5∘W 4∘30998400W 4∘W 3∘30998400W 3∘W 2∘30998400W
Terrain height contours 0 to 2000 by 250
Aircraft trajectory
minus125 minus12 minus115 minus11 minus105 minus10 minus95
1000
1000
1000
1500
1000
1000
1000
1500
500
500
500
) at 650hPa
Temperature (C)
Temperature (C
Figure 14 Temperature at 650 hPa in D03 Aircraft trajectory has been superimposed
41∘30998400N
41∘N
41∘30998400N
40∘N
39∘30998400N
5∘30998400W 5∘W 4∘30998400W 4∘W 3∘30998400W 3∘W 2∘30998400W
Terrain height (m)250 500 750 1000 1250 1500 1750 2000
Liquid water content (gkg) at 650hPa
Aircraft trajectory
(a)
50
40
30
20
10
000 5 10 15 20 25
Grid pointsSouth North
Cloud water mixing ratio (gkg)
Cloud water mixing ratio (gkg)
0025 01 0175 025 0325 04
Hei
ght (
km)
Aircraft trajectory
(b)
Figure 15 Liquid water content at 650 hPa (a) and on a cross section (b) of domain D03 Aircraft trajectory has been superimposed
The Scientific World Journal 15
A cloudless band just downwind of the GuadarramaMountains is evident in the WRF output This band wascaused by Foehn windThese winds cause descending air andheating by compression on the lee side dissipating the cloudsSubsequently the air is forced to rise by mountain waves(with additional ascent caused by the mesolow in our case)This rising air cools by expansion forming clouds associatedwith mountain waves after reaching the dew point level [22]These authors showed that gravity waves produce significantamounts of supercooled LWC
The region of aircraft icing had stratiform clouds withweak updrafts Politovich [25] stated that when such cloudshave maritime characteristics (as in this case because thedominant air mass was maritime arctic) such as highhumidity and very low IN concentration hindering ice crystalformation they create an environment conducive to icing
The updraft in the Guadarrama Mountains was themain cause of SLD accumulation in the region of aircrafticing because it provided liquid water mixing and timefor collision-coalescence processes The updraft also allowedSLD accumulation because it obstructed precipitation [74]The updraft was generated by mountain waves and strength-ened by the mesolow in the lee of the mountains
After analyzing the D03 output of WRF we concludedthat the severe icing of the C-212-200 aircraft was caused bymountain waves The aircraft first crossed the second (south-ernmost) mountain wave experiencing light to moderateicing since the updraft there was less intense and there wasless LWC However the aircraft reached the northernmostmountain wave over the Lozoya Valley experiencing severeicing caused by updrafts greater than 1ms and LWC inexcess of 04 gm3 In addition the high SLD concentrationcaused ice accretion in areas unprotected by anti-icing sys-tems forcing flight termination Stationary gravity waves arecommonly dominated by cloud droplets smaller than 20 120583mbut in 2ms updrafts drop sizes between 50 and 500 120583m canprevail generating the greatest risk of aircraft icing [75]
5 Conclusions
In summary severe icing of a C-212-200 aircraft during anapproach to the Guadarrama Mountains on February 1 2012occurred as a result of several factors
(i) Temperatures encountered by the aircraft at 3500mslwere optimal for icing around minus12∘C This facttogether with a low IN concentration (measured atthe surface of Lozoya Valley by an isothermal cloudchamber during the flight) hindered the nucleationprocess Furthermore the radiometer registered astable layer just below 600 hPa This weak ther-mal inversion favoured formation of vertical shearincreasing collision-coalescence process efficiencyLWC presence was detected by CAPS observationwhich demonstrates that most of the hydrometeors inthe gravity wave over the Lozoya Valley were liquid
(ii) In the WRF simulation a dynamic tropopauseanomaly approaching from north of the IberianPeninsula pushed a warm andmoist air mass ahead of
it Secondarily another dynamic tropopause anomalysouthwest of the peninsula supported moisture accu-mulation in the central peninsula Airflow perpendic-ular to the Guadarrama Mountains during the hoursbefore the flight formed a downwind mesolow iden-tified by an area of low pressure and a cyclonic gyreThis mesolow favoured convergence and updraftsin the region of aircraft icing Together with themesolow mountain waves were the main cause ofupdrafts in the lee of the Guadarrama MountainsThese updrafts provided LWC sufficient time formixing and SLD accumulation A neutral atmo-sphere below 4 km altitude permitted the formationof gravity waves Further a stable layer above thisaltitude blocked development of these gravity wavesso a layer of high concentration of SLD and LWCappeared just beneath cloud top
The combination of all these factors created an optimalenvironment for aircraft icing in a small region a few kilome-tres downwind of the GuadarramaMountains between 3500and 4000msl
Conflict of Interests
The authors declare that there is no conflict of interestsregarding the publication of this paper
Acknowledgments
This paper was supported by the following Grants TECO-AGUA Micrometeocom and Granimetro (CGL2010-15930)and LE220A11-2 and LE003B009 awarded by the Junta deCastilla y Leon and MINECO Special thanks are due toRoberto Weigand Angel Guerrero Steven Hunter AnalisaWeston and Lauren Giera The authors would like to thankCanal de Isabel II Gestion INTA and CLAEX for thefacilities Sergio Fernandez-Gonzalez acknowledges the grantsupported from the FPU program
References
[1] S G Cober G A Isaac and J W Strapp ldquoCharacterizationsof aircraft icing environments that include supercooled largedropsrdquo Journal of Applied Meteorology vol 40 no 11 pp 1984ndash2002 2001
[2] B C Bernstein FMcDonoughM K Politovich et al ldquoCurrenticing potential algorithm description and comparison withaircraft observationsrdquo Journal of Applied Meteorology vol 44no 7 pp 969ndash986 2005
[3] F T Lynch and A Khodadoust ldquoEffects of ice accretions onaircraft aerodynamicsrdquo Progress in Aerospace Sciences vol 37no 8 pp 669ndash767 2001
[4] S G Cober J W Strapp and G A Isaac ldquoAn example of super-cooled drizzle drops formed through a collision-coalescenceprocessrdquo Journal of Applied Meteorology vol 35 no 12 pp2250ndash2260 1996
[5] J Marwitz M Politovich B Bernstein et al ldquoMeteorologicalconditions associated with the ATR72 aircraft accident near
16 The Scientific World Journal
Roselawn Indiana on 31October 1994rdquoBulletin of theAmericanMeteorological Society vol 78 no 1 pp 41ndash52 1997
[6] J-M Carriere C Lainard C Le Bot and F Robart ldquoAclimatological study of surface freezing precipitation inEuroperdquoMeteorological Applications vol 7 no 3 pp 229ndash238 2000
[7] J W Strapp R A Stuart and G A Isaac ldquoA Canadianclimatology of freezing precipitation and a detailed studyusing data from St Johnrsquos Newfoundlandrdquo in Proceedings ofInternational Conferences On Aircraft Inflight Icing pp 45ndash56Federal Aviation Administration Springfield Va USA 1996
[8] B M Pobanz J D Marwitz and M K Politovich ldquoConditionsassociated with large-drops regionsrdquo Journal of Applied Meteo-rology vol 33 no 11 pp 1366ndash1372 1994
[9] R M Rasmussen I Geresdi G Thompson K Manningand E Karplus ldquoFreezing drizzle formation in stably stratifiedlayer clouds the role of radiative cooling of cloud dropletscloud condensation nuclei and ice initiationrdquo Journal of theAtmospheric Sciences vol 59 no 4 pp 837ndash860 2002
[10] A V Korolev and G A Isaac ldquoDrop growth due to highsupersaturation caused by isobaric mixingrdquo Journal of theAtmospheric Sciences vol 57 no 10 pp 1675ndash1685 2000
[11] B C Bernstein T A Omeron M K Politovich and FMcDonough ldquoSurfaceweather features associatedwith freezingprecipitation and severe in-flight aircraft icingrdquo AtmosphericResearch vol 46 no 1-2 pp 57ndash73 1998
[12] G J Huffman and G A Norman Jr ldquoThe supercooled warmrain process and the specification of freezing precipitationrdquoMonthly Weather Review vol 116 no 11 pp 2172ndash2182 1988
[13] R M Rauber and L O Grant ldquoThe characteristics anddistribution of cloud water over the mountains of northernColorado during wintertime storms Part II spatial distributionandmicrophysical characteristicsrdquo Journal of ClimateampAppliedMeteorology vol 25 no 4 pp 489ndash504 1986
[14] R M Rauber and A Tokay ldquoAn explanation for the existenceof supercooled water at the top of cold cloudsrdquo Journal of theAtmospheric Sciences vol 48 no 8 pp 1005ndash1023 1991
[15] D C Rogers ldquoMeasurements of natural ice nuclei with acontinuous flow diffusion chamberrdquo Atmospheric Research vol29 no 3-4 pp 209ndash228 1993
[16] AV Korolev G A Isaac S G Cober JW Strapp and JHallettldquoMicrophysical characterization of mixed-phase cloudsrdquoQuar-terly Journal of the Royal Meteorological Society vol 129 no 587pp 39ndash65 2003
[17] GN Petersen J E Kristjansson andH Olafsson ldquoThe effect ofupstream wind direction on atmospheric flow in the vicinity ofa large mountainrdquoQuarterly Journal of the Royal MeteorologicalSociety vol 131 no 607 pp 1113ndash1128 2005
[18] M H Bauer G J Mayr I Vergeiner and H Pichler ldquoStronglynonlinear flow over and around a three-dimensional mountainas a function of the horizontal aspect ratiordquo Journal of theAtmospheric Sciences vol 57 no 24 pp 3971ndash3991 2000
[19] R B Smith S Skubis J D Doyle A S Broad C Kiemle andH Volkert ldquoMountain waves over Mont Blanc influence of astagnant boundary layerrdquo Journal of the Atmospheric Sciencesvol 59 no 13 pp 2073ndash2092 2002
[20] C Ramis R Romero V Homar S Alonso and M AlarconldquoDiagnosis and numerical simulation of a torrential precipita-tion event in Catalonia (Spain)rdquo Meteorology and AtmosphericPhysics vol 69 no 1-2 pp 1ndash21 1998
[21] E Garcıa-Ortega L Fita R Romero L Lopez C Ramis andJ L Sanchez ldquoNumerical simulation and sensitivity study of a
severe hailstorm in northeast SpainrdquoAtmospheric Research vol83 no 2-4 pp 225ndash241 2007
[22] R F Reinking J B Snider and J L Coen ldquoInfluences of storm-embedded orographic gravity waves on cloud liquid water andprecipitationrdquo Journal of Applied Meteorology vol 39 no 6 pp733ndash759 2000
[23] W A Cooper and J D Marwitz ldquoWinter storms over the SanJuan mountains Part III seeding potentialrdquo Journal of AppliedMeteorology vol 19 no 8 pp 942ndash949 1980
[24] P A Vaillancourt A Tremblay S G Cober and G A IsaacldquoComparison of aircraft observations with mixed-phase cloudsimulationsrdquo Monthly Weather Review vol 131 no 4 pp 656ndash671 2002
[25] M K Politovich ldquoAircraft icing caused by large supercooleddropletsrdquo Journal of AppliedMeteorology vol 28 no 9 pp 856ndash868 1989
[26] S G Cober and G A Isaac ldquoCharacterization of aircraft icingenvironments with Supercooled Large Drops for application tocommercial aircraft certificationrdquo Journal of Applied Meteorol-ogy and Climatology vol 51 no 2 pp 265ndash284 2012
[27] T Hauf and F Schroder ldquoAircraft icing research flights inembedded convectionrdquo Meteorology and Atmospheric Physicsvol 91 no 1ndash4 pp 247ndash265 2006
[28] D Baumgardner J L Brenguier A Bucholtz et al ldquoAirborneinstruments to measure atmospheric aerosol particles cloudsand radiation a cookrsquos tour of mature and emerging technol-ogyrdquo Atmospheric Research vol 102 no 1-2 pp 10ndash29 2011
[29] J L Sanchez R Posada E Garcıa-Ortega L Lopez and JL Marcos ldquoA method to improve the accuracy of continuousmeasuring of vertical profiles of temperature and water vapordensity by means of a ground-based microwave radiometerrdquoAtmospheric Research vol 122 pp 43ndash54 2013
[30] D Baumgardner H Jonsson W Dawson D OrsquoConnor and RNewton ldquoThe cloud aerosol and precipitation spectrometer anew instrument for cloud investigationsrdquoAtmospheric Researchvol 59-60 pp 251ndash264 2001
[31] A Castro J L Marcos J Dessens J L Sanchez and R FraileldquoConcentration of ice nuclei in continental and maritime airmasses in Leon (Spain)rdquo Atmospheric Research vol 47-48 pp155ndash167 1998
[32] B C Bernstein ldquoRegional and local influences on freezingdrizzle freezing rain and ice pellet eventsrdquo Weather andForecasting vol 15 no 5 pp 485ndash508 2000
[33] A V Korolev G A Isaac J W Strapp S G Cober and H WBarker ldquoIn situ measurements of liquid water content profilesin midlatitude stratiform cloudsrdquoQuarterly Journal of the RoyalMeteorological Society vol 133 no 628 pp 1693ndash1699 2007
[34] D M Schultz and J A Knox ldquoBanded convection caused byfrontogenesis in a conditionally symmetrically and inertiallyunstable environmentrdquo Monthly Weather Review vol 135 no6 pp 2095ndash2110 2007
[35] R S Schumacher D M Schultz and J A Knox ldquoConvec-tive snowbands downstream of the rocky mountains in anenvironment with conditional dry symmetric and inertialinstabilitiesrdquoMonthlyWeather Review vol 138 no 12 pp 4416ndash4438 2010
[36] J T Moore A C Czarnetzki and P S Market ldquoHeavyprecipitation associated with elevated thunderstorms formed ina convectively unstable layer aloftrdquoMeteorological Applicationsvol 5 no 4 pp 373ndash384 1998
The Scientific World Journal 17
[37] K L Horgan D M Schultz J E Hales Jr S F Corfidi and RH Johns ldquoA five-year climatology of elevated severe convectivestorms in the United States east of the Rocky MountainsrdquoWeather and Forecasting vol 22 no 5 pp 1031ndash1044 2007
[38] E Koffi M Schneebeli E Brocard and C Matzler ldquoTheuse of radiometer derived convective indices in thunderstormnowcastingrdquo IAP Research Report 2007-02-MW Institut furangewandte Physik Universitat Bern 2007
[39] C W Ulbrich ldquoNatural variations in the analytical form ofthe raindrop size distributionrdquo Journal of Climate amp AppliedMeteorology vol 22 no 10 pp 1764ndash1775 1983
[40] T L Clark ldquoA study in cloud phase parameterization using thegamma distributionrdquo Journal of the Atmospheric Sciences vol31 pp 142ndash155 1973
[41] D S Wilks Statistical Methods in the Atmospheric SciencesAcademic Press 1995
[42] A V Korolev G A Isaac I P Mazin and H W BarkerldquoMicrophysical properties of continental clouds from in situmeasurementsrdquo Quarterly Journal of the Royal MeteorologicalSociety vol 127 no 576 pp 2117ndash2151 2001
[43] H L Crutcher ldquoA note on the possible misuse of theKolmogorov-Smirnov testrdquo Journal of Applied Meteorology vol14 no 8 pp 1600ndash1603 1975
[44] G P Ellrod and A A Bailey ldquoAssessment of aircraft icingpotential and maximum icing altitude from geostationarymeteorological satellite datardquo Weather and Forecasting vol 22no 1 pp 160ndash174 2007
[45] R Ashenden W Lindberg J D Marwitz and B Hoxie ldquoAirfoilperformance degradation by supercooled cloud drizzle andrain drop icingrdquo Journal of Aircraft vol 33 no 6 pp 1040ndash10461996
[46] W R Sand W A Cooper M K Politovich and D L VealldquoIcing conditions encountered by a research aircraftrdquo Journal ofClimate amp Applied Meteorology vol 23 no 10 pp 1427ndash14401984
[47] G Vidaurre and J Hallett ldquoIce and water content of stratiformmixed-phase cloudrdquo Quarterly Journal of the Royal Meteorolog-ical Society vol 135 no 642 pp 1292ndash1306 2009
[48] G D Modica S T Heckman and R M Rasmussen ldquoAnapplication of an explicit microphysics mesoscale model to aregional icing eventrdquo Journal of AppliedMeteorology vol 33 no1 pp 53ndash64 1994
[49] J Reisner R M Rasmussen and R T Bruintjes ldquoExplicitforecasting of supercooled liquid water in winter storms usingthe MM5 mesoscale modelrdquo Quarterly Journal of the RoyalMeteorological Society vol 124 no 548 pp 1071ndash1107 1998
[50] W C Skamarock M L Weisman J B Klemp et al ldquoAdescription of the advanced research WRF version 2rdquo NCARTech 2005
[51] E KalnayMKanamitsu R Kistler et al ldquoTheNMCNCAR40-year reanalysis projectrdquo Bulletin of the American MeteorologicalSociety vol 76 pp 1ndash37 1996
[52] B E K Nygaard J E Kristjansson and L Makkonen ldquoPredic-tion of in-cloud icing conditions at ground level using theWRFmodelrdquo Journal of AppliedMeteorology and Climatology vol 50no 12 pp 2445ndash2459 2011
[53] G Thompson P R Field R M Rasmussen and W D HallldquoExplicit forecasts of winter precipitation using an improvedbulk microphysics scheme Part II implementation of a newsnow parameterizationrdquo Monthly Weather Review vol 136 no12 pp 5095ndash5115 2008
[54] F Chen and J Dudhia ldquoCoupling and advanced land surface-hydrology model with the Penn State-NCAR MM5 modelingsystem Part I model implementation and sensitivityrdquoMonthlyWeather Review vol 129 no 4 pp 569ndash585 2001
[55] Z Janjic The Surface Layer Parameterization in the NCEPEta Model World Meteorological Organization-publicationsWMO TD 4-4 1996
[56] E J Mlawer S J Taubman P D Brown M J Iacono and S AClough ldquoRadiative transfer for inhomogeneous atmospheresRRTM a validated correlated-k model for the longwaverdquoJournal of Geophysical Research D vol 102 no 14 pp 16663ndash16682 1997
[57] J Dudhia ldquoNumerical study of convection observed duringthe Winter Monsoon Experiment using a mesoscale two-dimensionalmodelrdquo Journal of theAtmospheric Sciences vol 46no 20 pp 3077ndash3107 1989
[58] KA Browning ldquoThedry intrusion perspective of extra-tropicalcyclone developmentrdquoMeteorological Applications vol 4 no 4pp 317ndash324 1997
[59] B C Bernstein T A Omeron F Mcdonough and M K Poli-tovich ldquoThe relationship between aircraft icing and synoptic-scale weather conditionsrdquo Weather and Forecasting vol 12 no4 pp 742ndash762 1997
[60] R M Rauber L S Olthoff M K Ramamurthy D Miller andK E Kunkel ldquoA synoptic weather pattern and sounding-basedclimatology of freezing precipitation in the United States East ofthe Rocky Mountainsrdquo Journal of Applied Meteorology vol 40no 10 pp 1724ndash1747 2001
[61] Y-L Lin N-H Lin and R P Weglarz ldquoNumerical modelingstudies of lee mesolows mesovortices and mesocyclones withapplication to the formation of Taiwan mesolowsrdquoMeteorologyand Atmospheric Physics vol 49 no 1-4 pp 43ndash67 1992
[62] G K Batchelor An Introduction to Fluid Dynamics CambridgeUniversity Press Cambridge UK 1967
[63] R B Smith ldquoHydrostatic airflow over mountainsrdquo Advances inGeophysics vol 31 pp 1ndash41 1989
[64] I Geresdi R Rasmussen W Grabowski and B BernsteinldquoSensitivity of freezing drizzle formation in stably stratifiedclouds to ice processesrdquo Meteorology and Atmospheric Physicsvol 88 no 1-2 pp 91ndash105 2005
[65] S E Koch and C OrsquoHandley ldquoOperational forecasting anddetection of mesoscale gravity wavesrdquoWeather and Forecastingvol 12 no 2 pp 253ndash281 1997
[66] K Ikeda R M Rasmussen W D Hall and G ThompsonldquoObservations of freezing drizzle in extratropical cyclonicstorms during IMPROVE-2rdquo Journal of the Atmospheric Sci-ences vol 64 no 9 pp 3016ndash3043 2007
[67] G N Petersen H Olafsson and J E Kristjansson ldquoFlow inthe lee of idealized mountains and greenlandrdquo Journal of theAtmospheric Sciences vol 60 no 17 pp 2183ndash2195 2003
[68] C C Epifanio and D R Durran ldquoLee-vortex formation in free-slip stratified flow over ridges Part II mechanisms of vorticityand PV production in nonlinear viscous wakesrdquo Journal of theAtmospheric Sciences vol 59 no 7 pp 1166ndash1181 2002
[69] R M Rauber ldquoCharacteristics of cloud ice and precipitationduring wintertime storms over the mountains of northernColoradordquo Journal of Climate amp Applied Meteorology vol 26no 4 pp 488ndash524 1987
[70] JDMarwitz ldquoWinter storms over the San JuanMountains PartI dynamical processesrdquo Journal of Applied Meteorology vol 19no 8 pp 913ndash926 1980
18 The Scientific World Journal
[71] W A Cooper and C P R Saunders ldquoWinter storms over theSan Juan Mountains Part II microphysical processesrdquo Journalof Applied Meteorology vol 19 no 8 pp 927ndash941 1980
[72] K Sassen R M Rauber and J B Snider ldquoMultiple remote sen-sor observations of supercooled liquid water in a winter stormat Beaver Utahrdquo Journal of Climate amp Applied Meteorology vol25 no 6 pp 825ndash834 1986
[73] Z Cui A M Blyth K N Bower J Croisier and T ChoulartonldquoAircraftmeasurements of wave cloudsrdquoAtmospheric Chemistryand Physics vol 12 no 20 pp 9881ndash9892 2012
[74] N Song and J Marwitz ldquoA numerical study of the warmrain process in orographic cloudsrdquo Journal of the AtmosphericSciences vol 46 no 22 pp 3479ndash3486 1989
[75] R F Reinking A S Frisch B W Orr D L Korn L RBissonnette and G Roy ldquoRemote sensing observation of effectsof mountain blocking on travelling gravity-shear waves andassociated cloudsrdquo Boundary-Layer Meteorology vol 109 no 3pp 255ndash284 2003
Submit your manuscripts athttpwwwhindawicom
Hindawi Publishing Corporationhttpwwwhindawicom Volume 2014
ClimatologyJournal of
EcologyInternational Journal of
Hindawi Publishing Corporationhttpwwwhindawicom Volume 2014
EarthquakesJournal of
Hindawi Publishing Corporationhttpwwwhindawicom Volume 2014
Hindawi Publishing Corporationhttpwwwhindawicom
Applied ampEnvironmentalSoil Science
Volume 2014
Mining
Hindawi Publishing Corporationhttpwwwhindawicom Volume 2014
Journal of
Hindawi Publishing Corporation httpwwwhindawicom Volume 2014
International Journal of
Geophysics
OceanographyInternational Journal of
Hindawi Publishing Corporationhttpwwwhindawicom Volume 2014
Journal of Computational Environmental SciencesHindawi Publishing Corporationhttpwwwhindawicom Volume 2014
Journal ofPetroleum Engineering
Hindawi Publishing Corporationhttpwwwhindawicom Volume 2014
GeochemistryHindawi Publishing Corporationhttpwwwhindawicom Volume 2014
Journal of
Atmospheric SciencesInternational Journal of
Hindawi Publishing Corporationhttpwwwhindawicom Volume 2014
OceanographyHindawi Publishing Corporationhttpwwwhindawicom Volume 2014
Advances in
Hindawi Publishing Corporationhttpwwwhindawicom Volume 2014
MineralogyInternational Journal of
Hindawi Publishing Corporationhttpwwwhindawicom Volume 2014
MeteorologyAdvances in
The Scientific World JournalHindawi Publishing Corporation httpwwwhindawicom Volume 2014
Paleontology JournalHindawi Publishing Corporationhttpwwwhindawicom Volume 2014
ScientificaHindawi Publishing Corporationhttpwwwhindawicom Volume 2014
Hindawi Publishing Corporationhttpwwwhindawicom Volume 2014
Geological ResearchJournal of
Hindawi Publishing Corporationhttpwwwhindawicom Volume 2014
Geology Advances in
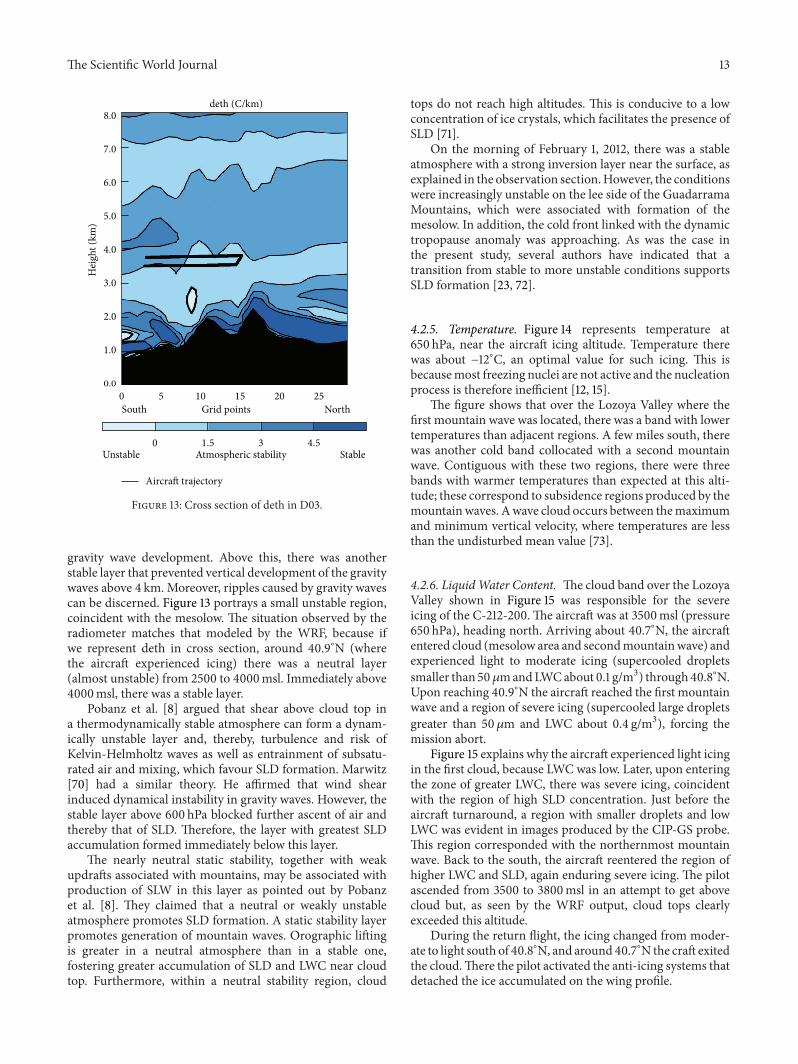
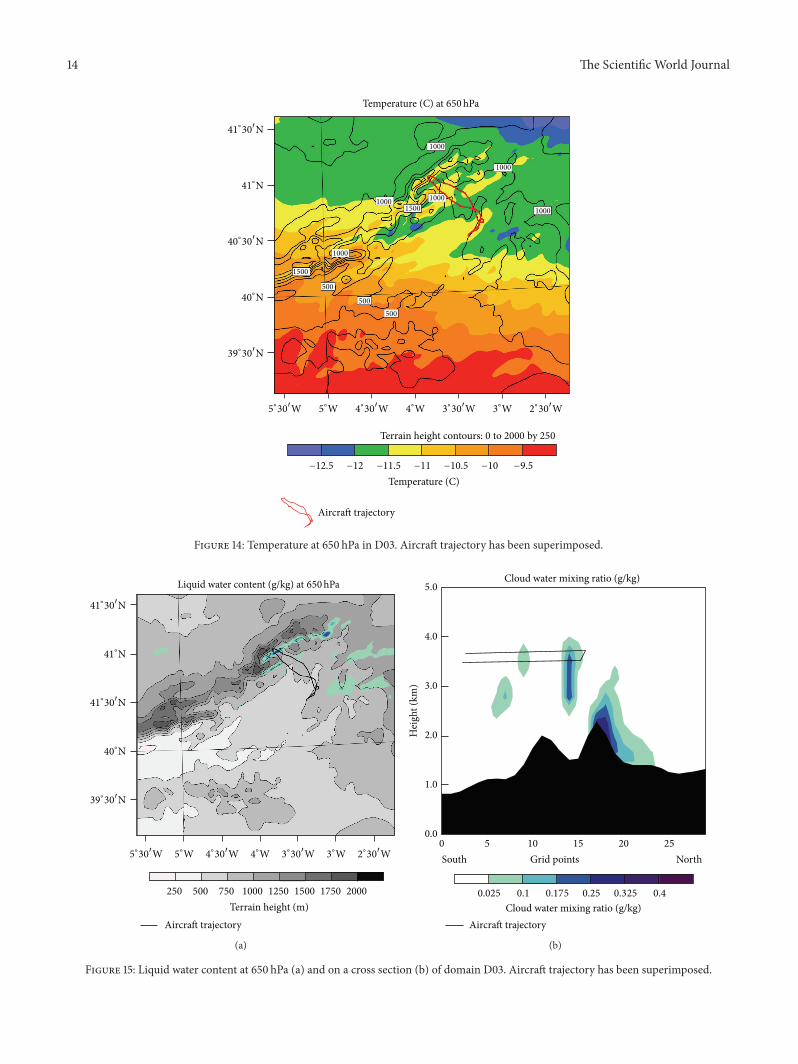
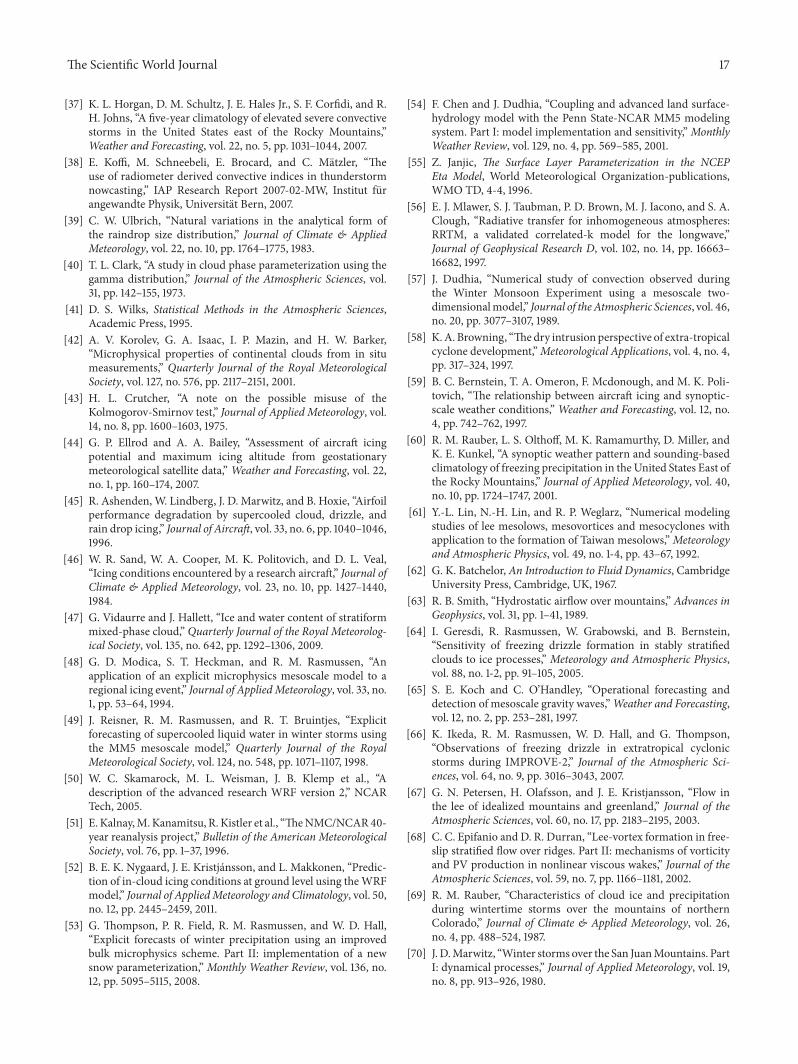