Research Article WDARS: A Weighted Data Aggregation...
13
Research Article WDARS: A Weighted Data Aggregation Routing Strategy with Minimum Link Cost in Event-Driven WSNs Omar Adil Mahdi, 1,2 Ainuddin Wahid Abdul Wahab, 1 Mohd Yamani Idna Idris, 1 Ammar Abu Znaid, 1 Yusor Rafid Bahar Al-Mayouf, 2,3 and Suleman Khan 1 1 Faculty of Computer Science & Information Technology, University of Malaya, 50603 Lembah Pantai, Kuala Lumpur, Malaysia 2 Department of Computer Sciences, College of Education for Pure Sciences-Ibn Al-Haytham, University of Baghdad, Baghdad, Iraq 3 Faculty of Engineering and Built Environment, Universiti Kebangsaan Malaysia, 43600 Bangi, Selangor, Malaysia Correspondence should be addressed to Omar Adil Mahdi; omar [email protected] and Ainuddin Wahid Abdul Wahab; [email protected] Received 15 March 2016; Revised 9 May 2016; Accepted 25 May 2016 Academic Editor: Fei Yu Copyright © 2016 Omar Adil Mahdi et al. is is an open access article distributed under the Creative Commons Attribution License, which permits unrestricted use, distribution, and reproduction in any medium, provided the original work is properly cited. Realizing the full potential of wireless sensor networks (WSNs) highlights many design issues, particularly the trade-offs concerning multiple conflicting improvements such as maximizing the route overlapping for efficient data aggregation and minimizing the total link cost. While the issues of data aggregation routing protocols and link cost function in a WSNs have been comprehensively considered in the literature, a trade-off improvement between these two has not yet been addressed. In this paper, a comprehensive weight for trade-off between different objectives has been employed, the so-called weighted data aggregation routing strategy (WDARS) which aims to maximize the overlap routes for efficient data aggregation and link cost issues in cluster-based WSNs simultaneously. e proposed methodology is evaluated for energy consumption, network lifetime, throughput, and packet delivery ratio and compared with the InFRA and DRINA. ese protocols are cluster-based routing protocols which only aim to maximize the overlap routes for efficient data aggregation. Analysis and simulation results revealed that the WDARS delivered a longer network lifetime with more proficient and reliable performance over other methods. 1. Introduction Wireless sensor networks (WSNs) are formed by a collabo- ration of sensors through data sensing, processing, and wire- less communication among the sensor nodes. ese networks are organized for sensing event-driven information and transmitting it to the base station for in-depth evaluation [1– 3]. WSNs have delivered beneficial outcomes in several appli- cations such as environmental monitoring, surveillance mis- sions, health monitoring, home automation, target tracking, traffic monitoring, fire management, agriculture monitoring, industrial failure detection, and energy management [4–8]. WSNs are oſten deployed in the form of thousands of nodes in remote and hostile areas which are inaccessible or unsafe for humans. erefore, the formation of autonomous and energy efficient network among the sensor nodes becomes vital to ensure prolonged network lifetime and controlled energy depletion [9–12]. Energy efficiency is directly related to effective data routing wherein cluster of nodes is formed to reduce the energy consumption and control overhead while limiting the interference among the sensor nodes [13]. Generally, the energy is consumed during data sensing, processing, and transmission. Among these activities, data transmission consumes the most energy [14]. us, efficient data for- warding and processing techniques must be developed to extend the network lifetime. One possible solution is by using in-network data aggregation schemes (e.g., see [15]). is approach reduces a significant number of bytes trans- mitted during the network operation by aggregating data at intermediate nodes and thus helps in bandwidth and energy savings. Data aggregation involves combining data from various sources so that aggregated information is received at the base station and circulation of redundant information is eliminated. By employing data aggregation, the issues of Hindawi Publishing Corporation Journal of Sensors Volume 2016, Article ID 3428730, 12 pages http://dx.doi.org/10.1155/2016/3428730
Transcript of Research Article WDARS: A Weighted Data Aggregation...
Research ArticleWDARS A Weighted Data Aggregation Routing Strategy withMinimum Link Cost in Event-Driven WSNs
Omar Adil Mahdi12 Ainuddin Wahid Abdul Wahab1 Mohd Yamani Idna Idris1
Ammar Abu Znaid1 Yusor Rafid Bahar Al-Mayouf23 and Suleman Khan1
1Faculty of Computer Science amp Information Technology University of Malaya 50603 Lembah Pantai Kuala Lumpur Malaysia2Department of Computer Sciences College of Education for Pure Sciences-Ibn Al-Haytham University of Baghdad Baghdad Iraq3Faculty of Engineering and Built Environment Universiti Kebangsaan Malaysia 43600 Bangi Selangor Malaysia
Correspondence should be addressed to Omar Adil Mahdi omar 1980117yahoocomand Ainuddin Wahid Abdul Wahab ainuddinumedumy
Received 15 March 2016 Revised 9 May 2016 Accepted 25 May 2016
Academic Editor Fei Yu
Copyright copy 2016 Omar Adil Mahdi et al This is an open access article distributed under the Creative Commons AttributionLicense which permits unrestricted use distribution and reproduction in any medium provided the original work is properlycited
Realizing the full potential of wireless sensor networks (WSNs) highlightsmany design issues particularly the trade-offs concerningmultiple conflicting improvements such as maximizing the route overlapping for efficient data aggregation and minimizing thetotal link cost While the issues of data aggregation routing protocols and link cost function in aWSNs have been comprehensivelyconsidered in the literature a trade-off improvement between these two has not yet been addressed In this paper a comprehensiveweight for trade-off between different objectives has been employed the so-called weighted data aggregation routing strategy(WDARS) which aims to maximize the overlap routes for efficient data aggregation and link cost issues in cluster-based WSNssimultaneouslyThe proposedmethodology is evaluated for energy consumption network lifetime throughput and packet deliveryratio and compared with the InFRA and DRINAThese protocols are cluster-based routing protocols which only aim to maximizethe overlap routes for efficient data aggregation Analysis and simulation results revealed that the WDARS delivered a longernetwork lifetime with more proficient and reliable performance over other methods
1 Introduction
Wireless sensor networks (WSNs) are formed by a collabo-ration of sensors through data sensing processing and wire-less communication among the sensor nodesThese networksare organized for sensing event-driven information andtransmitting it to the base station for in-depth evaluation [1ndash3]WSNs have delivered beneficial outcomes in several appli-cations such as environmental monitoring surveillance mis-sions health monitoring home automation target trackingtraffic monitoring fire management agriculture monitoringindustrial failure detection and energy management [4ndash8]WSNs are often deployed in the form of thousands of nodesin remote and hostile areas which are inaccessible or unsafefor humans Therefore the formation of autonomous andenergy efficient network among the sensor nodes becomesvital to ensure prolonged network lifetime and controlledenergy depletion [9ndash12]
Energy efficiency is directly related to effective datarouting wherein cluster of nodes is formed to reduce theenergy consumption and control overhead while limitingthe interference among the sensor nodes [13] Generallythe energy is consumed during data sensing processingand transmission Among these activities data transmissionconsumes the most energy [14] Thus efficient data for-warding and processing techniques must be developed toextend the network lifetime One possible solution is byusing in-network data aggregation schemes (eg see [15])This approach reduces a significant number of bytes trans-mitted during the network operation by aggregating data atintermediate nodes and thus helps in bandwidth and energysavings Data aggregation involves combining data fromvarious sources so that aggregated information is receivedat the base station and circulation of redundant informationis eliminated By employing data aggregation the issues of
Hindawi Publishing CorporationJournal of SensorsVolume 2016 Article ID 3428730 12 pageshttpdxdoiorg10115520163428730
2 Journal of Sensors
redundancy and numbers of transmissions are reduced Forexecution of common tasks the nodes within the networkmust communicate with each other or through intermediatenodes [16 17]
To develop a data aggregation scheme three main con-stituents of data aggregation should be considered whichare (1) aggregation function used by the protocol (2) dataaggregation scheduling which defines the waiting periodbefore a node aggregates and forwards the received data and(3) routing scheme which defines the routing protocol usedto send the aggregated data towards the sink by generatinga network structure [18] This paper focuses on the routingscheme of data aggregation which potentially optimizesthe routing procedure by utilizing the available processingcapability of the intermediate sensor nodes
The aggregation task in our network is achieved by for-mation of cluster-based data aggregation in a three-levelhierarchy This reduces the processing and communicationcost for randomly distributed nodes When in-networkoverlapping of routes occurs inside the cluster the membernodes of that cluster perform aggregation (aggregation viacluster members) Moreover aggregated data are sent to sinkby the cluster head node (aggregation via cluster head) Ifoverlapping of two or more events paths occurs outside thecluster the relaying nodes will perform the data aggregation(aggregation via relay nodes)
In the context ofWSNs efficient in-network data aggrega-tion will require an adaptive forwarding paradigm that allowsintermediate nodes to forward the data packets towards thesink node through different paths The paths are estimatedbased on comprehensive weights and choosing the next hopwith the maximum overlap routes to ensure the efficiencyof in-network data aggregation This forwarding paradigm isdifferent from the classic routing which only considers theshortest path between sources and sink nodes
In event-drivenWSNs themonitoring capability deterio-rates when the over-overlapping paths of uncorrelated eventsperform extensive data aggregation Hence the improvednetwork performance is not obtained Inefficient data aggre-gation neglects the network state and causes the early energydepletion of the backbone nodes and uneven network struc-ture due to various dead nodesTherefore a balance betweenmaximizing data aggregation and energy is necessary
In this paper a novel strategy of weighted data aggre-gation routing is proposed by analyzing the existing prob-lems The algorithm uses hop-tree to attain maximum dataaggregation To build and update hop-tree the local stateof the nodes is considered so that adaptive behavior can beobtained for event-driven WSNs Moreover the proposedstrategy finds the ideal point for route overlapping throughthe shortest paths from events to sink and optimally balancedthe energy consumption Each node chooses its next hop toforward the data in accordance with innovative triple costfunctions which are distributed adaptive and comprehen-sive weights
The rest of this paper is organized as follows in Sec-tion 2 the related works are discussed In Section 3 thenetwork model and scenario assumptions are outlined andthe proposed methodology and strategy are presented in
detail Section 4 discusses the performance of the proposedalgorithm by comparing it with other approaches Finallyin Section 5 conclusions are drawn and possible futuredirections are described
2 Related Work
21 Flat Network Based Aggregation In the literature manyearlier approaches employ the flat sensor networks for dataaggregation [19 20] For instance many studies have usedparent and child association based simpler topology for tree-based data aggregation technique [21] The data sent by thechildren are aggregated by the parent node which in turnsends it to its own parent node The key restrictions of thetree-based data aggregation methodologies are discussed asfollows (1) this technique provides a simpler approach toaggregate data but results in a high latency because the dataaggregation is not performed until the packets have arrivedat the parent node or grandparent node (2) High possibilityof data is not aggregated near the event of interest becauseany two nodes that sense the same event might have differentparent nodes This reduces proficiency of data aggregation asthe data transmitted over a long path to grandparent node(3) The tree-based data aggregation schemes require a highnumber of control messages to build and update the routingtree which consumesmore energy (4)The prior constructionof the tree is based on the assumption that the source nodesin the network are fixed and predetermined Hence it fails toexhibit the flexible behavior (5) Its main drawback is whenthe packet loses due to bad channel links In this case theentire aggregated data from the children nodes are lost
Hierarchical tree structures are costly to maintain andprone to damage due to limited network strength Howeverthey are still used in designing optimal data aggregationfunction energy efficient network and proficient data aggre-gation at intermediate nodes For example Li et al developedthe data aggregation protocol using Steiner minimum tree[22] Data centric routing approach employs shortest pathtree (SPT) routing protocol [23] This algorithm is a simpleapproach to construct the trees in ad hoc fashion andpromotes the energy awareness in the parent nodes Whenan event is detected by any node it uses the shortest path totransmit the information towards the sink This condition istrue if the overlapping paths of data aggregation occur (ieopportunistic data aggregation)
Issues in tree-based data aggregation due to correlationof sensed information have been considered in [24] Theauthors demonstrated the data gathering problem as an NP-complete problem and found the ideal result to be betweenshortest path tree (SPT) and Traveling Salesman Problem(TSP) A hybrid scheme proposed by Park and Sivakumar[25] combines the shortest path tree and clustering in whichthe data are aggregated in each minimum dominating set bya head node and all head nodes are linked through a globalshortest path tree
In [26] an energy-aware spanning tree algorithm (Espan)has been proposed for data aggregation exhibiting the featureof energy awareness This algorithm selects the source nodewith the highest available energy as the rootwhile other nodes
Journal of Sensors 3
use the residual energy and distance from the root nodeas metrics to select their parent node from the neighborsHowever the nodes will tend to select the neighboring nodeswith the least distance to the root as parent nodes This willcause a rapid energy depletion in the parent nodes with theleast distance to the root and they will be failed sooner ascompared to the other network nodes due to their frequentselection as parent nodes To achieve a long network lifespanand eliminate the dead nodes in the network an algorithmbased on left over energy in node and distance parametershas been proposed in [27] The node with the highest energyis selected as the parent nodewith a reasonable distance to therootThe energy along the path and length is used tomaintaina balance between energy and distance parameters
22 Cluster-Based Aggregation Clustering is a well-estab-lished approach in hierarchical data aggregation Thismethod involves division of network into small sets of nodescalled clusters Within each cluster the hierarchy is dividedinto a cluster head node and member nodes [28] The datafrom the member nodes are collected by the cluster headThen the data are aggregated and forwarded to the upstreamnode The clustering algorithms can be either a static ordynamic
The static clustering is the clusters that are formed prior tonetwork operation [29ndash31] and based on network parameters(eg the remaining energy in the nodes [32] and physicaldistance as in the Voronoi diagram-based method in [33])Moreover the reestablishments or updates of cluster donot occur adaptively LEACH [34] and HEED [35] are twoclassic models of static clustering They differ in the selectionmethod of cluster head as follows LEACH is formulated onthe assumption that energy of all nodes is equal during theelection while HEED considers the variation of energy innodes to optimize the network lifetime
A dynamic cluster architecture [33 36 37] is formedreactively within the proximity of the event sensing nodesOnce the event is located a specific sensor node is chosen asa cluster head (ideally the node with the maximum energy oradjacent to the event) and the nodes that are one hop awayare assigned as the member nodes The main benefit of thisapproach is that only the participated nodes are active in theaggregation of the data Thereby it conserves the energy ofthe idle nodes
Nakamura et al [38] discussed the reactive algorithmof the Information Fusion Based Role Assignment (InFRA)The roles such as sink collaborator coordinator and relayare assigned when any event takes place In this protocolclusters are formed when similar event is detected by variousnodes Then the coordinator aggregates the data from allcollaborated clusters and sends the event data towards thesink in multihop fashion InFRA discovers the shortest pathtree linking all source nodes to sink in amanner that the intracluster data aggregation is possible InFRA provides a rolemigration policy that is role of coordinator is transferredfromone node to another so that the load of energy consump-tion is distributed evenly between nodes in the cluster InFRAused intracluster and intercluster in its data aggregationschemes A disadvantage of InFRA is that each time a new
event is detected the information of the event is broadcastedall over the network to notify other nodes and the paths fromthe available coordinators to the sink node are updatedTheseprocesses are costly and limit the network scalability
Data Routing for In-Network Aggregation (DRINA) inWSNs [39] provides reliable and improved data aggregationIt reduces the control overhead for building routing trees andmaximizes the formation of overlapping pathsThemain aimof DRINA is to reduce the energy depletion andminimize themessage exchanges during the network operation Howeverthere are few disadvantages in DRINA as follows (1) Lacks ofload balance a heavy load in the nodes on the prior built pathwill cause those nodes to expire prematurely (2) Correlatedevents are ignored due to the assumption that the data fromdiffering event areas could be aggregated adequately (3)Sometimes the data have to be routed over the lengthier pathswhich increase the total energy depletion
In this work we proposed a novel algorithm for in-network data aggregation which takes into account the trade-offs between routes overlapping and total link cost for datatransmission Further the proposed algorithm exploits thelocal node state to construct and update the hop-tree forefficient data aggregation and efficient control of energyconsumption
3 WDARS Weighted Data AggregationRouting Strategy
31 The Network Model and Scenario Assumptions In thisstudy we consider the features of sensor nodes in the sim-ulated scenario as follows
(1) A 2D space has been filled with randomly deployedsensor nodes The nodes exhibit static and homo-geneous behavior in terms of storage processingabilities battery power sensing and communicationcapabilities
(2) A symmetric radio channel has been considered formodeling so that the energy needed to conduct adata transmission from sensor node 119878
119894to sensor node
119878119895is equal to the energy used for the same data
transmission from sensor node 119878119895to sensor node 119878
119894
(3) The single base station is considered to be at a distantlocation from the sensor field It is connected tothe power supply while the sensor nodes are non-rechargeable and may die after their energy areexhausted
(4) Every node possesses a unique ID and forwards thedata at any time during the network operation
(5) It is assumed that every node has the capability tocalculate its remaining energy and existing buffersize (available memory to store the data before beingserviced)
(6) The network employs a dynamic cluster architectureA cluster is formed reactively within the proximity ofthe sensing nodes event and terminated at the end ofthe event
4 Journal of Sensors
Event
Sink
Cluster member Cluster head Relay node
Aggregation pointData routing path
Figure 1 Network model diagrams for routing towards the sinknode
32 Proposed Model The event-driven applications are oftenused in a wide network and enforced dissimilar load tothe various parts of the network This is due to the arbi-trarily occurrence of the events In order to consider suchapplications the protocol should be designed to adopt adhoc features energy efficiency (ie effective management ofenergy resource for each node) maximum connectivity asimple controlled processing and transmissions
Most existing in-network data aggregation protocolsmaximize the route overlapping for efficiency of data aggre-gation However such approach may adversely affect thenetwork stability Therefore we proposed a protocol toprovide a trade-off between the data aggregation cost andthe total link cost to solve the excessive route overlappingproblem which could cause transfer of the data along longerpaths and unbalance of data load on the backbone nodesThe proposed protocol builds a fully distributed cluster andefficient routing tree with the maximum energy conservationand congestion avoidance It connects all the sensor nodesthat detect the event to the sink while maximizing the dataaggregation Also the proposed protocol optimally balancedthe energy depletion paths leading to the sink from the clusterhead Figure 1 depicts the suggested approach and the roles inthe routing arrangement are described as follows
(i) Cluster Member (CM) This node is responsible forthe discovery of an event and forwarding the gathereddata to the cluster head
(ii) Cluster Head (CH) The responsibility of the clusterhead includes the event detection and it performs thedata aggregation Then the gathered data are trans-mitted towards the sink
(iii) Relay It is a node whose duty is to forward thereceived data towards its next possible hop In somecases relay nodes represent a data aggregation pointwhen the data paths are overlapped on it
(iv) Sink It is a collection of nodes or personal computershaving high computational energy and processing
Table 1 The header of HCM
Number Parameter Description
1 Node-ID Identification of the node thattransmittedretransmitted the HCM
2 Type Description of HCMmessages
3 HtT The distance from the node to thehop-tree (in hops)
4 HtS The distance from the node to thesink (in hops)
51 ER Energy residual of the node
52 AB Available buffer memory size of thenode
capabilityThe sink is liable to receive all the data fromthe cluster head and other member nodes
The algorithm proposed in this study consists of three phasesThe first phase involves establishment of a hop-tree betweensensor nodes and sinkThe second phase starts as soon as anyevent is sensed by a node In this phase formation of clustersand selection of cluster head take place In the third phaseestablishment of routes data aggregation and routing processtake place
321 Phase I Hop-Tree Building Process The input of the ini-tialization phase is a set of nodes which are deployed inthe predetermined sensor field Consequently each nodewill identify its neighbors as possible parents within itsradio frequency (broadcast) region hop distance to reachthe sink their residual energy and available buffer sizeThe initialization algorithm begins by broadcasting a HopConfiguration Message (HCM) from the sink to all thesensors in the network (Step 1 Algorithm 1) In addition tothe common message fields it contains five key parametersincluding Node-ID Type Hop-to-Tree (HtT) Hop-to-Sink(HtS) and Status (ER AB) as explained in Table 1
In addition to Hop-to-Tree each node has Hop-to-Sink parameter that maintains a minimum number of hopsbetween the node and the sink At the beginning of the treeformation the same values are assigned to Hop-to-Tree andHop-to-Sink The value of Hop-to-Tree parameter changeimmediately after the first event is detected It will continu-ously change with the occurrence of the new events Contrar-ily the value of Hop-to-Sink remains the same in every nodeHowever Hop-to-Tree of any node may change due to theoccurrence of following two events (i) the member node isincluded in the backbone structure which is the Hop-to-Treeof the sink node and other nodes belonging to the backbonestructure are zero (ii) aHCM is received by themember nodeand gives a more accurate information about the distance
At the beginning of the process when the hop-treebegins to form the value of HtT at sink node is stored aszero and infinity for other nodes the node energy is set toactual value and the node available buffer memory size isconcededmaximum Once the neighboring nodes of the sinkreceive the HCM (Step 2 Algorithm 1) a node performs thefollowing tasks verifies if its HtT value is greater than the
Journal of Sensors 5
value of HtT in the HCM message (Step 31 Algorithm 1)this condition will guarantee that each node records theminimum number of hops to the sink Depending on thevalidity of the condition the node maintains the informationof its neighbors whose HCM are received in neighbors table(Step 311 Algorithm 1) This node also updates the routingtable as stated in Steps 312 and 313 in Algorithm 1 byexploiting the weights function to compute the link costof their next hop neighbors and selects the node with thelowest cost as its next hop is depending on (4) This followsincrementing the values of HtT and HtS by one in a sensornode The sensor node then computes its residual energyafter one complete transmission and updates the ER fieldMoreover it computes the obtainable buffer size and updatesthe AB field and finally circulates the HCM to furtherneighbors as shown in Algorithm 1 (Steps 314ndash3111)
Otherwise in Step 32 Algorithm 1 the HCM messagewill be dropped if the condition in Step 31 Algorithm 1 isfalse which indicates the stored path is the shortest distanceto sink
This procedure is repeated until all the nodes in thenetwork join the tree topology with the sink node as the rootnode of the tree
The weights for packet transmission from node 119909 to node119910 are defined as follows
1198821= (1 minus
119864res (119910)
119864init (119910))
2
+ (1 minus119861ava (119910)
119861total (119910))
2
(1)
1198822=((HtT (119910) minusHtT (119909)) + 1)
HtT (119910)(2)
1198823=((HtS (119910) minusHtS (119909)) + 1)
HtS (119910)(3)
119882119891= alpha lowast119882
1+ beta lowast119882
2+meu
lowast1198823
(4)
alpha + beta +meu = 1 (5)
Theweight (1198821) consists of leftover energy and average buffer
size of node In the first part of (1) when the remaining energyof node 119910 reduces the result approaches 1 Conversely whenthe remaining energy is high the resulting value approacheszero and the cost reduces Furthermore if the node energydoes not change (ie same as the starting energy) zero costenergy will be obtained Likewise in the second part of theequation when the buffer is spacious the cost approaches 0and when the buffer size has reached its maximum capacitythe cost approaches 1
Further1198822and119882
3are the distance based on number of
hops to calculate the next hop neighbor These weights havethe same initial values during the establishment of the tree In(2) when the node 119910 is one hop closer to already establishedpath 0 cost is obtained If the node 119910 is far from the earlier
Sink
6
17
58
65
4
4
38
4
5
5
5
9 3
9
2
5
14 3
39
10
10
8
6
8
8
8 7
6
6
2
6
1
43
3
2
9 6
4
5
2
2
4
4
4 3
2
98
3
2
3
7
1
3
3
2
9
8
9
7
7
5
7
1
11
9 7
9
1
6
7
4
7
9
10
10
10
10
10
10
10
11
11 4
11
Figure 2 The hop-tree building process
path the cost is higher than 0 and if the hop distance isthe same the cost is 1 The same principle is applied to (3)but the variables are representing the distance to the sinkThe weights are represented by alpha beta meu and theirsummation is equal to unityThefinalweight (119882
119891) is obtained
by combining11988211198822 and119882
3together which represents the
overall cost of the packet transmission fromnode119909 to node119910Figure 2 shows the hop-tree building process where the
labels in the sensors indicate the Hop-to-Tree in increasingorder as it moves away from the sink
Algorithm 1 Hop-tree building process
Step 1 The sink node broadcasts the initializationmessage HCMStep 2 ldquo119873rdquo is the set of nodes in a network that receiveHCM such that 119909 isin 119873119909 represents any member nodeStep 3 Foreach 119909 isin 119873
Step 31 If HtT(119909) gt HtT (received HCM) (119909)larr true then
Step 311 Insert Neighbortable (Node-IDHtT HtS ER and BM)Step 312 Node 119909 compute the final linkcost (119882
119891) for119873119864(119909)
NE (119909119894) = 119909
119895119889(119897119894 119897119895) le 119903119888and 119897119895le 119897119894 is
the set of neighbor nodes of sensor node 119909119894
where 119897119894is the location of 119909
119894and 119889(119897
119894 119897119895) is
the Euclidean distance between 119909119894and 119909
119895
Step 313 NextHop(119909) larr ID(Bestneigh-bour)Bestneighbour=Theneighbourwith small-est weightStep 314 HtT(119909) larr HtT(HCM) + 1Step 315 HtS(119909) larr HtT(HCM) + 1Step 316 Update the HCMStep 317 ID(HCM) larr ID(119909)Step 318HtT(HCM) larr HtT(119909)Step 319HtS(HCM) larr HtS(119909)
6 Journal of Sensors
Event
Sink
6
17
58
65
4
4
38
4
5
5
5
9 3
9
2
5
14 3
39
10
10
8
6
8
8
8 7
6
6
2
6
1
43
3
2
9 6
4
5
2
2
4
4
4 3
2
98
3
2
3
7
1
3
3
2
9
8
9
7
7
5
7
1
11
9 7
9
1
6
Cluster member Cluster head
7
4
7
9
10
10
10
10
10
10
10
11
11 4
11
Figure 3 Example of cluster formation
Step 3110 Status (HCM)larr Status (119909)State contain ER amp ABStep 3111 Broadcast (HCM)
Step 32 Else Discard HCMmessageStep 33 End
Step 4 End
322 Phase II Event-Driven Cluster Formation and ClusterHead Election In phase II a formation of dynamic clusterarchitecture takes place Once the event is located all thenodes that detect the event will be input to the clusterformation algorithm At the end the algorithm will choosea specific sensor node as the cluster head (ideally the onewith the minimumweight cost) while nodes within the rangeof the cluster head will be designated as member nodes Inthis process any node that has detected the event sets its roleto cluster head and calculates its weight (119882
119891) as stated in
Steps 11 and 12 in Algorithm 2 Then all event nodes prop-agate their information by Cluster Configuration Message(CCM) (Step 13 Algorithm 2) where CCM also constitutesquantities (Node-ID Type HtT HtS and Status) Clusterhead is selected considering the final weight function (4) andminimum weight node will be assigned as the cluster head(Step 3 Algorithm 2) Finally the decision is broadcasted tothe all member nodes The member nodes then remembertheir cluster head and all the events detection reports are sentdirectly to the cluster head In the case of two ormore concur-rent nodes having the same weight the node with the lowestID is considered eligible as shown in Step 32 Algorithm 2
Every cluster head is liable to collect information from themember nodes and forward the aggregated data towards sinkFigure 3 shows an example of cluster formation
Algorithm 2 Event-driven cluster formation and cluster headelection
Input 119878 119878 is the set of nodes that detects the event
Output 119906 A node of the set 119878 is elected as a clusterheadStep 1 Foreach 119909 isin 119878 do
Step 11 Role(119909) larr Cluster headStep 12 119882
119891(119909) larr alpha lowast 119882
1+ beta lowast 119882
2+
meu lowast1198823
Each node calculate its weight119882119891
Step 13 Node 119909 broadcast (CCM)Each node after create CCMbroadcast it toits one hop neighbors
Step 14 End
Step 2 ldquo119873rdquo is the set of nodes in a network thatreceived CCM and detects the eventStep 3 Foreach 119906 isin 119873
Step 31 If 119882119891(119906) gt 119882
119891(CCM) then
Step 311 Role(119906) larr Member NodeStep 312 Node 119906 retransmits the CCMreceived from 119909
Step 32 ElseIf 119882119891(119906) == 119882
119891(CCM) ampamp
ID(119906) gt ID(CCM) thenStep 321 Role(119906) larr Member NodeStep 322 Node 119906 retransmits the CCMreceived from 119909
Step 33 ElseNode 119906 discards the CCM receivedfrom 119909
Step 4 End
323 Phase III Route Establishment in Consideration of NodesWeight In phase III a group of cluster heads which wereestablished during phase II is considered as input and thenew route to transfer the event data will be the outcome ofthis process In this phase routing tree formation is based onthe saved weights in neighbor table which was created duringPhase I Each node will be well aware of all its neighbors thepossible parent nodes within its radio range number of hopsrequired to approach sink or former routing path remainingenergy of those nodes and obtainable buffer memory Thisimplies that each node can use the information in neighborstable to send the data packet to the sink node
In the first step of this process the cluster head is nowresponsible for routing tree formation and routing packetsof the new event towards the sink (Step 1 Algorithm 3) Thecluster head will check if its HtT is zero and this means it isapart from the backbone of the hop-tree so creating a freshroute as hop-treesrsquo new backbone is not required (Step 2Algorithm 3)
In order to acquire even energy dissipation and avoidcongestion delay which is caused by data collisions theWDARS scheme keeps track of the remaining energy leveland accessible buffer memory of the nodes in the backbonewhich if it gets larger than the set weight limit the new
Journal of Sensors 7
routing path formation is initiated as shown in Step 3Algorithm 3 During the reformation process the neighbornode that relatively has less HtT and HtS higher energylevel and available buffer memory in comparison to othercandidates is chosen as the alternative next hope Also inthe reformation of routing path process the weight-thresholdlevel for (119882
1) in every node is slightly increased if no suitable
node can be foundThe cluster head starts to create a route establishment
message (REM) and sends the REM to its next hop as shownin Step 4 Algorithm 3 If a route establishment messageis received by the next hop node it will retransmit andinitiate the process of updating the hop-tree (Steps 5 and 6Algorithm 3) The repetition of these steps occurs until thesink is approached or a node that took part in a formerlyconstructed route is discoveredThe creation of routes occursby selecting the best neighbor at every hop
The updating of hop-tree is required so that all sourcenodes can be connected via shortest paths data aggregationcan be maximized and energy dissipation can be balanced asevents befall in succession In the proposed scheme HtTHtSER and AB values are updated at each node to fulfill theseobjectives Correlation among data is of great concern in dataaggregation and hence higher degree of correlation generatesbetter results Spatial distance between nodes determines thespatial correlation of sensed data by nodes So if the twoevents are closer the sensed data is highly correlated whereaswhen the events are far apart the sensed data exhibits lowersdegree of correlationUsually efficient data aggregation couldnot be performed for events that are far apart InWDARS thepurpose of using varied weights especially for HtT andHtS inroute establishment is to achieve the ideal point for path over-lapping for different events When events are close the datapath will overlap as early as possible at the nearest ideal pointfor aggregating eventrsquos data In contrast when the events arefar apart the data routes overlapping will occur at the pointwhere the shortest path will be selected to reach the destina-tion and avoid transferring the data over the long tracks
Algorithm 3 Routing establishment in consideration ofnodes weight
Step 1The leader node V of new event starts to estab-lish routing treeStep 2 If HtT(V) == 0 then
Step 21 Start send data to its NextHop(V)
There is no need to routing formation node V isalready on the backbone of the Hop-TreeStep 3 If 119882
1(NextHop(V)) gtWeight-Threshold then
Step 31 Node V find a new NextHop withless weight that satisfy the predefined limits byexploiting the neighbors table
Step 4The leader node V sendingREMto its next hopStep 5 Repeat
Step 51 Node 119909 is NextHop(V) that receivedREMStep 52HtT(119909) larr 0node 119909 becomes a part from new routing struc-tureStep 53 Role(119909) larr RelayStep 54 If 119882
1(NextHop(119909)) gtWeight-Thresh-
old thenStep 541Node119909 find a newNextHopwithless weight that satisfy the predefined limitsby exploiting the neighbors table
Step 55 Node 119909 send route establishment mes-sage REM to its NextHop(119909)Step 56Node119909broadcasts theHCMwith valueof HtT = 0
Step 6 Until finds the sink node or a node belongs tothe routing structure for previous eventStep 7 End
Figure 4(a) shows the formation of the new path and theupdated hop-tree based on HtT only [39] Their techniqueforces the paths from the events that occur far apart tooverlap and aggregate the data from two consistent eventsThis results in a poor data formation the overload in over-lapping paths that causes imbalance of energy consumptionin the network and increase in the number of dead nodesMoreover the data transmission over the lengthier path willboost the total energy consumption In WDARS the state ofroute overlapping depends on HtT and HtS as an addition tothe node status as shown in Figure 4(b) It can be observedthat the route overlapping is linearly related to the distancebetween the two events and guaranteed the data transmissionover the shortest route possible
4 Simulation Results andPerformance Evaluation
41 Simulation Environment The simulation of the proposedmodel was conducted using MATLAB with IEEE 802154as the MAC layer protocol This simulation was based ona wireless sensor network in event-based environment withan area of 500m times 500m in which the nodes are randomlyplaced If two sensors are within the range of each other theyare considered neighbors A circular event space is consideredwith random position time and event duration The sizeof the nodes varies from [100 300] with a step size of 50nodeswhile the sensor field communication range and eventradius remain constant As the number of nodes increasesthe time taken for simulation also increases gradually Allparameters used in this simulation are listed in Table 2
411 Description of Adopted Energy ConsumptionModel Theenergy consumption model can be categorized into threeenergy consumption submodules communication compu-tation and sensing [14] Among these activities the com-munication phase consumes a significant amount of energy
8 Journal of Sensors
Sink
1
02
21
01
0
3
11
1
5
3
0
5 3
7
1
2
122
01
2
2
4
6
3
0
1 1
3
4
1
2
2
45
1
2
1 2
4
1
4
2
2
1
3 3
3
6
5
3
0
2
6
3
4
4
3
3
6
0
5
4
4
6
1
1
23
0
1
5
0
5
1
4
0
0
1
5
3
6
4
5
6 5
1
EventCluster member Cluster head Relay node
Data routing path
(a)
Sink
1
02
21
01
0
3
11
1
5
3
0
5 3
7
1
2
122
01
2
2
4
6
3
0
1 1
3
4
1
2
2
45
1
2
1 2
4
1
4
2
2
1
3 3
3
6
5
3
0
2
6
3
4
4
3
3
6
0
5
4
4
6
1
1
23
0
1
5
0
5
1
4
0
0
1
5
3
6
4
5
6 5
1
EventCluster member Cluster head Relay node
Aggregation pointData routing path
(b)
Figure 4 (a) and (b) The formation of the new path based on the former hop-tree when another event happens for DRINA and WDARSrespectively
Table 2 Simulation parameter
Parameter ValueChannel Wireless channelSink node Fixed coordinatesDeployment area 500m times 500mAntenna Omni directionalInitial node energy 2 JNumber of sensor nodes 100 150 200 250 300Number of events 3Event radius 80mCommunication radius 80mSimulation time (sec) 3000Topology Dynamic clusterBandwidth 10MbpsData packet size 1024 byteControl packet size 56 byteAlpha 0250Beta 0375Meu 0375
in the sensor nodes depending on the distance betweensource and destination node In this simulation we utilizethe radio transceiver model as in [40] According to thecommunication energy consumption model in Figure 5 theenergy consumed to transmit an ℓ-bit packet over a distance119889 by the radio can be described in the following equation
119864Tx (ℓ 119889) = ℓ lowast 119864node (Tx) + ℓ lowast 120576op-amp lowast 119889120578 (6)
Furthermore a sensor node is responsible for forwardingother sensor nodesrsquo data In this procedure the data packetsare received by the sensor nodes and their energy is not
affected by variation of distance between communicationpairs Therefore the energy required for receiving an ℓ-bitspacket over a distance 119889 is given by the following equation
119864Rx (ℓ) = ℓ lowast 119864node (Rx) (7)
The sensing structure of each sensor node is activated anddata is collected from the surroundings by consuming sensingenergy denoted by119864
119904 It is assumed that a constant amount of
energy 119864node (sensing) is dissipated to sense one bit Hence theoverall energy dissipation for ℓ-bits is given by the followingequation
119864119904= 119864node (sensing) lowast ℓ (8)
Finally the sensor network has been structured into dis-tributed clusters The sensor nodes not only forward thedata but also contribute in making key decisions regardingthe network operation Furthermore the computation ofdata aggregation consumes extra energy 119864node (aggregation) butit is relatively low in comparison to the energy dissipatedduring communication [14] For simplicity we assume theenergy dissipated for computation and sensing energy arethe same and equal to 50 nJbit while communication (send-ingreceiving) is assumed to be 100 nJbit The following listdefines the meaning of different energy terms in this workand their typical values
Energy consumption model parameters are presented asfollows
Term and meaning are given
119864node (Tx) energy consumed in transmitter electronicsper bit (taken to be 100 nJbit)119864node (Rx) energy consumed in receiver electronicsper bit (taken to be 100 nJbit)
Journal of Sensors 9
d
Receiver electronics
Transmitter electronics
Transmitter electronics
Data processor
Transmitter amplifier
Packet (985747 bit)
Packet (985747 bit)
Enode(sensing)
Enode(aggregation) ETx(985747 d) ERx(985747 )
L middot Enode(Tx) L middot Enode(Rx)L middot 120576op-ampd120578
Microsensor
Figure 5 Energy consumption model
119864node (sensing) energy consumed in sensing one bit(taken to be 50 nJbit)
119864node (aggregation) energy consumed for aggregatingone bit (taken to be 50 nJbitsignal)
120576op-amp energy consumed in the transmitter ampli-fier for either a free-space channel or a multi-path fading channel (taken to be 10 pJbitm2 and00013 pJbitm4 resp)
119889 distance that the data has to travel
ℓ data packet size in bits (taken to be 8192 bit)
120578 path loss exponent that ranges between 2 and 6
42 Performance Evaluation The performance of the pro-posed WDARS has been evaluated with various network testcases and compared against DRINA and InFRA protocolsFigure 6 illustrates the energy consumption of the nodes forvarious network densities between WDARS DRINA andInFRA protocols The InFRA recorded the highest energyconsumption followed by DRINA and WDARS This is dueto the fact that the InFRA sends more control packetsthroughout the network during the event detection to informthe nodes and update the routes from existing coordinators tothe sink node This process results in a high communicationcost in InFRA In DRINA lengthier paths are formed dueto unwanted overlapping of distant and uncorrelated eventsTherefore a significant energy is wasted by forwarding thedata through the longer paths On the contrary the suggestedmethodology ofWDARS consumes less energy by taking intoconsideration the residual energy of the nodes to stabilizethe energy consumption among the nodes Moreover theweights of HtT and HtS play an important role in energysaving through the selection of the proper overlappingpoints Consequently a balanced trade-off between the dataaggregation and link cost is achievedThe average of the totalenergy consumption for all tested protocols is depicted inFigure 7 The proposed WDARS recorded the lowest energyconsumption with 1165 compared to the DRINA (2175)and the InFRA (3571)
Energy consumptionnode
WDARSDRINAInFRA
150 200 250 300100Number of nodes
01
02
03
04
05
06
07
08
Ener
gy co
nsum
ptio
n (J
)
Figure 6 Comparison of average energy consumption for differentnode density
WDARS DRINA InFRA
Average energy consumptionnode
0
01
02
03
04
05
06
07
08
Ener
gy co
nsum
ptio
n (J
)
071427 J
043503 J
023307 J
Figure 7 Comparison of total energy consumption
10 Journal of Sensors
Total number of dead nodes
WDARSDRINAInFRA
150 200 250 300100Number of nodes
0
5
10
15
20
25
30
Dea
d no
des
Figure 8 Comparison of the dead nodes number
Next the rates of dead nodes for each algorithm duringthe network operation were evaluated and compared asshown in Figure 8 Again theWDARShad the lowest numberof the dead nodes followed by the DRINA and InFRA inascending order This can be explained as follows InFRAignores the node status in decision to forward the nodesOnly the shortest path tree is considered to link the sourceand sink node and enable the intracluster data aggregationConsequently the nodes which are located at the shortestpath are extensively utilized during the data transmissionThis causes excessive energy consumption by those nodesand in turn generates a lot of dead nodes in the networkIn DRINA the maximization of the route overlapping isirrespective to the actual status of the network nodes andthe spatial correlation between the events Such approach hasplaced an immense load on the overlapping area and a verylow aggregation ratio As a result the energy of the nodes inthese areas is rapidly depleted and contributed to the earlydeath of the backbone nodes ContrarilyWDARSminimizedthe deadnodes by setting theweights rationally Furthermorethe scenario of low hop distance and extensive energy deple-tion were successfully avoided in WDARS Thus the energyconsumption of the nodes in the network is well balanced
The network lifetime is highly depending on the routingprotocol and influence by two factors energy consumed overtime and the initial node energy If the initial energy capacityof a node is 119864 and the energy consumed by each node is 119890
119894
then the time up to which the node can work is given as(119905119894= 119864119890
119894) All such arrays of 119905
119894provide us with the infor-
mation about network lifetime As depicted in Figure 9 thenetwork lifetime of all algorithms increased as the nodedensity increasedThe lifetime of theWDARS exceeded otheralgorithms at all node densities When the node density wasminimum the difference of lifetime between WDARS andDRINA and InFRA was 889 and 944 respectively At
Average network lifetime
0
2
4
6
8
10
12
14
16
18
Tim
e (hr
)
150 200 250 300100Number of nodes
WDARSDRINAInFRA
Figure 9 Comparison of network lifetime
Total throughput
150 200 250 300100Number of nodes
1000
2000
3000
4000
5000
6000
7000
Thro
ughp
ut (K
bps)
WDARSDRINAInFRA
Figure 10 Comparison of throughput
node size of 300 theWDARS scored 9111which was higheras compared to DRINA and InFRA with 7555 and 7778respectively Moreover the approach of the energy balanceadopted by the WDARS appears to be beneficial with theincrease of network density
Figure 10 shows the throughput of WDARS DRINA andInFRA in different network density It can be observed thatthe total throughput is increased with the increasing of nodedensity Overall the WDARS achieved 822 and 1307more throughput at the lowest density network and 3931and 4190 at the highest density network as comparedwith DRINA and InFRA respectively Such performance of
Journal of Sensors 11
Packet delivery ratio
WDARSDRINAInFRA
10
20
30
40
50
60
70
80
90
PDR
()
150 200 250 300100Number of nodes
Figure 11 Comparison of packet delivery ratio
WDARS is contributed by its protocol that tracks the level ofthe available buffer memory in the backbone and effectivelyavoids the congestion delay caused by data collisions
Another evaluation metric that quantifies the quality ofrouting tree built by the algorithms is measured by the packetdelivery ratio (PDR)A lowPDR implies a greater aggregationrate of the built tree In Figure 11 the PDR for all algorithmsis increased as the network density increased At the lowestnetwork density the WDARS has low PDR with 3610and 3980 whereas at highest density it has a 2650 and3310 as compared to DRINA and InFRA respectively TheWDARS selects the ideal point for routes overlapping whichresults in fewer relay nodes in the routing tree as compared toDRINA and InFRA for varying network density The perfectaggregation results were achieved via minimal Steiner tree[23]
5 Conclusion and Future Recommendations
This paper presented a multiobjective clustered-based rout-ing protocol by utilizing the comprehensive weights Theproposed WDARS successfully maximized the route over-lapping via ideal aggregation point while simultaneouslyensuring the data transmission across a lightweight route inWSNsTheperformance ofWDARSwas comparedwithwell-known DRINA and InFRA algorithms in terms of scalabilityaggregation rate data delivery rate energy consumption andnetwork lifetime For a set of different test instances the simu-lation results showed that WDARS-based clustering protocoloutperformed the DRINA and InFRA Also our WDARSattained a better performance in the network lifetime byproviding a route structure with lower energy consump-tion for in-network communication Furthermore WDARSdemonstrated an acceptable level in balancing the energy loadamong all nodes This reflects that the proposed algorithm
can provide considering aggregation cost Also a trade-offbetween network load and network lifetime was establishedwhile considering residual node energy and obtainable buffersize Other improvements in route structures exhibiting delayand fault tolerance abilitieswill be investigated in futurework
Competing Interests
The authors declare that there is no conflict of interestsregarding the publication of this paper
Acknowledgments
This research is supported by Research Grant RP036(ABC)-15AET and HIR MoE Grant UMC6251HIRMoEFCSIT17 from the Ministry of Education Malaysia
References
[1] K Matrouk and B Landfeldt ldquoRETT-gen a globally efficientrouting protocol for wireless sensor networks by equalisingsensor energy and avoiding energy holesrdquoAdHocNetworks vol7 no 3 pp 514ndash536 2009
[2] M H Anisi G Abdul-Salaam M Y I Idris A W A Wahaband I Ahmedy ldquoEnergy harvesting and battery power basedrouting in wireless sensor networksrdquoWireless Networks 2015
[3] H Modares R Salleh and A Moravejosharieh ldquoOverview ofsecurity issues in wireless sensor networksrdquo in Proceedings ofthe 3rd International Conference on Computational IntelligenceModelling and Simulation (CIMSim rsquo11) pp 308ndash311 September2011
[4] I F AkyildizW Su Y Sankarasubramaniam and E Cayirci ldquoAsurvey on sensor networksrdquo IEEE Communications Magazinevol 40 no 8 pp 102ndash114 2002
[5] D Miorandi S Sicari F De Pellegrini and I Chlamtac ldquoInter-net of things vision applications and research challengesrdquo AdHoc Networks vol 10 no 7 pp 1497ndash1516 2012
[6] M Y I Idris A M A Abu Znaid A W A Wahab L KQabajeh and O A Mahdi ldquoLow communication cost (LCC)scheme for localizingmobile wireless sensor networksrdquoWirelessNetworks 2016
[7] M Ahmed M R Sattari M K Nasir et al ldquoVehicle adhocsensor network framework to provide green communication forurban operation rescuerdquo Lecture Notes on Information Theoryvol 1 no 2 pp 77ndash82 2013
[8] S Khan A Gani A W Wahab M Shiraz and I AhmadldquoNetwork forensics review taxonomy and open challengesrdquoJournal of Network and Computer Applications vol 66 pp 214ndash235 2016
[9] S Park ldquoPerformance evaluation of data aggregation schemesin wireless sensor networksrdquo in Proceedings of the IEEEWirelessCommunications and Networking Conference (WCNC rsquo06) vol1 pp 413ndash418 Las Vegas Nev USA April 2006
[10] M H Anisi A H Abdullah and S A Razak ldquoEnergy-efficientand reliable data delivery in wireless sensor networksrdquoWirelessNetworks vol 19 no 4 pp 495ndash505 2013
[11] S A A Shah M Shiraz M K Nasir and R B M Noor ldquoUni-cast routing protocols for urban vehicular networks reviewtaxonomy and open research issuesrdquo Journal of Zhejiang Uni-versity Science C vol 15 no 7 pp 489ndash513 2014
12 Journal of Sensors
[12] G Abdul-Salaam A H Abdullah M H Anisi A Gani andA Alelaiwi ldquoA comparative analysis of energy conservationapproaches in hybrid wireless sensor networks data collectionprotocolsrdquo Telecommunication Systems vol 61 no 1 pp 159ndash179 2016
[13] S Halawani and A W Khan ldquoSensors lifetime enhancementtechniques in wireless sensor networksmdasha surveyrdquo Journal ofComputing vol 2 no 5 pp 34ndash47 2010
[14] V Raghunathan C Schurgers S Park and M B SrivastavaldquoEnergy-aware wireless microsensor networksrdquo IEEE SignalProcessing Magazine vol 19 no 2 pp 40ndash50 2002
[15] M Gasser ldquoIn-Network Aggregation Techniques in WirelessSensor Networksrdquo Internet Economics VIII p 7 2014
[16] B Abid T T Nguyen and H Seba ldquoNew data aggregationapproach for time-constrained wireless sensor networksrdquo TheJournal of Supercomputing vol 71 no 5 pp 1678ndash1693 2015
[17] C Chen K Lee J-S Park and S J Baek ldquoMinimum cost dataaggregation for wireless sensor networks computing functionsof sensed datardquo Journal of Sensors vol 2015 Article ID 50690917 pages 2015
[18] M Bagaa Y Challal A Ksentini A Derhab and N BadacheldquoData aggregation scheduling algorithms in wireless sensornetworks solutions and challengesrdquo IEEE CommunicationsSurveys amp Tutorials vol 16 no 3 pp 1339ndash1368 2014
[19] L Chitnis A Dobra and S Ranka ldquoAggregation methods forlarge-scale sensor networksrdquo ACM Transactions on Sensor Net-works vol 4 no 2 article 9 2008
[20] R Rajagopalan and P K Varshney ldquoData-aggregation tech-niques in sensor networks a surveyrdquo IEEE CommunicationsSurveys and Tutorials vol 8 no 4 pp 48ndash63 2006
[21] C Castelluccia A C-F Chan E Mykletun and G TsudikldquoEfficient and provably secure aggregation of encrypted datain wireless sensor networksrdquo ACM Transactions on SensorNetworks vol 5 no 3 article 20 2009
[22] J Li A Deshpande and S Khuller ldquoOn computing compres-sion trees for data collection in wireless sensor networksrdquo inProceedings of the IEEE INFOCOM pp 1ndash9 IEEE San DiegoCalif USA March 2010
[23] B Krishnamachari D Estrin and S Wicker ldquoThe impact ofdata aggregation in wireless sensor networksrdquo in Proceedings ofthe 22nd IEEE International Conference on Distributed Comput-ing Systems Workshops pp 575ndash578 Vienna Austria 2002
[24] R Cristescu B Beferull-Lozano M Vetterli and R Watten-hofer ldquoNetwork correlated data gathering with explicit com-munication NP-completeness and algorithmsrdquo IEEEACMTransactions on Networking vol 14 no 1 pp 41ndash54 2006
[25] S-J Park and R Sivakumar ldquoEnergy efficient correlated dataaggregation for wireless sensor networksrdquo International Journalof Distributed Sensor Networks vol 4 no 1 pp 13ndash27 2008
[26] M Lee and V W Wong ldquoAn energy-aware spanning treealgorithm for data aggregation in wireless sensor networksrdquo inProceedings of the IEEE Pacific Rim Conference on Communi-cations Computers and Signal Processing (PACRIM rsquo05) IEEEAugust 2005
[27] Z Eskandari M H Yaghmaee and A Mohajerzadeh ldquoEnergyefficient spanning tree for data aggregation in wireless sensornetworksrdquo in Proceedings of the 17th International Conference onComputer Communications and Networks (ICCCN rsquo08) pp 1ndash5IEEE St Thomas Virgin Islands USA August 2008
[28] A A Abbasi andM Younis ldquoA survey on clustering algorithmsfor wireless sensor networksrdquo Computer Communications vol30 no 14-15 pp 2826ndash2841 2007
[29] R Ghosh and S Basagni ldquoNapping backbones energy efficienttopology control for wireless sensor networksrdquo in Proceedingsof the IEEE Radio andWireless Symposium pp 611ndash614 January2006
[30] Y Chen and S H Son ldquoA fault tolerant topology control inwireless sensor networksrdquo in Proceedings of the 3rd ACSIEEEInternational Conference onComputer Systems andApplicationspp 269ndash276 January 2005
[31] M Busse T Haenselmann and W Effelsberg ldquoTECA a topol-ogy and energy control algorithm for wireless sensor networksrdquoin Proceedings of the 9th ACM Symposium onModeling Analysisand Simulation of Wireless and Mobile Systems (MSWiM rsquo06)pp 317ndash321 October 2006
[32] W B Heinzelman A P Chandrakasan and H Balakrish-nan ldquoAn application-specific protocol architecture for wirelessmicrosensor networksrdquo IEEE Transactions onWireless Commu-nications vol 1 no 4 pp 660ndash670 2002
[33] W-P Chen J C Hou and L Sha ldquoDynamic clustering foracoustic target tracking in wireless sensor networksrdquo IEEETransactions on Mobile Computing vol 3 no 3 pp 258ndash2712004
[34] W BHeinzelmanApplication-Specific Protocol Architectures forWireless Networks Massachusetts Institute of Technology 2000
[35] O Younis and S Fahmy ldquoHEED a hybrid energy-efficientdistributed clustering approach for ad hoc sensor networksrdquoIEEE Transactions on Mobile Computing vol 3 no 4 pp 366ndash379 2004
[36] S Park Performance analysis of data aggregation schemes forwireless sensor networks static-cluster aggregation and dynamic-cluster aggregation section [PhD dissertation] North CarolinaState University Raleigh NC USA 2006
[37] J-Y Cheng S-J Ruan R-G Cheng and T-T Hsu ldquoPADCPpower-aware dynamic clustering protocol for wireless sensornetworkrdquo in Proceedings of the IFIP International Conference onWireless and Optical Communications Networks 6 pages IEEEBangalore India April 2006
[38] E Nakamura H de Oliveira L Pontello and A LoureiroldquoOn demand role assignment for event-detection in sensor net-worksrdquo in Proceedings of the 11th IEEE Symposium onComputersand Communications (ISCC rsquo06) pp 941ndash947 Cagliari Italy2006
[39] L A Villas A Boukerche H S Ramos H A de Oliveira RB de Araujo and A A Loureiro ldquoDRINA a lightweight andreliable routing approach for in-network aggregation inwirelesssensor networksrdquo IEEE Transactions on Computers vol 62 no4 pp 676ndash689 2013
[40] W R Heinzelman A Chandrakasan and H BalakrishnanldquoEnergy-efficient communication protocol for wireless micro-sensor networksrdquo in Proceedings of the 33rd Annual HawaiiInternational Conference on System Siences IEEEMaui HawaiiUSA January 2000
International Journal of
AerospaceEngineeringHindawi Publishing Corporationhttpwwwhindawicom Volume 2014
RoboticsJournal of
Hindawi Publishing Corporationhttpwwwhindawicom Volume 2014
Hindawi Publishing Corporationhttpwwwhindawicom Volume 2014
Active and Passive Electronic Components
Control Scienceand Engineering
Journal of
Hindawi Publishing Corporationhttpwwwhindawicom Volume 2014
International Journal of
RotatingMachinery
Hindawi Publishing Corporationhttpwwwhindawicom Volume 2014
Hindawi Publishing Corporation httpwwwhindawicom
Journal ofEngineeringVolume 2014
Submit your manuscripts athttpwwwhindawicom
VLSI Design
Hindawi Publishing Corporationhttpwwwhindawicom Volume 2014
Hindawi Publishing Corporationhttpwwwhindawicom Volume 2014
Shock and Vibration
Hindawi Publishing Corporationhttpwwwhindawicom Volume 2014
Civil EngineeringAdvances in
Acoustics and VibrationAdvances in
Hindawi Publishing Corporationhttpwwwhindawicom Volume 2014
Hindawi Publishing Corporationhttpwwwhindawicom Volume 2014
Electrical and Computer Engineering
Journal of
Advances inOptoElectronics
Hindawi Publishing Corporation httpwwwhindawicom
Volume 2014
The Scientific World JournalHindawi Publishing Corporation httpwwwhindawicom Volume 2014
SensorsJournal of
Hindawi Publishing Corporationhttpwwwhindawicom Volume 2014
Modelling amp Simulation in EngineeringHindawi Publishing Corporation httpwwwhindawicom Volume 2014
Hindawi Publishing Corporationhttpwwwhindawicom Volume 2014
Chemical EngineeringInternational Journal of Antennas and
Propagation
International Journal of
Hindawi Publishing Corporationhttpwwwhindawicom Volume 2014
Hindawi Publishing Corporationhttpwwwhindawicom Volume 2014
Navigation and Observation
International Journal of
Hindawi Publishing Corporationhttpwwwhindawicom Volume 2014
DistributedSensor Networks
International Journal of
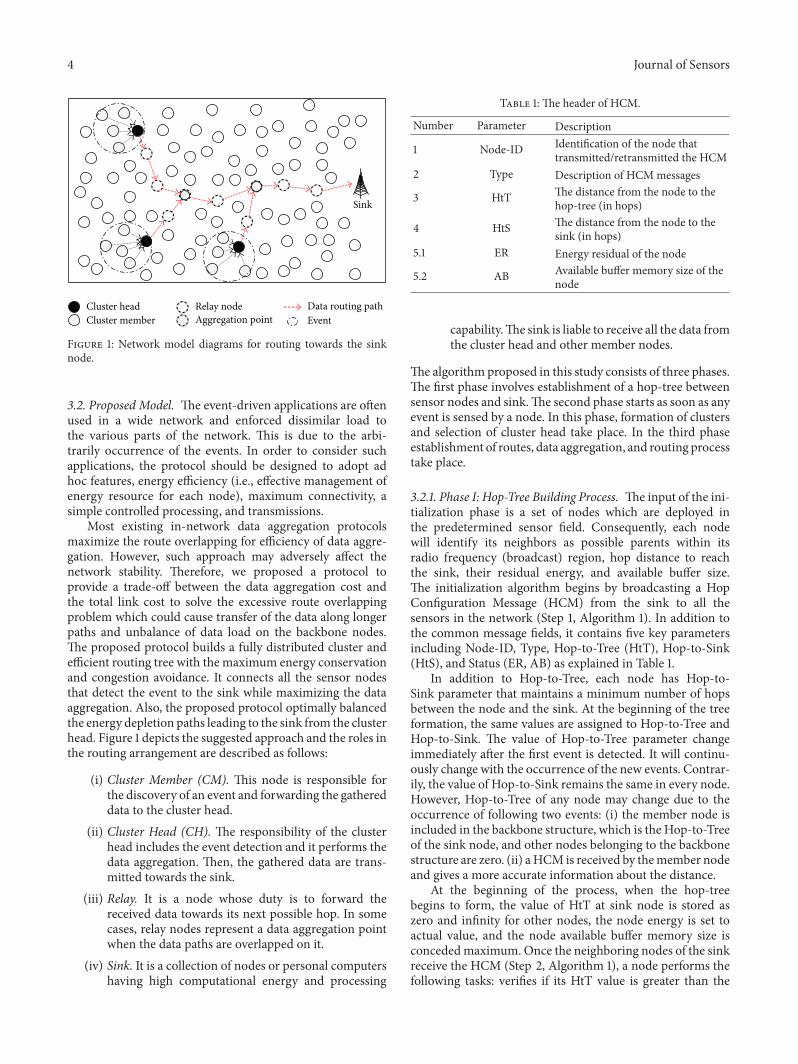
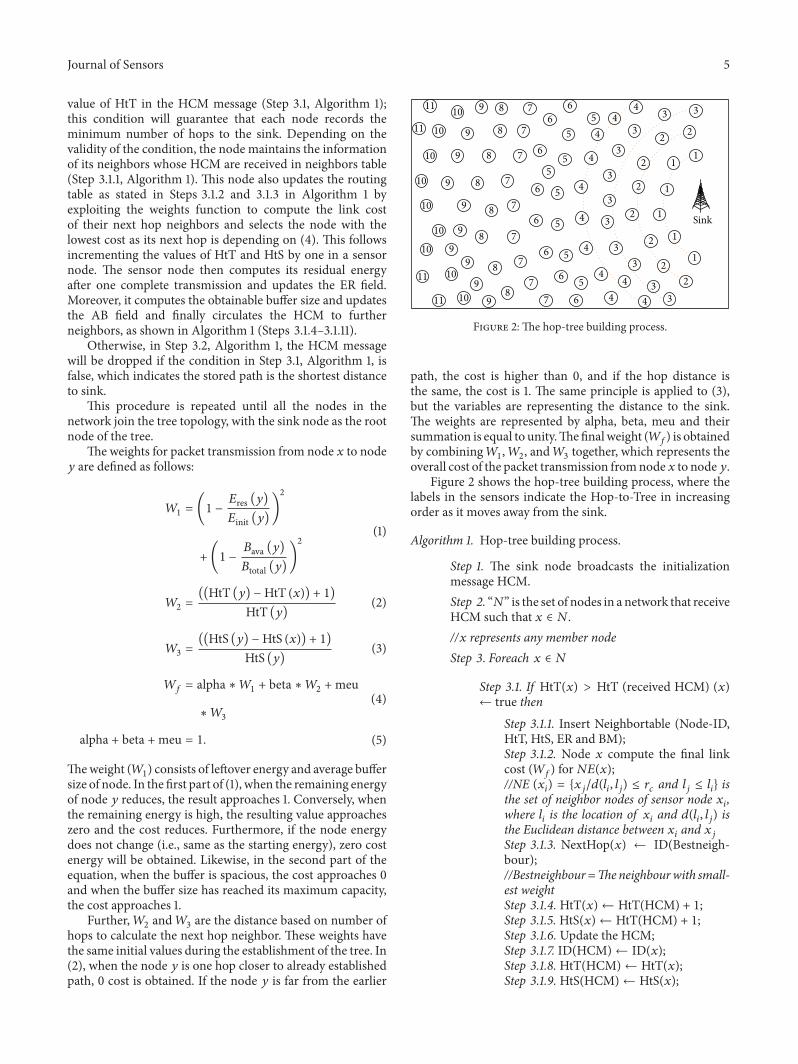
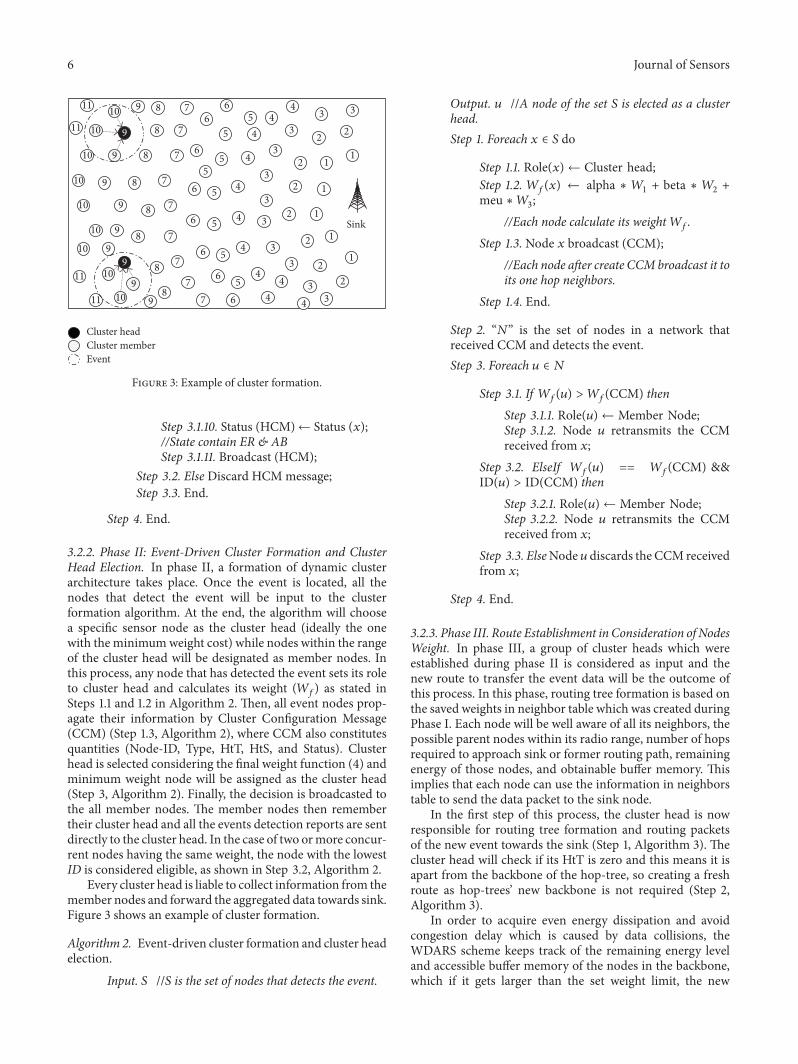
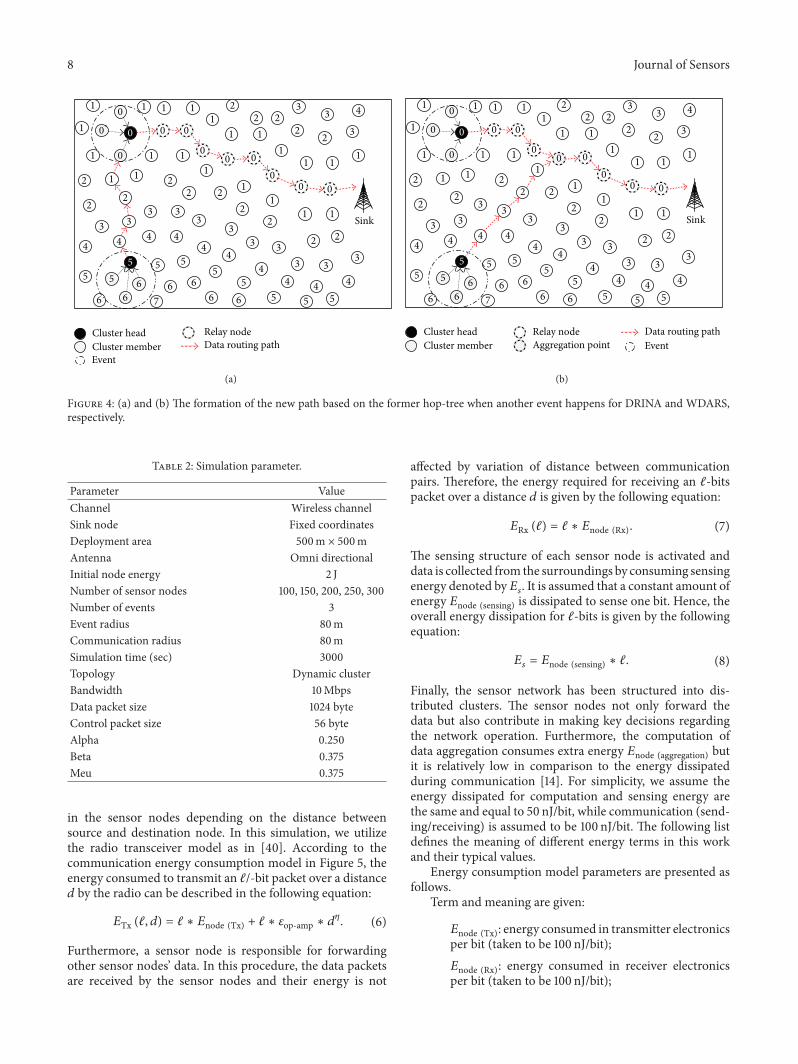
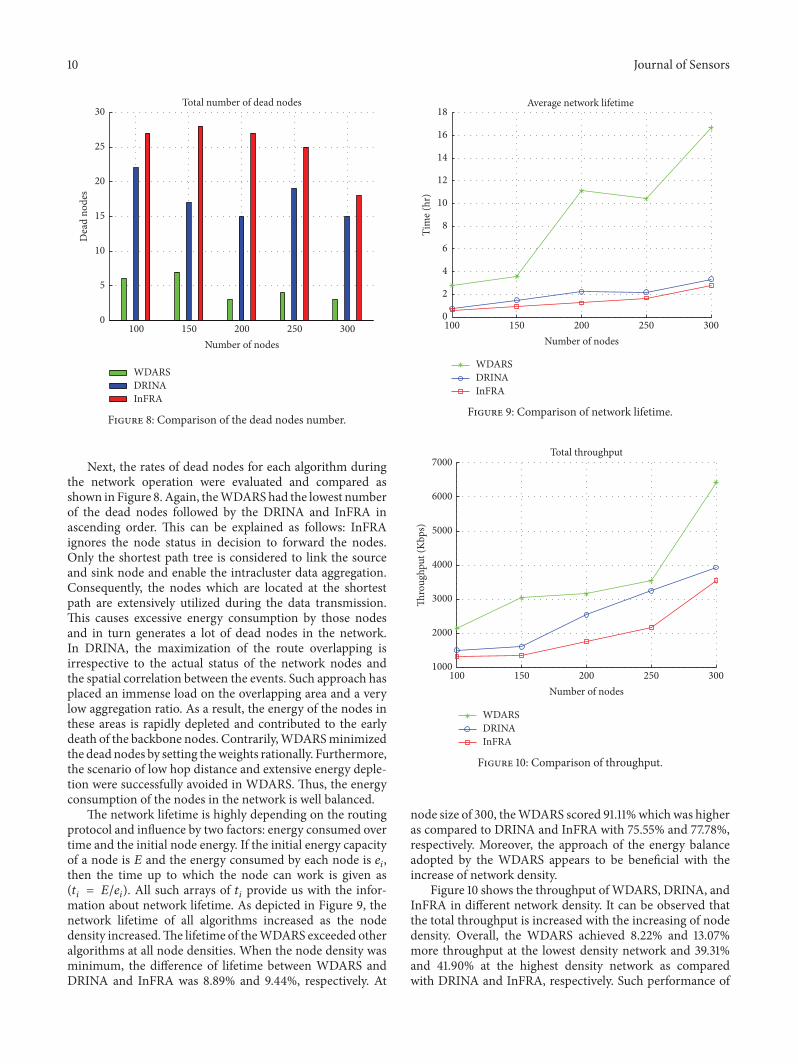

International Journal of
AerospaceEngineeringHindawi Publishing Corporationhttpwwwhindawicom Volume 2014
RoboticsJournal of
Hindawi Publishing Corporationhttpwwwhindawicom Volume 2014
Hindawi Publishing Corporationhttpwwwhindawicom Volume 2014
Active and Passive Electronic Components
Control Scienceand Engineering
Journal of
Hindawi Publishing Corporationhttpwwwhindawicom Volume 2014
International Journal of
RotatingMachinery
Hindawi Publishing Corporationhttpwwwhindawicom Volume 2014
Hindawi Publishing Corporation httpwwwhindawicom
Journal ofEngineeringVolume 2014
Submit your manuscripts athttpwwwhindawicom
VLSI Design
Hindawi Publishing Corporationhttpwwwhindawicom Volume 2014
Hindawi Publishing Corporationhttpwwwhindawicom Volume 2014
Shock and Vibration
Hindawi Publishing Corporationhttpwwwhindawicom Volume 2014
Civil EngineeringAdvances in
Acoustics and VibrationAdvances in
Hindawi Publishing Corporationhttpwwwhindawicom Volume 2014
Hindawi Publishing Corporationhttpwwwhindawicom Volume 2014
Electrical and Computer Engineering
Journal of
Advances inOptoElectronics
Hindawi Publishing Corporation httpwwwhindawicom
Volume 2014
The Scientific World JournalHindawi Publishing Corporation httpwwwhindawicom Volume 2014
SensorsJournal of
Hindawi Publishing Corporationhttpwwwhindawicom Volume 2014
Modelling amp Simulation in EngineeringHindawi Publishing Corporation httpwwwhindawicom Volume 2014
Hindawi Publishing Corporationhttpwwwhindawicom Volume 2014
Chemical EngineeringInternational Journal of Antennas and
Propagation
International Journal of
Hindawi Publishing Corporationhttpwwwhindawicom Volume 2014
Hindawi Publishing Corporationhttpwwwhindawicom Volume 2014
Navigation and Observation
International Journal of
Hindawi Publishing Corporationhttpwwwhindawicom Volume 2014
DistributedSensor Networks
International Journal of