Research Article Surface Water Quality Assessment of Wular...
19
Research Article Surface Water Quality Assessment of Wular Lake, A Ramsar Site in Kashmir Himalaya, Using Discriminant Analysis and WQI Salim Aijaz Bhat and Ashok K. Pandit Aquatic Ecology Laboratory, Centre of Research for Development (CORD), University of Kashmir, Jammu and Kashmir 190006, India Correspondence should be addressed to Salim Aijaz Bhat; [email protected] Received 27 June 2014; Accepted 16 July 2014; Published 31 August 2014 Academic Editor: Winn-Jung Huang Copyright © 2014 S. A. Bhat and A. K. Pandit. is is an open access article distributed under the Creative Commons Attribution License, which permits unrestricted use, distribution, and reproduction in any medium, provided the original work is properly cited. Multivariate techniques, discriminant analysis, and WQI were applied to analyze a water quality data set including 27 parameters at 5 sites of the Lake Wular in Kashmir Himalaya from 2011 to 2013 to investigate spatiotemporal variations and identify potential pollution sources. Spatial and temporal variations in water quality parameters were evaluated through stepwise discriminant analysis (DA). e first spatial discriminant function (DF) accounted for 76.5% of the total spatial variance, and the second DF accounted for 19.1%. e mean values of water temperature, EC, total-N, K, and silicate showed a strong contribution to discriminate the five sampling sites. e mean concentration of NO 2 -N, total-N, and sulphate showed a strong contribution to discriminate the four sampling seasons and accounted for most of the expected seasonal variations. e order of major cations and anions was Ca 2+ > Mg 2+ > Na + > K + and Cl − > SO4 2− > SiO 2 2− respectively. e results of water quality index, employing thirteen core parameters vital for drinking water purposes, showed values of 49.2, 46.5, 47.3, 40.6, and 37.1 for sites I, II, III, IV, and V, respectively. ese index values reflect that the water of lake is in good condition for different purposes but increased values alarm us about future repercussions. 1. Introduction Today surface water is most vulnerable to pollution due to its easy accessibility for disposal of pollutants and wastew- aters. Worldwide surface water quality is governed by com- plex anthropogenic activities and natural processes [1, 2], including weathering, erosion, hydrological features, climate change, precipitation, industrial activities, agricultural land use, sewage discharge, and the human exploitation of water resources [1–6]. During the last decade, widespread deteri- oration in water quality of inland aquatic systems has been reported due to rapid development of industries, agriculture, and urban sprawl [7–9]. e evaluation of water quality in most countries has become a critical issue in recent years, especially due to concerns that freshwater will be a scarce resource in the future [10–13]. e protection of integrity of world water resources have been given topmost priority in the 21st century due to limited supply of fresh water and the role of anthropogenic activities in deteriorating the water quality[14–17]. is however cannot be achieved without a spatiotemporal evaluation of water quality of the aquatic systems of concern [18]. Numerous studies have also identi- fied the pollution sources and potential influences of natural processes and anthropogenic activities on spatiotemporal variations in water quality [19, 20]. In view of the spatial and temporal variations in the hydrochemistry of surface waters, regular monitoring pro- grams are required for reliable estimates of the water quality [12]. Water quality monitoring is a helpful tool not only to evaluate the impacts of pollution sources but also to ensure an efficient management of water resources and the protection of aquatic life [21]. However, the large and complicated data sets of water quality parameters generated by monitoring programs are oſten difficult to interpret latent meaningful information [11, 12, 22, 23] and require data reduction methods to simplify the data structure so as to extract useful and interpretable information [24]. Sequel to this challenge, the application of multivariate statistical and mathematical techniques such as discriminant analysis (DA) and WQI facilitates the interpretation of complex data matrices to Hindawi Publishing Corporation Journal of Ecosystems Volume 2014, Article ID 724728, 18 pages http://dx.doi.org/10.1155/2014/724728
Transcript of Research Article Surface Water Quality Assessment of Wular...

Research ArticleSurface Water Quality Assessment of Wular Lake A Ramsar Sitein Kashmir Himalaya Using Discriminant Analysis and WQI
Salim Aijaz Bhat and Ashok K Pandit
Aquatic Ecology Laboratory Centre of Research for Development (CORD) University of Kashmir Jammu and Kashmir 190006 India
Correspondence should be addressed to Salim Aijaz Bhat salimaijazgmailcom
Received 27 June 2014 Accepted 16 July 2014 Published 31 August 2014
Academic Editor Winn-Jung Huang
Copyright copy 2014 S A Bhat and A K Pandit This is an open access article distributed under the Creative Commons AttributionLicense which permits unrestricted use distribution and reproduction in any medium provided the original work is properlycited
Multivariate techniques discriminant analysis andWQI were applied to analyze a water quality data set including 27 parameters at5 sites of the Lake Wular in Kashmir Himalaya from 2011 to 2013 to investigate spatiotemporal variations and identify potentialpollution sources Spatial and temporal variations in water quality parameters were evaluated through stepwise discriminantanalysis (DA) The first spatial discriminant function (DF) accounted for 765 of the total spatial variance and the second DFaccounted for 191Themean values of water temperature EC total-N K and silicate showed a strong contribution to discriminatethe five sampling sites The mean concentration of NO
2-N total-N and sulphate showed a strong contribution to discriminate the
four sampling seasons and accounted for most of the expected seasonal variations The order of major cations and anions wasCa2+ gt Mg2+ gt Na+ gt K+ and Clminus gt SO42minus gt SiO
2
2minus respectively The results of water quality index employing thirteen coreparameters vital for drinking water purposes showed values of 492 465 473 406 and 371 for sites I II III IV and V respectivelyThese index values reflect that thewater of lake is in good condition for different purposes but increased values alarmus about futurerepercussions
1 Introduction
Today surface water is most vulnerable to pollution due toits easy accessibility for disposal of pollutants and wastew-aters Worldwide surface water quality is governed by com-plex anthropogenic activities and natural processes [1 2]including weathering erosion hydrological features climatechange precipitation industrial activities agricultural landuse sewage discharge and the human exploitation of waterresources [1ndash6] During the last decade widespread deteri-oration in water quality of inland aquatic systems has beenreported due to rapid development of industries agricultureand urban sprawl [7ndash9] The evaluation of water quality inmost countries has become a critical issue in recent yearsespecially due to concerns that freshwater will be a scarceresource in the future [10ndash13] The protection of integrity ofworld water resources have been given topmost priority inthe 21st century due to limited supply of fresh water andthe role of anthropogenic activities in deteriorating the waterquality[14ndash17] This however cannot be achieved without
a spatiotemporal evaluation of water quality of the aquaticsystems of concern [18] Numerous studies have also identi-fied the pollution sources and potential influences of naturalprocesses and anthropogenic activities on spatiotemporalvariations in water quality [19 20]
In view of the spatial and temporal variations in thehydrochemistry of surface waters regular monitoring pro-grams are required for reliable estimates of the water quality[12] Water quality monitoring is a helpful tool not only toevaluate the impacts of pollution sources but also to ensure anefficient management of water resources and the protectionof aquatic life [21] However the large and complicated datasets of water quality parameters generated by monitoringprograms are often difficult to interpret latent meaningfulinformation [11 12 22 23] and require data reductionmethods to simplify the data structure so as to extract usefuland interpretable information [24] Sequel to this challengethe application of multivariate statistical and mathematicaltechniques such as discriminant analysis (DA) and WQIfacilitates the interpretation of complex data matrices to
Hindawi Publishing CorporationJournal of EcosystemsVolume 2014 Article ID 724728 18 pageshttpdxdoiorg1011552014724728
2 Journal of Ecosystems
Table 1 Sampling station locations and their coordinates
Study sites Latitude Longitude Elevation Location Water depth (m)Makhdomyari Site I 34∘-171015840-44210158401015840 74∘-371015840-24210158401015840 1597 Southeastern 1ndash3Vintage Site II 34∘-241015840-08110158401015840 74∘-321015840-39110158401015840 1583 Eastern side 1ndash4Ashtang Site III 34∘-241015840-3810158401015840 74∘-321015840-41710158401015840 1583 Northwestern side 05ndash45Watlab Site IV 34∘-211015840-29410158401015840 74∘-011015840-59210158401015840 1577 Western side 1ndash55Ningle Site V 34∘-171015840-16610158401015840 74∘-301015840-26610158401015840 1574 Northern 05ndash44
better understand the water quality and ecological status ofstudied systems [10 12 23 25ndash28] These statistical methodsalso help with the identification of possible factorssourcesthat influence water systems and offer a valuable tool forthe reliable management of water resources as well as rapidsolutions to pollution problems [10 11 23 25 29 30]
In this study physicochemical parameters of surfacewater quality directly affected by different pollution sourceswere monitored over two-year periodThe data sets obtainedwere subjected to multivariate statistical technique namelydiscriminant analysis (DA) to obtain information about thesimilarities or dissimilarities among the monitoring periodsand sites and to identify water quality variables responsiblefor spatial and temporal water quality variations in surfacewater Besides multivariate statistical analysis water qualityindex (a multifactor mathematical tool) was used to interpretwater quality of studied lake numerically It is regarded asone of the most effective ways to communicate water quality[26 27 31] and is assessed on the basis of calculated waterquality indices [27 32] The index is a numeric expressionused to transform large number of variables data into a singlenumber which represents the water quality level [33ndash35]
During the last decades widespread deterioration inwater quality of Wular lake has been reported due toanthropogenic influences (agricultural practices increasedexploitation of water resource sewage runoff agricultureand urban sprawl) and natural processes (changes in pre-cipitation erosion and weathering of crustal materials)[36 37] Pollutants from anthropogenic activities have beenincreasingly produced and discharged into the Wular Lakeresulting in severe degradation of water quality restrictingthe sustainable development of the local economies Further-more enhanced input of nutrients from both natural as wellas anthropogenic activities has resulted in the eutrophicationof Wular Lake [38 39] In the view of the above-mentionedpollution problems of Lake Wular the present study wascarried out with the objectives of finding pollution sourcesand causes of spatiotemporal variations in water quality
2 Materials and Methodology
21 Materials
211 Study Area The valley of Kashmir lies on the northernfringe of the Indian subcontinent and is lacustrine basin ofthe intermontane depression formed between the lesser andthe greater Himalaya It abounds a vast array of freshwaterbodies streams lakes ponds and rivers famous for its beautyand natural scenery throughout the world These numerous
but varied freshwater ecosystems are of great aestheticcultural socioeconomic and geological value besides playingan important role in the conservation of genetic resources ofboth plants and animals However anthropogenic activitieshave resulted in heavy inflow of nutrients into these lakesfrom the catchment areas [40 41] These anthropogenicinfluences not only deteriorate the water quality but alsoaffect the aquatic life in the lakes as a result of which theprocess of aging of these lakes is hastened [42ndash44] As aconsequence most of the lakes in the Kashmir valley areexhibiting eutrophication [45ndash48]
Geographically the Wular Lake one of the largest wet-lands of Asia is situated at an altitude of 1580m (amsl)between 34∘161015840ndash34∘201015840N latitudes and 74∘331015840-74∘441015840E lon-gitudes (Figure 1) Wular Lake an ox-bow type lake is offluviatile origin located in the north-west of Kashmir about35 km from Srinagar city being formed by the meanderingof River Jhelum which is the main feeding channel besidesother tributaries It plays a significant role in the hydrographyof the Kashmir valley not only by acting as a huge absorptionbasin for floodwaters but also for maintaining flows tosupport agriculture and hydropower generation as well assports activities The lake along with the extensive marshessurrounding is an important habitat for fish accounting for60 of the fish production within the state of Jammu andKashmir [36] The lake is largely shallow with a maximumdepth of 58m the deeper part being on the western sideopposite the hills of Baba Shakur Din The lake is drainedin the northeast by the only single outlet in the form ofRiver Jhelum General features of study stations are shownin Table 1The catchment of the lake is comprised of sloppinghills of the Zanskar ranges of the western Himalaya on thenortheastern and northwestern sideswhich drain their runoffthrough various nallahs where Erin and Madhumati areprominent On the eastern and southern sides are the low-lying areas of Sonawari which used to get inundated almostevery year until numerous criss-crossing embankments wereconstructed along River JhelumThe lake area thus reclaimedhas in the recent past been brought under cultivation of paddyand plantations of willow poplar and fruit trees On thewestern side in the Sopore-Watlab section low-lying areashave also been brought under paddy cultivation In 1986 thelake was designated as wetland of national importance underthe Indian GovernmentsWetlands Programme and in 1990it was enlisted as a wetland of international importance underthe Ramsar Convention of 1975 However a comprehensivestudy regarding the assessment of spatiotemporal hydro-chemistry of the lake is lacking up to date Morphometricfeatures of Wular Lake are presented in Table 2
Journal of Ecosystems 3
India Jammu and Kashmir
74∘20
9984000998400998400E 74
∘25
9984000998400998400E 74
∘30
9984000998400998400E 74
∘35
9984000998400998400E 74
∘40
9984000998400998400E 74
∘45
9984000998400998400E 74
∘50
9984000998400998400E
34∘25
9984000998400998400N
34∘20
9984000998400998400N
34∘15
9984000998400998400N
34∘10
9984000998400998400N
Figure 1 Showing layout of study area and surface water quality monitoring stations in Lake Wular
22 Methodology
221 Sampling and Analysis Surface water samples (05ndash10m) were collected from five sites on monthly basis fromFebruary 2011 to January 2013 On each sampling date threereplicates were collected at each sampling site The watersamples were preserved in prerinsed 1-L polypropylene acid-washed sampling bottles at 4∘C in darkness and analyzedwithin 24 h A saturated mercuric chloride solution was usedat a final concentration of 02mlLminus1 to stop all microbiologi-cal activities in the water samples The parameters includingdepth transparency temperature pH and conductivity were
determined on spot while the rest of the parameters weredetermined in the laboratory The parameters includingorthophosphorus total phosphorus ammoniacal nitrogennitrite nitrogen nitrate nitrogen organic nitrogen (Kjeldahlnitrogen minus ammoniacal nitrogen) alkalinity free CO
2
conductivity chloride total hardness calcium hardnessmagnesium hardness Na K silicate sulphate iron andTDS were determined in the laboratory within 24 hoursof sampling The analysis was done by adopting standardmethods of Mackereth Golterman and Clymo and APHA[49ndash51]
4 Journal of Ecosystems
Table 2 Morphometric features of Lake Wular
Max area 616 Km2
Min area 1224Km2
Average area 31415 Km2
Max volume 371825 times 106 m3
Min volume 187735 times 106 m3
Average volume 267675 times 106 m3
Elevation 1580m (amsl)Maximum length 16 kmMinimum breadth 76 kmShape EllipticalMax depth 58mMinimum depth 09m
222 Statistical Analysis Data for physicochemical param-eters of water samples were presented as mean values andanalyzed using descriptive analysis We used standard devi-ation for describing the spatiotemporal degree of variationsof the observed water quality parameters in Lake Wularin different months and seasons Prior to investigating theseasonal effect on water quality parameters we divided thewhole observation period into four fixed seasons spring(March April and May) summer (June July and August)autumn (September October and November) and winter(December January and February)
223 Discriminant Analysis Stepwise discriminant analy-sis (DA) which is also a multivariate statistical techniquewas used for spatiotemporal analysis of water quality dataDiscriminant analysis (DA) is used to classify cases intocategorical-dependent values usually a dichotomy If dis-criminant analysis is effective for a set of data the classi-fication table of correct and incorrect estimates will yielda high correct percentage In DA multiple quantitativeattributes are used to discriminate between two or morenaturally occurring groups In contrast to CA DA providesstatistical classification of samples and is performed withprior knowledge of membership of objects to a particulargroup or cluster Furthermore DA helps in grouping samplessharing common properties The DA technique builds up adiscriminant function for each group which operates on rawdata [10 12 52] as in the equation below
119891 (119866119894) = 119896119894+
119899
sum
119895 = 1
119908119894119895119901119894119895 (1)
where i is the number of groups (119866) 119896119894is the constant
inherent to each group 119899is the number of parameters used toclassify a set of data into a given group and 119908
119895is the weight
coefficient assigned by DA to a given selected parameters(119901119895)The weight coefficient maximizes the distance between
the means of the criterion (dependent) variable DA wasperformed on each raw data matrix using stepwise modesin constructing discriminant functions to evaluate boththe spatial and temporal variations in water quality of the
lake The sites (spatial) and the seasons (temporal) were thegrouping (dependent) variables whereas all the measuredparameters constituted the independent variables Lineardiscriminant functions were used to describe or elucidate thedifferences between the sampling sites and the influence ofseason on water quality of each sampling site The relativecontribution of all variables to the separation of groups washighlighted [53]
224 Water Quality Index Accurate and timely informationon the quality of water is necessary to shape a sound publicpolicy and to implement the water quality improvementprogrammes efficiently One of the most effective ways tocommunicate information on water quality trends is withindices The WQI is a mathematical instrument used totransform large quantities of water quality data into a singlenumber which summarize different quality parametersThe WQI is an index of water quality for a particular useMathematically the index is an arithmetic weighting ofnormalized water quality measurements The weightingsare different for different water usages [54] The indices arebroadly characterized into two parts the physicochemicalindices and the biological indices The physicochemicalindices are based on the values of various physicochemicalparameters in a water sample while biological indices arederived from the biological information and are calculatedusing the species composition of the sample the diversity ofspecies their distribution pattern the presence or absenceof the indicator species or groups and so forth [55] Hereattempt has been made to calculate the water quality indexof Wular Lake on the basis of Harkins [56] and Lohani [57]and subsequently modified by Tiwari et al [58] based ontwo-year physicochemical data
Quality Rating and Weightage In the formulation of waterquality index the importance of various parameters dependson the intended use of water here water quality parametersare studied from the point of view of suitability for humanconsumption The ldquostandardsrdquo (permissible values of variouspollutants) for the drinking water recommended by theIndianCouncil ofMedical Research [59]United States PublicHealth Services [60]World Health Organization [61] IndianStandards Institution [62] and unit weights are given inTable 5 For the purpose of the present investigation twelvewater quality parameters have been selected
Water quality index is
WQI =sum13
119894 = 1119902119894119908119894
sum13
119894 = 1119882119894
(2)
which gives
WQI =13
sum
119894=1
119902119894119908119894
Since sum119882119894= 1
(3)
where 119902119894(water quality rating) = 100 times (119881
119886minus 119881119894)(119881119904minus 119881119894)
Journal of Ecosystems 5
When 119881119886is the actual value present in the water sample
119881119894is the ideal value (0 for all parameters except pH and DO
which are 70 and 146mg Lminus1 resp) 119881119904is the standard value
Pollutants are (i) completely absent when 119902119894= 0 (ii) with
in prescribed standard values when 0 lt 119902119894lt 100 and (iii)
are above standard values when 119902119894 gt 100The more harmful a given pollutant is the smaller is
its permissible value for drinking water So the ldquoweightsrdquofor various water quality parameters are assumed to beinversely proportional to the recommended standards for thecorresponding parameters that is
119882119894=
119896
119878119899
(4)
where 119882119894is the unit weight for the ith parameter (119894 =
1 2 3 12)119896 is the constant of proportionality which is determined
from the condition and 119896 = 1 for sake of simplicity119878119899is the ldquo119899rdquo number of standard values
Based on the range of WQI values water is grouped intothe following categories [27]
(I) WQI less than 25 water is not polluted and fit forhuman consumption (excellent)
(II) WQI between 26 and 50 slightly polluted (good)(III) WQI between 51 and 75 moderately polluted (poor)(IV) WQI between 76 and 100 polluted (very poor)(V) WQI above 100 excessively polluted and unfit for
human use (unsuitable)
In this study multivariate statistical and mathematicalanalysis methods (DA and WQI approaches) were appliedto evaluate the impact of anthropogenic activities and spa-tiotemporal variations in physicochemical characteristics onwater quality of Wular Lake Statistical conclusions andtests were made on the basis of a multiparametric modelspecifying how water quality parameters are changed withdifferent seasons and nature of polluting source in the studiedaquatic system
3 Results and Discussion
31 Physicochemical Parameters During the two years ofthis study the lake behavior was explored by measuring 27parameters to assess the quality of this aquatic system Allthese parametersweremeasured from samples collected fromstudy stations in the Wular Lake as indicated in Figure 1The mean and standard deviation and range of water qualityparameters of five study sites are presented in Figures 2(a)2(b) 2(c) and 2(d) Box and whisker plots showed the wholespatiotemporal dynamics of physical chemical nutrient andionic parameters of two-year study carried out inWular LakeThe high standard deviation of most parameters indicatespresence of temporal and spatial variations caused likely bypolluting sources andor climatic factors [25] Mean watertemperature was strongly seasonal and ranged from a min-imum of 42∘C in winter to a maximum of 256∘C in summer
The water temperature reflects the atmospheric temperatureand it presents themost significant difference among seasonsThroughout the year mean transparency ranged from 086 to115m The sites nearer to inflows showed lower depth thanthose nearer to outflow The low transparency value in someof the high altitude Kashmir Himalayan water bodies hasbeen attributed to the incoming silt from the catchment [63]Seasonally the highest value of water transparency occurredin winter at all sampling sites and may be attributed to lowsuspended organic matter with poor planktonic growth [64]The highest average TDS content was recorded mainly at thesite I (15411 plusmn 322) located in the proximity of major inflowof the lake Seasonal variation was also observed in TDSwith lower values in dry season (autumn) and higher valuesin rainy season (spring) From the temperature differencechanges are expected in DO As expected dissolved oxygenis negatively related to temperature because the solubility ofoxygen in water decreases with increasing temperature [65]The highest average pH (784 plusmn 034) was recorded at thesite located in the proximity of major tributary Mean pHof water body ranging from 72 to 85 showed a significanttemporal variation pH recorded in the present study was inalkaline range suggesting that the lakes were well bufferedthroughout the study period pH range from 72 to 85indicates productive nature of water body [66] Throughoutthe year EC varied between 100 and 387120583S cmminus1 SeasonallyEC was lower in spring and summer than in autumn andwinter seasons Spring-summer minima were due to nutrientassimilation by autotrophs [67] The lake exhibited highervalue of EC which reflects the high degree of anthropogenicactivities such as waste disposal and agricultural runoffThe distribution of DO among sampling seasons showedmarked temporal variability and its lower value in summer(78 plusmn 019mgLminus1) and higher (101 plusmn 016mgLminus1) in winterseason The inverse relationship between temperature anddissolved oxygen is a natural process because warmer waterbecomes more easily saturated with oxygen and it can holdless dissolved oxygen [23] In winter the highest free CO
2
was recorded at sites III and IV whereas in spring it wasthe highest at site VI Decreased CO
2level in summer
season indicates the consumption of CO2due to high rates
of photosynthesis by autotrophs there by reducing pH [68]Clear seasonal trend was found in hardness at all samplingsites The alkalinity showed fluctuations between stationswith the highest average vales (1004 plusmn 317 and 1043 plusmn331mgLminus1) at sites IV and V In general the highest andthe lowest NO
3-N concentrations occurred in winter and
summer respectively The sites located close to inlets showedhigher NO
3-N concentrations compared to sites near outlet
channel throughout the study periodThe seasonal variationsof nitrate concentration in the lake were similar to thepatterns generally reported in other water bodies wherenitrate levels are higher in winter than in summer due toa decreased biological activity (bacterial denitrification andalgal assimilation) in winter [69] NO
2-N and organic-N
being influenced by temperature maintained higher val-ues in summer and lower in winter season The NH
3-N
concentration showed similar temporal pattern to NO3-N
6 Journal of Ecosystems
0
5
10
15
20
25
30
(i)
0
1
2
3
4
5
6
(ii)
Dep
th (m
)
Mak Vin Ash Wat Nin Spr Sum Aut Win00
05
10
15
20
25
(iii)Study sites and seasons
Study sites and seasonsTr
ansp
aren
cy (m
)
Tem
pera
ture
(∘C)
Study sites and seasonsMak Vin Ash Wat Nin Spr Sum Aut Win Mak Vin Ash Wat Nin Spr Sum Aut Win
(a)
65
70
75
80
85
90
(i)
pH
0
100
200
300
400
500
(iii)
6
7
8
9
10
11
12
(iii)
Diss
olve
d ox
ygen
Mak Vin Ash Wat Nin Spr Sum Aut WinStudy sites and seasons
0
5
10
15
20
(iv)
Mak Vin Ash Wat Nin Spr Sum Aut WinStudy sites and seasons
Mak Vin Ash Wat Nin Spr Sum Aut WinStudy sites and seasons
Con
duct
ivity
(
Mak Vin Ash Wat Nin Spr Sum Aut WinStudy sites and seasons
Free
CO
2120583
S cm
minus1 )
(mg L
minus1 )
(mg L
minus1 )
(b) Continued
Figure 2 Continued
Journal of Ecosystems 7
Mak Vin Ash Wat Nin Spr Sum Aut Win0
50
100
150
200
250
(v)Study sites and seasons
50
100
150
200
250
(vi)
20
40
60
80
100
(vii)
0
10
20
30
40
(viii)
Alk
alin
ity
Mak Vin Ash Wat Nin Spr Sum Aut WinStudy sites and seasons
Tota
l har
dnes
s
Mak Vin Ash Wat Nin Spr Sum Aut WinStudy sites and seasons
Calci
um h
ardn
ess
Mak Vin Ash Wat Nin Spr Sum Aut WinStudy sites and seasons
Mag
nesiu
m h
ardn
ess
0
50
100
150
200
250
(ix)
TDS
Mak Vin Ash Wat Nin Spr Sum Aut WinStudy sites and seasons
(b)
Mak Vin Ash Wat Nin Spr Sum Aut Win00
02
04
06
08
10
(xiii)Study sites and seasons
000
002
004
006
008
010
(xiv)
NO
3-N
conc
NO
2-N
conc
Mak Vin Ash Wat Nin Spr Sum Aut WinStudy sites and seasons
(mg L
minus1 )
(mg L
minus1 )
(mg L
minus1 )
(mg L
minus1 )
(mg L
minus1 )
(mg L
minus1 )
(mg L
minus1 )
(c) Continued
Figure 2 Continued
8 Journal of Ecosystems
00
01
02
03
04
(xv)
000
025
050
075
100
125
(xvi)
050
075
100
125
150
175
(xvii)
001
002
003
004
005
006
(xviii)
00
01
02
03
04
05
(xix)
Mak Vin Ash Wat Nin Spr Sum Aut WinStudy sites and seasons
NH
4-N
conc
Mak Vin Ash Wat Nin Spr Sum Aut WinStudy sites and seasons
Mak Vin Ash Wat Nin Spr Sum Aut WinStudy sites and seasons
Study sites and seasons
Tota
l-N co
nc
Mak Vin Ash Wat Nin Spr Sum Aut WinStudy sites and seasons
Ort
ho-P
conc
Mak Vin Ash Wat Nin Spr Sum Aut Win
(c)
Tota
l-P co
nc
Org
anic
-N co
nc
Mak Vin Ash Wat Nin Spr Sum Aut Win0
5
10
15
20
25
30
(i)Study sites and seasons
10
15
20
25
30
35
40
(ii)
Cl co
nc
Mak Vin Ash Wat Nin Spr Sum Aut WinStudy sites and seasons
Ca co
nten
t
(mg L
minus1 )
(mg L
minus1 )
(mg L
minus1 )
(mg L
minus1 )
(mg L
minus1 )
(mg L
minus1 )
(mg L
minus1 )
(d) Continued
Figure 2 Continued
Journal of Ecosystems 9
0
5
10
15
20
25
(iii)
5
10
15
20
25
(iv)
1
2
3
4
5
6
(v)
0
5
10
15
20
(vi)
00
25
50
75
100
125
(vii)
020
025
030
035
040
045
(viii)
Mak Vin Ash Wat Nin Spr Sum Aut WinStudy sites and seasons
Mg
cont
ent
Mak Vin Ash Wat Nin Spr Sum Aut WinStudy sites and seasons
Silic
ate
Mak Vin Ash Wat Nin Spr Sum Aut WinStudy sites and seasons
K co
nten
t
Mak Vin Ash Wat Nin Spr Sum Aut WinStudy sites and seasons
Na c
onte
nt
Mak Vin Ash Wat Nin Spr Sum Aut WinStudy sites and seasons
Mak Vin Ash Wat Nin Spr Sum Aut WinStudy sites and seasons
Sulp
hate
Fe
(d)
(mg L
minus1 )
(mg L
minus1 )
(mg L
minus1 )
(mg L
minus1 )
(mg L
minus1 )
(mg L
minus1 )
Figure 2 (a) Box and whisker plots showing spatiotemporal dynamics of physical parameters (b) Box and whisker plots showingspatiotemporal dynamics of chemical parameters (c) Box and whisker plots showing spatiotemporal dynamics of nutrient (N and P)parameters (d) Box and whisker plots showing spatiotemporal dynamics of ionic parameters
concentration with high values in spring and winter andlow values in summer and autumn Nitrate may originatefrom livestock wastes fertilizers and nonpoint sources ofpollution such as runoff from agriculture areas [70] Thesites located close to rural residential area showed highermean total-N concentration mainly in summer season Ithas been reported that N fertilizer applied to farmland isthe main source of N pollution in surface water [71 72]The distribution of ortho-P showed significant variation withaverage higher values (004 plusmn 0002) in winter contraryto average lower values (002 plusmn 0001) in summer seasonOrtho-P enters the lakes through domestic wastewater and
agricultural runoff accounting for the accelerated eutrophi-cation [73] The sites influenced by agriculture and domesticsewage (sites I II and III) showed high TP concentrationsduring all the year with relatively high values in springand summer and low values in autumn and winter It hasbeen documented by [74] thatmunicipal wastewater containssubstantial amount of phosphorus contributed by humanurine and detergents Increased concentration of phosphorusand NO
3-N in lakes has resulted in enhanced productivity
elevating oxygen demand in turn [46 75] However besidesits contribution to eutrophication and toxic algal bloomsphosphate does not have notable adverse health effects [61]
10 Journal of Ecosystems
The highest value of chloride content (197plusmn085mgLminus1) wasreported in winter season at all sampling sites Chloride con-centrationwas higher inwinter season due to poor dilution ofwastewater because sodium chloride a common componentof the human diet passes unchanged through the digestivesystem [61] Cations maintained higher concentration inwinter season and in contrast to those of anions whichshowed lower concentration in winter season Spatially andtemporally Ca and Mg content was the highest at site IVand in winter season respectively Ca and Mg rich water inKashmir valley is attributed to the predominance of lime richrocks in the catchment area [76] Throughout the year thelowest content of Na and K occurred at site V with concen-trations ranging from 56 to 133 and from 14 to 32mg Lminus1respectively Domestic sewage is the responsible factor forhigher content of sodium and potassium in freshwaters [77]Silicate maintained continuous decreasing trend from springto winter season with maximum average values at site I (853plusmn 374mg Lminus1) throughout the study period Silicate exportsfrom land-based resources especially during rainfall [78]Sulphate distribution showed similar spatial trend to silicatewith high values at site I (609 plusmn 267mgLminus1) and low valuesat other stations The high sulphate content found in water isprobably a consequence of the morphology of soils irrigatedby the river which are formed mainly by limestone marland gypsum [25] Seasonally the higher concentration of ironwas reported in winter season against the lower values insummer at all of the study sites The water-quality data (3240observations) was further subjected to different multivariatestatistical techniques to explore their temporal and spatialtrends
32 Discriminant Analysis Discriminant analysis is one ofthe more advanced multivariate classification techniquesused to define the variables discriminating between the iden-tified clusters by specifying the weight (ie discriminatingpower) to these variables [79 80]
Spatial variations in water parameters were evaluatedthrough stepwise discriminant analysis (DA) method Fourdiscriminant functions (DFs) were found to discriminatethe quality of the five sampling sites used in this study(Table 3) Wilks Lambda test showed that all five functionswere statistically significant (119875 lt 005) Furthermore 956of the total variance between the five sampling sites wasaccounted for by the first two DFs The first DF accountedfor 765 of the total spatial variance and the secondDF accounted for 191 The relative contribution of eachparameter is given in Table 3 The mean values of watertemperature EC total-N K and silicate showed a strongcontribution in discriminating the five sampling sites andaccounted for most of the expected spatial variations in thelake while other parameters exhibited a low contribution tothe discriminant function The second group of parameters(DF2) that accounted for the remaining spatial variations wasmean concentration of organic-N and Na (Table 3)
From the canonical discriminant plot (Figure 3) thesampling stations close to major tributaries (I and II) showedhigh positive loadings for factors represented by the first dis-criminant function (DF1) indicating that these study points
were highly characterized by elevated levels of EC K andsilicate The spatial discriminating function showed varyingnature of water quality factors (EC TN K Org-N Na etc)at different study sites and is due to dynamic nature of naturaland anthropogenic influences active in lake catchment Thesites located away from inflow that is IV and V depictednegative associations with these factors indicating that thesesites were characterized by minimal levels of these chemicalcontaminants On the other hand the site IV showed highpositive loadings for the factors represented by the seconddiscriminant function (DF2) indicating that the site was char-acterized by elevated levels of organic-N and Na compared tosites I and II The higher loading values of EC Na K andorganic-N indicate the impact of enhanced organic matterload imported via domestic wastewater [23]The higher valueof EC at some study stations is attributed to the high degreeof anthropogenic activities such as waste disposal and agri-cultural runoff Further positive loading of Na+ is attributedto agricultural runoff [81] while asserted variations of K arelinked with parent rock materials present in the catchmentarea [76]
Temporal DA was performed on synthesized data afterdividing the whole data set into four seasonal groups(spring summer autumn and winter) Three discriminantfunctions (DFs) were found to discriminate the quality ofthe three sampling seasons used in this study (Table 4)Wilks Lambda test showed that all three functions werestatistically significant (119875 lt 005) Furthermore 948 ofthe total variance between the four sampling seasons wasaccounted for by the first two DFs The first DF accountedfor 855 of the total temporal variance and the secondDF accounted for 88 The relative contribution of eachparameter is given in Table 4 The mean concentration ofNO2-N total-N and sulphate showed a strong contribution
in discriminating the four sampling seasons and accountedfor most of the expected seasonal variations in the lakewhile other parameters exhibited a low contribution tothe discriminant function The second group of parameters(DF2) that accounted for the remaining spatial variations wasmean concentration of NH
4-N and TDS (Table 4) Table 4
presents the standardized function coefficients which high-light the parameters that exhibited the highest change acrossseasons
Discriminant plot for temporal variations (Figure 4)showed that the spring season and summer season werestrongly characterized by increased NO
2-N total-N and
sulphate while NH4-N and TDS had respective strong pos-
itive and negative associations with the autumn season andwinter season The average concentrations of NO
2-N total-
N and sulphate were higher in summer and spring comparedto autumn and winter This may be due to tributary inputsand surface runoff which carry more nutrients into thelake during the rainy season (spring and summer) Depthincreases with higher runoff which in turn brings higherload of nitrate from this agriculture dominated watershed inspring and summer seasons Nitrate is more associated withthe use of organic and inorganic fertilizers [82 83] Positiveloading on total-N has been associated with agriculturalrunoff [84]
Journal of Ecosystems 11
Table3Disc
riminantfun
ctioncoeffi
cientsandWilk
sLam
bdafor
spatialvariatio
nsin
water
parameterso
fLakeW
ular
Standardized
cano
nicald
iscrim
inantfun
ctioncoeffi
cients
Eigenvalues
Wilk
sLam
bda
Function
WT
Depth
Trans
EC
TAlkalinity
CaHArd
NO2-N
OrgN
Total-N
Na+
K+
Silicate
Sulphate
TDS
Eigenvalue
Variance
Cumulative
CanonicalCorrelation
WilksrsquoLambda
Chi-square
df
Sig
110
6minus201
031
094
020
012
078
029minus12
2087
107
122
089
064
2082
7650
765
098
000
6356
560
02minus087
186
010
050
063
053
052
098minus027
084
100
051
018minus038
519
1910
956
092
007
2980
390
03minus074
059
047
045minus003
025
040
048
029minus057
028minus222
204
067
950
350
991
070
041
982
240
04minus086minus046minus068
031
045
065
084
015minus017minus025minus011
028
089minus049
259
090
1000
045
080
251
110
000
9
12 Journal of Ecosystems
Table4Disc
riminantfun
ctioncoeffi
cientsandWilk
sLam
bdafor
tempo
ralvariatio
nsin
water
parameterso
fLakeW
ular
Standardized
cano
nicald
iscrim
inantfun
ctioncoeffi
cients
Eigenvalues
Wilk
sLam
bda
Functio
nNO
2-N
NH
4-N
Total-N
Total-P
TDS
Sulphate
Eigenvalue
of
Varia
nce
Cumulative
Cano
nicalC
orrelation
Wilk
srsquoLambd
aCh
i-squ
are
dfSig
1217minus16
3251minus18
8009
228
9422
8590
8590
100
01590
3818
02
140
154minus090minus076minus116
075
969
880
9480
095
0014
77028
100
3064
188minus116minus015minus009
102
576
520
10000
092
0148
34384
40
Journal of Ecosystems 13
Table5Drin
king
water
standardsun
itweights
averagew
ater
qualityand
water
quality
indexof
fives
tudy
statio
nsin
Lake
Wular
Chem
icalparameters
Standards
Recommending
agency
Unitw
eight(wi)
Makhd
oomyari
Vintage
Ashtang
Watlab
Ningle
AvWq
WiQ
iAv
Wq
WiQ
iAv
Wq
WiQ
iAv
Wq
WiQ
iAv
Wq
WiQ
ipH
70ndash85
ICMR
0037
784
419
776
380
780
397
775
373
777
387
Electricalcond
uctiv
ity750120583
Scm
WHO
000
02529
001
2542
001
2554
001
2823
001
2485
001
Chlorid
e250m
gL
ISI
0001
1235
001
1334
001
1433
001
1411
001
1285
001
Diss
olvedoxygen
50m
gL
WHO
0052
903
304
893
310
893
310
894
309
912
299
Free
CO2
22mgL
WHO
0012
989
054
1002
054
1000
054
1004
054
1043
057
Totalalkalinity
120m
gL
USP
HS
0002
1127
021
1070
019
9954
018
1145
021
1020
019
Totalh
ardn
ess
500m
gL
WHO
0001
1455
002
1439
002
1422
001
1617
002
1282
001
Nitrate-N
45mgL
WHO
000
6047
001
048
001
048
001
046
001
042
001
Calcium
75mgL
ICMR
0003
2116
010
2088
010
2061
010
2605
012
1985
009
Magnesiu
m50
mgL
ICMR
000
91350
039
1366
024
1323
023
1409
025
1147
020
Sulfate
200m
gL
ICMR
0001
610
000
550
000
503
000
477
000
390
000
Iron
03m
gL
ISI
0874
014
407
013
385
013
391
011
326
010
291
Totald
issolvedsolid
s500m
gL
WHO
0001
1541
002
1469
002
1333
001
1068
001
7708
001
sum119882119894
100
sum119882119894119876119894
492sum119882119894119876119894
465sum119882119894119876119894
473sum119882119894119876119894
406sum119882119894119876119894
371
14 Journal of Ecosystems
Function 1
1050minus5minus10
Func
tion2
10
5
0
minus5
minus10
5
4
3
2
1
Group centroid5-Ningle4-Watlab
3-Ashtang2-Vintage1-Makhdoomyari
Sample station
Figure 3 Discriminant plot showing spatial variation of waterparameters in Lake Wular (2012ndash2003)
33 Water Quality Index Evaluation of overall water qualityis not an easy task particularly when different criteria fordifferent uses are applied Moreover the classification ofwater quality follows various definitions with respect to thecontents of different water quality parameters Dozens ofvariables have been developed and are available to be usedin management governmental or environmental programsbut the high price because of water analysis to attend theseprograms generally makes it difficult to use them In thisstudy the application of the water quality index approach tothe Lake Wular has the objective of providing a simple andvalid method for expressing the results of several parametersin order to more rapidly and conveniently assess the waterquality Combining different parameters into one singlenumber leads to an easy interpretation of the index thusproviding an important tool for management purposes Asdescribed WQI employing thirteen parameters can give anindication of the health of the water body at various pointsand can be used to keep track of and analyze changes overtime but other options can be used in an economic way
The values of water quality indices are taken as thestandards for drinking water according to Table 5 Theresults of water quality index employing thirteen parametersshowed values of 492 465 473 406 and 371 for sites I IIIII IV and V respectively The status of water correspondingto the WQI is categorized into five types which is given inTable 5 From the table it is evident that the surface watersamples of studied lake are falling under good categoryHowever the quality of samples collected from the lakeis high in case of stations located near to lake tributaries
Function 1
15
10
5
0
minus5
minus10
minus15
Func
tion2
151050minus5minus10minus15
4
3
2
1
Group centroid4-Autumn
3-Summer2-Spring1-Winter
Seasons
Figure 4 Discriminant plot showing temporal variation of waterparameters in Lake Wular (2012-2013)
indicating high pollution In these cases highWQI is mainlydue to the presence of high concentration of Iron and otherparameters WQI analysis showed that the water of lake is ingood condition for drinking purpose but increased valueswarn us about future consequences
Ionic Composition The order of major cations and anionswas Ca2+ gt Mg2+ gt Na+ gt K+ and Clminus gt SO42minus gtSiO2
2minus respectively This pattern also shows that the lakewater is dominated by alkaline earth Ca and Mg (Ca2+ andMg2+) and weak acids Dominance of Ca and Mg ions inlake water is linked primarily with parent rock materialpresent in the catchment area [85] It is also apparent thatthe dominance of Clminus over SO42minus could be due to the largeamount of domestic and sewage water being dischargedinto tributary waters [86] The primary source of majorions in the river and lake waters is atmospheric depositiondissolution of evaporates (halite gypsum) and weathering ofcarbonates and silicates by sulphuric acid or carbonic acidand anthropogenic activities Ca Mg and HCO
3are derived
fromweathering of carbonates rocks by carbonic acid [87 88]as the carbonate rocks weather congruently Magnesium isoften associated with calcium in all kinds of waters but itsconcentration remains generally lower than the calcium [89]Water hardness contains dissolvedmetals likeMg originatedfrom agricultural and domestic sewage seen in high levelstherefore revealing instances of soil weathering erosion (sea-sonal effect) and anthropogenic sources of pollution in thisarea Magnesium is essential for chlorophyll growth and actsas a limiting factor for the growth of phytoplankton [90] Like
Journal of Ecosystems 15
the ldquostandardrdquo freshwater in which calcium is the dominatingcation [91] the ionic composition of the water in WularLake was also dominated by calcium followed bymagnesiumThe chemical denudation due to dilution from heavy rainscoupled with the reservoir circulation and weathering fromrock and runoffs from surrounding watersheds might havecontributed to the availability of calcium and magnesiumions Ca and Mg concentration of freshwater bodies ofKashmir Himalaya has been associated with thick populationof plankton especially Cyanophyceae [92] The presence ofcalcium and magnesium ions in moderate levels classifiesthe reservoir as eutrophic which will support diverse plantand animal life including fish According to [93] waters withcalcium levels of lt 10mgLminus1 are usually oligotrophic whilethose above 25mg Lminus1 are eutrophic
4 Conclusion
In this study statistical and mathematical exploratory tech-niques were utilized to evaluate variations in surface waterquality of Lake Wular This study has shown that the highestsources of variation in water quality are both seasonal factorsas well as anthropogenic factors The results exhibit that theDA technique is useful in present accredited classification ofsurface waters in the whole lake basin hence the number ofsampling sites and respective cost in the future monitoringplans can be lessen The water quality index provided anumeric expression used to transform large number ofvariables data into a single number which represented thewater quality level of wholeWular Lake basinThus the studyillustrates the useful application of chemometric techniquesfor the analysis and interpretation of lake water quality dataand identification based on pollution status and identificationof pollution sources as part of the efforts towards man-agement of sustainability of this lake The main sources ofpollution came from domestic wastewater and agriculturalactivities and runoff however they contributed differentlyto each station in regard to pollution levels These resultsprovide fundamental information for developing better waterpollution control strategies for the Wular Lake
Conflict of Interests
The authors declare that there is no conflict of interestsregarding the publication of this paper
Acknowledgments
The authors are indebted to Director Centre of Research forDevelopment (CORD) and Head Department of Environ-mental Science University of Kashmir for providing full sup-port and necessary laboratory facilities for carrying out thechemical analysis Also the authors gratefully acknowledgethe help from the State Irrigation and Flood Control andIndian Meteorological Department for providing necessarydata
References
[1] H P Jarvie B A Whitton and C Neal ldquoNitrogen andphosphorus in east coast British rivers speciation sources andbiological significancerdquo Science of the Total Environment vol210-211 pp 79ndash109 1998
[2] S Ravichandran ldquoHydrological influences on the water qualitytrends in Tamiraparani basin South Indiardquo EnvironmentalMonitoring and Assessment vol 87 no 3 pp 293ndash309 2003
[3] A H Mahvi J Nouri A A Babaei and R Nabizadeh ldquoAgri-cultural activities impact on groundwater nitrate pollutionrdquoInternational Journal of Environmental Science and Technologyvol 2 no 1 pp 41ndash47 2005
[4] S Liao H Gau W Lai J Chen and C Lee ldquoIdentificationof pollution of Tapeng Lagoon from neighbouring rivers usingmultivariate statistical methodrdquo Journal of Environmental Man-agement vol 88 no 2 pp 286ndash292 2008
[5] N Gantidis M Pervolarakis and K Fytianos ldquoAssessment ofthe quality characteristics of two lakes (Koronia and Volvi) ofN Greecerdquo Environmental Monitoring and Assessment vol 125no 1ndash3 pp 175ndash181 2007
[6] M B Arain T G Kazi M K Jamali N Jalbani H I AfridiandA Shah ldquoTotal dissolved and bioavailable elements inwaterand sediment samples and their accumulation in Oreochromismossambicus of polluted Manchar Lakerdquo Chemosphere vol 70no 10 pp 1845ndash1856 2008
[7] A A Olajire and F E Imeokparia ldquoWater quality assessmentof Osun river Studies on inorganic nutrientsrdquo EnvironmentalMonitoring and Assessment vol 69 no 1 pp 17ndash28 2001
[8] J C Vie C Hilton-Taylor and S N Stuart Eds Wildlife ina Changing WorldmdashAn Analysis of the 2008 IUCN Red List ofThreatened Species IUCN Gland Switzerland 2009
[9] K E Murray S M Thomas and A A Bodour ldquoPrioritizingresearch for trace pollutants and emerging contaminants in thefreshwater environmentrdquo Environmental Pollution vol 158 no12 pp 3462ndash3471 2010
[10] W D Alberto D M Del Pilar A M Valeria P S FabianaH A Cecilia and B M De Los Angeles ldquoPattern recognitiontechniques for the evaluation of spatial and temporal variationsin water quality A case study Suquıa River Basin (Cordoba-Argentina)rdquoWater Research vol 35 pp 2881ndash2894 2001
[11] V Simeonov J A Stratis C Samara et al ldquoAssessment of thesurface water quality in Northern GreecerdquoWater Research vol37 no 17 pp 4119ndash4124 2003
[12] K P Singh A Malik D Mohan and S Sinha ldquoMultivariatestatistical techniques for the evaluation of spatial and temporalvariations in water quality of Gomti River (India) a case studyrdquoWater Research vol 38 no 18 pp 3980ndash3992 2004
[13] A Qadir R N Malik and S Z Husain ldquoSpatio-temporalvariations in water quality of Nullah Aik-tributary of the riverChenab Pakistanrdquo Environmental Monitoring and Assessmentvol 140 no 1ndash3 pp 43ndash59 2008
[14] J R Chinhanga ldquoImpact of industrial effluent from an ironand steel company on the physico-chemical quality of KwekweRiver water in Zimbabwerdquo International Journal of EngineeringScience and Technology vol 2 no 7 pp 29ndash40 2010
[15] United States Environmental Protection Agency Re-cent Rec-ommended Water Quality Criteria United States Environ-mental Protection Agency 2007 httpwwwepagovwater-sciencecriteriawqcriteriahtml
16 Journal of Ecosystems
[16] S Wei Y Wang J C W Lam et al ldquoHistorical trends oforganic pollutants in sediment cores fromHong KongrdquoMarinePollution Bulletin vol 57 no 6-12 pp 758ndash766 2008
[17] S A Bhat G Meraj S Yaseen and A K Pandit ldquoStatisticalassessment of water quality parameters for pollution sourceidentification in Sukhnag stream an inflow stream of LakeWular (Ramsar site) KashmirHimalayardquo Journal of Ecosystemsvol 2014 Article ID 898054 18 pages 2014
[18] K N Don-Pedro E O Oyewo and A A Otitoloju ldquoTrend ofheavymetal concentration in Lagos Lagoon ecosystemNigeriaWest Africardquo Journal of Applied Ecology vol 5 pp 103ndash1142004
[19] L A Pillsbury and R H Byrne ldquoSpatial and temporal chemicalvariability in theHillsboroughRiver systemrdquoMarineChemistryvol 104 no 1-2 pp 4ndash16 2007
[20] P R Kannel S Lee and Y Lee ldquoAssessment of spatial-temporalpatterns of surface and ground water qualities and factorsinfluencing management strategy of groundwater system inan urban river corridor of Nepalrdquo Journal of EnvironmentalManagement vol 86 no 4 pp 595ndash604 2008
[21] R O Strobl and P D Robillard ldquoNetwork design for waterquality monitoring of surface freshwaters a reviewrdquo Journal ofEnvironmental Management vol 87 no 4 pp 639ndash648 2008
[22] P K S Shin and K Y S Fong ldquoMultiple discriminant analysisof marine sediment datardquoMarine Pollution Bulletin vol 39 no1ndash12 pp 285ndash294 1999
[23] S Shrestha and F Kazama ldquoAssessment of surface water qualityusing multivariate statistical techniques a case study of the Fujiriver basin Japanrdquo Environmental Modelling and Software vol22 no 4 pp 464ndash475 2007
[24] D Chapman Water Quality Assessment UNESCO WHO andUNEPChapman and Hall London UK 1992
[25] M Vega R Pardo E Barrado and L Deban ldquoAssessment ofseasonal and polluting effects on the quality of river water byexploratory data analysisrdquo Water Research vol 32 no 12 pp3581ndash3592 1998
[26] S K Pradhan D Patnaik and S P Rout ldquoWater quality indexfor the ground water around a phosphatic fertilizer plantrdquoIndian Journal of Environmental Protection vol 21 no 4 pp355ndash358 2001
[27] D K Sinha S Saxena and R Saxena ldquoWater quality index forRam Ganga river water at Moradabadrdquo Pollution Research vol23 no 3 pp 527ndash531 2004
[28] M Wu Y Wang C Sun et al ldquoIdentification of coastal waterquality by statistical analysis methods in Daya Bay South ChinaSeardquoMarine Pollution Bulletin vol 60 no 6 pp 852ndash860 2010
[29] R Reghunath T R S Murthy and B R Raghavan ldquoThe utilityof multivariate statistical techniques in hydrogeochemical stud-ies An example fromKarnataka IndiardquoWater Research vol 36no 10 pp 2437ndash2442 2002
[30] S A Bhat G Meraj S Yaseen A R Bhat and A K PanditldquoAssessing the impact of anthropogenic activities on spatiotem-poral variation of water quality in Anchar lake KashmirHi-malayasrdquo International Journal of Environmental Sciences vol3 no 5 pp 1625ndash1640 2013
[31] K Kannan Fundamentals of Environmental Pollution S Chandand Company Limited New Delhi India 1991
[32] A P Singh and S K Ghosh ldquoWater quality index for riverYamunardquo Pollution Research vol 18 no 4 pp 435ndash439 1999
[33] W W Miller H M Joung C N Mahannah and J R GarrettldquoIdentification of water quality differences in Nevada through
index applicationrdquo Journal of Environmental Quality vol 15 no3 pp 265ndash272 1986
[34] A A Bordalo R Teixeira and W J Wiebe ldquoA water qualityindex applied to an international shared river basin the case oftheDouro Riverrdquo EnvironmentalManagement vol 38 no 6 pp910ndash920 2006
[35] E SanchezM F Colmenarejo J Vicente et al ldquoUse of thewaterquality index and dissolved oxygen deficit as simple indicatorsof watersheds pollutionrdquo Ecological Indicators vol 7 no 2 pp315ndash328 2007
[36] K Rumysa A A Sharique Z Tariq M Farooq A Bilal andK Pinky ldquoPhysico chemical status of Wular Lake in KashmirrdquoJournal of Chemistry Biology and Physics Science vol 31 pp631ndash636 2012
[37] J A SheikhG Jeelani R S Gavali andRA Shah ldquoWeatheringand anthropogenic influences on the water and sedimentchemistry of Wular Lake Kashmir Himalayardquo EnvironmentalEarth Sciences vol 71 no 6 pp 2837ndash2846 2014
[38] M R D Kundangar S G Sarwar and J Husssain ldquoZoo-plankton population and nutrient dynamics of wetlands ofWular lake Kashmir Indiardquo in Environment and Biodiversityin the Context of South Asia P K Jha G P S Ghimire SB Karmacharya S A Baral and P Lacoul Eds pp 128ndash134Ecological Society (ECOS) Kathmandu Nepal 1996
[39] J A Shah and A K Pandit ldquolsquoPhysico-chemical characteristicsof water in Wular Lakersquo A Ramsar Site in Kashmir HimalayardquoInternational Journal of Geology Earth and EnvironmentalSciences vol 2 no 2 pp 257ndash265 2012
[40] S A Romshoo N Ali and I Rashid ldquoGeoinformatics for char-acterizing and understanding the spatio-temporal dynamics(1969 to 2008) of Hokersar Wetland in Kashmir HimalayasrdquoInternational Journal of Physical Sciences vol 6 no 5 pp 1026ndash1038 2011
[41] S A Romshoo and I Rashid ldquoAssessing the impacts ofchanging land cover and climate onHokersar wetland in IndianHimalayasrdquoArabian Journal of Geosciences vol 7 no 1 pp 143ndash160 2014
[42] E O Odada D O Olago K Kulindwa M Ntiba andS Wandiga ldquoMitigation of environmental problems in LakeVictoria East Africa causal chain and policy options analysesrdquoAmbio vol 33 no 1-2 pp 13ndash23 2004
[43] R Li M Dong Y Zhao L Zhang Q Cui and W He ldquoAssess-ment of water quality and identification of pollution sourcesof plateau lakes in Yunnan (China)rdquo Journal of EnvironmentalQuality vol 36 no 1 pp 291ndash297 2007
[44] G Karakoc F Unlu Erkoc and H Katircioglu ldquoWater qualityand impacts of pollution sources for Eymir and Mogan Lakes(Turkey)rdquo Environment International vol 29 no 1 pp 21ndash272003
[45] V Kaul ldquoWater characteristics of some fresh water bodies ofKashmirrdquo Current Trends in Life Sciences vol 9 pp 221ndash2461979
[46] A K Pandit and A R Yousuf ldquoTrophic status of KashmirHimalayan lakes as depicted by water chemistryrdquo Journal ofResearch and Development vol 2 pp 1ndash12 2002
[47] M A Khan ldquoChemical environment and nutrient fluxes ina flood plain wetland ecosystem Kashmir Himalayas IndiardquoIndian Forester vol 134 no 4 pp 505ndash514 2008
[48] F A Khan and A A Ansari ldquoEutrophication an ecologicalvisionrdquo Botanical Review vol 71 no 4 pp 449ndash482 2005
Journal of Ecosystems 17
[49] F J H Mackereth Some Methods for Water Analysis forLimnologists vol 21 Freshwater Biological Association SciencePublication London UK 1963
[50] H L Golterman and R S Clymo ldquoMethods for physical andchemical analysis of freshwatersrdquo in IBP Hand Book No 8Blackwell Scientific Publications Oxford UK 1969
[51] American Public Health Association (APHA) StandardMethods for Examination of Water and Waste Water AmericanPublicHealthAssociationWashington DCUSA 20th edition1998
[52] R A Johnson and D W Wichern Applied Multivariate Sta-tistical Analysis Prentice Hall Englewood Cliffs NJ USA 3rdedition 1992
[53] A C Rencher Method of Multivariate Analysis John Wiley ampSons 2nd edition 2002
[54] S F Pesce and D AWunderlin ldquoUse of water quality indices toverify the impact of Cordoba City (Argentina) on Suquia RiverrdquoWater Research vol 34 no 11 pp 2915ndash2926 2000
[55] R K Trivedy and P K Goel Chemcial and Biological MethodsforWater Pollution Studies Environmental Publications KaradIndia 1984
[56] R D Harkins ldquoAn objective water quality indexrdquo Journal of theWater Pollution Control Federation vol 46 no 3 1974
[57] B N Lohani ldquoWater quality indicesrdquo in Water Pollution andManagement Reviews C K Varshney Ed pp 53ndash69 SouthAsian Publications New Delhi India 1981
[58] T N Tiwari S C Das and P K Bose ldquoWater quality indexfor the river Jhelum in Kashmir and its seasonal variationrdquoPollution Research vol 5 no 1 pp 1ndash5 1986
[59] Indian Council of Medical Research Manual of Standards ofQuality of Drinking Water Supplied Special Report Series no44 Indian Council of Medical Research New Delhi India 2ndedition 1975
[60] United States Public Health Service Public Health ServiceDrinking Water Standards Publication No 956 U S Depart-ment of Health Education and Welfare Public Health ServicesWashington DC USA 1962
[61] WorldHealthOrganizationGuidelines to DrinkingWater Qual-ity vol 1 World Health Organization Geneva Switzerland 3rdedition 2008
[62] ISI Indian Standard Specification for Drinking Water 1983[63] S Bamforth ldquoEcological studies on the planktonic protozoa of
a small artificial pondrdquo Limnology of Oceanography vol 3 pp398ndash412 1958
[64] M P Sinha R Kumar R Srivastava S K Mishra and AK Choudhuri ldquoEcotaxonomy and biomonitoring of lake forconservation and management Biotic Profilerdquo in Ecology andConservation of Lakes Reservoirs and Rivers A Kumar Ed vol2 pp 248ndash289 ABD Publication Jaipur India 2002
[65] V R Solanki M M Hussain and S S Raja ldquoWater qualityassessment of Lake Pandu Bodhan Andhra Pradesh StateIndiardquo Environmental Monitoring and Assessment vol 163 no1ndash4 pp 411ndash419 2010
[66] R K Garg R J Rao D Uchchariya G Shukla and D NSaksena ldquoSeasonal variations in water quality andmajor threatsto Ramsagar reservoir Indiardquo African Journal of EnvironmentalScience and Technology vol 4 no 2 pp 61ndash76 2010
[67] Q Lu Z L He D A Graetz P J Stoffella and X YangldquoPhytoremediation to remove nutrients and improve eutrophicstormwaters using water lettuce (Pistia stratiotes L)rdquo Environ-mental Science and Pollution Research vol 17 no 1 pp 84ndash962010
[68] LM Bini SMThomaz and P Carvalho ldquoLimnological effectsof Egeria najas Planchon (Hydrocharitaceae) in the arms ofItaipu Reservoir (Brazil Paraguay)rdquo Limnology vol 11 no 1 pp39ndash47 2010
[69] D D Ratnayaka M J Brandt and K M Johnson Water Sup-ply Butterworth-Heinemann Boston Mass USA 6th edition2009
[70] M E Kotti A G Vlessidis N C Thanasoulias and N PEvmiridis ldquoAssessment of river water quality in NorthwesternGreecerdquoWater Resources Management vol 19 no 1 pp 77ndash942005
[71] W Yan C Yin and S Zhang ldquoNutrient budgets and bio-geochemistry in an experimental agricultural watershed inSoutheastern Chinardquo Biogeochemistry vol 45 no 1 pp 1ndash191999
[72] Y B Si S Q Wang and H M Chen ldquoWater eutrophyicationand losses of nitrogen and phosphrus in farmlandrdquo Soils vol32 pp 188ndash193 2000 (Chinese)
[73] A Vyas D DMishra A Bajapai S Dixit andN Verma ldquoEnvi-ronment impact of idol immersion activity lakes of BhopalIndiardquo Asian Journal of Experimental Science vol 20 no 2 pp289ndash296 2006
[74] P Ekholm and K Krogerus ldquoBioavailability of phosphorus inpurified municipal wastewatersrdquoWater Research vol 32 no 2pp 343ndash351 1998
[75] S Mc Eldowney D J Hardman and SWaite Pollution Ecologyand Biotreatment Longman Essex UK 1993
[76] M A Khan M A Shah S S Mir and S Bashir ldquoTheenvironmental status of a Kashmir Himalayan wetland gamereserve Aquatic plant communities and eco-restoration mea-suresrdquo Lakes and Reservoirs Research and Management vol 9no 2 pp 125ndash132 2004
[77] S A Bhat S A Rather and A K Pandit ldquoImpact of effluentfrom Sheri-Kashmir Institute of Medical Sciences (SKIMS)Soura on Anchar Lakerdquo Journal of Research and Developmentvol 1 pp 30ndash37 2001
[78] Z H Zhu ldquoPhosphorates and silicaterdquo in Researches on Ecosys-tem of Daya Bay J P Pan Ed pp 25ndash29 ChinaMeteorologicalPress Beijing China 1999
[79] A Astel M Biziuk A Przyjazny and J Namiesnik ldquoChemo-metrics in monitoring spatial and temporal variations in drink-ing water qualityrdquoWater Research vol 40 no 8 pp 1706ndash17162006
[80] F Zhou Y Liu and H Guo ldquoApplication of multivariate statis-tical methods to water quality assessment of the watercoursesin Northwestern New Territories Hong Kongrdquo EnvironmentalMonitoring and Assessment vol 132 no 1ndash3 pp 1ndash13 2007
[81] NMMattikalli andK S Richards ldquoEstimation of surfacewaterquality changes in response to land use change Applicationof the export coefficient model using remote sensing andgeographical information systemrdquo Journal of EnvironmentalManagement vol 48 no 3 pp 263ndash282 1996
[82] H Juahir S M Zain M K Yusoff et al ldquoSpatial water qualityassessment of Langat River Basin (Malaysia) using environ-metric techniquesrdquo Environmental Monitoring and Assessmentvol 173 no 1ndash4 pp 625ndash641 2011
[83] P Basnyat L D Teeter B G Lockaby and K M Flynn ldquoTheuse of remote sensing and GIS in watershed level analysesof non-point source pollution problemsrdquo Forest Ecology andManagement vol 128 no 1-2 pp 65ndash73 2000
18 Journal of Ecosystems
[84] D G Uzarski T M Burton M J Cooper J W Ingram and ST A Timmermans ldquoFish habitat use within and across wetlandclasses in coastal wetlands of the five Great Lakes Developmentof a fish-based index of biotic integrityrdquo Journal of Great LakesResearch vol 31 no 1 pp 171ndash187 2005
[85] M A Khan and M A Shah ldquoHydrology and sediment loadingofHokersarwetland sanctuary in theKashmirHimalaya IndiardquoThe Indian Forester vol 130 pp 899ndash910 2004
[86] C A Biney ldquoA review of some characteristics of freshwater andcoastal ecosystems in Ghanardquo Hydrobiologia vol 208 no 1-2pp 45ndash53 1990
[87] R F Stallard and J M Edmond ldquoGeochemistry of the Amazon2The influence of geology and weathering environment on thedissolved loadrdquo Journal of Geophysical Research vol 88 no 14pp 9671ndash9688 1983
[88] G J Chakrapani ldquoWater and sediment geochemistry of majorKumaun Himalayan lakes Indiardquo Environmental Geology vol43 no 1-2 pp 99ndash107 2002
[89] R Venkatasubramani and T Meenambal ldquoStudy on subsurfacewater quality in Mettupalayam taluk of Coimbatore districtTamilNadurdquoNature Environment and Pollution Technology vol6 no 2 pp 307ndash310 2007
[90] A Dagaonkar and D N Saksena ldquoPhysico-chemical andbiological characterization of a temple tank Kailasagar GwaliorMadhya Pradeshrdquo Journal Hydrobiology vol 8 no 1 pp 11ndash191992
[91] H L Golterman and F A Kouwe ldquoChemical budgets andnutrients pathwaysrdquo in The functioning of ecosystems E DLecren and R H LoweMcConnel Eds vol 22 of InternationalBiological Program pp 85ndash140 London UK 1980
[92] S A Bhat and A K Pandit ldquoPhytoplankton dynamics inAnchar Lake Kashmirrdquo Journal of Research and Developmentvol 3 pp 71ndash96 2003
[93] G Campbell and S Wildberger The Monitorrsquos Handbook aReference Guide for Natural Water 2005
Submit your manuscripts athttpwwwhindawicom
Forestry ResearchInternational Journal of
Hindawi Publishing Corporationhttpwwwhindawicom Volume 2014
Environmental and Public Health
Journal of
Hindawi Publishing Corporationhttpwwwhindawicom Volume 2014
Hindawi Publishing Corporationhttpwwwhindawicom Volume 2014
EcosystemsJournal of
Hindawi Publishing Corporationhttpwwwhindawicom Volume 2014
MeteorologyAdvances in
EcologyInternational Journal of
Hindawi Publishing Corporationhttpwwwhindawicom Volume 2014
Marine BiologyJournal of
Hindawi Publishing Corporationhttpwwwhindawicom Volume 2014
Hindawi Publishing Corporationhttpwwwhindawicom
Applied ampEnvironmentalSoil Science
Volume 2014
Advances in
Hindawi Publishing Corporationhttpwwwhindawicom Volume 2014
Environmental Chemistry
Atmospheric SciencesInternational Journal of
Hindawi Publishing Corporationhttpwwwhindawicom Volume 2014
Hindawi Publishing Corporationhttpwwwhindawicom Volume 2014
Waste ManagementJournal of
Hindawi Publishing Corporation httpwwwhindawicom Volume 2014
International Journal of
Geophysics
Hindawi Publishing Corporationhttpwwwhindawicom Volume 2014
Geological ResearchJournal of
EarthquakesJournal of
Hindawi Publishing Corporationhttpwwwhindawicom Volume 2014
BiodiversityInternational Journal of
Hindawi Publishing Corporationhttpwwwhindawicom Volume 2014
ScientificaHindawi Publishing Corporationhttpwwwhindawicom Volume 2014
OceanographyInternational Journal of
Hindawi Publishing Corporationhttpwwwhindawicom Volume 2014
The Scientific World JournalHindawi Publishing Corporation httpwwwhindawicom Volume 2014
Journal of Computational Environmental SciencesHindawi Publishing Corporationhttpwwwhindawicom Volume 2014
Hindawi Publishing Corporationhttpwwwhindawicom Volume 2014
ClimatologyJournal of
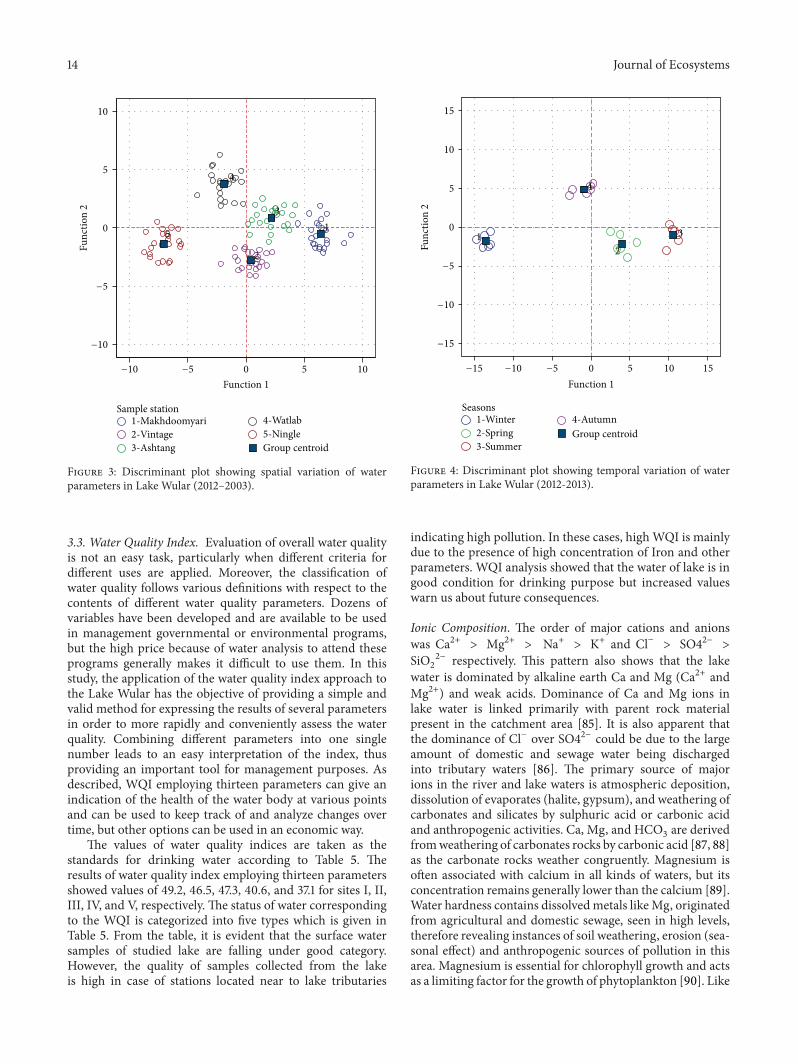
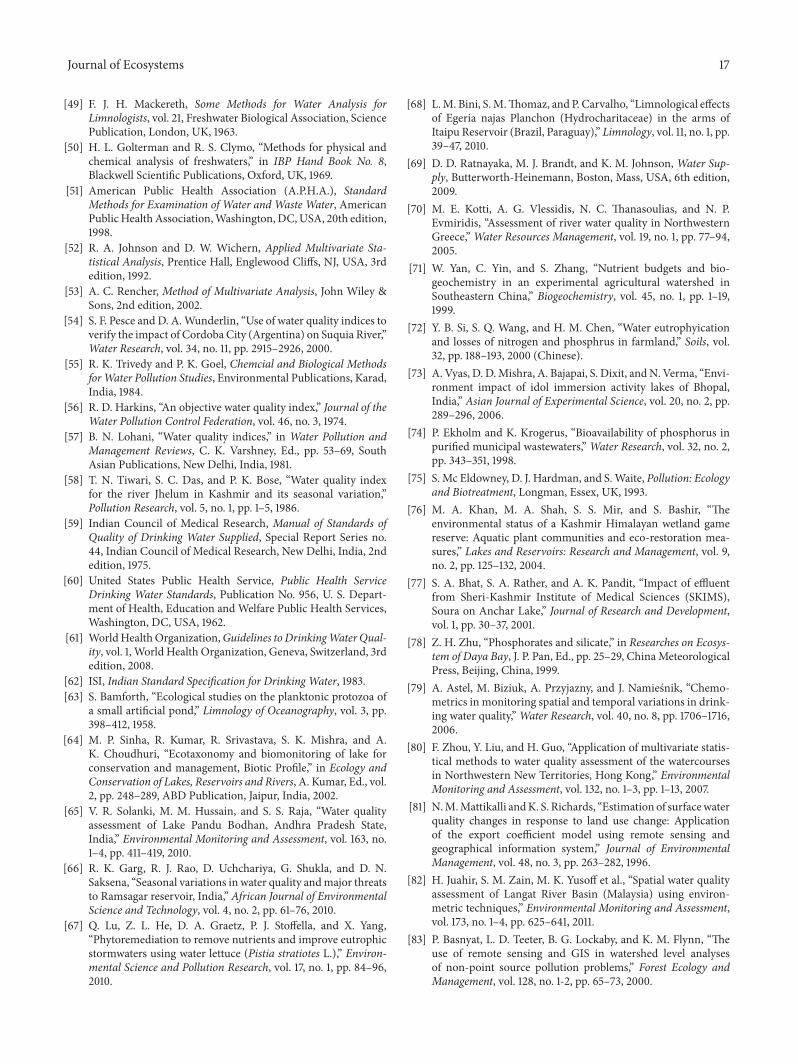