Research Article Significance of a Biomarkers ... · Significance of a Biomarkers . ......
11
Central Annals of Clinical Pathology Cite this article: Luderer LA, Lustosa SAS, Silva SEM, Denadai MVA, Afonso Jr RJ, et al. (2015) Significance of a Biomarkers Immunohistochemistry Panel for Survival Prognostic in Patients with Sporadic Colorectal Cancer. Ann Clin Pathol 3(2): 1050. *Corresponding author Luderer LA , Inter disciplinary Surgical Science Postgraduate Program, UNIFESP-EPM, São Pauloand, Rua Profa Clélia, nº 46 – CEP 27260-500 – Vila Santa Cecília – Volta Redonda- Rio de Janeiro – Tel: 55 243343 4089; Email: Submitted: 03 December 2014 Accepted: 05 May2015 Published: 07 May 2015 ISSN: 2373-9282 Copyright © 2015 Luderer et al. OPEN ACCESS Keywords • Colorectal adenocarcinoma • Biomarkers panel • Tumor markers • VEGF • p53 • Ki67 • EGFR and Bcl-2 Research Article Significance of a Biomarkers Immunohistochemistry Panel for Survival Prognostic in Patients with Sporadic Colorectal Cancer Luderer LA 1 *, Lustosa SAS 2 , Silva SEM 3 , Denadai MVA 4 , Afonso Jr RJ 5 , Viana LS 5 and Matos D 6 1 Inter disciplinary Surgical Science Postgraduate Program, UNIFESP-EPM, São Pauloand, UNIFOA Pathology Department, Brazil 2 Inter disciplinary Surgical Science Postgraduate Program, UNIFESP-EPM, Brazil 3 Departmento f Pathology, FPio XII Barretos Cancer Hospital, São Paulo, Brazil 4 Department of Surgery, FPio XII Barretos Cancer Hospital, Brazil 5 Department of Oncology, Barretos Cancer Hospital, Brazil 6 Department of Surgery, UNIFESP-Escola Paulista de Medicina, Brazil Abstract Objective: to evaluate the prognostic power of survival of a biomarkers panel formed by p53, VEGF, Bcl-2, Ki-67, and EGFR in subjects with sporadic colorectal adenocarcinoma subjected to radical surgical treatment. Methods: 114 post-surgical subjects with colorectal adenocarcinoma were studied and followed for 3 to 5 years at FundaçãoPio XII – Hospital de Câncer de Barretos. The study was conducted in paraffin-embedded tumor tissue whose slides were stained using the hematoxylin-eosin technique. The tissue microarray slides, as well as the immunohistochemical staining, were examined by two pathologists, blinded to the evaluations. The statistical analyses were conducted using mean, median, minimum, maximum, and number of valid observations for the descriptive analysis of the numeric variable, global survival. The comparison of the expression of EGFR, VEGF, Ki-67, p53, and Bcl-2 biomarkers was conducted through the Chi-square test or, when required, Fisher’s exact test. The Cox regression model was used for global survival analysis with a panel of markers and for uni and multivariate global survival analyses. Results: Isolated expression correlation results of the markers with the variables: age, differentiation degree, venous invasion, perineural invasion, TNM (I+II) x (III+IV), and survival showed statistically significant differences in the EGFR expression with venous invasion, TNM classification, and global survival; the expression of the VEGF marker has showed significant correlation with the perineural invasion; the Ki-67 marker, with age, venous invasion, and TNM; expression of p53 was significantly related with age, venous invasion, TNM, and global survival; the Bcl-2 marker did not show significant correlation with any of the variables analyzed. The survival analysis, using the markers panel, has significantly showed lesser time of survival in surgical species with 60% or more over-expression. Conclusion: over expression of the selected tumor markers panel is related with lesser time of survival in those suffering from sporadic colorectal adenocarcinoma submitted to radical surgical treatment. INTRODUCTION The prognosis of surgically-treated colorectal adenocarcinoma depends on the histopathological staging of each patient’s tumor. Identifying, in these patients, biological markers who se expression maybe related to the staging and clinical prognostic parameters is an important priority in health care. Therefore, the expression of a set of these molecular markers, previously demonstrated as critical factors alone, both in the generation of tumors and in their evolution, would be important in findinga prognosis faster. This strategy contemplates the complexity of the biology of the colorectal cancer because it involves the actions of the various routes of carcinogenesis, and may well be associated with clinical parameters for diagnosis, staging, and prognosis. The careful selection of these biomarkers and how to approach the data for statistical analysis are essential, as they can more consistently allow for the association with the progression of colorectal cancer, from its early to its advanced stage. The VEGF protein is a vascular endothelial growth factor, stimulating the formation of larger number of vessels and facilitating the oxygenation of tumor cells, tumor invasion, and Meta stasesin vessels [1-3]. The p53 protein has apoptosis-
Transcript of Research Article Significance of a Biomarkers ... · Significance of a Biomarkers . ......

Central Annals of Clinical Pathology
Cite this article: Luderer LA, Lustosa SAS, Silva SEM, Denadai MVA, Afonso Jr RJ, et al. (2015) Significance of a Biomarkers Immunohistochemistry Panel for Survival Prognostic in Patients with Sporadic Colorectal Cancer. Ann Clin Pathol 3(2): 1050.
*Corresponding authorLuderer LA , Inter disciplinary Surgical Science Postgraduate Program, UNIFESP-EPM, São Pauloand, Rua Profa Clélia, nº 46 – CEP 27260-500 – Vila Santa Cecília – Volta Redonda- Rio de Janeiro – Tel: 55 243343 4089; Email:
Submitted: 03 December 2014
Accepted: 05 May2015
Published: 07 May 2015
ISSN: 2373-9282
Copyright© 2015 Luderer et al.
OPEN ACCESS
Keywords•Colorectal adenocarcinoma•Biomarkers panel•Tumor markers•VEGF•p53•Ki67•EGFR and Bcl-2
Research Article
Significance of a Biomarkers Immunohistochemistry Panel for Survival Prognostic in Patients with Sporadic Colorectal CancerLuderer LA1*, Lustosa SAS2, Silva SEM3, Denadai MVA4, Afonso Jr RJ5, Viana LS5 and Matos D6
1Inter disciplinary Surgical Science Postgraduate Program, UNIFESP-EPM, São Pauloand, UNIFOA Pathology Department, Brazil2Inter disciplinary Surgical Science Postgraduate Program, UNIFESP-EPM, Brazil 3Departmento f Pathology, FPio XII Barretos Cancer Hospital, São Paulo, Brazil4Department of Surgery, FPio XII Barretos Cancer Hospital, Brazil5Department of Oncology, Barretos Cancer Hospital, Brazil6Department of Surgery, UNIFESP-Escola Paulista de Medicina, Brazil
Abstract
Objective: to evaluate the prognostic power of survival of a biomarkers panel formed by p53, VEGF, Bcl-2, Ki-67, and EGFR in subjects with sporadic colorectal adenocarcinoma subjected to radical surgical treatment.
Methods: 114 post-surgical subjects with colorectal adenocarcinoma were studied and followed for 3 to 5 years at FundaçãoPio XII – Hospital de Câncer de Barretos. The study was conducted in paraffin-embedded tumor tissue whose slides were stained using the hematoxylin-eosin technique. The tissue microarray slides, as well as the immunohistochemical staining, were examined by two pathologists, blinded to the evaluations. The statistical analyses were conducted using mean, median, minimum, maximum, and number of valid observations for the descriptive analysis of the numeric variable, global survival. The comparison of the expression of EGFR, VEGF, Ki-67, p53, and Bcl-2 biomarkers was conducted through the Chi-square test or, when required, Fisher’s exact test. The Cox regression model was used for global survival analysis with a panel of markers and for uni and multivariate global survival analyses.
Results: Isolated expression correlation results of the markers with the variables: age, differentiation degree, venous invasion, perineural invasion, TNM (I+II) x (III+IV), and survival showed statistically significant differences in the EGFR expression with venous invasion, TNM classification, and global survival; the expression of the VEGF marker has showed significant correlation with the perineural invasion; the Ki-67 marker, with age, venous invasion, and TNM; expression of p53 was significantly related with age, venous invasion, TNM, and global survival; the Bcl-2 marker did not show significant correlation with any of the variables analyzed. The survival analysis, using the markers panel, has significantly showed lesser time of survival in surgical species with 60% or more over-expression.
Conclusion: over expression of the selected tumor markers panel is related with lesser time of survival in those suffering from sporadic colorectal adenocarcinoma submitted to radical surgical treatment.
INTRODUCTIONThe prognosis of surgically-treated colorectal adenocarcinoma
depends on the histopathological staging of each patient’s tumor. Identifying, in these patients, biological markers who se expression maybe related to the staging and clinical prognostic parameters is an important priority in health care. Therefore, the expression of a set of these molecular markers, previously demonstrated as critical factors alone, both in the generation of tumors and in their evolution, would be important in findinga prognosis faster. This strategy contemplates the complexity of the biology of the colorectal cancer because it involves the actions of
the various routes of carcinogenesis, and may well be associated with clinical parameters for diagnosis, staging, and prognosis.
The careful selection of these biomarkers and how to approach the data for statistical analysis are essential, as they can more consistently allow for the association with the progression of colorectal cancer, from its early to its advanced stage.
The VEGF protein is a vascular endothelial growth factor, stimulating the formation of larger number of vessels and facilitating the oxygenation of tumor cells, tumor invasion, and Meta stasesin vessels [1-3]. The p53 protein has apoptosis-

Central
Luderer et al. (2015)Email:
Ann Clin Pathol 3(2): 1050 (2015) 2/11
inducing and tumor cell aging characteristics, suppressing its growth and preventing the development of premalignant lesions to malignant tumors [4]. The mutant form of p53 has oncogenic characteristics and it’s over expression correlates with poor prognosis for colorectal cancer [5]. The tumor marker Bcl-2 still creates some controversy, but most authors consider it as an inhibitor of apoptosis stimulating the proliferation of tumor cell and the increase in its expression correlates with poor prognosis in colorectal cancer [6,5]. The Ki67 protein is associated with cell proliferation and some authors found higher expression in cases of metastases [7]. Ghitaetal [5] reported in 2012 an increase of this protein in cases of trans-mural invasion of the colorectal adenocarcinoma. The tumor marker EGFR is a frequent glycoprotein in nuclei of cells with high proliferative capacity. When more intensely present in the nuclei of tumor cells it is related with increases in tumor aggressiveness and more modest response to chemotherapeutic agents [8].
LyallMS [9] has investigated in 2006 the immunohistochemical expression of 23 tumor markers in colorectal adenocarcinoma. Using unsupervised hierarchical two-dimensional analysis these authors identified three groups of patients with different profiles of markers, observing significant differences in survival between the groups; the multivariate analysis showed that the complete profile of markers was independently the most important prognostic factor.
They concluded that this study identified a panel of markers in colorectal cancer that independently indicates the prognosis for this type of cancer.
SatoshiI [10] used in 2006 a combination of three carcinogenesis tumor biomarkers for purposes of differential diagnosis between primary and metastatic colorectal adenocarcinoma and primary lung cancer. These authors concluded that the method of analysis in the form of a panel consisting of beta-catenin, CK7, and CK20 is useful for discriminating between lung metastases from colorectal cancer and primary lung tumor, accurately enabling this differential diagnosis. In a practical application scenario, we were able to identify patients for a rational therapeutic strategy, including the most appropriate therapeutic agents and therapeutic management.
The immunohistochemical expression of genes and proteins in the form of a panel is also used as an indicator of therapeutic response to the use of EGFR-TK inhibitors in patients with pulmonary metastases due to colorectal adenocarcinoma. This study, presented in 2009 by Muraca PJ [11], and already patented in the US, has allowed us not only to identify patients responsive to this form of treatment, but also to investigate other therapeutic regimens for those who fail to show satisfactory therapeutic response.
In 2013, Zeestraten ECM [12] in an extensive review of the literature on the prognostic importance of the use of tumor biomarkers by the immunohistochemistry method, published results concerning the apoptosis pathway in colorectal cancer. The authors emphasize that statistical methods based on hierarchical clusters must be employed. Regarding the apoptosis pathway, the main focus of this study, they stress that this review of 26 biomarkers of apoptosis in colorectal cancer alone showed that none of the immunohistochemical studies provided sufficient scientific evidence to implement the use of a single marker in the clinical practice.
In 2013, MuracaPJ [13] filed for a patent for a panel of tumor biomarkers related to the therapeutic efficacy of irinotecan in post operative patients with colorectal cancer, based on the immune staining profile of genes and proteins. Based on the pre-operative immunohistochemical analysis of the tumor tissue, as tissue micro array of a genetic and proteinic panel, together with clinical data and analysis with a differential expression algorithm.
MATERIALS AND METHODSThe sample consisted of 114 patients diagnosed with
colorectal adenocarcinoma treated at FundaçãoPioXII –Hospital de Cancer de Barretos, SP and followed up for3-5years. The gender, age group, and malignancy site are identified in (Table1).
In the present study, patients who underwent radical surgical resection, without radio and /or chemotherapy and with injuries not associated with inflammatory bowel disease or with hereditary transmission characteristics were included.
The slides were stained with hematoxylin-eosin and immunohistochemical examination was performed with streptavidin-biotin-peroxidase using the following antibodies: anti-p53 cloneDO-7; anti-Bcl-2 clone124; antiVEGFcloneVG1; antiKi67cloneMIB-1; anti-EGFR clone EGFR-25, the one from Novocastra and previous ones from the Dakobrand, were analyzed by two experienced pathologists without prior knowledge of the cases.
The assessment of the histological type outcome was based on the histology of colorectal glandular tumors, taking into consideration the adenocarcinoma not otherwise specified (NOS), with predominance of glands that form tubular structures and the mucinous, in which the glandular structures present themselves in the middle of mucus lakes. The differentiation degree was classified into four types, also according to WHO [14]. Regarding the TNM classification, the AJCC classification [15] was used and the TMAs (microarray) of biological samples, in paraffin, and the immunohistochemistry were performed in the Pathological Anatomy lab of Hospital ACCamargo, in São Paulo.
In the reading of the slides an optical microscope Nikon Eclipse E 200 was used. The TMAs were scanned at a lower magnification (40X) and confirmed at higher magnifications (200xand400x). The standardized assessment for all markers was based on the “Quick score” Q=PxI [16] where P is the percentage of diffusely and evenly positive epithelial cells and I is the color intensity;
Gender n(%)Male 63 (55.3) Female 51 (44.7)Agen(%)from 24 to 83 years of age, average 54 years old< 60 years 56 (49.1)> = 60 years 58 (50.9)Cecum 14 (12.3) Siten (%) Right colon 17 (14.9) Transverse colon 10 (8.8) Left colon 6 (5.3) Sigmoid 35 (30.6)Rectum 32 (28.1)
Table 1: Sample Characteristics.
Central
Luderer et al. (2015)Email:
Ann Clin Pathol 3(2): 1050 (2015) 3/11
therefore the analysis was so performed: Multiplying the values of P and I we get the score. The expression was considered weakly positive (1) in cases with score of 0-5, and strongly positive (2) with score of six or more [17].
The statistical analysis comparing the expression of markers (not and over expression) regarding the variables: age, gender, differentiation degree, venous invasion, perineural invasion, TNM, and mortality was performed using the chi-square test or, when necessary the Fisher’s exact test. The analysis of overall survival of isolated markers or as panel was performed using the Cox regression model.
Following the test of various panels with the five markers in terms of survival, those selected included those of up to two over expressed markers (<40%), three over expressed markers (60%), and four or more over expressed markers (80% or more).
RESULTSThe results of the correlation of the Knot or over expressed
markers EGFR, VEGF, Ki-67, p53, and Bcl-2 with the variables: age, gender, differentiation degree, venous invasion, perineural invasion, TNMS (I+II) x (III +IV), and survival, are presented below.
EGFR
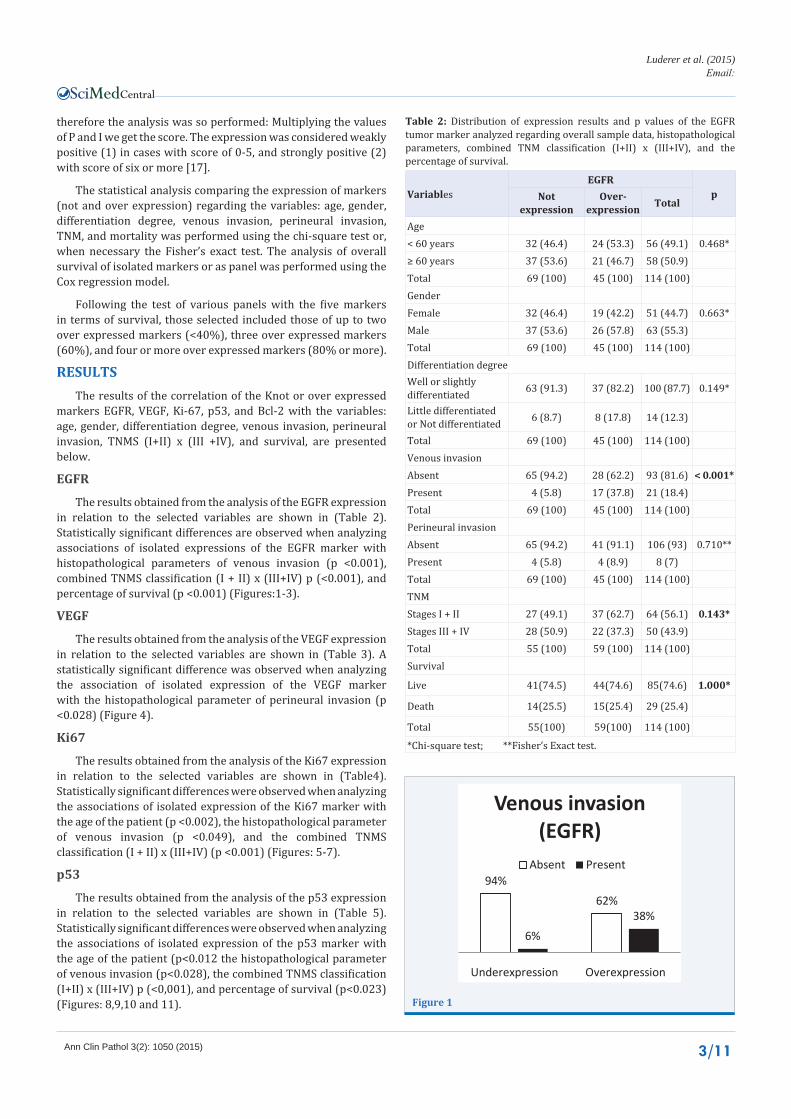
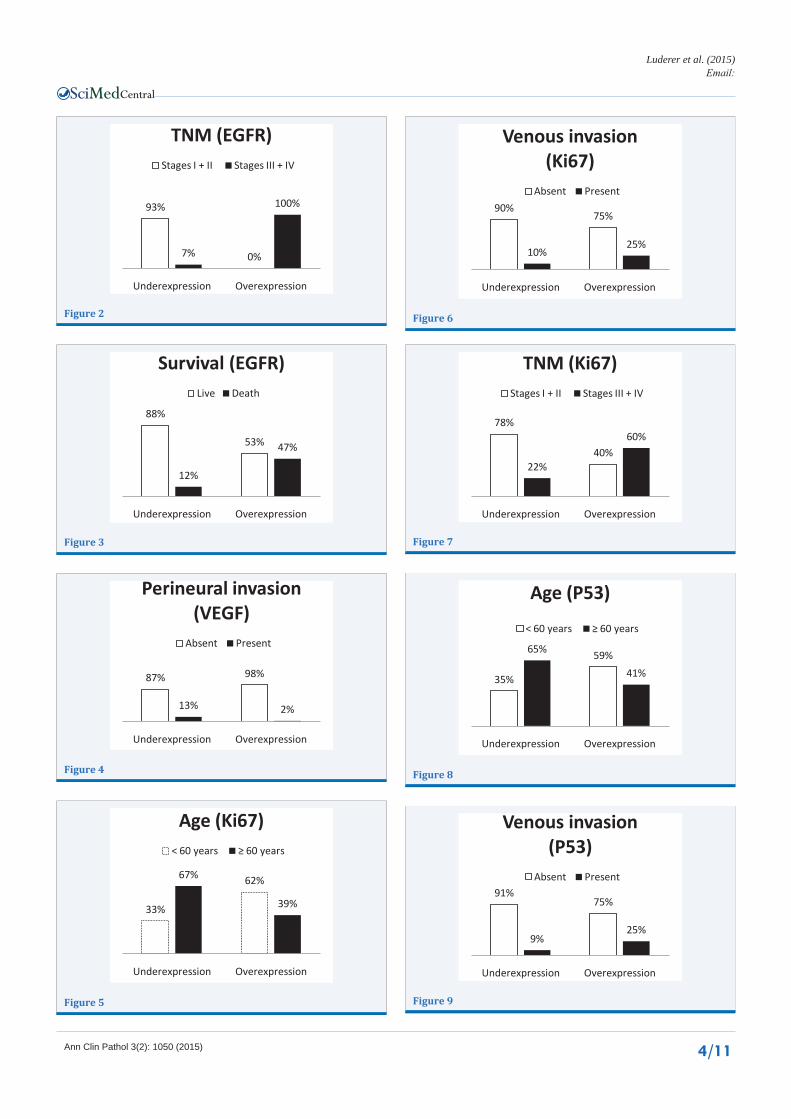
The results obtained from the analysis of the EGFR expression in relation to the selected variables are shown in (Table 2). Statistically significant differences are observed when analyzing associations of isolated expressions of the EGFR marker with histopathological parameters of venous invasion (p <0.001), combined TNMS classification (I + II) x (III+IV) p (<0.001), and percentage of survival (p <0.001) (Figures:1-3).
VEGF
The results obtained from the analysis of the VEGF expression in relation to the selected variables are shown in (Table 3). A statistically significant difference was observed when analyzing the association of isolated expression of the VEGF marker with the histopathological parameter of perineural invasion (p <0.028) (Figure 4).
Ki67
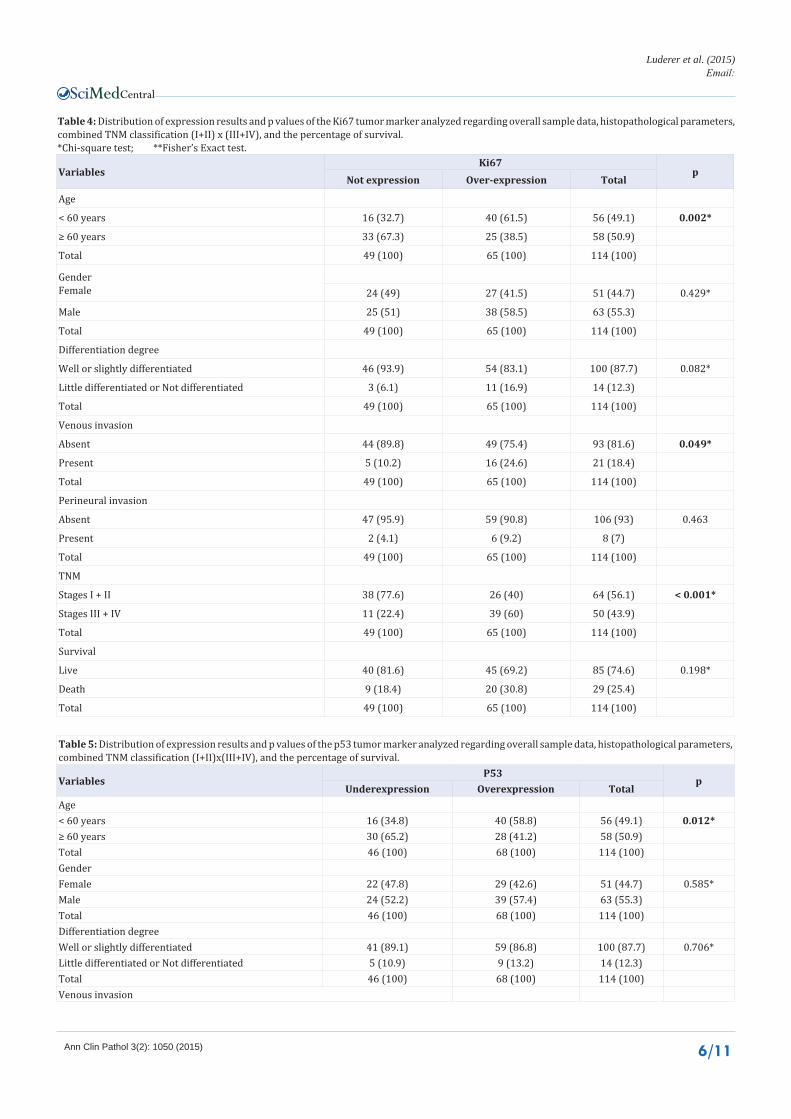
The results obtained from the analysis of the Ki67 expression in relation to the selected variables are shown in (Table4). Statistically significant differences were observed when analyzing the associations of isolated expression of the Ki67 marker with the age of the patient (p <0.002), the histopathological parameter of venous invasion (p <0.049), and the combined TNMS classification (I + II) x (III+IV) (p <0.001) (Figures: 5-7).
p53
The results obtained from the analysis of the p53 expression in relation to the selected variables are shown in (Table 5). Statistically significant differences were observed when analyzing the associations of isolated expression of the p53 marker with the age of the patient (p<0.012 the histopathological parameter of venous invasion (p<0.028), the combined TNMS classification (I+II) x (III+IV) p (<0,001), and percentage of survival (p<0.023) (Figures: 8,9,10 and 11).
VariablesEGFR
pNot expression
Over-expression Total
Age< 60 years 32 (46.4) 24 (53.3) 56 (49.1) 0.468*≥ 60 years 37 (53.6) 21 (46.7) 58 (50.9)Total 69 (100) 45 (100) 114 (100) GenderFemale 32 (46.4) 19 (42.2) 51 (44.7) 0.663*Male 37 (53.6) 26 (57.8) 63 (55.3)Total 69 (100) 45 (100) 114 (100) Differentiation degreeWell or slightly differentiated 63 (91.3) 37 (82.2) 100 (87.7) 0.149*
Little differentiated or Not differentiated 6 (8.7) 8 (17.8) 14 (12.3)
Total 69 (100) 45 (100) 114 (100) Venous invasionAbsent 65 (94.2) 28 (62.2) 93 (81.6) < 0.001*Present 4 (5.8) 17 (37.8) 21 (18.4)Total 69 (100) 45 (100) 114 (100) Perineural invasionAbsent 65 (94.2) 41 (91.1) 106 (93) 0.710**Present 4 (5.8) 4 (8.9) 8 (7)Total 69 (100) 45 (100) 114 (100) TNMStages I + II 27 (49.1) 37 (62.7) 64 (56.1) 0.143*Stages III + IV 28 (50.9) 22 (37.3) 50 (43.9)Total 55 (100) 59 (100) 114 (100) Survival
Live 41(74.5) 44(74.6) 85(74.6) 1.000*
Death 14(25.5) 15(25.4) 29 (25.4)
Total 55(100) 59(100) 114 (100)
*Chi-square test; **Fisher’s Exact test.
Table 2: Distribution of expression results and p values of the EGFR tumor marker analyzed regarding overall sample data, histopathological parameters, combined TNM classification (I+II) x (III+IV), and the percentage of survival.
94%62%
6%38%
Underexpression Overexpression
Venous invasion (EGFR)
Absent Present
Figure 1
Central
Luderer et al. (2015)Email:
Ann Clin Pathol 3(2): 1050 (2015) 4/11
93%
0%7%
100%
Underexpression Overexpression
TNM (EGFR)Stages I + II Stages III + IV
Figure 2
88%
53%
12%
47%
Underexpression Overexpression
Survival (EGFR)Live Death
Figure 3
87% 98%
13% 2%
Underexpression Overexpression
Perineural invasion (VEGF)
Absent Present
Figure 4
33%
62%67%
39%
Underexpression Overexpression
Age (Ki67)< 60 years ≥ 60 years
Figure 5
90%75%
10%25%
Underexpression Overexpression
Venous invasion (Ki67)
Absent Present
Figure 6
78%
40%22%
60%
Underexpression Overexpression
TNM (Ki67)Stages I + II Stages III + IV
Figure 7
35%
59%65%
41%
Underexpression Overexpression
Age (P53)
< 60 years ≥ 60 years
Figure 8
91%75%
9%25%
Underexpression Overexpression
Venous invasion (P53)
Absent Present
Figure 9
Central
Luderer et al. (2015)Email:
Ann Clin Pathol 3(2): 1050 (2015) 5/11
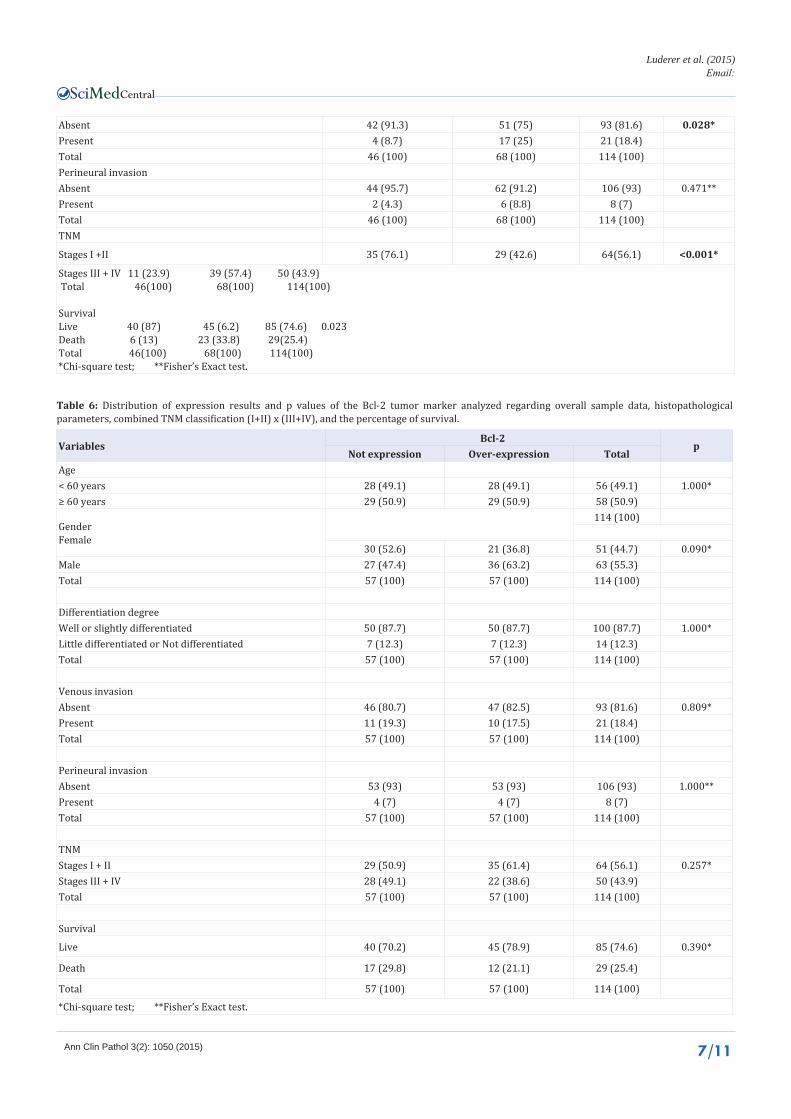
Bcl-2
The results obtained from the analysis of the Bcl-2 expression in relation to the selected variables are shown in (Table 6). No statistically significant difference was observed when analyzing the associations of isolated expression of the Bcl-2 marker with general sampling data, histopathological parameters, combined TNMS classification (I+II) x(III+IV), and the percentage of survival.
Estimate of patient’s survival related to isolated expressions of tumor markers
The results obtained in univariate analyses of overall survival with isolated expressions of tumor markers are shown in (Table 7) and illustrated in (Figures 12,13), as graphs. Statistically significant differences were observed when analyzing the time of survival with the EGFR tumor marker expression (p <0.001) and p53 (p <0.022).
Univariate survival analysis with isolated biomarker expressions
The results obtained in univariate analyses of survival with isolated expression of tumor markers are shown in (Table 8) and illustrated in (Figures 14,15), as graphs.
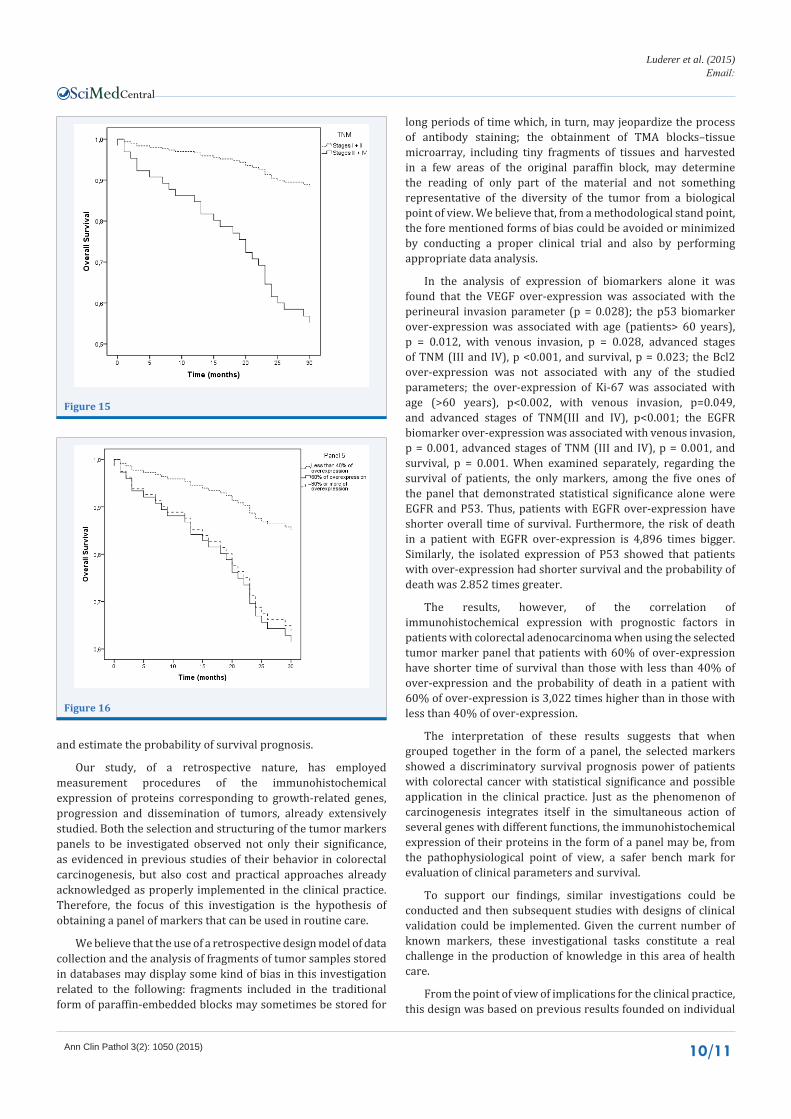
Statistically significant differences were observed when we analyzed the overall time of survival with histopathological parameters of venous invasion (p <0.001) and combined TNMS classification (I+II) x (III +IV) (p <0.001).
Estimate of survival by univariate analysis, with 5-tumor-marker panels and different combinations of percentages of over expression
Below are presented the results obtained from univariate and multivariate analyses, related to survival with panels of markers. 6 panels, including all 5 markers, were structured with progressively larger over expression percentages.
Two panels have been chosen to be submitted to multivariate survival analysis. The first panel selected that included patients with 60% of over expression had shorter survival time than that including patients with less than 40% of over expression. The risk of death in a patient with 60% of over expression is 3,022 times greater than the risk of death in a patient with less than 40% of over expression
Patients with 80% or more of over expression have shorter overall survival than patients with less than 40% of over expression. The risk of death in a patient with 80% or more over expression is 2,816 times greater than the risk of death in a
VariablesVEGF p
Not expression Over-expression TotalAge< 60 years 29 (52.7) 27 (45.8) 56 (49.1) 0.457*≥ 60 years 26 (47.3) 32 (54.2) 58 (50.9)Total 55 (100) 59 (100) 114 (100) GenderFemale 29 (52.7) 22 (37.3) 51 (44.7) 0.098*Male 26 (47.3) 37 (62.7) 63 (55.3)Total 55 (100) 59 (100) 114 (100) Differentiation degreeWell or slightly differentiated 49 (89.1) 51 (86.4) 100 (87.7) 0.667*Little differentiated or Not differentiated 6 (10.9) 8 (13.6) 14 (12.3)Total 55 (100) 59 (100) 114 (100) Venous invasionAbsent 44 (80) 49 (83.1) 93 (81.6) 0.675*Present 11 (20) 10 (16.9) 21 (18.4)Total 55 (100) 59 (100) 114 (100) Perineural invasionAbsent 48 (87.3) 58 (98.3) 106 (93) 0.028**Present 7 (12.7) 1 (1.7) 8 (7)Total 55 (100) 59 (100) 114 (100) TNMStages I + II 27 (49.1) 37 (62.7) 64 (56.1) 0.143*Stages III + IV 28 (50.9) 22 (37.3) 50 (43.9)Total 55 (100) 59 (100) 114 (100) SurvivalLive 41(74.5) 44(74.6) 85(74.6) 1.000*Death 14(25.5) 15(25.4) 29(25.4)Total 55(100) 59(100) 114(100) *Chi-square test; **Fisher’s Exact test.
Table 3: Distribution of expression results and p values of the VEGF tumor marker analyzed regarding overall sample data, histopathological parameters, combined TNM classification (I+II) x (III+IV), and the percentage of survival.
Central
Luderer et al. (2015)Email:
Ann Clin Pathol 3(2): 1050 (2015) 6/11
VariablesKi67
pNot expression Over-expression Total
Age
< 60 years 16 (32.7) 40 (61.5) 56 (49.1) 0.002*
≥ 60 years 33 (67.3) 25 (38.5) 58 (50.9)
Total 49 (100) 65 (100) 114 (100)
GenderFemale 24 (49) 27 (41.5) 51 (44.7) 0.429*
Male 25 (51) 38 (58.5) 63 (55.3)
Total 49 (100) 65 (100) 114 (100)
Differentiation degree
Well or slightly differentiated 46 (93.9) 54 (83.1) 100 (87.7) 0.082*
Little differentiated or Not differentiated 3 (6.1) 11 (16.9) 14 (12.3)
Total 49 (100) 65 (100) 114 (100)
Venous invasion
Absent 44 (89.8) 49 (75.4) 93 (81.6) 0.049*
Present 5 (10.2) 16 (24.6) 21 (18.4)
Total 49 (100) 65 (100) 114 (100)
Perineural invasion
Absent 47 (95.9) 59 (90.8) 106 (93) 0.463
Present 2 (4.1) 6 (9.2) 8 (7)
Total 49 (100) 65 (100) 114 (100)
TNM
Stages I + II 38 (77.6) 26 (40) 64 (56.1) < 0.001*
Stages III + IV 11 (22.4) 39 (60) 50 (43.9)
Total 49 (100) 65 (100) 114 (100)
Survival
Live 40 (81.6) 45 (69.2) 85 (74.6) 0.198*
Death 9 (18.4) 20 (30.8) 29 (25.4)
Total 49 (100) 65 (100) 114 (100)
Table 4: Distribution of expression results and p values of the Ki67 tumor marker analyzed regarding overall sample data, histopathological parameters, combined TNM classification (I+II) x (III+IV), and the percentage of survival.*Chi-square test; **Fisher’s Exact test.
Table 5: Distribution of expression results and p values of the p53 tumor marker analyzed regarding overall sample data, histopathological parameters, combined TNM classification (I+II)x(III+IV), and the percentage of survival.
VariablesP53
pUnderexpression Overexpression Total
Age< 60 years 16 (34.8) 40 (58.8) 56 (49.1) 0.012*≥ 60 years 30 (65.2) 28 (41.2) 58 (50.9)Total 46 (100) 68 (100) 114 (100) GenderFemale 22 (47.8) 29 (42.6) 51 (44.7) 0.585*Male 24 (52.2) 39 (57.4) 63 (55.3)Total 46 (100) 68 (100) 114 (100) Differentiation degreeWell or slightly differentiated 41 (89.1) 59 (86.8) 100 (87.7) 0.706*Little differentiated or Not differentiated 5 (10.9) 9 (13.2) 14 (12.3)Total 46 (100) 68 (100) 114 (100) Venous invasion
Central
Luderer et al. (2015)Email:
Ann Clin Pathol 3(2): 1050 (2015) 7/11
VariablesBcl-2
pNot expression Over-expression Total
Age< 60 years 28 (49.1) 28 (49.1) 56 (49.1) 1.000*≥ 60 years 29 (50.9) 29 (50.9) 58 (50.9)
GenderFemale
114 (100)
30 (52.6) 21 (36.8) 51 (44.7) 0.090*Male 27 (47.4) 36 (63.2) 63 (55.3)Total 57 (100) 57 (100) 114 (100)
Differentiation degreeWell or slightly differentiated 50 (87.7) 50 (87.7) 100 (87.7) 1.000*Little differentiated or Not differentiated 7 (12.3) 7 (12.3) 14 (12.3)Total 57 (100) 57 (100) 114 (100)
Venous invasionAbsent 46 (80.7) 47 (82.5) 93 (81.6) 0.809*Present 11 (19.3) 10 (17.5) 21 (18.4)Total 57 (100) 57 (100) 114 (100)
Perineural invasionAbsent 53 (93) 53 (93) 106 (93) 1.000**Present 4 (7) 4 (7) 8 (7)Total 57 (100) 57 (100) 114 (100)
TNMStages I + II 29 (50.9) 35 (61.4) 64 (56.1) 0.257*Stages III + IV 28 (49.1) 22 (38.6) 50 (43.9)Total 57 (100) 57 (100) 114 (100)
Survival
Live 40 (70.2) 45 (78.9) 85 (74.6) 0.390*
Death 17 (29.8) 12 (21.1) 29 (25.4)
Total 57 (100) 57 (100) 114 (100)
*Chi-square test; **Fisher’s Exact test.
Table 6: Distribution of expression results and p values of the Bcl-2 tumor marker analyzed regarding overall sample data, histopathological parameters, combined TNM classification (I+II) x (III+IV), and the percentage of survival.
Absent 42 (91.3) 51 (75) 93 (81.6) 0.028*Present 4 (8.7) 17 (25) 21 (18.4)Total 46 (100) 68 (100) 114 (100) Perineural invasionAbsent 44 (95.7) 62 (91.2) 106 (93) 0.471**Present 2 (4.3) 6 (8.8) 8 (7)Total 46 (100) 68 (100) 114 (100) TNM
Stages I +II 35 (76.1) 29 (42.6) 64(56.1) <0.001*
Stages III + IV 11 (23.9) 39 (57.4) 50 (43.9) Total 46(100) 68(100) 114(100)
SurvivalLive 40 (87) 45 (6.2) 85 (74.6) 0.023Death 6 (13) 23 (33.8) 29(25.4)Total 46(100) 68(100) 114(100) *Chi-square test; **Fisher’s Exact test.

Central
Luderer et al. (2015)Email:
Ann Clin Pathol 3(2): 1050 (2015) 8/11
Factor Estimate p HR 95% CI
EGFR (Over-expression versus Not expression) 1.588 < 0.001 4.896 [2.163; 11.078]
VEGF (Over-expression versus Not expression) 0.033 0.930 1.033 [0.499; 2.141]
Ki67 (Over-expression versus Not expression) 0.608 0.130 1.837 [0.836; 4.036]
P53 (Over-expression versus Not expression) 1.048 0.022 2.852 [1.161; 7.008]
Bcl-2 (Over-expression versus Not expression) 0.436 0.247 1.547 [0.738; 3.241]
Table 7: Overall survival estimate by univariate analysis, related to isolated expressions of tumor markers.
Cox Regression Analysis. CI= Confidence Index. HR = High risk
Factor Estimate p HR 95% CIAge (≥ 60 years versus < 60 years) 0.544 0.156 1.722 [0.813; 3.648]Gender (Male versus Female) 0.125 0.740 1.133 [0.541; 2.373]Differentiation degree (Little differentiated orNot differentiated versus Well or slightly differentiated) 0.734 0.110 2.084 [0.847; 5.124]
Venous invasion (Present versus Absent) 1.310 0.001 3.708 [1.764; 7.793]Perineural invasion (Absent versus Present) 0.744 0.465 2.104 [0.286; 15.465]TNM (Stages III + IV versus Stages I + II) 1.577 < 0.001 4.838 [2.063; 11.349]
Table 8: Overall survival estimate, p value, HR, and CI related with age, gender, histopathological parameters, and TNM classification (I+II) x (III+IV).
Cox Regression Analysis. CI= Confidence Index. HR = High risk
Factor Estimate p HR 95% CI
Panel 5 0.036
Panel (60% of Over-expression vs Less than 40% of Over-expression) 1.106 0.020 3.022 [1.192; 7.662]
Panel (80% or more of Over-expression vs Less than 40% of Over-expression) 1.035 0.026 2.816 [1.132; 7.007]
Table 9: Univariate survival analysis using biomarker panel.
CI= Confidence Index. HR = High risk
Factor Estimate p HR 95% CIAge (≥ 60 years versus < 60 years) 0.868 0.028 2.383 [1.1; 5.161]Differentiation degree (Little differentiated or Not differentiated versus Well or slightly differentiated) 0.584 0.216 1.793 [0.711; 4.524]
Venous invasion (Present versus Absent) 0.790 0.061 2.204 [0.964; 5.037]TNM (Stages III + IV versus Stages I + II) 0.984 0.066 2.675 [0.937; 7.641]Marker panel (60% of Over-expression versusLess than 40% of Over-expression) 0.806 0.123 2.238 [0.804; 6.229]
Marker panel (80% or more of Over-expressionVersus Less than 40% of Over-expression) 0.503 0.342 1.654 [0.587; 4.663]
Table 10: Multivariate survival analysis with the variables: age, differentiation degree, venous invasion, TNM, and marker panel, without selection of variables.
Cox Regression Analysis. CI= Confidence Index. HR = High risk
Fator Estimate p HR 95% CI
Age (≥ 60 years versus< 60 years) 0,743 0,055 2,103 [0,985; 4,49]
Venous invasion (Present versus Absent) 0,768 0,066 2,155 [0,951; 4,884]
TNM (Stages III + IV versus Stages I + II) 1,335 0,005 3,799 [1,49; 9,681]
Table 11: Multivariate survival analysis with the variables: age, differentiation degree, and venous invasion, TNM, and marker panels, with selection of variables.
Cox Regression Analysis. CI= Confidence Index. HR = High risk
patient with less than 40% of over expression (Table 9) (Figure 16).
Estimate of survival by multivariate analysis
To estimate survival using multivariate analysis, the variables that in the univariate survival analysis showed a significant
relationship with the time of survival to a maximum of 20%, p≤20%, were selected. These variables were: age, differentiation degree, venous invasion, TNM, and panel of markers (less than 40% of over expression, 60% of over expression, 80% or more of over-expression in the set of markers). The only variable with statistically significant differences when related to the time of

Central
Luderer et al. (2015)Email:
Ann Clin Pathol 3(2): 1050 (2015) 9/11
76%
43%
24%
57%
Underexpression Overexpression
TNM (P53)Stages I + II Stages III + IV
Figure 10
87.0%66.2%
13.0%33.8%
Hipoexpressão Hiperexpressão
Status (P53)Vivo Óbito
Figure 11
Figure 12
Figure 13
Figure 14
survival in the multivariate analysis, without variable selection, is age, p<0.028 (Table10).
The TNM variable was the only one that showed statistically significant difference when related to the time of survival in the multivariate analysis. The variables age and venous invasion do not show statistically significant correlation with the time of survival, at a significance level of 5%, but they were selected in the Cox regression model as significant in the analysis of time of
survival (Table 11).
DISCUSSIONColorectal adenocarcinoma has its prognosis made based on
the histological type, differentiation degree, blood and lymphatic vascular invasion, and the presence of lymph nodes or distant metastases. In the past few years a series of tumor markers have been used and evaluated in terms of their actions and influences in the genesis and inhibition of tumor growth. Much has been elucidated regarding colorectal carcinogenesis and its influences in relation to the extent and mechanisms of metastasis. Thus we hypothesized that the use, still in the diagnostic and staging phase, of a set of rationally selected tumor markers could offer, in theory, important support information to guide the treatment
Central
Luderer et al. (2015)Email:
Ann Clin Pathol 3(2): 1050 (2015) 10/11
and estimate the probability of survival prognosis.
Our study, of a retrospective nature, has employed measurement procedures of the immunohistochemical expression of proteins corresponding to growth-related genes, progression and dissemination of tumors, already extensively studied. Both the selection and structuring of the tumor markers panels to be investigated observed not only their significance, as evidenced in previous studies of their behavior in colorectal carcinogenesis, but also cost and practical approaches already acknowledged as properly implemented in the clinical practice. Therefore, the focus of this investigation is the hypothesis of obtaining a panel of markers that can be used in routine care.
We believe that the use of a retrospective design model of data collection and the analysis of fragments of tumor samples stored in databases may display some kind of bias in this investigation related to the following: fragments included in the traditional form of paraffin-embedded blocks may sometimes be stored for
long periods of time which, in turn, may jeopardize the process of antibody staining; the obtainment of TMA blocks–tissue microarray, including tiny fragments of tissues and harvested in a few areas of the original paraffin block, may determine the reading of only part of the material and not something representative of the diversity of the tumor from a biological point of view. We believe that, from a methodological stand point, the fore mentioned forms of bias could be avoided or minimized by conducting a proper clinical trial and also by performing appropriate data analysis.
In the analysis of expression of biomarkers alone it was found that the VEGF over-expression was associated with the perineural invasion parameter (p = 0.028); the p53 biomarker over-expression was associated with age (patients> 60 years), p = 0.012, with venous invasion, p = 0.028, advanced stages of TNM (III and IV), p <0.001, and survival, p = 0.023; the Bcl2 over-expression was not associated with any of the studied parameters; the over-expression of Ki-67 was associated with age (>60 years), p<0.002, with venous invasion, p=0.049, and advanced stages of TNM(III and IV), p<0.001; the EGFR biomarker over-expression was associated with venous invasion, p = 0.001, advanced stages of TNM (III and IV), p = 0.001, and survival, p = 0.001. When examined separately, regarding the survival of patients, the only markers, among the five ones of the panel that demonstrated statistical significance alone were EGFR and P53. Thus, patients with EGFR over-expression have shorter overall time of survival. Furthermore, the risk of death in a patient with EGFR over-expression is 4,896 times bigger. Similarly, the isolated expression of P53 showed that patients with over-expression had shorter survival and the probability of death was 2.852 times greater.
The results, however, of the correlation of immunohistochemical expression with prognostic factors in patients with colorectal adenocarcinoma when using the selected tumor marker panel that patients with 60% of over-expression have shorter time of survival than those with less than 40% of over-expression and the probability of death in a patient with 60% of over-expression is 3,022 times higher than in those with less than 40% of over-expression.
The interpretation of these results suggests that when grouped together in the form of a panel, the selected markers showed a discriminatory survival prognosis power of patients with colorectal cancer with statistical significance and possible application in the clinical practice. Just as the phenomenon of carcinogenesis integrates itself in the simultaneous action of several genes with different functions, the immunohistochemical expression of their proteins in the form of a panel may be, from the pathophysiological point of view, a safer bench mark for evaluation of clinical parameters and survival.
To support our findings, similar investigations could be conducted and then subsequent studies with designs of clinical validation could be implemented. Given the current number of known markers, these investigational tasks constitute a real challenge in the production of knowledge in this area of health care.
From the point of view of implications for the clinical practice, this design was based on previous results founded on individual
Figure 15
Figure 16
Central
Luderer et al. (2015)Email:
Ann Clin Pathol 3(2): 1050 (2015) 11/11
Luderer LA, Lustosa SAS, Silva SEM, Denadai MVA, Afonso Jr RJ, et al. (2015) Significance of a Biomarkers Immunohistochemistry Panel for Survival Prognostic in Patients with Sporadic Colorectal Cancer. Ann Clin Pathol 3(2): 1050.
Cite this article
evaluations of these markers, when no statistic and satisfactory significance was obtained for application in patient care [18-22]. The trend observed in the literature of conducting analysis no longer in isolation, but in a panel of markers, leading us to believe that the measurement of the strength of the association of selected markers could give more power to the correlation between their expressions and clinic pathological variables, was considered.
Therefore, based on reliable results, a method of estimating a prognostic parameter in early stage of care was established. However, the conduction of further studies in various investigational sites and with different panels of markers for validation and consolidation of this kind of study is still required.
Finally, based on the resultsof this investigation, we conclude that the immunohistochemical over-expression of the carcinogenetic marker panel consisting of VEGF, EGFR, Ki67, p53, and Bcl-2 is associated with shorter time of survival of patients with sporadic colorectal adenocarcinoma who underwent radical surgical treatment
REFERENCES1. Yin Y, Cao LY, Wu WQ, Li H, Jiang Y, Zhang HF. Blocking effects of
siRNA on VEGF expression in human colorectal cancer cells. World J Gastroenterol. 2010; 16: 1086-1092.
2. Liang JF, Wang HK, Xiao H, Li N, Cheng CX, Zhao YZ, Ma YB. Relationship and prognostic significance of SPARC and VEGF protein expression in colon cancer. J Exp Clin Cancer Res. 2010; 29: 71.
3. Martins SF, Garcia EA, Luz MA, Pardal F, Rodrigues M, Filho AL. Clinicopathological correlation and prognostic significance of VEGF-A, VEGF-C, VEGFR-2 and VEGFR-3 expression in colorectal cancer. Cancer Genomics Proteomics. 2013; 10: 55-67.
4. Suzuki K, Matsubara H. Recent advances in p53 research and cancer treatment. J Biomed Biotechnol. 2011; 2011: 978312.
5. Ghiţă C, Vîlcea ID, Dumitrescu M, Vîlcea AM, Mirea CS, Aşchie M, et al. The prognostic value of the immunohistochemical aspects of tumor suppressor genes p53, bcl-2, PTEN and nuclear proliferative antigen Ki-67 in resected colorectal carcinoma. Rom J MorpholEmbryol. 2012; 53: 549-556.
6. Sillars-Hardebol AH, Carvalho B, Beliën JA, de Wit M, Delis-van Diemen PM, Tijssen M, et al . BCL2L1 has a functional role in colorectal cancer and its protein expression is associated with chromosome 20q gain. J Pathol. 2012; 226: 442-450.
7. Menezes HL, Jucá MJ, Gomes EGA, Nunes BLBBP, Costa HO, Matos D. Analysis of the Immunohistochemical expressions of p53, Bcl-2 and Ki-67 in colorectal adenocarcinoma and their correlations with the prognostics factors. Arq Gastroenterol. 2010; 47: 141-147.
8. Brand TM, Iida M, Li C, Wheeler DL. The nuclear epidermal growth factor receptor signaling network and its role in cancer. Discov Med. 2011; 12: 419-432.
9. Lyall MS, Dundas SR, Curran S, Murray GI. Profiling markers of prognosis in colorectal cancer. Clin Cancer Res. 2006; 12: 1184-1191.
10. Satoshi I, Fujimori M, Shibata S, Okajima M, Ishizaki Y, Kurihara T, et al. Combined immunohistochemistry of ß-catenin, cytokeratin 7, and cytokeratin 20 is useful in discriminating primary lung adenocarcinomas from metastatic colorectal cancer. BMC Cancer. 2006; 6: 31.
11. Muraca PJ, inventor; Nuclea Biotechnologies Pittsfield, MA. Gene and protein expressin profiles associated with the terapeutic efficacy of EGFR-TK inhibitors. United State Patent nº 2009/0263819, 2009.
12. Zeestraten ECM, Bernard A, Reimers MS, Schouten PC, Liefers GJ, van de Velde CJH, et al. The prognostic Value of the Apoptosis pathway in colorectal Cancer: A Review of the Literature on Biomarkers Identified by Immunohistochemistry. Biomarkers in Cancer. 2013; 5: 13–29.
13. Muraca PJ, inventor; Nuclea Biotechnologies Pittsfield, MA. Gene and protein expression profiles associated with the therapeutic efficacy of irinotecan. United StatePatent nº 2013/8580926, 2013.
14. Hamilton SR, Bosman FT, Boffetta P, Ilyas M, Morreau H, Nakamura SI, et al. Carcinoma of the colon and rectum. In: Bosman FT, Carneiro F, Hruban RH, and Theise ND editors. WHO Classification of Tumors of the Dygestive System – Lyon: International Agency for Research on Cancer. 2010: 131-182.
15. Edge SB, Byrd DR, Compton CC, Fritz AG, Greene FL, Trotti A. AJCC Cancer Staging Manual. American Joint Committee on Cancer. 7ª Ed. Springer New York. 2010.
16. Bendardaf R, Buhmeida A, Ristamäki R, Syrjänen K, Pyrhönen S. MMP-1 (collagenase-1) expression in primary colorectal cancer and its metastases. Scand J Gastroenterol. 2007; 42: 1473-1478.
17. Dong W, Li H, Zhang Y, Yang H, Guo M, Li L, Liu T. Matrix metalloproteinase 2 promotes cell growth and invasion in colorectal cancer. Acta Biochim Biophys Sin (Shanghai). 2011; 43: 840-848.
18. Lustosa SA, Logullo A, Artigiani R, Saad SS, Goldenberg A, Matos D. Analysis of the correlation between p53 and bcl-2 expression with staging and prognosis of the colorectal adenocarcinoma. Acta Cir Bras. 2005; 20: 353-357.
19. Gomes EG, Jucá MJ, de Menezes HL, Nunes BL, Costa H, Lima Fde O, Matos D. Correlation between the immunohistochemical expressions of MMP-1, MMP-7 and VEGF and prognostic factors in colorectal adenocarcinoma. Acta Cir Bras. 2009; 24: 303-310.
20. Jesus EC, Matos D, Artigiani R, Waitzberg AF, Goldenberg A, Saad SS. Assessment of staging, prognosis and mortality of colorectal cancer by tumor markers: receptor erbB-2 and cadherins. Acta Cir Bras. 2005; 20: 422-427.
21. Moura Franco RM, Linhares MM, Lustosa SS, Silva ID, Souza NC, Matos D. Analysis of differentially expressed genes in colorectal adenocarcinoma with versus without metastasis by three-dimensional oligonucleotide microarray. Int J ClinExpPathol. 2014; 7: 255-263.
22. Nunes BL, Jucá MJ, Gomes EG, Menezes HL, Costa HO, Matos D, Saad SS. Metalloproteinase-1, metalloproteinase-7, and p53 immunoexpression and their correlation with clinicopathological prognostic factors in colorectal adenocarcinoma. Int J Biol Markers. 2009; 24: 156-164.


![Normas do Cerimonial Unifesp Final [A5].p65](https://static.fdocuments.us/doc/165x107/58709d031a28ab16728bae35/normas-do-cerimonial-unifesp-final-a5p65.jpg)