
Research Article Preventive Maintenance Scheduling for ...
13
Research Article Preventive Maintenance Scheduling for Multicogeneration Plants with Production Constraints Using Genetic Algorithms Khaled Alhamad, 1 Mohsen Alardhi, 2 and Abdulla Almazrouee 3 1 Technological Science Department, College of Technological Studies, PAAET, P.O. Box 42325, Shuwaikh 70654, Kuwait 2 Automotive & Marine Engineering Technology Department, College of Technological Studies, PAAET, P.O. Box 42325, Shuwaikh 70654, Kuwait 3 Manufacturing Engineering Technology Department, College of Technological Studies, PAAET, P.O. Box 42325, Shuwaikh 70654, Kuwait Correspondence should be addressed to Khaled Alhamad; [email protected] Received 13 August 2014; Revised 20 November 2014; Accepted 9 January 2015 Academic Editor: Viliam Makis Copyright © 2015 Khaled Alhamad et al. is is an open access article distributed under the Creative Commons Attribution License, which permits unrestricted use, distribution, and reproduction in any medium, provided the original work is properly cited. is paper describes a method developed to schedule the preventive maintenance tasks of the generation and desalination units in separate and linked cogeneration plants provided that all the necessary maintenance and production constraints are satisfied. e proposed methodology is used to generate two preventing maintenance schedules, one for electricity and the other for distiller. Two types of crossover operators were adopted, 2-point and 4-point. e objective function of the model is to maximize the available number of operational units in each plant. e results obtained were satisfying the problem parameters. However, 4-point slightly produce better solution than 2-point ones for both electricity and water distiller. e performance as well as the effectiveness of the genetic algorithm in solving preventive maintenance scheduling is applied and tested on a real system of 21 units for electricity and 21 units for water. e results presented here show a great potential for utility applications for effective energy management over a time horizon of 52 weeks. e model presented is an effective decision tool that optimizes the solution of the maintenance scheduling problem for cogeneration plants under maintenance and production constraints. 1. Introduction Desalination, desalinization, desalinisation, or desalting refers to any of several processes employed to produce fresh water suitable for human consumption by removing some amount of salt from the sea water. It is known that salty water cannot sustain the human life, farming, or industry; there- fore, people have strived to develop cost-effective and reliable ways for desalination. One of the widely used procedures for water production is cogeneration. is is an energy-efficient method of producing power and fresh water at the same time, in one process with one fuel. e cogeneration power plants (considered as complex process engineering systems consisting of various subsystems) are operated for achieving two major goals, namely, maximizing both generation of power and production of distilled water. e cogeneration power plants have been widely used worldwide because of their reliability, efficiency, and economic values [1–3]. Currently, around 120 countries have adopted this technology for producing power and water [4]. e cost effectiveness represents a real challenge that the cogeneration power plants technology has been facing recently. is effectiveness is related to the reduction of the different cost variables such as fuel and operational cost. In the classical scheduling, the common assumption is that processing times of the jobs are fixed and known a priori with certainty [5]. In practice, however, machine production rate becomes less than normal due to a mal-position of tools, mal-alignment jobs, abrasion of tools, and scraps of operations, and so forth. In these situations, the processing time of the jobs increases depending upon the sequence of jobs or the starting time of jobs. Such problems are generally known as machine scheduling problems with deterioration [6]. e deteriorated processing time of jobs is recovered to Hindawi Publishing Corporation Advances in Operations Research Volume 2015, Article ID 282178, 12 pages http://dx.doi.org/10.1155/2015/282178
Transcript of Research Article Preventive Maintenance Scheduling for ...

Research ArticlePreventive Maintenance Scheduling for MulticogenerationPlants with Production Constraints Using Genetic Algorithms
Khaled Alhamad1 Mohsen Alardhi2 and Abdulla Almazrouee3
1Technological Science Department College of Technological Studies PAAET PO Box 42325 Shuwaikh 70654 Kuwait2Automotive amp Marine Engineering Technology Department College of Technological Studies PAAETPO Box 42325 Shuwaikh 70654 Kuwait3Manufacturing Engineering Technology Department College of Technological Studies PAAET PO Box 42325Shuwaikh 70654 Kuwait
Correspondence should be addressed to Khaled Alhamad kmalhamadpaaetedukw
Received 13 August 2014 Revised 20 November 2014 Accepted 9 January 2015
Academic Editor Viliam Makis
Copyright copy 2015 Khaled Alhamad et al This is an open access article distributed under the Creative Commons AttributionLicense which permits unrestricted use distribution and reproduction in any medium provided the original work is properlycited
This paper describes a method developed to schedule the preventive maintenance tasks of the generation and desalination units inseparate and linked cogeneration plants provided that all the necessary maintenance and production constraints are satisfied Theproposedmethodology is used to generate two preventingmaintenance schedules one for electricity and the other for distiller Twotypes of crossover operators were adopted 2-point and 4-point The objective function of the model is to maximize the availablenumber of operational units in each plant The results obtained were satisfying the problem parameters However 4-point slightlyproduce better solution than 2-point ones for both electricity and water distiller The performance as well as the effectiveness ofthe genetic algorithm in solving preventive maintenance scheduling is applied and tested on a real system of 21 units for electricityand 21 units for water The results presented here show a great potential for utility applications for effective energy managementover a time horizon of 52 weeks The model presented is an effective decision tool that optimizes the solution of the maintenancescheduling problem for cogeneration plants under maintenance and production constraints
1 Introduction
Desalination desalinization desalinisation or desaltingrefers to any of several processes employed to produce freshwater suitable for human consumption by removing someamount of salt from the sea water It is known that salty watercannot sustain the human life farming or industry there-fore people have strived to develop cost-effective and reliableways for desalination One of the widely used procedures forwater production is cogeneration This is an energy-efficientmethod of producing power and fresh water at the sametime in one process with one fuel The cogeneration powerplants (considered as complex process engineering systemsconsisting of various subsystems) are operated for achievingtwo major goals namely maximizing both generation ofpower and production of distilled water The cogenerationpower plants have been widely used worldwide because
of their reliability efficiency and economic values [1ndash3]Currently around 120 countries have adopted this technologyfor producing power and water [4]
The cost effectiveness represents a real challenge thatthe cogeneration power plants technology has been facingrecently This effectiveness is related to the reduction of thedifferent cost variables such as fuel and operational cost
In the classical scheduling the common assumption isthat processing times of the jobs are fixed and known a prioriwith certainty [5] In practice however machine productionrate becomes less than normal due to a mal-position oftools mal-alignment jobs abrasion of tools and scraps ofoperations and so forth In these situations the processingtime of the jobs increases depending upon the sequence ofjobs or the starting time of jobs Such problems are generallyknown as machine scheduling problems with deterioration[6] The deteriorated processing time of jobs is recovered to
Hindawi Publishing CorporationAdvances in Operations ResearchVolume 2015 Article ID 282178 12 pageshttpdxdoiorg1011552015282178
2 Advances in Operations Research
an original processing time by the maintenance or cleaningprocess machines The recovering process bringing back toa normal processing time is called rate-modifying activity(RMA) [7] Lee and Leon [8] consider several problems ofscheduling on a single machine with an RMA (minimizingmakespan flow-time weighted flow-time and maximumlateness)
The maintenance which is defined as a combination ofseveral functions needed to keep in or restore the equipmentto a designated operational state [9ndash11] is an essential activityin these cogeneration power plants It is known as anincreasing portion of the operational costs and as a resultany saving in maintenance cost will lead to huge reductionin the overall cost Maintenance also has a great effect on theplant and unit availability and production cost In additionthe long termmaintenance scheduling (MS) of the generationand desalination units is an important challenge for theseplants Past experiences indicated that effective schedulingcan save considerable operational costs that help the electricand water utilities to be more competitive in terms of theenergy and water price while increasing system reliability[2 3]
Maintenance optimization consists in broad terms ofthose mathematical models aimed at finding either theoptimum balance between costs and benefits of maintenanceor themost appropriatemoment to executemaintenance [12]It is a well-established area as several reviews show [13 14]For introductions and frameworks see [15 16] For recentproblem oriented overviews see [17ndash19]
Maintenance scheduling is usually considered as an opti-mization problem This problem is subject to a number ofconstraints such as the crew constraint maintenance windowconstraint time limitation constraint and the output loadconstraints of water and electric power demanded [9] Themain goal of this optimization problem is to allow the powergeneration and water production to meet the demand with-out any delay by keeping the required equipment availableduring operation Availability is ldquothe ability of equipment tosuccessfully perform its required function at a stated instantof time over a stated period of timerdquo [20] Any failure whichmay occur in any unit in the cogeneration plant will affect theoverall availability of the system and therefore will cause anincrease in the overall cost
As an example some earlier studies that dealt with cogen-eration maintenance are [21ndash23] Authors treating desali-nation include [1 2 24 25] Several methods have beenproposed in the literature to solve thermal unitMS these havesimilarities with cogeneration units The solution methodscan be categorized as follows integer programming [1 26 27]Bendersrsquo decomposition technique [28] dynamic program-ming [11 29] and exact and metaheuristic algorithms [30]which give exact optimal solution However when the size ofthe problem increases the solution space increases greatly as aresult causing the computational time to increase Thereforethe exact solution might be sacrificed in order to reducethe computational time using other algorithms such as Tabusearch [31] simulated annealing methods [32] and geneticalgorithm (GA) [33 34]
0
20
40
60
80
100
120
Countries
Top 10 desalination countries
(m3d
)
Saud
i Ara
bia
UAE
USA
Spai
n
Kuw
ait
Alg
eria
Chin
a
Qat
ar
Japa
n
Aust
ralia
times105
Figure 1 Desalination capacity for top 10 countries in terms ofinstalled capacities in m3d (2008) [35]
This paper presents a genetic algorithm (GA) modeldesigned to produce an optimal maintenance schedule forcogeneration plants in terms of maximizing the availablenumber of units in each plant for a 12-month demand cycleGA was used in many other problems and found to producecompetitive results see for example Liu et al [34] and Al-Hamad et al [33]Themodel designed in this paper is reliableand capable of generating a good schedule for industrialsectors Moreover this model can be used to solve large-scaleproblems practically and efficiently
The structure of the paper is as follows In the next sectionthe problem background and the main features of the geneticalgorithm are covered Section 3 is devoted to formulate themodel mathematically An illustrative example is given inSection 5 to test the model This is finally followed by theconclusion
2 Problem Background andGenetic Algorithms
21 ProblemBackground Around 120 countries have adoptedthe cogeneration power plants for producing power andwater (see Figure 1) Fifty percent of them are theMiddle Eastregion [36] Among theseMiddle Eastern countries that havebeen extensively using the cogeneration power plant is thestate of Kuwait
InKuwait theMinistry of Electricity andWater (MEW) isresponsible for supplying power and water to the populationThe MEW has met the growth in demand for electricity andwater in the last 30 years by the construction of a systemof cogeneration plants exceeding 12 Gigawatts (GW) and400 million imperial gallons per day (MIGD) [37] Thereare 6 power plants in Kuwait namely Doha East DohaWest Shuaiba Al-Zour South Sabiya and Shuwaikh Theseplants employ both thermal steam turbines and gas turbinesfor power generation These plants are identical in layoutbut different in sizes and installed capacities Each plant has
Advances in Operations Research 3
150MW
Aux serv
Boiler Steam turbine
DistillersFuel
Stage 26
Condenser
S heater
ECO
Generator
Transformer
Distillate water
Sea water
Main heaterBoiler feed water pumps
F D fan
Stage 1
System 132k
15kV132kV
Figure 2 The elements of the units of a typical cogeneration plant in Kuwait
a boiler a turbo-generator and a distiller as shown inFigure 2The boilers produce a high pressure steam from fuelthe turbo-generators produce an electric power from the highpressure steam and the distillers produce desalinated waterfrom the salty water using low pressure steam A commonsteam header connects the boilers of a plant so that the steamfrom a boiler in one unit can be used by a distiller in anotherunit The water produced is stored in reservoirs which areused to meet the predicted demand at each time period ofplanning horizon The plants should also satisfy the demandfor electric power and water during each time period
The main target of this research is to present a geneticalgorithm model that produces a solution of an optimalmaintenance schedule for cogeneration plants in terms ofmaximizing the available number of units in each plant fora 12-month demand cycle
22 Genetic Algorithm Definition Genetic algorithms (GAs)belong to a class of efficient algorithms which generate solu-tions to optimization problems using techniques inspired bynatural evolution such as inheritance mutation selectionand crossover They are very common algorithms and workwell in any search space GAs were formally introduced inthe United States in the 1970s by John Holland at UniversityofMichiganThe starting point ofGA is to create a populationof chromosomes (ie a collection of chromosomes) whereeach chromosome represents a proposed solution to theproblem into consideration and is defined as a simple stringTwo chromosomes are selected from the population and thecrossover andmutation operators are then applied to generatenew chromosomes Crossover is a genetic operator thatcombines (mates) two chromosomes (parents) to produce anew chromosome (offspring) The idea behind crossover isthat the new chromosome may be better than both of theparents if it takes the best characteristics from each of theparents Mutation operator alters one or more gene values ina chromosome from its initial state In mutation the solutionmay change entirely from the previous solution Hence GAcan produce better solutions by using mutationThe purpose
of mutation in GAs is to preserve the diversity and to allowthe algorithm to avoid local minima or maxima In eachgeneration the fitness function of every chromosome in thepopulation is evaluated (Note that the fitness function mea-sures the quality of the represented solutionmdashchromosome)
The three most important aspects of using geneticalgorithms are (1) definition of the objective function (2)definition and implementation of the genetic representationof chromosomes and (3) definition and implementation ofthe genetic operators There are various selection criteria sothat it picks the best individuals for mating (see [38])
3 Problem Description andMathematical Formulation
The problem of MS that concerns this paper is definedformally as follows Let119875 be a set of plants with119875 = 1 119901
where 119901 is the total number of plants There is a set of119905 units of type boiler-turbine and a set of 119889 units of typedistiller such that the total number of type boiler-turbine isequal to the total number of type distiller Each unit must gothrough a maintenance process for a period of time morethan one unit can go through maintenance simultaneouslyThe maintenance durations of the units are not necessarilyidentical During maintenance a minimum number of unitsfor each plant must stay in operation The goal is to schedulethe preventive maintenance tasks for 119901 plants consisting of 119892units of boiler-turbine and 119892 units of distiller in a way thatmaximizes the number of available units over the operationalplanning time-horizon 119879
The schedule of maintenance consists of a strip of allthe units and of their corresponding maintenance timesThe schedule displays all the units and their maintenancestartingweek Figure 3 illustrates the schedule of 10 units to bemaintained in time-horizon of 52 weeks The upper numbersrepresent the unit number and the lower numbers representthe starting week of maintenance
For example unit 1 starts in week 5 and unit 2 starts inweek 12 Units 4 and 9 start in the same week 24
4 Advances in Operations Research
10987654321292436444502416125
Figure 3 Schedule of 10 units to be maintained in time-horizon of52 weeks
Fitness10987654321534292436444502416125
Figure 4 An illustration of a chromosome
The GA adapted in this paper starts by generating anumber of chromosomes NM say where each chromosomeis formed of ND genes (nodes) Each chromosome representsa schedule of starting maintenance (week)mdashsame Figure 3mdashfor unit 119905 in case of boiler-turbine or for unit 119889 in case ofdistiller The fitness value will be evaluated and displayedseparately for each chromosomeAn example of chromosomeis illustrated in Figure 4
Notation The following notations are used in the GAapproach
119875 = 1 2 119901 denotes the set of 119901 plants indexedby 119894 isin 119875119866 = 1 2 119892 denotes the set of 119892 units of typeboiler-turbine indexed by 119905 isin 119866119873 = 1 2 119892 denotes the set of 119892 units of typedistiller indexed by 119889 isin 119873
(Note that the total number of boiler-turbine units is equalto the total number of distiller units)
119879 = 1 2 ℎ is length of the maintenance planninghorizon (week) indexed by 119896 isin 119879NM is number of chromosomes (population)ND is number of genes (nodes) in chromosomewhereND = 119892NB is portion of chromosome called neighborhoodItIn is number of inner iterations (iterations withinspecific population NM)ItOut is number of outer iterations which is equal tothe number of populations thatwere generated duringthe GA modelItAll is number of iterations = ItIn lowast ItOut119864119905is earliest time (week) that maintenance on unit 119905
can start where 119905 isin 119866119871119905is latest time (week) that maintenance on unit 119905 can
start where 119905 isin 119866119864119889is earliest time (week) that maintenance on unit 119889
can start where 119889 isin 119873119871119889is latest time (week) that maintenance on unit 119889
can start where 119889 isin 119873119870119905is maximum electricity production capacity for
unit 119905 where 119905 isin 119866
119869119905is maximum water production capacity for unit 119889
where 119889 isin 119873OP119905is minimum number of units 119905 in operation
where 119905 isin 119866OP119889is minimum number of units 119889 in operation
where 119889 isin 119873DE119896is total demand of electricity in period 119896
DW119896is total demand of water in period 119896
119882min is minimum allowed reservoir level amount ofwater119882max is maximum allowed reservoir level amount ofwaterINw is initial reservoir amount of waterTCE is the total amount of manpower available forelectricity equipmentTCW is the total amount of manpower available forwater equipmentMANE
119905is amount of manpower required for unit 119905
where 119905 isin 119866MANW
119889is amount of manpower required for unit 119889
where 119889 isin 119873119860119905is electricity production rate for unit 119905 where 119905 isin
119866119860119889is water production rate for unit 119889 where 119889 isin 119873
119872119905is maintenance duration of unit 119905 where 119905 isin 119866
119872119889is maintenance duration of unit 119889 where 119889 isin 119873
WE119894119896
is number of electricity units operational inweek 119896 where 119894 isin 119875WW119894119896is number of water units operational in week
119896 where 119894 isin 119875
Decision Variables Consider
119909119905119896
=
1 unit 119905 strats maintenancein the 119896th week 119905 isin 119866
0 otherwise
where 119896 isin [119864119905 119871119905] 119905 isin 119866
119910119889119896
=
1 unit 119889 strats maintenancein the 119896th week 119889 isin 119873
0 otherwise
where 119896 isin [119864119889 119871119889] 119889 isin 119873
(1)
The available production of electricity (available MW) fl119896
and the available production of water (available MGID) fw119896
at period 119896 are calculated as follows
fl119896=
119892
sum119905=1
(1 minus 119909119905119896) 119860119905
fw119896=
119892
sum119889=1
(1 minus 119910119889119896
) 119860119889
(2)
Advances in Operations Research 5
45 9 21 5 8 36 19 46 22 28
Figure 5 A chromosome that represents one feasible solution
The reservoir amount of water Res1in first week is given by
Res1= fw1+ INw minus DW
1 (3)
and the reservoir amount of water Res119896at period 119896 = 1 is
computed by
Res119896= Res
119896minus1+ fw119896minus DW
119896 (4)
4 Genetic Algorithm Method
This section explains how the genetic algorithm procedure isimplemented
41 Representation GAs work with a population of chro-mosomes (strings) where each chromosome represents onepotential solution to the optimization problem Most of theGAs apply binary chromosomes to represent chromosomeHere an integer chromosome of length119892 as the representationof chromosome is used where 119892 is the number of units in theproblemThere are two types of chromosomes one representsunits of boiler-turbine 119905 while the other one represents unitsof distiller 119889 An important part of GAs is encoding the valueof each gene in the chromosome belonging to the populationThis encoding is significant to the GA operations The valueof each gene in the chromosome is the unit maintenanceweek starting time and the sequence of the genes is the orderof units For example a chromosome can be represented asgiven in Figure 5
This chromosome represents one feasible solution of 10genes (node MS) In this representation the maintenance ofunit number 1 starts at week 45 and unit number 2 starts atweek 9 and so on for the other units There are two types ofchromosomes as mentioned previously one holds only unitsof boiler-turbine 119905 while the second holds units of distiller 119889
The operations accomplished when implementing a GAmodel are in the following order
(1) Initialize the population(2) Calculate the fitness for each chromosome in the
population(3) Perform the crossover and mutation operators on the
population(4) Go to step (2) until a certain number of iterations is
reached or a specific criterion is satisfied(5) Reproduce a new chromosome to form a new popu-
lation then go to step (2)
42 Initial Population There are two types of units 119905 and119889 two GA models for each type of unit were createdusing the same methodology On the other hand eachmodel works separately this means if boiler-turbine is under
28224619368521945Parent 1
501932271324482614Parent 2
Figure 6 Two parent chromosomes
maintenance the distiller will not be influenced First eachGA model generates an initial population consisting of NMchromosomes of type 119905 and NM chromosomes of type 119889respectively the generation is carried out randomly using atrial process where all conditions mentioned in Section 43are satisfied The second step is to calculate the fitness value(objective function) for each chromosome where the fitnessvalue associated with each chromosome is the standarddeviation of the gaps between the demand and the availableproduction on the whole maintenance planning horizonThe reason behind using the standard deviation is to keepthe gaps between the demand and the available productionalmost equal during the time horizon 119879 This means thatthere is a sufficient production in period 119896 in case anybreakdown occurred Chromosomes with good fitness value(lower standard deviation) will have the higher chance to beselected as parents for mating The standard deviations 119878
119905
and 119878119889for both types 119905 and 119889 respectively are calculated as
follows
119878119905= radicsum
ℎ
119896=1(gapl119896minus ave)2
ℎ minus 1
119878119889= radicsum
ℎ
119896=1(gapw
119896minus avw)
2
ℎ minus 1
(5)
Let gapl119896stand for the electricity gap between the demand
of electricity and available MW in period (119896) while gapw119896
stand for the water gap between the demand of water and theavailable MIGD in period (119896) These gaps are given as
gapl119896= fl119896minus DE119896 gapw
119896= fw119896minus DW
119896 (6)
and their respective averages ave and avd are found by
ave =sumℎ
119896=1gapl119896
ℎ avd =
sumℎ
119896=1gapw119896
ℎ (7)
Once two parents are selected offspring are producedusing crossover and mutation operators simultaneously
43 Crossover Operation Crossover is a process of takingtwo parent solutions to produce two children solutions fromthem There are many techniques for crossover operationsee for example [39 40] The 2-point and 4-point crossovertechniques are adapted in this research see [33 41] To explainthese two techniques suppose two chromosomes (parents)are presented as illustrated in Figure 6
The 2-point crossover starts by selecting two crossoverpoints on both parent chromosomes randomly All databeyond the two selected points (called neighborhood (NB))
6 Advances in Operations Research
28224619368521945Parent 1
501932271324482614Parent 2
28224619132448945Offspring 1
501932273685212614Offspring 2
Figure 7 An illustration of 2-point crossover
28224619368521945Parent 1
501932271324482614Parent 2
28223227185212645Offspring 1
501946193632448914Offspring 2
Figure 8 An illustration of 4-point crossover
in each chromosome are swappedThis produces the children(offspring) shown in Figure 7 The size of the selected neigh-borhood NB varies but does not exceed 50 of the lengthof the chromosome As an example of neighborhood size inFigure 7 the size of neighborhood is 40 4 genes out of 10the length of chromosome
With the 4-point crossover four crossover positions areselected at random and the value of genes exchanged betweenthe chromosomes along with these points Then two newoffspring are produced The length between two selectedpoints is not fixed where it could bind only one gene or itcould be segment as in Figure 8
After each crossover trial all the following conditionsmust be satisfied
WE119894119896
minus
119892
sum119905=1
119909119905119896
ge OP119905 (8)
WW119894119896
minus
119892
sum119905=1
119910119889119896
ge OP119889 (9)
fl119896ge DE119896 (10)
fw119896ge DW
119896 (11)
119882min le Res119896le 119882max (12)
Conditions (8) and (9) ensure that total number of unitsoperating in week 119896 is more than or equal to the minimumtotal number of units required to be operational in week 119896Conditions (10) and (11) indicate that the available productionin week 119896must be more than or equal to the demandThe lastcondition (12) ensures that the reservoir level amount ofwaterremains within the boundaries
Furthermore starting a preventive maintenance taskmust be more than or equal to the earliest time Meantime
when the starting time for a specific unit takes place themaintenance durationmust not exceed the latest timeThere-fore any crossover trial for unit 119905must be within [119864
119905 119871119905] and
must be within [119864119889 119871119889] in case of unit 119889 The conditions are
as followsIf 119909119905119896
= 1 then the following conditionsmust be satisfied
119896 ge 119864119905
119872119905+ 119896 le 119871
119905
(13)
And if 119910119889119896
= 1 then the following conditions must besatisfied
119896 ge 119864119889
119872119889+ 119896 le 119871
119889
(14)
Because of the limitation of manpower required to serveunits the following conditions must be satisfied
119892
sum119905=1
MANE119905sdot 119909119905119896
le TCE forall119896 isin 119879
119892
sum119889=1
MANW119889sdot 119910119889119896
le TCW forall119896 isin 119879
(15)
Conditions (15) state that no more than the available numberof manpower is dedicated
If one value of gene 119896 violates one of the previous con-ditions then further action to address this situation shouldbe taken The operation is carried out by exchanging thevalue of gene 119896
1015840 with the opposite offspring which has thelowest gap (gapl
1198961015840) If the previous conditions are satisfied
then the exchange succeeds otherwise 11989610158401015840 will be selecteduntil satisfying all conditionsThis procedure continues untilan exchange is implemented On the other hand if the trialfailed then the gene value remains unmodified (the sameprocedure is applied in case of distiller 119889) In addition eachoffspring will be evaluated in terms of fitness value If thefitness value is the best so far then it will be stored as the bestchromosome Meantime both offspring will be used in thenext step applying mutation operation to each
44 Mutation Operation The mutation operator plays thenext role in GA The objective of the mutation is to interruptthe two offspring chromosomes slightly by swapping twogene values There are many mutation operators for permu-tation representation see for instance [39 42]
Two mutation operators were applied exchange nodesbetween two chromosomes and swap nodes for one chro-mosome as shown in Figure 9 First exchange nodes areapplied The performance is accomplished by selecting genein offspring 1 with the largest gap then selecting the genein offspring 2 whose gap is the smallest Finally the valuesare exchanged All conditions mentioned in the crossoveroperation must be satisfied If an infeasible solution occursthen swap nodes operation will be applied on the infeasibleoffspring Application of this method is accomplished bysearching for gene in this offspring with lowest gap for
Advances in Operations Research 7
2822461936852194528224619368521945
28224619218536945501932271324482614
2884619368521945
5019322713244222614
Swap nodesExchange nodes
Figure 9 Several common mutation operations
instance gene 1198961015840 in distiller then the gene values will beswapped with gene 119896 where all conditions are satisfied Ifoperation failed the second lowest gap of gene 119896
10158401015840 will beselected and swapped with gene 119896 The process is repeateduntil reaching a feasible solution otherwise the gene value of119896 remains unmodified
Once the mutation is completed fitness value will beevaluated If the produced fitness value is the best then itwill be stored as the best chromosome otherwise it will beignored
These two offspring will be the new two parents for thenext iteration The same procedure explained previously willbe applied and repeated for a number of ItIn iterationsHowever if these two parents generate the best solution inwhich the solution is improved then iteration will start fromzero and the procedure will carry on for a number of ItIniterations This means that these two chromosomes couldlead to optimality or near optimality
Once iteration has reached ItIn then second new popu-lation will be generated and used in the next iteration of GAThis generational process is repeated for a number of ItOutiterations Overall number of iterations ItAll = ItIn lowast ItOutDuring each successive generation best fitness solution willbe stored deleting the previous one Figure 10 illustrates allGA operation
5 Computational Study andNumerical Results
51 Description of the Test Study TheGAalgorithmdescribedabove was coded in VB6 and can be run on Intel Core 2 Duo250GHz CPU To test the model described a representativeexample is used to compare three Kuwaiti cogenerationplants Each plant has seven units where each unit consistsof two pieces of equipment boiler-turbine (capacity 150MW)and distiller (capacity 10MGID) The time-horizon is 52weeks (one year)
The aim of this experiment is to search for the best fitnessvalue which means maximizing the availability number ofoperational units in each plant
The input data for the model is as follows maintenancewindow it is assumed that the earliest starting time formain-tenance is in week one (119864
119905= 1) while the latest starting time
for maintenance is in week 52 (119871119905= 52) The maintenance
duration is taken to be between 2 and 4 weeks depending onthe unit typeThe resource andmaintenance crew constraints
are kept constant The demand is taken from the StatisticalYear Book Ministry of Energy Figure 11 illustrates two inputdemands the first one is the electrical consumption inmegawatts (MW) while the second is the water consumptionin million imperial gallons per day (MIGD) The maximumtotal generator capacity is 3150MW and the maximum totaldistiller capacity is 210 MIGD
52 Numerical Results The performance of GA is imple-mented by exploring the quality of fitness value (lowerstandard deviation) in terms of the neighborhood size (NB)for each crossover operator As mentioned previously twotypes of crossover operators were implemented 2-point and4-point So the algorithm was run two times Neighborhoodsize NB for each was tested as percentage of chromosomesize The percentages are 10 20 30 40 50 and afixable NB size in the range [10 50] Therefore a set ofsix runs for each NB size was performed Additionally sevendifferent iterations ItIn (10 20 30 40 50 60 and 100) wereconsidered The total number of iterations (ItAll) is fixed to60000 iterations where ItAll = ItIn lowast ItOut this means ifItIn = 20 then ItOut = 3000 Moreover to see the effectof the search space the algorithm was run three times foreach population size NM (100 250 and 500) No furtherimprovement was observed with NM gt 500 Thus the totalnumber of problems tested is equal to 126 (six runs for eachNB size seven different iterations ItIn and three times foreach population size NM)
A clear picture of the interactive effects of two typescrossover operator inner iteration (ItIn) size of Neighbor-hood (NB) Portion of 16 chromosome and population size(NM) is given in Table 1
There are two types of experiments 2-point and 4-pointcrossover operators In each experiment investigation to testthe relationship between the number of iterations (ItIn)size of population (NM) and size of NB was implementedTable 1 shows the results obtained using the two methods ofcrossover operators for each Electricity plants and Distillerplants First column represents the three different populationsizes NM neighborhood while the second column shows thesix neighborhood size NB Due to limitation of this tableonly best solution obtained using one of the seven ItIn (1020 30 40 50 60 and 100) was illustrated in column 3 whilecolumn 4 represents the best fitness Computation time foreach experiment is illustrated in column 5 Next columns arethe same of columns 3 4 and 5
Since the standard deviation (fitness value)measures howfar the numbers are from their average it is obvious that mostof the fitness values (best solution) are small in electricity thefitness value lies between 97639 and 105849 while in waterthe fitness value is between 3978 and 4441The best solutionfor electricity is equal to 97639 which can be obtained using4-point crossover with NM = 250 (size of population) NB =
10 (neighborhood size) and ItIn = 60 (number of inneriterations) where the solution time is 107 sec Meantimethe best solution for water is equal to 3978 which can beobtained using either NM = 250 NB size = 10 and ItIn =
60 with solution time 90min or NM = 500 NB size = 10
8 Advances in Operations Research
Yes
Fitness evaluation of offspring 1offspring 2
No
Yes Best fitnessso far
Store fitness value
Apply mutation
Fitness evaluation of each chromosomein the population
Selectparent 1 and parent 2
Apply crossover
Fitness evaluation of offspring 1offspring 2
Start generation
Yes
No
Best fitnessso far
YesNo
Stop
Store fitness value
No
N = 0M = 0
N = 0
Create random population of size NM
N = N+ 1
M = M+ 1
Parent 1 = offspring 1
Parent 2 = offspring 2
M = ItOut
N = ItIn
Figure 10 The flow chart of genetic algorithm operation
0
20
40
60
80
100
0
500
1000
1500
1 4 7 10 13 16 19 22 25 28 31 34 37 40 43 46 49 52
Wat
er d
eman
d M
GID
Elec
tric
ity d
eman
d (M
W)
Time (weeks)
ElectricityWater
Figure 11 Input demand for the model
and ItIn = 50 with solution time 78 sec Both are obtainedusing 4-point crossover
It is obvious from this result that using 4-point crossoverwith NM = 250 NB size = 10 and ItIn = 60 generatesslightly best fitness value for both electricity and water unitsThe small value of standard deviation indicates the gapsbetween the demand and the available production are close tothe average which means that there is a sufficient productionin any period in case of any breakdown occurred
Figure 12 illustrates the available MW and the demandMW in each period of planning horizon (in week) AlsoFigure 12 illustrates the number of units on maintenance
0
5
10
15
20
0500
100015002000250030003500
1 4 7 10 13 16 19 22 25 28 31 34 37 40 43 46 49 52
Num
ber o
f uni
ts
(MW
)
Weeks
Generator units on maintenanceElectricity demandAvailable MW
Figure 12 Unit system output loads and gross reserves for 21 units
for each week during planning horizon Figure 13 illustratesthe same as Figure 12 but for water (MGID) It is clearmdashforFigures 12 and 13mdashthat when there is increasing demandthere are fewer units taken for maintenance provided that thedemand constrains are satisfied On the other hand whena generator is under maintenance there is a decline in thetotal generator The same thing is for water when distilleris under maintenance there is a decline in the total distillercapacity Table 2 illustrates the generator and distiller capacitybeing maintained for each week All constraints are satisfiedthe table shows that when any preventive maintenance taskstarts it continues until it completes its duration hence
Advances in Operations Research 9
Table 1 Summary results of the computational experiments
Plant type Electricitylowast (ave = 197404) Waterlowastlowast (avw = 11831)Crossover operator 2-point 4-point 2-point 4-point
NM NB size ItIn Bestsolutionlowastlowastlowast
CPU ItIn Bestsolution
CPU ItIn Bestsolution
CPU ItIn Bestsolution
CPU
100
10 60 101334 118 10 100401 93 20 407 108 50 398 8720 100 101305 71 10 102518 119 10 407 83 40 407 7530 40 105403 153 10 101624 79 20 4348 111 40 4348 7940 50 104281 75 100 10266 67 100 4206 80 60 425 5750 10 104422 112 30 104591 145 40 4116 74 100 4348 106Rnd 20 104422 83 30 10363 83 40 4206 73 30 4116 74
250
10 10 99489 123 60 97639 107 20 4024 72 60 3978 9020 40 101131 124 20 103403 83 10 4217 102 50 4348 7630 60 105793 85 50 102804 133 10 4161 147 30 4206 7540 20 10116 145 100 10084 147 50 4348 79 20 4261 8250 30 104309 112 40 101769 115 60 4307 180 40 4024 123Rnd 60 105849 87 20 102518 150 60 4217 120 60 4441 91
500
10 10 102288 119 100 101827 114 40 4024 139 50 3978 7820 40 1038 98 100 101595 82 10 4345 164 50 407 8030 20 10223 147 100 101335 81 40 4024 131 60 4206 8440 30 10266 107 20 104984 88 60 4348 87 100 439 7550 50 103772 82 10 102058 129 30 4426 201 10 4305 122Rnd 40 105292 98 100 103061 71 30 4116 105 40 4116 94
lowastThe gap average of electricity = 197404lowastlowastThe gap average of water = 11831lowastlowastlowastBest solution is related to fitness valueCPU in seconds
0
5
10
15
20
050
100150200250
1 4 7 10 13 16 19 22 25 28 31 34 37 40 43 46 49 52
Num
ber o
f uni
ts
MG
ID
Weeks
Distiller units on maintenanceWater demandAvailable MGID
Figure 13 Distiller unit system output loads and gross reserves for21 units
satisfying the maintenance completion duration constraintsCrew constraints are kept constant when these constraintsare tightened then the final schedule for the preventivemaintenance tasks will change
Since the temperature in Kuwait is very high in summerthis requires enormous consumption of electricity due to theneed for air conditioners while the opposite is in winterand this explains why most of the scheduling of preventive
0
5
10
15
20
0500
100015002000250030003500
1 4 7 10 13 16 19 22 25 28 31 34 37 40 43 46 49 52
Num
ber o
f uni
ts
MW
Weeks
Generator units in maintenanceElectricity demandAvailable MW
Figure 14 Generator unit system output loads and gross reservesfor 21 units with 20 percent increase in demand
maintenance is in the winter as in Table 2 Meanwhile thesame reason applies on water preventive maintenance
Sensitivity analysis was implemented on the model pro-posed to evaluate its robustness and to observe the impactwhen the demand is increased The model proposed wasrun again with increasing by 20 per cent of the electricityand water demand Figure 14 shows that when the demand
10 Advances in Operations Research
Table 2 Maintenance schedules for 21 units of electricity and 21units of water
Week numberGenerating units scheduled for maintenance
Electricity Water1 14 16 2 13 152 14 16 2 13 153 4 7 12 13 154 4 7 10 6 125 7 10 12 6 10 216 7 10 12 8 10 217 12 19 3 8 178 12 17 19 3 8 179 9 17 710 9 17 711 2 3 1412 2 3 1413 2 1414 2 515 15 516 15 517 mdash mdash18 mdash mdash19 mdash mdash20 mdash mdash21 mdash mdash22 mdash mdash23 mdash mdash24 mdash mdash25 mdash mdash26 mdash mdash27 mdash mdash28 mdash mdash29 mdash mdash30 mdash mdash31 mdash mdash32 mdash mdash33 mdash 2034 mdash 2035 mdash 2036 mdash 2037 mdash mdash38 mdash mdash39 mdash mdash40 mdash mdash41 1 18 1842 1 18 1843 8 11 1 944 8 11 1 9
Table 2 Continued
Week numberGenerating units scheduled for maintenance
Electricity Water45 5 11 20 146 5 20 1 1147 5 13 4 1148 5 13 4 1149 6 21 16 1950 6 21 16 1951 6 21 1952 6 21 19
0
5
10
15
20
050
100150200250
1 4 7 10 13 16 19 22 25 28 31 34 37 40 43 46 49 52
MG
IDWeeks
Distiller units on maintenanceWater demandAvailable MGID
Figure 15 Distiller unit system output loads and gross reserves for21 units with 20 percent increase in demand
for electricity increases the gap between the total availablecapacity and the demand curve reducesThe same thing is forwater illustrated in Figure 15 it shows that when the demandfor water increases the gap between the total availablecapacity and the demand curve reduces Thus the geneticalgorithm proposed offers a promising viable approach forthe MS of generators and distillers
6 Conclusion
This paper proposed a GA method for solving the mainte-nance scheduling (MS) problem for cogeneration plants Theproposed approach was modeled to generate two preventingmaintenance schedules one for electricity and the otherfor water distiller Two types of crossover operators wereadopted 2-point and 4-point The objective function of themodel is to maximize the available number of operationalunits in each plantThe results obtainedwere very close to thesolution quality where 4-point slightly produces better solu-tion than 2-point ones for both electricity and water distillerGenetic operators have been designed to incorporate furtherinvestigation in specific space before diversify to search inanother solution space The model has demonstrated thatGA is a powerful technique for modeling the cogenerationplants preventing maintenance schedules Moreover thisapproach can be applied to any problem with any numberof plants with any number of units Meantime user canreach better solution if heshe increases number of iterations
Advances in Operations Research 11
The numerical analysis shows that genetic algorithm mayhopefully be a new approach for kinds of difficult-to-solveproblems
For a future work it is possible to extend the objectivefunction to include the cost for the maintenance and theproduction of the units using an optimal approach (exactsolution) The methodology implemented will first generateall feasible schedules then select the optimal solution using anoptimal approach such as integer programming (IP) whereall constraints are satisfied
Conflict of Interests
The authors declare that there is no conflict of interestsregarding the publication of this paper
References
[1] M Alardhi R G Hannam and A W Labib ldquoPreventive main-tenance scheduling for multi-cogeneration plants with produc-tion constraintsrdquo Journal of Quality inMaintenance Engineeringvol 13 no 3 pp 276ndash292 2007
[2] A M El-nashar and M S Khan ldquoEconomic scheduling of theUAN cogeneration plant a preliminary optimization studyrdquoDesalination vol 85 no 1 pp 93ndash127 1991
[3] M Y El-Sharkh R Yasser and A A El-Keib ldquoOptimal main-tenance scheduling for power generation systemsmdasha literaturereviewrdquo in Proceeding of theMaintenance and Reliability Confer-ence Knoxville Tenn USA 1998
[4] K Wangnick IDA Worldwide Desalting Plants Inventory Pro-duced by Wangnick Consulting for the International Desalina-tion Association Gnarrenburg Germany 2002
[5] C Zhao and H Tang ldquoA note to due-window assignment andsingle machine scheduling with deteriorating jobs and a rate-modifying activityrdquoComputers andOperations Research vol 39no 6 pp 1300ndash1303 2012
[6] C M Joo and B S Kim ldquoGenetic algorithms for singlemachine scheduling with time-dependent deterioration andrate-modifying activitiesrdquo Expert Systems with Applications vol40 no 8 pp 3036ndash3043 2013
[7] V S Gordon and A A Tarasevich ldquoA note common due dateassignment for a single machine scheduling with the rate-modifying activityrdquoComputers andOperations Research vol 36no 2 pp 325ndash328 2009
[8] C-Y Lee and V J Leon ldquoMachine scheduling with a rate-modifying activityrdquo European Journal of Operational Researchvol 128 no 1 pp 119ndash128 2001
[9] M Ben-Daya S O Duffuaa and Abdul Raouf MaintenanceModeling and Optimization Kluwer Academic Publishers2000
[10] Z A Yamayee ldquoMaintenance scheduling description literaturesurvey and interface with overall operations schedulingrdquo IEEETransactions on Power Apparatus and Systems vol 101 no 8 pp2770ndash2779 1982
[11] H H Zuern and V H Quintana ldquoGenerator maintenancescheduling via successive approximations dynamic program-mingrdquo IEEE Transactions on Power Apparatus and Systems vol94 no 2 pp 665ndash671 1975
[12] R Dekker and P A Scarf ldquoOn the impact of optimisationmodels in maintenance decision making the state of the artrdquo
Reliability Engineering and System Safety vol 60 no 2 pp 111ndash119 1998
[13] Y S Sherif ldquoReliability analysis optimal inspection andmainte-nance schedules of failing systemsrdquoMicroelectronics Reliabilityvol 22 no 1 pp 59ndash115 1982
[14] C Valdez-Flores ldquoSurvey of preventivemaintenancemodels forstochastically deteriorating single-unit systemsrdquoNaval ResearchLogistics vol 36 no 4 pp 419ndash446 1989
[15] T Aven and R Dekker ldquoA useful framework for optimalreplacement modelsrdquo Reliability Engineering and System Safetyvol 58 no 1 pp 61ndash67 1997
[16] R Dekker ldquoIntegrating optimisation priority setting planningand combining of maintenance activitiesrdquo European Journal ofOperational Research vol 82 no 2 pp 225ndash240 1995
[17] L M Pintelon and L F Gelders ldquoMaintenance managementdecision makingrdquo European Journal of Operational Researchvol 58 no 3 pp 301ndash317 1992
[18] R Dekker ldquoApplications of maintenance optimization modelsa review and analysisrdquoReliability Engineering and System Safetyvol 51 no 3 pp 229ndash240 1996
[19] P A Scarf ldquoOn the application of mathematical models inmaintenancerdquo European Journal of Operational Research vol99 no 3 pp 493ndash506 1997
[20] British Standards InstitutionGlossary of General Terms Used inMaintenance Organization 1984
[21] M L Baughman N A Eisner and P S Merrill ldquoOptimizingcombined cogeneration and thermal storage systems an engi-neering economics approachrdquo IEEE Transactions on PowerSystems vol 4 no 3 pp 974ndash980 1989
[22] M F J Bos R J L Beune andRAM vanAmerongen ldquoOn theincorporation of a heat storage device in Lagrangian Relaxationbased algorithms for unit commitmentrdquo International Journal ofElectrical Power and Energy Systems vol 18 no 4 pp 207ndash2141996
[23] H B Puttgen and P R MacGregor ldquoOptimum scheduling pro-cedure for cogenerating small power producing facilitiesrdquo IEEETransactions on Power Systems vol 4 no 3 pp 957ndash964 1989
[24] A K Coleman ldquoOptimization of a single effect multi-stageflash distillation desalination systemrdquo Desalination vol 9 no4 pp 315ndash331 1971
[25] K Moslehi M Khadem R Bernal and G Hernandez ldquoOpti-mization of multiplant cogeneration system operation includ-ing electric and steam networksrdquo IEEE Transactions on PowerSystems vol 6 no 2 pp 484ndash490 1991
[26] J FDopazo andHMMerrill ldquoOptimal generatormaintenancescheduling using integer programmingrdquo IEEE Transactions onPower Apparatus and Systems vol 94 no 5 pp 1537ndash1545 1975
[27] K W Edwin and F Curtius ldquoNew maintenance-schedulingmethod with production cost minimization via integer linearprogrammingrdquo International Journal of Electrical Power andEnergy Systems vol 12 no 3 pp 165ndash170 1990
[28] S P Canto ldquoApplication of Bendersrsquo decomposition to powerplant preventive maintenance schedulingrdquo European Journal ofOperational Research vol 184 no 2 pp 759ndash777 2008
[29] K S Moghaddam and J S Usher ldquoPreventive maintenance andreplacement scheduling for repairable and maintainable sys-tems using dynamic programmingrdquo Computers and IndustrialEngineering vol 60 no 4 pp 654ndash665 2011
[30] K SMoghaddam and J S Usher ldquoSensitivity analysis and com-parison of algorithms in preventive maintenance and replace-ment scheduling optimization modelsrdquo Computers amp IndustrialEngineering vol 61 no 1 pp 64ndash75 2011
12 Advances in Operations Research
[31] I El-Amin S Duffuaa and M Abbas ldquoTabu search algorithmfor maintenance scheduling of generating unitsrdquo Electric PowerSystems Research vol 54 no 2 pp 91ndash99 2000
[32] J T Saraiva M L Pereira V T Mendes and J C SousaldquoA Simulated Annealing based approach to solve the genera-tor maintenance scheduling problemrdquo Electric Power SystemsResearch vol 81 no 7 pp 1283ndash1291 2011
[33] K Al-Hamad M Al-Ibrahim and E Al-Enezy ldquoA geneticalgorithm for ship routing and scheduling problem with timewindowrdquo American Journal of Operations Research vol 2 no 3pp 417ndash429 2012
[34] T-K Liu J-T Tsai and J-H Chou ldquoImproved genetic algo-rithm for the job-shop scheduling problemrdquo The InternationalJournal of AdvancedManufacturing Technology vol 27 no 9-10pp 1021ndash1029 2006
[35] httpwaterwebsterorgDesalinationhtm[36] KWangnick IDAWorldwideDesalting Plants InventoryWang-
nick Consulting for the International Desalination AssociationGnarrenburg Germany 1990
[37] MEW Statistical Year Book Kuwait Ministry of Electricity Stateof Kuwait 2010
[38] M Gen and R Cheng Genetic Algorithms and EngineeringDesign John Wiley amp Sons New York NY USA 1997
[39] J Berger and M Barkaoui ldquoA parallel hybrid genetic algorithmfor the vehicle routing problemwith time windowsrdquoComputersamp Operations Research vol 31 no 12 pp 2037ndash2053 2004
[40] C Prins ldquoA simple and effective evolutionary algorithm for thevehicle routing problemrdquo Computers amp Operations Researchvol 31 no 12 pp 1985ndash2002 2004
[41] B M Baker and M A Ayechew ldquoA genetic algorithm for thevehicle routing problemrdquo Computers and Operations Researchvol 30 no 5 pp 787ndash800 2003
[42] H-S Hwang ldquoAn improved model for vehicle routing problemwith time constraint based on genetic algorithmrdquo Computers ampIndustrial Engineering vol 42 no 2ndash4 pp 361ndash369 2002
Submit your manuscripts athttpwwwhindawicom
Hindawi Publishing Corporationhttpwwwhindawicom Volume 2014
MathematicsJournal of
Hindawi Publishing Corporationhttpwwwhindawicom Volume 2014
Mathematical Problems in Engineering
Hindawi Publishing Corporationhttpwwwhindawicom
Differential EquationsInternational Journal of
Volume 2014
Applied MathematicsJournal of
Hindawi Publishing Corporationhttpwwwhindawicom Volume 2014
Probability and StatisticsHindawi Publishing Corporationhttpwwwhindawicom Volume 2014
Journal of
Hindawi Publishing Corporationhttpwwwhindawicom Volume 2014
Mathematical PhysicsAdvances in
Complex AnalysisJournal of
Hindawi Publishing Corporationhttpwwwhindawicom Volume 2014
OptimizationJournal of
Hindawi Publishing Corporationhttpwwwhindawicom Volume 2014
CombinatoricsHindawi Publishing Corporationhttpwwwhindawicom Volume 2014
International Journal of
Hindawi Publishing Corporationhttpwwwhindawicom Volume 2014
Operations ResearchAdvances in
Journal of
Hindawi Publishing Corporationhttpwwwhindawicom Volume 2014
Function Spaces
Abstract and Applied AnalysisHindawi Publishing Corporationhttpwwwhindawicom Volume 2014
International Journal of Mathematics and Mathematical Sciences
Hindawi Publishing Corporationhttpwwwhindawicom Volume 2014
The Scientific World JournalHindawi Publishing Corporation httpwwwhindawicom Volume 2014
Hindawi Publishing Corporationhttpwwwhindawicom Volume 2014
Algebra
Discrete Dynamics in Nature and Society
Hindawi Publishing Corporationhttpwwwhindawicom Volume 2014
Hindawi Publishing Corporationhttpwwwhindawicom Volume 2014
Decision SciencesAdvances in
Discrete MathematicsJournal of
Hindawi Publishing Corporationhttpwwwhindawicom
Volume 2014 Hindawi Publishing Corporationhttpwwwhindawicom Volume 2014
Stochastic AnalysisInternational Journal of
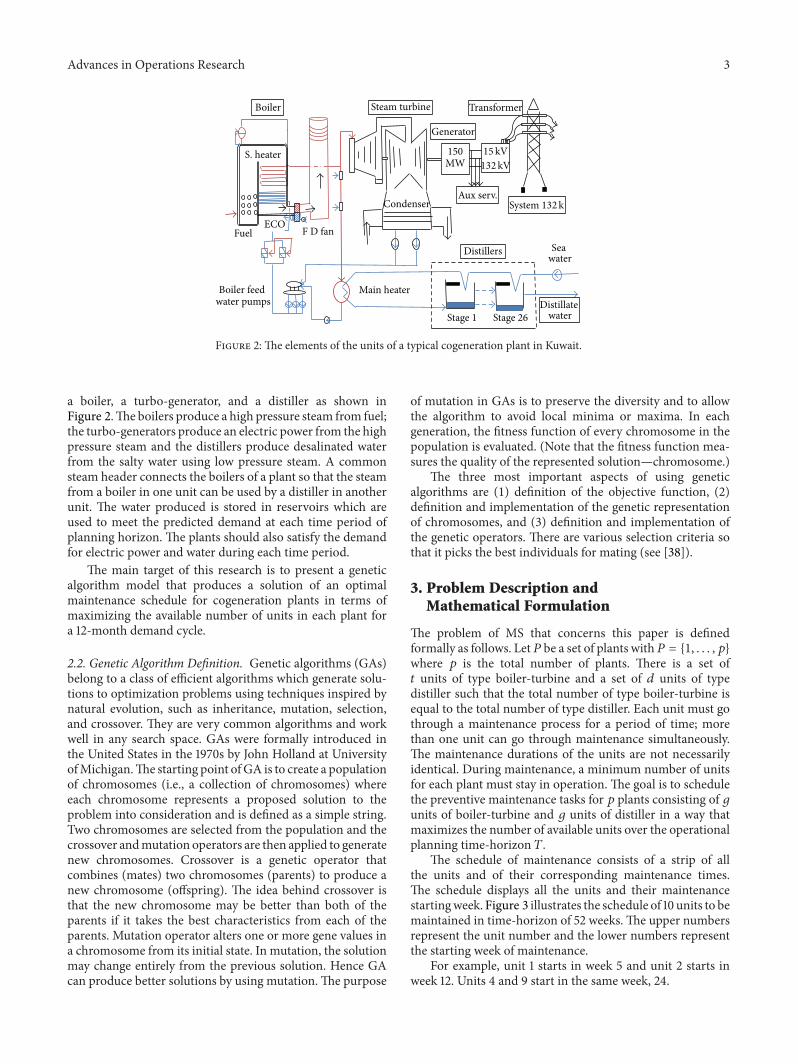
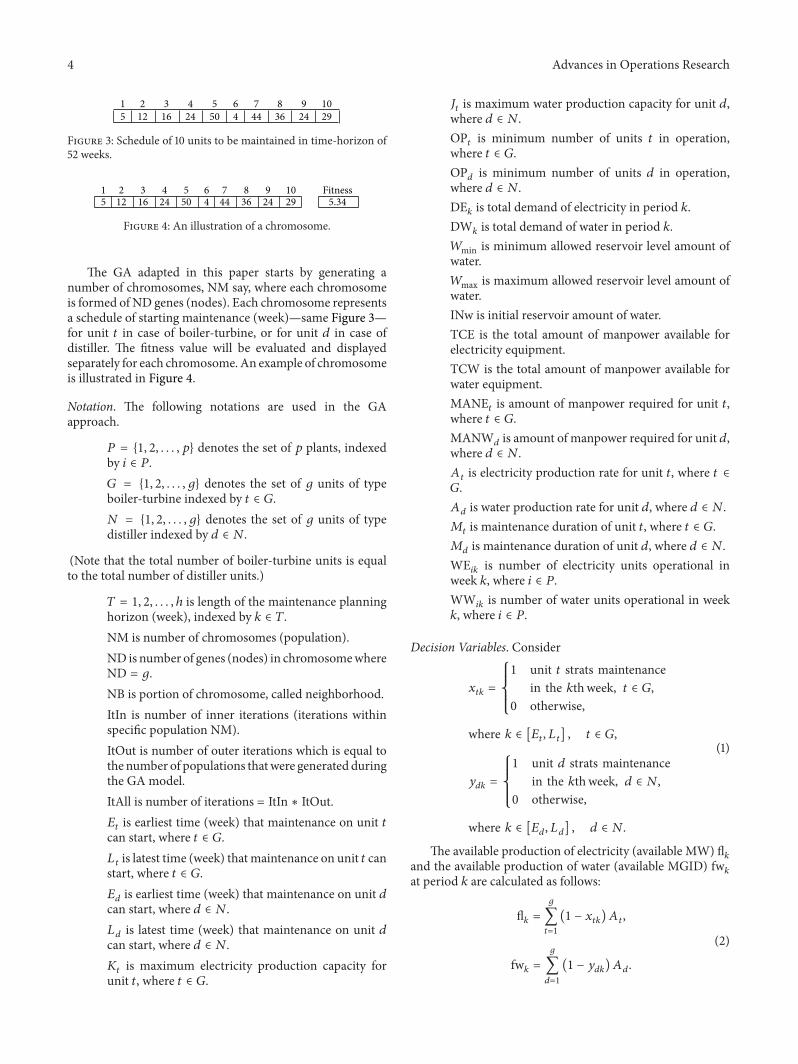
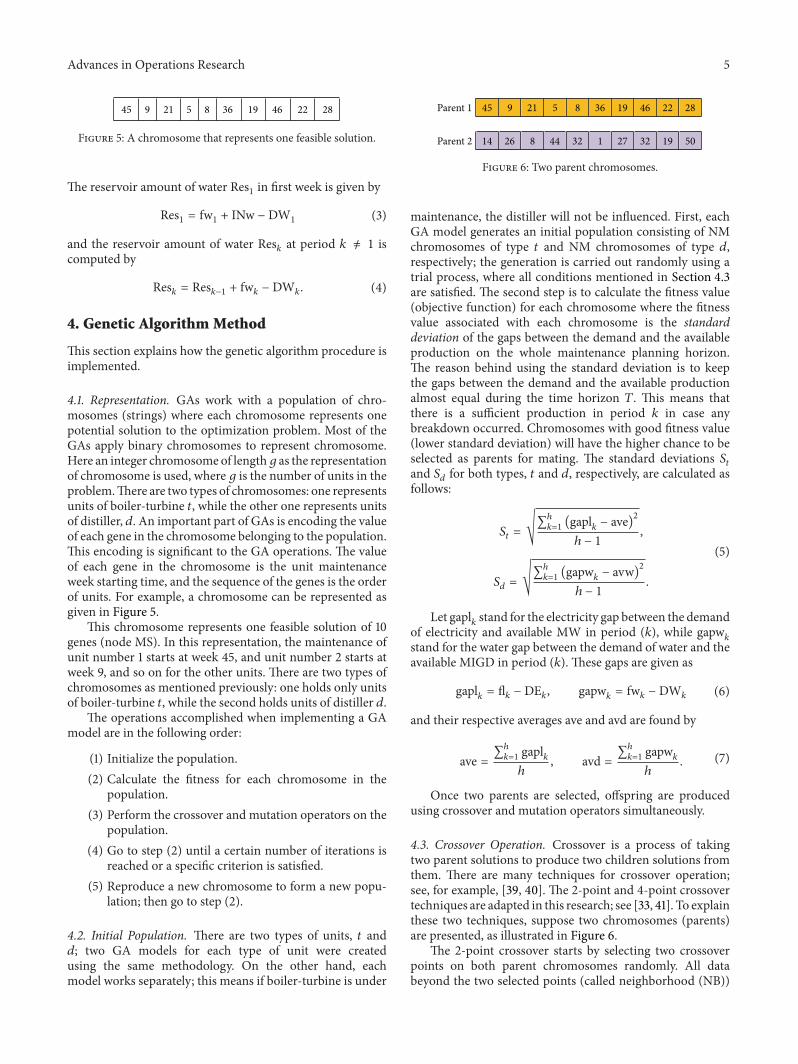
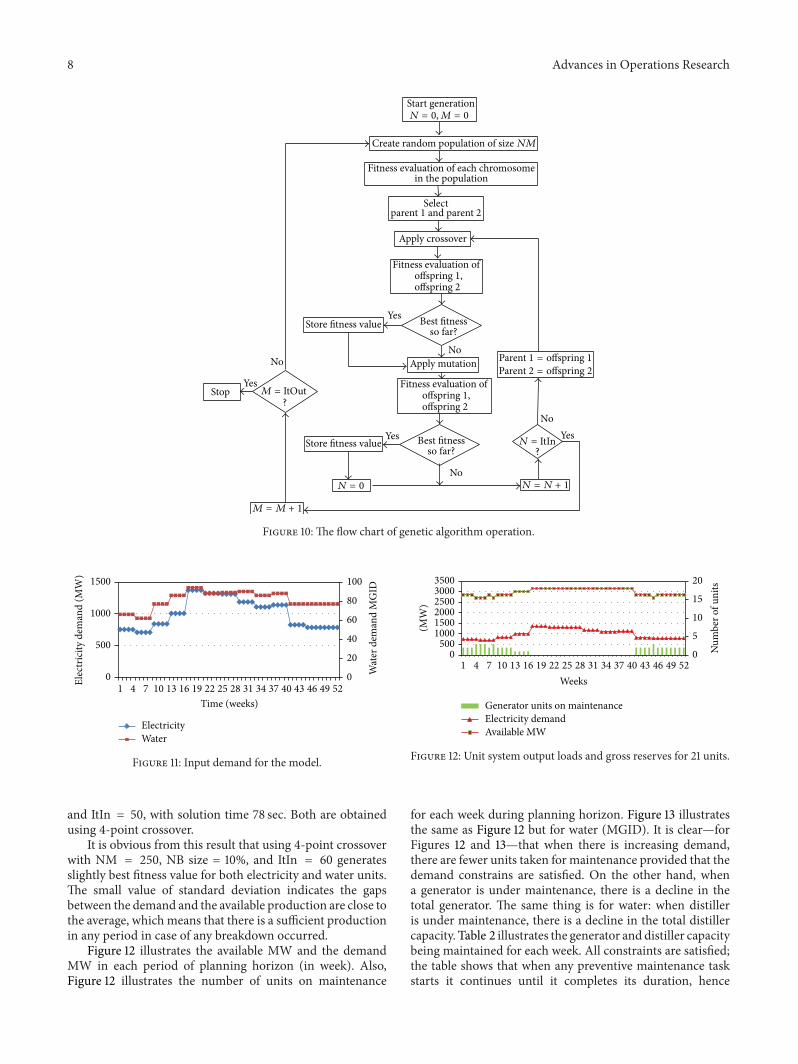
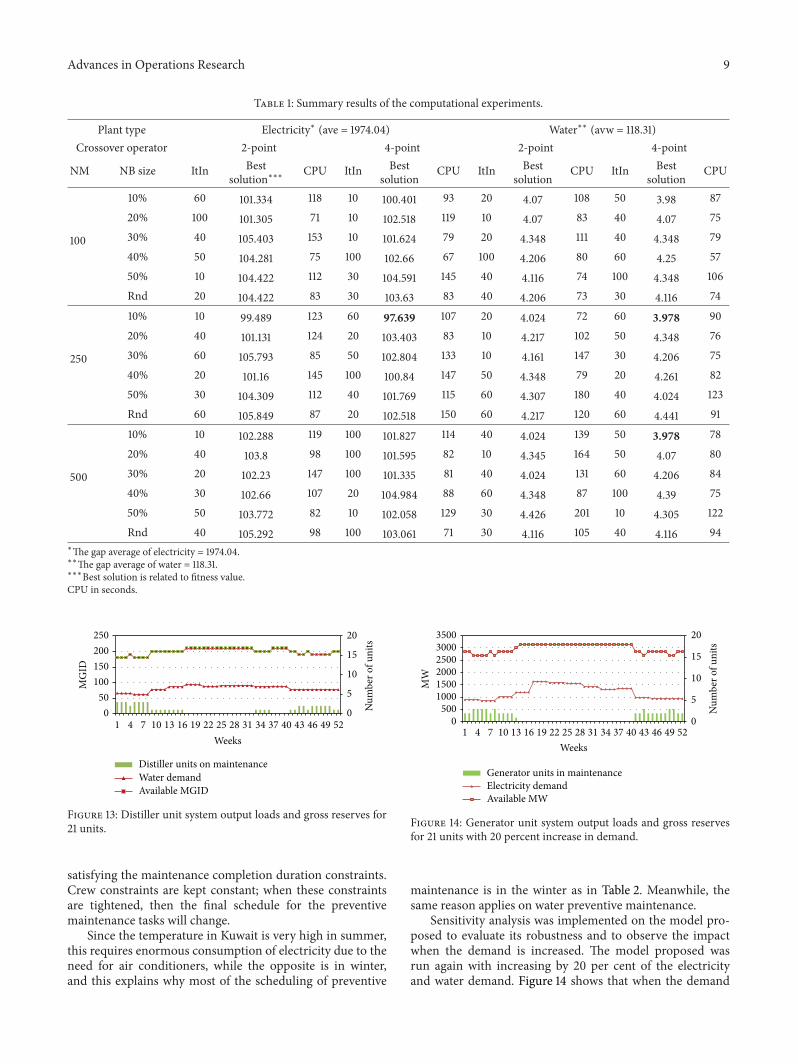
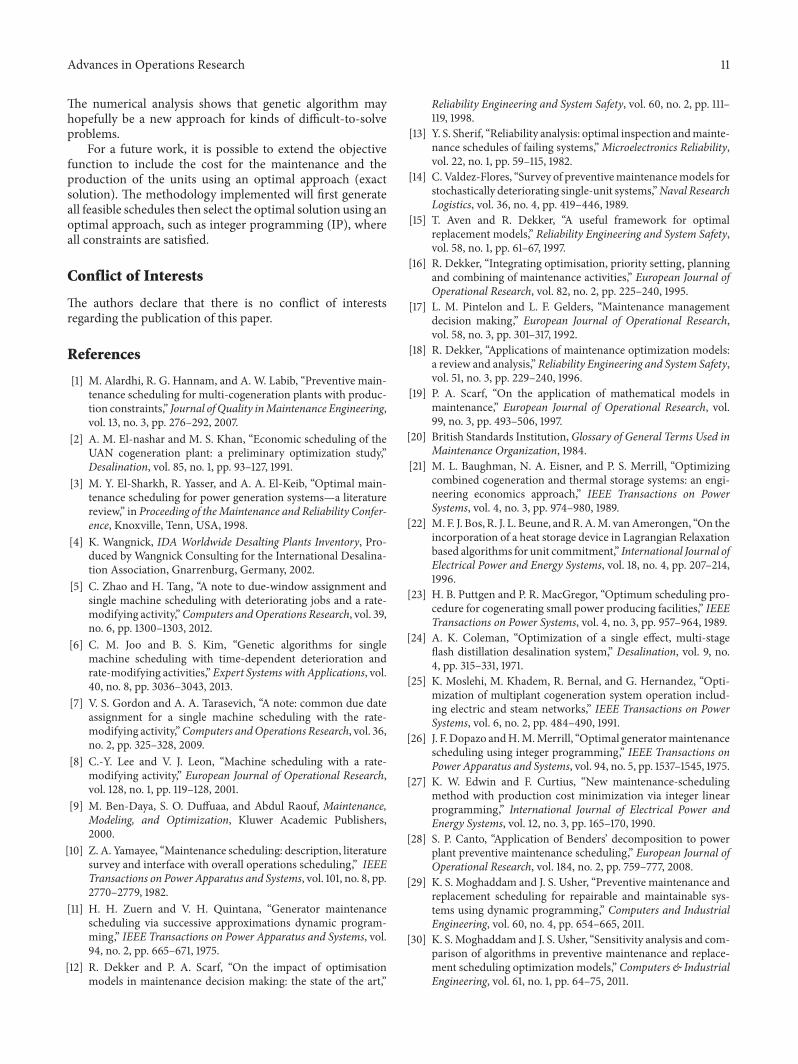