Research Article Mutation-Specific Phenotypes in hiPSC ...
17
Research Article Mutation-Specific Phenotypes in hiPSC-Derived Cardiomyocytes Carrying Either Myosin-Binding Protein C Or -Tropomyosin Mutation for Hypertrophic Cardiomyopathy Marisa Ojala, 1 Chandra Prajapati, 1 Risto-Pekka Pölönen, 1 Kristiina Rajala, 1 Mari Pekkanen-Mattila, 1 Jyrki Rasku, 2 Kim Larsson, 1 and Katriina Aalto-Setälä 1,3,4 1 BioMediTech, University of Tampere, 33014 Tampere, Finland 2 School of Information Sciences, University of Tampere, 33014 Tampere, Finland 3 Medical School, University of Tampere, 33014 Tampere, Finland 4 Heart Hospital, Tampere University Hospital, 33521 Tampere, Finland Correspondence should be addressed to Katriina Aalto-Set¨ al¨ a; katriina.aalto-setala@uta.fi Received 21 May 2015; Revised 22 July 2015; Accepted 20 September 2015 Academic Editor: Farah Sheikh Copyright © 2016 Marisa Ojala et al. is is an open access article distributed under the Creative Commons Attribution License, which permits unrestricted use, distribution, and reproduction in any medium, provided the original work is properly cited. Hypertrophic cardiomyopathy (HCM) is a genetic cardiac disease, which affects the structure of heart muscle tissue. e clinical symptoms include arrhythmias, progressive heart failure, and even sudden cardiac death but the mutation carrier can also be totally asymptomatic. To date, over 1400 mutations have been linked to HCM, mostly in genes encoding for sarcomeric proteins. However, the pathophysiological mechanisms of the disease are still largely unknown. Two founder mutations for HCM in Finland are located in myosin-binding protein C (MYBPC3-Gln1061X) and -tropomyosin (TPM1-Asp175Asn) genes. We studied the properties of HCM cardiomyocytes (CMs) derived from patient-specific human induced pluripotent stem cells (hiPSCs) carrying either MYBPC3-Gln1061X or TPM1-Asp175Asn mutation. Both types of HCM-CMs displayed pathological phenotype of HCM but, more importantly, we found differences between CMs carrying either MYBPC3-Gln1061X or TPM1-Asp175Asn gene mutation in their cellular size, Ca 2+ handling, and electrophysiological properties, as well as their gene expression profiles. ese findings suggest that even though the clinical phenotypes of the patients carrying either MYBPC3-Gln1061X or TPM1-Asp175Asn gene mutation are similar, the genetic background as well as the functional properties on the cellular level might be different, indicating that the pathophysiological mechanisms behind the two mutations would be divergent as well. 1. Introduction Hypertrophic cardiomyopathy (HCM) is one of the most common genetic cardiac diseases with worldwide prevalence of 1 : 500, as well as the most common cause of sudden cardiac death (SCD) among young competing athletes. HCM is inherited in an autosomal dominant pattern. Nevertheless, a large clinical diversity and age-related penetrance are typical for HCM. On the tissue level, HCM is characterized by the disarray of cardiomyocytes (CMs) and fibrosis of cardiac tissue, as well as thickened interventricular septum or free leſt ventricular wall. Clinical symptoms include arrhythmias, progressive heart failure, and even SCD, but on the other hand the mutation carrier can be completely asymptomatic. Altogether more than 1400 mutations in 11 genes encoding for the sarcomeric proteins have been identified and related to HCM. e majority of the mutations are found either in the -myosin heavy chain (MYH7 ) or in the myosin-binding protein C (MYBPC3) genes [1]. In Finland, two founder mutations located in MYBPC3 and -tropomyosin (TPM1) genes and one common mutation in MYH7 gene together account around 24% of all Finnish HCM cases [2, 3]. Although the genetic information related to HCM has been growing in the recent years due to the development of sequencing technologies, exact information of the disease mechanisms remains unclear. us, current medication of the disease is directed toward the symptom relief and there is no specific therapy to prevent the onset or progression of the Hindawi Publishing Corporation Stem Cells International Volume 2016, Article ID 1684792, 16 pages http://dx.doi.org/10.1155/2016/1684792
Transcript of Research Article Mutation-Specific Phenotypes in hiPSC ...
Research ArticleMutation-Specific Phenotypes in hiPSC-DerivedCardiomyocytes Carrying Either Myosin-Binding Protein C Or𝛼-Tropomyosin Mutation for Hypertrophic Cardiomyopathy
Marisa Ojala,1 Chandra Prajapati,1 Risto-Pekka Pölönen,1 Kristiina Rajala,1
Mari Pekkanen-Mattila,1 Jyrki Rasku,2 Kim Larsson,1 and Katriina Aalto-Setälä1,3,4
1BioMediTech, University of Tampere, 33014 Tampere, Finland2School of Information Sciences, University of Tampere, 33014 Tampere, Finland3Medical School, University of Tampere, 33014 Tampere, Finland4Heart Hospital, Tampere University Hospital, 33521 Tampere, Finland
Correspondence should be addressed to Katriina Aalto-Setala; [email protected]
Received 21 May 2015; Revised 22 July 2015; Accepted 20 September 2015
Academic Editor: Farah Sheikh
Copyright © 2016 Marisa Ojala et al. This is an open access article distributed under the Creative Commons Attribution License,which permits unrestricted use, distribution, and reproduction in any medium, provided the original work is properly cited.
Hypertrophic cardiomyopathy (HCM) is a genetic cardiac disease, which affects the structure of heart muscle tissue. The clinicalsymptoms include arrhythmias, progressive heart failure, and even sudden cardiac death but themutation carrier can also be totallyasymptomatic. To date, over 1400mutations have been linked to HCM,mostly in genes encoding for sarcomeric proteins. However,the pathophysiological mechanisms of the disease are still largely unknown. Two founder mutations for HCM in Finland arelocated inmyosin-binding protein C (MYBPC3-Gln1061X) and𝛼-tropomyosin (TPM1-Asp175Asn) genes.We studied the propertiesof HCM cardiomyocytes (CMs) derived from patient-specific human induced pluripotent stem cells (hiPSCs) carrying eitherMYBPC3-Gln1061X or TPM1-Asp175Asnmutation. Both types of HCM-CMs displayed pathological phenotype of HCM but, moreimportantly, we found differences between CMs carrying either MYBPC3-Gln1061X or TPM1-Asp175Asn gene mutation in theircellular size, Ca2+ handling, and electrophysiological properties, as well as their gene expression profiles. These findings suggestthat even though the clinical phenotypes of the patients carrying either MYBPC3-Gln1061X or TPM1-Asp175Asn gene mutationare similar, the genetic background as well as the functional properties on the cellular level might be different, indicating that thepathophysiological mechanisms behind the two mutations would be divergent as well.
1. Introduction
Hypertrophic cardiomyopathy (HCM) is one of the mostcommon genetic cardiac diseases with worldwide prevalenceof 1 : 500, as well as the most common cause of suddencardiac death (SCD) among young competing athletes. HCMis inherited in an autosomal dominant pattern. Nevertheless,a large clinical diversity and age-related penetrance are typicalfor HCM. On the tissue level, HCM is characterized by thedisarray of cardiomyocytes (CMs) and fibrosis of cardiactissue, as well as thickened interventricular septum or freeleft ventricular wall. Clinical symptoms include arrhythmias,progressive heart failure, and even SCD, but on the otherhand the mutation carrier can be completely asymptomatic.
Altogether more than 1400 mutations in 11 genes encodingfor the sarcomeric proteins have been identified and relatedto HCM. The majority of the mutations are found either inthe 𝛽-myosin heavy chain (MYH7) or in the myosin-bindingprotein C (MYBPC3) genes [1]. In Finland, two foundermutations located in MYBPC3 and 𝛼-tropomyosin (TPM1)genes and one common mutation in MYH7 gene togetheraccount around 24% of all Finnish HCM cases [2, 3].
Although the genetic information related to HCM hasbeen growing in the recent years due to the developmentof sequencing technologies, exact information of the diseasemechanisms remains unclear.Thus, currentmedication of thedisease is directed toward the symptom relief and there is nospecific therapy to prevent the onset or progression of the
Hindawi Publishing CorporationStem Cells InternationalVolume 2016, Article ID 1684792, 16 pageshttp://dx.doi.org/10.1155/2016/1684792

2 Stem Cells International
disease [1]. Most of the HCM studies have been conductedwith model systems, mainly either with transgenic mice orby studying human tissues obtained from surgical myectomyfrom end-stage HCM patients [4]. However, animal modelscarry only the mutated gene lacking the rest of the genomeand myectomy samples are obtained from patients in the latestage of HCM development. Therefore, the discovery of thehuman induced pluripotent stem cells (hiPSCs) has offered anew valuable tool to model HCM and other cardiac diseasesand to study the underlying disease mechanisms [5]. To date,hiPSCs have already been used to model a variety of cardiacdiseases: electrical defects, for example, long-QT syndrome[6–8] and catecholaminergic polymorphic ventricular tachy-cardia (CPVT) [9, 10] as well as cardiomyopathies includingdilated cardiomyopathy (DCM) [11] and HCM [12–14].
Here we have derived hiPSCs from patients carrying twoof the Finnish HCM founder mutations either in MYBPC3(MYBPC3-Gln1061X) or in TPM1 (TPM1-Asp175Asn) gene.We have differentiated the patient-specific hiPSCs into CMsand compared the phenotypes of the diseased and controlCMs.
2. Materials and Methods
2.1. Ethical Issues. This study was conducted in accordancewith the Ethics Committee of Pirkanmaa Hospital Districtto establish, culture, and differentiate hiPSC lines (R08070).Skin biopsies for hiPSC establishment were received fromthe Heart Hospital, Tampere University Hospital, Tam-pere, Finland. Patients donating skin biopsies signed aninformed consent after receiving both oral and writtendescriptions of the study. The teratoma assay, described inSection 2.3.6, was approved by ELLA-Animal ExperimentBoard of Regional State Administrative Agency for SouthernFinland (ESAVI/6543/04.10.03/2011).
2.2. Generation and Culture of Patient-Specific hiPSC Lines.hiPSC lines were generated from skin’s fibroblasts either withSendai reprogramming vectors OCT4, KLF4, c-MYC, andSOX2 using CytoTune-iPS Reprogramming Kit (Life Tech-nologies Ltd., Paisley, UK) according to the manufacturer’sinstructions or by using pMX retroviral vectorsOCT4,KLF4,c-MYC, and SOX2with or without Cre-LoxP site as describedearlier [6, 15]. UTA.13602.HCMT, UTA.02912.HCMT, andUTA.04511.WT hiPSC lines were generated by using Sendaivectors and UTA.07801.HCMM and UTA.06108.HCMMby using pMX retroviral vectors with Cre-LoxP site andUTA.04602.WT was generated by using pMX retroviralvectors without Cre-LoxP site. In the present study, oneline of each patient was used. hiPSC lines were derived andcultured on mouse embryonic fibroblast (MEF) feeder celllayers (26000 cells/cm2, CellSystems Biotechnologie VertriebGmbH, Troisdorf, Germany) in human pluripotent stem cell(hPSC) culture medium consisting of knockout-DMEM (ko-DMEM, Gibco, Life Technologies Ltd.) supplemented with20% knockout serum replacement (ko-SR, Gibco, Life Tech-nologies Ltd.), 1% nonessential amino acids (NEAA, LonzaGroup Ltd., Basel, Switzerland), 2mMGlutaMax (Gibco, Life
Technologies Ltd.), 50U/mL penicillin/streptomycin (LonzaGroup Ltd.), 0.1mM 2-mercaptoethanol (Gibco, Life Tech-nologies Ltd.), and 4 ng/mL basic fibroblast growth factor(bFGF, PeproTech, Rocky Hill, NJ, USA).
2.3. Characterization of hiPSC Lines
2.3.1. Mutation Analysis by Genotyping. DNA samples fromthe hiPSC lines were prepared with TaqMan Sample-to-SNP Kit (Applied Biosystems, Life Technologies Ltd.) andthe presence of MYBPC3-Gln1061X and TPM1-Asp175Asnmutation in the patient-specific hiPSC lines was confirmedby customTaqMan SNPGenotyping Assays (Applied Biosys-tems, Life Technologies Ltd.) according to the manufacturer’sinstructions. In the genotyping assays, MYBPC3-gene aswell as TPM1-gene was amplified with specific primers.Furthermore, the presence of themutationswas assessedwithmutation-specific FAM labeled probes. VIC labeled probeswere used to assess the presence of the wild type allele.Sequences for the primers and probes used in the assay arelisted in Supplementary Table 1 (see Supplementary Materialavailable online at http://dx.doi.org/10.1155/2016/1684792).
2.3.2. The Expression of Mutant and Wild Type Alleles inhiPSC-Derived CMs. RNA samples were collected andextracted from hiPSC-derived CMs (UTA.04511.WT,UTA.02912.HCMT, UTA.07801.HCMM, and UTA.06108.HCMM) with Norgen’s Total RNA Purification Plus Kit(Norgen Biotek Corp., Ontario, Canada) according to manu-facturer’s instructions. 50–100 ng of RNA was transcribed tocDNA by High-Capacity cDNA Reverse Transcription Kit(Applied Biosystems, Life Technologies Ltd.). The expressionof TPM1-Asp175Asn or MYBPC3-Gln1061X mutation onmRNA level in the hiPSC-derived CMs was studied byCustom TaqMan SNP Genotyping Assays (Applied Bio-systems, Life Technologies Ltd.) similarly as that forgenotyping described above. Sequences for the primers andprobes used in the assay are listed in Supplementary Table 1.
2.3.3. Immunocytochemistry. Undifferentiated hiPSC colo-nies were fixed with 4% paraformaldehyde (PFA, Sigma-Aldrich, Saint Louis, USA), stained with primary antibodiesfor Nanog (R&D systems Inc., Minneapolis, MN, USA),OCT4 (R&D systems Inc.), SOX2 (Santa Cruz Biotechnol-ogy, Santa Cruz, CA, USA), TRA-1-60 (Millipore, Billerica,MA, USA), and TRA-1-81 (Millipore), and visualized withsecondary antibodies as described before [16]. Finally, thecells were mounted with Vectashield (Vector LaboratoriesInc., Burlingame, CA, USA) containing 40,6-diamidino-2-phenylindole (DAPI) for the nuclei staining and imaged withan Olympus IX51 phase contrast microscope equipped withfluorescence optics andOlympusDP30BWcamera (OlympusCorporation, Hamburg, Germany).
2.3.4. RT-PCR. The RNA was extracted from the hiPSC linesby NucleoSpin RNA II Kit (Macherey-Nagel GmbH & Co.,Duren, Germany) and 500–1000 ng of RNA was transcribedto cDNA by High-Capacity cDNA Reverse Transcription Kit

Stem Cells International 3
(Applied Biosystems, Life Technologies Ltd.).The presence ofpluripotency genes Nanog, SOX2, REX1, OCT4, and c-MYCand the absence of virally imported exogenes (OCT4, SOX2,c-MYC, and KLF4) were confirmed by RT-PCR. GAPDHwas used as an endogenous control. The primer sequencesfor pluripotency genes and virally imported exogenes havebeen published earlier [5]. The primer sequences used fordetection of Sendai transgenes are described inCytoTune-iPSReprogramming Kit’s manual (Life Technologies Ltd.).
2.3.5. KaryotypeAnalysis. Thekaryotypes of hiPSC lineswerestudied by G-banding (Medix Laboratories, Espoo, Finland)or by KaryoLite assay [17] (Turku Centre for Biotechnology,University of Turku, Turku, Finland).
2.3.6. Pluripotency Analysis. The pluripotency of hiPSC lineswas confirmed in vitro by embryoid body (EB) formationand in vivo by teratoma assay. hiPSCs were removed fromfeeder cell layer and cultured in suspension to form EBs. TheEBs were cultured in EB medium consisting of ko-DMEMsupplemented with 20% fetal bovine serum (FBS, Biosera,Boussens, France), 1% NEAA (Lonza Group Ltd.), 2mMGlutaMax (Invitrogen, Life Technologies Ltd.), and 50U/mLpenicillin/streptomycin (Lonza Group Ltd) for 4–6 weeksbefore RNA extraction. 200 ng of RNA was transcribed tocDNA for theRT-PCRanalysis.Thepresence of all three germlayers, endoderm (AFP, SOX17), ectoderm (SOX1, NESTIN,andMusashi), andmesoderm (KDR, alpha cardiac actin), wasstudied with RT-PCR.
For in vivo pluripotency assay, hiPSCs were injectedunder the testis capsule of nude mice and the formedteratomas were collected and fixed with 4% PFA 8 weeks afterthe injection. Teratomas were embedded in paraffin, cut insections, and stained with haematoxylin and eosin.
2.4. Differentiation of Cardiomyocytes. hiPSCs were dif-ferentiated into CMs by coculturing with mouse visceralendodermal-like cells (END-2) (Hubrecht Institute, Utrecht,Netherlands) as described before [18]. After 15–30 days beat-ing areas were cut from cocultures and dissociated into singlecells in EB medium by Collagenase A (Roche Diagnostics,Mannheim, Germany) as described earlier [18] and platedto 0.1% gelatin-coated cover slips or well plates for furtheranalysis.
2.5. Characterization of hiPSC-Derived Cardiomyocytes
2.5.1. Immunocytochemistry and Image Analysis. DissociatedCMs were fixed with 4% PFA and stained with TroponinT (cTnT, 1 : 2000, ab64623, Abcam, Cambridge, MA, USA),MYBPC (1 : 400, sc-166081, Santa Cruz Biotechnology), andTPM1 (1 : 200, sc-73225, Santa Cruz Biotechnology) primaryantibodies, followed by labeling with secondary antibodies.Images were obtained with Olympus IX51 phase contrastmicroscope equipped with fluorescence optics and OlympusDP308Wcamera (OlympusCorporation) or with Zeiss Axio-Scope A1 fluorescent microscope and Zeiss AxioCam MRc5camera (Carl Zeiss, Jena, Germany). Size of the Troponin T
stained CMswas analyzed from 46 to 50 CMs in each cell lineby in-housemade software (unpublishedmethod). CMswereanalyzed from pictures obtained with Olympus IX51 phasecontrast microscope. The proportion of multinucleated CMswas determined from the same images (46–50 CMs/cell line).
2.5.2. Ca2+ Imaging. The clusters of CMs were cut, dissoci-ated, plated on 0.1% gelatin-coated coverslips, and culturedfor 1, 3, and 6 weeks. To study the Ca2+ handling properties ofhiPSC-derived CMs, cells were loaded with 4 𝜇MFura-2 AM(Molecular Probes, Life Technologies Ltd.) for 30 minutesin perfusate medium. The perfusate medium consisted of(in mM) 137 NaCl, 5 KCl, 0.44 KH
2PO4, 20 HEPES, 4.2
NaHCO3, 5 D-glucose, 2 CaCl
2, 1.2MgCl
2, and 1Na-pyruvate
dissolved in H2O. pH of the perfusate medium was adjusted
to 7.4 with NaOH. The coverslip, containing the dissociatedhiPSC-derived CMs, was mounted to an RC-25 recordingchamber and continuously perfused with perfusate mediumpreheated to 35-36∘C by an SH-27B inline-heater controlledby a TC-324B unit (all from Warner Instruments Inc.,Hamden, USA). The perfusion was controlled by a gravitydriven VC38 application system (ALA Scientific InstrumentsInc., NY, USA). Coverslip was perfused for 15 minutes forFura-2 AM deesterification before experimental recordings.Ca2+ handling of spontaneously beating CMs was imagedwith an inverted IX70 microscope using UApo/340 x20 airobjective (Olympus Corporation) and ANDOR iXon 885CCD camera (Andor Technology, Belfast, Northern Ireland)synchronized with a Polychrome V light source by a real timeDPS control unit. TILLvisION or Live Acquisition software(TILL Photonics, Munich, Germany) was used for recording.Fura-2 AM was excited at 340 nm and 380 nm light and theemission was recorded for 10–30 seconds at 505 nm.
For Ca2+ imaging analysis, single beating CMs wereselected as regions of interests and background noise,recorded from a cell-free area in the same coverslip, wassubtracted before further processing. Data is presented asratios of 340/380 nm (F340/F380).The spontaneously beatingCMs were divided into five different rhythm categories basedon the abnormalities observed in their Ca2+signals: normalbeating with regular peaks (normal); more than three peakswhich do not return to the baseline (oscillation); signals withsmall or middle sized amplitude events in the beginning, inthe end, or in between two Ca2+ spikes (low/middle peaks);two or three peaks which do not return to the baseline(double peaks); Ca2+ spikes with prolonged rise or decay time(plateau abnormality). In the low/middle peaks category, thesmall amplitude was at least 10% from the preceding Ca2+spike amplitude. Full-length, 10–30 seconds long recordingswere analyzed, while most of the analyzed recordings were 12seconds long. The distribution of CMs in different categoriesis presented for each cell lines separately.
2.5.3. ElectrophysiologicalMeasurements: Recording andAnal-ysis of Action Potentials. The action potentials (APs) wererecorded by conventional patch clamp [19] in perforatedpatch configuration using Amphotericin B [20] in finalconcentration of 0.24mg/mL [8]. Data acquisition was

4 Stem Cells International
Table 1: TaqMan assays used in qRT-PCR experiments.
Gene Description/alias Function TaqMan assay IDEEF1A1 Eukaryotic translation elongation factor 1 alpha 1 Housekeeping gene Hs00265885 g1GAPDH Glyceraldehyde-3-phosphate dehydrogenase Housekeeping gene Hs02758991 g1TNNT2 Troponin T Sarcomeric gene Hs00165960 m1MYH6 Myosin heavy chain 6 Sarcomeric gene Hs01101425 m1ACTN2 𝛼-actinin 2 Sarcomeric gene Hs00153809 m1TPM1 𝛼-tropomyosin Sarcomeric gene Hs00165966 m1MYBPC3 Myosin-binding protein C Sarcomeric gene Hs00165232 m1TTN Titin Sarcomeric gene Hs00399225 m1TNNC1 Troponin C type 1 Sarcomeric gene Hs00896999 g1MYL9 Myosin, light chain 2/MLC2 Sarcomeric gene Hs00697086 m1MYL7 Myosin, light chain 7 Sarcomeric gene Hs01085598 g1NPPA Natriuretic peptide A Hypertrophy marker Hs01081097 m1NPPB Natriuretic peptide B Hypertrophy marker Hs01057466 g1HCN4 Hyperpolarization activated cyclic nucleotide-gated potassium channel 4 Potassium channel Hs00975492 m1KCNQ1 Voltage-gated potassium channel, KQT-like subfamily, member 1 Potassium channel Hs00923522 m1CACNA1C Voltage-dependent calcium channel, L type, alpha 1C subunit/CaCNA1.2 Calcium channel Hs00167681 m1SCN5A Voltage-gated sodium channel, V type, alpha subunit Sodium channel Hs00165693 m1SLC8A1 Solute carrier family 8, member 1/NCX1 Na+/Ca2+ exchanger Hs01062258 m1PLN Phospholamban/PLB Protein kinase substrate Hs01848144 s1ATP2A2 ATPase, Ca2+ transporting, cardiac muscle, slow twitch 2/SERCA2a Ca2+-ATPase Hs00544877 m1CASQ2 Calsequestrin Ca2+ binding protein in SR Hs00154286 m1ITPR2 Inositol 1,4,5-trisphosphate receptor, type 2/IP3R2 Ca2+ receptor Hs00181916 m1RYR2 Ryanodine receptor 2 (cardiac) Ryanodine receptor Hs00892883 m1
conducted using Axon Series 200B patch-clamp amplifierconnected to Digidata 1440a AD/DA converter driven bypCLAMP 10.2 software (all from Molecular devices LLC).On the day of use, the coverslips containing dissociatedhiPSC-derived CMs were transferred to RC-24N recordingchamber (Warner Instruments Inc.) and mounted on aninverted Olympus IX71 microscope (Olympus Corporation).The patch electrodes had tip resistance of 3.0–3.5MΩ andcontained the following intracellular solution (in mM): 132KMeSO
4, 20 KCl, 1 MgCl
2, and 1 CaCl
2(pH was adjusted to
7.2 with KOH).The extracellular solution contained (in mM)143 NaCl, 4.8 KCl, 1.8 CaCl
2, 1.2 MgCl
2, 5 glucose, and 10
HEPES (pH was adjusted to 7.4 with NaOH). The preheatedextracellular solution was continuously perfused with similarsetup compared to what is presented in Section 2.5.2. Patchpipettes (Harvard Apparatus Ltd., Holliston, MA, USA)were freshly prepared using PC-10 micropipette puller andthen flame-polished with MF-830 microforge (both fromNarishige Int., Tokyo, Japan).
APs were recorded in the gap-free mode in the currentclamp from the spontaneously beating hiPSC-derived CMs.Current-clamp recordings were digitally sampled at 20 kHzand filtered at 2 kHz using low pass Bessel filter on recordingamplifier. Beats per minute (BPM), AP duration (APD
50
and APD90), AP amplitude (APA), and maximum diastolic
potential (MDP) were analyzed from the recorded APs byusing Origin 9.1 (OriginLab Corp., Northampton, USA).Only ventricular-like waveforms are presented here to avoid
any biasness among different hiPSC lines. The ventricular-like CMs were characterized by APD
90/APD
50< 1.3 and APA
> 90mV.
2.5.4. Real-Time qRT-PCR Analysis. After one week of cul-ture, dissociated CMs were collected into a lysis solutionbuffer of CellsDirect One-Step qRT-PCR Kit (Life Technolo-gies Ltd.) according to the manufacturer’s instructions. Tworeplicate samples were collected and stored at −70∘C until theDNase I digestion and reverse transcription-specific targetamplification (RT-STA) by using CellsDirect One-Step qRT-PCR Kit. Real-Time qPCR was performed with Biomark HDsystem (Fluidigm Corp., San Francisco, USA) according tothe manufacturer’s instructions. The TaqMan assays (LifeTechnologies Ltd.) used in the qRT-PCR are collected inTable 1. All samples were analyzed in duplicate and the foldchanges were calculated by the 2−ΔΔCT method [21]. EEF1A1and GAPDH genes were used as endogenous control genesand UTA.04511.WT cell line was used as a calibrator.
2.5.5. Western Blot. hiPSC-derived CMs were lysed in M-PER protein extraction reagent (Thermo Scientific, LifeTechnologies Ltd.), supplemented with complete proteaseinhibitor cocktail (Roche Diagnostics). The protein concen-tration was quantified with BCA protein assay kit (ThermoScientific, Life Technologies Ltd.). 10 𝜇g of protein was runto 4–15% mini-PROTEAN TGX precast polyacrylamide gel

Stem Cells International 5
(Bio-Rad, Hercules, CA, USA) and transferred to PVDFmembrane (Amersham Hybond-P, GE Healthcare, LittleChalfont, UK). Membranes were blocked with 5% milk for1 h at RT and proteins were stained with MYBPC (1 : 1500, sc-166081, Santa Cruz Biotechnology), cTnT (1 : 2000, ab64623,Abcam), TPM1 (1 : 200, sc-73225, Santa Cruz Biotechnology),or 𝛽-actin (1 : 1000, sc-47778, Santa Cruz Biotechnology) pri-mary antibodies over night at +4∘C. Horseradish peroxidase-(HRP-) conjugated polyclonal rabbit anti-mouse (DAKO,P0260) and rabbit anti-goat IgG (Santa Cruz Biotechnology,sc-2922) were used as secondary antibodies. Stained proteinswere detected by using Clarity ECL substrate (Bio-Rad) andvisualized byMolecular Imager ChemiDOcXRS+ (Bio-Rad).ImageJ software (National Institutes of Health, USA) wasused to compare the expression of MYBPC, cTnT, and TPM1with the 𝛽-actin expression from the same cell line.
2.6. Statistical Analysis. For statistical analysis, control celllines and cell lines in eachmutationwere combined in groups:UTA.04602.WT and UTA.04511.WT hiPSC lines in WT-CMgroup,UTA.02912.HCMTandUTA.13602.HCMT inHCMT-CM group, and UTA.07801.HCMM and UTA.06108.HCMMin HCMM-CM group. Mann-Whitney 𝑈 test with Bonfer-roni’s correction was used to analyze the differences betweenWT-, HCMT-, andHCMM-CMs in cell size analysis, propor-tion of multinucleated CMs, and Ca2+ imaging experimentsas well as in gene expression analysis. For the statisticalcomparison between the three groups, one-way ANOVAfollowed by Tukey test was used for the patch-clamp resultanalysis. 𝑝 < 0.05 was considered statistically significant. Allerror bars are presented as standard error of themean (SEM).
3. Results
3.1. hiPSCs Were Derived from HCM Patients with DifferentBackgrounds. Wederived hiPSCs from four patients carryinga HCM causing mutation either in TPM1 (TPM1-Asp175Asn)or inMYBPC3 (MYBPC3-Gln1061X). UTA.13602.HCMT andUTA.02912.HCMTs carry TPM1-Asp175Asn and UTA.07801.HCMM and UTA.06108.HCMM MYBPC3-Gln1061X muta-tion. The hiPSC lines and their mutations and abbreviations,used below, are presented in Table 2. UTA.13602.HCMT (46,XX) is derived from a 48-year-old female, whose motherdied suddenly at the age of 51. Our patient has had onecollapse at the age of 20 with normal heart structure, butlater slight thickening of septum (16mm) has been observed.Currently she is not onmedication due to low blood pressure.UTA.02912.HCMT (46, XY) is derived from a 33-year-oldmale whose family member has died suddenly at the ageof 21. The maximal septal thickness of our patient has beenmeasured to be 26mm on echocardiogram. The patient hasbeen asymptomatic but is currently on 𝛽-blockermedication.UTA.07801.HCMM (46, XY) is derived from a 61-year-oldmale with no SCDs in the family. On echocardiogram, hismyocardial septum has been observed to be 25mm. He hasatrial fibrillation and he is on 𝛽-blocker medication. Due tobradycardia and frequent nonsustained ventricular tachycar-dia episodes, an implantable cardioverter defibrillator (ICD)
Table 2:ThehiPSC lines and theirmutations and abbreviations usedin the study.
Group Cell line Mutation Name inFigure 2(f)
WT UTA.04602.WT — WT1UTA.04511.WT — WT2
HCMT UTA.02912.HCMT TPM1-Asp175Asn HCMT1UTA.13602.HCMT TPM1-Asp175Asn HCMT2
HCMM UTA.07801.HCMM MYBPC3-Gln1061X HCMM1UTA.06108.HCMM MYBPC3-Gln1061X HCMM2
has been implanted. UTA.06108.HCMM (46, XY) is derivedfrom a 55-year-old male whose father died suddenly at theage of 36 and uncle at the age of 38. Our patient has beenasymptomatic with maximal septal thickness of 22mm onechocardiogram. He is not on medication due to low bloodpressure. Control hiPSC lines were derived from healthyindividuals: UTA.04602.WT (46, XX) from a 56-year-oldfemale andUTA.04511.WT (46, XY) from a 34-year-oldmale.
The pluripotent characteristics of the hiPSC-lines usedwere assessed (Figure 1 and Supplementary Figures 1–5).UTA.04602.WT cell line has been characterized earlier [22].All the lines formed colonies, which expressed proteins andgenes typical for hPSCs. The virally transferred exogenousgenes were silenced and karyotypes of the hiPSC lines werenormal. The pluripotency of hiPSC lines was proven invitro by EB formation or in vivo by teratoma formation.The presence of TPM1-Asp175Asn and MYBPC3-Gln1061Xmutations in the patient-specific hiPSC lines was confirmedby custom TaqMan SNP Genotyping Assays (SupplementaryFigure 6).
3.2. Mutation-Specific HCM Phenotypes Were Observed inhiPSC-Derived Cardiomyocytes. All the cell lines used in thepresent study differentiated into cardiomyocytes similarly.Beating aggregateswere formed 14–20 days after the initiationof coculturing with END-2 cells and there was no differencebetween the lines when the beating areas appeared. Aftercardiac differentiation, beating clusters were dissociated intosingle cells and cultured for 1, 3, and 6 weeks. The differencesin the cell sizes and Ca2+ handling properties betweentwo different mutations and control cells were analyzed ineach time point. When comparing different types of CMs,HCMM-CMswere significantly larger thanHCMT-CMs andWT-CMs in all three time points (Figures 2(a) and 2(b),𝑛 = 96–100, 𝑝 < 0.005 in all cases). The enlargementof HCMT-CMs was detected after three weeks of culturewhen they were significantly larger than WT-CMs (𝑝 <0.005). Generally, the size of the hiPSC-derived CMs in allgroups increased when the cells cultured for three weeks.Within each group, there were no differences in cell sizesbetween three and sixweeks, except withHCMT-CMs, whichseemed to be smaller in size 6-week time point. However,during 6 weeks of culture, cell types other than CMs hadthe tendency to overgrow the CM culture, which mighthave affected the cellular enlargement.This phenomenonwas
6 Stem Cells International
OCT4 TRA-1-60
Nanog SOX2 TRA-1-81
(a)
500
250
500
250
Exogenous
Endogenous
OCT4
OCT
4
KLF4 SOX2
SOX2
c-MYC
c-MYC
+ + + +
GAPD
H
Nanog
H2O
H2O
H2O
REX1
(b)
1 2 3 4 5
6 7 8 9 10 11 12
13 14 15 16 17 18
19 20 21 22 X Y
(c)
Mesoderm Endoderm Ectoderm
(d)
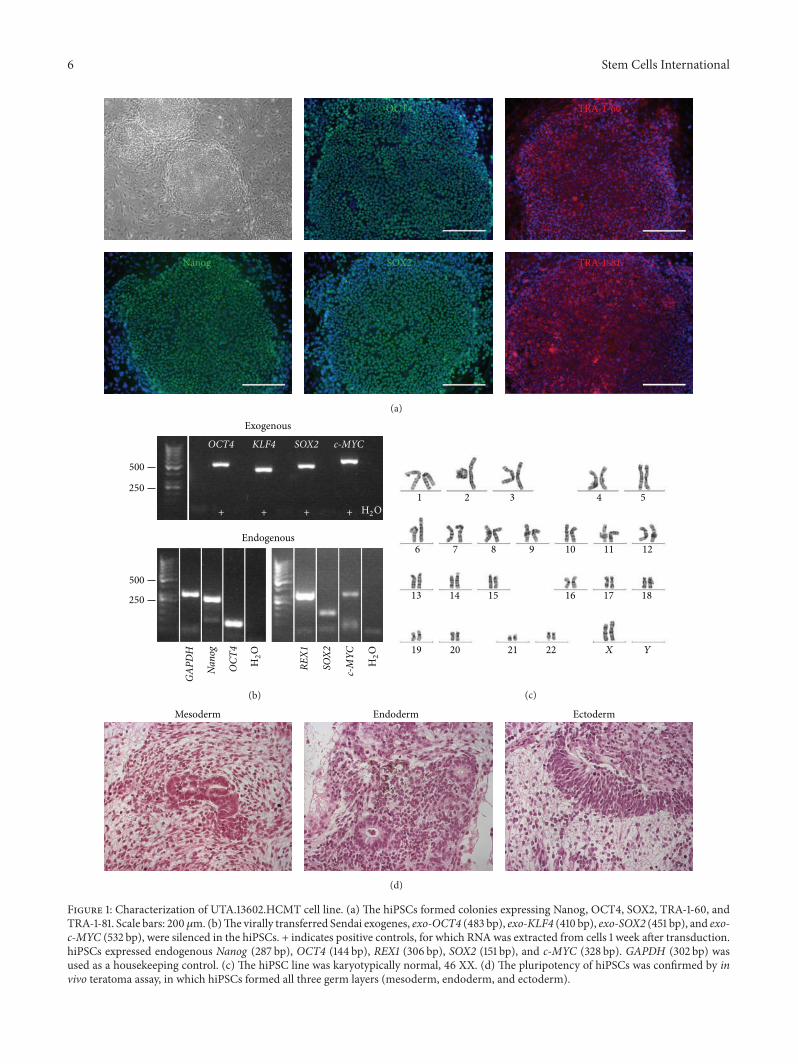
Figure 1: Characterization of UTA.13602.HCMT cell line. (a) The hiPSCs formed colonies expressing Nanog, OCT4, SOX2, TRA-1-60, andTRA-1-81. Scale bars: 200 𝜇m. (b)The virally transferred Sendai exogenes, exo-OCT4 (483 bp), exo-KLF4 (410 bp), exo-SOX2 (451 bp), and exo-c-MYC (532 bp), were silenced in the hiPSCs. + indicates positive controls, for which RNAwas extracted from cells 1 week after transduction.hiPSCs expressed endogenous Nanog (287 bp), OCT4 (144 bp), REX1 (306 bp), SOX2 (151 bp), and c-MYC (328 bp). GAPDH (302 bp) wasused as a housekeeping control. (c) The hiPSC line was karyotypically normal, 46 XX. (d) The pluripotency of hiPSCs was confirmed by invivo teratoma assay, in which hiPSCs formed all three germ layers (mesoderm, endoderm, and ectoderm).

Stem Cells International 7
WT HCMT HCMM
(a)
12
10
8
6
4
2
×104
(pix
els)
n=100
n=100
n=100
n=100
n=100
n=96
n=100
n=100
n=100
∗∗ ##
WT1
w
WT3
w
WT6
w
HCM
T1
w
HCM
T3
w
HCM
T6
w
HCM
M1
w
HCM
M3
w
HCM
M6
w
$$
&&
(b)∗ ∗
50
40
30
20
10
(%)
WT1
w
WT3
w
WT6
w
HCM
T1
w
HCM
T3
w
HCM
T6
w
HCM
M1
w
HCM
M3
w
HCM
M6
w
(c)
∗ ∗
50
40
30
20
10
(%)
WT1
w
WT3
w
WT6
w
HCM
T1
w
HCM
T3
w
HCM
T6
w
HCM
M1
w
HCM
M3
w
HCM
M6
w
(d)
Normal
2 4 6 8 10
Time (s)
F340
/F38
0
Oscillation
2 4 6 8 10
Time (s)
F340
/F38
0
Low/middle peaks
2 4 6 8 10
Time (s)
F340
/F38
0
Plateau abnormality
2 4 6 8 10
Time (s)
F340
/F38
0
Double peaks
2 4 6 8 10
Time (s)
F340
/F38
0
(e)
Figure 2: Continued.
8 Stem Cells International
50
60
70
80
90
40
30
20
10
(%)
n =
WT1
1w
WT1
3w
WT1
6w
WT2
1w
WT2
3w
WT2
6w
HCM
T11
wH
CMT1
3w
HCM
T16
wH
CMT2
1w
HCM
T23
wH
CMT2
6w
HCM
M11
wH
CMM13
wH
CMM16
wH
CMM21
wH
CMM23
wH
CMM26
w
89 24 20 99 66 50 99 104 19 145 24 97 78 141 83 90 29 42
(f)
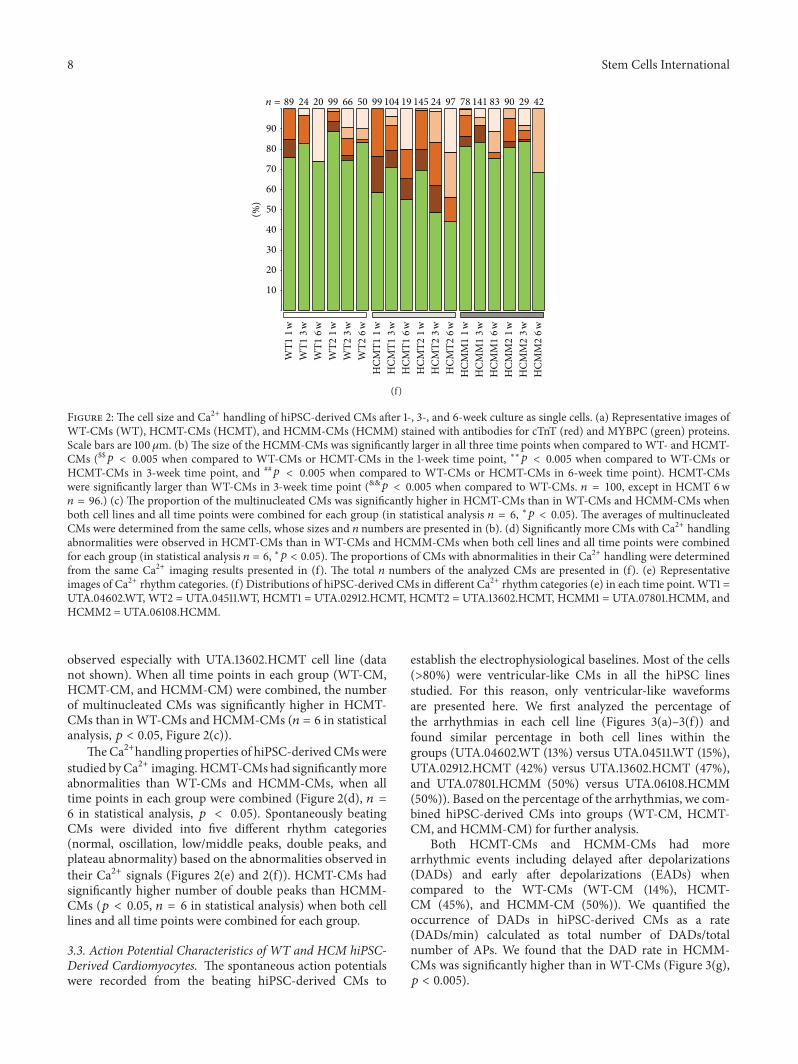
Figure 2: The cell size and Ca2+ handling of hiPSC-derived CMs after 1-, 3-, and 6-week culture as single cells. (a) Representative images ofWT-CMs (WT), HCMT-CMs (HCMT), and HCMM-CMs (HCMM) stained with antibodies for cTnT (red) and MYBPC (green) proteins.Scale bars are 100𝜇m. (b) The size of the HCMM-CMs was significantly larger in all three time points when compared to WT- and HCMT-CMs ($$𝑝 < 0.005 when compared to WT-CMs or HCMT-CMs in the 1-week time point, ∗∗𝑝 < 0.005 when compared to WT-CMs orHCMT-CMs in 3-week time point, and ##
𝑝 < 0.005 when compared to WT-CMs or HCMT-CMs in 6-week time point). HCMT-CMswere significantly larger than WT-CMs in 3-week time point (&&𝑝 < 0.005 when compared to WT-CMs. 𝑛 = 100, except in HCMT 6w𝑛 = 96.) (c) The proportion of the multinucleated CMs was significantly higher in HCMT-CMs than in WT-CMs and HCMM-CMs whenboth cell lines and all time points were combined for each group (in statistical analysis 𝑛 = 6, ∗𝑝 < 0.05). The averages of multinucleatedCMs were determined from the same cells, whose sizes and 𝑛 numbers are presented in (b). (d) Significantly more CMs with Ca2+ handlingabnormalities were observed in HCMT-CMs than in WT-CMs and HCMM-CMs when both cell lines and all time points were combinedfor each group (in statistical analysis 𝑛 = 6, ∗𝑝 < 0.05). The proportions of CMs with abnormalities in their Ca2+ handling were determinedfrom the same Ca2+ imaging results presented in (f). The total 𝑛 numbers of the analyzed CMs are presented in (f). (e) Representativeimages of Ca2+ rhythm categories. (f) Distributions of hiPSC-derived CMs in different Ca2+ rhythm categories (e) in each time point. WT1 =UTA.04602.WT, WT2 = UTA.04511.WT, HCMT1 = UTA.02912.HCMT, HCMT2 = UTA.13602.HCMT, HCMM1 = UTA.07801.HCMM, andHCMM2 = UTA.06108.HCMM.
observed especially with UTA.13602.HCMT cell line (datanot shown). When all time points in each group (WT-CM,HCMT-CM, and HCMM-CM) were combined, the numberof multinucleated CMs was significantly higher in HCMT-CMs than inWT-CMs and HCMM-CMs (𝑛 = 6 in statisticalanalysis, 𝑝 < 0.05, Figure 2(c)).
TheCa2+handling properties of hiPSC-derived CMswerestudied byCa2+ imaging.HCMT-CMs had significantlymoreabnormalities than WT-CMs and HCMM-CMs, when alltime points in each group were combined (Figure 2(d), 𝑛 =6 in statistical analysis, 𝑝 < 0.05). Spontaneously beatingCMs were divided into five different rhythm categories(normal, oscillation, low/middle peaks, double peaks, andplateau abnormality) based on the abnormalities observed intheir Ca2+ signals (Figures 2(e) and 2(f)). HCMT-CMs hadsignificantly higher number of double peaks than HCMM-CMs (𝑝 < 0.05, 𝑛 = 6 in statistical analysis) when both celllines and all time points were combined for each group.
3.3. Action Potential Characteristics of WT and HCM hiPSC-Derived Cardiomyocytes. The spontaneous action potentialswere recorded from the beating hiPSC-derived CMs to
establish the electrophysiological baselines. Most of the cells(>80%) were ventricular-like CMs in all the hiPSC linesstudied. For this reason, only ventricular-like waveformsare presented here. We first analyzed the percentage ofthe arrhythmias in each cell line (Figures 3(a)–3(f)) andfound similar percentage in both cell lines within thegroups (UTA.04602.WT (13%) versus UTA.04511.WT (15%),UTA.02912.HCMT (42%) versus UTA.13602.HCMT (47%),and UTA.07801.HCMM (50%) versus UTA.06108.HCMM(50%)). Based on the percentage of the arrhythmias, we com-bined hiPSC-derived CMs into groups (WT-CM, HCMT-CM, and HCMM-CM) for further analysis.
Both HCMT-CMs and HCMM-CMs had morearrhythmic events including delayed after depolarizations(DADs) and early after depolarizations (EADs) whencompared to the WT-CMs (WT-CM (14%), HCMT-CM (45%), and HCMM-CM (50%)). We quantified theoccurrence of DADs in hiPSC-derived CMs as a rate(DADs/min) calculated as total number of DADs/totalnumber of APs. We found that the DAD rate in HCMM-CMs was significantly higher than in WT-CMs (Figure 3(g),𝑝 < 0.005).

Stem Cells International 9
WT
(a)
HCM
T
(b)
HCM
M
(c)HCMT(d)
HCMM
(e)
n = 23 n = 20 n = 24 n = 47 n = 32 n = 22
80
60
40
20
(%)
DADs and EADsEADs
DADsNormal
UTA
.04602
.WT
UTA
.04511
.WT
UTA
.02912
.HCM
T
UTA
.13602
.HCM
T
UTA
.07801
.HCM
M
UTA
.06108
.HCM
M
(f)
2
4
6
8
DA
Ds/
min
n = 43WT
n = 71HCMT
n = 54HCMM
∗∗
(g)
Figure 3: Arrhythmogenic events (DADs and EADs) were observed in HCM-CMs. (a)–(e) Representative recordings of control hiPSC-derived CMs (WT) and hiPSC-derived CMs carrying TPM1-Asp175Asn (HCMT) orMYBPC3-Gln1061X (HCMM)mutations. Typical DADs(arrows) are presented in (b) and (c) and EADs (arrows) in (d) and (e) for HCMT-CMs and HCMM-CMs, respectively. Scale bars represent40mv and 5 seconds, respectively. Scale bars in (a) are representative for (b) and (c), and scale bars in (d) are representative for (e). (f)Distribution of CMs exhibiting arrhythmogenic events in each cell line. (g) DAD rate was significantly higher in HCMM-CMs than in WT-CMs (∗∗𝑝 < 0.005).

10 Stem Cells International
Table 3: AP properties of ventricular-like CMs derived from control hiPSC lines (WT) and from hiPSC lines carrying TPM1-Asp175Asn(HCMT) orMYBPC3-Gln1061X (HCMM) mutations. In the results, the data of each group is comprised from two separate cell lines.
Group 𝑛
Beating rate APD50
APD90
APA MDP(BPM) (ms) (ms) (mV) (mV)
WT 43 58.1 ± 2.3 277.3 ± 13.0 323.6 ± 13.9 119.5 ± 1.1 −76.8 ± 0.8HCMT 71 48.4 ± 1.5∗∗ 372.3 ± 13.2∗∗ 433.1 ± 14.0∗∗ 121.2 ± 1.1 −75.8 ± 0.7HCMM 54 47.1 ± 1.8∗∗ 319.5 ± 13.7$ 377.6 ± 15.0∗,$ 124.3 ± 1.4∗ −77.9 ± 0.8∗HCMT or HCMM versus WT.$HCMM versus HCMT.$ or ∗𝑝 < 0.05 and ∗∗𝑝 < 0.005.
The average APD at 50% repolarization (APD50) and
90% repolarization (APD90) of HCMT-CMswas significantly
longer than those of the WT-CMs (APD50
(𝑝 < 0.005) andAPD90
(𝑝 < 0.005)) and HCMM-CMs (APD50
(𝑝 < 0.05)and APD
90(𝑝 < 0.05)) (Table 3). APD
90of HCMM-CMs
was significantly longer than that of the WT-CMs (𝑝 < 0.05)(Table 3). Furthermore, the beating rates of both HCMT-CMs and HCMM-CMs were significantly lower than inWT-CMs (WT-CM versus HCMT-CM (𝑝 < 0.005) and WT-CMversus HCMM-CM (𝑝 < 0.005)). In addition, the APA ofHCMM-CMs was significantly higher than in the WT-CMs(𝑝 < 0.05). However, no significant differences were foundfor the MDP between any groups (Table 3).
3.4. Differences in the Gene Expression Profiles of hiPSC-Derived Cardiomyocytes. Dissociated hiPSC-derived CMswere cultured for one week before qRT-PCR analysis wasperformed.The results are presented in Figure 4.The expres-sion of sarcomeric genes MYBPC3, TNNT2, ACTN2, TTN,MYL7, and MYL9 was significantly higher in both HCMT-CMs andHCMM-CMs than in theWT-CMs (𝑝 < 0.005 in allcases). The expression of TPM1 and TNNC1 was significantlyincreased only in the HCMM-CMs when compared to WT-CMs (𝑝 < 0.005 in both cases). On the other hand, theexpression of MYH6 was on the same level in all hiPSC-derived CMs. Moreover, the expression of some sarcomericgenes (TNNT2, ACTN2, TNNC1, TTN, MYL7, and MYL9)was significantly higher in the HCMM-CMs than in theHCMT-CMs (𝑝 < 0.005 in other than TNNT2 and MYL9𝑝 < 0.05). The expression of natriuretic peptide A (NPPA)was similar in all hiPSC-derived CMs while the expression ofnatriuretic peptide B (NPPB) was increased in HCMT-CMsand HCMM-CMs when compared to WT-CMs (𝑝 < 0.005in both cases). Nodal marker HCN4 was also significantlyincreased in both HCM-CMs when compared to WT-CMs(𝑝 < 0.05 for HCMT-CMs versus WT-CMs and 𝑝 < 0.005for HCMM-CMs versus WT-CMs). Further, the highestexpression of potassium channelKCNQ1 and sodium channelSCN5A as well as sodium calcium exchanger SLC8A1 wasobserved in HCMM-CMs (𝑝 < 0.005 when compared toWT-CMs in all cases).
We found differences also in the expression of genesrelated to the Ca2+ handling. The expression of CACNA1Cand PLN was increased in both HCMT-CMs (𝑝 < 0.05for CACNA1C and 𝑝 < 0.005 for PLN) and HCMM-CMs(𝑝 < 0.005 in both cases) when compared to WT-CMs
while the expression of ATP2A2 and ITPR2 was on the samelevel in all hiPSC-derived CMs. However, the expression ofCASQ2 and RYR2 was significantly higher in HCMT-CMsand HCMM-CMs when compared to WT-CMs (𝑝 < 0.005in all cases). Moreover, the expression of RYR2 was almostsix times higher in the HCMM-CMs than in the WT-CMs(𝑝 < 0.005) and around three times higher than in HCMT-CMs (𝑝 < 0.005).
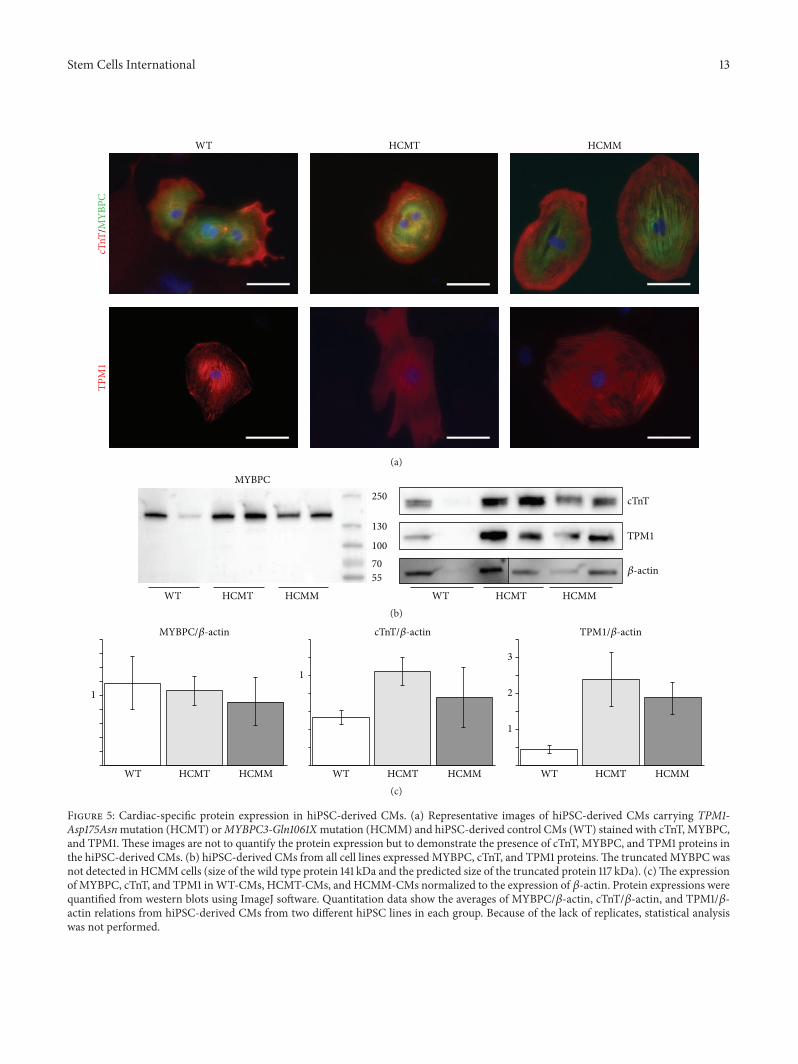
3.5. Truncated MYBPC Protein Was Not Detected in hiPSC-Derived Cardiomyocytes Carrying MYBPC3-Gln1061X Muta-tion. Both wild type and the mutant TPM1 mRNA werepresent in HCM-CMs carrying the TPM1-Asp175Asn muta-tion while hiPSC-derived control CMs expressed only wildtypemRNA.However, in hiPSC-CMs carrying theMYBPC3-Gln1061X mutation the mutant mRNA was not clearlydetected (Supplementary Figure 7). At a protein level allhiPSC-derived CMs expressed MYBPC, cTnT, and TPM1(Figures 5(a) and 5(b)). The truncated MYBPC protein (pre-dicted size: 116 kDa) was not detected in HCMM-CMs withwestern blot analysis (Figure 5(b)). However, the expressionlevel of total MYBPC was slightly reduced in HCMM-CMswhen compared to WT-CMs (Figure 5(c)). In addition, theexpression of cTnT and TPM1 was elevated in both HCM-CMs (Figure 5(c)).
4. Discussion
Here we have analyzed characteristics of hiPSC-derivedHCM-CMs carrying either TPM1-Asp175Asn or MYBPC3-Gln1061X gene mutation. The size of the MYBPC3-Gln1061XCMs was significantly larger than that of TPM1-Asp175AsnCMs, while the CMs carrying the latter mutation hadsignificantly more abnormal Ca2+ transients. Additionally,CMs with TPM1-Asp175Asnmutation had significantly moreprolonged action potentials. However, both types of HCM-CMs had increased amount of arrhythmogenic events (DADsand EADs) in electrophysiological recordings when com-pared to control CMs. In addition to morphological andfunctional differences, also gene expression profiles weredifferent between CMs carrying either TPM1-Asp175Asn orMYBPC3-Gln1061X gene mutation.
GeneticHCM is primarily due tomutations in sarcomericgenes, while changes at the cellular level include disturbedCa2+metabolism and decreased contraction force generationin addition to enlarged cell size [23]. To our knowledge,

Stem Cells International 11
TPM1
1
2
WT
Fold
chan
geFo
ld ch
ange
Fold
chan
geFo
ld ch
ange
Fold
chan
ge
HCMT HCMM
MYBPC3
1
2
3
WT HCMT HCMM
∗∗
∗∗
∗∗
∗∗
∗∗
TNNT2
1
2
3
WT HCMT HCMM
$
∗∗
∗∗
TTN
1
2
3
4
WT HCMT HCMM
$$
∗∗
∗∗
ACTN2
2
4
6
WT HCMT HCMM
$$ ∗∗TNNC1
1
2
WT HCMT HCMM
$$
∗∗
∗∗MYL9
0.8
1.2
1.6
WT HCMT HCMM
$
0.4
∗∗
∗∗MYL7
1
2
WT HCMT HCMM
$$MYH6
1
2
WT HCMT HCMM
NPPA
0.8
1.2
WT HCMT HCMM
0.4
∗∗∗∗
NPPB
0.8
1.2
1.6
WT HCMT HCMM
0.4
∗ ∗∗HCN4
0.8
1.2
WT HCMT HCMM
0.4
∗∗
∗∗
SLC8A1
2
4
WT HCMT HCMM
$$∗∗SCN5A
4
8
12
WT HCMT HCMM
$$
∗∗
∗∗KCNQ1
1
3
2
4
WT HCMT HCMM
$$
Fold
chan
ge
ATP2A2
0.4
1.2
WT HCMT HCMM
$$∗∗
∗∗
PLN
1
2
WT HCMT HCMM
$
∗
∗∗
CACNA1C
1
2
WT HCMT HCMM
0.8
Figure 4: Continued.

12 Stem Cells InternationalFo
ld ch
ange
RYR2
2
6
WT HCMT HCMM
$$ITPR2
0.4
1.2
WT HCMT HCMM
∗∗
∗∗
CASQ2
2
4
WT HCMT HCMM
4
∗∗
∗∗
0.8
$
Figure 4: Gene expression profiles in control hiPSC-derived CMs (WT) and in hiPSC-derived CMs carrying TPM1-Asp175Asn (HCMT)or MYBPC3-Gln1061X (HCMM) mutations. (∗ represents HCMT or HCMM versus WT, and $ represents HCMT versus HCMM. ∗∗ or$$𝑝 < 0.005, ∗ or $
𝑝 < 0.05 𝑛 = 16, except for NPPA 𝑛 = 8).
total of three reports studying the characteristics as well asthe pathophysiological mechanisms of the HCM by usingthe patient-specific hiPSCs have been published [12–14]. Intwo of these publications, the mutation is located in theMYH7 (MYH7-R663H or MYH7-R442G) [12, 13], whereas,in the most recent publication, the hiPSCs were derived fromthree HCM patients, from whom one carried the MYBPC3-999-1004del2, while the other mutations were unknown [14].In addition to these three publications, hiPSC-derived CMscarrying MYBPC3 mutations have been used in one studywhere the effects of serum on the phenotype of neonatalrat CMs as well as hPSC-derived CMs have been explored[24]. hiPSC-derived CMs carrying MYBPC3 mutation wereused only when studying the effects of serum on the cellularenlargement [24]. In this current study, we obtained hiPSCsfrom HCM patients carrying either the MYBPC3-Gln1061Xor TPM1-Asp175Asn mutation. We believe that this is thefirst report where hiPSC-derived CMs carrying different genemutations have been compared in the same studywith similarexperimental settings.
OurHCM-CMs demonstrated cellular enlargement simi-larly to previous HCM studies with hiPSCs [12–14]. However,we observed a significant difference in the cellular enlarge-ment between the two HCM mutations. CMs carrying theMYBPC3-Gln1061X mutation presented more pronouncedand earlier cellular enlargement than CMs carrying theTPM1-Asp175Asn mutation. In a previous study, serum hasbeen shown to mask hypertrophic phenotype of the CMswith mutations in the MYBPC3 [24]. The CMs from theHCM patients were larger in serum-free conditions withoutany external stimuli, while the serum seemed to increasethe cellular enlargement in WT-CMs but not in CMs withHCMmutations [24].We used 20% serum in our CM culturemedium that did not seem to mask the cellular enlargementwith our CMs. Already after one week of culture, CMs car-rying MYBPC3-Gln1061X mutation were significantly largerthan theWT-CMs.The enlargement of CMs carrying TPM1-Asp175Asn mutation was detectable only after three weeksof culture. In the previous clinical studies, as well as in thepatient data analyzed in this current study, the hypertrophyhas been in the same range in patients carrying either of thesetwo mutations [2]. Therefore, these differences in CM sizebetween the two mutations do not correlate with the extentof clinical hypertrophy.
The higher Ca2+ sensitivity, observed in animal modelsand myectomy samples, has been suggested to be a commonfeature for allHCMmutations [25, 26]. In the previous studieswith hiPSC-derived CMs, irregularities in Ca2+ transientshave been observed in the MYH7-R663H and the MYH7-R442G mutations [12, 13]. The higher Ca2+ sensitivity hasbeen related to lower phosphorylation levels of the MYBPCand the Troponin I proteins and the difference could atleast partly be explained by hypophosphorylation of thesarcomeric proteins compared to the actual mutations [26].In our study, the amount of abnormalities in Ca2+transientswas significantly increased only in the hiPSC-derived CMswith the TPM1-Asp175Asn mutation. Indeed, the amountof irregularities in Ca2+ handling properties was similar inthe MYBPC3-Gln1061X compared to that in the WT-CMs.The phosphorylation of the proteins was not analyzed inthis current study. However, we analyzed the expression ofgenes related to Ca2+ handling and they were at the highestlevel in hiPSC-derived CMs carrying theMYBPC3-Gln1061Xmutation. This might be at least partly due to the larger cellsize of these CMs. Han and coworkers found decreased levelof RYR2 expression in HCM-CMs carrying MYH7-R442Gmutation [13], while in our study the expression of RYR2 wassignificantly higher in both mutations and almost six timeshigher in the hiPSC-derived CMs carrying the MYBPC3-Gln1061Xmutation than in theWT-CMs.These observationssuggest that abnormal Ca2+ transients inHCM-CMs carryingdifferent mutations may be caused by distinct mechanisms.
One of the fundamental features of the HCM is itsassociation with ventricular arrhythmias responsible forsevere cardiac malfunctions including sudden cardiac death[27, 28]. We found increased amount of arrhythmogenicevents (DADs and EADs) in both HCM-CMs. Furthermore,decreased beating rate was observed in both types of HCM-CMs, which could be due to higher occurrence of DADsbetween the two consecutive APs. In addition, the APD
90
of hiPSC-derived CMs carrying either TPM1-Asp175Asn orMYBPC3-Gln1061X mutation was longer than in WT-CMs,which is in line with previous findings with different muta-tions [12, 13, 29]. The mechanism of arrhythmias in HCMis not yet fully understood; however, imbalances in Ca2+homeostasis are considered as a main cause of arrhythmiasshown in the previous studies [12, 13]. Clinically, patientscarrying TPM1-Asp175Asn mutation have been reported to
Stem Cells International 13
WT HCMT HCMM
TPM
1cT
nT/M
YBPC
(a)
TPM1
cTnT
𝛽-actin
WT HCMT HCMM
MYBPC
WT HCMT HCMM
250
130
100
70
55
(b)
MYBPC/𝛽-actin cTnT/𝛽-actin TPM1/𝛽-actin
WT HCMT HCMM WT HCMT HCMM
1
1
1
2
3
WT HCMT HCMM(c)
Figure 5: Cardiac-specific protein expression in hiPSC-derived CMs. (a) Representative images of hiPSC-derived CMs carrying TPM1-Asp175Asnmutation (HCMT) orMYBPC3-Gln1061Xmutation (HCMM) and hiPSC-derived control CMs (WT) stained with cTnT, MYBPC,and TPM1. These images are not to quantify the protein expression but to demonstrate the presence of cTnT, MYBPC, and TPM1 proteins inthe hiPSC-derived CMs. (b) hiPSC-derived CMs from all cell lines expressed MYBPC, cTnT, and TPM1 proteins.The truncated MYBPC wasnot detected in HCMM cells (size of the wild type protein 141 kDa and the predicted size of the truncated protein 117 kDa). (c)The expressionof MYBPC, cTnT, and TPM1 inWT-CMs, HCMT-CMs, and HCMM-CMs normalized to the expression of 𝛽-actin. Protein expressions werequantified from western blots using ImageJ software. Quantitation data show the averages of MYBPC/𝛽-actin, cTnT/𝛽-actin, and TPM1/𝛽-actin relations from hiPSC-derived CMs from two different hiPSC lines in each group. Because of the lack of replicates, statistical analysiswas not performed.
14 Stem Cells International
be more prone to arrhythmias than those carryingMYBPC3-Gln1061X mutation [30]. Our data with hiPSC-derived CMssupport this finding by demonstrating more abnormal Ca2+transients and longer APD
90in TPM1-Asp175Asn CMs than
in HCM-CMs carrying theMYBPC3-Gln1061X mutation.Likemost of theHCMmutations located in theMYBPC3,
also MYBPC3-Gln1061X is a nonsense mutation that leadsto premature stop-codon [31]. Nonsense mutations are sug-gested to act through haploinsufficiency inwhich themutatedprotein is either degraded or not produced at all. Thetruncated form of MYBPC has not been found in humancardiac samples while the total expression level of MYBPChas been reported to vary from being decreased to evenincreased [32–36]. Interestingly, when studying myectomysamples from HCM hearts with MYBPC3 mutation, Helmset al. observed that the total amount ofMYBPC3mRNA wasincreased, while the total amount of MYBPC protein wason the same level compared to that in the control hearts.They hypothesized that the upregulation of the MYBPC3compensates the degraded truncated MYBPC protein [35].We could not detect mutant allele on mRNA expressionlevel or truncated MYBPC protein in hiPSC-derived CMscarrying theMYBPC3-Gln1061Xmutation. Similar absence oftruncated protein has been reported earlier with a differentMYBPC mutation in hiPSC-derived CMs [14]. These datasuggest that the mutant mRNAmight be degraded. However,further research is still needed to confirm the results and todiscover the actual degradation mechanism.
The two HCM mutations analyzed in this study are themost frequent mutations in Finland accounting for about18% of all Finnish HCM patients [3]. In our study, wefound differences in the morphological and biochemicalproperties, as well as in Ca2+ cycling and electrophysio-logical properties between the CMs carrying either TPM1-Asp175Asn or MYBPC3-Gln1061X mutation. However, wehave not analyzed the possible effects of other genemutationsand epigenetic factors on the phenotype differences observedin our study. Additionally, we used only two hiPSC lines fromtwo different patients in each mutation in our experiments.In the future, we need to extend our studies including furtherpatients and studying the effects of additional genemutationsand epigenetic factors. The immature nature of hiPSC-derived CMs is a general limitation when using these cells indisease modeling. Further development in the differentiationand maturation protocols will increase the reliability ofstudies conductedwith hiPSC-derivedCMs. Finally, the exactpathophysiology in abnormal Ca2+ transients or electricalabnormalities is not known and further research with com-bined patch clamp and Ca2+ imaging is required in the futureto reveal the significance of the cellular findings for clinicalphenotypes as well as for treatment options.
5. Conclusions
In conclusion, both HCM hiPSC-derived CMs either car-rying the TPM1-Asp175Asn or MYBPC3-Gln1061X mutationexhibited pathological changes related to HCM. However,significant differences between the two mutations were
observed. The hiPSC-derived cell models, established in thisstudy, can be exploited to study further the pathophysio-logical mechanisms of HCM as well as to screen drugs andpotentially optimize treatments in mutation-specific way.
Abbreviations
AP: Action potentialAPA: Action potential amplitudeAPD: Action potential durationbFGF: Basic fibroblast growth factorBPM: Beats per minuteCM: CardiomyocyteCPVT: Catecholaminergic polymorphic
ventricular tachycardiacTnT: Troponin TDAD: Delayed after depolarizationDAPI: 40,6-Diamidino-2-phenylindoleDCM: Dilated cardiomyopathyEAD: Early after depolarizationEB: Embryoid bodyEND-2: Mouse endodermal-like cellsFBS: Fetal bovine serumHCM: Hypertrophic cardiomyopathyHCM-CM: Cardiomyocytes derived from hiPSCs
carrying HCMmutationHCMM-CM: Cardiomyocytes derived from hiPSCs
carryingMYBPC3-Gln1061X mutationHCMT-CM: Cardiomyocytes derived from hiPSCs
carrying TPM1-Asp175AsnmutationhiPSC: Human induced pluripotent stem cellhPSC: Human pluripotent stem cellHRP: Horseradish peroxidaseICD: Implantable cardioverter defibrillatorko: Knockoutko-SR: Knockout serum replacementMDP: Maximum diastolic potentialMEF: Mouse embryonic fibroblastMYBPC: Myosin-binding protein CMYH7: 𝛽-myosin heavy chainNEAA: Nonessential amino acidsRT-STA: Reverse transcription-specific target
amplificationSCD: Sudden cardiac deathSEM: Standard error of the meanTPM1: 𝛼-tropomyosinWT-CM: Cardiomyocytes derived from control
hiPSCs.
Conflict of Interests
The authors declare that there is no conflict of interestsregarding the publication of this paper.
Acknowledgments
This study was funded by the Finnish Foundation forCardiovascular Research, the Finnish Funding Agency for
Stem Cells International 15
Technology and Innovation, Competitive Research Fundingof the Pirkanmaa Hospital District, Finnish Cultural Foun-dation, Aarne and Aili Turunen Foundation, Maud KuistilaMemorial Foundation, and Aarne Koskelo Foundation. Theauthors would like to acknowledge Markus Haponen, MerjaLehtinen, Kirsi Penttinen, Julia Silvennoinen, and HennaVenalainen for the general technical support, TurkkaMannilafor the help with data analysis, Reija Autio for the help withstatistical analysis, and Christine Mummery (Leiden Univer-sity Medical Center, Leiden, Netherlands) for providing theEND-2 cells.
References
[1] B. J. Maron, S. R. Ommen, C. Semsarian, P. Spirito, I. Olivotto,and M. S. Maron, “Hypertrophic cardiomyopathy: presentand future, with translation into contemporary cardiovascularmedicine,” Journal of the AmericanCollege of Cardiology, vol. 64,no. 1, pp. 89–99, 2014.
[2] P. Jaaskelainen, T. Helio, K. Aalto-Setala et al., “A new commonmutation in the cardiac beta-myosin heavy chain gene inFinnish patients with hypertrophic cardiomyopathy,” Annals ofMedicine, vol. 46, no. 6, pp. 424–429, 2014.
[3] P. Jaaskelainen, T. Helio, K. Aalto-Setala et al., “Two foundermutations in the alpha-tropomyosin and the cardiac myosin-binding protein C genes are common causes of hypertrophiccardiomyopathy in the Finnish population,”Annals ofMedicine,vol. 45, no. 1, pp. 85–90, 2013.
[4] D. J. Duncker, J. Bakkers, B. J. Brundel, J. Robbins, J. C. Tardiff,and L. Carrier, “Animal and in silico models for the studyof sarcomeric cardiomyopathies,” Cardiovascular Research, vol.105, no. 4, pp. 439–448, 2015.
[5] K. Takahashi, K. Tanabe, M. Ohnuki et al., “Induction ofpluripotent stem cells from adult human fibroblasts by definedfactors,” Cell, vol. 131, no. 5, pp. 861–872, 2007.
[6] A. L. Lahti, V. J. Kujala, H. Chapman et al., “Model for longQT syndrome type 2 using human iPS cells demonstratesarrhythmogenic characteristics in cell culture,” Disease Modelsand Mechanisms, vol. 5, no. 2, pp. 220–230, 2012.
[7] A.Moretti,M. Bellin, A.Welling et al., “Patient-specific inducedpluripotent stem-cell models for long-QT syndrome,”The NewEngland Journal ofMedicine, vol. 363, no. 15, pp. 1397–1409, 2010.
[8] A. L. Kiviaho, A. Ahola, K. Larsson et al., “Distinct elec-trophysiological and mechanical beating phenotypes of longQT syndrome type 1-specific cardiomyocytes carrying differentmutations,” IJC Heart & Vasculature, vol. 8, pp. 19–31, 2015.
[9] K. Kujala, J. Paavola, A. Lahti et al., “Cell model of cat-echolaminergic polymorphic ventricular tachycardia revealsearly and delayed afterdepolarizations,” PLoS ONE, vol. 7, no.9, Article ID e44660, 2012.
[10] A. Fatima, G. Xu, K. Shao et al., “In vitromodeling of ryanodinereceptor 2 dysfunction using human induced pluripotent stemcells,” Cellular Physiology and Biochemistry, vol. 28, no. 4, pp.579–592, 2011.
[11] N. Sun, M. Yazawa, J. Liu et al., “Patient-specific inducedpluripotent stem cells as a model for familial dilated cardiomy-opathy,” Science Translational Medicine, vol. 4, no. 130, ArticleID 130ra47, 2012.
[12] F. Lan, A. S. Lee, P. Liang et al., “Abnormal calcium han-dling properties underlie familial hypertrophic cardiomyopathy
pathology in patient-specific induced pluripotent stem cells,”Cell Stem Cell, vol. 12, no. 1, pp. 101–113, 2013.
[13] L. Han, Y. Li, J. Tchao et al., “Study familial hypertrophic car-diomyopathy using patient-specific induced pluripotent stemcells,”Cardiovascular Research, vol. 104, no. 2, pp. 258–269, 2014.
[14] A. Tanaka, S. Yuasa, G. Mearini et al., “Endothelin-1 inducesmyofibrillar disarray and contractile vector variability in hyper-trophic cardiomyopathy-induced pluripotent stem cell-derivedcardiomyocytes,” Journal of the AmericanHeart Association, vol.3, no. 6, Article ID e001263, 2014.
[15] M. Ohnuki, K. Takahashi, and S. Yamanaka, “Generation andcharacterization of human induced pluripotent stem cells,” inCurrent Protocols in StemCell Biology, chapter 4, unit 4A.2, JohnWiley & Sons, 2009.
[16] M. Ojala, K. Rajala, M. Pekkanen-Mattila, M. Miettinen, H.Huhtala, and K. Aalto-Setala, “Culture conditions affect cardiacdifferentiation potential of human pluripotent stem cells,” PLoSONE, vol. 7, no. 10, Article ID e48659, 2012.
[17] R. J. Lund, T. Nikula, N. Rahkonen et al., “High-throughputkaryotyping of human pluripotent stem cells,” Stem CellResearch, vol. 9, no. 3, pp. 192–195, 2012.
[18] C. Mummery, D. Ward-van Oostwaard, P. Doevendans et al.,“Differentiation of human embryonic stem cells to cardiomy-ocytes: role of coculture with visceral endoderm-like cells,”Circulation, vol. 107, no. 21, pp. 2733–2740, 2003.
[19] O. P. Hamill, A.Marty, E. Neher, B. Sakmann, and F. J. Sigworth,“Improved patch-clamp techniques for high-resolution currentrecording from cells and cell-free membrane patches,” PflugersArchiv European Journal of Physiology, vol. 391, no. 2, pp. 85–100,1981.
[20] J. Rae, K. Cooper, P. Gates, and M. Watsky, “Low accessresistance perforated patch recordings using amphotericin B,”Journal of Neuroscience Methods, vol. 37, no. 1, pp. 15–26, 1991.
[21] K. J. Livak and T. D. Schmittgen, “Analysis of relative geneexpression data using real-time quantitative PCRand the 2−ΔΔ𝐶Tmethod,”Methods, vol. 25, no. 4, pp. 402–408, 2001.
[22] A. Ahola, A. L. Kiviaho, K. Larsson, M. Honkanen, K. Aalto-Setala, and J. Hyttinen, “Video image-based analysis of singlehuman induced pluripotent stem cell derived cardiomyocytebeating dynamics using digital image correlation,” BioMedicalEngineering Online, vol. 13, article 39, 2014.
[23] J. C. Tardiff, L. Carrier, D. M. Bers et al., “Targets for therapyin sarcomeric cardiomyopathies,” Cardiovascular Research, vol.105, no. 4, pp. 457–470, 2015.
[24] C. Dambrot, S. R. Braam, L. G. J. Tertoolen, M. Birket, D.E. Atsma, and C. L. Mummery, “Serum supplemented culturemediummasks hypertrophic phenotypes in human pluripotentstem cell derived cardiomyocytes,” Journal of Cellular andMolecular Medicine, vol. 18, no. 8, pp. 1509–1518, 2014.
[25] S. J. van Dijk, E. R. Paalberends, A. Najafi et al., “Contrac-tile dysfunction irrespective of the mutant protein in humanhypertrophic cardiomyopathy with normal systolic function,”Circulation: Heart Failure, vol. 5, no. 1, pp. 36–46, 2012.
[26] V. Sequeira, P. J. M. Wijnker, L. L. A. M. Nijenkamp et al., “Per-turbed length-dependent activation in human hypertrophiccardiomyopathy with missense sarcomeric gene mutations,”Circulation Research, vol. 112, no. 11, pp. 1491–1505, 2013.
[27] N. Frey, M. Luedde, and H. A. Katus, “Mechanisms of disease:hypertrophic cardiomyopathy,” Nature Reviews Cardiology, vol.9, no. 2, pp. 91–100, 2012.

16 Stem Cells International
[28] B. J. Maron, “Hypertrophic cardiomyopathy: a systematicreview,” The Journal of the American Medical Association, vol.287, no. 10, pp. 1308–1320, 2002.
[29] P. Liang, F. Lan,A. S. Lee et al., “Drug screening using a library ofhuman induced pluripotent stem cell-derived cardiomyocytesreveals disease-specific patterns of cardiotoxicity,” Circulation,vol. 127, no. 16, pp. 1677–1691, 2013.
[30] P. Jaaskelainen, R. Miettinen, P. Karkkainen, L. Toivonen, M.Laakso, and J. Kuusisto, “Genetics of hypertrophic cardiomy-opathy in eastern Finland: few founder mutations with benignor intermediary phenotypes,” Annals of Medicine, vol. 36, no. 1,pp. 23–32, 2004.
[31] P. Jaaskelainen, J. Kuusisto, R. Miettinen et al., “Mutations inthe cardiacmyosin-binding protein C gene are the predominantcause of familial hypertrophic cardiomyopathy in eastern Fin-land,” Journal of Molecular Medicine, vol. 80, no. 7, pp. 412–422,2002.
[32] S. Marston, O. Copeland, A. Jacques et al., “Evidence fromhuman myectomy samples that MYBPC3 mutations causehypertrophic cardiomyopathy through haploinsufficiency,” Cir-culation Research, vol. 105, no. 3, pp. 219–222, 2009.
[33] W. Rottbauer, M. Gautel, J. Zehelein et al., “Novel splice donorsite mutation in the cardiac myosin-binding protein-C genein familial hypertrophic cardiomyopathy. Characterization ofcardiac transcript and protein,” Journal of Clinical Investigation,vol. 100, no. 2, pp. 475–482, 1997.
[34] S. J. Van Dijk, D. Dooijes, C. Dos Remedios et al., “Car-diac myosin-binding protein C mutations and hypertrophicardiomyopathy haploinsufficiency, deranged phosphorylation,and cardiomyocyte dysfunction,” Circulation, vol. 119, no. 11, pp.1473–1483, 2009.
[35] A. S. Helms, F. M. Davis, D. Coleman et al., “Sarcomeremutation-specific expression patterns in human hypertrophiccardiomyopathy,” Circulation: Cardiovascular Genetics, vol. 7,no. 4, pp. 434–443, 2014.
[36] J. L. Theis, J. M. Bos, J. D. Theis et al., “Expression patternsof cardiac myofilament proteins: genomic and protein analysisof surgical myectomy tissue from patients with obstructivehypertrophic cardiomyopathy,” Circulation: Heart Failure, vol.2, no. 4, pp. 325–333, 2009.

Submit your manuscripts athttp://www.hindawi.com
Hindawi Publishing Corporationhttp://www.hindawi.com Volume 2014
Anatomy Research International
PeptidesInternational Journal of
Hindawi Publishing Corporationhttp://www.hindawi.com Volume 2014
Hindawi Publishing Corporation http://www.hindawi.com
International Journal of
Volume 2014
Zoology
Hindawi Publishing Corporationhttp://www.hindawi.com Volume 2014
Molecular Biology International
GenomicsInternational Journal of
Hindawi Publishing Corporationhttp://www.hindawi.com Volume 2014
The Scientific World JournalHindawi Publishing Corporation http://www.hindawi.com Volume 2014
Hindawi Publishing Corporationhttp://www.hindawi.com Volume 2014
BioinformaticsAdvances in
Marine BiologyJournal of
Hindawi Publishing Corporationhttp://www.hindawi.com Volume 2014
Hindawi Publishing Corporationhttp://www.hindawi.com Volume 2014
Signal TransductionJournal of
Hindawi Publishing Corporationhttp://www.hindawi.com Volume 2014
BioMed Research International
Evolutionary BiologyInternational Journal of
Hindawi Publishing Corporationhttp://www.hindawi.com Volume 2014
Hindawi Publishing Corporationhttp://www.hindawi.com Volume 2014
Biochemistry Research International
ArchaeaHindawi Publishing Corporationhttp://www.hindawi.com Volume 2014
Hindawi Publishing Corporationhttp://www.hindawi.com Volume 2014
Genetics Research International
Hindawi Publishing Corporationhttp://www.hindawi.com Volume 2014
Advances in
Virolog y
Hindawi Publishing Corporationhttp://www.hindawi.com
Nucleic AcidsJournal of
Volume 2014
Stem CellsInternational
Hindawi Publishing Corporationhttp://www.hindawi.com Volume 2014
Hindawi Publishing Corporationhttp://www.hindawi.com Volume 2014
Enzyme Research
Hindawi Publishing Corporationhttp://www.hindawi.com Volume 2014
International Journal of
Microbiology