Research Article ISSN : 0975-7384 CODEN(USA) : JCPRC5 · solution of the metal chloride with molar...
13
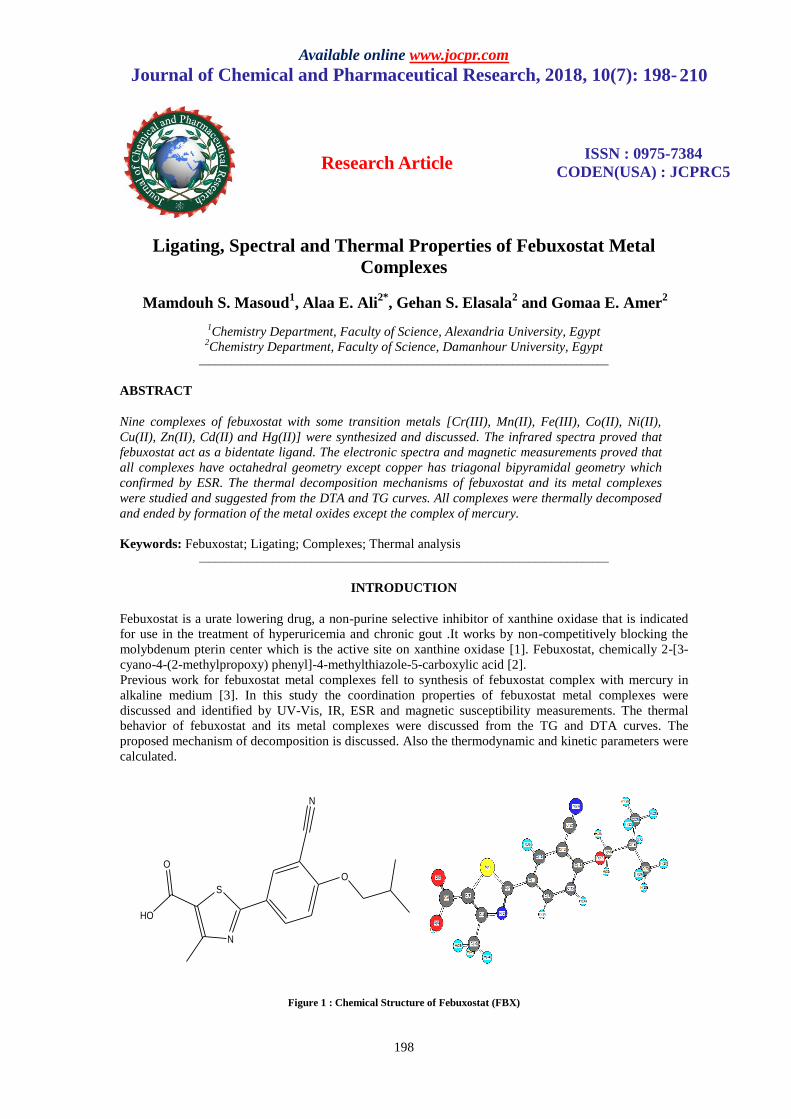
Available online www.jocpr.com Journal of Chemical and Pharmaceutical Research, 2018, 10(7): 198- 210 Research Article ISSN : 0975-7384 CODEN(USA) : JCPRC5 198 Ligating, Spectral and Thermal Properties of Febuxostat Metal Complexes Mamdouh S. Masoud 1 , Alaa E. Ali 2* , Gehan S. Elasala 2 and Gomaa E. Amer 2 1 Chemistry Department, Faculty of Science, Alexandria University, Egypt 2 Chemistry Department, Faculty of Science, Damanhour University, Egypt _____________________________________________________________________________ ABSTRACT Nine complexes of febuxostat with some transition metals [Cr(III), Mn(II), Fe(III), Co(II), Ni(II), Cu(II), Zn(II), Cd(II) and Hg(II)] were synthesized and discussed. The infrared spectra proved that febuxostat act as a bidentate ligand. The electronic spectra and magnetic measurements proved that all complexes have octahedral geometry except copper has triagonal bipyramidal geometry which confirmed by ESR. The thermal decomposition mechanisms of febuxostat and its metal complexes were studied and suggested from the DTA and TG curves. All complexes were thermally decomposed and ended by formation of the metal oxides except the complex of mercury. Keywords: Febuxostat; Ligating; Complexes; Thermal analysis _____________________________________________________________________________ INTRODUCTION Febuxostat is a urate lowering drug, a non-purine selective inhibitor of xanthine oxidase that is indicated for use in the treatment of hyperuricemia and chronic gout .It works by non-competitively blocking the molybdenum pterin center which is the active site on xanthine oxidase [1]. Febuxostat, chemically 2-[3- cyano-4-(2-methylpropoxy) phenyl]-4-methylthiazole-5-carboxylic acid [2]. Previous work for febuxostat metal complexes fell to synthesis of febuxostat complex with mercury in alkaline medium [3]. In this study the coordination properties of febuxostat metal complexes were discussed and identified by UV-Vis, IR, ESR and magnetic susceptibility measurements. The thermal behavior of febuxostat and its metal complexes were discussed from the TG and DTA curves. The proposed mechanism of decomposition is discussed. Also the thermodynamic and kinetic parameters were calculated. S N O HO O N Figure 1 : Chemical Structure of Febuxostat (FBX)
Transcript of Research Article ISSN : 0975-7384 CODEN(USA) : JCPRC5 · solution of the metal chloride with molar...
Available online www.jocpr.com
Journal of Chemical and Pharmaceutical Research, 2018, 10(7): 198- 210
Research Article ISSN : 0975-7384
CODEN(USA) : JCPRC5
198
Ligating, Spectral and Thermal Properties of Febuxostat Metal
Complexes
Mamdouh S. Masoud1, Alaa E. Ali
2*, Gehan S. Elasala
2 and Gomaa E. Amer
2
1Chemistry Department, Faculty of Science, Alexandria University, Egypt
2Chemistry Department, Faculty of Science, Damanhour University, Egypt
_____________________________________________________________________________
ABSTRACT
Nine complexes of febuxostat with some transition metals [Cr(III), Mn(II), Fe(III), Co(II), Ni(II),
Cu(II), Zn(II), Cd(II) and Hg(II)] were synthesized and discussed. The infrared spectra proved that
febuxostat act as a bidentate ligand. The electronic spectra and magnetic measurements proved that
all complexes have octahedral geometry except copper has triagonal bipyramidal geometry which
confirmed by ESR. The thermal decomposition mechanisms of febuxostat and its metal complexes
were studied and suggested from the DTA and TG curves. All complexes were thermally decomposed
and ended by formation of the metal oxides except the complex of mercury.
Keywords: Febuxostat; Ligating; Complexes; Thermal analysis _____________________________________________________________________________
INTRODUCTION
Febuxostat is a urate lowering drug, a non-purine selective inhibitor of xanthine oxidase that is indicated
for use in the treatment of hyperuricemia and chronic gout .It works by non-competitively blocking the
molybdenum pterin center which is the active site on xanthine oxidase [1]. Febuxostat, chemically 2-[3-
cyano-4-(2-methylpropoxy) phenyl]-4-methylthiazole-5-carboxylic acid [2].
Previous work for febuxostat metal complexes fell to synthesis of febuxostat complex with mercury in
alkaline medium [3]. In this study the coordination properties of febuxostat metal complexes were
discussed and identified by UV-Vis, IR, ESR and magnetic susceptibility measurements. The thermal
behavior of febuxostat and its metal complexes were discussed from the TG and DTA curves. The
proposed mechanism of decomposition is discussed. Also the thermodynamic and kinetic parameters were
calculated.
S
N
O
HO
O
N
Figure 1 : Chemical Structure of Febuxostat (FBX)
Mamdouh S. Masoud et al J. Chem. Pharm. Res., 2018, 10(7): 198-210
199
EXPERIMENTAL SECTION
The solution of febuxostst was prepared by dissolving the solid in hot ethanol, while the solutions of the
salts [Cr(III), Mn(II), Fe(III), Co(II), Ni(II), Cu(II), Zn(II), Cd(II) and Hg(II)] as chlorides were prepared
by dissolving the salt in 50 ml bidistilled water. The solution of febuxostst was mixed with the aqueous
solution of the metal chloride with molar ratio (1:1). The obtained precipitates were isolated by filtration,
and then washed by EtOH-H2O and dried in a vacuum desiccator over anhydrous CaCl2.The analytical
data, Table 1, of the prepared complexes examined by usual methods [4]. The chloride contents of the
complexes were analyzed by using Volhard method [5]. Also the contents of metals were determined by
using atomic absorption spectroscopy and complexometric analysis [6].
Measurements
The electronic spectra of the solid metal complexes were measured in Nujol mull spectra by use Unicam
UV/Vis spectrometer [7]. The IR spectra of the febuxostst and its metal complexes were recorded on
Perkin Elmer spectrophotometer, Model 1430 which it is range of 400-4000 cm-1. The Molar magnetic
susceptibilities were determined by using Pascal’s constants at room temperature using Faraday’s method.
The electron spin resonance spectra were recorded on reflection spectrometer operating at (9.1–9.8) GHZ
in a cylindrical resonance cavity with 100 KHZ modulation. The values of g were determined by
comparison with the standard DPPH signal. Differential thermal analysis and thermogravimetric analysis
of the ligand and its complexes were recorded on Shimadzu DTA/TGA-60 thermal analyzer with heating
rate 10°C/min under nitrogen atmosphere of flow rate 20 ml/min. Hyperchem computer program using
PM3 semi-empirical and Molecular Mechanics Force Field (MM+) is applied for ligand.
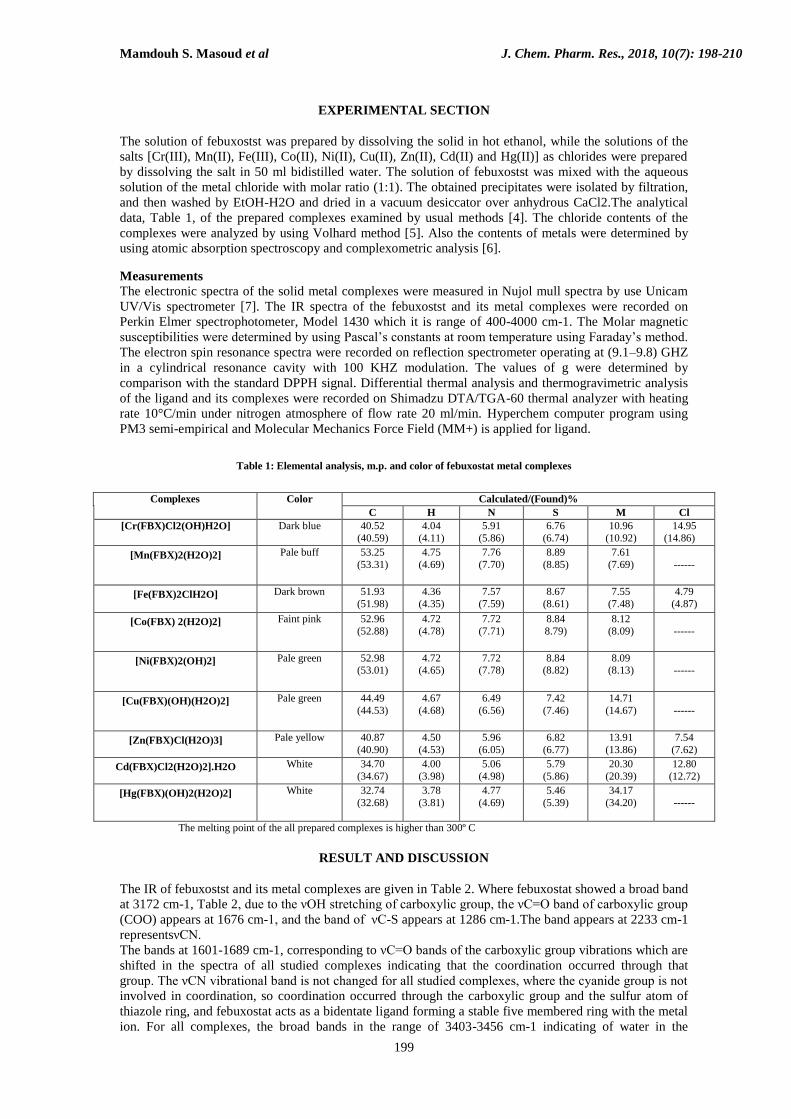
Table 1: Elemental analysis, m.p. and color of febuxostat metal complexes
Calculated/(Found)% Color Complexes
Cl M S N H C
14.95
(14.86)
10.96
(10.92)
6.76
(6.74)
5.91
(5.86)
4.04
(4.11)
40.52
(40.59)
Dark blue [Cr(FBX)Cl2(OH)H2O]
------
7.61
(7.69)
8.89
(8.85)
7.76
(7.70)
4.75
(4.69)
53.25
(53.31)
Pale buff [Mn(FBX)2(H2O)2]
4.79
(4.87)
7.55
(7.48)
8.67
(8.61)
7.57
(7.59)
4.36
(4.35)
51.93
(51.98)
Dark brown [Fe(FBX)2ClH2O]
------
8.12
(8.09)
8.84
8.79)
7.72
(7.71)
4.72
(4.78)
52.96
(52.88)
Faint pink [Co(FBX) 2(H2O)2]
------
8.09
(8.13) 8.84
(8.82) 7.72
(7.78) 4.72
(4.65) 52.98
(53.01) Pale green [Ni(FBX)2(OH)2]
------
14.71
(14.67)
7.42
(7.46)
6.49
(6.56)
4.67
(4.68)
44.49
(44.53)
Pale green [Cu(FBX)(OH)(H2O)2]
7.54
(7.62)
13.91
(13.86)
6.82
(6.77)
5.96
(6.05)
4.50
(4.53)
40.87
(40.90)
Pale yellow [Zn(FBX)Cl(H2O)3]
12.80
(12.72)
20.30
(20.39)
5.79
(5.86)
5.06
(4.98)
4.00
(3.98)
34.70
(34.67)
White Cd(FBX)Cl2(H2O)2].H2O
------
34.17
(34.20)
5.46
(5.39)
4.77
(4.69)
3.78
(3.81)
32.74
(32.68)
White [Hg(FBX)(OH)2(H2O)2]
The melting point of the all prepared complexes is higher than 300º C
RESULT AND DISCUSSION
The IR of febuxostst and its metal complexes are given in Table 2. Where febuxostat showed a broad band
at 3172 cm-1, Table 2, due to the νOH stretching of carboxylic group, the νC=O band of carboxylic group
(COO) appears at 1676 cm-1, and the band of νC-S appears at 1286 cm-1.The band appears at 2233 cm-1
representsνCN.
The bands at 1601-1689 cm-1, corresponding to νC=O bands of the carboxylic group vibrations which are
shifted in the spectra of all studied complexes indicating that the coordination occurred through that
group. The νCN vibrational band is not changed for all studied complexes, where the cyanide group is not
involved in coordination, so coordination occurred through the carboxylic group and the sulfur atom of
thiazole ring, and febuxostat acts as a bidentate ligand forming a stable five membered ring with the metal
ion. For all complexes, the broad bands in the range of 3403-3456 cm-1 indicating of water in the
Mamdouh S. Masoud et al J. Chem. Pharm. Res., 2018, 10(7): 198-210
200
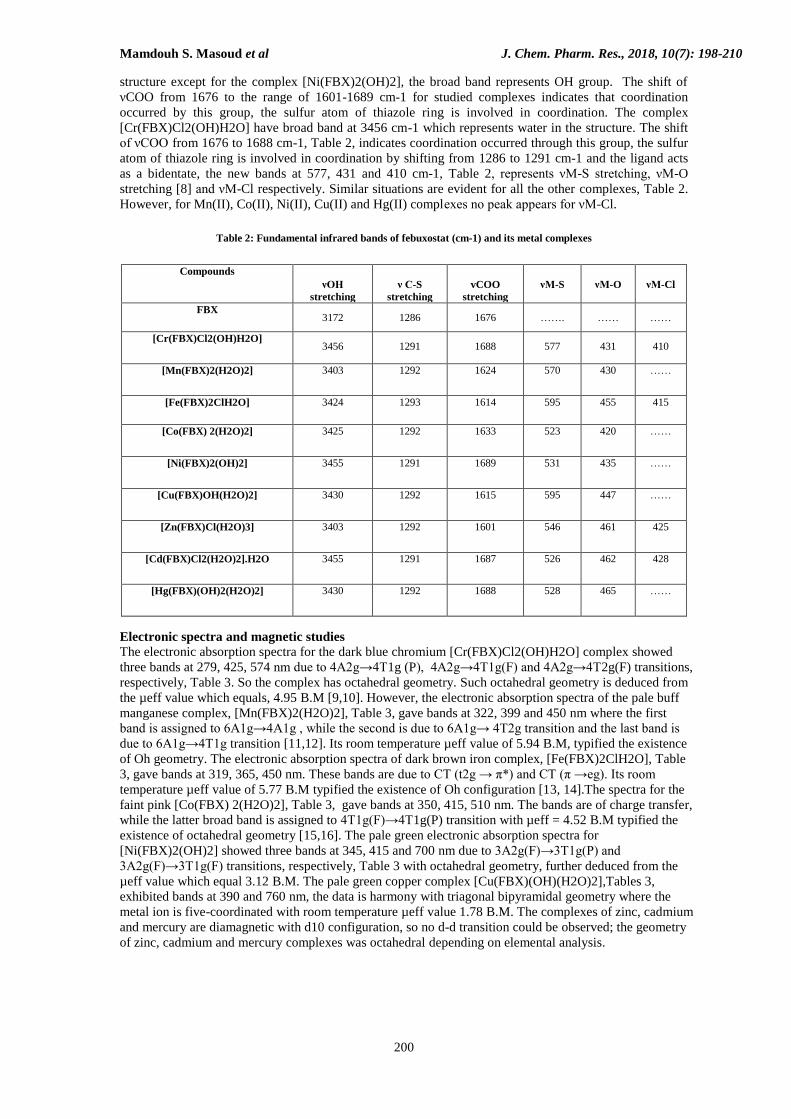
structure except for the complex [Ni(FBX)2(OH)2], the broad band represents OH group. The shift of
νCOO from 1676 to the range of 1601-1689 cm-1 for studied complexes indicates that coordination
occurred by this group, the sulfur atom of thiazole ring is involved in coordination. The complex
[Cr(FBX)Cl2(OH)H2O] have broad band at 3456 cm-1 which represents water in the structure. The shift
of νCOO from 1676 to 1688 cm-1, Table 2, indicates coordination occurred through this group, the sulfur
atom of thiazole ring is involved in coordination by shifting from 1286 to 1291 cm-1 and the ligand acts
as a bidentate, the new bands at 577, 431 and 410 cm-1, Table 2, represents νM-S stretching, νM-O
stretching [8] and νM-Cl respectively. Similar situations are evident for all the other complexes, Table 2.
However, for Mn(II), Co(II), Ni(II), Cu(II) and Hg(II) complexes no peak appears for νM-Cl.
Table 2: Fundamental infrared bands of febuxostat (cm-1) and its metal complexes
Compounds
νOH
stretching
ν C-S
stretching
vCOO
stretching
νM-S νM-O νM-Cl
FBX 3172 1286 1676 ……. …… ……
[Cr(FBX)Cl2(OH)H2O] 3456 1291 1688 577 431 410
[Mn(FBX)2(H2O)2] 3403 1292 1624 570 430 ……
[Fe(FBX)2ClH2O] 3424 1293 1614 595 455 415
[Co(FBX) 2(H2O)2] 3425 1292 1633 523 420 ……
[Ni(FBX)2(OH)2] 3455 1291 1689 531 435 ……
[Cu(FBX)OH(H2O)2] 3430 1292 1615 595 447 ……
[Zn(FBX)Cl(H2O)3] 3403 1292 1601 546 461 425
[Cd(FBX)Cl2(H2O)2].H2O 3455 1291 1687 526 462 428
[Hg(FBX)(OH)2(H2O)2] 3430 1292 1688 528 465 ……
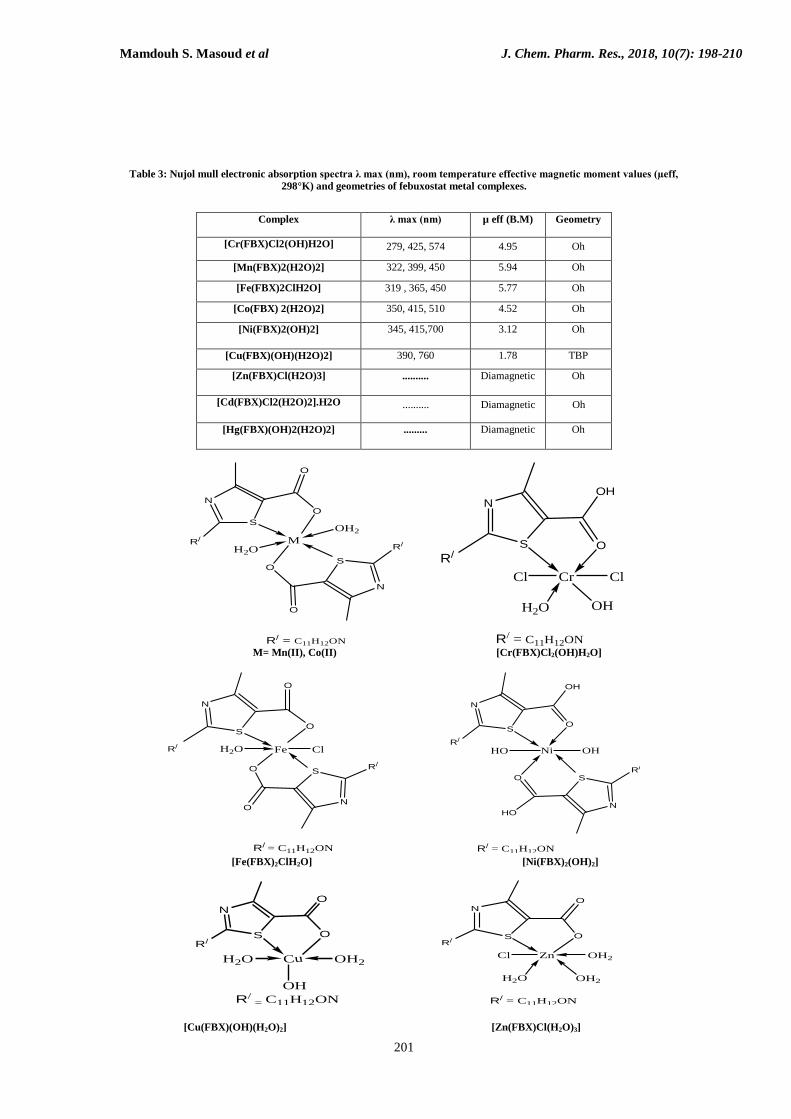
Electronic spectra and magnetic studies
The electronic absorption spectra for the dark blue chromium [Cr(FBX)Cl2(OH)H2O] complex showed
three bands at 279, 425, 574 nm due to 4A2g→4T1g (P), 4A2g→4T1g(F) and 4A2g→4T2g(F) transitions,
respectively, Table 3. So the complex has octahedral geometry. Such octahedral geometry is deduced from
the µeff value which equals, 4.95 B.M [9,10]. However, the electronic absorption spectra of the pale buff
manganese complex, [Mn(FBX)2(H2O)2], Table 3, gave bands at 322, 399 and 450 nm where the first
band is assigned to 6A1g→4A1g , while the second is due to 6A1g→ 4T2g transition and the last band is
due to 6A1g→4T1g transition [11,12]. Its room temperature µeff value of 5.94 B.M, typified the existence
of Oh geometry. The electronic absorption spectra of dark brown iron complex, [Fe(FBX)2ClH2O], Table
3, gave bands at 319, 365, 450 nm. These bands are due to CT (t2g → π*) and CT (π →eg). Its room
temperature µeff value of 5.77 B.M typified the existence of Oh configuration [13, 14].The spectra for the
faint pink [Co(FBX) 2(H2O)2], Table 3, gave bands at 350, 415, 510 nm. The bands are of charge transfer,
while the latter broad band is assigned to 4T1g(F)→4T1g(P) transition with µeff = 4.52 B.M typified the
existence of octahedral geometry [15,16]. The pale green electronic absorption spectra for
[Ni(FBX)2(OH)2] showed three bands at 345, 415 and 700 nm due to 3A2g(F)→3T1g(P) and
3A2g(F)→3T1g(F) transitions, respectively, Table 3 with octahedral geometry, further deduced from the
µeff value which equal 3.12 B.M. The pale green copper complex [Cu(FBX)(OH)(H2O)2],Tables 3,
exhibited bands at 390 and 760 nm, the data is harmony with triagonal bipyramidal geometry where the
metal ion is five-coordinated with room temperature µeff value 1.78 B.M. The complexes of zinc, cadmium
and mercury are diamagnetic with d10 configuration, so no d-d transition could be observed; the geometry
of zinc, cadmium and mercury complexes was octahedral depending on elemental analysis.
Mamdouh S. Masoud et al J. Chem. Pharm. Res., 2018, 10(7): 198-210
201
Table 3: Nujol mull electronic absorption spectra λ max (nm), room temperature effective magnetic moment values (µeff,
298°K) and geometries of febuxostat metal complexes.
Complex λ max (nm) µ eff (B.M) Geometry
[Cr(FBX)Cl2(OH)H2O] 279, 425, 574 4.95 Oh
[Mn(FBX)2(H2O)2] 322, 399, 450 5.94 Oh
[Fe(FBX)2ClH2O] 319 , 365, 450 5.77 Oh
[Co(FBX) 2(H2O)2] 350, 415, 510 4.52 Oh
[Ni(FBX)2(OH)2] 345, 415,700 3.12 Oh
[Cu(FBX)(OH)(H2O)2] 390, 760 1.78 TBP
[Zn(FBX)Cl(H2O)3] .......... Diamagnetic Oh
[Cd(FBX)Cl2(H2O)2].H2O .......... Diamagnetic Oh
[Hg(FBX)(OH)2(H2O)2]
......... Diamagnetic Oh
S
N
O
R/
S
N
O
O
R/ M
O
OH2
H2O
R/ = C11H12ON
S
N
O
OH
Cr ClCl
H2O OH
R/
R/ = C11H12ON M= Mn(II), Co(II) [Cr(FBX)Cl2(OH)H2O]
S
NO
R/
S
N
O
O
Fe
O
ClH2OR/
R/ = C11H12ON
S
NHO
R/
S
N
OH
O
R/
Ni
O
OHHO
R/ = C11H12ON [Fe(FBX)2ClH2O] [Ni(FBX)2(OH)2]
S
N
O
R/O
Cu
OH
OH2H2O
R/ = C11H12ON
S
NO
OR/
ZnCl
H2O
OH2
OH2
R/ = C11H12ON
[Cu(FBX)(OH)(H2O)2] [Zn(FBX)Cl(H2O)3]
Mamdouh S. Masoud et al J. Chem. Pharm. Res., 2018, 10(7): 198-210
202
S
NOH
OR/
HgHO
H2O
OH
OH2
R/ = C11H12ON
S
N
O
OH
R/
CdCl Cl
H2O OH2
H2O
R/ = C11H12ON [Hg(FBX)(OH)2(H2O)2] [Cd(FBX)Cl2(H2O)2].H2O
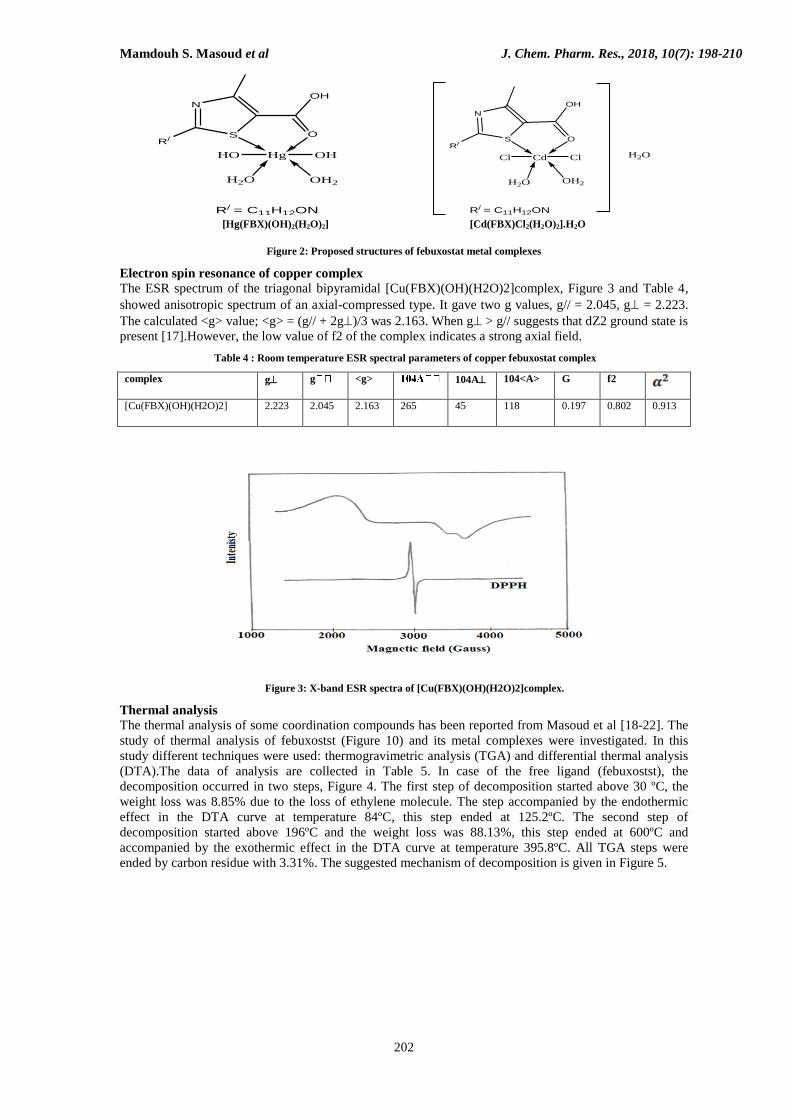
Figure 2: Proposed structures of febuxostat metal complexes
Electron spin resonance of copper complex
The ESR spectrum of the triagonal bipyramidal [Cu(FBX)(OH)(H2O)2]complex, Figure 3 and Table 4,
showed anisotropic spectrum of an axial-compressed type. It gave two g values, g// = 2.045, g = 2.223.
The calculated <g> value; <g> = (g// + 2g)/3 was 2.163. When g > g// suggests that dZ2 ground state is
present [17].However, the low value of f2 of the complex indicates a strong axial field.
Table 4 : Room temperature ESR spectral parameters of copper febuxostat complex
complex g g <g> 104A 104<A> G f2
[Cu(FBX)(OH)(H2O)2] 2.223 2.045 2.163 265 45 118 0.197 0.802 0.913
Figure 3: X-band ESR spectra of [Cu(FBX)(OH)(H2O)2]complex.
Thermal analysis
The thermal analysis of some coordination compounds has been reported from Masoud et al [18-22]. The
study of thermal analysis of febuxostst (Figure 10) and its metal complexes were investigated. In this
study different techniques were used: thermogravimetric analysis (TGA) and differential thermal analysis
(DTA).The data of analysis are collected in Table 5. In case of the free ligand (febuxostst), the
decomposition occurred in two steps, Figure 4. The first step of decomposition started above 30 ºC, the
weight loss was 8.85% due to the loss of ethylene molecule. The step accompanied by the endothermic
effect in the DTA curve at temperature 84ºC, this step ended at 125.2ºC. The second step of
decomposition started above 196ºC and the weight loss was 88.13%, this step ended at 600ºC and
accompanied by the exothermic effect in the DTA curve at temperature 395.8ºC. All TGA steps were
ended by carbon residue with 3.31%. The suggested mechanism of decomposition is given in Figure 5.

Mamdouh S. Masoud et al J. Chem. Pharm. Res., 2018, 10(7): 198-210
203
Figure 4: TGA and DTA curves for febuxostat
S
N
OO
N
OH
19.7-195.2oC C2H4 8.85%
C6H6 24.65%3CO 26.55%H2S 10.75%2C2H2 16.44%N2 8.85%
195.2-599.8oC
S
N
OO
N
OH
2-(3-cyano-4-isobutoxy-phenyl)-4-methyl-thiazole-5-carboxylic acid
2-(3-cyano-4-ethoxy-phenyl)-4-methyl-thiazole-5-carboxylic acid
C
Mamdouh S. Masoud et al J. Chem. Pharm. Res., 2018, 10(7): 198-210
204
Figure 5: Suggested mechanism of decomposition of febuxostat
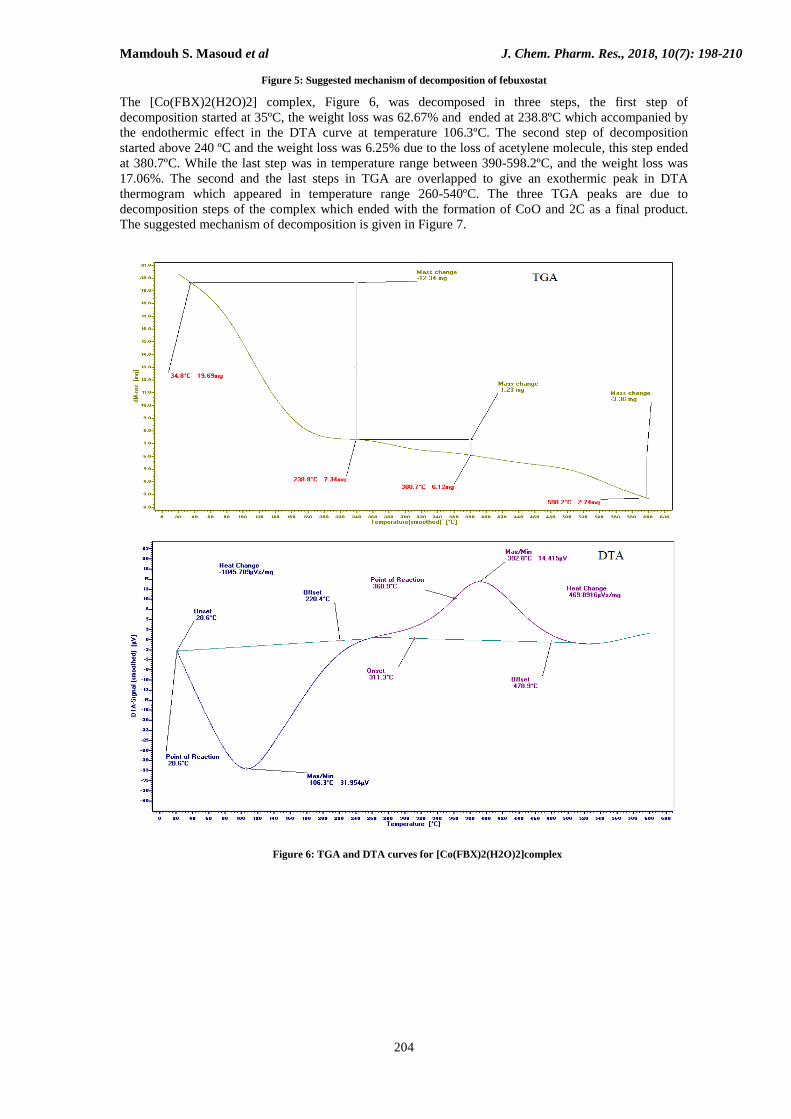
The [Co(FBX)2(H2O)2] complex, Figure 6, was decomposed in three steps, the first step of
decomposition started at 35ºC, the weight loss was 62.67% and ended at 238.8ºC which accompanied by
the endothermic effect in the DTA curve at temperature 106.3ºC. The second step of decomposition
started above 240 ºC and the weight loss was 6.25% due to the loss of acetylene molecule, this step ended
at 380.7ºC. While the last step was in temperature range between 390-598.2ºC, and the weight loss was
17.06%. The second and the last steps in TGA are overlapped to give an exothermic peak in DTA
thermogram which appeared in temperature range 260-540ºC. The three TGA peaks are due to
decomposition steps of the complex which ended with the formation of CoO and 2C as a final product.
The suggested mechanism of decomposition is given in Figure 7.
Figure 6: TGA and DTA curves for [Co(FBX)2(H2O)2]complex
Mamdouh S. Masoud et al J. Chem. Pharm. Res., 2018, 10(7): 198-210
205
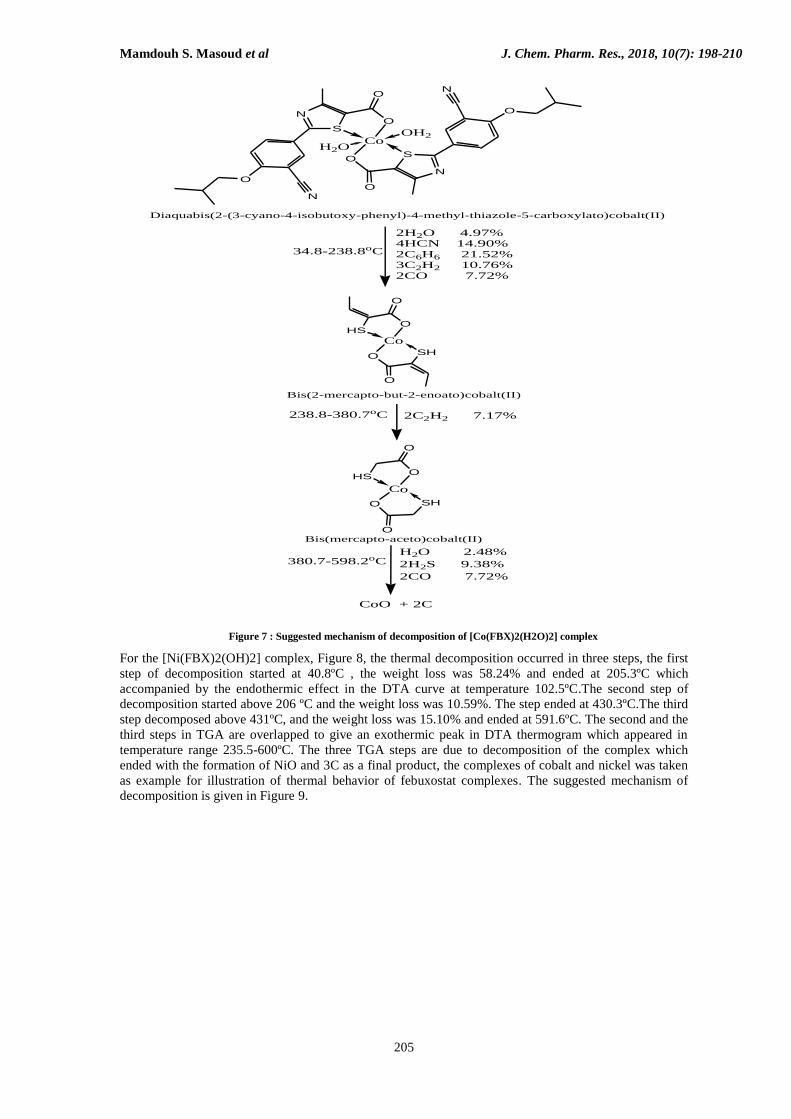
Figure 7 : Suggested mechanism of decomposition of [Co(FBX)2(H2O)2] complex
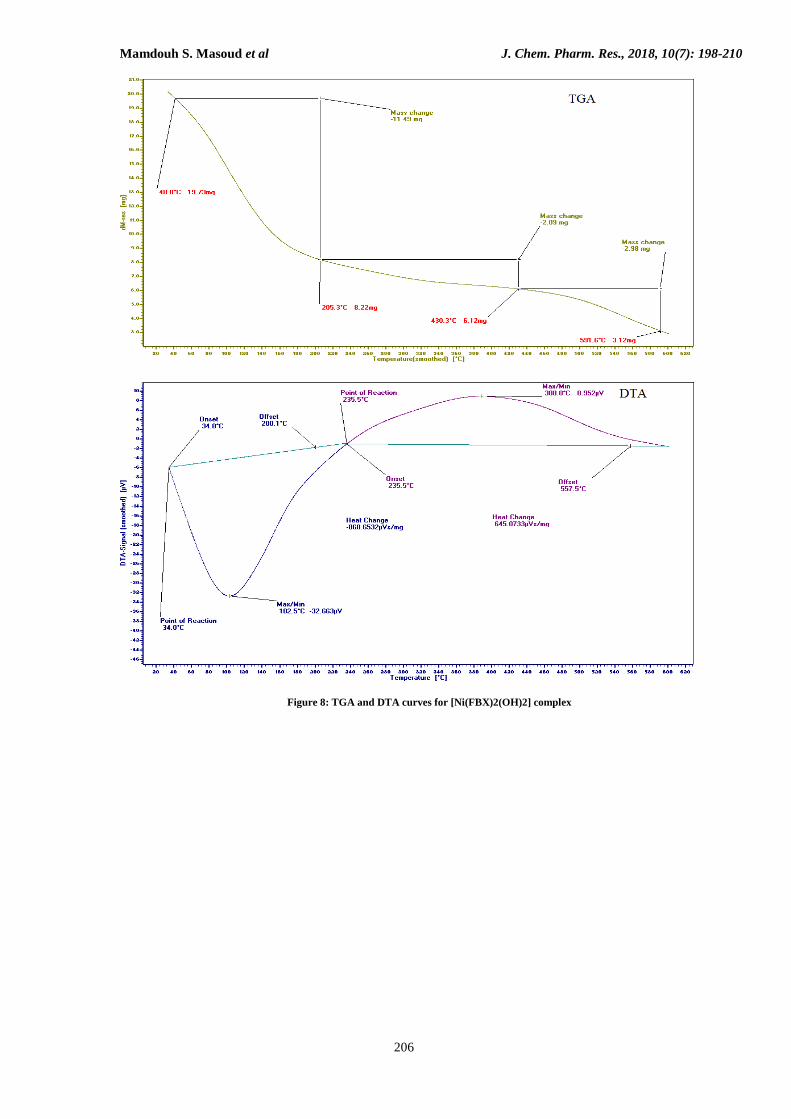
For the [Ni(FBX)2(OH)2] complex, Figure 8, the thermal decomposition occurred in three steps, the first
step of decomposition started at 40.8ºC , the weight loss was 58.24% and ended at 205.3ºC which
accompanied by the endothermic effect in the DTA curve at temperature 102.5ºC.The second step of
decomposition started above 206 ºC and the weight loss was 10.59%. The step ended at 430.3ºC.The third
step decomposed above 431ºC, and the weight loss was 15.10% and ended at 591.6ºC. The second and the
third steps in TGA are overlapped to give an exothermic peak in DTA thermogram which appeared in
temperature range 235.5-600ºC. The three TGA steps are due to decomposition of the complex which
ended with the formation of NiO and 3C as a final product, the complexes of cobalt and nickel was taken
as example for illustration of thermal behavior of febuxostat complexes. The suggested mechanism of
decomposition is given in Figure 9.
S
N
O
O
N
S
N
O
O
O
N
Co
O
OH2
H2O
SH
O
HS
O
O
Co
O
SH
O
HS
O
O
Co
O
34.8-238.8oC
2H2O 4.97% 4HCN 14.90%2C6H6 21.52%3C2H2 10.76%2CO 7.72%
238.8-380.7oC 2C2H2 7.17%
380.7-598.2oCH2O 2.48%
2H2S 9.38%
2CO 7.72%
CoO + 2C
Diaquabis(2-(3-cyano-4-isobutoxy-phenyl)-4-methyl-thiazole-5-carboxylato)cobalt(II)
Bis(2-mercapto-but-2-enoato)cobalt(II)
Bis(mercapto-aceto)cobalt(II)
Mamdouh S. Masoud et al J. Chem. Pharm. Res., 2018, 10(7): 198-210
206
Figure 8: TGA and DTA curves for [Ni(FBX)2(OH)2] complex
Mamdouh S. Masoud et al J. Chem. Pharm. Res., 2018, 10(7): 198-210
207
S
N
HO
O
N
S
N
OH
O
O
N
Ni
O
OHHO
40.8-205.3oC
2H2O 4.96% 4HCN 14.88%2C6H6 21.50%3C2H2 9.93%2CO 7.71%
205.3-430.3oC2CO 7.71%C2H2 3.59%
430.3-591.6oCH2O 2.48%
2H2S 9.38%
CH4 2.21%
NiO + 3C
SH
O
HS
O
O
Ni
O
SH
HS O
Ni
O
Dihydroxobis((2-(3-cyano-4-isobutoxy-phenyl)-4-methyl-thiazole-5-carboxylic acid))nickel(II)
Bis((2-mercapto-but-2-enoato))nickel(II)
Bis((2-mercapto-ethoxo))nickel(II)
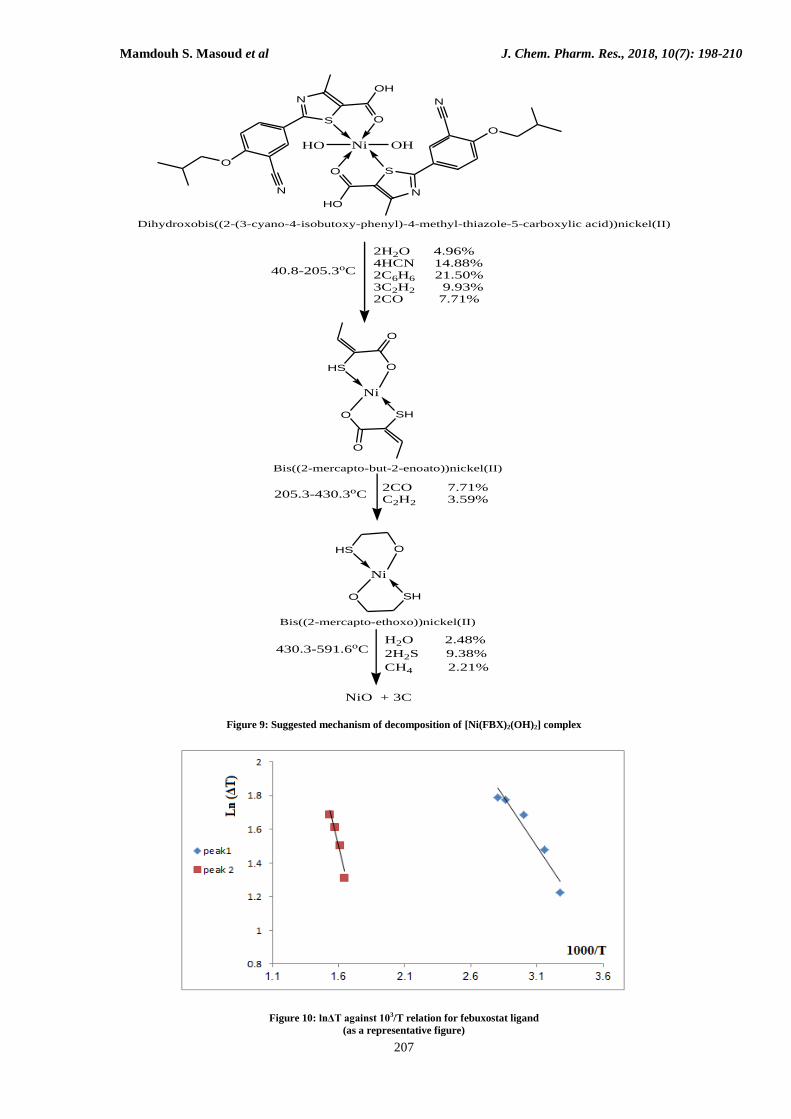
Figure 9: Suggested mechanism of decomposition of [Ni(FBX)2(OH)2] complex
Figure 10: lnΔT against 103/T relation for febuxostat ligand
(as a representative figure)

Mamdouh S. Masoud et al J. Chem. Pharm. Res., 2018, 10(7): 198-210
208
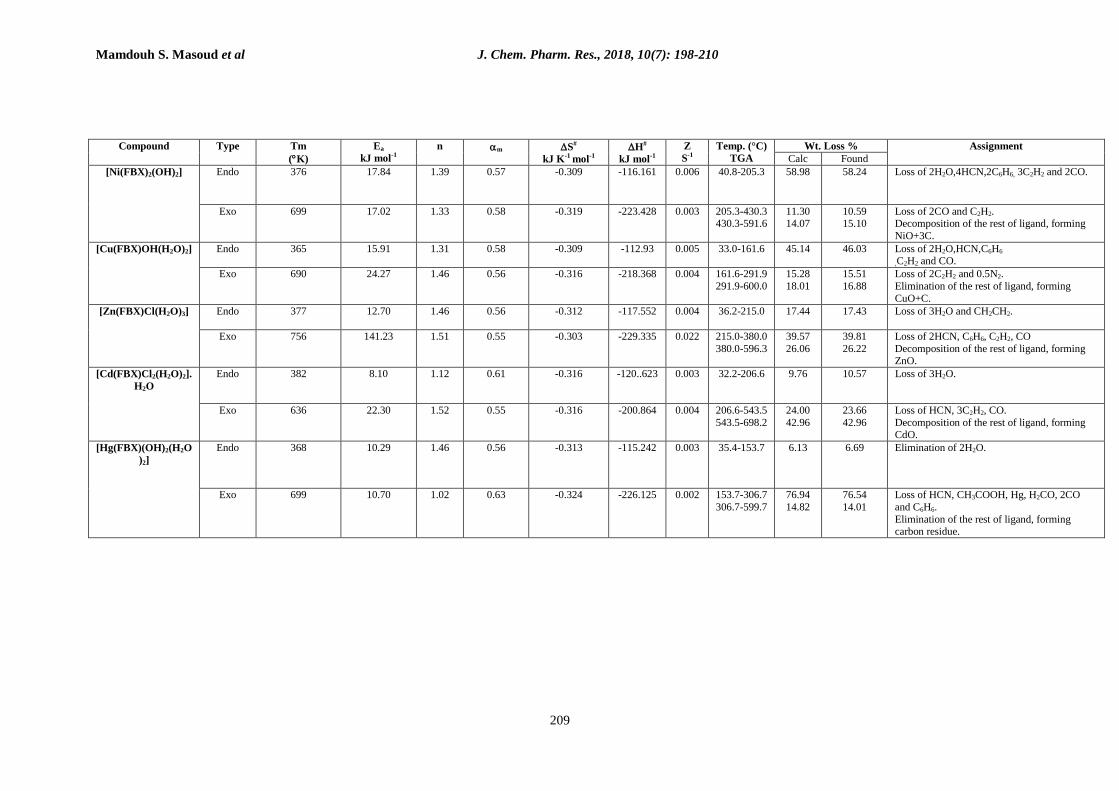
Table 5 : DTA analysis of febuxostat and its metal complexes
Compound Type Tm
(K)
Ea
kJ mol-1
n m S#
kJ K-1 mol-1
H#
kJ mol-1
Z
S-1
Temp.
(°C)
TGA
Wt. Loss % Assignment
Calc Found
Febuxostat Endo 357 9.72 1.44 0.56 -0.313 -111.786 0.003 19.7-195.2 8.85 8.39 Elimination of C2H4.
Exo 669 21.53 1.58 0.55 -0.317 -212.046 0.033 195.2-599.8
87.24 88.13 Loss of C6H6, 3CO, N2 2C2H2 and H2S, forming C as residue.
[Cr(FBX)Cl2(OH)H2
O]
Endo 368 20.00 1.28 0.59 -0.308 -113.209 0.007 33.7-122.2
122.2-
285.2
48.53
19.1
50.67
19.91
Loss of H2O, 2HCN, C6H6, 2C2H2 and CO.
loss of CO, HCl and C2H2.
Exo 676 57.48 1.28 0.59 -0.309 -208.861 0.010 159.8-
322.1
27.61 26.61 Elimination of the rest of ligand, forming
0.5Cr2O3.
[Mn(FBX)2(H2O)2] Endo 363.4 21.37 1.13 0.61 -0.307 -111.518 0.007 40.2-166.9 41.82 43.18 Loss of 2H2O ,2HCN,6C2H2 ,and 2CO.
Exo 804.7 27.19 1.38 0.57 -0.318 -255.967 0.004 166.9-
367.0
367.0-599.9
18.53
19.64
18.27
18.87
Loss of 2HCN, 2C2H2 and C2H4
Decomposition of the rest of ligand, forming
MnO+6C.
[Fe(FBX)2ClH2O] Endo 361 14.66 1.29 0.58 -0.310 -111.873 0.005 34.5-227.8 45.37 44.09 Elimination of H2O,2HCN, 2C6H6 ,2C2H2 and
2CO.
Exo 741 26.58 1.16 0.60 -0.317 -234.827 0.004 227.8-
431.1 431.1-
597.9
7.56
23.16
6.87
22.27
Elimination of 2C2H4.
Decomposition of the rest of ligand, forming 0.5Fe2O3+8C.
[Co(FBX)2(H2O)2] Endo 379 13.86 1.34 0.58 -0.311 -117.934 0.004 34.8-238.8 59.87 62.67 Elimination of 2H2O,4HCN, 2C6H6 ,3C2H2 and
2CO.
Exo 665 49.61 1.26 0.59 -0.309 -206.096 0.009 238.8-380.7
380.7-
598.2
7.17 19.58
6.25 17.06
Loss of 2C2H2. Elimination of the rest of ligand, forming
CoO+2C.
Mamdouh S. Masoud et al J. Chem. Pharm. Res., 2018, 10(7): 198-210
209
Compound Type Tm
(K)
Ea
kJ mol-1
n m S#
kJ K-1 mol-1
H#
kJ mol-1
Z
S-1
Temp. (°C)
TGA
Wt. Loss % Assignment
Calc Found
[Ni(FBX)2(OH)2] Endo 376 17.84 1.39 0.57 -0.309 -116.161 0.006 40.8-205.3 58.98 58.24 Loss of 2H2O,4HCN,2C6H6, 3C2H2 and 2CO.
Exo 699 17.02 1.33 0.58 -0.319 -223.428 0.003 205.3-430.3 430.3-591.6
11.30 14.07
10.59 15.10
Loss of 2CO and C2H2. Decomposition of the rest of ligand, forming
NiO+3C.
[Cu(FBX)OH(H2O)2] Endo 365 15.91 1.31 0.58 -0.309 -112.93 0.005 33.0-161.6 45.14 46.03 Loss of 2H2O,HCN,C6H6
,C2H2 and CO.
Exo 690 24.27 1.46 0.56 -0.316 -218.368 0.004 161.6-291.9
291.9-600.0
15.28
18.01
15.51
16.88
Loss of 2C2H2 and 0.5N2.
Elimination of the rest of ligand, forming
CuO+C.
[Zn(FBX)Cl(H2O)3] Endo 377 12.70 1.46 0.56 -0.312 -117.552 0.004 36.2-215.0 17.44 17.43 Loss of 3H2O and CH2CH2.
Exo 756 141.23 1.51 0.55 -0.303 -229.335 0.022 215.0-380.0
380.0-596.3
39.57
26.06
39.81
26.22
Loss of 2HCN, C6H6, C2H2, CO
Decomposition of the rest of ligand, forming ZnO.
[Cd(FBX)Cl2(H2O)2].
H2O
Endo
382 8.10 1.12 0.61 -0.316 -120..623 0.003 32.2-206.6 9.76 10.57 Loss of 3H2O.
Exo 636 22.30 1.52 0.55 -0.316 -200.864 0.004 206.6-543.5
543.5-698.2
24.00
42.96
23.66
42.96
Loss of HCN, 3C2H2, CO.
Decomposition of the rest of ligand, forming CdO.
[Hg(FBX)(OH)2(H2O
)2]
Endo 368 10.29 1.46 0.56 -0.313 -115.242 0.003 35.4-153.7 6.13 6.69 Elimination of 2H2O.
Exo 699 10.70 1.02 0.63 -0.324 -226.125 0.002 153.7-306.7
306.7-599.7
76.94
14.82
76.54
14.01
Loss of HCN, CH3COOH, Hg, H2CO, 2CO
and C6H6.
Elimination of the rest of ligand, forming carbon residue.

Mamdouh S. Masoud et al J. Chem. Pharm. Res., 2018, 10(7): 198-210
210
CONCLUSION
The complexes of febuxostat was synthesized and characterized by different spectroscopic methods. The
stoichiometry of complexes was determined by the analytical data. All complexes have octahedral
geometries except copper complex has triagonal bipyramidal geometry. The Nujol mull electronic spectra
confirmed these results. An ESR spectrum of copper complex was studied. The spectral data confirmed that
febuxostat acts as a bidentate ligand. The kinetic and thermodynamic parameters were calculated from the
differential thermal analysis curves. All complexes were thermally decomposed and ended by formation of
metal oxides except the complex of mercury.
REFERENCES
[1] Love BL; Barrons R; Veverka A; Snider KM. Pharmacotherapy. 2010, 30(6), 594-608
[2] Savjani K; Gajjar A; Savjani J. Int J of Pharm and Pharm Sci. 2016, 8(1), 359-366. [3] Somasekhar G; Mamatha P; Rani SN; Kumar NR; Zabiullah SI; Basha MM. Int J of Chem
and Pharm Sci. 2016, 4(8), 434–438
[4] Vogel AI. A Text Book of Quantitative Inorganic Analysis, Longmans, London. 1989.
[5] Lee RH; Griswold E; Kleinberg. J Inorg Chem. 1964, 3, 1278-1283
[6] Schwarzenbach G. Complexometric Titration, Translated by H, Methuen Co., London, Irving.
1957. [7] Mohamed GB; Masoud MS; Hindawy AM; Ahmed RH. J Pharm Sci. 1989, 3(2), 141-145.
[8] Price ER; Wasson JR. J Inorg Nucl Chem. 1974, 36 (1) 711-716.
[9] Howlader MBH; Islam MS; Karim MR. J Chem. 2000, 39, 407-409.
[10] Sreekanth A; Joseph M; Fun HK; Kurup MRP. Polyhedron. 2006, 25(6), 1408-1414.
[11] Buhl F; Sroka BS. Chem Anal. 2003, 48, 58-145.
[12] Barefield DW. J Inorg Nucl Chem. 1961, 22, 3-4.
[13] Barnum DW. J Inorg Nucl Chem. 1961, 22(4), 183-191.
[14] Lever ABP. Elsevier publish Co, Amsterdam, 1968.
[15] Barefield EK; Busch DH; Nelson SM. Quart Rev. 1968, 22(4), 457- 498.
[16] Masoud MS; Zaki ZM. Transition Met Chem. 1988, 13(5), 321-327
[17] Garribba E; Micera G. J of Chem Edu. 2006, 83(8), 1229.
[18] Masoud MS; Ali AE; Ahmed HM; Mohamed EA. J Mol Str. 2013, 1050, 43-52.
[19] Masoud MS; Ali AE; Elasala GS. Spectrochim. Acta A. 2015, 149, 363-377.
[20] Masoud MS; Ali AE; Ghareeb DA; Nasr NM. J Mol Str. 2015, 1099, 359-372.
[21] Masoud MS; Ali AE; Elasala GS; Kolkaila AS. J chem pharm Res. 2017, 9(4), 171-179.
[22] Masoud MS; Ali AE; Elasala GS; Kolkaila AS. Spectrochim.Acta A 2018, 193, 458-466