Research Article Influence of Cooling Rate on Microsegregation...
19
Research Article Influence of Cooling Rate on Microsegregation Behavior of Magnesium Alloys Md. Imran Khan, 1 Ahmad O. Mostafa, 1 Mohammad Aljarrah, 2 Elhachmi Essadiqi, 3 and Mamoun Medraj 1 1 Mechanical and Industrial Engineering Department, Concordia University, 1455 de Maisonneuve Boulevard West, Montreal, QC, Canada H3G 1M8 2 Industrial Engineering Department, e Hashemite University, P.O. Box 330127, Zarqa 13115, Jordan 3 Renewable Energy & Advanced Materials Research Lab, International University of Rabat, Technopolis, 11 100 Sala el Jadida, Morocco Correspondence should be addressed to Mamoun Medraj; [email protected] Received 28 November 2013; Revised 7 January 2014; Accepted 10 January 2014; Published 3 March 2014 Academic Editor: Necmettin Maras ¸lı Copyright © 2014 Md. Imran Khan et al. is is an open access article distributed under the Creative Commons Attribution License, which permits unrestricted use, distribution, and reproduction in any medium, provided the original work is properly cited. e effect of cooling rate on microstructure and microsegregation of three commercially important magnesium alloys was investigated using Wedge (V-shaped) castings of AZ91D, AM60B, and AE44 alloys. ermocouples were distributed to measure the cooling rate at six different locations of the wedge casts. Solute redistribution profiles were drawn based on the chemical composition analysis obtained by EDS/WDS analysis. Microstructural and morphological features such as dendrite arm spacing and secondary phase particle size were analyzed using both optical and scanning electron microscopes. Dendritic arm spacing and secondary phase particle size showed an increasing trend with decreasing cooling rate for the three alloys. Area percentage of secondary phase particles decreased with decreasing cooling rate for AE44 alloy. e trend was different for AZ91D and AM60B alloys, for both alloys, area percentage of -Mg 17 Al 12 increased with decreasing cooling rate up to location 4 and then decreased slightly. e tendency for microsegregation was more severe at slower cooling rates, possibly due to prolonged back diffusion. At slower cooling rate, the minimum concentration of aluminum at the dendritic core was lower compared to faster cooled locations. e segregation deviation parameter and the partition coefficient were calculated from the experimentally obtained data. 1. Introduction Environmental concern was the key motivating factor behind development of Mg alloys. Better aerodynamic design of vehicles or engines with improved combustion efficiency can lessen fuel consumption, but weight reduction seems to be the most effective way to achieve a substantial fuel saving [1, 2]. Magnesium, with density of 1.74 g/cm 3 , is the lightest of all the engineering structural metals [3]. Mg-based alloys have an excellent combination of properties which justifies their usage in transportation applications. ese properties include excellent strength-to-weight ratio, good fatigue and impact strengths, and relatively large thermal and electrical conductivities [4]. All commercial magnesium alloys are multicomponent and form a variety of phases during solidification and subsequent processing stages. High-pressure die casting and gravity casting, particularly sand and permanent mold cast- ing, are the common casting processes used to produce Mg alloy components. Other pertinent production technologies include squeeze casting, thixocasting, and thixomolding [5]. e wide range of operational conditions existing in foundry and casting processes generates, as a direct conse- quence, a diversity of solidification microstructures. Because microstructure determines the final properties of the mate- rial, proper understanding of the microstructure formation mechanisms is extremely important. Mechanical properties depend on the microstructural arrangement defined during Hindawi Publishing Corporation Journal of Materials Volume 2014, Article ID 657647, 18 pages http://dx.doi.org/10.1155/2014/657647
Transcript of Research Article Influence of Cooling Rate on Microsegregation...

Research ArticleInfluence of Cooling Rate on MicrosegregationBehavior of Magnesium Alloys
Md Imran Khan1 Ahmad O Mostafa1 Mohammad Aljarrah2
Elhachmi Essadiqi3 and Mamoun Medraj1
1 Mechanical and Industrial Engineering Department Concordia University 1455 de Maisonneuve Boulevard WestMontreal QC Canada H3G 1M8
2 Industrial Engineering Department The Hashemite University PO Box 330127 Zarqa 13115 Jordan3 Renewable Energy ampAdvancedMaterials Research Lab International University of Rabat Technopolis 11 100 Sala el Jadida Morocco
Correspondence should be addressed to Mamoun Medraj mmedrajencsconcordiaca
Received 28 November 2013 Revised 7 January 2014 Accepted 10 January 2014 Published 3 March 2014
Academic Editor Necmettin Maraslı
Copyright copy 2014 Md Imran Khan et al This is an open access article distributed under the Creative Commons AttributionLicense which permits unrestricted use distribution and reproduction in any medium provided the original work is properlycited
The effect of cooling rate on microstructure and microsegregation of three commercially important magnesium alloys wasinvestigated usingWedge (V-shaped) castings of AZ91D AM60B and AE44 alloysThermocouples were distributed tomeasure thecooling rate at six different locations of thewedge casts Solute redistribution profileswere drawnbased on the chemical compositionanalysis obtained by EDSWDS analysis Microstructural and morphological features such as dendrite arm spacing and secondaryphase particle size were analyzed using both optical and scanning electron microscopes Dendritic arm spacing and secondaryphase particle size showed an increasing trend with decreasing cooling rate for the three alloys Area percentage of secondaryphase particles decreased with decreasing cooling rate for AE44 alloy The trend was different for AZ91D and AM60B alloys forboth alloys area percentage of 120573-Mg
17Al12increased with decreasing cooling rate up to location 4 and then decreased slightly The
tendency for microsegregation was more severe at slower cooling rates possibly due to prolonged back diffusion At slower coolingrate the minimum concentration of aluminum at the dendritic core was lower compared to faster cooled locationsThe segregationdeviation parameter and the partition coefficient were calculated from the experimentally obtained data
1 Introduction
Environmental concernwas the keymotivating factor behinddevelopment of Mg alloys Better aerodynamic design ofvehicles or engines with improved combustion efficiency canlessen fuel consumption but weight reduction seems to bethe most effective way to achieve a substantial fuel saving[1 2] Magnesium with density of 174 gcm3 is the lightestof all the engineering structural metals [3] Mg-based alloyshave an excellent combination of properties which justifiestheir usage in transportation applications These propertiesinclude excellent strength-to-weight ratio good fatigue andimpact strengths and relatively large thermal and electricalconductivities [4]
All commercial magnesium alloys are multicomponentand form a variety of phases during solidification andsubsequent processing stages High-pressure die casting andgravity casting particularly sand and permanent mold cast-ing are the common casting processes used to produce Mgalloy components Other pertinent production technologiesinclude squeeze casting thixocasting and thixomolding[5] The wide range of operational conditions existing infoundry and casting processes generates as a direct conse-quence a diversity of solidification microstructures Becausemicrostructure determines the final properties of the mate-rial proper understanding of the microstructure formationmechanisms is extremely important Mechanical propertiesdepend on the microstructural arrangement defined during
Hindawi Publishing CorporationJournal of MaterialsVolume 2014 Article ID 657647 18 pageshttpdxdoiorg1011552014657647
2 Journal of Materials
solidification such as the amount and distribution of eutec-tic phases grain size dendrite spacing and porosity [6]Segregation or redistribution of solutes during solidificationis closely linked to dendrite arm spacing interdendriticporosity and the amount and distribution of eutectic phases
Themechanism ofmicrosegregation during solidificationof aluminum alloys has received considerable attention butmicrosegregation during solidification of magnesium alloyshas not been systematically studied To understand theinfluence of cooling rate on microsegregation of magnesiumalloys this work aims to carry out an experimental investiga-tion using wedge cast samples of AZ91D AM60B and AE44alloys By applying thewedge casting solidification techniqueit is possible to produce a range of cooling rates in one casting
2 Literature Data
Very few experimental works [7ndash10] regarding the microseg-regation analysis of magnesium alloys were found in theliterature In contrary several studies [11ndash20] were carriedout to investigate the solidification behavior of magnesium-based alloys Although the prime focus of these studieswas not on microsegregation analysis valuable informationregarding elemental composition at different cooling ratesand conditions could be obtained from them Mirkovicand Schmid-Fetzer [8 9] studied the microsegregation ofAZ31 and AM50 alloys applying directional solidificationtechnique They reported that the segregation behavior ofmanganese is opposite compared to both aluminum andzinc This can be explained by understanding the ternaryMg-Al-Mn system where the Mn forms a peritectic systemPeritectic systems are known to show reversed segregationZhang et al [10] studied the microsegregation in direc-tionally solidified Mg-4Al binary alloy They determinedmicrosegregation in specimens directionally solidified withcooling rates ranging from 006 to 08 Ks They reportedthat the concentration profile of Al at high growth rate orhigher cooling rate is closer to the Scheil model Zheng etal [7] investigated the microsegregation pattern of Mg-4Al-4Ca alloy under different growth rates using the directionalsolidification techniqueThey suggested that the Scheilmodelcan be used in microstructure simulation of this alloy asthe microsegregation of the alloying elements (Al and Ca)predicted by this model agreed reasonably well with theEPMAmeasurements
Wei and Warren [21] carried out microstructural char-acterization of several magnesium alloys in the AM seriesin as-cast condition They performed quantitative analysis ofthe Al segregation in the die cast alloys by examining thinfoil specimens in the TEM Compositional measurementsacross an 120572-Mg grain in AM50A at intervals of 180 nmwere performed using X-ray energy dispersive spectrometry(EDS) in the TEM along a straight line They found that theAl composition in the interior ofMg grain was approximately15 wt which increased to 30 wt in the area adjacent tothe grain boundaries They repeated the same procedure fora thin foil sample of die cast AM60A at intervals of 600 nmThe Al content varied from 2wt in the grain interior toapproximately 4wt in the Al-rich grain boundary region
The width of the high Al region was about 2-3mmThey alsoreported that owing to the low Al content no 120573-Al
12Mg17
formed in AM20 but there was intergranular Al segregationBarbagallo et al [19] determined the variation of the
alloying element contents through the grain boundaries ofan HPDC AM60 alloy by means of EPMA line scanningand reported that the Al concentration varied from 25 wtin the bulk 120572-Mg core to 10wt in the boundary regionIt is to be noted that for the same alloy AM60 Wei andWarren [21] and Barbagallo et al [19] reported differentamount of Al content in the grain boundary region and thisis due to the fact that the casting conditions of the sampleswere different Han et al [22] reported that for permanentmold casting of AZ91D alloy in the dendritic center thealuminum concentration is 26 wt but it is 117 wt atthe dendrite edge about 45 times higher than that in thedendrite center Zhang et al [23] conducted experimentsto compare the amount of microsegregation in permanentmold cast and die-cast AZ91 alloys They reported that theaverage concentration of Al and Zn is lower in the diecasting matrix than in the permanent mold casting matrixAverage concentration of Al is 33 wt and for Zn it is033 wt in permanent mold casting and 3wt Al and022wt Zn in die-cast matrix which means the amount ofsegregationwas higher for comparatively faster cooling Ditzeand Schwerdtfeger [24] reported on strip casting of AZ91alloy that the aluminum content increased from 1wt at thecenter of the dendrite arms where solidification had startedto about 25 wt between the arms where solidificationhad ended Guo et al [25] reported that in AZ80 alloy theregions close to the 120573-Mg
17Al12
eutectic phase have higheraluminum contents and that the maximum concentration inthe dendritic interstice varied between 66 wt and 79 wtThey also reported that applying electromagnetic vibrationon the billet they could increase the value of minimum Alconcentration up to 35 wt from 25 wt which is theminimum concentration of Al in the 120572-Mg matrix in thecenter of a conventional die-cast billet This means that theycould reduce the amount of microsegregation by agitatingthe liquid Table 1 summarizes the available data from theliterature
Segregation takes place due to unequal solute diffusionrates in the solid and the liquid phases of the solventmaterial As a result the phases that solidify in the laterstages of the solidification process such as 120573-Mg
17Al12 are
placed between dendrite arms Gungor [26] reported that theextent of microsegregation in an alloy could be determinedexperimentally by measuring one of the following amount ofnonequilibrium eutectic amount of nonequilibrium secondphase minimum solid composition ratio of minimum andmaximum composition of the primary phase and com-position versus fraction solid profile Experimental tech-niques to investigate the extent of microsegregation includequantitative metallography (point count areal and linealmeasurements) X-ray diffraction analysis [27] and electronmicroprobe measurements
Of the techniques available the most widely used onefor characterizing microsegregation is the random samplingapproach developed by Flemings et al [28] commonly
Journal of Materials 3
known as the point matrix or area scan approach There isno hard and fast rule about the total number of points tobe taken to represent the compositional variability Gungor[26] reported that at least 100 points are necessary to obtaina reasonably accurate result He showed that the result didnot vary significantly if 300 points are taken instead of 100points These points are acquired by means of scanningelectron microscope-energy dispersive spectroscopy (SEM-EDS) or electron microprobe analysis using wavelengthdispersive spectrometry (EPMA-WDS) Two comparativelyless appliedmethods are compositionalmaps and segregationratio With compositional maps it is possible to presentthe nature and variability of the dendritic structure andassociated microsegregation but it is not a suitable methodfor comparing different samplesThe segregation ratio usuallyrefers to the maximum over minimum or the maximumover bulk composition These are the simplest parametersfor comparing different samples but much information islost Martorano and Capocchi [29] used a refined segregationratio and the average deviation between the measurementsand nominal composition were reported
Two approaches were suggested to sort the EPMA datapoints into increasing or decreasing order depending ontheir segregation behavior to produce composition versussolid fraction profiles for each element These approachesare sorting all the measurements based on composition of asingle component (single-element sorts) or sorting based onthe compositional difference between two solutes (differencesorts) Yang et al [30] reported that sorting based on primaryalloying elements can produce more accurate elementalpartition coefficients However the main weakness of bothtechniques lies in the appropriateness of the choice of theelements upon which to base the sort for a 10-componentalloy there are 90 different permutations of the differencesorts to consider [31]
Ganesan et al [31] proposed an alloy-independent sortingalgorithm They termed it weighted interval ranking sort(WIRS) In this approach all elements present at each datapoint are considered along with the measurement errorsaccrued during data treatment By applying this approachfor segregation profiling of Ni-based alloys they demon-strated that this sorting method treats eutectic constituentsappropriately and the errors in the segregation profile arealso more accurately determined The WIRS method wasapplied in this work as this alloy independent sortingmethodcould accurately treat the eutectic constituents of the threeinvestigated multicomponent alloys
Segregation ratio and segregation index these two meth-ods rely on the minima or maxima of an alloying element ata particular location to calculate segregation severity Thesecalculations might be sometimes misleading as only theterminal points of solute profiles are being considered insteadof the entire variation Poirier [32] proposed the segregationdeviation parameter method for measuring the severity ofmicrosegregation This method is better in the sense that thedeviation is calculated over the entire range of data
120590119898=1
1198991198620
119899
sum119894=1
1003816100381610038161003816119862119894 minus 11986201003816100381610038161003816 (1)
In this method the segregation deviation parameter 120590119898
is calculated using (1) The absolute difference between thecomposition at any point 119862
119894and the bulk composition 119862
0is
measured and the sum is taken for all the readingsThen thissummation is divided by the total number of points analyzedand the bulk composition
Both the segregation deviation parameter and the seg-regation index were employed in this work to compare theseverity of microsegregation at different locations of thewedge cast samples
3 Analytical Microsegregation Modeling
Several analytical microsegregation models [27 33ndash38] havebeen found in the literature tomodel the solute redistributionof alloying elements during dendritic solidification of alloysIn most of the models mass balance for the solute elementsis considered within a simplified geometry such as a planecylinder or sphere to describe the growth of dendrite armsIt is obvious from theoretical and experimental evidencethat the simplified geometry gives reasonably accurate resultsfor the majority of alloy systems and solidification pro-cesses [39ndash41]The simplest formulations are the equilibriumsolidification model (lever rule) and Scheil-Gulliver modelwhich describe the two extreme cases of ideal equilibriumand nonequilibrium respectively With the advent of moresophisticated computing technology and improvement ofmaterial databases the more advanced models (Kraft et al[40] Du and Jacot [42] Boettinger et al [43]) incorpo-rate more realistic variable diffusion properties across thesolid-liquid interface Three models will be described inthe following section equilibrium solidification model theScheil-Gulliver solidificationmodel and the Brody-Flemingsdendritic solidification model
31 Equilibrium Solidification Model This model assumesthat a state of equilibrium exists at the solid-liquid inter-face during growth That means there would be negligibleresistance for transportation of atoms between the solid andliquid phases [44] For instance if a single crystal of alloycomposition 119862
0is cooled to temperature (119879lowast) which is
below the liquidus temperature (119879119871) then according to the
equilibrium solidification theory 119862lowast119871and 119862lowast
119878would be the
respective compositions of liquid and solid at the interfaceThe partition coefficient 119870 is the ratio of the compositionof the solid to that of the liquid It indicates the degree ofsegregation of solute The equilibrium partition ratio may bedefined as follows
119870 =119862lowast119878
119862lowast119871
(2)
A value less than unity indicates that the element ispartitioning preferentially to the eutectic region whereasa value greater than unity indicates that the element ispartitioning to the dendrite core as peritectic solidificationThe farther from unity the partition coefficient the morestrongly the element partitions to either the dendrite coreor eutectic region Physical parameters that contribute to
4 Journal of Materials
the partition coefficient are differences in atomic radii (thetendency for an element to be in solution) and the chemicalpotential of the elements in the liquid
Applying the equilibrium lever rule the amount of soluteredistribution during equilibrium solidification can be deter-mined by
119862119878119891119878+ 119862119871119891119871= 1198620 (3)
Here 119891119878and 119891
119871are weight fractions of solid and liquid
respectively The above equation can be written in thefollowing form
119862119878=119870 sdot 1198620
(1 minus 119891119878) + 119870 sdot 119891
119878
(4)
This equation describes the composition of the solidphase with respect to the fraction of solid where 119862
119878is solute
concentration in the solid (wt) 1198620is the initial solute
concentration (wt) 119870 is the partition coefficient and 119891119878is
the fraction solidAccording to the assumption of the equilibrium model
there would be complete diffusion in the liquid and solidphases that means the final product would have a homoge-neous composition 119862
119878= 1198620[44]
The dependency of liquidus temperature on the changingliquid composition would result in solidification of the alloysover a range of temperatures The first solid would startforming and the composition would be lower in solute foreutectic alloys compared to initial liquid composition As thesolidification progresses the balance of the solute would berejected enriching the liquid through diffusion This wouldeventually result in lower liquidus temperature than thatof the initial composition This solute rejection process isresponsible for the development of segregation or coring As ageneral rule it can be stated that if the freezing range is largerfor an alloy and it gets sufficient time for solute rejection thesegregation severity would be more [45]
32 Scheil-Gulliver Solidification Model This model is dif-ferent from the equilibrium model in the sense that it doesnot allow any elemental diffusion in the solid This meansthat once a solid is formed nothing comes out of it or getsin This would result in a steady rise in rejected solute levelin the liquid phase until the final liquid region has reachedthe eutectic composition The famous ldquononequilibrium leverrulerdquo or more popularly known as the Scheil equation is asfollows
119862119878= 119870 sdot 119862
0(1 minus 119891
119878)119870minus1
(5)
33 Brody-Fleming Dendritic Solidification Model The workof Bower et al [35] pinpointed the reason for the discrepancybetween experimental microsegregation measurements andthe values predicted by the Scheil model This mismatch isdue to the presence of finite solid-state diffusion in actualcastings whereas the Scheil model assumes no diffusion inthe solid state Therefore the amount of back diffusion thattakes place both during and after solidification has to be
taken into consideration This back diffusion is responsiblefor lower solute levels than the prediction of the Scheilmodel The extent of back diffusion is determined by thedimensionless parameter 120572 as shown in the integration ofthe differential solute balance equation for a parabolic growthrate as follows
119862119878= 119870119862
0[1 minus (1 minus 2120572119870)119891
119878](119870minus1)(1minus2120572119870)
(6)
where
120572 =4119863119878119905119891
1205822 (7)
Here 119863119878is the diffusivity in solid (m2sdotsminus1) 119905
119891is the
local solidification time (s) and 120582 represents the secondarydendrite arm spacing (m) Equation (6) contains two limitingcases that were described earlier for plane front solidificationwhen 120572 is set to 05 then the equation represents theequilibrium lever rule andwhen119863
119878is set to zero (ie no solid
state diffusion) 120572 becomes zero and that results in the Scheilequation
There are many other models available in the literatureand the quest for achieving a perfect model is still going onBut most of these models are modifications of the Brody-Flemings model Kearsey [46] in his thesis came to theconclusion that it is really difficult tomake accuratemicroseg-regation prediction using these simplified models as thesemodels do not take into account the complexity regardingthe number of diffusing solute species and their relativeinteractive effects that takes place during the solidification ofmulticomponent alloys
4 Methodology
The ingots of the three alloys were melted and degased usinghexachloroethane (C
2Cl6) The pouring temperature of the
molten metal in the mold was 1000K or 723∘C Six K-typethermocouples at different locations along the wedge castingwere placed as illustrated in Figure 1(a) Time-temperaturecurveswere obtained at each location using the thermocouplereading The thickness increases gradually from 6mm atlocation 1 to 34mm at location 6 as shown in Figure 1(b) Itis expected that location 1 has the fastest cooling rate whilelocation 6 has the slowest cooling rate of the six locations
The bulk compositions of the investigated alloys arepresented in Table 2 In AE44 alloy rare earth elementswere added as mischmetal The percentage of the rare earthelements in the mischmetal is as follows Ce = 5590 La =3050 Pd = 680 Nd = 520 and others = 160
Solidified samples were sectioned longitudinally at theposition of the thermocouples Samples were ground using120 240 320 400 600 800 and 1200 grit SiC emery paperwhile ethanol was used as lubricant and the samples wereultrasonically cleaned in ethanol between steps to removeany residue Samples were etched with nitric acid reagent(20mL acetic acid 1mL HNO
3(concentrated) 60mL ethy-
lene glycol 20mL water) after being manually polishedThe solidification microstructures were analyzed by opticalmicroscopy (OM) The phase analyses were investigated
Journal of Materials 5
12m
m
18m
m24
mm 37
mm 50
mm 68
mm
(a)
Location 1Location 2
Location 3
Location 4
Location 5
Location 634mm
25mm
185mm
12mm9mm6mm
(b)
Figure 1 Schematic of thermocouple positions in the wedge castsample
Figure 2 Schematic of area scanmethod using EDS Each black dotcorresponds to a composition measurement
using scanning electron microscopy (SEM) (Model HitachiS-3400N SEM) equipped with wavelength dispersive spec-trometry (WDS) and energy dispersive spectrometry (EDS)systems for elemental analysis For the SEM the samples werenot etched
The SEM was used mainly in the backscatter electron(BSE) mode at 15 keV BSE images were treated by imageanalysis software in order to enhance the color contrastThe composition measurements for elemental analysis werecarried out using EDS At each sample location a minimumof 150 readings were taken in amatrix using EDS spot analysisas shown in Figure 2
X-ray diffraction (XRD) using XrsquoPert PROmanufacturedby PANalytical Inc was performed to detect the phasespresent in these alloys and measure the volume fraction ofthe dominant secondary phases The samplesrsquo powders wereprepared in a mortar to a uniform particle size distributionSilicon powder (minus325mesh) was added to all powder samplesas an internal standard to correct for any systematic errorX-ray diffraction analysis of the sampleswas carried out using
minus30minus20minus10
0102030
400450500550600650
0
10
20
30
6 10 14 18 22 26 30Time (s)
6 10 14 18 22 26 30Time (s)
6 10 14 18 22 26 30Time (s)
Liquidus
Solidus
d2Tdt2
)∘ C2
sminus2
Tem
pera
ture
(∘C)
dTdt (
(
)C
sminus1
Figure 3 The cooling first and second derivative curves of theAZ91D alloy showing the solidus and liquidus
XrsquoPert High Score Plus software in combination with theRietveld analysis and Pearsonrsquos crystal database [47]
Secondary dendrite arm spacing was measured using thelinear intercept method from optical micrographs Suitablelocations were selected where secondary dendrite arms areclearly distinguishable Then the average secondary dendritearm spacing was measured by counting the number of armsintercepting a straight line of a known length Readings weretaken at 10 different locations close to the thermocoupleposition in the wedge and then averaged
5 Results and Discussion
51 Thermal Analysis The cooling curves obtained at dif-ferent locations of the wedge cast samples were analyzedto obtain important thermal parameters A cooling curvecontains information regarding the release of heat duringsolidification This release of heat eventually changes theslope of the cooling curve which indicates the characteristicsof transformation and phase reactions during solidificationHowever the amount of the heat that evolved during somephase transformations is very small that it is difficult to detectthese changes from the cooling curve alone Hence the firstand second derivatives of the cooling curve were employed todetermine these thermal parameters accurately This proce-dure is presented in Figure 3 for location 1 ofAZ91D alloyTheblock arrows denote the approximate start and end of solidi-fication as determined from temperatures at deviations from
6 Journal of Materials
Table 1 Summary of the literature data
Alloy Casting condition Min Al wt Max Al wt Scheil model ReferenceMin Al wt Max Al wt
Mg-4Al-4Ca DSlowast 1 gt3 1 3AZ31 DS 1 4-5 1 gt6 [7]AM50 DS lt2 8-9 lt2 gt10 [8 9]Mg-4Al DS lt2 8-9 lt2 gt10AM60 HPDClowastlowast 25 10 mdash mdash [10]AM50A Die casting 15 30 mdash mdash [19]AM60A Die casting 2 40 mdash mdash [21]AZ91D PMClowastlowastlowast 26 117 mdash mdashAZ91D PMC 33 mdash mdash mdash [22]AZ91D Die casting 3 mdash mdash mdash [23]AZ91D Strip casting 1 25 mdash mdashAZ80 Die-cast billet 25ndash35 66ndash79 mdash mdash [24]lowastDS directional solidification lowastlowastHPCD high-pressure die casting lowastlowastlowastPMC permanent mold casting
Table 2 Bulk composition of the investigated alloys (wt)
Alloy Al Zn Mn Si Cu Fe Ce (RElowast)AE44 395 019 03 0007 lt0005 lt0005 220 (394lowast)AM60B 57 0023 031 0013 lt0005 lt0005AZ91D 88 075 034 0015 lt0005 lt0005lowastPercentage of the other rare earth elements in the mischmetal
Table 3 Liquidus solidus and freezing range calculation of thethree alloys
Alloy Liquidus (∘C) Solidus (∘C) Freezing range (∘C)AZ91D 600 410 190AM60B 620 415 205AE44 630 575 55
Table 4 Cooling rate of investigated alloys within the solidificationrange
LocationCooling rate ∘Cs
AZ91D(600∘Cndash410∘C)
AM60B(620∘Cndash415∘C)
AE44(630∘Cndash575∘C)
1 1011 1613 6052 1132 1655 7793 1141 16 7264 1015 1187 5845 808 817 3016 518 502 149
linearity in the first and second derivative curves The resultsare summarized in Table 3 The liquidus and solidus temper-atures recorded at different wedge locations remain constantregardless of the change of cooling rate From Table 3it can be seen that the rare earth containing alloys have thesmallest solidification range
The cooling rates of the three investigated alloys atdifferent thermocouple locations are presented in Table 4For ease of calculation and representation cooling rates were
considered to be changing linearly within the approximatesolidification range of the alloys A little difference in coolingrate among the first three locations was noticed Althoughit is considered that cooling rate decreases gradually fromlocation 1 to location 6 it is evident from the table thatfor all three alloys the cooling rate at location 2 is slightlyhigher than that at location 1 The deviation observed atthese thermocouple locations can possibly be explained bysome phenomenological factors Firstly this could be dueto the delay in thermocouple response to correctly recordthe temperature change in rapidly cooled locations Secondlythe pattern of mold filling might also be responsible Thewedge cast sample is very narrow at the bottom and hencethis narrow end could solidify much earlier before the rest ofthe locations But the molten metal on top of this solidifiedlocation will affect its cooling rate Thirdly this thin endat the bottom of wedge might not be cooled properly bythe circulating cooling water due to stagnation Howeversamples with the same cooling rate might have differentamounts ofmicrosegregation based on cooling and solidifica-tion conditions such as thickness of sample coarsening andhomogenization period
52Microstructural Analysis Themicrostructure of the threestudied magnesium alloys was characterized by quantifyingthe area percentage of the secondary phases average sizeof the secondary phase particles the maximum size of thesecondary phase particles and the secondary dendrite armspacing All these microstructural features vary significantlywith the change in cooling rate and subsequentmicrosegrega-tion The BSE micrographs were taken at 500x magnification
Journal of Materials 7
Table5Microstructuralmapping
ofAZ9
1DA
M60B
andAE4
4alloys
andtheird
etailsin
locatio
ns1and
6Th
epicturesw
eretaken
atmagnificationof
100X
Allo
yLo
catio
nDetails
Edge
ofthew
edge
Colum
nartoequiaxed
transition
Centero
fthe
wedge
AZ9
1D
1
100120583
m
6
AM60B
1 6
AE4
4
1 6
8 Journal of Materials
120572-Mg matrix
Discontinuousprecipitates
120573-Mg17Al12
50120583m
Al8Mn5
(a)
120573-Mg17Al12
120572-Mg matrix
50120583m
Mn-rich phase
(b)
120572-Mg matrix
Al3REAl11RE3
50120583m
(c)
Figure 4 General microstructure of the as-cast (a) AZ91D alloy (b) AM60B (c) AE44 regardless of the thermocouple location
for image analysis and each micrograph covers an area of227120583m times 200120583m Measurement of average and maximumsize of secondary phase particles at specific locations providesinformation regarding overall particle size distribution
Microstructural mapping was done from edge to edge forthe first four thermocouple positions For locations 5 and 6as they are much wider pictures were taken from the centerto the edge of the wedge instead of the regular patternededge to edge Microstructural maps and important segmentsare shown in Table 5 For each location of the wedge thesemerged micrographic maps are divided into three sectionsedge transition from columnar to equiaxed andmidpositionof the wedge
The general microstructure of the as-cast Mg alloys isdemonstrated in Figure 4 AZ91D alloy is characterized by asolid solution of aluminum in magnesium which is knownas 120572-Mg (hexagonal close packed structure) and eutectic 120573-Mg17Al12
phase Dendrite arms of 120572-Mg are surrounded bya eutectic mixture of 120572 and 120573-Mg
17Al12
In addition to thisa small amount of Al
8Mn5is also noticed within the 120572-
Mg matrix These phases are shown in Figure 4(a) The 120573-Mg17Al12phase may be fully or partially divorced depending
on the solidification rate The typical microstructure ofAM60B alloy that consisted of 120572-Mg dendrite cells anda divorced-eutectic (120572-Mg + 120573-Mg
17Al12) is presented in
Figure 4(b) A few spherical Mn-rich intermetallic parti-cles are also generally observed in the microstructure Theprimary 120572-Mg dendrites that form the largest portion ofthe microstructure are surrounded by divorced eutecticA typical microstructure of AE44 alloy that consisted of
primary 120572-Mg dendrites and intermetallic phases in theinterdendritic regions or at grain boundaries is presented inFigure 4(c)
The intermetallic phases have two distinctive morpholo-gies one is a lamellar or needle-like acicular morphologyand the other is of a particulate or globular shape Thelamellar phase is identified as Al
11RE3and the particulate
shaped particles are Al3RE Al
11RE3is the dominant phase
in all wedge locations the presence of Al3RE is in very small
amountsFigure 5 shows SEM micrographs of the midpositions of
the wedge at locations 1 and 6 of the three Mg alloysFor AZ91D alloy the size of the secondary phase particles
increases significantly from location 1 to location 6 Althoughthe sizes of the particles are much smaller in location 1their number is much greater in comparison to location 6The distance between eutectic 120573-Mg
17Al12
phase particlesalso increases with the decrease of cooling rate whichindicates that secondary dendrite arm spacing is varyingwith cooling rate For AM60B a fully divorced morphologywas observed for the 120573-Mg
17Al12
phase in all locations Thepresence of coring was more obvious in locations 5 and 6The size of individual secondary phase particles increasedsignificantly from location 1 to location 6 and subsequentlythe number of these particles decreased For AE44 alloylocations 1 2 and 3 have a similar cluster-like morphol-ogy of Al
11RE3 Then from location 4 the space between
the clusters starts to increase This transition continues inlocations 5 and 6 where the morphology shows scatteredclusters
Journal of Materials 9
AZ91D-location 1 AZ91D-location 6
(a)
AM60B-location 1 AM60B-location 6
(b)
AE44-location 1 AE44-location 6
(c)
Figure 5 Microstructures at the midposition of the wedge at locations 1 and 6 for AZ91D AM60B and AE44 alloys
The variation in secondary dendrite arm spacing (SDAS)measured close to the six thermocouple locations forthe three Mg alloys is shown in Figures 6(a)ndash6(c) Thevariation of SDASwith the change of cooling rate for the threeMg alloys was calculated It is concluded that the secondarydendrite arm spacing increases as the cooling rate decreasesfrom around 9 120583m at location 1 up to about 26120583m at location6 for AZ91D alloy For AM60B alloy the SDAS increasedgradually with the decrease in cooling rate from 15120583m atlocation 1 up to 30 120583m at location 6 The SDAS variation forAE44was in the range of 10ndash15 120583mat location 1 and increasedup to 45 120583m at location 6 due to significant reduction incooling rate
53 Microsegregation Measurements Quantitative microseg-regation analysis was carried out close to the six thermo-couple locations for the three investigated magnesium alloys
The following results were obtained from the acquired data atdifferent locations of the wedge solute redistribution profilefor alloying elements (experimental andmodeling) partitioncoefficient segregation index (ratio between minima andbulk composition) and segregation deviation parameter (120590
119898)
and area percentage of eutectic from the distribution pro-files Inhomogeneous distribution of solute elements duringdendritic solidification of an alloy takes place due to coringCoring or layered structure solidification is the key conceptfor understanding microsegregation As can be seen fromthe schematic diagram of a dendrite arm in Figure 7(a) thechemical composition at point ldquoCrdquo is different from the chem-ical composition of point ldquoErdquo It is assumed that solidificationstarts at point ldquoCrdquo and finishes at point ldquoErdquo and the change inchemical composition is gradual In Figure 7(b) the opticalmicrograph of AZ91D alloy is presented to be compared withthe schematic diagram
10 Journal of Materials
0
5
10
15
20
25
30
0 10 20 30 40 50 60 70
Wedge locationD
endr
ite ar
m sp
acin
g (120583
m)
Distance from bottom of wedge (mm)
1 2 3 4 5 6
(a)
0
5
10
15
20
25
30
35
0 10 20 30 40 50 60 70
Wedge location
Den
drite
arm
spac
ing
(120583m)
Distance from bottom of wedge (mm)
1 2 3 4 5 6
(b)
0
10
20
30
40
50
60
0 20 40 60
Wedge location
Den
drite
arm
spac
ing
(120583m)
Distance from bottom of wedge (mm)
1 2 3 4 5 6
(c)
Figure 6 Secondary dendritic arm spacing measured at center of the wedge of (a) AZ91D (b) AM60B (c) AE44 at different locations
C
E
(a)
C
(b)
Figure 7 Coring in dendritic solidification (a) schematic of dendrite arm and (b) dendritic microstructure in optical micrograph of AZ91Dalloy
Journal of Materials 11
0
5
10
15
20
25
30
35
60 70 80 90 100
AZ91D
Zn
AlMn
(wt
)
Magnesium (wt)
(a)
0
5
10
15
20
25
30
70 80 90 100
AM60B
Mn
(wt
)
Magnesium (wt)
Al
(b)
(wt
)
Magnesium (wt)
0
1
2
3
4
5
6
7
8
80 85 90 95 100
AE44
AlLa
CeNd
(c)
Figure 8 Segregation trend in investigated alloys
When the molten alloy starts to solidify at point ldquoCrdquo thewt of aluminum can be as low as 2 or 3wt depending onthe cooling rate And it gradually increases to the last point tobe solidified namely point ldquoErdquo Some alloying elements havea tendency to accumulate in higher concentration at the edgeof the dendritic arm These elements have low concentrationat the center of the arm Some alloying elements behave in theopposite way they have higher concentration at themiddle ofdendrite arm and then gradually decrease towards the edgeThis was mainly reported for the elements forming peritecticsystems
531 Solute Redistribution In this work microsegregationmeasurements were performed using SEMEDS 150 readingswere taken in a 10 times 15 regular grid with a spacing of10 120583m between each point All the data points were sorted
based on the weighted interval ranking sort (WIRS) method[31] The alloying elements which were present in less than05 wt in the bulk composition of the alloy were neglectedbecause they are below the EDS detection limit This couldbe the major source of the experimental errors which leadto provision of different values of the calculated parametersIn this work the microsegregation analysis was carried outfor aluminum and zinc in AZ91D aluminum andmanganesein AM60B and aluminum cerium and lanthanum in AE44The segregation trend of these alloys for all locations in thecasting is presented in Figure 8
For AZ91D and AM60B with the increase of magnesiumconcentration the concentration of Al and Zn decreaseswhile Mn shows the opposite trend This means that Al andZn would be low in the dendrite core and gradually increasetowards the dendrite periphery For AE44 alloy with theincrease of Mg concentration all other elements Al La Ce
12 Journal of Materials
0
5
10
15
20
25
30
0 02 04 06 08 1
Al (
wt
)
Fraction solid
AZ91D-location 1
(a)
0
5
10
15
20
25
30
0 02 04 06 08 1
Al (
wt
)
Fraction solid
AZ91D-location 6
(b)
0
04
08
12
16
2
0 02 04 06 08 1
Zn (w
t)
Fraction solid
(c)
0
05
1
15
2
25
3
0 02 04 06 08 1
Zn (w
t)
Fraction solid
(d)
Figure 9 Solute redistribution in locations 1 and 6 of AZ91D alloy
and Nd decrease in concentrationThus the concentration ofthese elements will be low in the dendrite core
The Brody-Fleming equation [35] was used for modelingthe solute redistribution profile modeling
The parameters needed to calculate the solute profiles(composition at any specific point solidified 119862
119878) using this
model are dimensionless parameter 120572 solid fraction 119891119878 par-
tition coefficient119870 and bulk composition 1198620 The secondary
dendrite arm spacing and solidification time at each locationwere used from the experimental data to calculate120572 From theexperimentally measured data sorted by the WIRS methodvalues of 119862
119878and 119891
119878can be obtained Putting these values in
the Scheil equation (2) values of the partition coefficient 119870were calculated
The average value of 119870 was then used in the Brody-Fleming model for drawing solute redistribution profiles forthe three Mg alloys in all locations These experimentallyobtained values of119870 for all major alloying elements are listedin Table 6 From the table it is clear that the average valueof the partition coefficient decreases with the decrease ofcooling rate
The solute redistribution profiles at locations 1 and 6 forthe major alloying elements of AZ91D AM60B and AE44
are shown in Figures 9 10 and 11 respectively Open symbolsrepresent the solute profile obtained from the experimentaldata sorted and treated by the WIRS method and the closedsymbols represent the curves calculated using the Brody-Fleming model [35]
For AZ91D the average value of 119870Al is 053 at loca-tion 1 and 043 at location 6 However Shang et al [48]reported 119870Al = 035 and 119870Zn = 009 for the Scheiland equilibrium cooling They also reported that for theScheil cooling conditions the partition coefficient remainsconstant up to 085 fractions solid For AM60B the averagevalue of 119870Al is 056 at location 1 and 041 at location 6Although in many solute redistribution models the partitioncoefficient value is considered to be the same for the Scheiland equilibriumcooling conditions the results obtained fromthese experiments indicate that partition coefficient valuechanges significantly with cooling rate
For AE44 the average value of 119870Al at location 1 is 034and at location 6 it decreases to 023 For Ce and La thepartition coefficient is too small which could be due to theirlow solubility in Mg For Ce at location 1 the average 119870is 0068 and at location 6 it is 00257 For La at location 1the average is 0075 and at location 6 the average is 00283
Journal of Materials 13
0
5
10
15
20
25
30
0 02 04 06 08 1
Al (
wt
)
Fraction solid
AM60B-location 1
(a)
0
5
10
15
20
0 02 04 06 08 1
Al (
wt
)
Fraction solid
AM60B-location 6
(b)
0
01
02
03
04
05
0 02 04 06 08 1
Mn
(wt
)
Fraction solid
(c)
0
01
02
03
04
05
0 02 04 06 08 1
Mn
(wt
)
Fraction solid
(d)
Figure 10 Solute redistribution in locations 1 and 6 of AM60B alloy
Chia et al [49] reported the partition coefficient for La andCe using the binary phase diagrams of Mg-Ce and Mg-Laas 00193 and 0036 respectively Their partition coefficientvalues were closer to what has been obtained in slowercooling locations in this work For both Ce and La at location6 the partition coefficient is 003
532 Area Percentage Calculations of Secondary PhasesAccording to theMg-Al binary phase diagram themaximumsolubility of Al in Mg is around 129 wt On the basis ofthis assumption the area fraction of 120573-Mg
17Al12
phase wasmeasured using the solute redistribution curve of aluminumat different wedge locations for AZ91D and AM60B alloys Inthismethod a horizontal line is extended from themaximumAl solubility value A vertical line is constructed at the end ofthe linear proportion of the fraction solid curve The amountof the eutectic then can be calculated based on the differencebetween the fraction solid curve and the constructed verticallineThe procedure applied for these calculations is presentedin Figure 12
The eutectic area percentage was obtained through imageanalysis and the solute redistribution curve of aluminum forthe three Mg alloys In this work 120573-Mg
17Al12
is considered
the eutectic phase in the AZ91D and AM60B alloys Noeutectic phase was formed in the AE44 alloy and thus bothAl3RE andAl
11RE3were the so-called secondary precipitates
Hence for the three alloys the 120572-Mg matrix was consideredthe primary phase and all other particles were called thesecondary phase The area percent distribution of secondaryphases measured from the solute redistribution curve andimage analysis are available in Table 7 Accordingly the eutec-tic area percentage of AZ91D alloy increases with cooling rateup to location 4 and then decreases at locations 5 and 6 Thistrend is similar to observation by image analysis For AM60Bat sample locations 1 2 and 3 the area fraction was in therange of 35ndash5 Afterwards a reduction was observed atlocations 5 and 6 At location 6 it was only 2
In AE44 the composition of Al is very low in 120572-Mgmatrix as most of the aluminum reacts with the rare earthelements to form precipitates Solubility of La Ce and Ndis also very low in the matrix Hence the maximum solidsolubility of La in Mg 08 wt was assumed as the beginningof precipitate formation For AE44 alloy area percentage ofsecondary precipitates decreases gradually with cooling ratefrom 30 at location 1 to 8 at location 6 Hehmann et al[50] reported that the solid solubility of Al La and Ce in
14 Journal of Materials
0
2
4
6
8
10
0 02 04 06 08 1
Al (
wt
)
Fraction solid
AE44-location 1
(a)
0
2
4
6
8
10
0 02 04 06 08 1
Al (
wt
)
Fraction solid
AE44-location 6
(b)
0
2
4
6
8
10
0 02 04 06 08 1
Ce (
wt
)
Fraction solid
(c)
0
2
4
6
0 02 04 06 08 1
Ce (
wt
)
Fraction solid
(d)
0
1
2
3
4
5
0 02 04 06 08 1
La (w
t)
Fraction solid
(e)
0
1
2
3
0 02 04 06 08 1
La (w
t)
Fraction solid
(f)
Figure 11 Solute redistribution in locations 1 and 6 of AE44 alloy
Mg could be increased by rapid solidification method Henceincreased solid solubility in 120572-Mg matrix will result in lowerarea percentage of eutectic phases In the present experimentvery high cooling rate was observed at locations close tobottom of the wedge therefore it could affect the maximumsolid solubility of other alloying elements in magnesiumThis means that if accurate values of solid solubility areused to calculate the area percentage the difference betweenimage analysis and the solute distribution curve method maybecome less
533 Segregation Index and Minimum Composition Thesegregation index is the ratio between the minimum com-position and bulk composition of an alloying element Todetermine the minimum at a specific location the averageof the ten lowest compositions was taken The minimumconcentration of aluminum and the segregation index atdifferent wedge locations for the three alloys are presented inTable 8 From the table it can be seen that as the cooling ratedecreases theminimumcomposition decreases and hence theseverity of segregation increases For AZ91D the minimum
Journal of Materials 15
Table 6 Effective partition coefficient for major alloying elements in the investigated alloys
Location AZ91D AM60B AE44119870Al 119870Zn 119870Al 119870Mn 119870Al 119870Ce 119870La
1Lowest 042 004 048 003 029 002 002Highest 058 050 068 073 042 014 015Average 053 021 056 030 034 007 008
2Lowest 042 003 039 001 017 002 000Highest 063 040 049 057 040 018 022Average 051 015 046 033 030 006 005
3Lowest 044 008 036 003 031 002 002Highest 070 040 060 052 054 010 010Average 057 019 045 029 040 005 005
4Lowest 032 006 030 001 021 001 001Highest 056 036 047 023 033 013 007Average 041 018 036 011 027 003 004
5Lowest 029 001 035 002 029 001 001Highest 044 025 051 054 036 007 008Average 039 010 040 028 033 003 003
6Lowest 033 003 031 001 019 001 002Highest 056 029 055 062 025 005 005Average 043 012 041 029 023 003 003
lowastlowastUsing FactSage software119870Al = 035119870Zn = 009119870Ce = 00193119870La = 0036 and119870Mn = 110
Table 7 Area percentage of secondary phases measured from solute redistribution curve and image analysis for the investigated alloys
Location AZ91D AM60B AE44Solute curve Image analysis Solute curve Image analysis Solute curve Image analysis
1 75 55 34 16 30 2082 76 58 40 16 24 2103 8 65 50 21 22 1784 10 71 40 21 12 1325 7 65 27 19 12 926 66 45 20 17 8 86
concentration of aluminum decreases with the decrease ofcooling rate At location 1 the composition is 36 wt andat location 6 it drops to 301 wt For AM60B at location1 minimum concentration of aluminum is 25 wt and atlocation 6 it reduces to 18 wt For AE44 at location 1the minimum concentration of aluminum is 11 wt and atlocations 6 the concentration is 09 wt
534 Segregation Deviation The severity of microsegrega-tion is measured by the segregation deviation parameter(120590119898) using (1) Martorano and Capocchi [29] reported that
microsegregation severity is lower for columnar dendritesthan for equiaxed ones It has also been reported that theincrease in segregation deviation parameter 120590
119898 for a change
in structure fromcolumnar to equiaxed seems to be constantapproximately 011 for the Cu-8wt Sn alloys However thisvalue can be applicable for any particular system since itshows the difference in the amount of segregation betweencolumnar and equiaxed segregation Consequently the typeof dendritic growth seems to be an important variableto define microsegregation The greater microsegregationseverity observed in an equiaxed dendrite zone comparedwith that in columnar dendrites might be the result of morehomogenization in the latter structure The overall deviationfrom the bulk composition for aluminum is presented inFigure 13
In the present work location 1 could be considered ascolumnar dendritic and location 6 could be considered as
16 Journal of Materials
Table 8 Minimum concentration of aluminum and segregation index for the investigated alloys at different locations
Location AZ91D AM60B AE44Minimum Al Segregation index Minimum Al Segregation index Minimum Al Segregation index
1 363 242 256 223 115 3442 357 247 225 254 121 3273 354 249 219 261 130 3044 290 303 189 301 106 3735 312 282 205 278 107 3696 301 293 184 310 090 439
0
5
10
15
20
25
30
0 02 04 06 08 1
Al (
wt
)
Fraction solid
Eutectic129 wt
Primary 120572-Mg matrix
Figure 12 Procedure for the eutectic fraction calculation using thesolute redistribution curve
03
04
05
06
07
0 10 20 30 40 50 60 70
Wedge location
Distance from the bottom of the wedge (mm)
AZ91DAM60BAE44
Segr
egat
ion
devi
atio
n(120590
m)
1 2 3 4 5
Figure 13 Segregation deviation for three investigated alloys
equiaxed dendriticThe difference in deviation from location1 to location 6 forAZ91DAM60B andAE44 is 008 006 and019 respectively which is comparable to the results observedby Martorano and Capocchi [29]
For AM60B alloy from location 1 to location 5 thesegregation deviation increases and then it slightly decreasesat location 6 thus contradicting the segregation indexThe segregation index is high at location 6 but when thesegregation deviation is calculated on a broader range the
segregation deviation is comparatively lower than at otherlocations
6 Summary
ThreemainMg alloys (AZ91D AM60B and AE44) solidifiedin a range of cooling rates (1ndash20∘Cmin) were studied andfound to exhibit dendritic microstructures At higher coolingrate (locations 1 and 2) the dendritic morphology waspredominantly columnar and at lower cooling rate (locations5 and 6) dendritic equiaxed morphology was observedSecondary dendrite arm spacing increased significantly withthe decrease of cooling rate for all three investigated alloysThe arm spacing ranges for the different alloys are 10 to25 120583m for AZ91D 15 to 30 120583m for AM60B and 10 to 45 120583mfor AE44 The average size of secondary phase particlesincreased substantially with the decrease of cooling rateFor AZ91D the 120573-Mg
17Al12
phase had a partially divorcedmorphology at fast cooled locations of the wedge and fullydivorced morphology at slowly cooled locations For AE44the secondary precipitates had cluster-like morphology atfaster cooling rate and gradually becamemore dispersed withslower cooling rate
Microsegregation was more pronounced at slow cooledlocations which is evident from themicrosegregation param-eters The minimum concentration of aluminum was alwayslow for slow cooled locations (3 wt at location 6 in compar-ison to 36 wt at location 1 for AZ91D alloy) Significant dif-ference in segregation deviation (Δ120590
119898) was observed between
the columnar and the equiaxed dendrites approximately inthe range of (006ndash019) for the three alloys The highersegregation deviation observed in equiaxed morphology isprobably due to prolonged back diffusion which takes placeat slow cooling rates
Experimentally obtained solute redistribution profilesmatch reasonably with theoretically calculated profiles exceptat very low solid fraction This discrepancy at low solidfraction is possibly due to the presence of a few primarydendritic arms in the microstructure which have lowerconcentration of aluminum than the rest of the matrix Theelemental partition coefficients calculated from the experi-mentally obtained redistribution profiles were comparativelyhigher than the partition coefficients calculated from binaryphase diagrams
Area fraction of secondary phase particles measuredby two different methods image analysis and solute
Journal of Materials 17
redistribution curves showed close resemblance Areafraction measured from solute redistribution curves iscomparatively higher due to the fact that in case of imageanalysis only the secondary phase particles are measuredbased on color threshold while in solute curve methodregions adjacent to particles which have high concentrationof alloying elements (eg eutectic phases) are also taken intoaccount
Conflict of Interests
The authors declare that there is no conflict of interestsregarding the publication of this paper
Acknowledgment
The authors would like to acknowledge AUTO21 NSERCStrategic Network of Excellence for the financial support ofthis work
References
[1] A Boby U Pillai B Pillai and B Pai ldquoDevelopments inmagnesium alloys for transport applicationsmdashan overviewrdquoIndian Foundry Journal vol 57 p 30 2011
[2] R S Beals C Tissington X Zhang et al ldquoMagnesium globaldevelopment outcomes from the TMS 2007 annual meetingrdquoJournal of theMinerals Metals andMaterials Society vol 59 no8 pp 39ndash42 2007
[3] G Davies Materials for Automobile Bodies Butterworth-Heinemann Oxford UK 2003
[4] H Mao V Chandrasekar M Murray et al ldquoMicrostructuralcharacteristics of die cast AZ91D andAM60magnesium alloysrdquoTech Rep SAE 1996
[5] E Aghion B Bronfin and D Eliezer ldquoThe role of the mag-nesium industry in protecting the environmentrdquo Journal ofMaterials Processing Technology vol 117 no 3 pp 381ndash385 2001
[6] J Quaresma C Santos and A Garcia ldquoCorrelation betweenunsteady-state solidification conditions dendrite spacings andmechanical properties of AI-Cu alloysrdquoMetallurgical andMate-rials Transactions A vol 31 no 12 pp 3167ndash3178 2000
[7] X Zheng A Luo C Zhang J Dong and R Waldo ldquoDirec-tional solidification and microsegregation in a magnesium-aluminum-calcium alloyrdquoMetallurgical and Materials Transac-tions A vol 43 no 9 pp 3239ndash3248 2012
[8] D Mirkovic and R Schmid-Fetzer ldquoDirectional solidificationof Mg-Al alloys and microsegregation study of Mg alloys AZ31and AM50mdashpart I methodologyrdquo Metallurgical and MaterialsTransactions A vol 40 no 4 pp 958ndash973 2009
[9] D Mirkovic and R Schmid-Fetzer ldquoDirectional solidificationof Mg-Al alloys and microsegregation study of Mg alloys AZ31and AM50mdashpart II comparison between Az31 and AM50rdquoMetallurgical and Materials Transactions A vol 40 no 4 pp974ndash981 2009
[10] C Zhang DMa K SWu et al ldquoMicrostructure andmicroseg-regation in directionally solidifiedMg-4Al alloyrdquo Intermetallicsvol 15 no 10 pp 1395ndash1400 2007
[11] A Luo ldquoUnderstanding the solidification ofmagnesium alloysrdquoin Proceedings of the 3rd International Magnesium Conferencepp 449ndash464 Manchester UK 1997
[12] D H Stjohn A K Dahle T Abbott M D Nave and M QianldquoSolidification of cast magnesium alloysrdquo in Proceedings of theMinerals Metals and Materials Society (TMS rsquo03) pp 95ndash100Magnesium Technology San Diego Calif USA 2003
[13] Y W Riddle and M M Makhlouf ldquoCharacterizing solidifica-tion by non- equilibrium thermal analysisrdquo in Proceedings of theMinerals Metals and Materials Society (TMS rsquo03) pp 101ndash106Magnesium Technology San Diego Calif USA 2003
[14] A Lindemann J Schmidt M Todte and T Zeuner ldquoThermalanalytical investigations of the magnesium alloys AM60 andAZ91 including the melting rangerdquo Thermochimica Acta vol382 no 1-2 pp 269ndash275 2002
[15] M Ohno D Mirkovic and R Schmid-Fetzer ldquoOn liquidus andsolidus temperatures inAZ andAMalloysrdquo in Proceedings of theMinerals Metals and Materials Society (TMS rsquo06) pp 129ndash132San Antonio Tex USA 2006
[16] M D Nave A K Dahle and D H StJohn ldquoEutectic growthmorphologies in magnesium-aluminium alloysrdquo in Proceedingsof theMineralsMetals andMaterials Society (TMS rsquo02) pp 233ndash242 Nashville Tenn USA 2000
[17] L P Barber ldquoCharacterization of the solidification behaviorand resultantmicrostructures ofmagnesium-aluminum alloysrdquoin Materials Science and Engineering Worcester PolytechnicInstitute Worcester Mass USA 2004
[18] A K Dahle Y C Lee M D Nave P L Schaffer and DH Stjohn ldquoDevelopment of the as-cast microstructure inmagnesium-aluminium alloysrdquo Journal of Light Metals vol 1no 1 pp 61ndash72 2001
[19] S Barbagallo H Laukli O Lohne and E Cerri ldquoDivorcedeutectic in a HPDC magnesium-aluminum alloyrdquo Journal ofAlloys and Compounds vol 378 no 1-2 pp 226ndash232 2004
[20] MN KhanM Aljarrah J TWood andMMedraj ldquoThe effectof cooling rate on thermophysical properties of magnesiumalloysrdquo Journal of Materials Research vol 26 no 8 pp 974ndash9822011
[21] L-Y Wei and R Warren ldquoMicrostructural characterisation ofseveral magnesium alloys in AM seriesrdquo Materials Science andTechnology vol 23 no 6 pp 745ndash752 2007
[22] Q Han E Kenik S Agnew and S Viswanathan ldquoSolidificationbehaviour of commercial magnesium alloysrdquo in MagnesiumTechnology pp 81ndash86TheMineralsMetals ampMaterials SocietyWarrendale Pa USA 2001
[23] Z Zhang A Couture R Tremblay and D Dube ldquoMicrostruc-ture and mechanical properties of permanent mold and diecasting of AZ 91 magnesium alloyrdquo in Proceedings of the Inter-national Symposium on Light Metals pp 397ndash406 CanadianInstitute of Mining Metallurgy and Petroleum 1999
[24] A Ditze and K Schwerdtfeger ldquoStrip casting of magnesiumwith the single-belt processrdquo Scandinavian Journal of Metal-lurgy vol 32 no 6 pp 311ndash316 2003
[25] S Guo Q Le Y Han Z Zhao and J Cui ldquoThe effect of theelectromagnetic vibration on the microstructure segregationand mechanical properties of As-cast AZ80 magnesium alloybilletrdquo Metallurgical and Materials Transactions A vol 37 no12 pp 3715ndash3724 2006
[26] M Gungor ldquoA statistically significant experimental techniquefor investigating microsegregation in cast alloysrdquo MetallurgicalTransactions A vol 20 no 11 pp 2529ndash2533 1989
[27] J Sarreal and G Abbaschian ldquoThe effect of solidification rateon microsegregationrdquo Metallurgical Transactions A vol 17 no11 pp 2063ndash2073 1986
18 Journal of Materials
[28] M C Flemings D R Poirier R V Barone and H D BrodyldquoMicrosegregation in Iron base alloysrdquo Journal of Iron and SteelInstitute vol 208 pp 371ndash381 1970
[29] M Martorano and J Capocchi ldquoEffects of processing variableson the microsegregation of directionally cast samplesrdquo Metal-lurgical and Materials Transactions A vol 31 no 12 pp 3137ndash3148 2000
[30] W Yang K-M Chang W Chen S Mannan and J Debar-badillo ldquoMonte carlo sampling for microsegregation measure-ments in cast structuresrdquo Metallurgical and Materials Transac-tions A vol 31 no 10 pp 2569ndash2574 2000
[31] M Ganesan D Dye and P Lee ldquoA technique for characterizingmicrosegregation in multicomponent alloys and its applicationto single-crystal superalloy castingsrdquoMetallurgical and Materi-als Transactions A vol 36 no 8 pp 2191ndash2204 2005
[32] D R Poirier Microsegregation in Ternary Iron-Carbon-Chromium Alloys Department of Metallurgy MassachusettsInstitute of Technology Cambridge Mass USA 1966
[33] E Scheil ldquoBemerkungen zur schichtkristallbildungrdquo ZeitschriftMetallkunde vol 34 pp 70ndash72 1942
[34] T Clyne and W Kurz ldquoSolute redistribution during solidifica-tion with rapid solid state diffusionrdquoMetallurgical TransactionsA vol 12 no 6 pp 965ndash971 1981
[35] T Bower H Brody and M Flemings ldquoMeasurements of soluteredistribution in dendritic solidificationrdquo Transaction of theMetallurgical Society of AIME vol 236 pp 624ndash633 1966
[36] I Ohnaka ldquo Mathematical analysis of solute redistributionduring solidification with diffusion in solid phaserdquoTransactionsof the Iron and Steel Institute of Japan vol 26 no 12 pp 1045ndash1051 1986
[37] S Kobayashi ldquoA mathematical model for solute redistributionduring dendritic solidificationrdquo Transactions of the Iron andSteel Institute of Japan vol 28 pp 535ndash542 1988
[38] L Nastac and D M Stefanescu ldquoAn analytical model forsolute redistribution during solidification of planar columnaror equiaxed morphologyrdquoMetallurgical Transactions A vol 24no 9 pp 2107ndash2118 1993
[39] J Lacaze P Benigni and A Howe ldquoSome issues concerningexperiments and models for alloy microsegregationrdquo AdvancedEngineering Materials vol 5 no 1-2 pp 37ndash46 2003
[40] T Kraft M Rettenmayr and H Exner ldquoAn extended numericalprocedure for predicting microstructure and microsegregationof multicomponent alloysrdquo Modelling and Simulation in Mate-rials Science and Engineering vol 4 no 2 pp 161ndash177 1996
[41] F Y Xie T Kraft Y Zuo C H Moon and Y A ChangldquoMicrostructure and microsegregation in Al-rich Al-Cu-Mgalloysrdquo Acta Materialia vol 47 no 2 pp 489ndash500 1999
[42] Q Du and A Jacot ldquoA two-dimensional microsegregationmodel for the description of microstructure formation dur-ing solidification in multicomponent alloys formulation andbehaviour of the modelrdquo Acta Materialia vol 53 no 12 pp3479ndash3493 2005
[43] W J Boettinger U R Kattner and D K Banerjee ldquoAnalysisof solidification path and microsegregation in multicomponentalloysrdquo in Modelling of Casting Welding and Advanced Solidifi-cation Processed-VIII B G Thomas and C Beckermann Edsvol 1 pp 159ndash170 TMS Warrendale Pa USA 1998
[44] M C Flemings Solidification Processing McGraw-Hill 1974[45] MC Flemings ldquoSolidification processingrdquoMetallurgical Trans-
actions vol 5 no 10 pp 2121ndash2134 1974
[46] R M Kearsey ldquoCompositional effects on microsegregationbehaviour in single crystal superalloy systemsrdquo in Mechani-cal and Aerospace Engineering Carleton University OntarioCanada 2004
[47] H Putz and K Brandenburg Pearsonrsquos Crystal Data CrystalStructure Database for Inorganic Compounds
[48] S Shang H Zhang S Ganeshan and Z-K Liu ldquoThe develop-ment and application of a thermodynamic database for mag-nesium alloysrdquo Journal of the Minerals Metals and MaterialsSociety vol 60 no 12 pp 45ndash47 2008
[49] T L Chia M A Easton S M Zhu M A Gibson NBirbilis and J F Nie ldquoThe effect of alloy composition on themicrostructure and tensile properties of binary Mg-rare earthalloysrdquo Intermetallics vol 17 no 7 pp 481ndash490 2009
[50] F Hehmann F Sommer and B Predel ldquoExtension of solidsolubility in magnesium by rapid solidificationrdquo MaterialsScience and Engineering A vol 125 no 2 pp 249ndash265 1990
Submit your manuscripts athttpwwwhindawicom
ScientificaHindawi Publishing Corporationhttpwwwhindawicom Volume 2014
CorrosionInternational Journal of
Hindawi Publishing Corporationhttpwwwhindawicom Volume 2014
Polymer ScienceInternational Journal of
Hindawi Publishing Corporationhttpwwwhindawicom Volume 2014
Hindawi Publishing Corporationhttpwwwhindawicom Volume 2014
CeramicsJournal of
Hindawi Publishing Corporationhttpwwwhindawicom Volume 2014
CompositesJournal of
NanoparticlesJournal of
Hindawi Publishing Corporationhttpwwwhindawicom Volume 2014
Hindawi Publishing Corporationhttpwwwhindawicom Volume 2014
International Journal of
Biomaterials
Hindawi Publishing Corporationhttpwwwhindawicom Volume 2014
NanoscienceJournal of
TextilesHindawi Publishing Corporation httpwwwhindawicom Volume 2014
Journal of
NanotechnologyHindawi Publishing Corporationhttpwwwhindawicom Volume 2014
Journal of
CrystallographyJournal of
Hindawi Publishing Corporationhttpwwwhindawicom Volume 2014
The Scientific World JournalHindawi Publishing Corporation httpwwwhindawicom Volume 2014
Hindawi Publishing Corporationhttpwwwhindawicom Volume 2014
CoatingsJournal of
Advances in
Materials Science and EngineeringHindawi Publishing Corporationhttpwwwhindawicom Volume 2014
Smart Materials Research
Hindawi Publishing Corporationhttpwwwhindawicom Volume 2014
Hindawi Publishing Corporationhttpwwwhindawicom Volume 2014
MetallurgyJournal of
Hindawi Publishing Corporationhttpwwwhindawicom Volume 2014
BioMed Research International
MaterialsJournal of
Hindawi Publishing Corporationhttpwwwhindawicom Volume 2014
Nano
materials
Hindawi Publishing Corporationhttpwwwhindawicom Volume 2014
Journal ofNanomaterials
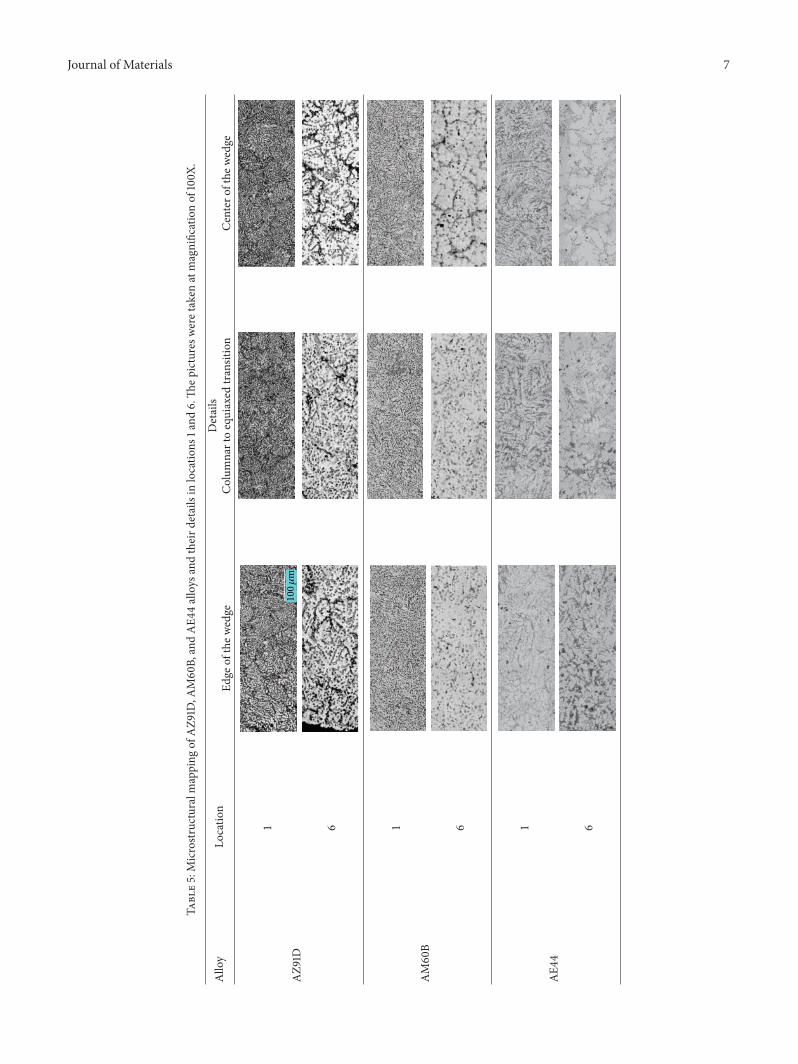