Research Article Geotechnical Aspects of Explosive …
15
Research Article Geotechnical Aspects of Explosive Compaction Mahdi Shakeran, 1 Abolfazl Eslami, 1 and Majid Ahmadpour 2 1 Civil and Environmental Engineering Department, Amirkabir University of Technology, Tehran, Iran 2 Faculty of Art and Architecture, Mazandaran University, Babolsar, Iran Correspondence should be addressed to Abolfazl Eslami; [email protected] Received 3 March 2016; Revised 2 July 2016; Accepted 21 August 2016 Academic Editor: Carlo Trigona Copyright © 2016 Mahdi Shakeran et al. is is an open access article distributed under the Creative Commons Attribution License, which permits unrestricted use, distribution, and reproduction in any medium, provided the original work is properly cited. Explosive Compaction (EC) is the ground modification technique whereby the energy released from setting off explosives in subsoil inducing artificial earthquake effects, which compact the soil layers. e efficiency of EC predominantly depends on the soil profile, grain size distribution, initial status, and the intensity of energy applied to the soil. In this paper, in order to investigate the geotechnical aspects, which play an important role in performance of EC, a database has been compiled from thirteen-field tests or construction sites around the world, where EC has been successfully applied for modifying soil. is research focuses on evaluation of grain size distribution and initial stability status of deposits besides changes of soil penetration resistance due to EC. Results indicated suitable EC performance for unstable and liquefiable deposits having particle sizes ranging from gravel to silty sand with less than 40% silt content and less than 10% clay content. However, EC is most effective in fine-to-medium sands with a fine content less than 5% and hydraulically deposited with initial relative density ranging from 30% to 60%. Moreover, it has been observed that EC can be an effective method to improve the density, stability, and resistance of the target soils. 1. Introduction Depending on the importance and load level of a structure, ground improvement may be a viable alternative to expensive foundations in conditions involving weak and problematic soil deposits. e common options for improvement of weak soil layers at depth are as follows: vibro methods, Deep Soil Mixing (DSM), Deep Dynamic Compaction (DDC), jet grouting, and Explosive Compaction (EC). Modification of loose, saturated deposits at depth using methods such as Deep Soil Mixing and jet grouting is costly. Dynamic compaction involves dropping of heavy weights to improve soil and is effective to a depth of 15 m, although its efficiency decreases with decreasing soil permeability. Shakeran and Eslami [1] reported that the use of vibrators, for improvement of loose granular soils at depth, have three disadvantages: (a) they require special equipment, (b) their efficiency decreases with increasing silt and clay content, and (c) their application is limited to maximum depth of 30 m. Compaction of the site of Franklin Fall Dam in New Hampshire in late 1930s was the first successful application of the EC method. Soon aſter application of EC method in Franklin Fall Dam, the effectiveness of the method was approved and subsequently the method was successfully applied in the compaction of hydraulic deposits of Cape Cod Canal in Texas and Almond Dam in New York [2, 3]. In 1970s and 1980s, most of the research pertaining to EC method was carried out by the US army and was concentrated on the study of how blast effects cause liquefaction [4]. Dur- ing those years, examples of projects carried out included (i) compaction of existing deposits beside slopes and structures adjacent to residential areas, (ii) densification of deposits associated with waste pools, and (iii) coastal constructions and execution of the EC in the oil-drilling platform Molikpaq I. In the 1980s, the capability of the EC technique as a deep soil improvement method was demonstrated when the method was applied to eliminate earthquake liquefaction hazard and improve a 15 m thick deposit of loose, saturated, and unstable alluvial soil existing at a depth of 30 to 45 m from below ground level in Jebba dam project. Later in 1990s and 2000s, the EC method was used on projects relating to embankments of bridges and dams, waste pools, and liquefaction assessment tests [5]. Hindawi Publishing Corporation Shock and Vibration Volume 2016, Article ID 6719271, 14 pages http://dx.doi.org/10.1155/2016/6719271
Transcript of Research Article Geotechnical Aspects of Explosive …

Research ArticleGeotechnical Aspects of Explosive Compaction
Mahdi Shakeran1 Abolfazl Eslami1 and Majid Ahmadpour2
1Civil and Environmental Engineering Department Amirkabir University of Technology Tehran Iran2Faculty of Art and Architecture Mazandaran University Babolsar Iran
Correspondence should be addressed to Abolfazl Eslami afeslamiautacir
Received 3 March 2016 Revised 2 July 2016 Accepted 21 August 2016
Academic Editor Carlo Trigona
Copyright copy 2016 Mahdi Shakeran et al This is an open access article distributed under the Creative Commons AttributionLicense which permits unrestricted use distribution and reproduction in any medium provided the original work is properlycited
Explosive Compaction (EC) is the groundmodification technique whereby the energy released from setting off explosives in subsoilinducing artificial earthquake effects which compact the soil layers The efficiency of EC predominantly depends on the soilprofile grain size distribution initial status and the intensity of energy applied to the soil In this paper in order to investigatethe geotechnical aspects which play an important role in performance of EC a database has been compiled from thirteen-fieldtests or construction sites around the world where EC has been successfully applied for modifying soil This research focuses onevaluation of grain size distribution and initial stability status of deposits besides changes of soil penetration resistance due to ECResults indicated suitable EC performance for unstable and liquefiable deposits having particle sizes ranging from gravel to siltysand with less than 40 silt content and less than 10 clay content However EC is most effective in fine-to-medium sands with afine content less than 5 and hydraulically deposited with initial relative density ranging from 30 to 60 Moreover it has beenobserved that EC can be an effective method to improve the density stability and resistance of the target soils
1 Introduction
Depending on the importance and load level of a structureground improvementmay be a viable alternative to expensivefoundations in conditions involving weak and problematicsoil deposits The common options for improvement of weaksoil layers at depth are as follows vibro methods DeepSoil Mixing (DSM) Deep Dynamic Compaction (DDC) jetgrouting and Explosive Compaction (EC) Modification ofloose saturated deposits at depth usingmethods such asDeepSoil Mixing and jet grouting is costly Dynamic compactioninvolves dropping of heavy weights to improve soil and iseffective to a depth of 15m although its efficiency decreaseswith decreasing soil permeability Shakeran and Eslami [1]reported that the use of vibrators for improvement of loosegranular soils at depth have three disadvantages (a) theyrequire special equipment (b) their efficiency decreases withincreasing silt and clay content and (c) their application islimited to maximum depth of 30m
Compaction of the site of Franklin Fall Dam in NewHampshire in late 1930s was the first successful applicationof the EC method Soon after application of EC method
in Franklin Fall Dam the effectiveness of the method wasapproved and subsequently the method was successfullyapplied in the compaction of hydraulic deposits of Cape CodCanal in Texas and Almond Dam in New York [2 3]
In 1970s and 1980s most of the research pertaining to ECmethodwas carried out by theUS army andwas concentratedon the study of how blast effects cause liquefaction [4] Dur-ing those years examples of projects carried out included (i)compaction of existing deposits beside slopes and structuresadjacent to residential areas (ii) densification of depositsassociated with waste pools and (iii) coastal constructionsand execution of the EC in the oil-drilling platformMolikpaqI
In the 1980s the capability of the EC technique as adeep soil improvement method was demonstrated when themethod was applied to eliminate earthquake liquefactionhazard and improve a 15m thick deposit of loose saturatedand unstable alluvial soil existing at a depth of 30 to 45mfrom below ground level in Jebba dam project Later in 1990sand 2000s the EC method was used on projects relatingto embankments of bridges and dams waste pools andliquefaction assessment tests [5]
Hindawi Publishing CorporationShock and VibrationVolume 2016 Article ID 6719271 14 pageshttpdxdoiorg10115520166719271
2 Shock and Vibration
Water flow
Sand boil
Settlementprofile
Ground surface
Rayleigh
Source
Bedrock
Point of
Shear waveCompression wavewave
interest
Figure 1 Wave propagation caused by explosion shock soil liquefaction and settlement
Densification of cohesionless soils occurs due to a fewmechanisms imposed by the blasting including compressionvolumetric strains and shearingMoreover excess pore waterpressure is generated which may induce liquefaction andresettlement of the soil particles into a denser configuration[3] After the first phase of EC and dissipation of residualpore pressure subsequent phase of blasting induces moresettlement in the soil Amount of final settlement dependson initial stiffness and relative density and blast operationIn other words first phase of blasting breaks all bonds (dueto cementation or aging) between soil particles and otherphases increase settlement Saturated sands are more suitablefor blast densification than dry sand because it is a moreefficient medium for shock pulse transmission and residualpore water pressures reducing effective stresses Figure 1illustrates wave propagation and the effect of explosion onground subsidence soil liquefaction and surface settlement
In order to transmit sufficient energy to the soil mass andthereby achieve a suitable soil compaction in the ECmethodit is necessary to (a) ensure appropriate arrangement of blastholes on plan including pattern (square or triangular grid)and spacing and (b) select the correct amount of explosivesand distribution of them along the thickness of the targetlayer
2 EC Performance Mechanismand Effective Parameters
After the first phase of blasting and dissipation of the majorportion of excess pore water pressure repeating the blasts inthe subsequent phases will cause additional compaction ofsoil After each explosion phase soil will be more compactedbut soil settlement as well as compaction rate will decreaseand after two or three phases of explosion large settlementwill not occur anymore [6] Final compaction will dependon the stiffness and initial density of the soil in addition tothe method of setting off the explosives The first phase ofblasting will decompose all the soil grain bonds associatedwith cementation or aging whereas the subsequent phaseswill compact the soil further Clay particles in sand willdecrease the soil drainage and thereby reduce the efficiencyof EC Narin van Court [7] suggested that (a) the minimum
CPTcone resistance 119902t for a soil to be satisfactorily compactedby the ECmethod is 10MPa (b)medium density compactionis achieved in soils with 119902t less than 15MPa and (c) blastingcauses loosening in soil deposits where 119902t exceeds 20MPa
Effective parameters in design of EC fall in six categoriesare as follows (i) charge weight in each hole (ii) depth ofcharges in the hole (iii) scattering pattern of charges in height(iv) distance between the blast holes (v) phasing and thenumber of blast stages and (vi) sequence of blast holes andexplosive scheduling in each phase Determination of thesedesign parameters should be based on the final optimumresults Figure 2 illustrates a real plan and profile of blast holesarrangement alongwith the charging locations and sequencesof explosion [8]
The most important results of EC include increasing rel-ative density of the soil (119863
119903or 119877119863) increasing soil resistance
to cone penetration and suppression of volume changes thatcause settlement of the target Increase in 119863
119903of the soil is
because of arrangement of the grains in a denser state afterECAs a rule increase in119863
119903after blast densification is a factor
of fine contents in the sand and initial relative density ECcan increase in the compactness of loose sands having relativedensity in the range of 20 to 30 up to 60 to 70 Com-parison of the results of penetration tests such as CPT andSPT before and after blasting indicates that EC can be used toincrease the cone resistance and thus the bearing capacity ofthe soil Figure 3(a) presents sample CPT records before andafter EC [9] The increase of the soil resistance to cone pene-tration does not occur immediately after blasting but occursover a period Figure 3(b) illustrates the increasing PTtip resistant with time after using some soil improvementmethods [10] With increasing time after blasting bondsdecomposed by the shock effects are formed again resulting inenhancement of the soil strength This process may last fromseveral days to even several months [11]
3 Data Bank and Case Histories
For evaluation of the range of improved deposits using theEC technique 13 sites were selected from various countriesincluding countries namely the United States (five sites)Canada (three sites) Nigeria (two sites) and one site in each
Shock and Vibration 36
m
8m8m8m
6m 4
m
2m
2m
2m
2m
2m
12
m
12
m12
m12
m30m times 30m
Ground level
Stemming
Stemming
Stemming
Base ofblast hole
2m approx
2m approx
m0
5
8m4m 4m8m
panel
25kg
19kg
5 kg
EL 213
EL 194EL 1915
C deck 1L
EL 199
C deck 2L
EL 203
EL 201
C pilot chargeL
Approx groundwater level
Pass 1Pass 2Pass 3
Figure 2 Arrangement of blast holes and loading a blast hole in Seymour dam project [8]
Before blastingAfter blasting
605040
30
25
20
15
10
5
0
Dep
th (m
)
70
0 10 20 30 40Qt (MPa)
Dr = 80
(a)
20
15
101 10 100
Time after disturbance (weeks)
Mitchell andSolymar [12]
vibrocompactionMitchell andSolymar [12]
blasting
blasting
blasting
Fordham et al [13]
Schmertmann [15]dynamic compaction
This research
Jefferies et al [14]
Tip
resis
tanc
e of N
wee
ksti
p re
sista
nce o
f one
wee
k
(b)
Figure 3 (a)The effect of EC on the increase of CPT cone resistance and relative density (CPT data from [9]) (b) CPT tip resistant increasingwith time after (1) blast densification (Mitchell and Solymar [12] Fordham et al [13] and Jefferies et al [14]) (2) vibrocompaction (Mitchelland Solymar [12]) and (3) dynamic compaction (Schmertmann [15]) Research and comparison have been done by Charlie et al [10]
4 Shock and Vibration
of the following Japan Sweden and China The soil depositsin these sites ranged from fine alluvial sand to gravel andcobblestone The maximum ground water level was at thedepth of 2m from the ground surface and the thickness oftarget layers for soil improvement was between 4 and 20m inmost sites
EC was carried out in one to four phases at grid pointsforming square or triangular grid pattern The distancebetween the blast holes varied depending on the limitationsof each site as regards the weight of charges In some sitesa grid of blast holes spaced at 3m to 6m was used whereasin some other sites the blast holes were at spacing of up to15m and loadedwith higher amount of charges Various typesof charges were used in each country depending on theiravailability practicality and cost
Awareness of the amount of energy implemented to targetsoil of each site is necessary to have good judgment about ECperformance in every project In order to reach the criteriathat describe amount of used energy Powder Factor (PF) canbe determined as follows [16]
PF = 1000119882119881 (1)
where PF is Powder Factor (grm3)119882 is charge weight (kg)and 119881 is soil volume that is modified by EC method (m3)It is related to thickness of improved layer (ℎ
0) borehole
arrangement and distances (119878) For example for square gridpattern 119881 is described by the following
119881 = ℎ0(1198782) (2)
This parameter has been calculated for collected cases andwith a summary of the database records shown in Table 1 Abrief description of each site also is given below
Site Number 1 Tokachi Port Project [17] For performanceevaluation of steel sheet piles to prevent lateral spreading dueto liquefaction consequences of an earthquake a completeEC test was carried out in Tokachi port located in HokkaidoIsland in JapanThe soil profile at the site was predominantlyloose fine silty sand (approx 15 fine material) of thicknessof 8m and dredged from the sea bottom
Site Number 2 Seymour Fall Dam [8 18] In early 1960s anew concrete wall and an earth dam with the height of 30mwere constructed on the Seymour River approximately 18 kmnorth of the Burrard Inlet within North Vancouver city andadjacent to the existing 9m high concrete dam (SeymourFall Dam) Due to the seismology of the region EC anddynamic compaction methods were used for compaction ofthe new dam site between 2004 and 2005 The ground waterat the dam site was nearly at the ground level while therewere sand deposits along with coarse gravel and cobblestoneextending to a depth of 30m in the zone targeted for groundimprovement After EC an average settlement of 5 to 7was reported in the target layer
Site Number 3 Test Site in South Carolina [20] The siteis located in a coastal region of South Carolina where the
ground profile was classified into six layers The target layerfor EC was located at the depths of 75 to 13m (55m thick)from the ground level This layer comprised fine sand withrelative density between 20 and 30 and a fine content of4 The layer was fully saturated being below the groundwater level EC was designed and performed at this site in4 phases using an arrangement with square grid pattern in8 months The ground surface experienced an average settle-ment of 168mm after first phase with a recorded settlementbetween 120mm and 90mm in phases 2 to 4 In total thetarget layer for improvement settled approximately 490mm
Site Number 4 Foundation of TailingDam inOntario Canada-Test Area 2 [21] This project was conducted in order toimprove the foundation soil for a proposed tailings dam raisein Ontario Canada Based on the laboratory test data thedeposited tailings were noted to be heterogeneous and theyconsisted of alternating layers of fine sand silt and silty sandCone tip resistance of 0 to 5MPa was typical of the saturatedtailings at depth and relative density varied between 40 and60 percentThe depth of target layer was about 20 meters andaverage of water table depth was measured as approximately3m below the surface Settlements after blasting were in therange of 180 cm to 250 cm within the plan area of the test Itwas reported that these settlements were concentrated in thelowest 20m of the site which gives an induced vertical strainof about 10 Postcompaction penetration resistances weremeasured using the CPT twomonths after the end of groundtreatment and they were doubled in comparison with beforetreatment Figure 4 illustrates CPT results before and afterEC
Sites Number 5 and Number 6 Jebba Dam (Testing and theMain Stages) [22 23] Compaction of the alluvial depositsat the depths of 30 to 45m definitely brought special creditto EC Access to the deeper point more than 30m isusually not applicable and functional for the other commonmethods If so the work can be difficult and costly thereforeachievement of soil improvement was recognized from 30to 45m by EC efficiency and it involved promising resultsJebba rock fill dam with a height of 42m in Nigeria wasconstructed on 70m thick alluvial deposits on the NigerRiver In order to prevent both differential settlement of thedam foundations and liquefaction the existing deposits at thedepths of 30 to 45 were densified by EC Before major stageof compaction some EC tests were done near the main siteafter that primary place was divided into 5 zones and blastdensification was carried out for each zone separately
Based on site investigations alluvial deposits were clas-sified as medium-to-coarse sand mixed with gravel withoutany fine contents The average uniformity index was 294while the average 119863
10was reported as 031mm The relative
density of the soil in the test zone was reported between 35and 75 while in the main zone it ranged from 35 to 60Figure 5 shows the grain size envelope of the target depositsin this project For test site EC was designed and performedin three phases with a checked pattern of blast holes Blastholes were at the distances of 5m from each other in eachphase and were loaded with Noblersquos Special Gelatin charges
Shock and Vibration 5
Table1Databaser
ecords
summary
Site
number
Project
titlesite
title
Reference
Soiltype
Fine
content
()
Depth
ofgrou
ndwater
level(m)
Thickn
esso
ftargetlayer
andinterval
depth(m
)
Num
bero
fph
ases
Blasth
ole
spaces
(m)p
ereach
phase
Totalw
eight
ofcharge
per
holeper
phases
(Kg)
Type
ofcharge
Totalp
owder
factor
throug
hall
phases
(grm3)
Arrangement
Aim
ofim
provem
ent
Availabler
esults
Settlem
ent
percentage
oflayer
CPTor
SPT
1To
kachiP
ort
[17]
Fine
sand
resulting
from
dredging
ofthe
seafl
oor
151
8m(0ndash8
m)
16
7TN
T243
Slowastlowast
Llowastlowast
62
NA
2Seym
ourF
all
Dam
[818]
Sand
with
coarse
gravel
andcobb
lesto
ne
0Groun
dlevel
10(10ndash
20)
36
49Irem
iteTX
469
TlowastL
7NA
3Testsitein
SouthCarolina
[1920]
Fine
sand
41
55(3ndash85)
410
19avg
Hydromite
860
1382
SLampIlowast
9A
4Fo
undatio
nof
Tailing
Dam
inOntario
[21]
Fine
sand
53
20(0ndash20)
27
32Ch
ubbs
65S
I10
A
5Jebb
adam
(Zon
eI)
[2223]
Medium
tocoarse
sand
with
gravel
02
15(30ndash
45)
35
17avg
Gelatin
dynamite
80
136
SL
56
A
6Jebb
adam
(Test)
02
15(25ndash30)
35
21avg
168
SL
18A
7Ch
icop
ee1
[24]
Allu
vialsand
depo
sits
0to
524
91(6ndash152)
2158
68
Gelatin
dynamite
60
6S
L14
A
8FloridaJob
[25]
Fine
tomedium
unifo
rmgrain
sized
sand
009
8(0ndash8)
149
238
Gelatin
dynamite
60
124
SI
8NA
9Franklin
Fall
Dam
[26]
Fine-to
-medium
sand
25to
40Groun
dlevel
61(0ndash
61)
461
243
Gelatin
dynamite
60
4282
SLampI
5NA
10
Road
constructio
nprojectin
Sweden
[2728]
Silty
sand
with
alittlegravel
andcla
y25
05
25ndash55
14
2avg
NA
3125
TI
3ndash10
NA
11Shangh
aiHarbo
r[29]
Fine
alluvial
clean
sand
007ndash09
10(0ndash10)
25
16avg
NA
128
STest
1A
12QuebecH
QSM
-3Dam
[30]
Cleanalluvial
fine-to-coarse
sand
00
20(0ndash20)
178
145avg
Hydrodynamite
119
SLampI
62
A
13Oakrid
geLand
fill
[31]
Fine
clean
sand
515
ndash24(8ndash12)
4122
155
Hydromite
880
1041
SL
11A
Slowastlowastsqu
area
rrangementTlowast
tria
ngular
arrangem
entIlowastbearin
gcapacityincrease
andsettlem
entcon
trolLlowastlowastcon
trolofliquefaction
NAnot
availableandAavailable
6 Shock and Vibration
CPT results test plot 2 CPT results test plot 2prior to blasting after blasting
qt (MPa)qt (MPa)
Elev
atio
n (m
)
Elev
atio
n (m
)
CPT02-26CPT02-27
CPT02-28CPT02-29
306
0
301
10
296
20
291
30
286
40 0 10 20 30 40281
306
301
296
291
286
281
CPT03-1CPT03-2CPT03-3
CPT03-5
CPT03-4
CPT03-6CPT03-7
Figure 4 CPT results before and after EC in test site [21]
Gravel SandCoarseCoarse Fine FineMedium
Silt Clay Gravel SandCoarseCoarse Fine FineMedium Silt Clay
Perc
ent fi
ner t
han
Perc
ent fi
ner t
han
100908070605040302010
0
100908070605040302010
0100 10 10 01 001 0001
Millimeter100 10 10 01 001 0001
Millimeter
Grain size envelopemdashtesting area Grain size envelopemdashPW-1-from blast zone 4
Figure 5 Grain size envelope of the existing deposits in the testing area and site of Jebba dam project [22]
of 80 The weight of charges in each blast hole in phases 1to 3 was 3 2 and 1 kg respectively with their center of massplanted at the depth of 36m The performance of EC wasmeasured by surveying the surface settlement and comparingthe CPT records before and after blasting Final settlement ofapproximately 27 cm (13 cm 9 cm and 5 cm from phases 12 and 3 resp) was reported as a result of EC For designingEC related to the main zone more charges were used and thedistance between blast holes in each phase increased to 10m
Site Number 7 Chicopee Project I [24] EC was carriedout as part of the foundation design for new buildings at
an industrial park in Chicopee Massachusetts USA Theobjective was to prevent liquefaction induced by earthquakesin strata existing at depths of 61 to 152m The soil profile atthe site comprised mainly alluvial sand layers with gravel andsome silt up to the depth of 30mThe average settlement wasmeasured to be approximately 13m which was equivalent to14 of the thickness of the target layer CPT was carried outbefore and after blasting for evaluation of the improvementperformance As illustrated in Figure 6 upgrading in the soilstrength after EC is found generally in the target depositslayer but more increased strength around charges positionat depth is certainly conspicuous
Shock and Vibration 7
Chicopee I
BeforeAfter
Char
gersquos
posit
ions
17
15
13
11
9
7
5D
epth
(m)
0 10 20 30Qc (MPa)
Figure 6 CPT results before and after blast densification inChicopee project I (CPT data [24])
Site Number 8 Soil Densification for a Building in FloridaFlorida Job Project [25] This project was located at a site inLakeland City Florida USA Layers of fine-to-medium sandloose and of uniform grain size distribution existed betweenthe ground level and a depth of 8m The ground water levelwas at a depth of 09m but the percentage of fines in thesoil was unknown The loose nature of the layer necessitatedEC to improve the site prior to construction A considerablesettlement occurred in the ground surface due to consequentEC The settlement was reported to be 067m which wasapproximately equivalent to 8 of the thickness of the layertargeted for improvement This was a significant value incomparison with other projects
Site Number 9 Franklin Fall Dam [26] Franklin Fall Dam inNew Hampshire USA was built on the Pemigewasset Riverto control flooding andwas completed in 1943Thedamreser-voir and the surrounding areas are one of the tourist attrac-tions in the USA Lyman (1942) studied the performance ofEC for densification of this dam and reported the method asa success The riverbed composed mainly of fine-to-mediumsand which had been transferred from upstream locationsand deposited in a loose state Similar conditions apply to thedam site Observations on the riverbed revealed the presenceof silt and sand structure with a fine content of 25ndash40Thethickness of the target layer for improvement in this projectwas 61m but unfortunately there were no site investigationrecords before and after the improvement activity
Site Number 10 Road Construction Project along Soderhamn-Enanger [27 28]Themethod of EC for soil densification hasbeen implemented to a road construction project in central
Charge hole of the first coverageCharge hole of the second coverageCPT measured locationSurface settlement surveyed location
J1 J2 J3 J4 J5 J6 J7 8J J9 J10 J11
Figure 7 Sketch of charge hole settlement surveyed and CPTmeasured location in plan [29]
part of Sweden For building this road the natural organic soilwas excavated and replaced with a fine-grained fill This fillwith varied thickness between 25 and 55meterwas subjectedto compaction by blasting on three phases separated by atleast 2 to 3 weeks The fill includes about 5 clay 20 silt50 sand and 10gravel also there is a significant number ofcobbles and boulders in till As the ground water level was at05 meter below the surface and initial dry density of depositswas 1530 kgm3 the layer was saturated and loose For thiscase blast compaction has been carried out in triangularpattern with holes loaded with charges about one to three kgin weight As a result of EC target layer settles in rangeof 3 to 10 of the filling thickness Moreover geophysicalmethod SASW (Spectral Analysis of SurfaceWaves) was usedto detect changes in fill stiffness due to the blasting activitiesThe results of these measurements showed some parts of thefill seemed to get firmer as well as the volume change of thedeposits presents improvement in soil density
Site Number 11 Shanghai Harbor China [29] To determinethe ability of EC to densification of the reclamation bybumping filling sand (sand ie poured on seabed to settle onself-weight) foundation a series of in situ trials were carriedout in a harbor in Shanghai All field tests were carried outin a port which was formed by bumping fine clean sandwith coefficient of uniformity about 2 thicknesses of sandlayer was 10m and mean ground water level of trial field wasminus07mndash09m so this layer is loose and saturated In two ofthese trial tests (T7 and T8) EC was designed in two separatetypes of coverage (second type of coverage was carried out 7days after the first) with square plan as shown in Figure 7
A record of monitoring T7 test has been reported com-pletely indicating about 10 cm settlements during 28 dayswhich was observed at center of holes plan and cone resis-tance approximately doubled along the target soil due to EC
Site Number 12 Quebec HQ SM-3 Dam Canada [30] A largeEC project was carried out at SM-3 site along the SainteMarguerite River Quebec in 1995 In this project a 100m by120m area with depth of up to 20m of riverbed was densifiedin order to reduce the potential for static liquefaction andimprove the stability of an excavation for cofferdam duringconstruction of main dam Site investigation showed that the
8 Shock and Vibration
Before2 days
12 days35 days
0 50 100 150 200 250
(bar)
20
10
15
5
0
Dep
th (m
)
q c
Figure 8 Time dependency of CPT cone tip resistance 119902c at theQuebec HQ SM-3 Dam [30]
sand deposits at the site consist of loose sand overlying adense sand layer with a fine content less than 5 The ECprogram improves the relative density throughout the site toan average of 75 In one area of site CPT was performedbefore and after blasting at intervals of 2 12 and 35 dayswhich is shown in Figure 8
Site Number 13 Test Site in Oakridge Landfill South Carolina[31] The test site was located at the Oakridge Landfill inDorchester County South Carolina (approximately 50 kmnorthwest of Charleston) Blasting was used to densify alayer of potentially liquefiable loose sand along the perimeterof the landfill to address slope stability concerns duringa seismic event Target layer is a loose layer of fine sandknown as the Raysor formation with approximate 4m ofthickness The initial relative density of the loose black sandwas estimated to be 15ndash30 Four blast events took placeover the course of 21 days (7 days between blasts) The blastpattern and locations of instrumentation for the test sectionare shown in Figure 9 Blast holes were spaced 61m apart andcontained 155 kg of Hydromite buried at a depth of 107mFinally about 03ndash06m settlement occurred in the targetzone after four explosion stages Relative densities near thecenter of the zone appear to have increased to values between80 and 90 Despite significant amounts of densificationpenetration resistance measured with the CPTu indicated noimprovement
4 Geotechnical Aspects of EC
A useful way to estimate the results of EC is to analyze casehistories of sites improved by this technique In the following
paragraphs an opportunity has been taken to analyze adatabase of case histories in three categories including (1)zoning deposits for EC (2) initial stability status and (3)EC performance on soil penetration resistance this is simplybecause capability to predict and analyze changes in theground properties is of interest to geotechnical engineers andresearchers
41 Zoning Deposits for EC Engineers may be faced withthe challenge of identifying suitable soil types for EC Anability to do this will help reduce the number of preliminarytests necessary to be carried out thereby leading to reducedproject costs and time savings in construction Consideringthe available data from compiled sites the performance of ECand the efficiency of this method are evaluated under variousgeotechnical conditions in terms of material and grain sizedistribution using the database records This evaluationaccording to successful performance of EC can give a goodinsight into the performance range of EC realizing to the typeand fabric of deposits Figure 10 shows grain size envelope ofsome sites in the database
Undoubtedly problematic soils are affected significantlyby improvement measures This is true not only for EC butalso for other soil improvement methods Various factorssuch as the type and grain size distribution initial densityand saturation ratio of the soil are important for the result ofEC So far a specific range of grain size has not been given forthe performance range of EC Some researchers [7 32] havesuggested that the range of soil types suitable for vibrocom-paction is also suitable for EC According to this suggestionsaturated sandswith 20 silt content and less than 5 clay areappropriate for EC Other researchers for example Bell [33]has reported that soil having up to 70 silt content or 10clay is suitable for EC However so far no significant upperlimit of fine content has been recommended for EC Plottingthe grain size envelopes of the sites in the database in a singlegraph as shown in Figure 11 may give broad indication ofthe performance range of EC To obtain this boundary it isassumed that grain size and distribution do not change afterEC however it is realistic to expect a few changes in gradingbecause crushing initial condition of deposits and soil typehave more effect on EC consequence that is remarkable
42 Initial Stability of Target Deposits Cone penetration test(CPT) is one of the in situ tests done in a site investigationactivity CPT is fast and cost effective and it provides contin-uous measurement of soil properties with depths CPT dataare used for investigation of deposits initial condition beforeIn this paper two approaches are used for evaluation of initialstability status of deposits as follows
421 119876tn Criteria Thedilatancy behavior of sands is affectedby mineralogical characteristics and grain size in addition toplacement density and confining pressure It is expected thatthe factors affecting dilatancy behavior also affect measuredcone bearing However it is not clear whether they areaffected in the same manner Sladen and Hewitt [34] defined119876tn as a border between dilation and compression behavior
Shock and Vibration 9
Blast 1Blast 2Blast 3Blast 4
Survey pointsPostblast CPTuPreblast CPTuBAT probe (piezometer)
N
9
9
8
8
7 5
64
63
5 7
4 1 1 2
2
12
1010
11
3
20m
(a)
20m
Elev
atio
n (m
)
Med dense sand
Dense sand
SiltclayBAT probes
Loose black sand
Cooper Marl Edges of blast zone18
20
22
24
26
28
30
9 8 7
6 325
41
Explosives
(b)
Figure 9 (a) Pattern of blast holes and location of instrumentation (b) Profile of target layer [31]
0
20
40
60
80
100
000100101110
Perc
ent fi
ner
0
20
40
60
80
100
0001001011101001000
Perc
ent fi
ner
Grain diameter (mm)
0
20
40
60
80
100
00101110
Perc
ent fi
ner
Grain diameter (mm)
Shanghai HarborSite number 11
Seymour Fall DamSite number 2
Grain diameter (mm)
0
20
40
60
80
100
0001001011100 10
Perc
ent fi
ner
Grain diameter (mm)
Chicopee I
0
20
40
60
80
100
000100101110100
Perc
ent fi
ner
Tokachi port
0
20
40
60
80
100
000100101110100
Perc
ent fi
ner
Grain diameter (mm)
South Carolina
Quebec SM-3 siteSite number 12
Site number 7
Site number 1 Site number 3
Grain diameter (mm)
Figure 10 Grain size envelopes of target layer for some cases
10 Shock and Vibration
0
20
40
60
80
100
000010001001011101001000
Perc
ent fi
ner
Grain diameter (mm)
Lower suggested
Upper suggested boundary
Tokachi port
Seymour Fall Dam
South Carolina
Jebba Dam-Main phase
Jebba Dam-Test phase
Chicopee I
Florida Job
Franklin Fall Dam
Swedish RoadOakridge Landfill
Shanghai Harbor
Quebec
ldquoTailing Damrdquo
boundary
Figure 11 Suggested grain size zoning for soil improvement by EC
based on CPT results which is determined according to thefollowing
119876tn = 119876t(1205901015840V)065 (3)
where 119876tn is normalized total cone bearing stress 119876t is totalcone bearing stress after pore pressure correction (for cleansands and gravels 119876t = 119902c) and 1205901015840V is vertical effective stress
Sladen and Hewittrsquos [34] criterion for the dilative-contractive boundary is 119876tn = 70 bar (1 bar = 01Mpa) andsandswith less than 70 bar are considered loose or contractivewhile sands with greater than 70 bar are considered dense ordilative Pincus et al [35] by studying the results of resistivitycone penetration testing (RCPTu) in various sites proposed119876tn = 55 bar for loose-dense boundary Therefore they sug-gested that if119876tn lt 55 bar then the sand is loose and suscepti-ble to liquefaction and if119876tn gt 55 bar then sand is dense andits liquefaction susceptibility is very low119876tn values in treatedlayers before blasting for studied cases as well as referencelines according to Pincus et alrsquos and Sladen and Hewittrsquoscriteria are presented at Figure 12
422 Soil Behavior Classification Charts and LiquefactionZone One of the main applications of CPT is soil clas-sification and some researchers have presented graphs forusing CPT records in the identification of soil types andintrinsic conditions Eslami and Fellenius [36] catalogueseveral existing CPT-based soil classification charts andcompared their relative reliability The graphs are based onnormalized plots of cone resistance 119902c cone sleeve friction119891sand pore pressure119906
2 and they could be used for identification
of problematic soils suitable for improvement by EC Forevaluation of the conditions of target deposits before blastingby using the soil classification graphs sites numbers 3 6 and7 in the databasewere selected In these sites the performanceof EC includes promising outcomes via cone penetrationresistance and relative density of target deposits increased
Jebba dam (test)Jebba dam (zone I)
Chicopee IGdansk
South CarolinaSt Petersburg ISt Petersburg II
Molikpaq ICold water creekZeebrugge (zone A)Bordeaux P6ABordeaux P8AQuebec SM-3 Dam
00
5
55
10
70
15
100
20
150
25
200
30
250
35
300
40
350
45
Dep
th (m
)
Qtn (bar)
Figure 12 Initial status of target deposits based on 119876tn criteria
significantly after EC In this study charts proposed byRobertson et al [37] and Eslami and Fellenius (2004) havebeen utilized for CPT-based soil classification Hence loca-tion of CPT records of selected sites in the classificationgraphs which is shown in Figure 13 can be implementedas a criterion for efficient implementation of EC on specificgeomaterial deposits boundaries
43 EC Performance on Soil Penetration Resistance Gener-ally CPT can be used for evaluation of EC before and afterblasting which is shown in Figure 14 It is also common toperform CPT tests in different time intervals after explosionbecause penetration resistance increases by time so in thisstudy the last reported CPT data has been utilized for eachsite A combination of CPT data and experimental equationsmay be used to determine other geotechnical parameters suchas relative density (119863
119903) which is calculated by (4) Figure 15
shows a summary ofCPT records of compiled sites before andafter soil improvement (see [38])
119863119903= radic 119902c1305119865OCR119865Age = radic
119902c1300 (4)
where 119902c1 is normalized cone resistance 119865OCR is adjustmentfactor for overconsolidation asymp 1 and 119865Age is adjustment factorfor age asymp 1
Shock and Vibration 11
Case number 6Case number 3Case number 7
Case number 6Case number 3Case number 7
1 10 100 1000
Eslami and Fellenius (2004) Robertson et al (1986)
Fs (kPa) Fr ()
01
1
10
100q
E(M
Pa)
01
1
10
100
qt
(bar
)
0 1 2 3 4 5 6 7 8
Figure 13 Location of CPT records of the evaluated sites before soil improvement via Eslami and Fellenius 2004 and Robertson et al 1986charts 1mdashclay silt (sensitive) 2mdashclay silt 3mdashsilty clay 4mdashsilty sand 5mdashsand 6mdashsandy silt to clayey silt 7mdashsilty sand to sandy silt 8mdashsandto silty sand 9mdashsand and 10mdashsandy gravel to sand
26
29
32
35
38
41
44
47
0 10 20 30 40
Dep
th (m
)
7
8
9
10
11
12
13
14
0 5 10 15
Dep
th (m
)
0
2
4
6
8
10
12
14
0 2 4 6 8
Dep
th (m
)
BeforeAfter
BeforeAfter
BeforeAfter
(MPa)
Shanghai Harbor Jebba dam South Carolina-Test site
q c (MPa)q c(MPa)q c
Figure 14 CPT records before and after EC in some sites in the database
5 Comparison and Discussion
As explained in brief for compiled cases the efficiencyand successful issues related to geotechnical aspects havebeen proved for EC performance including increasing resis-tance (strength) reducing volume change (settlement) andupgrading internal stability Therefore most of these criteriahave been adopted for the database records
For all cases the soil layers targeted for improvementwere100 saturated or so were mostly made up of sand with afine content of almost 0ndash40 and in a loose state whichmeans 119863
119903was almost close to 50 or less as it is shown
in Figure 15 However some of the target layers had graveland cobblestone or rubble with diameters of more than 1m
(eg in the case of Seymour Fall Dam project) Successfulimprovement indicates the capability of EC in a wide rangeof soil deposits The proposed range for soil improvement byEC in this study may be used as a guide for selection of theEC option among other deep improvement options
Accordingly suitable performance of EC is expectedfrom gravel to silty sand with a silt content of less thanapproximately 40 and clay content of less than 10
However the best EC which means significant increasein relative density penetration resistance and especiallydiminution of liquefaction potential was achieved with fine-to-medium sands with a fine content of less than 5 Otherdetermining factors in the selection of soil improvementmethod are (i) environmental conditions (ii) depth of the
12 Shock and Vibration
4395
324162
119
202
297
166201
286594 578
119
2531
Before improvementAfter improvement
Some relative density before and after EC
50
83
3035
43
63 6073
5258 55
3545
75
30
80
Site names
Taili
ng D
amO
ntar
ioSo
uth
Caro
lina
Chic
opee
I
(test)
Jebb
a dam
Jebb
a dam
Shan
ghai
port
Que
bec H
QSM
-3D
amO
akrid
geLa
ndfil
l
1009080706050403020100
Some CPT records before and after EC
Site names
Taili
ng D
amO
ntar
io
Sout
hCa
rolin
a
Chic
opee
I
(test)
Jebb
a dam
Jebb
a dam
zone
1
zone
1
Shan
ghai
port
Que
bec H
QSM
-3D
am
Oak
ridge
Land
fill
353025201510
50
qc
(avg
alo
ngta
rget
laye
r M
Pa)
Before improvementAfter improvement
Dr
()
Figure 15 CPT and119863119903Results before and after EC in some sites in the database
target layer for improvement and (iii) grain size distributionof the deposits For example for the great depth of the targetlayer encountered in the Jebba dam project EC is the onlyalternative that is appropriate Considering Figure 15 it canbe noticed that EC has increased the average cone resistanceby 30ndash200 in most sites Besides the relative density inall deposits increased by 10 to 50 due to EC The changesin the cone resistance values vary from one site to anotherbecause factors such as the CPT recording time appliedenergy soil type and initial strength also influence the finalpenetration resistance after blast densification
In some sites the treated layer experienced significantvolume reduction but penetration resistance did not increasesignificantly Cases 3 and 13 are good examples for this phe-nomenon After blast densification at a test site in South Car-olina USA large surface settlement of about 8 of the layerthickness happened while average values of 119902c increased onlyto about 28 after 1034 days Likewise in Oakridge Landfillvast volume changes and increase in 119863
119903can be seen whereas
CPT records donot show significant changes because of EC Itis concluded that some reasons such as confining layer abovetarget soils can affect CPT results because this layer is anobstacle for escaping gases generated by blasting
Results of investigation show that EC was carried out inloose deposits with 119876tn lt 55 because these types of soils aresusceptible to liquefaction Hence119876tn criteria can be used toidentify deposits which are suitable to be improved by EC
In some sites such as Chicopee I Quebec and Shanghaiproject the fine content was less than 5 and this enabledachievement of a significant increase in the cone resistance
In general according to data of Table 1 and comparisonspresented at Figure 1 it can be concluded that the coneresistance will increase up to twice of initial resistance valueafter blast densification in hydraulically deposited alluvialsands having a fine content of less than 5
As for the soil classification graphs based onCPT recordswhich are shown in Figure 13 EC had promising results forsoils falling in the silty clay to silty sand zones defined bythe Robertson et al (1986) chart and also in the silty sandzone defined by Eslami and Fellenius (2004) chartThereforeit can be concluded that these zones in classification charts
represent soil types that have liquefaction potential Throughcomparison of these two charts it may be seen that a moresuitable scattering of records is achieved by Eslami andFellenius (2004) chart as the records fit well in the sand andsilty sand zone Nevertheless in the chart of Robertson et al(1986) the data records are spread over more zones makingit difficult to interpret the range of grain size distribution forsoils suitable for EC treatment
6 Summary and Conclusions
EC for ground modification covers a wide range of soil typeswith regard to the grain size distribution In this study thir-teen successful case histories in USA Canada Nigeria JapanSweden and China have been collected and studied focusedon the range of grain size distribution The density of targetdeposits for improvement has been evaluated with regard tothe settlement of layer and increase of strength which wereobtained from the cone resistance relative density and visualobservations reported in the sources Consequently thesegeotechnical variations indicate the successful performanceof EC for improving the soil deposits The geomaterials ofsites mainly comprised fine-to-medium sand hydraulicallydeposited alluvial layers silty sand or sands mixed withgravel and cobblestone while the existing fine content grainswhich are less than 0075mm in size in the sitersquos deposits weredifferent between 0 and 40
Design of EC in these sites was carried out in squareor triangular grid patterns and in one to four phasesThe distance between the blast holes varied depending onconstraints of each site in terms of application of explosivesStudy of the grain size distribution of target deposits forimprovement and design status of EC in addition to analysisof CPT records before and after improvement have been usedand the following results are inferred for zoning
(i) EC was performed successfully in a wide range ofsoil types from coarse gravel with cobble or rubblewith a diameter of 1m to silty sands with 40 siltcontent and 10 clayThe best performance of ECwasin alluvial sandswith a fine content of less than 5andhydraulically deposited layers with an initial relative
Shock and Vibration 13
density of 30 to 60 Performance range of EC isin all soil types with potential liquefaction whichcovers a wider range of soil types in comparison withother soil improvement methods like the vibrationmethods
(ii) Cone penetration test (CPT) can be used as anevaluation tool for EC along with the measurementsof settlement Analyses have shown that through ECthe cone resistance of sand deposits easily increasesup to 200 with a fine content of less than 5 whichwould be followed by 10 to 30 increase in therelative density of soilThe increase of the fine contentand density of deposits would affect the performanceof EC in relation to the variation of the penetrationresistance of the soil
(iii) Deposits with CPT records fitting into zones 6 to 9of Robertson et al 1986 classification chart and zone4 of Eslami and Fellenius 2004 chart are the best forimprovement using the ECmethod Less scattering ofCPT records was observed in Eslami and Felleniusrsquoschart which gives more assurance with identificationof target deposits for EC
(iv) In addition to the position of problematic depositswith regard to grain size distribution and initialstrength other important parameters like depth oftarget layer relative costs and environmental limita-tions may play an important role in selection of ECas an alternative for deep improvement among othermethods
Competing Interests
The authors declare that they have no competing interests
References
[1] M Shakeran and A Eslami ldquoSettlemet due to explosiveimprovement in loose saturated deposits Application for 18case historisrdquoAmirkabir Journal of Science andResearch Journalvol 45 no 2 pp 17ndash19 2013
[2] S R Gandhi A K Dey and S Selvam ldquoDensification of pondash by blastingrdquo Journal of Geotechnical and GeoenvironmentalEngineering vol 125 no 10 pp 889ndash899 1999
[3] W A Narin van Court and J K Mitchell ldquoSoil improvementby blastingrdquo Journal of Explosives Engineering vol 12 no 3 pp34ndash41 1994
[4] W A Charlie G E Veyera and S R Abt ldquoPredicting blastinduced pore-water pressure increases in soilsrdquo Civil Engineer-ing for Practicing andDesign Engineers vol 43 pp 311ndash328 1985
[5] J E Hachey R L Plum J Byrne A P Kilian and D V JenkinsldquoBlast densification of a thick loose debris flowatMt StHelenrsquosWashingtonrdquo in Proceedings of the Vertical and HorizontalDeformations of Foundations and Embankments GeotechnicalSpecial Publication no 40 pp 502ndash512 1994
[6] B Tavakoli M Shakeran and A Eslami ldquoSettlement predic-tion for problematic soils improved by eplosive compactionmethodrdquo Journal of Revista Vitae vol 21 no 1 2014
[7] W A Narin van Court ldquoEC revisited new guidance forperforming blast densificationrdquo in Proceedings of the 12th
Pan-American Conference on Soil Mechanics and GeotechnicalEngineering and 39th U S Rock Mechanics Symposium pp1725ndash1730 SARA Cambridge Mass USA 2003
[8] PMurrayNK Singh FHuber andD Siu ldquoEC for the seymourfalls dam seismic upgraderdquo in Proceedings of the 59th CanadianGeotechnical Conference Vancouver Canada October 2006
[9] B T Rogers C A Graham andM G Jefferies ldquoCompaction ofhydraulic fill sand in Molikpaq corerdquo in Proceedings of the 43rdCanadian Geotechnical Conference Prediction and Performancein Geotechnique Quebec City Canada 1990
[10] W A Charlie M F J Rwebyogo and D O Doehring ldquoTime-dependent cone penetration resistance due to blastingrdquo Journalof Geotechnical Engineering vol 118 no 8 pp 1200ndash1215 1992
[11] A Eslami A Pirouzi J R Omer and M Shakeran ldquoCPT-based evaluation of Blast Densification (BD) performance inloose deposits with settlement and resistance considerationsrdquoGeotechnical and Geological Engineering vol 33 no 5 pp 1279ndash1293 2015
[12] J KMitchell and Z V Solymar ldquoTime-dependent strength gainin freshly deposited or densified sandrdquo Journal of GeotechnicalEngineering vol 110 no 11 pp 1559ndash1576 1984
[13] C J Fordham E C McRoberts B C Purcell and P DMcLaughlin ldquoPractical and theoretical problems associatedwith blast densification of loose sandsrdquo in Proceedings of the44th Canadian Geotechnical Conference vol 2 pp 921ndash922Canadian Geotechnical Society 1991
[14] M G Jefferies B T Rogers H R Stewart S Shinde DJames and S Williams-Fitzpatrick ldquoIsland construction in theCanadian Beaufort seardquo in Proceedings of the Hydraulic FillStructures Geotechnical Special Publications no 21 pp 816ndash883 ASCE August 1988
[15] J H Schmertmann ldquoDiscussion of lsquotimeminusdependent strengthgain in freshly deposited or densified sandrsquo by James KMitchell and Zoltan V Solymar (November 1984)rdquo Journal ofGeotechnical Engineering vol 113 no 2 pp 173ndash175 1987
[16] W A Narin van Court Investigation of the Densification Mech-anisms and Predictive Methologies for Explosive CompactionUniversity of California at Berkeley 1997
[17] T Sugano and E Kohama ldquoSeismic performance of urbanreclaimed and port areas-full scale experiment at tokachi portby controlled blasting techniquerdquo in Proceedings of the TheEarthquake Engineering Symposium vol 11 pp 901ndash906 2002
[18] N Singh L Murray F Huber and M Gant ldquoCase historymdashseismic upgrade of the Seymour Falls Damrdquo in Proceedingsof the 61th Canadian Geotechnical Conference and 9th JointCGSIAH-CNC Groundwater Conference (Geo-Edmonton rsquo08)Edmonton Canada 2008
[19] G A Narsilio Spatial variability and terminal density-impication in soil behavior [PhD dissertation] GeorgiaInstitute of Technology 2006
[20] G A Narsilio J C Santamarina T Hebeler and R BachusldquoBlast densification multi-instrumented case historyrdquo Journalof Geotechnical and Geoenvironmental Engineering vol 135 no6 pp 723ndash734 2009
[21] B Wilson and J Scholte ldquoBlast densification of fine tailingrdquo inProceedings of the 35th Annual Conference on Deep FoundationsHollywood Calif USA 2010
[22] Z V Solymar ldquoCompaction of alluvial sands by deep blastingrdquoCanadian Geotechnical Journal vol 21 no 2 pp 305ndash321 1984
[23] Z V Solymar B C Iloabachie R C Gupta and L R WilliamsldquoEarth foundation treatment at Jebba dam siterdquo Journal ofGeotechnical Engineering vol 110 no 10 pp 1415ndash1430 1984
14 Shock and Vibration
[24] U LaFosse and T A Gelormino ldquoSoil improvement by deepblastingmdasha case studyrdquo in Proceedings of the 17th AnnualSymposium on Explosives and Blasting Technique vol 1 pp 205ndash213 International Society of Explosive Engineers Las VegasNev USA 1991
[25] B J Prugh ldquoDensification of soils by explosive vibrationrdquoJournal of the Construction Division ASCE vol 89 pp 79ndash1001963
[26] A K Lyman ldquoCompaction of cohesionless foundation soilsby explosivesrdquo Transactions of the American Society of CivilEngineers vol 107 no 1 pp 1330ndash1348 Paper no 2160 1942
[27] N Jelisic and B S Malmborg ldquoCompaction by blastingrdquo inProceedings of the 12th European Conference on Soil Mechanicsand Geotechnical Engineering vol 3 Amsterdam Netherlands1999
[28] N Jelisic and B S Malmborg ldquoCompaction by blastingrdquo inProceedings of the 12th European Conference on Soil Mechanicsand Geotechnical Engineering pp 1513ndash1520 Amsterdam TheNetherlands 1999
[29] J Qu Z Ran and S Miao ldquoEC of sand foundation in-situtrailsrdquo Applied Mechanics and Materials vol 147 pp 176ndash1822012
[30] AGRA Earth and Environmental ldquoVolume change and residualpore water pressure of saturated granular soils to blast loadsrdquoInternal Report 1996
[31] R Finno A Gallant and P Sabatini ldquoEvaluating groundimprovement after blast densification performance at theoakridge landfillrdquo Journal of Geotechnical and Geoenvironmen-tal Engineering vol 142 no 1 2015
[32] M G Jefferies ldquoExplosive compactionrdquoGeotechnical News vol9 no 2 pp 29ndash31 1991
[33] F G Bell Engineering Treatment of Soils E amp Spon Publication1st edition 1993
[34] J A Sladen andK J Hewitt ldquoinfluence of placementmethod onthe in situ density of hydraulic sandfillsrdquoCanadianGeotechnicalJournal vol 22 pp 564ndash578 1988
[35] H Pincus R Campanella and M Kokan ldquoA new approach tomeasuring dilatancy in saturated sandsrdquo Geotechnical TestingJournal vol 16 no 4 p 485 1993
[36] A Eslami and B H Fellenius ldquoCPT and CPTu data forsoil profile interpretation review of methods and a proposednew approachrdquo Iranian Journal of Science and TechnologyTransaction B Engineering vol 28 no 1 pp 69ndash86 2004
[37] P K Robertson R G Campanella D Gillespie and J GriegldquoUse of piezometer cone datardquo in Proceedings of the AmericanSociety of Civil Engineers ASCE In-Situ 86 Specialty ConferenceS Clemence Ed Geotechnical Special Publication GSP no 6pp 1263ndash1280 Blacksburg Va USA June 1986
[38] F H Kulhawy and P W Mayne Manual on Estimating SoilProperties for Foundation Design Electric Power ResearchInstitute Palo Alto Calif USA 1990
International Journal of
AerospaceEngineeringHindawi Publishing Corporationhttpwwwhindawicom Volume 2014
RoboticsJournal of
Hindawi Publishing Corporationhttpwwwhindawicom Volume 2014
Hindawi Publishing Corporationhttpwwwhindawicom Volume 2014
Active and Passive Electronic Components
Control Scienceand Engineering
Journal of
Hindawi Publishing Corporationhttpwwwhindawicom Volume 2014
International Journal of
RotatingMachinery
Hindawi Publishing Corporationhttpwwwhindawicom Volume 2014
Hindawi Publishing Corporation httpwwwhindawicom
Journal ofEngineeringVolume 2014
Submit your manuscripts athttpwwwhindawicom
VLSI Design
Hindawi Publishing Corporationhttpwwwhindawicom Volume 2014
Hindawi Publishing Corporationhttpwwwhindawicom Volume 2014
Shock and Vibration
Hindawi Publishing Corporationhttpwwwhindawicom Volume 2014
Civil EngineeringAdvances in
Acoustics and VibrationAdvances in
Hindawi Publishing Corporationhttpwwwhindawicom Volume 2014
Hindawi Publishing Corporationhttpwwwhindawicom Volume 2014
Electrical and Computer Engineering
Journal of
Advances inOptoElectronics
Hindawi Publishing Corporation httpwwwhindawicom
Volume 2014
The Scientific World JournalHindawi Publishing Corporation httpwwwhindawicom Volume 2014
SensorsJournal of
Hindawi Publishing Corporationhttpwwwhindawicom Volume 2014
Modelling amp Simulation in EngineeringHindawi Publishing Corporation httpwwwhindawicom Volume 2014
Hindawi Publishing Corporationhttpwwwhindawicom Volume 2014
Chemical EngineeringInternational Journal of Antennas and
Propagation
International Journal of
Hindawi Publishing Corporationhttpwwwhindawicom Volume 2014
Hindawi Publishing Corporationhttpwwwhindawicom Volume 2014
Navigation and Observation
International Journal of
Hindawi Publishing Corporationhttpwwwhindawicom Volume 2014
DistributedSensor Networks
International Journal of
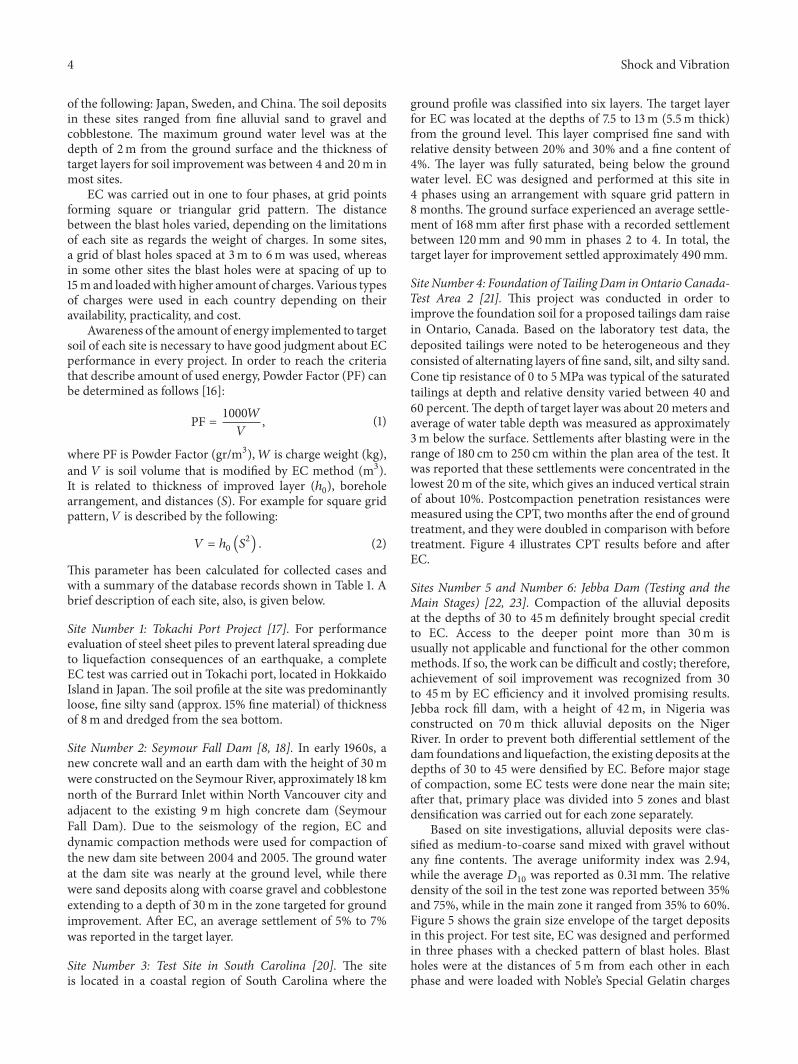
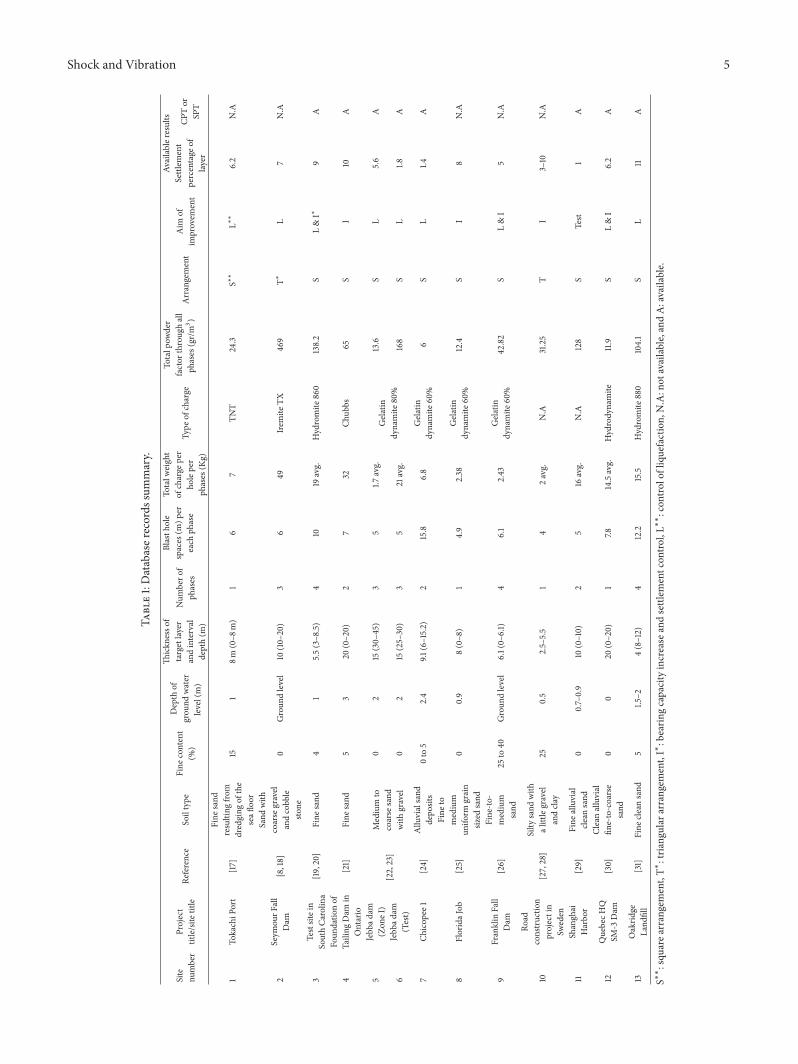
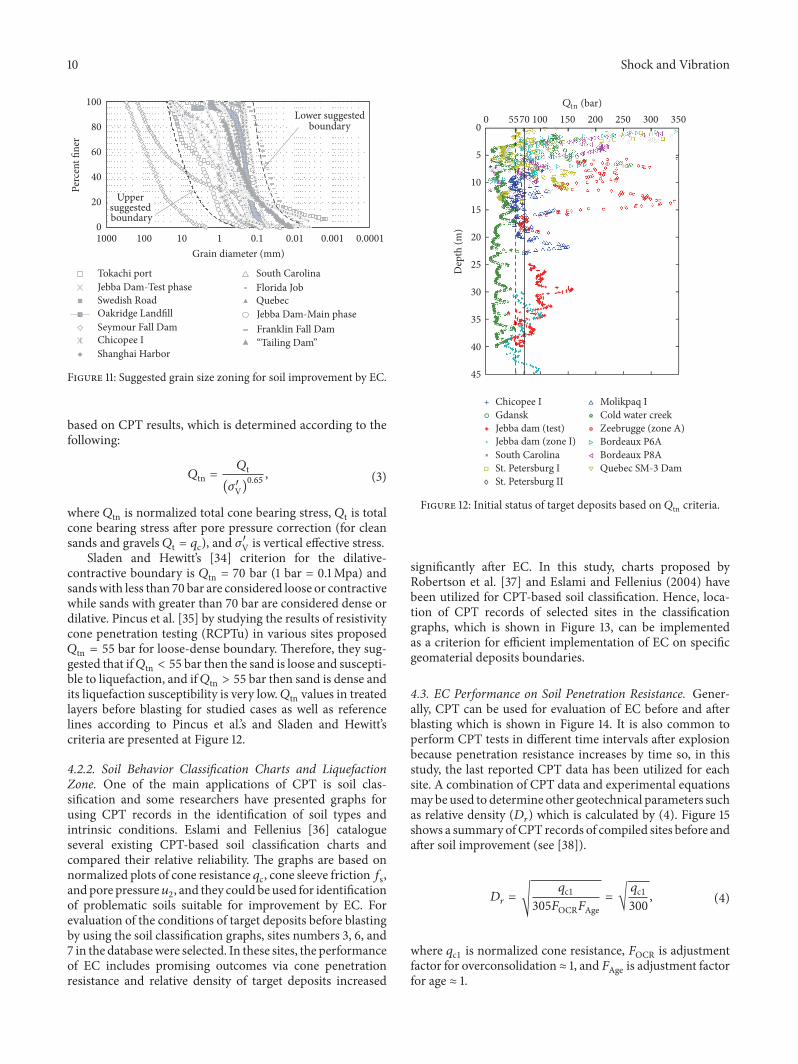
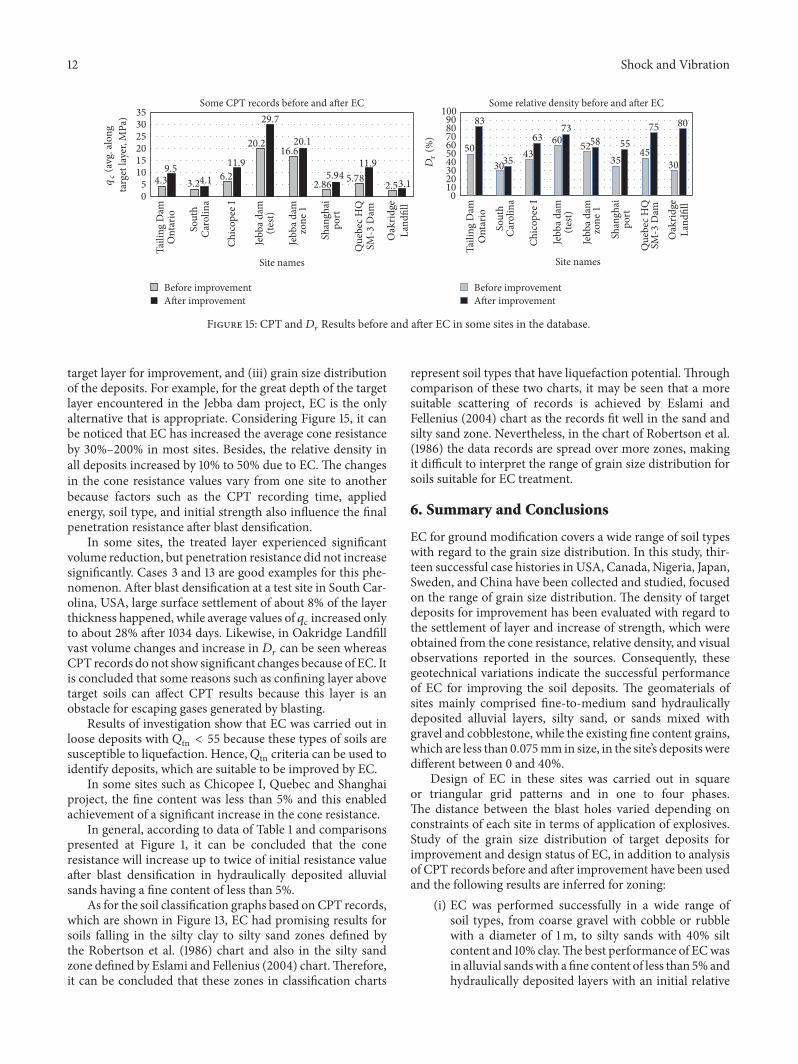

International Journal of
AerospaceEngineeringHindawi Publishing Corporationhttpwwwhindawicom Volume 2014
RoboticsJournal of
Hindawi Publishing Corporationhttpwwwhindawicom Volume 2014
Hindawi Publishing Corporationhttpwwwhindawicom Volume 2014
Active and Passive Electronic Components
Control Scienceand Engineering
Journal of
Hindawi Publishing Corporationhttpwwwhindawicom Volume 2014
International Journal of
RotatingMachinery
Hindawi Publishing Corporationhttpwwwhindawicom Volume 2014
Hindawi Publishing Corporation httpwwwhindawicom
Journal ofEngineeringVolume 2014
Submit your manuscripts athttpwwwhindawicom
VLSI Design
Hindawi Publishing Corporationhttpwwwhindawicom Volume 2014
Hindawi Publishing Corporationhttpwwwhindawicom Volume 2014
Shock and Vibration
Hindawi Publishing Corporationhttpwwwhindawicom Volume 2014
Civil EngineeringAdvances in
Acoustics and VibrationAdvances in
Hindawi Publishing Corporationhttpwwwhindawicom Volume 2014
Hindawi Publishing Corporationhttpwwwhindawicom Volume 2014
Electrical and Computer Engineering
Journal of
Advances inOptoElectronics
Hindawi Publishing Corporation httpwwwhindawicom
Volume 2014
The Scientific World JournalHindawi Publishing Corporation httpwwwhindawicom Volume 2014
SensorsJournal of
Hindawi Publishing Corporationhttpwwwhindawicom Volume 2014
Modelling amp Simulation in EngineeringHindawi Publishing Corporation httpwwwhindawicom Volume 2014
Hindawi Publishing Corporationhttpwwwhindawicom Volume 2014
Chemical EngineeringInternational Journal of Antennas and
Propagation
International Journal of
Hindawi Publishing Corporationhttpwwwhindawicom Volume 2014
Hindawi Publishing Corporationhttpwwwhindawicom Volume 2014
Navigation and Observation
International Journal of
Hindawi Publishing Corporationhttpwwwhindawicom Volume 2014
DistributedSensor Networks
International Journal of