Research Article - · PDF filephytochemicals by preliminary test along with HPTLC method to be...
8
Anuradha Palve et al / Int. J. Res. Ayurveda Pharm. 6(3), May - June 2015 358 Research Article www.ijrap.net HPTLC METHOD FOR QUALITATIVE DETERMINATION OF PHYTOCHEMICAL COMPOUNDS IN EXTRACT OF STERCULIA LYCHNOPHORA Anuradha Palve 1 , Pooja Shetty 1 , Mukesh Pimpliskar 2 and R. N. Jadhav 2 * 1 Department of Bioinformatics, G. N. Khalsa College, Matunga, Mumbai, India 2 Department of Zoology, E.S.A. College of Science Vasai Road, Dist- Palghar, India Received on: 04/03/15 Revised on: 23/04/15 Accepted on: 02/05/15 *Corresponding author Dr. R. N. Jadhav, Department of Zoology, E.S.A. College of Science Vasai Road, Dist- Palghar, 401202 India E-mail: [email protected] DOI: 10.7897/2277-4343.06370 ABSTRACT The objective of this study was to select and identify the sample and to perform extraction of Sterculia lychnophora and to check the presence of phytochemicals by preliminary test along with HPTLC method to be used for qualitative analysis. In present investigation primary screening of phytochemical and qualitative analysis of secondary metabolites like tannins, saponins, phenols, terpenoids, flavonoids, alkaloids and lipids were carried out by HPTLC method. Higher percentage of lipid, tannins and phenol, moderate of flavonoids, saponins and terpenoids while fewer peaks of alkaloids were observed. The present work signifies the use of HPTLC fingerprint for determining the identity, purity of drugs and also for developing standards Keywords: HPTLC, Sterculia lychnophora, phytochemical, Niranjan phal, Screening. INTRODUCTION Plants have been used in the production of stimulant beverages such as tea, coffee, cocoa and cola. Many secondary metabolites of plant chemicals are derived biosynthetically from plant primary metabolites. The secondary metabolites can be classified into several groups on the basis of their chemical classes 1 . Plants contain many active compounds such as alkaloids, steroids, tannins, glycosides, volatile oils, fixed oils, resins, phenols and flavonoids which are deposited in their specific parts such as leaves, flowers, bark, seeds, fruits, root, etc 2 . The seeds of Sterculia lychnophora are specified as boat-fruited Sterculia which is traditional Chinese drug 3 . S. lychnophora is also called “Niranjan phal”,Malva nut or “China fruit” in India. The fruit of Malva nut is egg-shaped having a diameter of 8-15 mm and color of this fruit is green-yellow which turns to dark- brown after maturation and size up to adult’s fingertip .The fruit is 18-20 millimeter long, base is 5-6 millimeter wide and dark blackish-brown surface with wrinkle and fruiting season is April-June 4 (Figure 1). Sterculia species have been extensively used in traditional medicine in the various countries across the world where they are found. In Cambodia, S. lychnophora is used as tea 5 . The flesh surrounding the dried seeds swells to eight times its original volume when it is overnight soaked in water. It is considered as “cooling medicine” and effective in soothing dry cough and stomach ailments. Malva nut is reported to contain glycoside, flavonoids, tannins and saponins. It is used as anti-bacterial, anti- oxidant, anti-ulcer, anti-tumour, anti-progestational, anti- estrogenic activity 6 . In-silico and In-vitro studies on Sterculia lychnophora reveals that it has neuroprotective properties 7, 8 . Solvents diffuse into plant materials and solubilize compounds with similar polarity during extraction. The main purpose of extraction procedure for medicinal plant parts is to obtain therapeutically desired portions and to eliminate unwanted material 9 . Hot continuous extraction (Soxhlet) is one of the techniques of medicinal plants extraction of secondary metabolites. Soxhlet extraction strongly depends on matrix characteristics and particle size as the internal diffusion may be the limiting step 10 . Alkaloids are one of the most diverse groups of secondary metabolites found in living organisms and have an array of structure types, biosynthetic pathways, and pharmacological activities 11 . Tannins are polyphenolic substances and are considered to have both adverse and beneficial effects depending on their concentration and nature as well as other factors such as species, physiological state and composition of the diet. Saponins are steroid or triterpene glycoside compounds found in a variety of plants 12 . Flavonoids are group of polyphenolic compounds which are diverse in chemical structure and characteristics .Plant phenols are mostly products of the phenylpropanoid pathway. They are strong antioxidants and might prevent oxidative damage to biomolecules such as DNA, lipids and proteins which play a role in chronic diseases such as cancer and cardiovascular disease 13 . Terpenoids are the most structurally varied class of plant natural products, they are commercially important due to their wide application in industrial products such as flavoring agents, pharmaceuticals, perfumes, insecticides and anti-microbial agents 14 .
Transcript of Research Article - · PDF filephytochemicals by preliminary test along with HPTLC method to be...

Anuradha Palve et al / Int. J. Res. Ayurveda Pharm. 6(3), May - June 2015
358
Research Article www.ijrap.net
HPTLC METHOD FOR QUALITATIVE DETERMINATION OF PHYTOCHEMICAL COMPOUNDS IN
EXTRACT OF STERCULIA LYCHNOPHORA Anuradha Palve1, Pooja Shetty1, Mukesh Pimpliskar2 and R. N. Jadhav2*
1Department of Bioinformatics, G. N. Khalsa College, Matunga, Mumbai, India
2Department of Zoology, E.S.A. College of Science Vasai Road, Dist- Palghar, India
Received on: 04/03/15 Revised on: 23/04/15 Accepted on: 02/05/15 *Corresponding author Dr. R. N. Jadhav, Department of Zoology, E.S.A. College of Science Vasai Road, Dist- Palghar, 401202 India E-mail: [email protected] DOI: 10.7897/2277-4343.06370 ABSTRACT The objective of this study was to select and identify the sample and to perform extraction of Sterculia lychnophora and to check the presence of phytochemicals by preliminary test along with HPTLC method to be used for qualitative analysis. In present investigation primary screening of phytochemical and qualitative analysis of secondary metabolites like tannins, saponins, phenols, terpenoids, flavonoids, alkaloids and lipids were carried out by HPTLC method. Higher percentage of lipid, tannins and phenol, moderate of flavonoids, saponins and terpenoids while fewer peaks of alkaloids were observed. The present work signifies the use of HPTLC fingerprint for determining the identity, purity of drugs and also for developing standards Keywords: HPTLC, Sterculia lychnophora, phytochemical, Niranjan phal, Screening. INTRODUCTION Plants have been used in the production of stimulant beverages such as tea, coffee, cocoa and cola. Many secondary metabolites of plant chemicals are derived biosynthetically from plant primary metabolites. The secondary metabolites can be classified into several groups on the basis of their chemical classes 1 . Plants contain many active compounds such as alkaloids, steroids, tannins, glycosides, volatile oils, fixed oils, resins, phenols and flavonoids which are deposited in their specific parts such as leaves, flowers, bark, seeds, fruits, root, etc 2. The seeds of Sterculia lychnophora are specified as boat-fruited Sterculia which is traditional Chinese drug 3. S. lychnophora is also called “Niranjan phal”,Malva nut or “China fruit” in India. The fruit of Malva nut is egg-shaped having a diameter of 8-15 mm and color of this fruit is green-yellow which turns to dark-brown after maturation and size up to adult’s fingertip .The fruit is 18-20 millimeter long, base is 5-6 millimeter wide and dark blackish-brown surface with wrinkle and fruiting season is April-June4 (Figure 1). Sterculia species have been extensively used in traditional medicine in the various countries across the world where they are found. In Cambodia, S. lychnophora is used as tea 5. The flesh surrounding the dried seeds swells to eight times its original volume when it is overnight soaked in water. It is considered as “cooling medicine” and effective in soothing dry cough and stomach ailments. Malva nut is reported to contain glycoside, flavonoids, tannins and saponins. It is used as anti-bacterial, anti-oxidant, anti-ulcer, anti-tumour, anti-progestational, anti-estrogenic activity 6. In-silico and In-vitro studies on
Sterculia lychnophora reveals that it has neuroprotective properties 7, 8 . Solvents diffuse into plant materials and solubilize compounds with similar polarity during extraction. The main purpose of extraction procedure for medicinal plant parts is to obtain therapeutically desired portions and to eliminate unwanted material9. Hot continuous extraction (Soxhlet) is one of the techniques of medicinal plants extraction of secondary metabolites. Soxhlet extraction strongly depends on matrix characteristics and particle size as the internal diffusion may be the limiting step 10. Alkaloids are one of the most diverse groups of secondary metabolites found in living organisms and have an array of structure types, biosynthetic pathways, and pharmacological activities 11. Tannins are polyphenolic substances and are considered to have both adverse and beneficial effects depending on their concentration and nature as well as other factors such as species, physiological state and composition of the diet. Saponins are steroid or triterpene glycoside compounds found in a variety of plants 12. Flavonoids are group of polyphenolic compounds which are diverse in chemical structure and characteristics .Plant phenols are mostly products of the phenylpropanoid pathway. They are strong antioxidants and might prevent oxidative damage to biomolecules such as DNA, lipids and proteins which play a role in chronic diseases such as cancer and cardiovascular disease13. Terpenoids are the most structurally varied class of plant natural products, they are commercially important due to their wide application in industrial products such as flavoring agents, pharmaceuticals, perfumes, insecticides and anti-microbial agents 14.

Anuradha Palve et al / Int. J. Res. Ayurveda Pharm. 6(3), May - June 2015
359
Phytochemicals are known to possess antibacterial, anti diabetic, antioxidant, anti-inflammatory, antifungal, antiarthritic, and radio-protective activity and due to these properties they are largely used for medicinal purpose 15. High performance thin layer chromatography (HPTLC) is a sophisticated instrumental technique based on the full capabilities of thin layer chromatography. The basic principle of HPTLC separation, resolution and validation process. HPTLC would be suitable technique for resolving the problem because of its highly accurate data. HPTLC is the most simple separation technique available to the analyst16. HPTLC offers better resolution and estimation of active constituents can be done with reasonable accuracy in a shorter time. HPTLC has recently emerged as a preferred analytical tool for fingerprints and quantification of marker compounds in herbal drugs because of its simplicity, sensitivity, accuracy, suitability for high throughput screening, etc 17. The objective of this study was to select and identify the sample and to perform extraction of sample (Sterculia lychnophora) and to check the presence of phytochemicals by preliminary test along with HPTLC method to be used for qualitative analysis.
Figure 1: Seeds of Malva nuts
MATERIALS AND METHODS Collection of the plant material Fruits of Sterculia lychnophora were procured from the local trader at Vashi, New Mumbai, Maharashtra, India. The specimen was identified and authenticated by Dr.Shankaran, Department of Botany, Sathey College, Vile Parle, Mumbai. The voucher specimen (No-M.18) was preserved in departmental herbarium museum for further reference. Extraction of the plant material Hot continuous extraction (Soxhlet) method was used for dried powdered fruit using methanol and water as solvents for extraction Phytochemical screening Extracts of Sterculia lychnophora were tested for the presence of active principle compounds such as terpenoids, saponins, alkaloids, flavonoids, tannins, phenol, and lipids by biochemical testing and latter was confirmed by high performance thin layer chromatography (HPTLC).
Following standard procedures were used for biochemical test of methanol and aqueous extract of Sterculia lychnophora. Test for Tannins (Braymer’s Test) 1ml of filtrate distilled water was added for diluting and then two drops of ferric chloride was added. A transient greenish to black color indicates the presence of Tannins.18 Test for Saponins (Foam Test) The small quantity of extract was diluted with 4 ml of distilled water. The mixture was shaken vigorously. Persistence of foam for ten minutes indicates the presence of saponins 19. Test for Terpenoids (Salkowski Test) The extract was mixed with 0.4ml of chloroform and 0.6ml of concentrated H2SO4 was carefully added to form a layer. A reddish brown coloration at the interface is formed to show positive result of the presence of terpenoids 18. Test for Flavonoids (NaOH Test) The extract has to be treated with a few drops of sodium hydroxide solution. Formation of intense yellow color, which becomes colorless on the addition of acid, indicates the presence of flavonoids 20. Test for Phenol (Ferric Chloride Test) Extract have to be treated with a few drops of ferric chloride solution. Formation of bluish black color indicates the presence of phenols 19. Test for Alkaloids (Mayer’s Test) To 1ml of filtrate 2% H2SO4 was added and warmed for two minutes. It is filtered and few drops of Mayer’s reagent were added. A creamy- white colored precipitation indicates positive test and confirms the presence of alkaloids 21. Test for Lipids (Sudan’s Test) To 1ml of filtrate and 1ml of distilled water was added and few drops of Sudan red indicator were added in the test tube. The content of test tube was swirled and was allowed to settle. Formation of red color indicates positive test confirms the presence of lipid 22. High Performance Thin Layer Chromatography (HPTLC) The fruit extracts of Sterculia lychnophora were analyzed for their fingerprinting by HPTLC method. The four extracts used were hot extract methanol with ammonia, hot extract methanol without ammonia, hot extract
Anuradha Palve et al / Int. J. Res. Ayurveda Pharm. 6(3), May - June 2015
360
aqueous with ammonia and hot extract aqueous. The application of each sample extract was at different concentrations viz. 2μl, 5μl and 10μl. The plates used were silica gel coated TLC plates. The analysis of different phytochemical constituents was done to check its presence. Following are the solvents and reagents used during analysis The sample application was done on silica plates (20 cm X 20 cm, RP-18 F254s, supplied by Merck) using HPTLC applicator. Then they were developed with their respective solvents for saturation time of 20 minutes. Further, the developed plates were scanned at spectral range from 190 to 900 nm with high spectral selectivity for data acquisition using CAMAG TLC scanner III with CATS 4 software and scanned under visible, UV-255nm and 366nm. Then they were documented again in visible light .The colour, Rf value of the resolved spots and densitometry scan were recorded 23.
RESULT AND DISCUSSION Preliminary phytochemical analysis Phytochemical screening of plant extract of Sterculia lychnophora showed the presence of various constituents viz. tannins, saponins, flavonoids, phenols, terpenoid, alkaloids and lipids which are shown in the table 2. Plant species: Sterculia lychnophora
Table 2: Presence of phytochemicals using preliminary test
Results Saponins + Tannins +
Terpenoid + Phenols +
Flavonoids + Alkaloids +
Lipids + Keys: + Presence of the compounds
Table 3: Tracks representing sample amount and sample ID
Track Track type Vial Sample ID Amount (µl)
1 Sample 1 Methanol hot extract with ammonia 2.0 2 Sample 1 Methanol hot extract with ammonia 5.0 3 Sample 1 Methanol hot extract with ammonia a 10.0 4 Sample 2 Methanol hot extract without ammonia 2.0 5 Sample 2 Methanol hot extract without ammonia 5.0 6 Sample 2 Methanol hot extract without ammonia 10.0 7 Sample 3 Aqueous hot extract with ammonia 2.0 8 Sample 3 Aqueous hot extract with ammonia 5.0 9 Sample 3 Aqueous hot extract with ammonia 10.0 10 Sample 4 Aqueous hot extract without ammonia 2.0 11 Sample 4 Aqueous hot extract without ammonia 5.0 12 Sample 4 Aqueous hot extract without ammonia 10.0
HPTLC The results from HPTLC fingerprint scanned at different wavelengths for methanol and aqueous extract of Sterculia lychnophora seeds confirmed the presence of different secondary metabolites with different concentrations. The band Rf value of different range for hot aqueous extract and hot methanol extract was obtained as shown in the Figures 2-14. Lipids As shown in Figure 3, track 2 loaded with 5.0µl of methanolic extract treated with ammonia showed the presence of 13 polyvalent phytoconstituents and corresponding ascending order of Rf values start from 0.07 to 0.78 in which highest concentration of the phytoconstituents was found to be 77.50% whose corresponding Rf value was found to be 0.49 and was recorded in table 4 confirmed the presence of lipid in S. lychnophora. Saponin As shown in Figure 3, track 3 loaded with 10.0µl of methanol extract treated with ammonia showed the
presence of 9 polyvalent phytoconstituents and corresponding ascending order of Rf values start from 0.09 to 0.77 in which highest concentration of the phytoconstituents was found to be 38.55% whose corresponding Rf value was found to be 0.42 and was recorded in table 5 confirmed the presence of saponin in S. lychnophora.
Flavonoids As shown in Figure 7, track 3 and track 5 loaded with 10.0µl and 5.0µl respectively of methanolic extract treated with ammonia showed the presence of 8 polyvalent phytoconstituents and corresponding ascending order of Rf values start from 0.11 to 0.85 where highest concentration was 17.01% with Rf value of 0.85 in track 3 and track 5 showed the presence of 8 polyvalent phytoconstituents and corresponding ascending order of Rf values start from 0.11 to 0.79 where highest concentration was 45.07% with Rf value of 0.79 recorded in table 6 and table 7 confirmed the presence of flavonoids in S. lychnophora. Tannins As shown in Figure 9, track 6 loaded with 5.0µl of methanol extract showed the presence of 11 polyvalent

Anuradha Palve et al / Int. J. Res. Ayurveda Pharm. 6(3), May - June 2015
361
phytoconstituents and corresponding ascending order of Rf values start from 0.07 to 0.79 in which highest concentration of the phytoconstituents was found to be 65.77% whose corresponding Rf value was found to be 0.64 and was recorded in table 8 confirmed the presence of tannins in S. lychnophora. Terpenoids As shown in Figure 11, track 6 loaded with 5.0µl of methanol extract showed the presence of 9 polyvalent phytoconstituents and corresponding ascending order of Rf values start from 0.01 to 0.76 in which highest concentration of the phytoconstituents was found to be 30.31% whose corresponding Rf value was found to be 0.69 and was recorded in table 9 confirmed the presence of terpenoids in S. lychnophora. Phenols As shown in figure 14, track 6 loaded with 5.0µl of methanol extract showed the presence of 13 polyvalent phytoconstituents and corresponding ascending order of
Rf values start from 0.05 to 0.83 in which highest concentration of the phytoconstituents was found to be 22.35% whose corresponding Rf value was found to be 0.54 and was recorded in table 10 confirmed the presence of phenols in S. lychnophora. Alkaloids As shown in Figure 15, track 6 loaded with 5.0µl of methanol extract showed the presence of 5 polyvalent phytoconstituents and corresponding ascending order of Rf values start from 0.09 to 0.54 in which highest concentration of the phytoconstituents was found to be 30.21% whose corresponding Rf value was found to be 0.54 and was recorded in table 11 confirmed the presence of alkaloids in S. lychnophora. Similar studies been done to test the phytochemicals from the crude extract of different parts of plants and developed the HPTLC method indicating the chemical profile of the plants under study to name few Sahadevi (Vernonia cinerea L.)24 and mangroves Rhizophora species along Mumbai coast25.
Table 1: Solvent systems and reagents used in HPTLC for detection of phytochemicals
Constituents Solvent system used Ratio of Volume (V:V) Reagents
Saponins Chloroform: Acetic acid: Methanol: water 6.4:3.2:1.2:0.8 Anisaldehyde Sulphuric acid Tannins Toluene: Ethyl Acetate: Formic acid 6:4:0.3 Ferric chloride
Flavonoids Ethyl Acetate: Formic acid Glacial acetic acid: water 10:0.5:0.5:1.3 Anisaldehyde Sulphuric acid Terpenoids n-Hexane: Ethyl Acetate 1:1 -nil-
Phenol Cyclohexane: Ethyl Acetate: Formic acid 4:6:1 Anisaldehyde Sulphuric acid Lipids Chloroform: Methanol water: Ammonia 13:5:0.8:0.1 Copper Sulphate
Alkaloids Toluene: Ethyl acetate:Diethylamine 7:2:1 Dragendorff’s
Table 4: HPTLC-Lipids profile of the methanolic extract with ammonia of S. lychnophora
Peak Start Rf
Start Height
Max Rf
Max Height
Max %
End Rf
End Height
Area Area %
Assigned substance
1 0.03 0.3 0.07 38.3 4.10 0.11 0.0 626.2 2.34 Unknown* 2 0.20 1.1 0.22 19.3 2.07 0.23 2.6 236.7 0.89 Unknown* 3 0.23 4.2 0.24 17.4 1.86 0.25 0.3 160.0 0.60 Auto generated 12 4 0.26 0.7 0.26 13.4 1.44. 0.27 3.3 95.4 0.36 Unknown* 5 0.27 4.3 0.28 18.4 1.97 0.30 7.1 213.8 0.80 Auto generated 10 6 0.30 7.3 0.32 21.9 2.34 0.33 18.3 330.7 1.24 Unknown* 7 0.33 19.5 0.35 35.0 3.75 0.37 24.4 944.1 3.53 Unknown* 8 0.37 25.1 0.38 30.6 3.29 0.39 13.3 415.3 1.55 Auto generated 6 9 0.40 13.8 0.41 33.0 3.63 0.42 20.7 398.7 1.49 Auto generated 9 10 0.42 21.8 0.49 585.7 62.63 0.53 12.1 20705.9 77.50 Auto generated 5 11 0.53 12.3 0.57 51.2 5.47 0.61 4.7 1277.0 4.78 Auto generated 4 12 0.63 4.4 0.65 12.1 1.29 0.67 2.0 191.4 0.72 Auto generated 3 13 0.73 1.0 0.78 58.6 6.26 0.80 1.3 1122.1 4.20 Unknown*
Table 5: HPTLC-Saponins profile of the methanol extract with ammonia of S. lychnophora.
Peak Start
Rf Start
Height Max Rf
Max Height
Max %
End Rf
End height
Area Area % Assigned substance
1 0.05 0.8 0.09 40.3 10.48 0.11 0.3 1070.2 9.25 Auto generated 24 2 0.13 2.6 0.17 14.3 3.71 0.19 4.2 323.5 2.80 Unknown* 3 0.19 4.5 0.20 16.5 4.27 0.21 12.9 216.7 1.87 Unknown* 4 0.21 13.8 0.23 23.4 6.07 0.25 8.0 483.6 4.18 Auto generated 12 5 0.36 5.7 0.42 147.1 38.12 0.45 60.0 4459.7 38.55 Unknown* 6 0.45 60.2 0.46 64.1 16.62 0.52 19.8 2173.0 18.78 Auto generated 9 7 0.53 19.6 0. 57 57.2 14.82 0.64 10.2 2346.1 20.28 Auto generated 4 8 0.65 9.7 0.66 11.1 2.87 0.70 0.7 271.0 2.34 Unknown* 9 0.74 1.1 0.77 11.7 3.03 0.79 0.4 225.3 1.95 Auto generated 1

Anuradha Palve et al / Int. J. Res. Ayurveda Pharm. 6(3), May - June 2015
362
Table 6: HPTLC-Flavonoids profile of the methanol extract with ammonia of S. lychnophora
Peak Start
Rf Start
Height Max Rf
Max Height
Max %
End Rf
End Height
Area Area %
Assigned Substance
1 0.07 0.5 0.11 70.1 30.34 0.17 0.9 2526.9 38.61 Auto generated11 2 0.17 1.0 0.20 20.6 8.92 0.22 1.7 394.0 6.02 Auto generated12 3 0.24 1.6 0.28 14.8 6.41 0.30 1.3 365.7 5.59 Auto generated8 4 0.33 2.0 0.36 28.7 12.41 0.40 3.6 832.9 12.73 Auto generated6 5 0.54 4.5 0.55 19.2 8.30 0.56 3.3 172.2 2.63 Auto generated4 6 0.60 9.5 0.62 16.5 7.15 0.65 1.6 379.9 5.80 Auto generated9 7 0.68 0.4 0. 71 23.1 10.01 0.76 3.5 759.2 11.60 Auto generated13 8 0.80 0.8 0.85 38.0 16.46 0.88 2.7 1113.5 17.01 Auto generated15
Table 7: HPTLC-Flavonoids profile of the methanol extract with ammonia of S. lychnophora
Peak Start
Rf Start
Height Max Rf
Max Height
Max %
End Rf
End height
Area Area %
Unknown*
1 0.05 0.4 0.11 88.6 23.29 0.15 0.7 2994.5 23.46 Unknown* 2 0.15 1.0 0.18 35.6 9.35 0.21 0.1 734.9 5.76 Unknown* 3 0.23 1.1 0.26 20.4 5.37 0.29 1.4 479.8 3.76 Unknown* 4 0.31 7.3 0.33 32.1 8.44 0.37 2.7 830.0 6.50 Unknown* 5 0.52 0.7 0.59 30.1 7.92 0.63 2.6 1142.7 8.95 Unknown* 6 0.65 1.2 0.69 13.9 3.67 0.71 11.8 337.3 2.64 Unknown* 7 0.71 11.5 0. 74 24.0 6.31 0.74 19.0 492.0 3.85 Unknown* 8 0.75 20.6 0.79 136.7 35.66 0.87 0.1 5752.6 45.07 Unknown*
Table 8: HPTLC-Tannins profile of the methanol extract of S. lychnophora
Peak Start
Rf Start
Height Max Rf
Max Height
Max %
End Rf
End Height
Area Area %
Assigned substance
1 0.04 0.3 0.07 25.0 2.26 0.08 4.2 401.6 0.81 Auto generated 8 2 0.10 1.0 0.13 11.2 1.01 0.15 0.5 249.4 0.50 Auto generated 2 3 0.15 1.3 0.17 12.5 1.13 0.18 3.1 159.0 0.32 Auto generated 11 4 0.18 3.2 0.21 36.3 3.28 0.22 31.8 706.0 1.42 Auto generated 9 5 0.23 32.6 0.25 166.2 15.01 0.28 42.6 3756.1 7.58 Auto generated 3 6 0.28 43.3 0.32 116.6 10.53 0.37 0.8 4533.9 9.15 Auto generated 4 7 0.38 1.3 0.41 17.2 1.55 0.43 11.1 379.9 0.77 Auto generated 13 8 0.44 14.0 0.47 28.4 2.56 0.50 4.8 964.6 1.95 Auto generated 12 9 0.51 6.3 0.64 564.9 51.00 0.68 36.5 32604.9 65.77 Auto generated 1 10 0.69 36.1 0.72 48.2 4.35 0.74 38.9 1757.8 3.55 Auto generated 7 11 0.75 38.9 0.79 81.0 7.31 0.86 7.4 4059.2 8.19 Auto generated 5
Table 9: HPTLC-Terpenoids profile of the methanol extract of S. lychnophora
Peak Start
Rf Start
Height Max Rf
Max Height
Max %
End Rf
End Height
Area Area %
Assigned substance
1 0.01 0.4 0.01 37.8 13.72 0.02 1.1 379.4 4.58 Unknown 2 0.05 0.2 0.08 19.5 7.08 0.08 13.8 256.5 3.09 Unknown 3 0.09 13.9 0.10 31.3 11.39 0.13 1.0 620.7 7.49 Unknown 4 0.14 0.7 0.18 18.3 6.64 0.23 2.1 665.7 8.03 Unknown 5 0.29 2.8 0.32 13.4 4.88 0.33 6.2 271.1 3.27 Unknown 6 0.35 3.3 0.44 30.0 10.92 0.46 27.3 1551.1 18.71 Unknown 7 0.49 32.2 0.49 34.4 12.50 0.55 2.1 977.3 11.79 Unknown 8 0.63 2.7 0.69 60.8 22.10 0.73 29.3 2512.4 30.31 Unknown 9 0.75 27.3 0.76 29.6 10.77 0.82 10.3 1054.9 12.73 Unknown
Table 10: HPTLC-Phenols profile of the methanol extract of S. lychnophora
Peak Start
Rf Start
Height Max Rf
Max Height
Max %
End Rf
End Height
Area Area %
Assigned substance
1 0.04 6.6 0.05 16.5 1.45 0.07 1.6 200.9 0.54 Auto generated 3 2 0.22 0.0 0.15 58.6 5.15 0.18 5.4 1603.3 4.35 Auto generated 3 3 0.22 11.6 0.24 28.9 2.54 0.26 18.8 759.3 2.06 Auto generated 12 4 0.26 19.0 0.28 31.5 2.77 0.30 23.7 678.7 1.84 Unknown* 5 0.30 24.0 0.33 58.9 5.17 0.36 31.1 2007.0 5.45 Auto generated 10 6 0.38 31.9 0.41 44.3 3.89 0.43 32.5 1256.8 3.41 Auto generated 3 7 0.34 32.6 0.46 99.6 8.74 0.49 31.3 2856.9 7.75 Auto generated 3 8 0.49 31.6 0.54 253.2 22.22 0.57 86.8 8236.8 22.35 Auto generated 6 9 0.57 87.2 0.61 144.3 12.66 0.65 58.0 6294.0 17.08 Auto generated 9 10 0.65 58.1 0.67 66.5 5.84 0.69 49.4 1676.3 4.55 Auto generated 5 11 0.69 49.6 0.73 125.9 11.5 0.76 92.7 4992.7 13.55 Auto generated 4 12 0.76 92.8 0.79 140.5 12.33 0.82 58.6 4123.0 11.10 Auto generated 3 13 0.82 59.0 0.83 70.7 6.21 0.89 4.1 2171.9 5.89 Auto generated 3

Anuradha Palve et al / Int. J. Res. Ayurveda Pharm. 6(3), May - June 2015
363
Table 11: HPTLC-Alkaloids profile of the methanol extract of S. lychnophora.
Peak Start Rf
Start Height
Max Rf
Max Height
Max %
End Rf
End Height
Area Area %
Assigned substance
1 0.07 3.6 0.09 11.2 11.82 0.10 3.8 193.6 7.91 Auto generated 2 2 0.21 0.4 0.24 23.4 24.80 0.28 0.6 566.4 23.14 Auto generated 5 3 0.29 1.2 0.33 25.1 26.61 0.35 6.4 574.4 23.46 Auto generated 4 4 0.42 3.5 0.45 13.2 13.96 0.40 1.4 374.0 15.28 Auto generated 3 5 0.51 2.4 0.54 21.5 22.80 0.60 1.8 739.6 30.21 Auto generated 1
Figure 2: HPTLC chromatogram in visible light for lipid estimation
Figure 3: Spectra of hot methanolic extract with ammonia of S. lychnophora for lipid estimation
Figure 4: HPTLC chromatogram at 366nm wavelength for saponins
Figure 5: Spectra of hot methanol extract with ammonia of S. lychnophora for Saponin Estimation
Figure 6: HPTLC chromatogram at 254 nm wavelength for flavonoids
Figure 7: Spectra of hot methanol extract with ammonia of S. lychnophora for flavonoid estimation
Anuradha Palve et al / Int. J. Res. Ayurveda Pharm. 6(3), May - June 2015
364
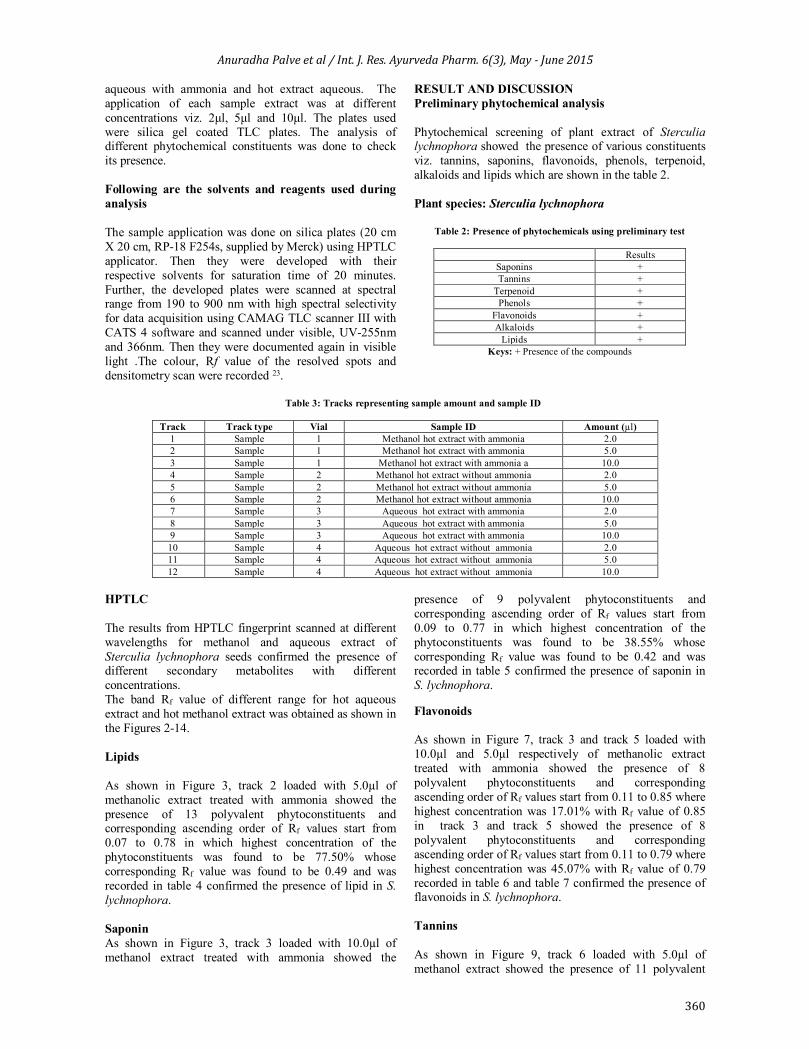
Figure 8: HPTLC chromatogram at 254nm wavelength for tannins
Figure 9: Spectra of hot methanol extract of S. lychnophora for tannin estimation
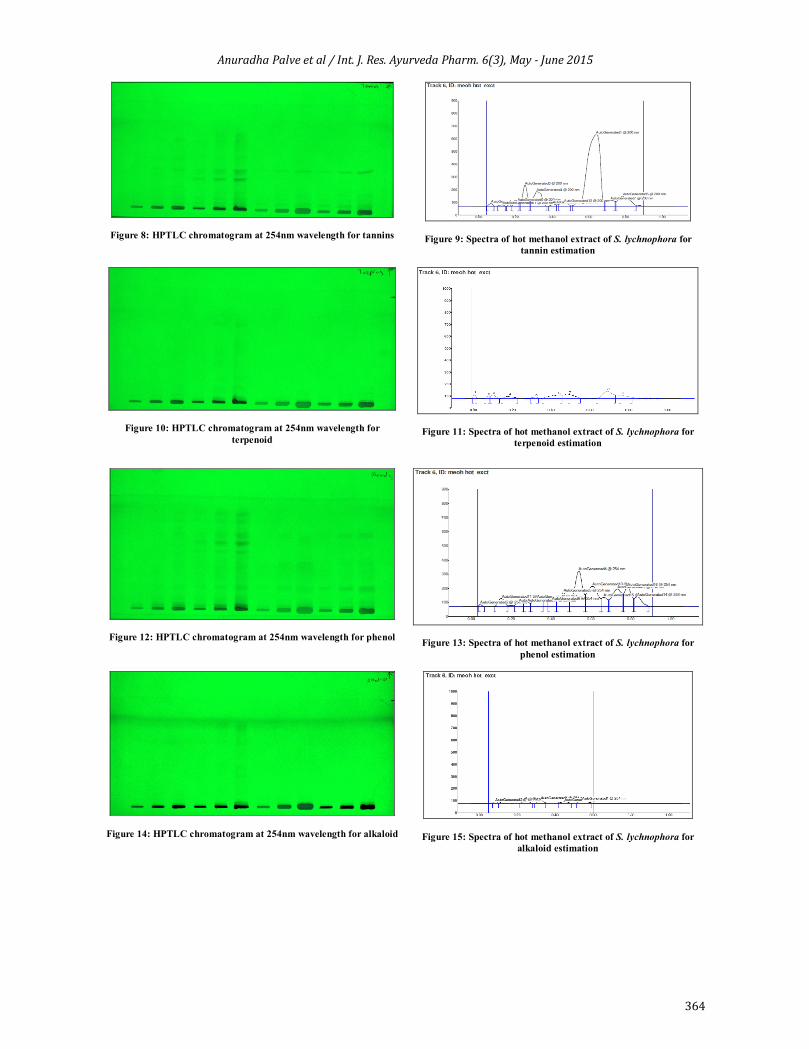
Figure 10: HPTLC chromatogram at 254nm wavelength for terpenoid
Figure 11: Spectra of hot methanol extract of S. lychnophora for terpenoid estimation
Figure 12: HPTLC chromatogram at 254nm wavelength for phenol
Figure 13: Spectra of hot methanol extract of S. lychnophora for phenol estimation
Figure 14: HPTLC chromatogram at 254nm wavelength for alkaloid
Figure 15: Spectra of hot methanol extract of S. lychnophora for alkaloid estimation
Anuradha Palve et al / Int. J. Res. Ayurveda Pharm. 6(3), May - June 2015
365
CONCLUSION The study was to detect the presence of useful compounds in Sterculia lychnophora which can be used as drug by in vitro technique and in silico technique in future. The biochemical test showed positive result for secondary metabolites like tannins, saponins, flavonoids, phenols, terpenoids, alkaloids and lipids which were further confirmed by HPTLC analysis. The HPTLC fingerprinting of seeds of Sterculia lychnophora methanol hot extract, methanol hot extract with ammonia added, aqueous hot extract and aqueous hot extract with ammonia added was used as sample, where the phenols, tannins and flavonoids showed high number of peaks in maximum wavelength, whereas saponins and terpenoids showed comparatively less in number. Very few peaks were obtained from alkaloids. And in lipids good number of peaks is obtained only in 510nm wavelength. Most of the peaks were found in methanol hot extract of more concentration track which indicates some number of compounds is present in extract. The investigation showed that the seed of S. lychnophora has medicinal properties which may be used for future drug development. REFERENCES 1. Angela A. Salim, Young-Won Chin and A. Douglas Kinghorn.
Drug Discovery from plants. Bioactive molecules and medicinal plants 2008; 1-23.
2. V. Prashanth Kumar, Chauhan NS, Padh Harish and M. Rajani. Search for antibacterial and antifungal agents from selected Indian medicinal plants. Journal of Ethanopharmacology. 2006; 107: 182-188. http://dx.doi.org/10.1016/j.jep.2006.03.013
3. Pancharee Surapanthanakorn. Evaluation of analgesic, antipyretic and anti- inflammatory activities of the ethanol and dichloromethane extract from Scaphium lychnophora fruit in experiment animals. M.Sc. Thesis Prince of Songkla University, 2010.
4. Qian Xin-Zhong and Xin Zhin Qiang, An illustrated atlas of the commonly used Chinese Materia Medica, People's Medical Publishing House, 1st Edition, 2: 406-407.
5. Orisakeye OT and Olugbade T.A. Studies on antimicrobial activities and phytochemical analysis of the plant Sterculia tragacantha lind. Middle-East Journal of Scientific Research.2012; 11(7): 924-927.
6. Sharma Beena, Gupta Shraddha and Sharma Kavita. Natural folk remedy for menorrhagia. Journal of information, knowledge and research in humanities and social service, 2011; 2(1): 86-88.
7. Shetty P, Palve A, Jadhav RN,Shinde P,Pimpliskar Mukesh.In-Silico docking analysis of S.lychnophora compounds against protein causing Alzheimer's disease. Int.J.Engineering Sci and Innovative technology 2014;Vol3(4):158-164.
8. Ru-Feng Wang , Xiu-Wen Wu and Di Geng. Two cerebrosides Isolated from the seeds of Sterculia lychnophora and their Neuroprotective effect. Molecules 2013; 18: 1181-1187 http://dx.doi.org/10.3390/molecules18011181
9. Tiwari Prashant, Kumar Bimlesh, Mandeep Kaur, Gurpreet Kaur and Harleen Kaur. Phytochemical screening and Extraction: A Review. Int. Pharmaceutica Sciencia, 2011; 2(1): 98-106.
10. Lijun Wang and Curtis L. Welle, Recent advances in extraction of nutraceuticals from plants. Trends in Food Science & Technology, 2006; 17: 300–312. http://dx.doi.org/10.1016/j.tifs.2005.12.004
11. Margaret F. Roberts and Michael Wink. Alkaloids: Biochemistry, Ecology, and Medicinal Applications. Springer, 1998; 1-2.
12. Makkar HPS, Francis G and Becker K., Bioactivity of phytochemicals in some lesser-known plants and their effects and potential applications in livestock and aquaculture production systems. Res. J. of the Animal Consortium.2007; 1(9): 1371-1391.
13. Cook NC and Samman S, Flavonoids Chemistry, metabolism, cardio protective effects, and dietary sources. J. of Nutritional Biochemistry, 1996; 7(2): 66-76. http://dx.doi.org/10.1016/0955-2863(95)00168-9
14. Asaph Aharoni, Maarten A. Jongsma, Tok-Yong Kim, Man-Bok Ri, Ashok P. Giri, Francel W. A. Verstappen, Wilfried Schwab and Harro J. Bouwmeester, Metabolic Engineering of Terpenoid Biosynthesis in Plants. Springer publishers, 2006; 5: 49-58,.
15. Gupta Ankit, Naraniwal Madhu and Kothari Vijay, Modern extraction methods for preparation of bioactive plant extracts. Int. J. of Applied and Natural Sciences, 2012; 1(1): 8-26.
16. Shrivastava Manmohan. High performance thin layer chromatography (HPTLC).Springer publisher 2010; 3-4.
17. Sethis PD. HPTLC, first edition. CBS publishers;1996. 4-5. 18. Thamaraiselvi, P. Lalitha and d P. Jayanthi, Studies on
phytochemicals and antimicrobial activity of solvent extracts of Eichhornia crassipes (Mart.)Solms. Asian Journal of Plant Science and Research, 2012; 2 (2): 115-122.
19. Singh Dharmendra, Poonam Singh Abhishek Gupta, Shikha Solanki, Ekta Sharma and Rajeev Nema, Qualitative Estimation of the Presence of Bioactive Compound in Centella Asiatica An Important Medicinal Plant. International Journal of Life Science and Medical Science, 2012; 2(1): 5-7.
20. Judith Laure Ngondi, Emile Joachim Djiotsa, Zephyrin Fossouo and Julius Oben. Hypoglycaemic effect of the methanol extract of Irvingia gabonensis seeds on streptozotocin diabetic rats. African Journal of Traditional, 2006; 3(4): 74-77. http://dx.doi.org/ 10.4314/ajtcam.v3i4.31179
21. Peter C. H Hollman, Evidence for health benefits of plant phenols: local or systemic effects. Journal of the Science of Food and Agriculture, 2001; 81(9): 842–852, http://dx.doi.org/10.1002 /jsfa.900
22. Sven O. Dahms, Sandra Hoefgen., Dirk Roeser, Bernhard Schlott, Karl-Heinz Gührs, Manuel E Than. Structure and biochemical analysis of the heparin –induced E1 dimer of the amyloid precuesor protein. Proceeding of the National Academy of Sciences,2010.107(12): 5381-5386.
23. Wagner H., Bladt S. Plant drug analysis: A thin layer chromatography Atlas. Germany:Springer –Verlog Berlin Heidelberg:1996. http://dx.doi.org/10.1007/978-3-642-00574-9
24. Giby Abraham. Pharmacognostical and phytochemical studies of the plant Sahadevi [Vernonia cinerea(L.)Less.]. Int. J. Res. Ayurveda Pharm.2015; 6(1):47-54. http://dx.doi.org/10.7897/2277-4343.06112
25. Pimpliskar M.R., Jadhav R.N and Jadhav B.L. Study on antimicrobial principles of Rhizophora Species Along Mumbai Coast. J.Aqua. Biol. 2011;26(1): 6 – 11.
Cite this article as: Anuradha Palve, Pooja Shetty, Mukesh Pimpliskar and R. N. Jadhav. HPTLC method for qualitative determination of phytochemical compounds in extract of Sterculia lychnophora. Int. J. Res. Ayurveda Pharm. 2015;6(3):358-365 http://dx.doi.org/10.7897/2277-4343.06370
Source of support: Nil, Conflict of interest: None Declared