Research Article Assessment of the Optic Disc Morphology...
7
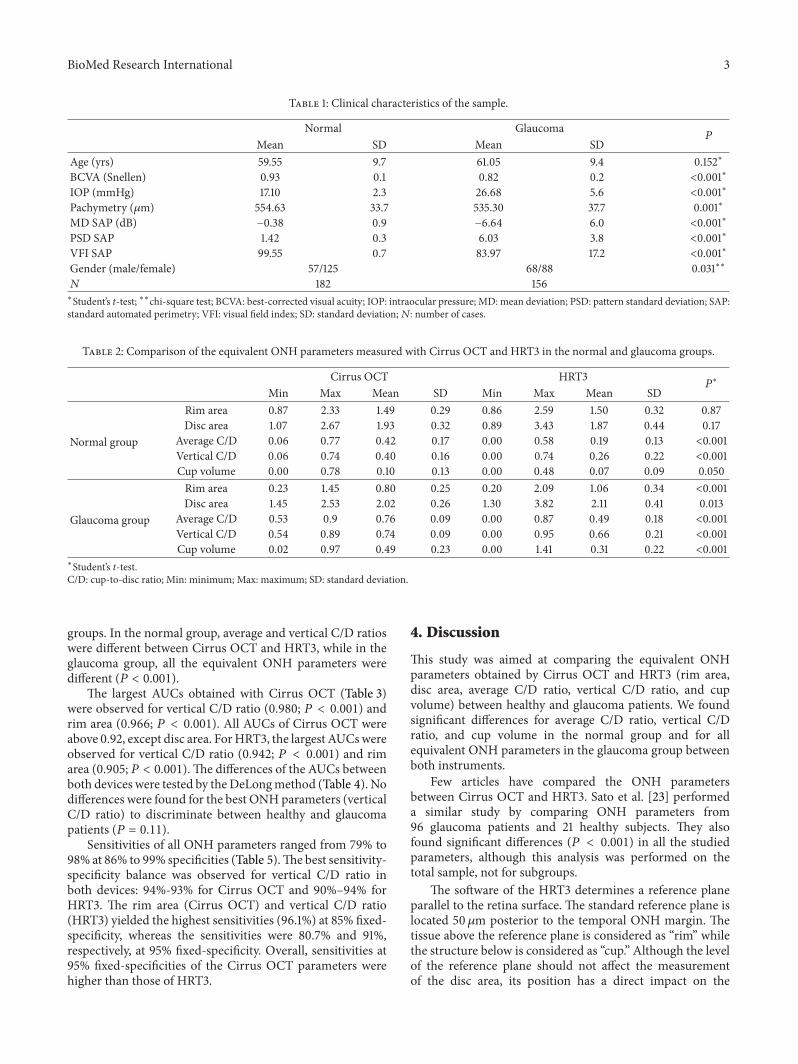
Research Article Assessment of the Optic Disc Morphology Using Spectral-Domain Optical Coherence Tomography and Scanning Laser Ophthalmoscopy Pilar Calvo, 1 Antonio Ferreras, 1,2 Beatriz Abadia, 1 Mirian Ara, 1 Michele Figus, 3 Luis E. Pablo, 1,2 and Paolo Frezzotti 4 1 Ophthalmology Department, Miguel Servet University Hospital, Aragon Health Sciences Institute, Isabel la Catolica 1–3, 50009 Zaragoza, Spain 2 Department of Surgery, Ginecology and Obstetrics, University of Zaragoza, 50009 Zaragoza, Spain 3 Department of Neurosciences, University of Pisa, 56126 Pisa, Italy 4 Department of Ophthalmology, University of Siena, 53100 Siena, Italy Correspondence should be addressed to Antonio Ferreras; [email protected] Received 27 February 2014; Accepted 19 June 2014; Published 6 July 2014 Academic Editor: Dan Milea Copyright © 2014 Pilar Calvo et al. is is an open access article distributed under the Creative Commons Attribution License, which permits unrestricted use, distribution, and reproduction in any medium, provided the original work is properly cited. Objective. To compare the equivalent optic nerve head (OHN) parameters obtained with confocal scanning laser ophthalmoscopy (HRT3) and spectral-domain optical coherence tomography (OCT) in healthy and glaucoma patients. Methods. One hundred and eighty-two consecutive healthy subjects and 156 patients with open-angle glaucoma were divided into 2 groups according to intraocular pressure and visual field outcomes. All participants underwent imaging of the ONH with the HRT3 and the Cirrus OCT. e ONH parameters and the receiver operating characteristic (ROC) curves were compared between both groups. Results. Mean age did not differ between the normal and glaucoma groups (59.55 ± 9.7 years and 61.05 ± 9.4 years, resp.; = 0.15). Rim area, average cup-to-disc (C/D) ratio, vertical C/D ratio, and cup volume were different between both instruments ( < 0.001). All equivalent ONH parameters, except disc area, were different between both groups ( < 0.001). e best areas under the ROC curve were observed for vertical C/D ratio (0.980 for OCT and 0.942 for HRT3; = 0.11). Sensitivities at 95% fixed-specificities of OCT parameters were higher than those of HRT3. Conclusions. Equivalent ONH parameters of Cirrus OCT and HRT3 are different and cannot be used interchangeably. ONH parameters measured with OCT yielded a slightly better diagnostic performance. 1. Introduction Identification of damage to the optic nerve head (ONH) is key for glaucoma diagnosis. For more than 10 years, the confocal scanning laser ophthalmoscope Heidelberg Retina Tomo- graph (HRT, Heidelberg Engineering, Heidelberg, Germany) has been widely used to evaluate the optic disc morphology and monitor changes over time [1–10]. On the other hand, since the introduction of optical coherence tomography (OCT) in 1993 [11, 12], this technique has been rapidly adopted into clinical practice and is now one of the main diagnostic methods in ophthalmology. e OCT is a computer-assisted precision instrument that delineates cross-sectional anatomy of the retina and provides in vivo real time images of different structures of the eye. e performance of OCT has been constantly improved since its introduction, and the latest versions can generate three- dimensional images from multiple A-scans acquired on the optic disc. e cube of data generated from these A-scans enables a far more extensive evaluation of the peripapillary area including retinal nerve fiber layer profiles, en face images (fundus image), and ONH assessment. Diagnostic ability of OCT for glaucoma diagnosis has been reported in the past [13–22]. Nevertheless, few studies have compared the ONH measurements between these devices [23, 24]. e purpose of this study was to compare the equivalent ONH parameters obtained with Cirrus OCT (Carl Zeiss Meditec, Dublin, CA) and HRT3 in healthy individuals and Hindawi Publishing Corporation BioMed Research International Volume 2014, Article ID 275654, 6 pages http://dx.doi.org/10.1155/2014/275654
Transcript of Research Article Assessment of the Optic Disc Morphology...
Research ArticleAssessment of the Optic Disc Morphology UsingSpectral-Domain Optical Coherence Tomography andScanning Laser Ophthalmoscopy
Pilar Calvo,1 Antonio Ferreras,1,2 Beatriz Abadia,1 Mirian Ara,1 Michele Figus,3
Luis E. Pablo,1,2 and Paolo Frezzotti4
1 Ophthalmology Department, Miguel Servet University Hospital, Aragon Health Sciences Institute,Isabel la Catolica 1–3, 50009 Zaragoza, Spain
2Department of Surgery, Ginecology and Obstetrics, University of Zaragoza, 50009 Zaragoza, Spain3 Department of Neurosciences, University of Pisa, 56126 Pisa, Italy4Department of Ophthalmology, University of Siena, 53100 Siena, Italy
Correspondence should be addressed to Antonio Ferreras; [email protected]
Received 27 February 2014; Accepted 19 June 2014; Published 6 July 2014
Academic Editor: Dan Milea
Copyright © 2014 Pilar Calvo et al. This is an open access article distributed under the Creative Commons Attribution License,which permits unrestricted use, distribution, and reproduction in any medium, provided the original work is properly cited.
Objective. To compare the equivalent optic nerve head (OHN) parameters obtained with confocal scanning laser ophthalmoscopy(HRT3) and spectral-domain optical coherence tomography (OCT) in healthy and glaucoma patients. Methods. One hundredand eighty-two consecutive healthy subjects and 156 patients with open-angle glaucoma were divided into 2 groups accordingto intraocular pressure and visual field outcomes. All participants underwent imaging of the ONH with the HRT3 and the CirrusOCT. The ONH parameters and the receiver operating characteristic (ROC) curves were compared between both groups. Results.Mean age did not differ between the normal and glaucoma groups (59.55 ± 9.7 years and 61.05 ± 9.4 years, resp.; 𝑃 = 0.15). Rimarea, average cup-to-disc (C/D) ratio, vertical C/D ratio, and cup volume were different between both instruments (𝑃 < 0.001). Allequivalent ONH parameters, except disc area, were different between both groups (𝑃 < 0.001).The best areas under the ROC curvewere observed for vertical C/D ratio (0.980 for OCT and 0.942 for HRT3; 𝑃 = 0.11). Sensitivities at 95% fixed-specificities of OCTparameters were higher than those of HRT3. Conclusions. Equivalent ONH parameters of Cirrus OCT and HRT3 are different andcannot be used interchangeably. ONH parameters measured with OCT yielded a slightly better diagnostic performance.
1. Introduction
Identification of damage to the optic nerve head (ONH) is keyfor glaucoma diagnosis. For more than 10 years, the confocalscanning laser ophthalmoscope Heidelberg Retina Tomo-graph (HRT, Heidelberg Engineering, Heidelberg, Germany)has been widely used to evaluate the optic disc morphologyand monitor changes over time [1–10].
On the other hand, since the introduction of opticalcoherence tomography (OCT) in 1993 [11, 12], this techniquehas been rapidly adopted into clinical practice and is now oneof the main diagnostic methods in ophthalmology. The OCTis a computer-assisted precision instrument that delineatescross-sectional anatomy of the retina and provides in vivo
real time images of different structures of the eye. Theperformance of OCT has been constantly improved sinceits introduction, and the latest versions can generate three-dimensional images from multiple A-scans acquired on theoptic disc. The cube of data generated from these A-scansenables a far more extensive evaluation of the peripapillaryarea including retinal nerve fiber layer profiles, en face images(fundus image), and ONH assessment. Diagnostic ability ofOCT for glaucoma diagnosis has been reported in the past[13–22]. Nevertheless, few studies have compared the ONHmeasurements between these devices [23, 24].
The purpose of this study was to compare the equivalentONH parameters obtained with Cirrus OCT (Carl ZeissMeditec, Dublin, CA) and HRT3 in healthy individuals and
Hindawi Publishing CorporationBioMed Research InternationalVolume 2014, Article ID 275654, 6 pageshttp://dx.doi.org/10.1155/2014/275654

2 BioMed Research International
glaucoma patients as well as evaluate their accuracy forglaucoma diagnosis.
2. Materials and MethodsThe study protocol adhered to the tenets of the Declarationof Helsinki and was approved by the Clinical Research EthicsCommittee of Aragon (CEICA).
A total of 350 eyes of 350 subjects were prospectivelypreenrolled. Normal eyes were consecutively recruited frompatients referred for refraction that underwent routine exam-ination without abnormal ocular findings, hospital staff, andrelatives of patients in our hospital.The glaucoma group com-prised subjects with primary open-angle glaucoma, pseu-doexfoliative glaucoma, and pigmentary glaucoma. Patientswith glaucoma were recruited consecutively from an ongoinglongitudinal follow-up study at the Miguel Servet UniversityHospital. In 4 cases we could not obtain a reliable standardautomated perimetry (SAP) after 3 attempts and in 8 casesthe subject did not complete the visits included in the studyprotocol. These 12 subjects were excluded from further anal-ysis. Finally, 338 eyes of Caucasian origin were included inthe statistical analysis. When both eyes fulfilled the inclusioncriteria, only one eye per subject was randomly selected.
All of them had to meet the following inclusion crite-ria: best-corrected visual acuity (BCVA) better than 20/30(Snellen), refractive error less than 5 spherical diopters and2 diopters of cylinder, transparent ocular media (nuclearcolour/opalescence, cortical or posterior subcapsular lensopacity < 1) according to the Lens Opacities ClassificationSystem III system [25], and open-anterior chamber angle.Subjects with previous intraocular surgery, diabetes or othersystemic diseases, history of ocular or neurologic disease,or current use of a medication that could affect visual fieldsensitivity were excluded.
Participants underwent full ophthalmologic examina-tion: clinical history, best-corrected visual acuity, biomi-croscopy of anterior segment using a slit lamp, gonioscopy,Goldmann applanation tonometry, central corneal ultrasonicpachymetry (OcuScan RxP; Alcon Laboratories Inc., Irvine,Ca), and ophthalmoscopy of the posterior segment.
At least 2 reliable SAPs were performed to minimize thelearning effect [26–28]. The visual field was evaluated witha Humphrey Field Analyzer, model 750i (Zeiss HumphreySystems, Dublin, CA), by using the 24-2 SITA Standardstrategy. Near addition was added to the subject’s refractivecorrection. If fixation losses were higher than 20% or false-positive or false-negative rates were higher than 15%, the testwas repeated.The subjects completed the perimetrymeasure-ments prior to any structural test, and each perimetry testwas performed at least 3 days apart to avoid a fatigue effect.Abnormal SAP results were defined as typical glaucomatousdefects with a pattern standard deviation significantly ele-vated beyond the 5% level and/or a Glaucoma Hemifield Testoutside normal limits.
The sample was divided into 2 groups according tothe intraocular pressure (IOP) and visual field outcome,regardless of optic disc appearance. Glaucomatous eyes hadan IOP of greater than 21mmHg and abnormal SAP results.
Topographic analysis of the optic disc was performedusing the HRT3, which provides topographic measurementsof the ONH derived from 16 to 64 optical sections to adepth of 4mm. The spherical equivalent refractive error ofeach eye was adjusted in the dioptric ring of the HRT3.Magnification errors were corrected by the software basedon keratometric readings. Topographic images were thenobtained through dilated pupils (1% tropicamide eye drops;Alcon Laboratories Inc., Fort Worth, TX) and analysed withthe Advanced Glaucoma Analysis 3.1 software. All scans hadto have an interscan standard deviation of less than 30 𝜇m.Themargin of the optic disc was manually traced by the sameglaucoma specialist, who was masked to the patients’ identityand clinical history, defining the inner edge of Elschnig’s ringwith at least a four-point contour line. All scans had to havean interscan standard deviation of less than 30𝜇m.The globalstereometric parameters investigated in this study were rimarea, disc area, average cup/disc (C/D) ratio, vertical C/Dratio, and cup volume.
The equivalent ONH parameters were also measuredusing the Cirrus OCT (Optic Disc Cube 200 × 200 scan pro-tocol; software version 6.2) following a standard proceduredescribed elsewhere. Left eye data were converted to a righteye format. All images were acquired with a quality greaterthan 6/10. The same operator performed all scans with thesame device.
All the ophthalmic examinations, perimetry tests, and thetopographic analysis of the ONH were performed within 6weeks of the subject’s date of enrolment into the study.
The statistical analyses were calculated using MedCalc(version 12; MedCalc software, Mariakerke, Belgium) andIBM SPSS statistical software (version 22; IBM Corporation,Somers, NY). All the variables followed a normal distributionas verified with the Kolmogorov-Smirnov test (K-S of 1sample). Demographics, HRT3, and OCT parameters werecompared between both groups with the independent 𝑡-test.
The receiver operating characteristic (ROC) curves wereplotted for the ONH parameters acquired with both devices.The best areas under the ROC curves (AUCs) were alsocompared (DeLong method) [29].
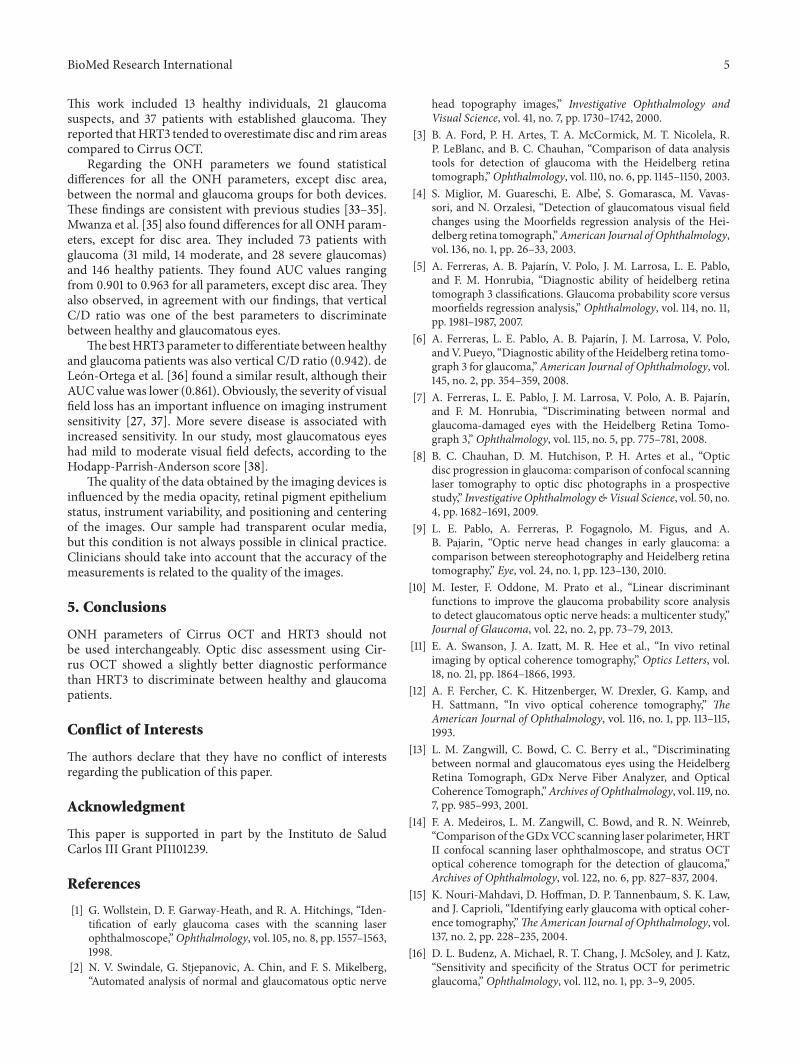
3. ResultsTable 1 shows the clinical characteristics of the study sample.Mean age in the normal group (182 eyes) was 59.55 ± 9.71years, while mean age in the glaucoma group (156 eyes)was 61.05 ± 9.43 years (𝑃 = 0.15). There were significantdifferences (𝑃 < 0.001) in mean IOP, best-corrected visualacuity, central corneal thickness, mean deviation of SAP,pattern standard deviation of SAP, and the visual field index(VFI) of SAP between both groups.
Disc area measured with Cirrus OCT did not differbetween the groups (𝑃 = 0.10). Nevertheless, HRT3 showedsignificant differences for disc area between the normal andglaucoma groups (𝑃 < 0.001). Rim area, average C/D ratio,vertical C/D ratio, and cup volume of both Cirrus OCT andHRT3 were different between both groups (𝑃 < 0.001).
Table 2 shows the equivalent ONH parameters measuredwith Cirrus OCT and HRT3 in the normal and glaucoma
BioMed Research International 3
Table 1: Clinical characteristics of the sample.
Normal Glaucoma𝑃
Mean SD Mean SDAge (yrs) 59.55 9.7 61.05 9.4 0.152∗
BCVA (Snellen) 0.93 0.1 0.82 0.2 <0.001∗
IOP (mmHg) 17.10 2.3 26.68 5.6 <0.001∗
Pachymetry (𝜇m) 554.63 33.7 535.30 37.7 0.001∗
MD SAP (dB) −0.38 0.9 −6.64 6.0 <0.001∗
PSD SAP 1.42 0.3 6.03 3.8 <0.001∗
VFI SAP 99.55 0.7 83.97 17.2 <0.001∗
Gender (male/female) 57/125 68/88 0.031∗∗
𝑁 182 156∗Student’s t-test; ∗∗chi-square test; BCVA: best-corrected visual acuity; IOP: intraocular pressure; MD: mean deviation; PSD: pattern standard deviation; SAP:standard automated perimetry; VFI: visual field index; SD: standard deviation;𝑁: number of cases.
Table 2: Comparison of the equivalent ONH parameters measured with Cirrus OCT and HRT3 in the normal and glaucoma groups.
Cirrus OCT HRT3𝑃∗
Min Max Mean SD Min Max Mean SD
Normal group
Rim area 0.87 2.33 1.49 0.29 0.86 2.59 1.50 0.32 0.87Disc area 1.07 2.67 1.93 0.32 0.89 3.43 1.87 0.44 0.17
Average C/D 0.06 0.77 0.42 0.17 0.00 0.58 0.19 0.13 <0.001Vertical C/D 0.06 0.74 0.40 0.16 0.00 0.74 0.26 0.22 <0.001Cup volume 0.00 0.78 0.10 0.13 0.00 0.48 0.07 0.09 0.050
Glaucoma group
Rim area 0.23 1.45 0.80 0.25 0.20 2.09 1.06 0.34 <0.001Disc area 1.45 2.53 2.02 0.26 1.30 3.82 2.11 0.41 0.013
Average C/D 0.53 0.9 0.76 0.09 0.00 0.87 0.49 0.18 <0.001Vertical C/D 0.54 0.89 0.74 0.09 0.00 0.95 0.66 0.21 <0.001Cup volume 0.02 0.97 0.49 0.23 0.00 1.41 0.31 0.22 <0.001
∗Student’s t-test.C/D: cup-to-disc ratio; Min: minimum; Max: maximum; SD: standard deviation.
groups. In the normal group, average and vertical C/D ratioswere different between Cirrus OCT and HRT3, while in theglaucoma group, all the equivalent ONH parameters weredifferent (𝑃 < 0.001).
The largest AUCs obtained with Cirrus OCT (Table 3)were observed for vertical C/D ratio (0.980; 𝑃 < 0.001) andrim area (0.966; 𝑃 < 0.001). All AUCs of Cirrus OCT wereabove 0.92, except disc area. ForHRT3, the largest AUCswereobserved for vertical C/D ratio (0.942; 𝑃 < 0.001) and rimarea (0.905; 𝑃 < 0.001). The differences of the AUCs betweenboth devices were tested by theDeLongmethod (Table 4). Nodifferences were found for the best ONHparameters (verticalC/D ratio) to discriminate between healthy and glaucomapatients (𝑃 = 0.11).
Sensitivities of all ONH parameters ranged from 79% to98% at 86% to 99% specificities (Table 5).The best sensitivity-specificity balance was observed for vertical C/D ratio inboth devices: 94%-93% for Cirrus OCT and 90%–94% forHRT3. The rim area (Cirrus OCT) and vertical C/D ratio(HRT3) yielded the highest sensitivities (96.1%) at 85% fixed-specificity, whereas the sensitivities were 80.7% and 91%,respectively, at 95% fixed-specificity. Overall, sensitivities at95% fixed-specificities of the Cirrus OCT parameters werehigher than those of HRT3.
4. Discussion
This study was aimed at comparing the equivalent ONHparameters obtained by Cirrus OCT and HRT3 (rim area,disc area, average C/D ratio, vertical C/D ratio, and cupvolume) between healthy and glaucoma patients. We foundsignificant differences for average C/D ratio, vertical C/Dratio, and cup volume in the normal group and for allequivalent ONH parameters in the glaucoma group betweenboth instruments.
Few articles have compared the ONH parametersbetween Cirrus OCT and HRT3. Sato et al. [23] performeda similar study by comparing ONH parameters from96 glaucoma patients and 21 healthy subjects. They alsofound significant differences (𝑃 < 0.001) in all the studiedparameters, although this analysis was performed on thetotal sample, not for subgroups.
The software of the HRT3 determines a reference planeparallel to the retina surface. The standard reference plane islocated 50 𝜇m posterior to the temporal ONH margin. Thetissue above the reference plane is considered as “rim” whilethe structure below is considered as “cup.” Although the levelof the reference plane should not affect the measurementof the disc area, its position has a direct impact on the

4 BioMed Research International
Table 3: Areas under the ROC curve of the optic nerve head parameters to discriminate between healthy and glaucoma patients.
AUC SE 𝑃CI 95%
Inferior limit Superior limit
Cirrus OCT
Rim area 0.966 0.02 <0.001 0.936 0.995Disc area 0.584 0.05 0.120 0.481 0.688
Average C/D 0.961 0.02 <0.001 0.932 0.991Vertical C/D 0.980 0.01 <0.001 0.960 0.999Cup volume 0.924 0.03 <0.001 0.873 0.975
HRT3
Rim area 0.905 0.03 <0.001 0.849 0.962Disc area 0.642 0.05 0.009 0.544 0.740
Average C/D 0.887 0.03 <0.001 0.824 0.950Vertical C/D 0.942 0.03 <0.001 0.888 0.995Cup volume 0.902 0.03 <0.001 0.846 0.958
C/D: cup-to-disc ratio; AUC: area under the receiver operating characteristic curve; CI: confidence interval; SD: standard error.
Table 4: Comparison of the best areas under the ROC curve of the equivalent optic nerve head parameters between Cirrus OCT and HRT3(DeLong method).
Cirrus OCTRim area Vertical C/D ratio Cup volume
HRT3Rim area 0.015 0.003 0.318
Vertical C/D ratio 0.363 0.114 0.489Cup volume 0.017 0.001 0.233
C/D: cup-to-disc.
Table 5: Best sensitivity-specificity balance of Cirrus OCT and HRT3 to discriminate between normal and glaucomatous eyes.
Optimalcut-off point
Sensitivity(%)
Sensitivity95% CI
Specificity(%)
Specificity95% CI
Sensitivity at fixed specificitySpecificity 85% Specificity 95%
Cirrus OCTRim area ≤1.2 98.1 90.1–100 86.3 76.2–96.2 96.1 80.7Average C/D >0.67 83.3 70.7–92.1 98.9 92.6–100 85.2 84.6Vertical C/D >0.59 94.2 84.6–98.8 93.4 84.7–97.7 77.5 86.5Cup volume >0.263 87.1 75.1–94.6 89.0 79.5–95.1 91 72.4
HRT3Rim area ≤1.16 79.4 66.5–89.4 90.1 81.2–96.1 83.3 68.5Average C/D >0.39 86.5 74.7–94.5 94.5 86.6–98.5 90.3 80.7Vertical C/D >0.55 90.3 79.7–96.9 94.5 86.6–98.5 96.1 91Cup volume >0.14 83.3 70.7–92.1 86.3 76.2–93.2 81.4 59.6
C/D: cup-to-disc ratio; CI: confidence interval.
calculation of the rim and cup areas. OCT measurementdoes not depend on reference planes and does not requireprior manual outlining of disc boundaries, reducing thedependency on operator skill. Additionally, in Cirrus OCT,the disc edge is determined by the termination of Bruch’smembrane; thus, the measurement of the rim and cup areascorresponds with the actual anatomy in the same plane as theoptic disc. HRT3 does not take into account the inclination ofthe optical disc as it acquires the images in horizontal planes,leading to a worse performance in tilted discs compared toOCT.
Other authors have evaluated the differences for ONHparameters obtained by Stratus OCT and HRT [30–32].Generally, it is accepted that Stratus OCT tended to measure
larger areas of the disc than HRT. In our work we didnot observe the same trend: disc area was 1.93mm2 forCirrus OCT and 1.87mm2 for HRT3 (𝑃 = 0.17) in healthyindividuals. In the glaucoma group, disc area was 2.02mm2for Cirrus OCT and 2.11mm2 for HRT3 (𝑃 = 0.01). Bycontrast, in the work of Sato et al. [23] disc areas withCirrus OCT were smaller than those obtained with theHRT (1.97mm2 versus 2.27mm2). They included a smallsample in the normal group (𝑛 = 21) and performed thestatistical analysis in the whole sample, including normaland glaucomatous eyes. Larger samples usually lead to moreprecise estimates.
Moghimi et al. [24] also studied the relationship betweenthe ONH parameters measured with Cirrus OCT and HRT3.
BioMed Research International 5
This work included 13 healthy individuals, 21 glaucomasuspects, and 37 patients with established glaucoma. Theyreported thatHRT3 tended to overestimate disc and rim areascompared to Cirrus OCT.
Regarding the ONH parameters we found statisticaldifferences for all the ONH parameters, except disc area,between the normal and glaucoma groups for both devices.These findings are consistent with previous studies [33–35].Mwanza et al. [35] also found differences for all ONH param-eters, except for disc area. They included 73 patients withglaucoma (31 mild, 14 moderate, and 28 severe glaucomas)and 146 healthy patients. They found AUC values rangingfrom 0.901 to 0.963 for all parameters, except disc area. Theyalso observed, in agreement with our findings, that verticalC/D ratio was one of the best parameters to discriminatebetween healthy and glaucomatous eyes.
ThebestHRT3parameter to differentiate between healthyand glaucoma patients was also vertical C/D ratio (0.942). deLeon-Ortega et al. [36] found a similar result, although theirAUC value was lower (0.861). Obviously, the severity of visualfield loss has an important influence on imaging instrumentsensitivity [27, 37]. More severe disease is associated withincreased sensitivity. In our study, most glaucomatous eyeshad mild to moderate visual field defects, according to theHodapp-Parrish-Anderson score [38].
The quality of the data obtained by the imaging devices isinfluenced by the media opacity, retinal pigment epitheliumstatus, instrument variability, and positioning and centeringof the images. Our sample had transparent ocular media,but this condition is not always possible in clinical practice.Clinicians should take into account that the accuracy of themeasurements is related to the quality of the images.
5. Conclusions
ONH parameters of Cirrus OCT and HRT3 should notbe used interchangeably. Optic disc assessment using Cir-rus OCT showed a slightly better diagnostic performancethan HRT3 to discriminate between healthy and glaucomapatients.
Conflict of Interests
The authors declare that they have no conflict of interestsregarding the publication of this paper.
Acknowledgment
This paper is supported in part by the Instituto de SaludCarlos III Grant PI1101239.
References
[1] G. Wollstein, D. F. Garway-Heath, and R. A. Hitchings, “Iden-tification of early glaucoma cases with the scanning laserophthalmoscope,”Ophthalmology, vol. 105, no. 8, pp. 1557–1563,1998.
[2] N. V. Swindale, G. Stjepanovic, A. Chin, and F. S. Mikelberg,“Automated analysis of normal and glaucomatous optic nerve
head topography images,” Investigative Ophthalmology andVisual Science, vol. 41, no. 7, pp. 1730–1742, 2000.
[3] B. A. Ford, P. H. Artes, T. A. McCormick, M. T. Nicolela, R.P. LeBlanc, and B. C. Chauhan, “Comparison of data analysistools for detection of glaucoma with the Heidelberg retinatomograph,”Ophthalmology, vol. 110, no. 6, pp. 1145–1150, 2003.
[4] S. Miglior, M. Guareschi, E. Albe’, S. Gomarasca, M. Vavas-sori, and N. Orzalesi, “Detection of glaucomatous visual fieldchanges using the Moorfields regression analysis of the Hei-delberg retina tomograph,”American Journal of Ophthalmology,vol. 136, no. 1, pp. 26–33, 2003.
[5] A. Ferreras, A. B. Pajarın, V. Polo, J. M. Larrosa, L. E. Pablo,and F. M. Honrubia, “Diagnostic ability of heidelberg retinatomograph 3 classifications. Glaucoma probability score versusmoorfields regression analysis,” Ophthalmology, vol. 114, no. 11,pp. 1981–1987, 2007.
[6] A. Ferreras, L. E. Pablo, A. B. Pajarın, J. M. Larrosa, V. Polo,andV. Pueyo, “Diagnostic ability of theHeidelberg retina tomo-graph 3 for glaucoma,”American Journal of Ophthalmology, vol.145, no. 2, pp. 354–359, 2008.
[7] A. Ferreras, L. E. Pablo, J. M. Larrosa, V. Polo, A. B. Pajarın,and F. M. Honrubia, “Discriminating between normal andglaucoma-damaged eyes with the Heidelberg Retina Tomo-graph 3,” Ophthalmology, vol. 115, no. 5, pp. 775–781, 2008.
[8] B. C. Chauhan, D. M. Hutchison, P. H. Artes et al., “Opticdisc progression in glaucoma: comparison of confocal scanninglaser tomography to optic disc photographs in a prospectivestudy,” Investigative Ophthalmology&Visual Science, vol. 50, no.4, pp. 1682–1691, 2009.
[9] L. E. Pablo, A. Ferreras, P. Fogagnolo, M. Figus, and A.B. Pajarin, “Optic nerve head changes in early glaucoma: acomparison between stereophotography and Heidelberg retinatomography,” Eye, vol. 24, no. 1, pp. 123–130, 2010.
[10] M. Iester, F. Oddone, M. Prato et al., “Linear discriminantfunctions to improve the glaucoma probability score analysisto detect glaucomatous optic nerve heads: a multicenter study,”Journal of Glaucoma, vol. 22, no. 2, pp. 73–79, 2013.
[11] E. A. Swanson, J. A. Izatt, M. R. Hee et al., “In vivo retinalimaging by optical coherence tomography,” Optics Letters, vol.18, no. 21, pp. 1864–1866, 1993.
[12] A. F. Fercher, C. K. Hitzenberger, W. Drexler, G. Kamp, andH. Sattmann, “In vivo optical coherence tomography,” TheAmerican Journal of Ophthalmology, vol. 116, no. 1, pp. 113–115,1993.
[13] L. M. Zangwill, C. Bowd, C. C. Berry et al., “Discriminatingbetween normal and glaucomatous eyes using the HeidelbergRetina Tomograph, GDx Nerve Fiber Analyzer, and OpticalCoherence Tomograph,”Archives of Ophthalmology, vol. 119, no.7, pp. 985–993, 2001.
[14] F. A. Medeiros, L. M. Zangwill, C. Bowd, and R. N. Weinreb,“Comparison of theGDxVCC scanning laser polarimeter, HRTII confocal scanning laser ophthalmoscope, and stratus OCToptical coherence tomograph for the detection of glaucoma,”Archives of Ophthalmology, vol. 122, no. 6, pp. 827–837, 2004.
[15] K. Nouri-Mahdavi, D. Hoffman, D. P. Tannenbaum, S. K. Law,and J. Caprioli, “Identifying early glaucoma with optical coher-ence tomography,”TheAmerican Journal of Ophthalmology, vol.137, no. 2, pp. 228–235, 2004.
[16] D. L. Budenz, A. Michael, R. T. Chang, J. McSoley, and J. Katz,“Sensitivity and specificity of the Stratus OCT for perimetricglaucoma,” Ophthalmology, vol. 112, no. 1, pp. 3–9, 2005.

6 BioMed Research International
[17] R. Sihota, P. Sony, V. Gupta, T. Dada, and R. Singh, “Diagnosticcapability of optical coherence tomography in evaluating thedegree of glaucomatous retinal nerve fiber damage,” Investiga-tive Ophthalmology & Visual Science, vol. 47, no. 5, pp. 2006–2010, 2006.
[18] F. Mayoral, V. Polo, A. Ferreras, J. M. Larrosa, V. Pueyo, andF. Honrubia, “Diagnostic ability of stratus optical coherencetomography (OCT) in pre-perimetric glaucoma diagnosis,”Archivos de la Sociedad Espanola de Oftalmologia, vol. 81, no.9, pp. 537–544, 2006.
[19] A. Ferreras, L. E. Pablo, A. B. Pajarın, J. M. Larrosa, V. Polo, andF.M.Honrubia, “Logistic regression analysis for early glaucomadiagnosis using optical coherence tomography,” Archives ofOphthalmology, vol. 126, no. 4, pp. 465–470, 2008.
[20] L. E. Pablo, A. Ferreras, A. B. Pajarın, and P. Fogagnolo, “Diag-nostic ability of a linear discriminant function for optic nervehead parameters measured with optical coherence tomographyfor perimetric glaucoma,” Eye, vol. 24, no. 6, pp. 1051–1057, 2010.
[21] K. R. Sung, D. Y. Kim, S. B. Park, andM. S. Kook, “Comparisonof retinal nerve fiber layer thickness measured by Cirrus HDand Stratus optical coherence tomography,”Ophthalmology, vol.116, no. 7, pp. 1264–1270, 2009.
[22] Y. H. Hwang and Y. Y. Kim, “Glaucoma diagnostic ability ofquadrant and clock-hour neuroretinal rim assessment usingcirrus HD optical coherence tomography,” Investigative Oph-thalmology & Visual Science, vol. 53, no. 4, pp. 2226–2234, 2012.
[23] S. Sato, K. Hirooka, T. Baba, and F. Shiraga, “Comparison ofoptic nerve head parameters using Heidelberg Retina Tomo-graph 3 and spectral-domain optical coherence tomography,”Clinical & Experimental Ophthalmology, vol. 40, no. 7, pp. 721–726, 2012.
[24] S. Moghimi, H. Hosseini, J. Riddle et al., “Measurement of opticdisc size and rim area with spectral-domain OCT and scanninglaser ophthalmoscopy,” Investigative Ophthalmology and VisualScience, vol. 53, no. 8, pp. 4519–4530, 2012.
[25] L. T. Chylack Jr., J. K. Wolfe, D. M. Singer et al., “The lensopacities classification system III,” Archives of Ophthalmology,vol. 111, no. 6, pp. 831–836, 1993.
[26] A. Heijl, A. Lindgren, and G. Lindgren, “Test-retest variabilityin glaucomatous visual fields,”TheAmerican Journal of Ophthal-mology, vol. 108, no. 2, pp. 130–135, 1989.
[27] M. Gonzalez-Hernandez, L. E. Pablo, K. Armas-Dominguez, R.Rodriguez de La Vega, A. Ferreras, and M. Gonzalez De LaRosa, “Structure-function relationship depends on glaucomaseverity,” British Journal of Ophthalmology, vol. 93, no. 9, pp.1195–1199, 2009.
[28] P. Fogagnolo, C. Sangermani, F. Oddone et al., “Long-term peri-metric fluctuation in patients with different stages of glaucoma,”British Journal ofOphthalmology, vol. 95, no. 2, pp. 189–193, 2011.
[29] E. R. DeLong, D. M. DeLong, and D. L. Clarke-Pearson,“Comparing the areas under two or more correlated receiveroperating characteristic curves: a nonparametric approach,”Biometrics, vol. 44, no. 3, pp. 837–845, 1988.
[30] J. S. Schuman, G. Wollstein, T. Farra et al., “Comparison ofoptic nerve head measurements obtained by optical coherencetomography and confocal scanning laser ophthalmoscopy,”TheAmerican Journal of Ophthalmology, vol. 135, no. 4, pp. 504–512,2003.
[31] M. E. Iliev, A. Meyenberg, and J. G. Garweg, “Morphometricassessment of normal, suspect and glaucomatous optic discswith Stratus OCT and HRT II,” Eye, vol. 20, no. 11, pp. 1288–1299, 2006.
[32] E. M. Hoffmann, C. Bowd, F. A. Medeiros et al., “Agreementamong 3 optical imaging methods for the assessment of opticdisc topography,”Ophthalmology, vol. 112, no. 12, pp. 2149–2156,2005.
[33] K. R. Sung, J. H. Na, and Y. Lee, “Glaucoma diagnosticcapabilities of optic nerve head parameters as determined bycirrusHDoptical coherence tomography,” Journal of Glaucoma,vol. 21, no. 7, pp. 498–504, 2012.
[34] J. Mwanza, M. K. Durbin, D. L. Budenz et al., “Glaucomadiagnostic accuracy of ganglion cell-inner plexiform layerthickness: comparison with nerve fiber layer and optic nervehead,” Ophthalmology, vol. 119, no. 6, pp. 1151–1158, 2012.
[35] J. Mwanza, J. D. Oakley, D. L. Budenz, and D. R. Anderson,“Ability of cirrus HD-OCT optic nerve head parameters todiscriminate normal from glaucomatous eyes,” Ophthalmology,vol. 118, no. 2, pp. 241–248, 2011.
[36] J. E. de Leon-Ortega, L. M. Sakata, B. E. Monheit, G. McgwinJr., S. N. Arthur, and C. A. Girkin, “Comparison of diagnosticaccuracy of Heidelberg retina tomograph II and Heidelbergretina tomograph 3 to discriminate glaucomatous and nonglau-comatous eyes,” American Journal of Ophthalmology, vol. 144,no. 4, pp. 525–532, 2007.
[37] F. A.Medeiros, L.M. Zangwill, C. Bowd, P. A. Sample, and R. N.Weinreb, “Influence of disease severity and optic disc size on thediagnostic performance of imaging instruments in glaucoma,”InvestigativeOphthalmology andVisual Science, vol. 47, no. 3, pp.1008–1015, 2006.
[38] E. Hodapp, R. K. Parrish II, and D. R. Anderson, ClinicalDecisions in Glaucoma, Mosby, St. Louis, Mo, USA, 1993.

Submit your manuscripts athttp://www.hindawi.com
Stem CellsInternational
Hindawi Publishing Corporationhttp://www.hindawi.com Volume 2014
Hindawi Publishing Corporationhttp://www.hindawi.com Volume 2014
MEDIATORSINFLAMMATION
of
Hindawi Publishing Corporationhttp://www.hindawi.com Volume 2014
Behavioural Neurology
EndocrinologyInternational Journal of
Hindawi Publishing Corporationhttp://www.hindawi.com Volume 2014
Hindawi Publishing Corporationhttp://www.hindawi.com Volume 2014
Disease Markers
Hindawi Publishing Corporationhttp://www.hindawi.com Volume 2014
BioMed Research International
OncologyJournal of
Hindawi Publishing Corporationhttp://www.hindawi.com Volume 2014
Hindawi Publishing Corporationhttp://www.hindawi.com Volume 2014
Oxidative Medicine and Cellular Longevity
Hindawi Publishing Corporationhttp://www.hindawi.com Volume 2014
PPAR Research
The Scientific World JournalHindawi Publishing Corporation http://www.hindawi.com Volume 2014
Immunology ResearchHindawi Publishing Corporationhttp://www.hindawi.com Volume 2014
Journal of
ObesityJournal of
Hindawi Publishing Corporationhttp://www.hindawi.com Volume 2014
Hindawi Publishing Corporationhttp://www.hindawi.com Volume 2014
Computational and Mathematical Methods in Medicine
OphthalmologyJournal of
Hindawi Publishing Corporationhttp://www.hindawi.com Volume 2014
Diabetes ResearchJournal of
Hindawi Publishing Corporationhttp://www.hindawi.com Volume 2014
Hindawi Publishing Corporationhttp://www.hindawi.com Volume 2014
Research and TreatmentAIDS
Hindawi Publishing Corporationhttp://www.hindawi.com Volume 2014
Gastroenterology Research and Practice
Hindawi Publishing Corporationhttp://www.hindawi.com Volume 2014
Parkinson’s Disease
Evidence-Based Complementary and Alternative Medicine
Volume 2014Hindawi Publishing Corporationhttp://www.hindawi.com