Research and Data Collection to Measure and Evaluate What We Do National Study Center for Trauma &...
90
Research and Data Collection to Measure and Evaluate What We Do National Study Center for Trauma & EMS
-
Upload
myra-potter -
Category
Documents
-
view
214 -
download
0
Transcript of Research and Data Collection to Measure and Evaluate What We Do National Study Center for Trauma &...

Research and Data Collection to Measure and Evaluate What We Do
National Study Center for Trauma & EMS
Traffic Records Data in Maryland◦ Statistical Overview◦ Crash Outcome Data Evaluation System (CODES)
Previous research studies◦ Younger v older◦ Motorcycle type◦ Helmet study
Ongoing studies◦ Promising practices◦ Rider observations◦ Behavioral surveys

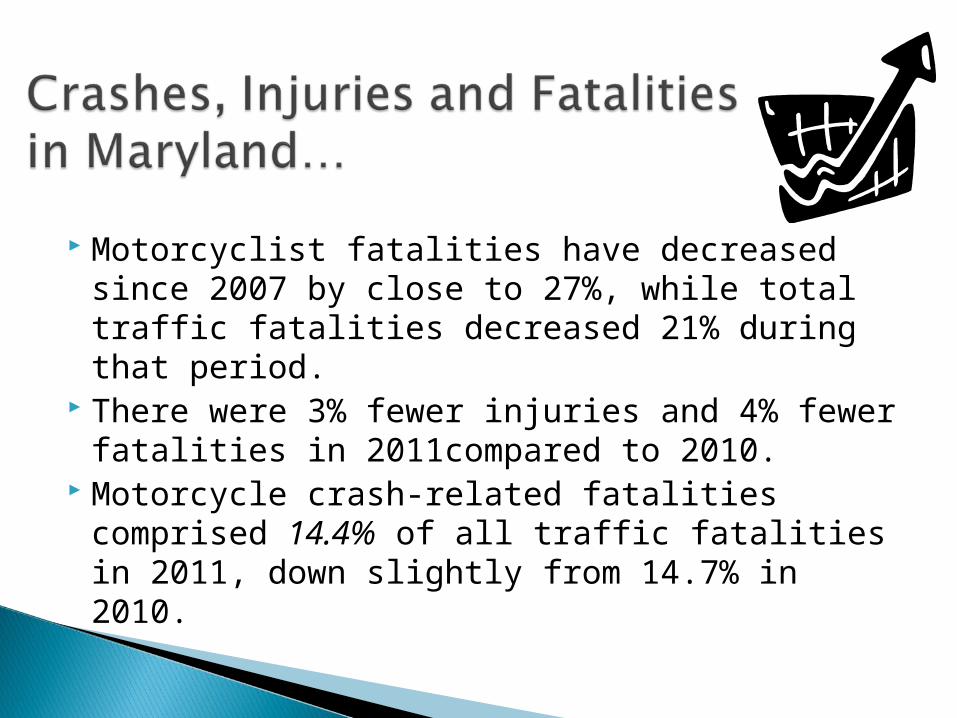
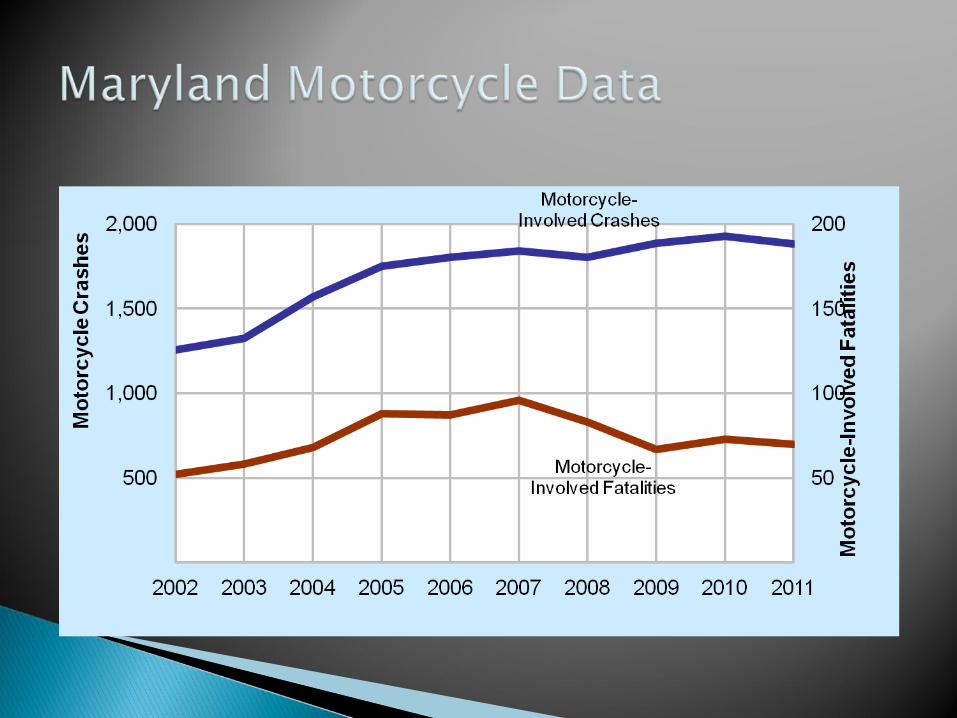
Motorcyclist fatalities have decreased since 2007 by close to 27%, while total traffic fatalities decreased 21% during that period.
There were 3% fewer injuries and 4% fewer fatalities in 2011compared to 2010.
Motorcycle crash-related fatalities comprised 14.4% of all traffic fatalities in 2011, down slightly from 14.7% in 2010.
Motorcycle registrations decreased by 2.5% from 2009 to 2011
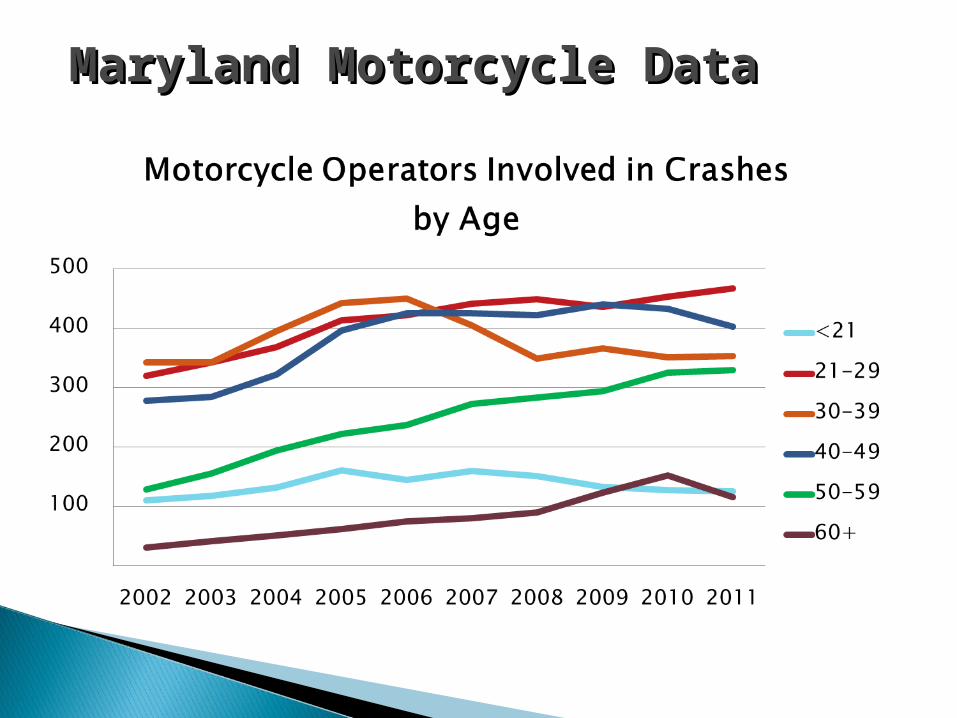
As of August 2012, a total 223,525 people held some class of motorcycle license◦ 15% ages 50-54◦ 14% ages 45-49◦ 13.5% ages 55-59
Maryland Motorcycle DataMaryland Motorcycle Data
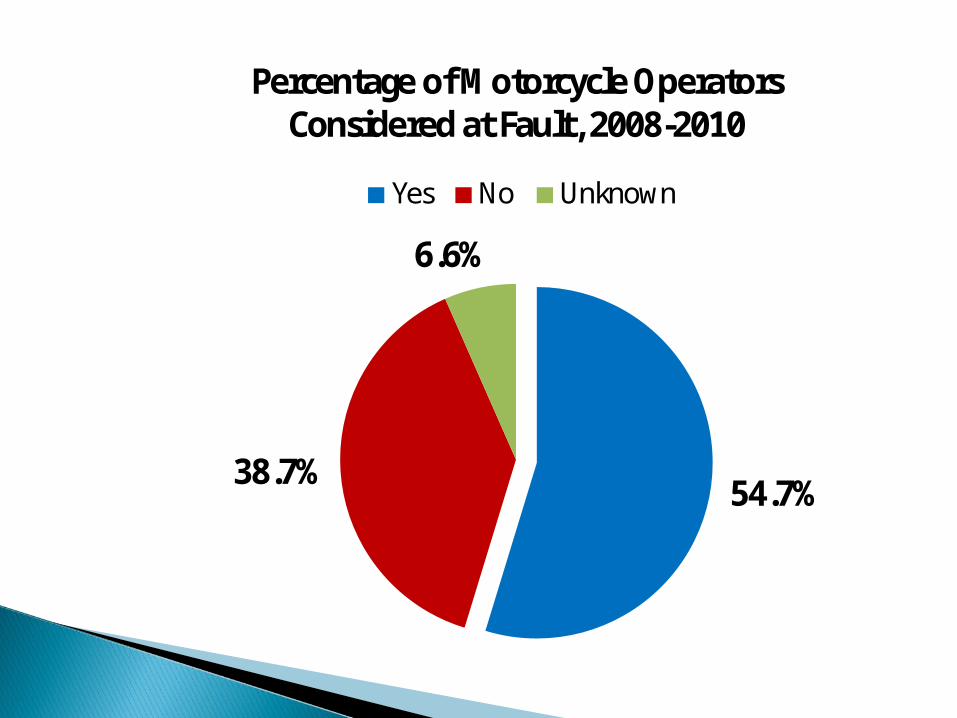
54.7%38.7%
6.6%
Percentage of Motorcycle Operators Considered at Fault, 2008-2010
Yes No Unknown
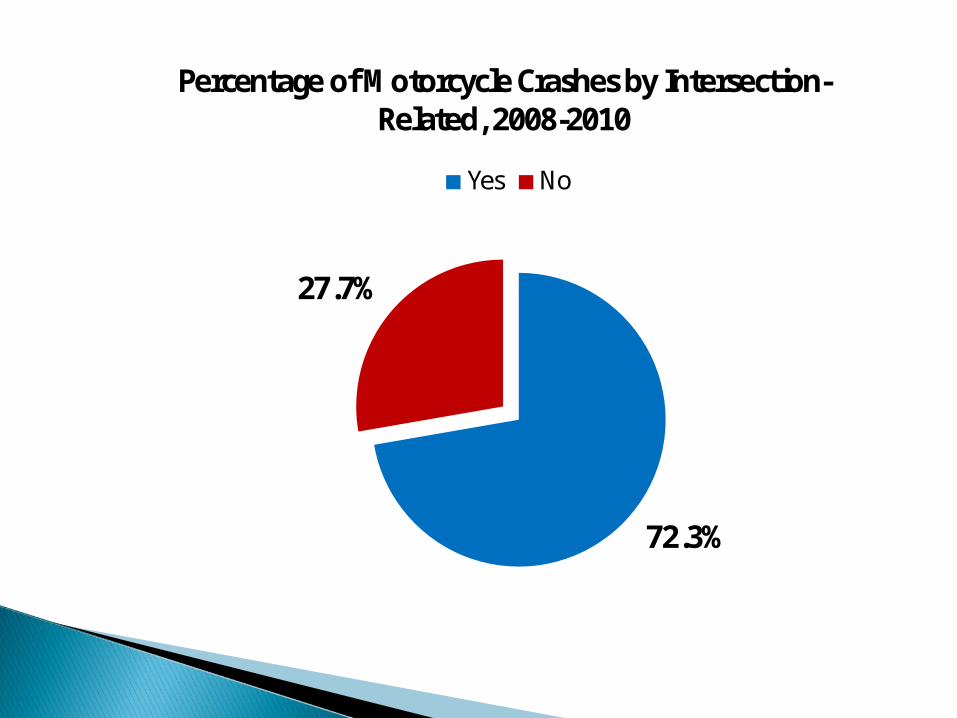
72.3%
27.7%
Percentage of Motorcycle Crashes by Intersection-Related, 2008-2010
Yes No
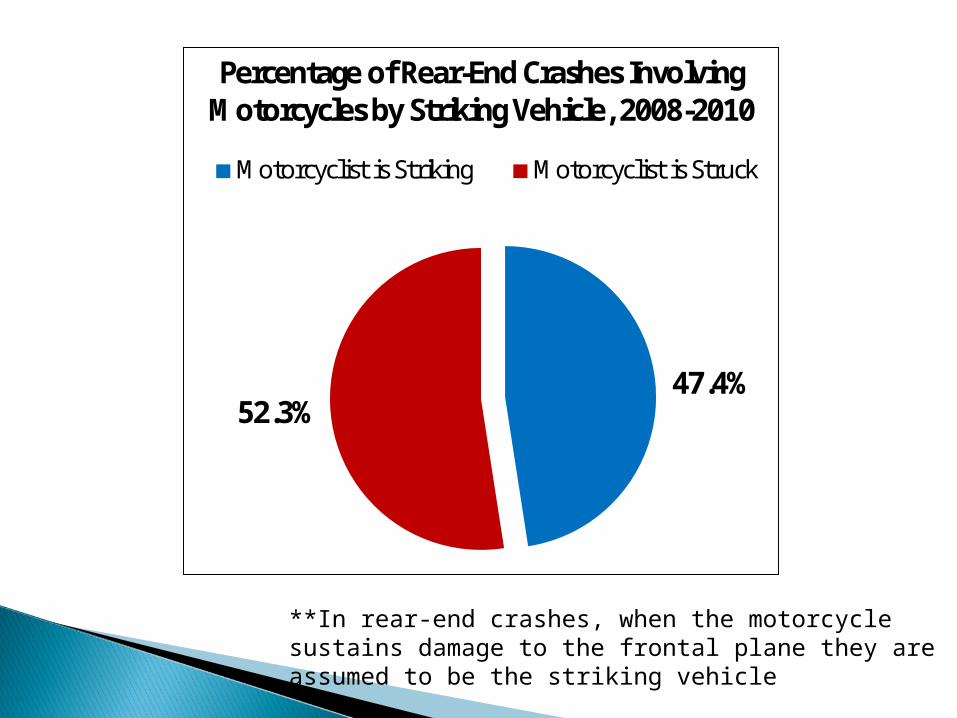
47.4%52.3%
Percentage of Rear-End Crashes Involving Motorcycles by Striking Vehicle, 2008-2010
Motorcyclist is Striking Motorcyclist is Struck
**In rear-end crashes, when the motorcycle sustains damage to the frontal plane they are assumed to be the striking vehicle
From 2008-2010, there were 129 same direction left turn crashes involving motorcycles.
In those crashes, the motorcycle was moving at a constant speed, accelerating, slowing or stopping, or passing in 103 of the crashes (80%).
The motorcycle was only turning left in 10 (8%) of those crashes.
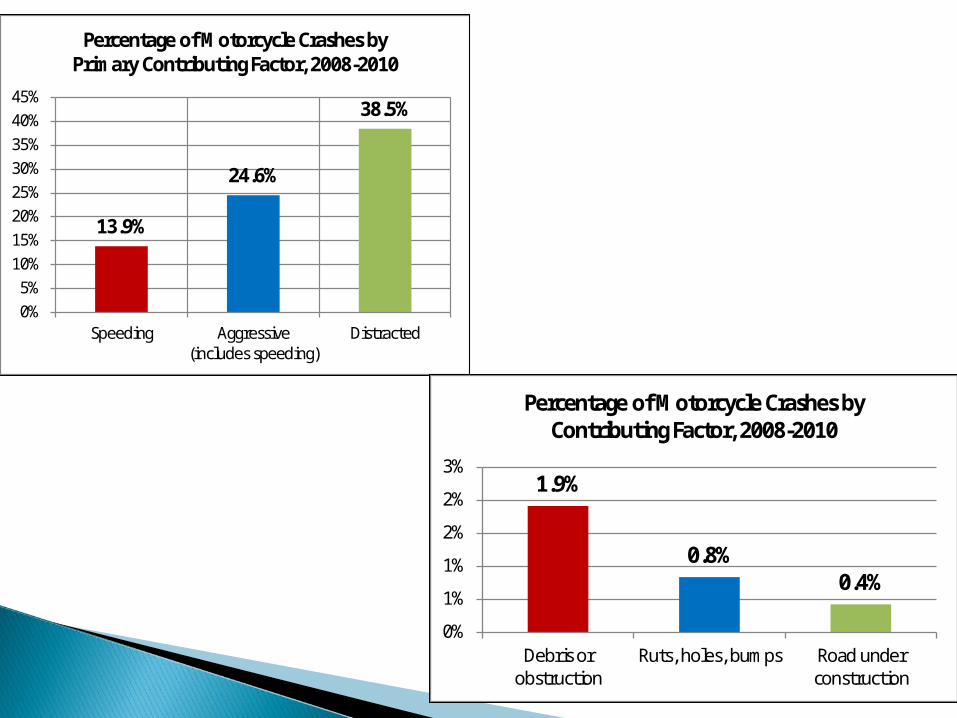
13.9%
24.6%
38.5%
0%5%
10%15%20%25%30%35%40%45%
Speeding Aggressive(includes speeding)
Distracted
Percentage of Motorcycle Crashes by Primary Contributing Factor, 2008-2010
1.9%
0.8%0.4%
0%
1%
1%
2%
2%
3%
Debris orobstruction
Ruts, holes, bumps Road underconstruction
Percentage of Motorcycle Crashes by Contributing Factor, 2008-2010
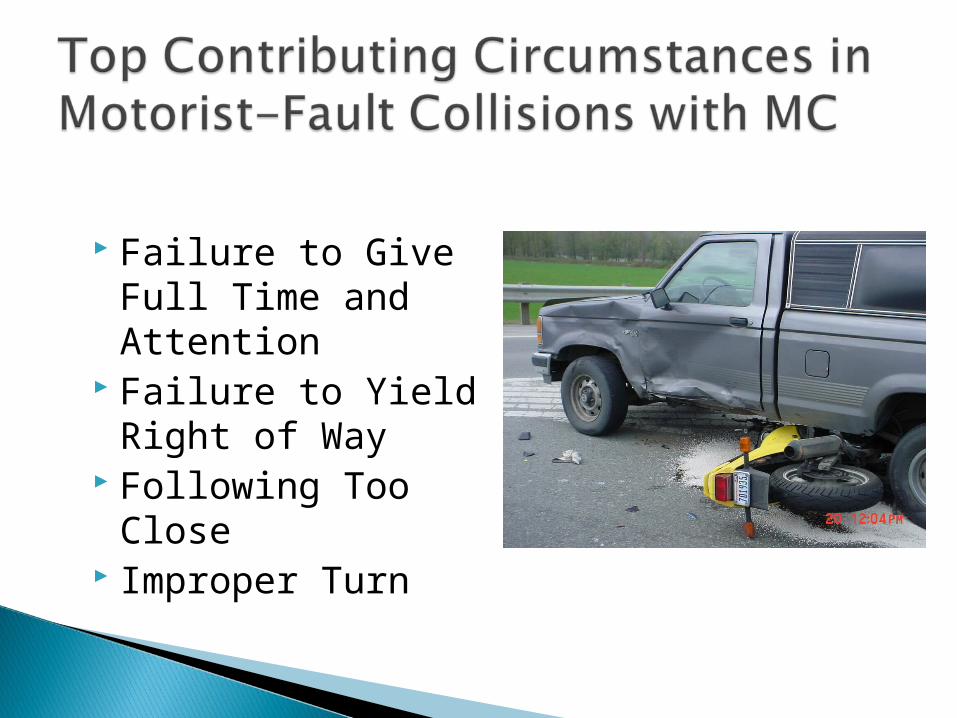
Failure to Give Full Time and Attention
Failure to Yield Right of Way
Following Too Close
Improper Turn
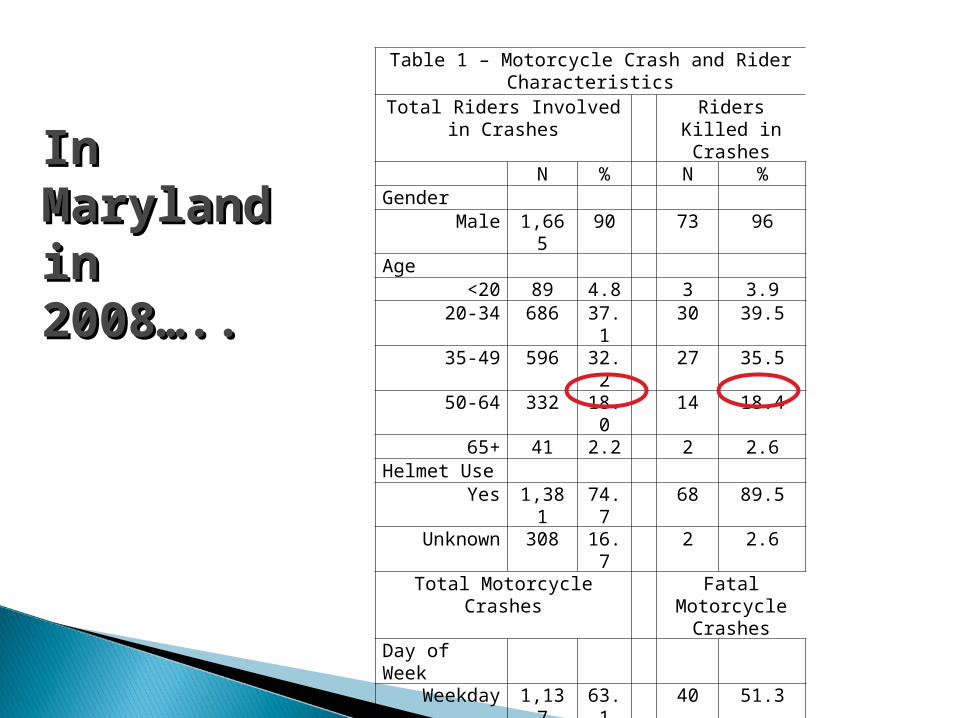
Table 1 – Motorcycle Crash and Rider Characteristics
Total Riders Involved in Crashes
Riders Killed in Crashes
N % N %Gender
Male 1,665 90 73 96Age
<20 89 4.8 3 3.920-34 686 37.1 30 39.535-49 596 32.2 27 35.550-64 332 18.0 14 18.4
65+ 41 2.2 2 2.6Helmet Use
Yes 1,381 74.7 68 89.5Unknown 308 16.7 2 2.6
Total Motorcycle Crashes Fatal Motorcycle Crashes
Day of WeekWeekday 1,137 63.1 40 51.3Weekend 666 36.9 38 48.7
Hour of Day12am – 8am 203 11.2 11 14.18am – 12pm 212 11.8 6 7.712pm – 8pm 1,078 59.8 47 60.28pm – 12am 310 17.2 14 17.9
In In Maryland Maryland in in 2008…..2008…..
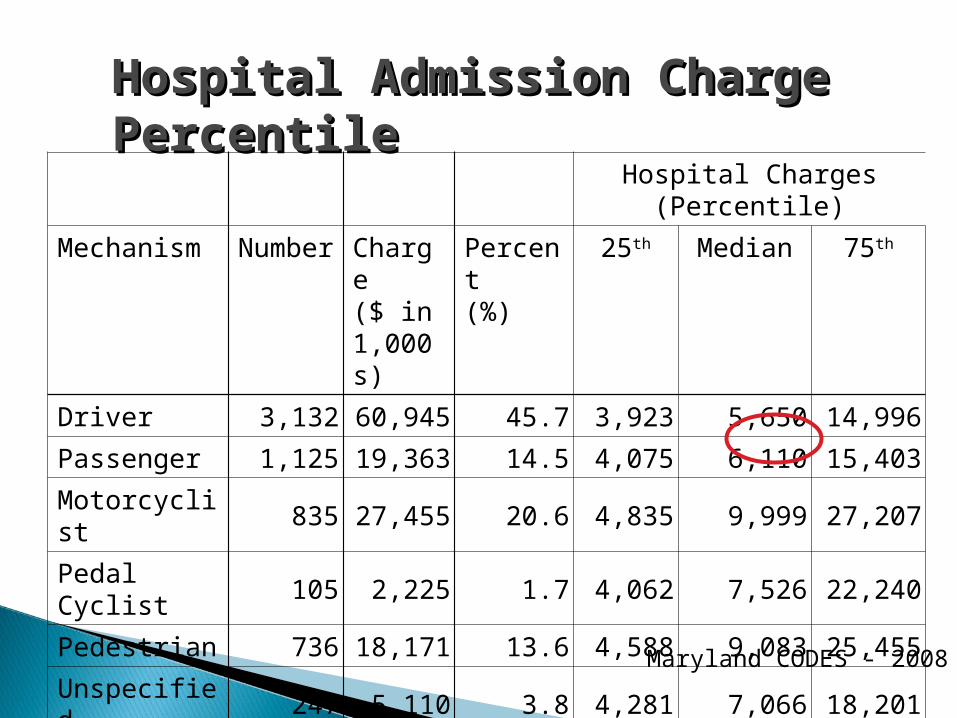
Hospital Admission Charge Hospital Admission Charge PercentilePercentile
Hospital Charges(Percentile)
Mechanism Number Charge($ in 1,000s)
Percent(%)
25th Median 75th
Driver 3,132 60,945 45.7 3,923 5,650 14,996
Passenger 1,125 19,363 14.5 4,075 6,110 15,403
Motorcyclist 835 27,455 20.6 4,835 9,999 27,207
Pedal Cyclist 105 2,225 1.7 4,062 7,526 22,240
Pedestrian 736 18,171 13.6 4,588 9,083 25,455
Unspecified 247 5,110 3.8 4,281 7,066 18,201
Total 6,180 133,269 100.0 4,104 6,396 17,713
Maryland CODES - 2008
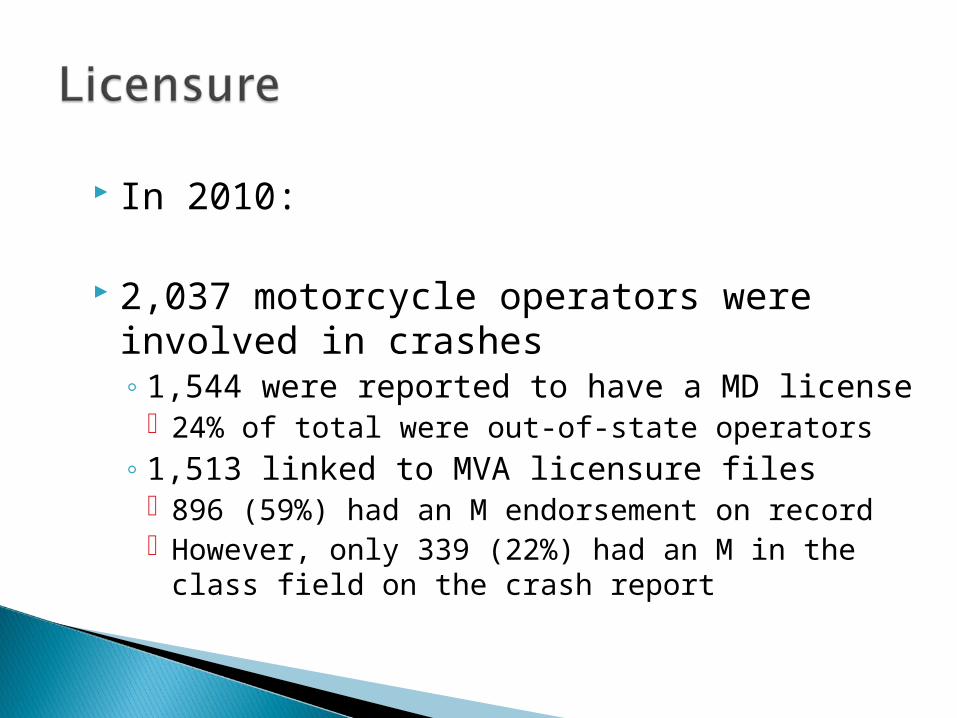
In 2010: 2,037 motorcycle operators were involved
in crashes◦ 1,544 were reported to have a MD license
24% of total were out-of-state operators◦ 1,513 linked to MVA licensure files
896 (59%) had an M endorsement on record However, only 339 (22%) had an M in the class
field on the crash report

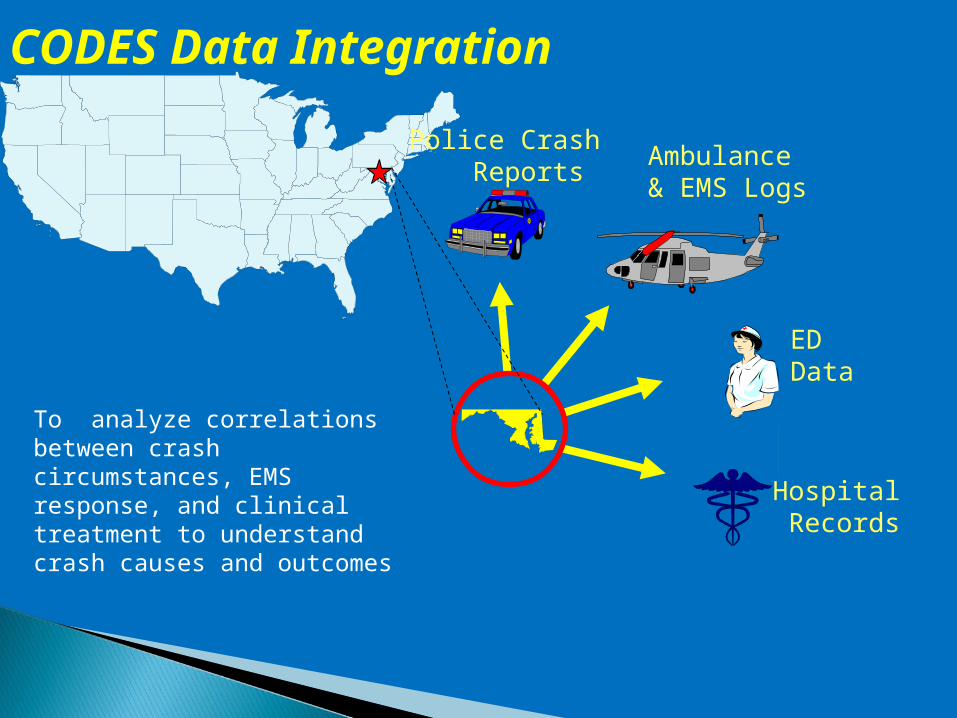
Hospital Records
Ambulance & EMS Logs
Police Crash Reports
ED Data
CODES Data Integration
To analyze correlations between crash circumstances, EMS response, and clinical treatment to understand crash causes and outcomes
Roadway Crash Driver/Vehicle Enforcement Adjudication EMS/Trauma
Timeliness Consistency Completeness Accuracy Accessibility Data Integration
• Program management and evaluation
• Research and program development
• Policy development
• Private sector and public requests
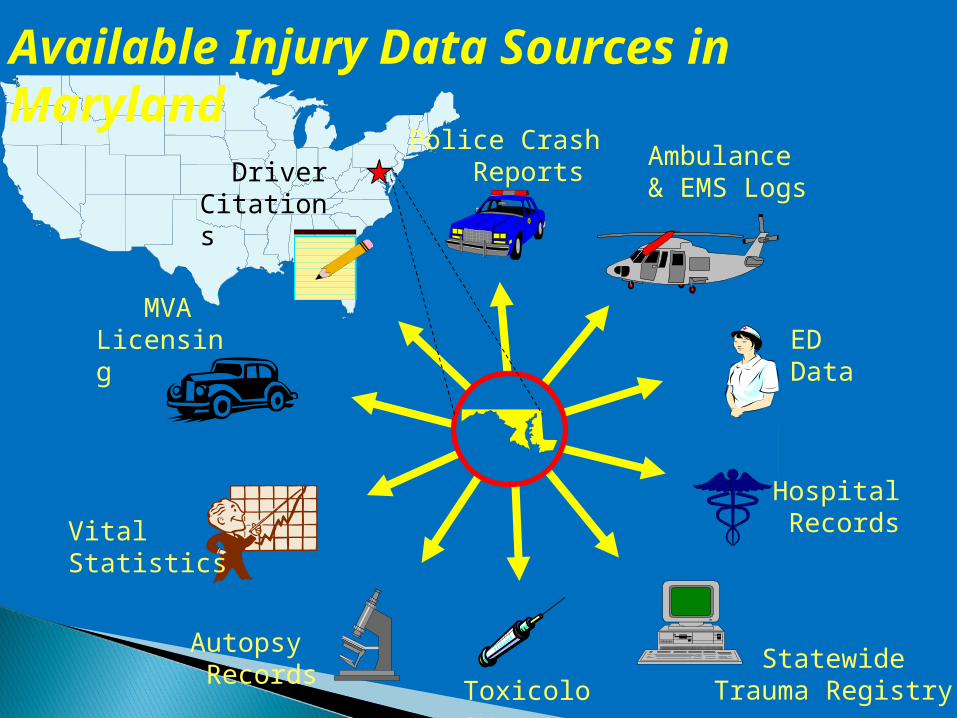
Hospital Records
Autopsy Records
StatewideTrauma Registry
Ambulance & EMS Logs
Police Crash Reports
VitalStatistics
ED Data
MVA Licensing
Driver Citations
Toxicology
Available Injury Data Sources in Maryland
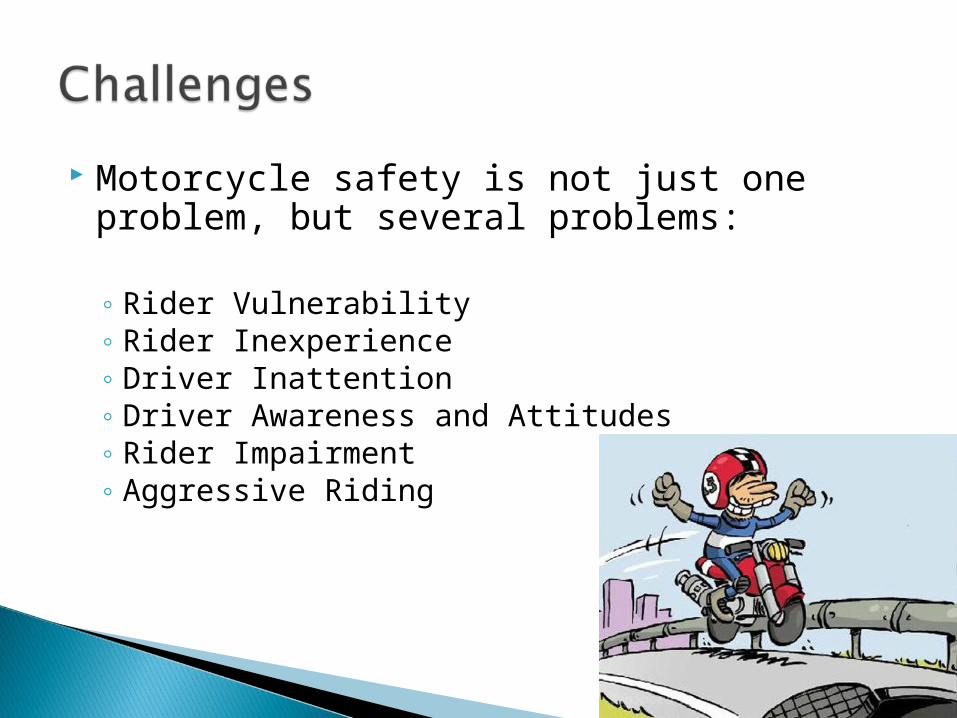
Motorcycle safety is not just one problem, but several problems:
◦ Rider Vulnerability◦ Rider Inexperience◦ Driver Inattention◦ Driver Awareness and Attitudes◦ Rider Impairment◦ Aggressive Riding
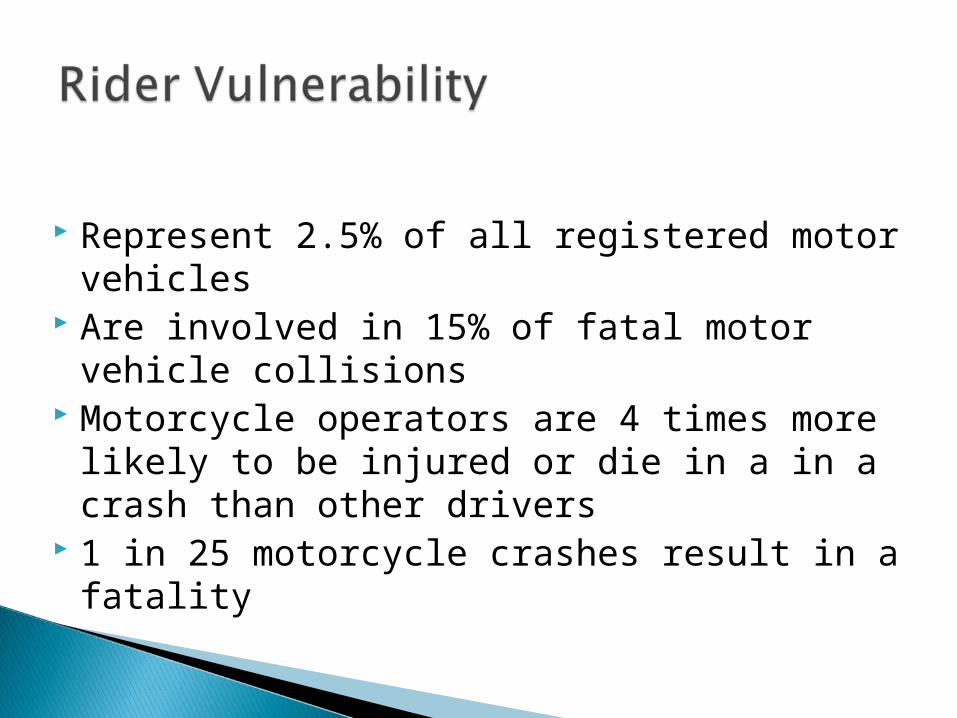
Represent 2.5% of all registered motor vehicles
Are involved in 15% of fatal motor vehicle collisions
Motorcycle operators are 4 times more likely to be injured or die in a in a crash than other drivers
1 in 25 motorcycle crashes result in a fatality
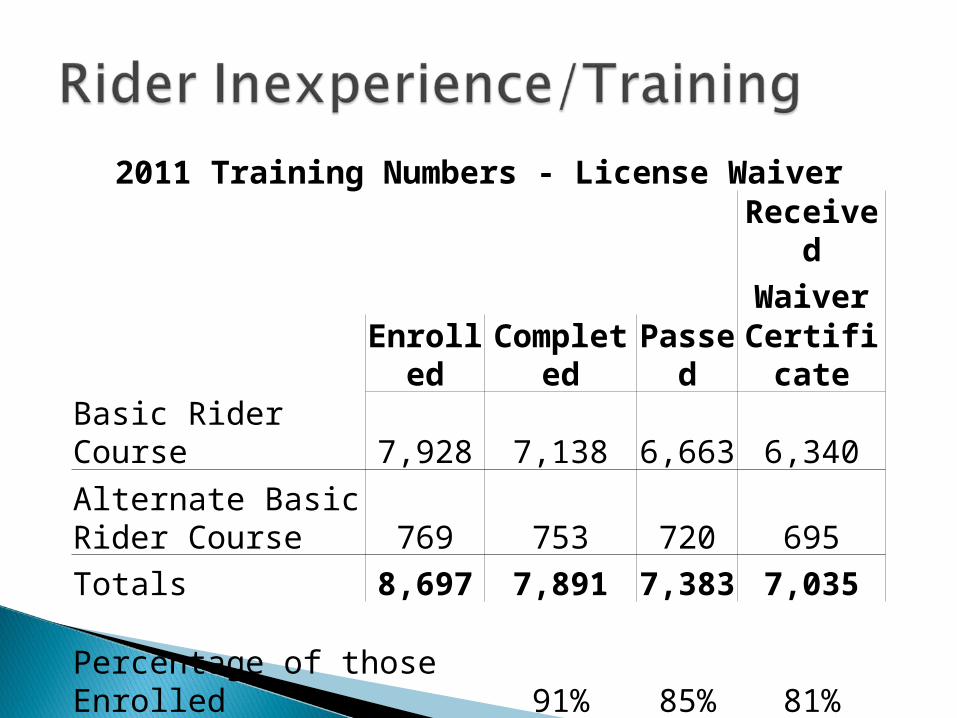
2011 Training Numbers - License WaiverReceivedWaiver
Enrolled Completed Passed CertificateBasic Rider Course 7,928 7,138 6,663 6,340Alternate Basic Rider Course 769 753 720 695Totals 8,697 7,891 7,383 7,035
Percentage of those Enrolled 91% 85% 81%

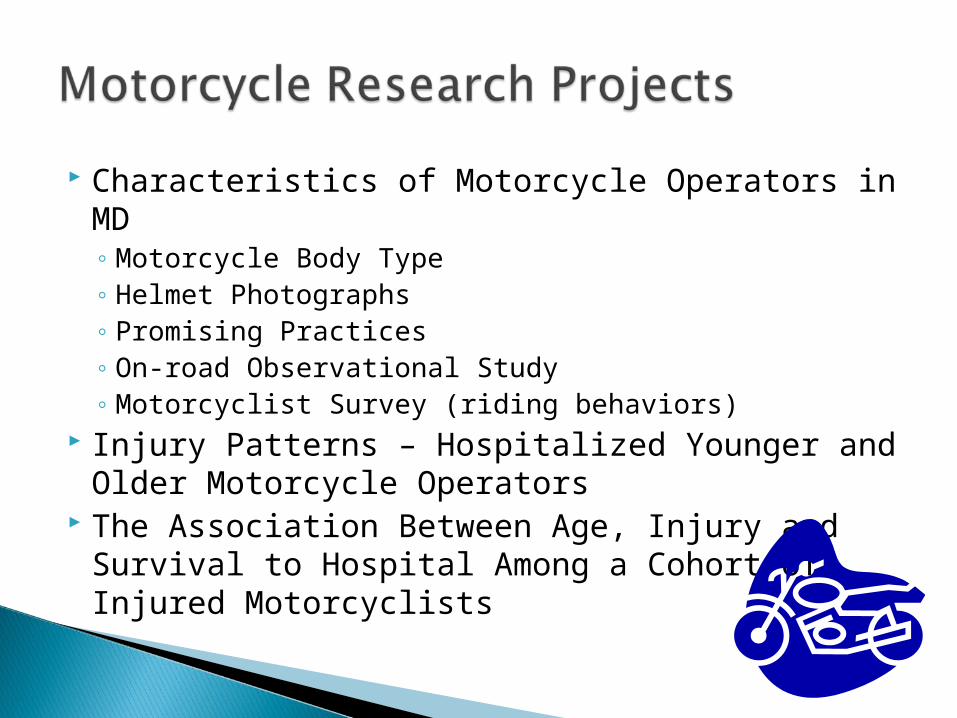
Characteristics of Motorcycle Operators in MD◦ Motorcycle Body Type◦ Helmet Photographs◦ Promising Practices◦ On-road Observational Study◦ Motorcyclist Survey (riding behaviors)
Injury Patterns – Hospitalized Younger and Older Motorcycle Operators
The Association Between Age, Injury and Survival to Hospital Among a Cohort of Injured Motorcyclists

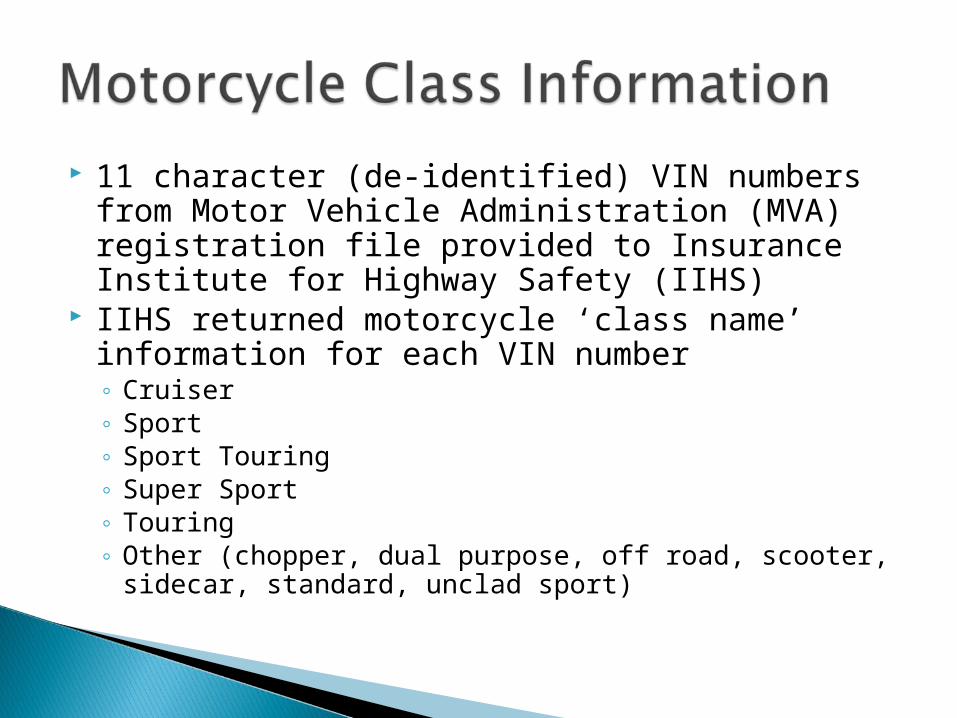
11 character (de-identified) VIN numbers from Motor Vehicle Administration (MVA) registration file provided to Insurance Institute for Highway Safety (IIHS)
IIHS returned motorcycle ‘class name’ information for each VIN number◦ Cruiser◦ Sport◦ Sport Touring◦ Super Sport◦ Touring◦ Other (chopper, dual purpose, off road, scooter, sidecar,
standard, unclad sport)
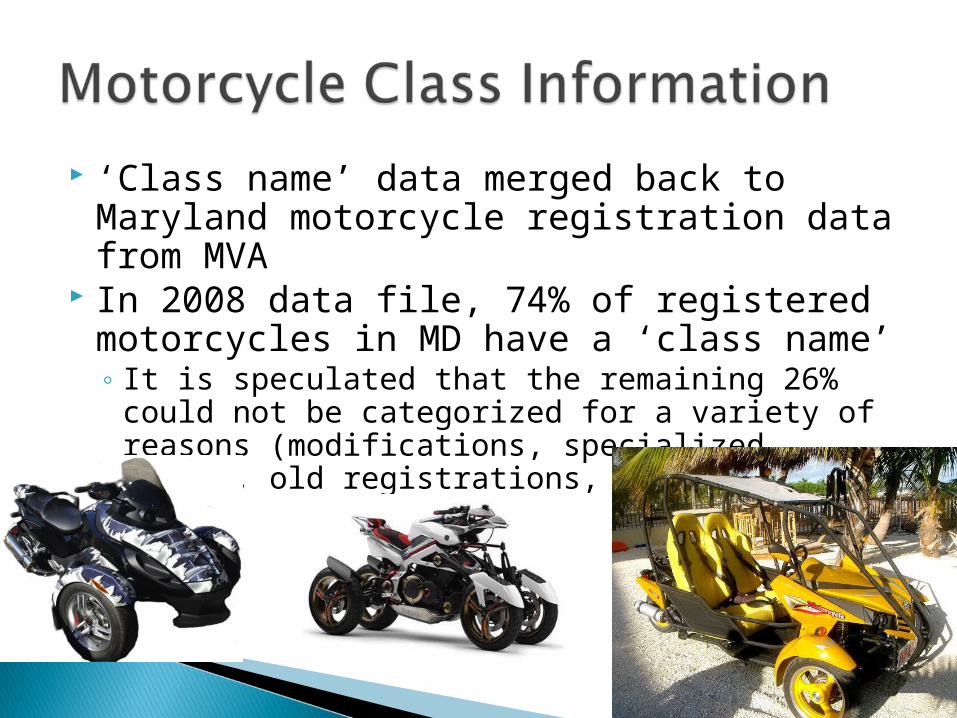
‘Class name’ data merged back to Maryland motorcycle registration data from MVA
In 2008 data file, 74% of registered motorcycles in MD have a ‘class name’◦ It is speculated that the remaining 26% could not
be categorized for a variety of reasons (modifications, specialized models, old registrations, etc.)
The updated MVA registration file (with ‘class name’) was merged with 14 years of police crash report data (1998-2011)
The files were merged by VIN number◦ 50% match
It is speculated that the remaining 50% could not be matched for a variety of reasons (missing fields, poor VIN capture, etc.)
The following slides include information based on the records that matched (50%) of all motorcycles in crashes and their operator
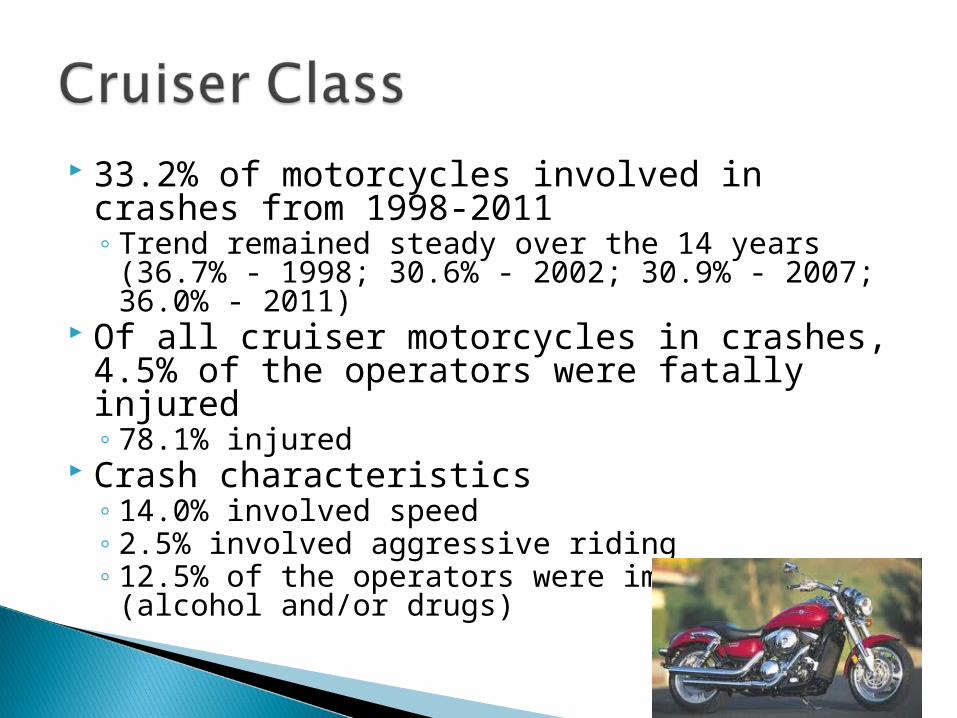
33.2% of motorcycles involved in crashes from 1998-2011◦ Trend remained steady over the 14 years (36.7%
- 1998; 30.6% - 2002; 30.9% - 2007; 36.0% - 2011)
Of all cruiser motorcycles in crashes, 4.5% of the operators were fatally injured◦ 78.1% injured
Crash characteristics◦ 14.0% involved speed◦ 2.5% involved aggressive riding◦ 12.5% of the operators were impaired (alcohol
and/or drugs)
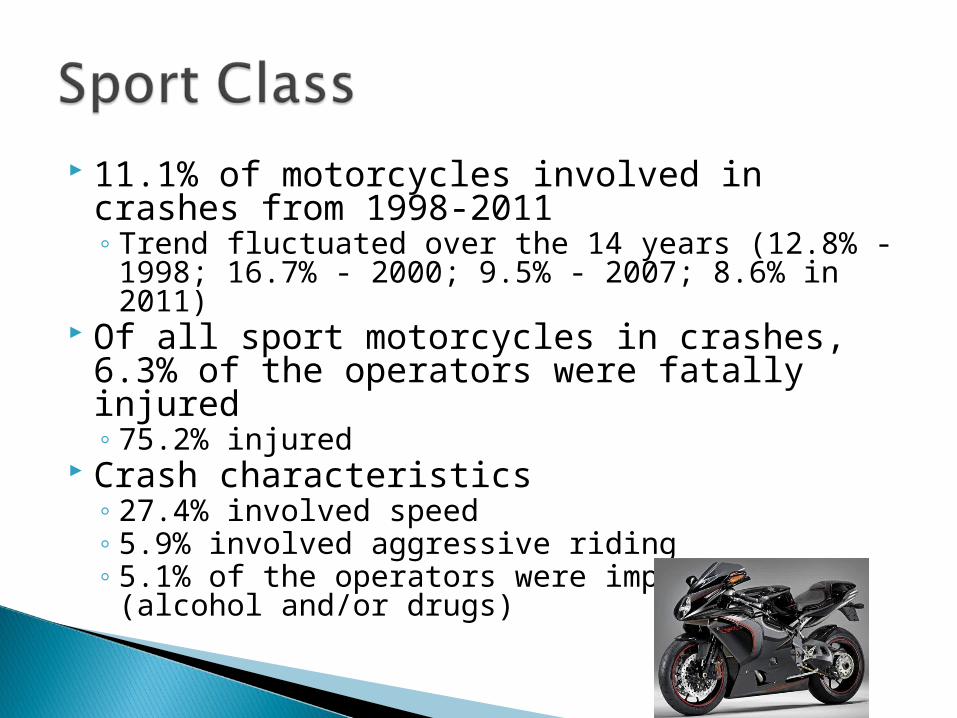
11.1% of motorcycles involved in crashes from 1998-2011◦ Trend fluctuated over the 14 years (12.8% -
1998; 16.7% - 2000; 9.5% - 2007; 8.6% in 2011) Of all sport motorcycles in crashes, 6.3%
of the operators were fatally injured◦ 75.2% injured
Crash characteristics◦ 27.4% involved speed◦ 5.9% involved aggressive riding◦ 5.1% of the operators were impaired (alcohol
and/or drugs)
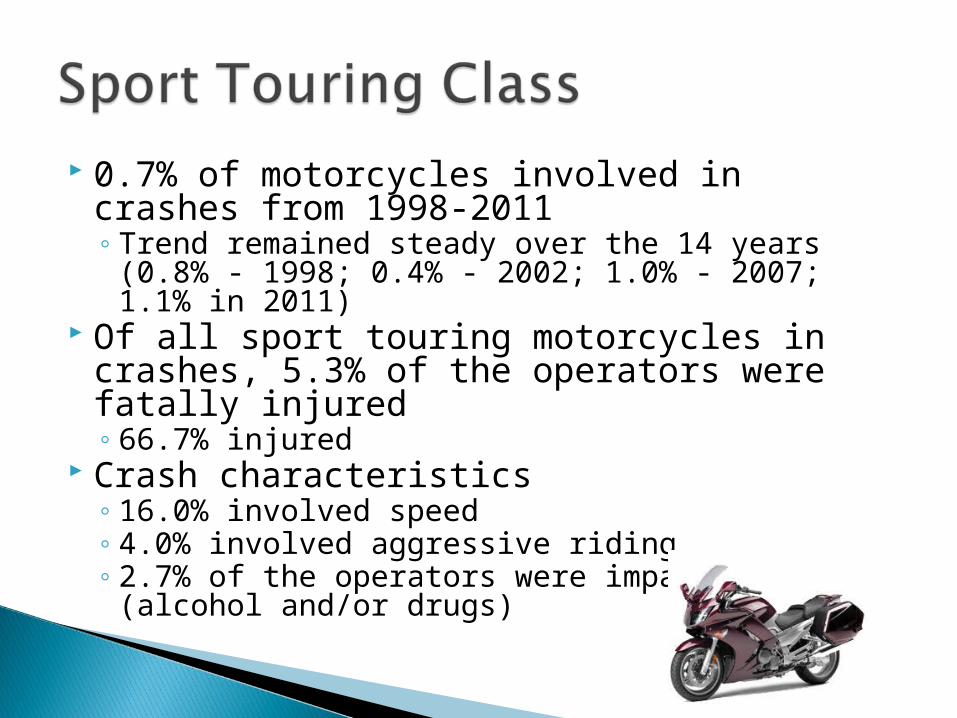
0.7% of motorcycles involved in crashes from 1998-2011◦ Trend remained steady over the 14 years (0.8%
- 1998; 0.4% - 2002; 1.0% - 2007; 1.1% in 2011)
Of all sport touring motorcycles in crashes, 5.3% of the operators were fatally injured◦ 66.7% injured
Crash characteristics◦ 16.0% involved speed◦ 4.0% involved aggressive riding◦ 2.7% of the operators were impaired (alcohol
and/or drugs)
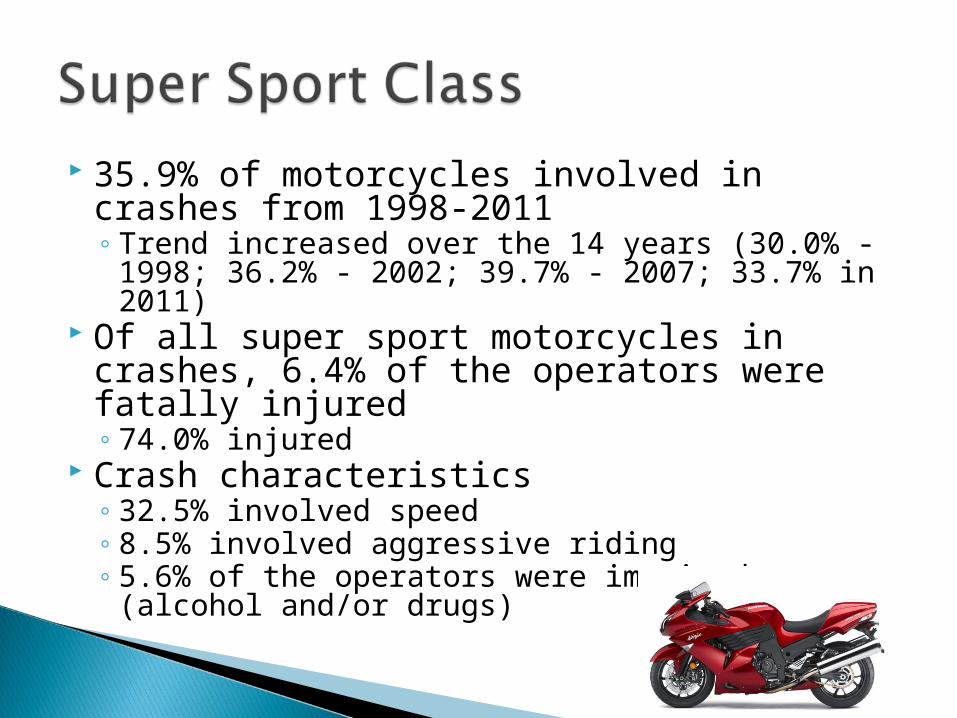
35.9% of motorcycles involved in crashes from 1998-2011◦ Trend increased over the 14 years (30.0% -
1998; 36.2% - 2002; 39.7% - 2007; 33.7% in 2011)
Of all super sport motorcycles in crashes, 6.4% of the operators were fatally injured◦ 74.0% injured
Crash characteristics◦ 32.5% involved speed◦ 8.5% involved aggressive riding◦ 5.6% of the operators were impaired (alcohol
and/or drugs)
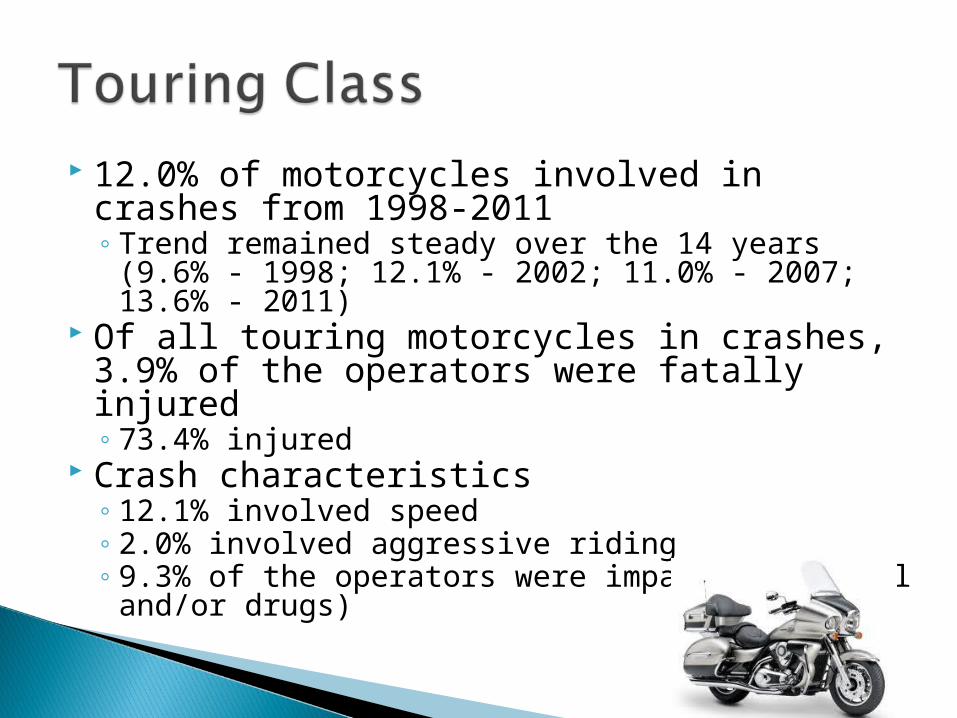
12.0% of motorcycles involved in crashes from 1998-2011◦ Trend remained steady over the 14 years (9.6% -
1998; 12.1% - 2002; 11.0% - 2007; 13.6% - 2011)
Of all touring motorcycles in crashes, 3.9% of the operators were fatally injured◦ 73.4% injured
Crash characteristics◦ 12.1% involved speed◦ 2.0% involved aggressive riding◦ 9.3% of the operators were impaired (alcohol
and/or drugs)
22.4% of all operators reported to be speeding in the crash
5.1% of all operators reported to be riding aggressively in the crash
8.4% of all operators reported to be impaired (alcohol and/or drugs) in the crash
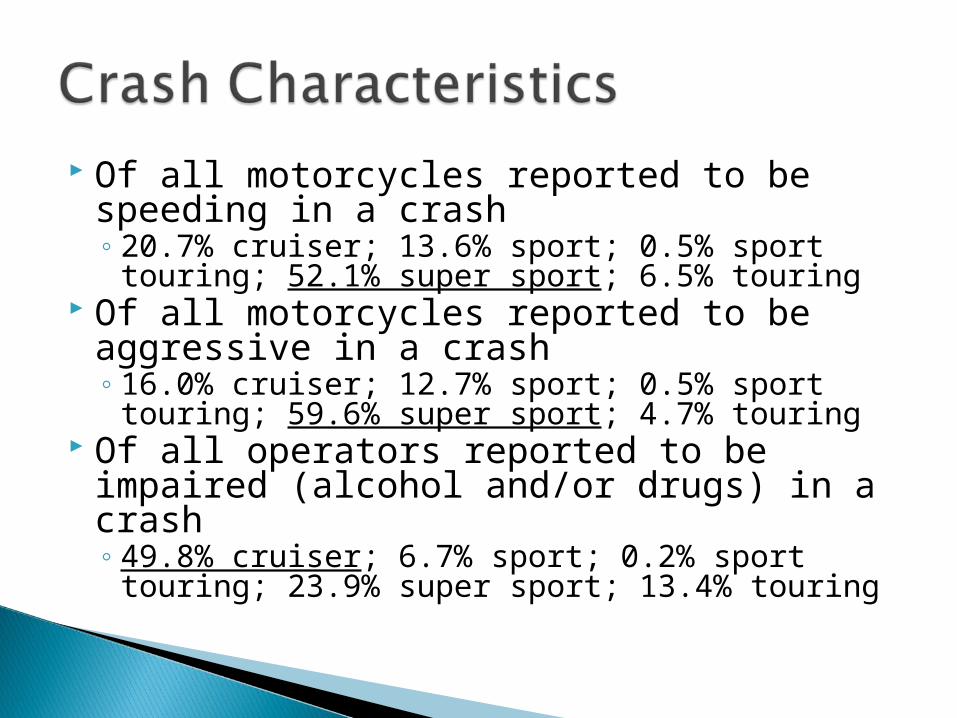
Of all motorcycles reported to be speeding in a crash◦ 20.7% cruiser; 13.6% sport; 0.5% sport touring;
52.1% super sport; 6.5% touring Of all motorcycles reported to be
aggressive in a crash◦ 16.0% cruiser; 12.7% sport; 0.5% sport touring;
59.6% super sport; 4.7% touring Of all operators reported to be impaired
(alcohol and/or drugs) in a crash◦ 49.8% cruiser; 6.7% sport; 0.2% sport touring;
23.9% super sport; 13.4% touring
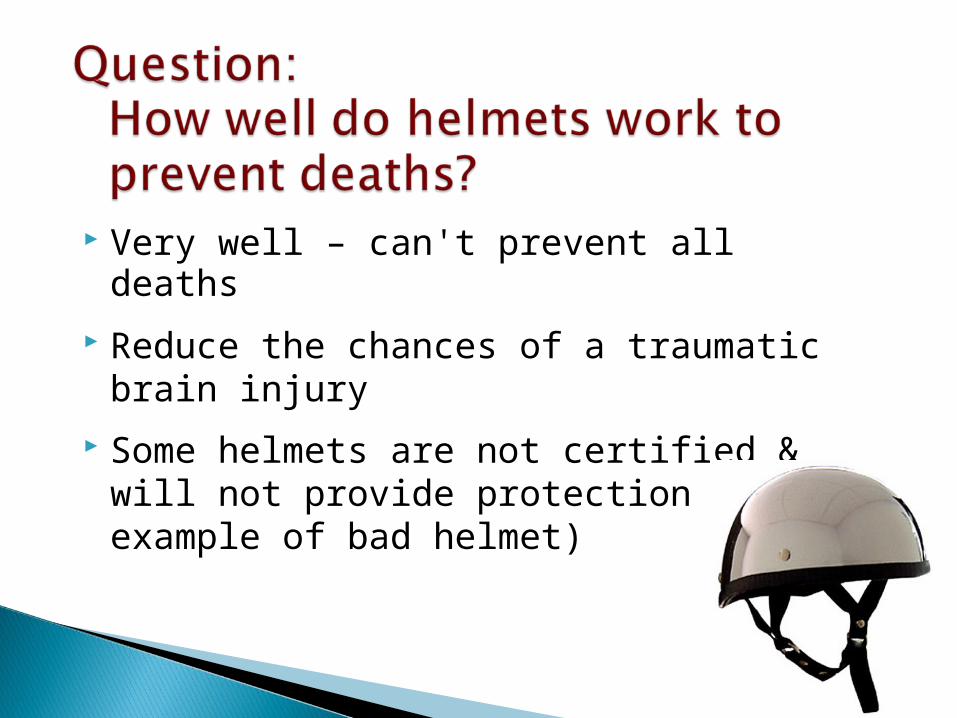
Very well – can't prevent all deaths
Reduce the chances of a traumatic brain injury
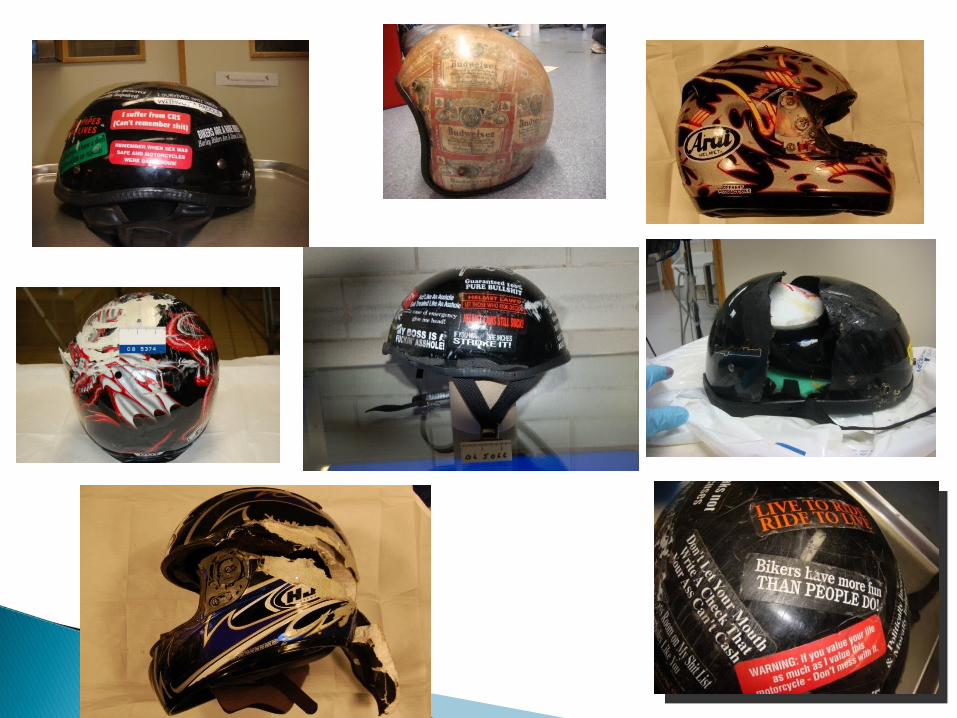
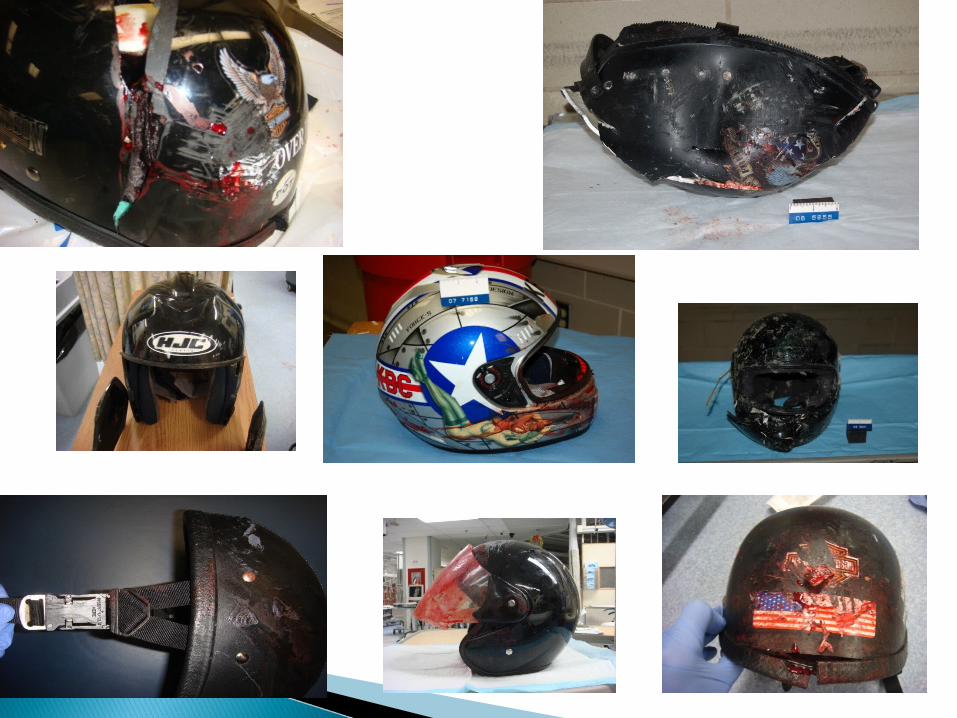
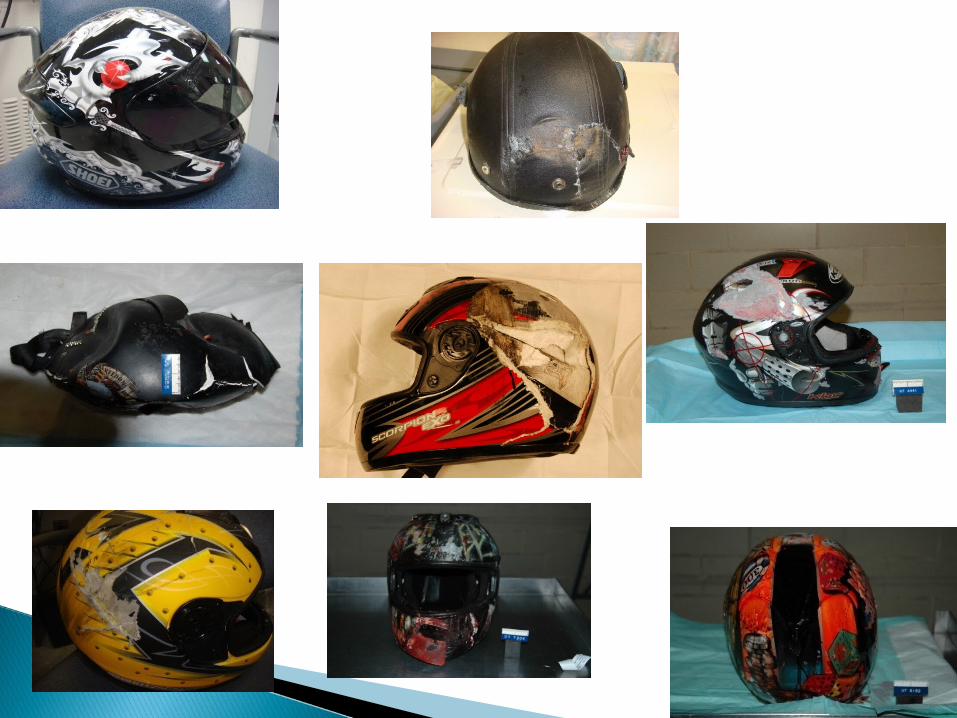
Some helmets are not certified & will not provide protection (see example of bad helmet)
Reduce chances of death in crash by 40% (Keng, 2005)
National Highway Traffic Safety Administration: estimates helmets saved 1,316 motorcyclists' lives in 2004
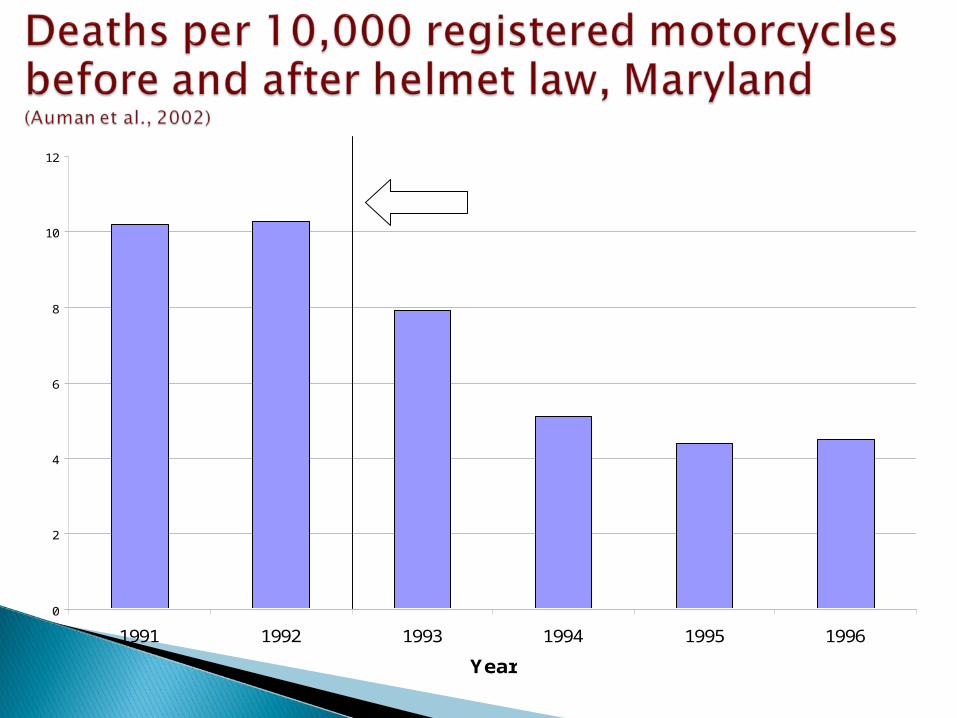
0
2
4
6
8
10
12
1991 1992 1993 1994 1995 1996
Year

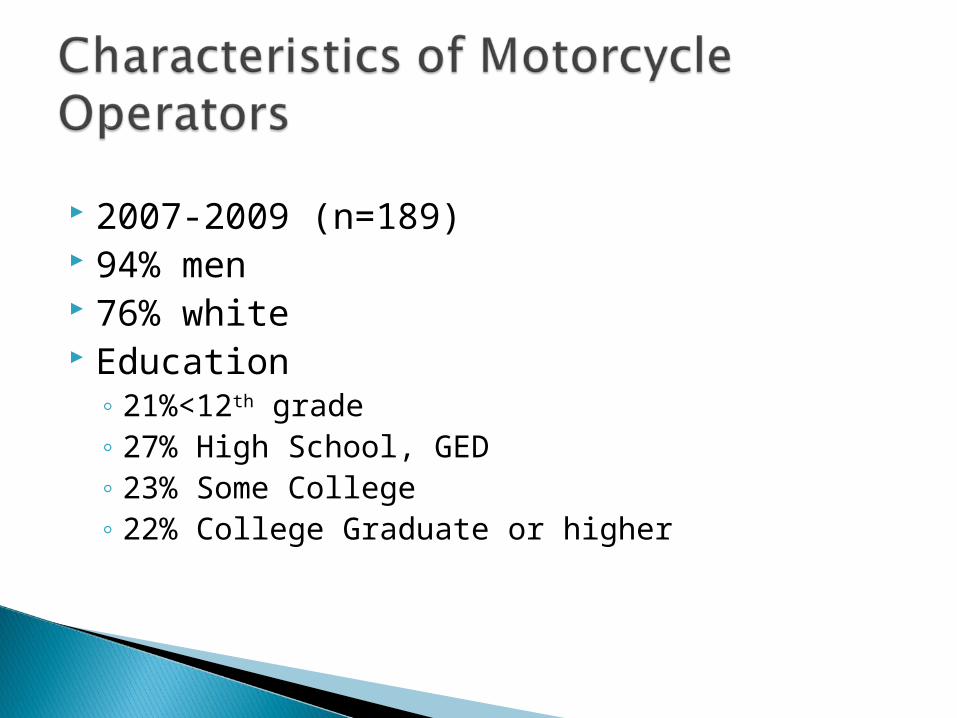
2007-2009 (n=189) 94% men 76% white Education
◦ 21%<12th grade◦ 27% High School, GED◦ 23% Some College◦ 22% College Graduate or higher
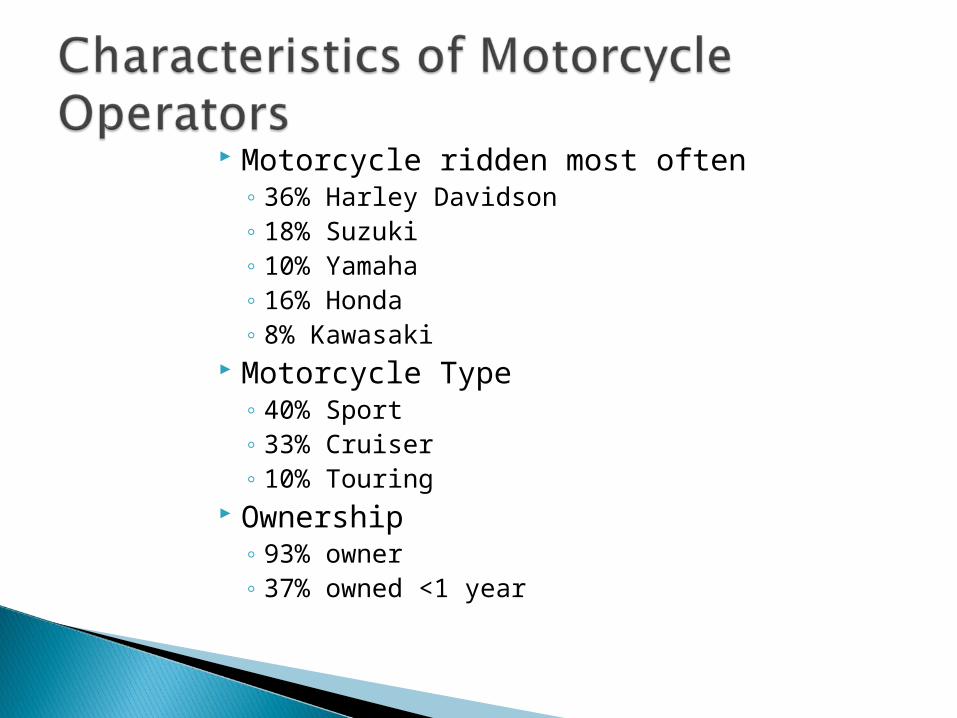
Motorcycle ridden most often◦ 36% Harley Davidson◦ 18% Suzuki◦ 10% Yamaha◦ 16% Honda◦ 8% Kawasaki
Motorcycle Type◦ 40% Sport◦ 33% Cruiser◦ 10% Touring
Ownership◦ 93% owner◦ 37% owned <1 year
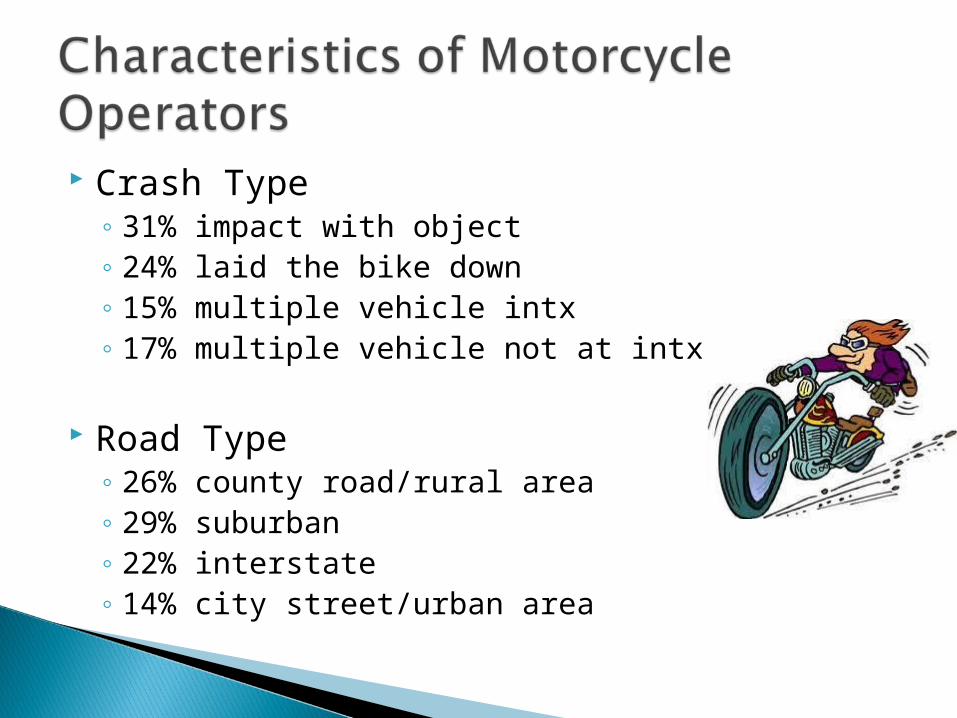
Crash Type◦ 31% impact with object◦ 24% laid the bike down◦ 15% multiple vehicle intx◦ 17% multiple vehicle not at intx
Road Type◦ 26% county road/rural area◦ 29% suburban◦ 22% interstate◦ 14% city street/urban area

Training◦ 60% motorcycle safety course
48% basic 10% intermediate 8% experienced
Licensing◦ 89% valid motorcycle endorsement
77% under the age of 21 when they began riding
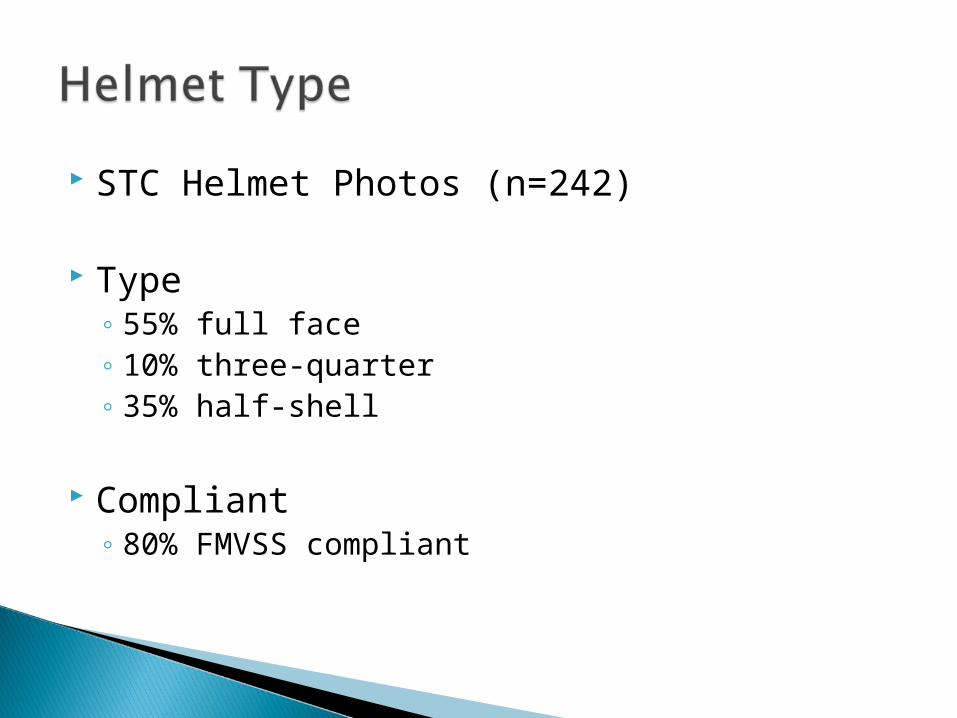
STC Helmet Photos (n=242)
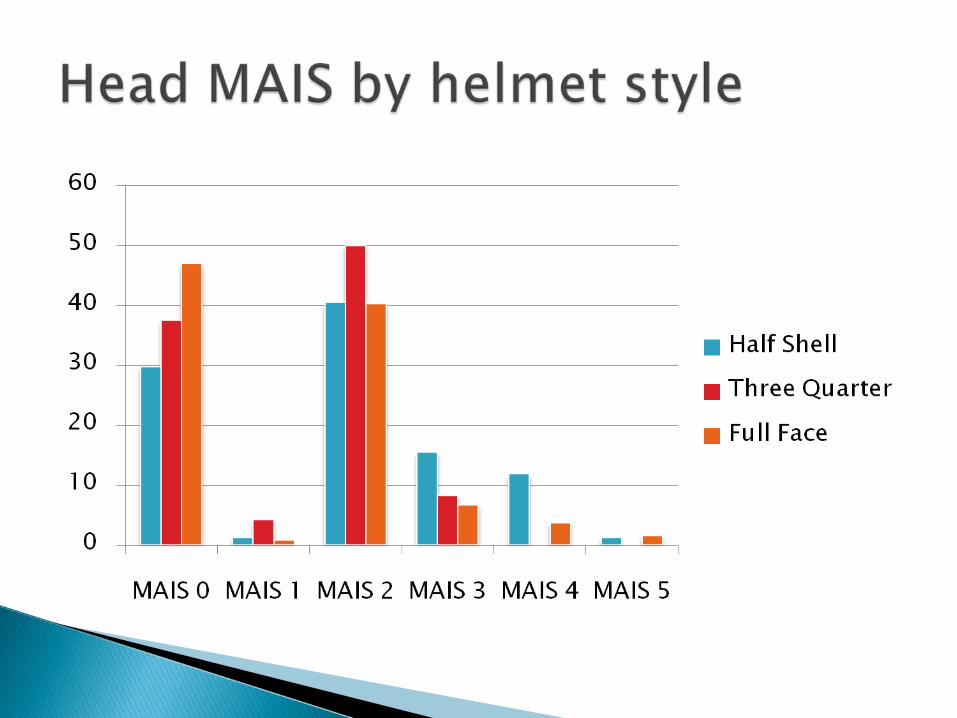
Type◦ 55% full face ◦ 10% three-quarter◦ 35% half-shell
Compliant◦ 80% FMVSS compliant
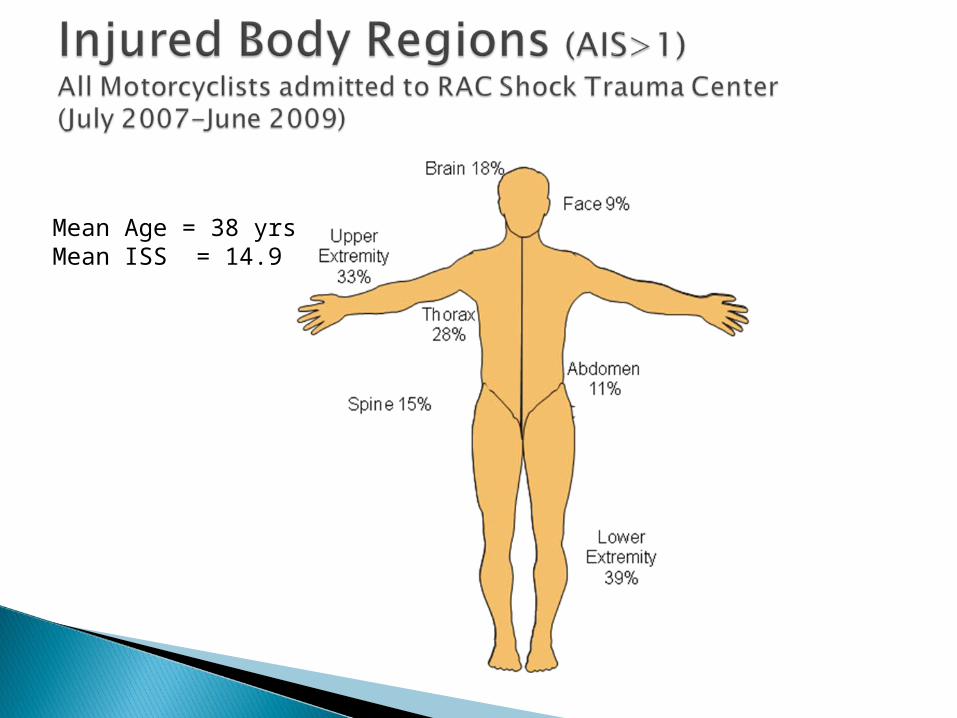
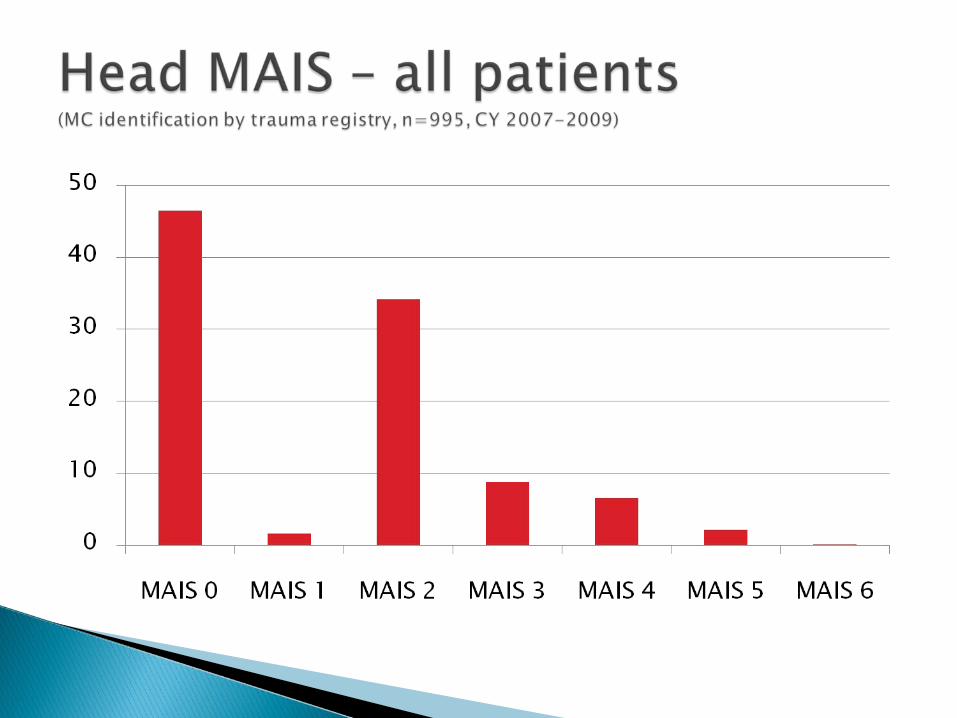
Mean Age = 38 yrsMean ISS = 14.9
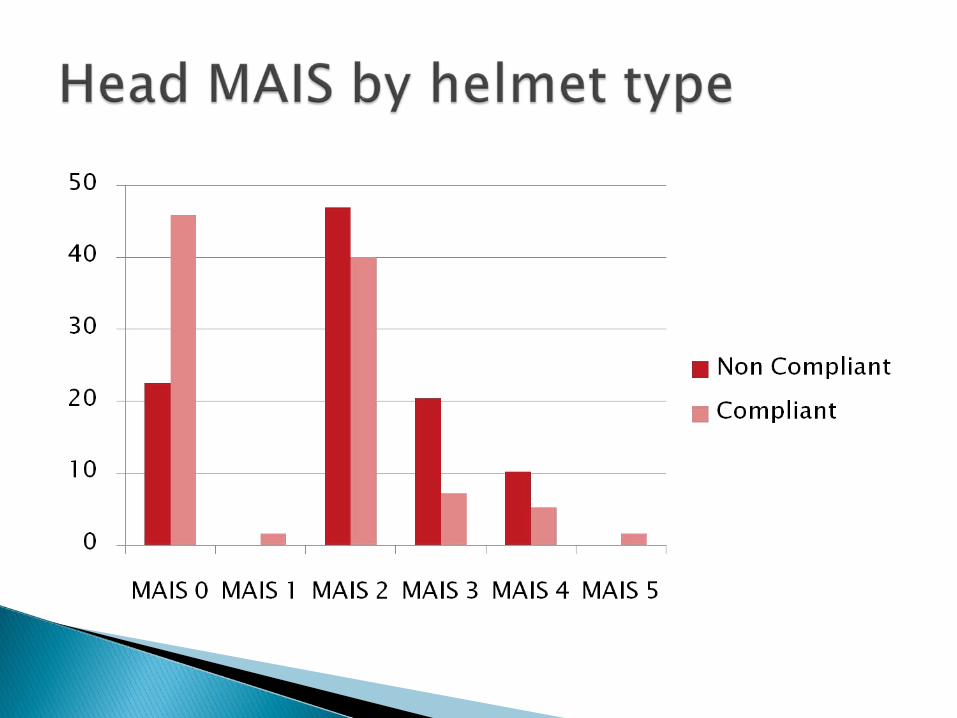
Compliant Non-compliant
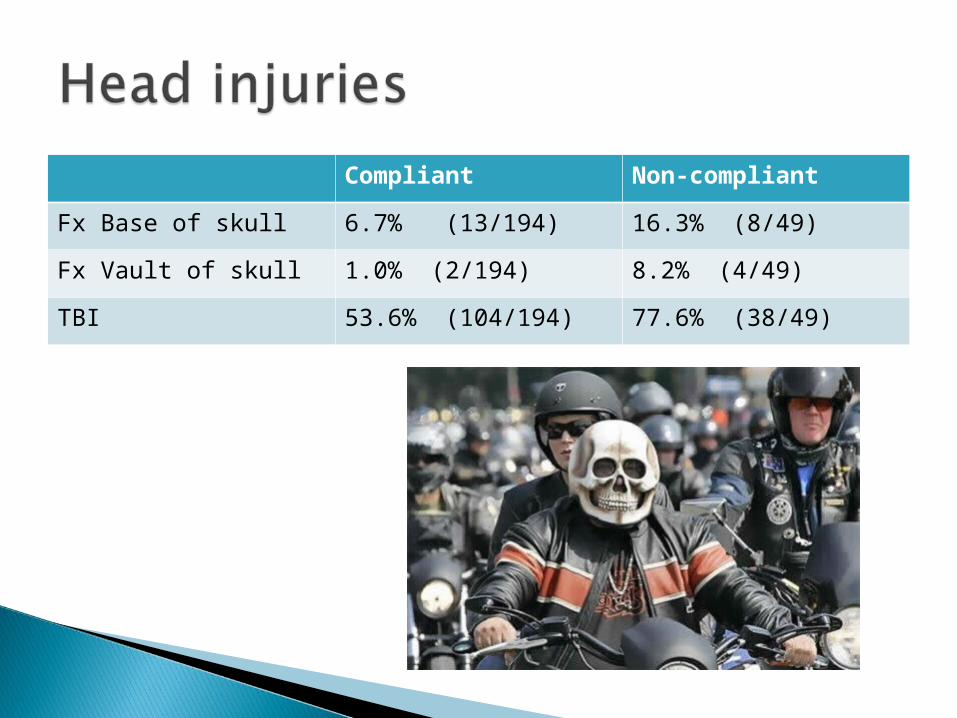
Fx Base of skull 6.7% (13/194) 16.3% (8/49)
Fx Vault of skull 1.0% (2/194) 8.2% (4/49)
TBI 53.6% (104/194) 77.6% (38/49)
Promising Practices◦ Analyze new exposure data (odometer readings =
new measure of miles traveled)◦ Analyze new baseline data (motorcycle safety
training course test scores and reported riding histories)
Behavioral Surveys◦ Quantify and analyze knowledge, attitudes and
behaviors Motorcycle operators/riders Motor vehicle drivers
Patricia Dischinger, Gabriel Ryb, Shiu Ho, Elisa Braver
National Study Center for Trauma & EMSBaltimore, MD
Older riders had a significantly higher incidence of thoracic injury, most notably multiple thoracic injuries (including 3+ rib fractures)
Older riders are more likely to ride larger motorcycles (bigger engine sizes) and wear helmets
Older motorcyclists are more likely to overturn or strike a highway structure (embankments, fences, bridge overpasses, etc)
Large engine sizes were associated with increased risk of head and thoracic injuries, but not abdominal injuries
The magnitude of increased risks related to 1000+cc engine size was higher among older motorcyclists than younger motorcyclists
Patricia Dischinger, Gabriel Ryb, Shiu Ho,Cynthia Burch
Older riders more likely to wear helmets and ride motorcycles with larger engines
Majority of fatally injured riders died at the scene
Older riders more likely to survive to hospitalization
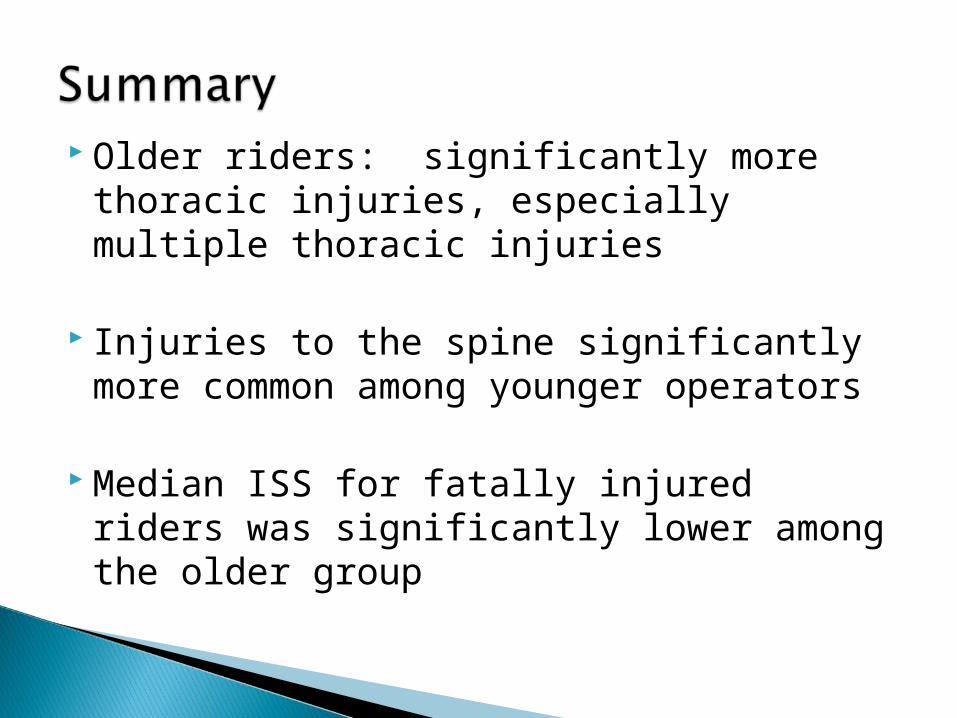
Older riders: significantly more thoracic injuries, especially multiple thoracic injuries
Injuries to the spine significantly more
common among younger operators
Median ISS for fatally injured riders was significantly lower among the older group
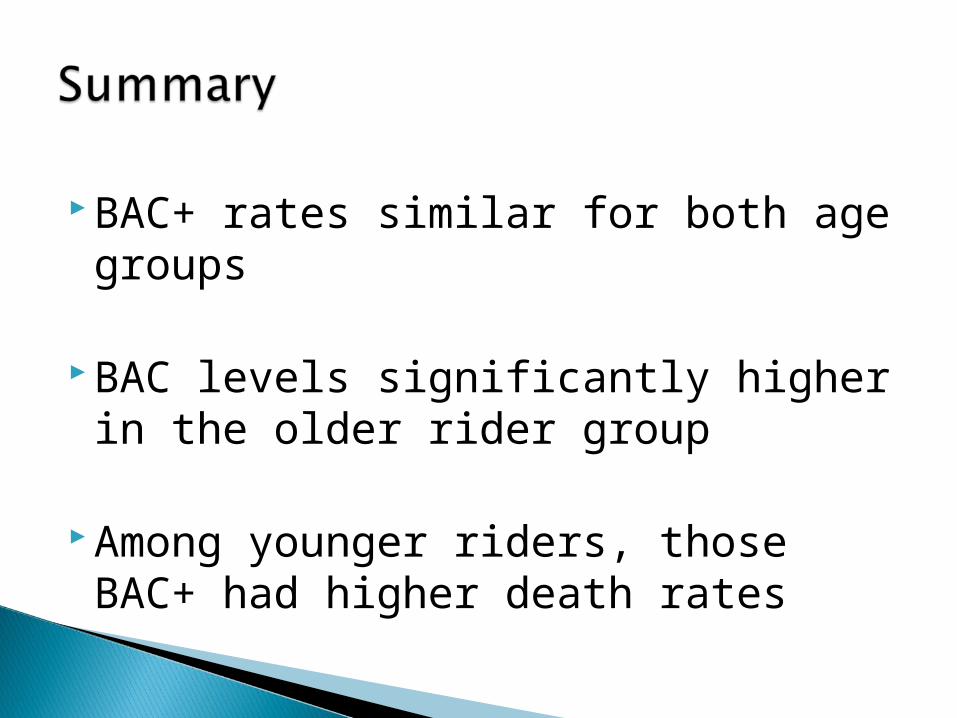
BAC+ rates similar for both age groups
BAC levels significantly higher in the older rider group
Among younger riders, those BAC+ had higher death rates

Maryland Motor Vehicle Administration Maryland Highway Safety Office Maryland State Police Maryland District Court University of Maryland, Baltimore –
National Study Center for Trauma & EMS
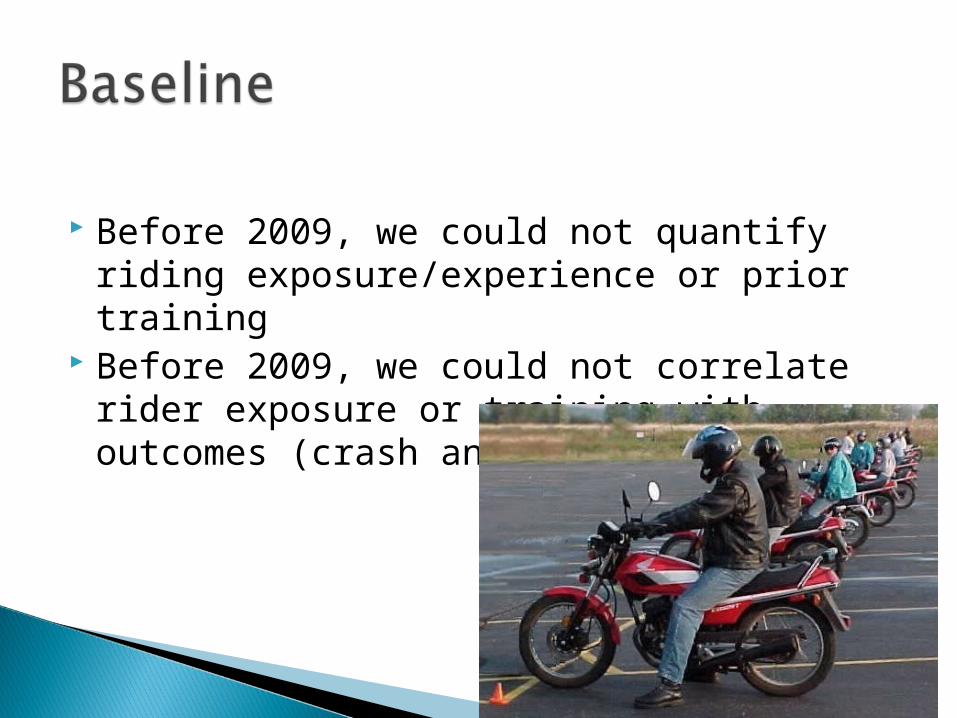
Before 2009, we could not quantify riding exposure/experience or prior training
Before 2009, we could not correlate rider exposure or training with outcomes (crash and citation)
Major components of the program◦ Data collection◦ Data analysis
What we did◦ Instituted new policies at all MVA licensing sites to
collect exposure data
Why we did it the way we did it◦ Motorcycle riding exposure is difficult to capture
VMT not accurate◦ Two methods for getting a motorcycle
endorsement in MD Conventional at MVA center (~3,000/year) Upon completion of training class (~7,000/year)
◦ Two ways to quantify exposure Self-report Odometer readings
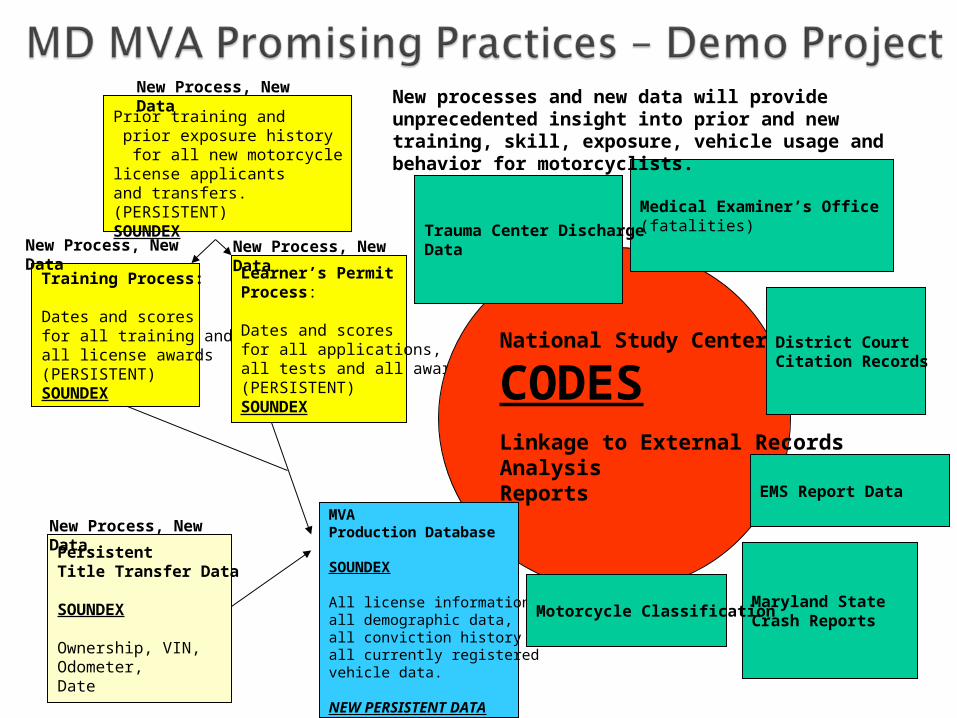
Prior training and prior exposure history for all new motorcycle license applicantsand transfers.(PERSISTENT)SOUNDEX
Training Process:
Dates and scoresfor all training and all license awards(PERSISTENT)SOUNDEX
Learner’s PermitProcess:
Dates and scoresfor all applications,all tests and all awards.(PERSISTENT)SOUNDEX
New Process, New Data
PersistentTitle Transfer Data
SOUNDEX
Ownership, VIN, Odometer, Date
National Study Center
CODESLinkage to External RecordsAnalysisReports
MVA Production Database
SOUNDEX
All license information, all demographic data,all conviction history data,all currently registered vehicle data.
NEW PERSISTENT DATA
Maryland StateCrash Reports
District Court Citation Records
Medical Examiner’s Office(fatalities)Trauma Center Discharge
DataNew Process, New Data
New Process, New Data
New processes and new data will provide unprecedented insight into prior and new training, skill, exposure, vehicle usage and behavior for motorcyclists.
EMS Report Data
New Process, New Data
Motorcycle Classification
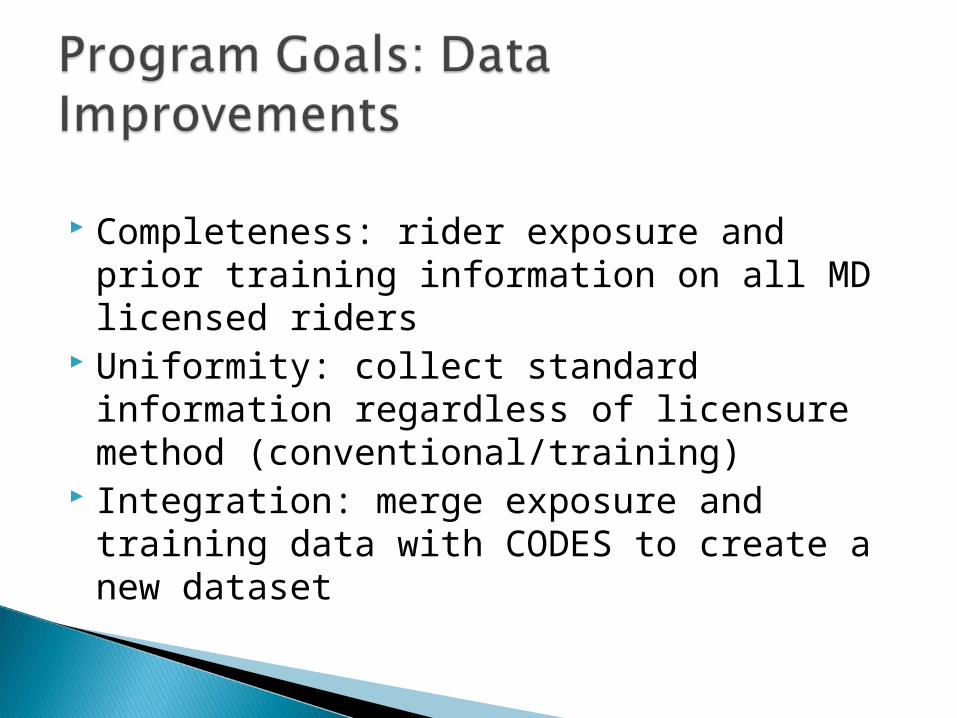
Completeness: rider exposure and prior training information on all MD licensed riders
Uniformity: collect standard information regardless of licensure method (conventional/training)
Integration: merge exposure and training data with CODES to create a new dataset
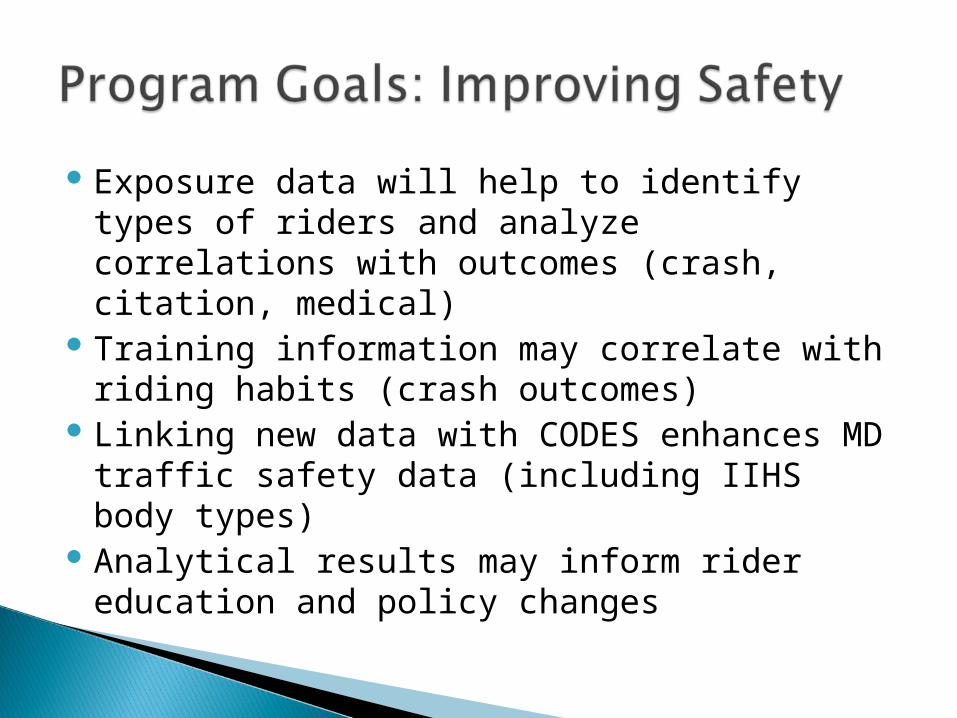
Exposure data will help to identify types of riders and analyze correlations with outcomes (crash, citation, medical)
Training information may correlate with riding habits (crash outcomes)
Linking new data with CODES enhances MD traffic safety data (including IIHS body types)
Analytical results may inform rider education and policy changes
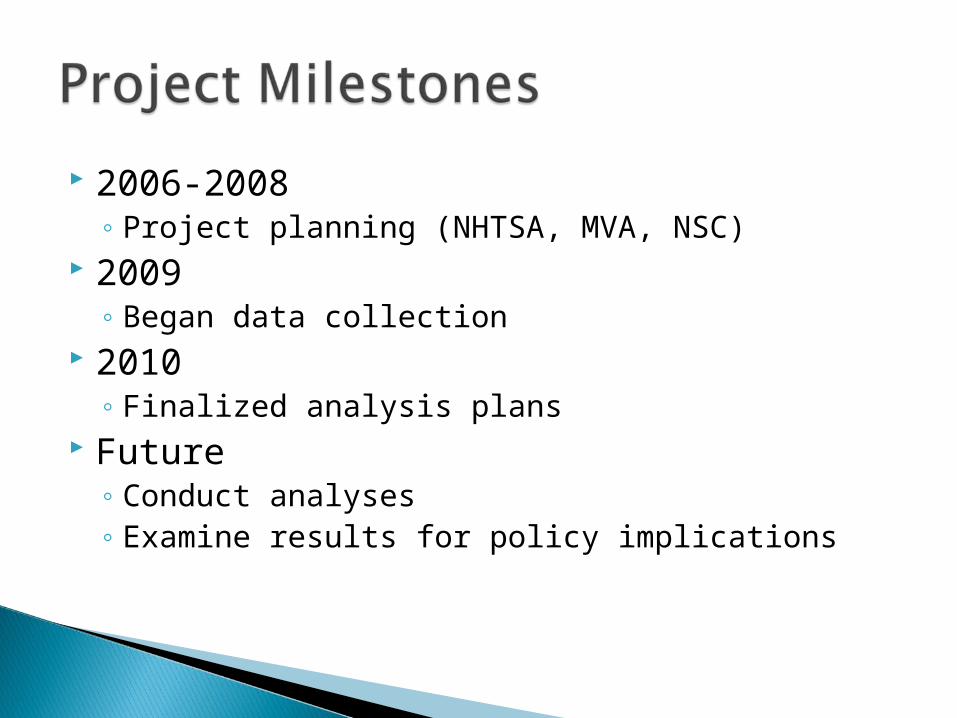
2006-2008◦ Project planning (NHTSA, MVA, NSC)
2009◦ Began data collection
2010◦ Finalized analysis plans
Future ◦ Conduct analyses◦ Examine results for policy implications
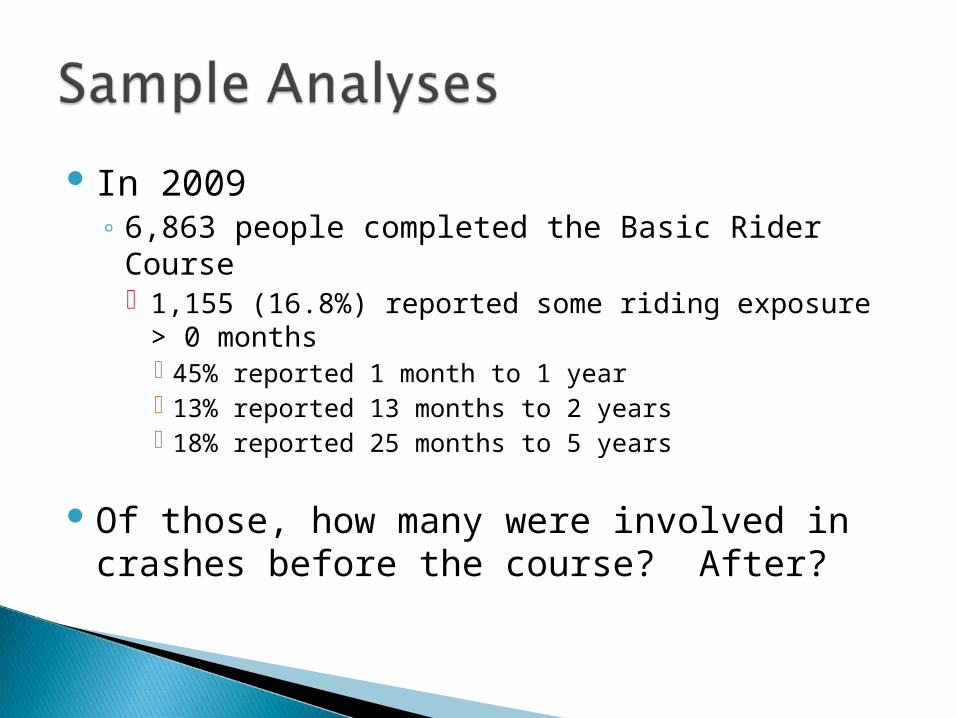
In 2009◦ 6,863 people completed the Basic Rider Course
1,155 (16.8%) reported some riding exposure > 0 months 45% reported 1 month to 1 year 13% reported 13 months to 2 years 18% reported 25 months to 5 years
Of those, how many were involved in crashes before the course? After?
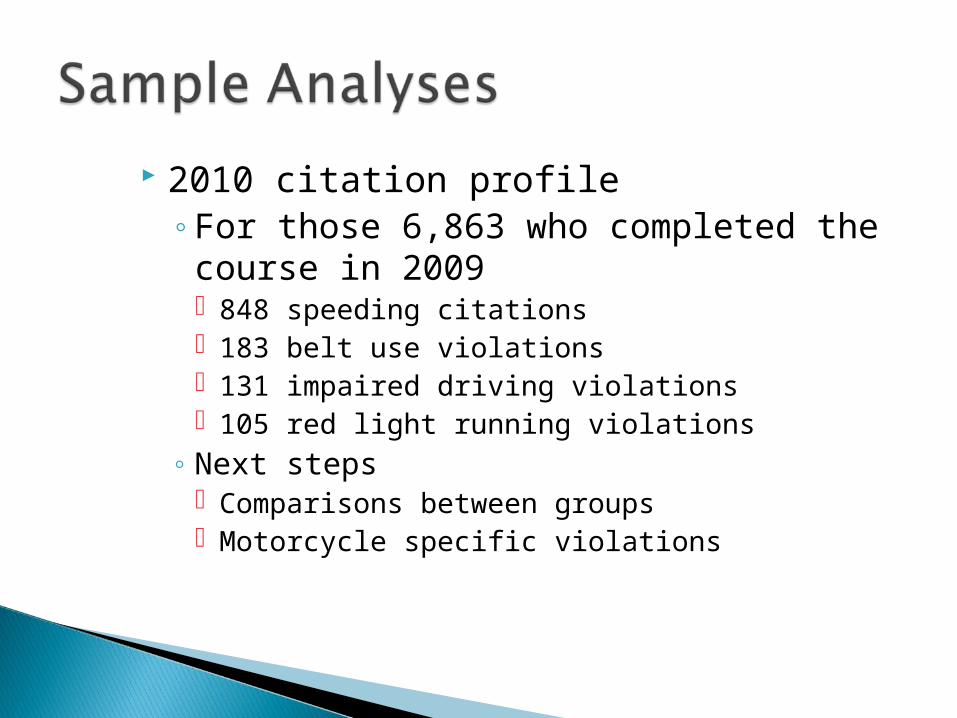
2010 citation profile◦For those 6,863 who completed the
course in 2009 848 speeding citations 183 belt use violations 131 impaired driving violations 105 red light running violations
◦ Next steps Comparisons between groups Motorcycle specific violations
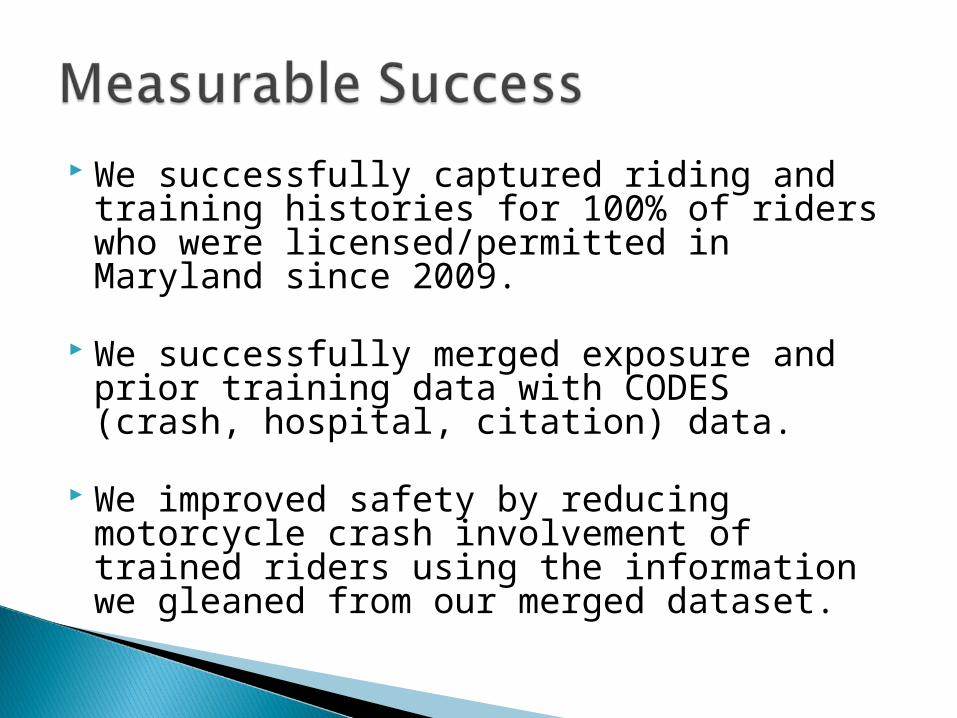
We successfully captured riding and training histories for 100% of riders who were licensed/permitted in Maryland since 2009.
We successfully merged exposure and prior training data with CODES (crash, hospital, citation) data.
We improved safety by reducing motorcycle crash involvement of trained riders using the information we gleaned from our merged dataset.
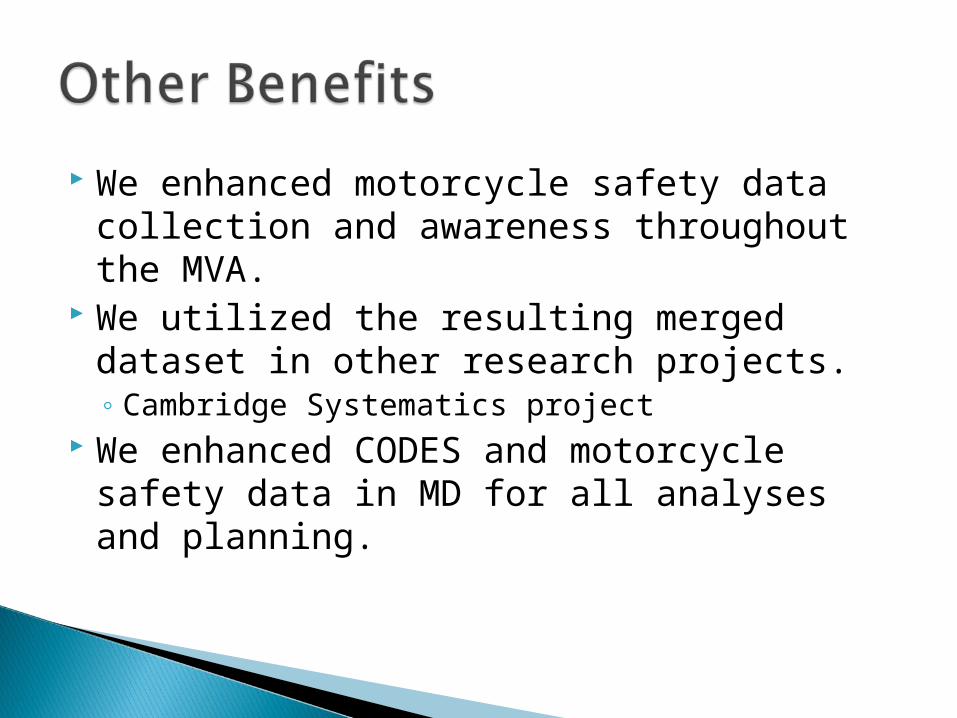
We enhanced motorcycle safety data collection and awareness throughout the MVA.
We utilized the resulting merged dataset in other research projects.◦ Cambridge Systematics project
We enhanced CODES and motorcycle safety data in MD for all analyses and planning.
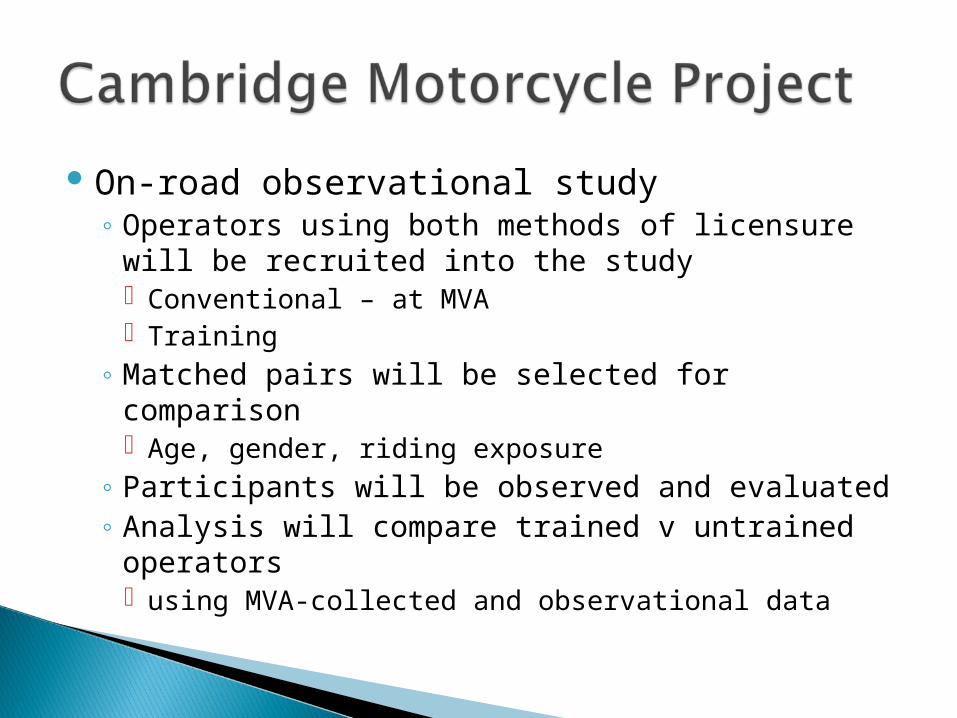
On-road observational study◦ Operators using both methods of licensure will be
recruited into the study Conventional – at MVA Training
◦ Matched pairs will be selected for comparison Age, gender, riding exposure
◦ Participants will be observed and evaluated◦ Analysis will compare trained v untrained
operators using MVA-collected and observational data
This is an innovative idea to address a major gap in traffic safety data (motorcycle exposure).
This project is an example of collaboration between numerous state agencies.
This project involved a comprehensive implementation throughout Maryland.
The resulting dataset provides a wealth of analysis possibilities for MD and motorcycle safety in general.

Recent Efforts and Outputs
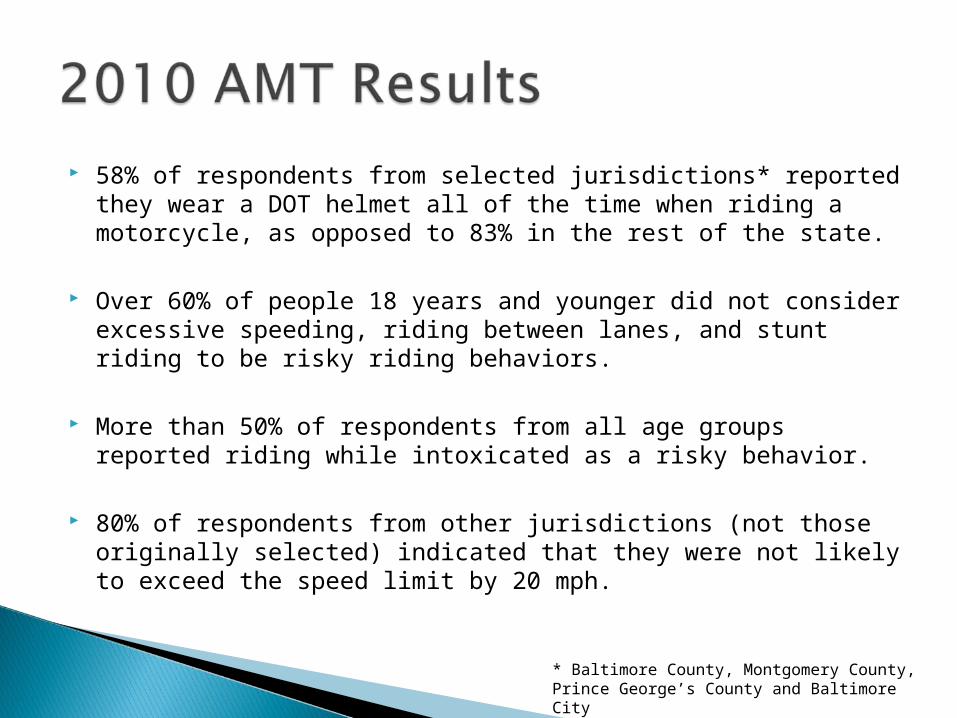
58% of respondents from selected jurisdictions* reported they wear a DOT helmet all of the time when riding a motorcycle, as opposed to 83% in the rest of the state.
Over 60% of people 18 years and younger did not consider excessive speeding, riding between lanes, and stunt riding to be risky riding behaviors.
More than 50% of respondents from all age groups reported riding while intoxicated as a risky behavior.
80% of respondents from other jurisdictions (not those originally selected) indicated that they were not likely to exceed the speed limit by 20 mph.
* Baltimore County, Montgomery County, Prince George’s County and Baltimore City
31
6877
70
59
25
63 66 6253
38
71 7364
47
63
8676 73
53
0102030405060708090
100
≤18 19-24 25-44 45-64 65+
%
Age
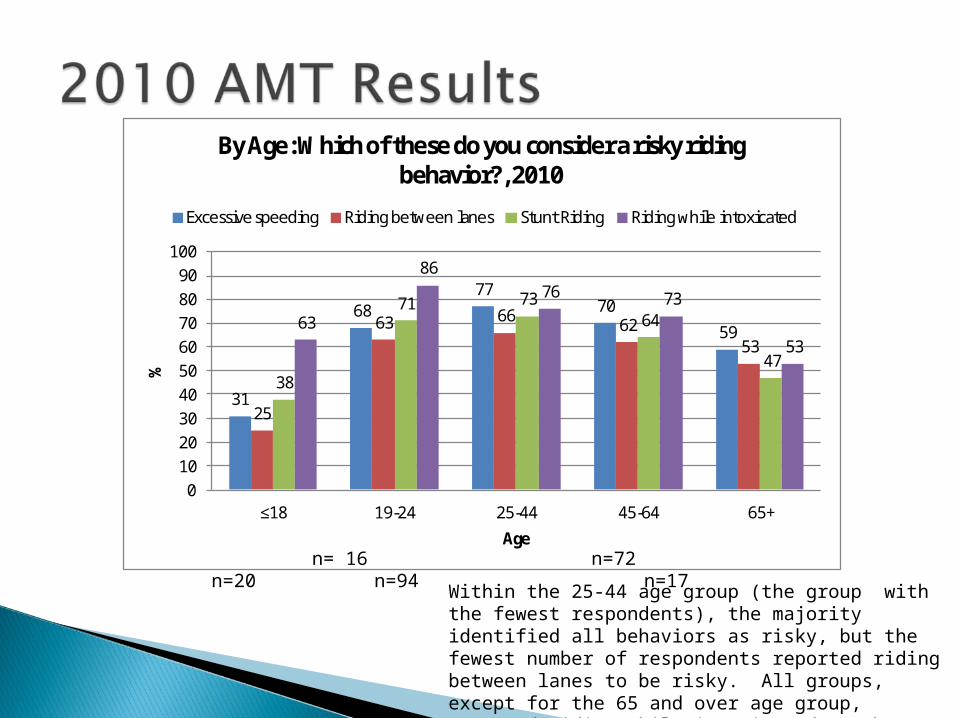
By Age: Which of these do you consider a risky riding behavior?, 2010
Excessive speeding Riding between lanes Stunt Riding Riding while intoxicated
n= 16 n=72 n=20 n=94 n=17
Within the 25-44 age group (the group with the fewest respondents), the majority identified all behaviors as risky, but the fewest number of respondents reported riding between lanes to be risky. All groups, except for the 65 and over age group, reported riding while intoxicated as the riskiest behavior.
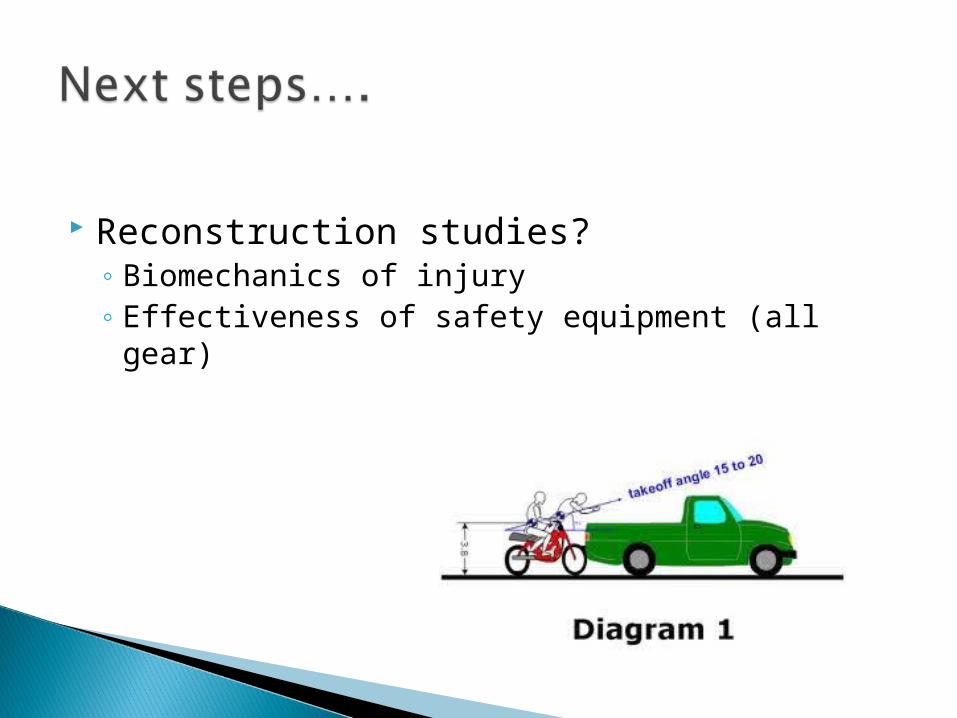
Reconstruction studies?◦ Biomechanics of injury◦ Effectiveness of safety equipment (all gear)
Andrew Krajewski - [email protected]
Maryland Motor Vehicle Administration
Tim Kerns – [email protected] Cindy Burch – [email protected] National Study Center for Trauma & EMS