
Research and climate aspects - sapea.info · Academia Europaea (AE), All European Academies...
98
Science Advice for Policy by European Academies Evidence Review Report No. 2 Novel carbon capture and utilisation technologies Research and climate aspects
Transcript of Research and climate aspects - sapea.info · Academia Europaea (AE), All European Academies...
Science Advice for Policy by European Academies
Evidence Review Report No. 2
Novel carbon capture and
utilisation technologies
Research and climate aspects
SAPEA Evidence Review Report No. 2
Informs the European Commission Group of Chief Scientific Advisors Scientific Opinion No. 4/2018
Novel carbon capture and
utilisation technologies
Research and climate aspects

This Evidence Review Report has been produced under the auspices of the SAPEA Consortium, as a deliverable under Grant Agreement Nr 737432 “Science Advice for Policy by European Academies” (SAPEA) that was signed by the Consortium and the European Commission on 22 November 2016.
The text of this work is licensed under the terms of the Creative Commons Attribution licence which permits unrestricted use, provided the original author and source are credited. The licence is available at: http://creativecommons.org/licenses/by/4.0. Images are not covered by this licence.
This report can be viewed online at: www.sapea.info/CCU
The following experts contributed to the report:
Robert Schlögl (Chair), Fritz-Haber-Institute, GermanyCarlos Abanades, Spanish Research Council, SpainMichele Aresta, CIRCC, University of Bari, ItalyAdisa Azapagic, University of Manchester, United KingdomEdd Anders Blekkan, Norwegian University of Science and Technology, NorwayThibault Cantat, CEA, FranceGabriele Centi, University of Messina, ItalyNeven Duic, University of Zagreb, CroatiaAïcha El Khamlichi, ADEME, FranceGraham Hutchings, Cardiff University, United KingdomMarco Mazzotti (Co-chair), ETH Zürich, SwitzerlandUnni Olsbye, University of Oslo, NorwayHrvoje Mikulcic (invited member), University of Zagreb, Croatia
In accordance with Article 35, paragraph 1 of the aforementioned Grant Agreement, the Consortium identified all relevant interests of the experts requested to contribute to the Evidence Review Report, assessed whether an interest constituted a conflict of interests, and took -where relevant- measures to exclude that an interest could compromise or be reasonably perceived as compromising the impartiality or objectivity of the report.
Further information about SAPEA’s working processes are available at: www.sapea.info/guidelines.
The information, facts and opinions set out in this report are those of the authors and do not necessarily reflect the opinion of the European Commission. The SAPEA Consortium is not responsible for the use which may be made of the information contained in this report by anyone, including the European Union institutions and bodies or any person acting on their behalf.
PDF ISBN 978-3-9819415-5-5 DOI 10.26356/CARBONCAPTURE
Print ISBN 978-3-9819415-4-8 ISSN 2568-4434
SAPEA, Science Advice for Policy by European Academies. (2018). Novel carbon capture and utilisation technologies: research and climate aspects Berlin: SAPEA. doi: 10.26356/CARBONCAPTURE
PUBLISHERSAPEAc/o acatechPariser Platz 4a10117 Berlin | Germany
CONTACTSAPEA Communications Office 13 Rue d’EgmontBrussels 1000 | Belgium [email protected]

Spanning the disciplines of engineering, humanities, medicine, natural sciences and social sciences, SAPEA – Science Advice for Policy by European Academies – brings together outstanding knowledge and expertise from over 100 academies, young academies, and learned societies in over 40 countries across Europe.
SAPEA is part of the European Commission’s Scientific Advice Mechanism (SAM), which provides independent, interdisciplinary, and evidence-based scientific advice on policy issues to the European Commission. SAPEA works closely with the European Commission Group of Chief Scientific Advisors
This Evidence Review Report informed the Group of Chief Scientific Advisors Opinion on Novel carbon capture and utilisation technologies: research and climate aspects, which is available here:
http://ec.europa.eu/research/sam/pdf/sam_ccu_report.pdf
Funded through the EU’s Horizon 2020 programme, the SAPEA consortium comprises Academia Europaea (AE), All European Academies (ALLEA), the European Academies’ Science Advisory Council (EASAC), the European Council of Academies of Applied Sciences, Technologies and Engineering (Euro-CASE), and the Federation of European Academies of Medicine (FEAM).
For further information about SAPEA visit www.sapea.info.
About SAPEA
1

2
Table of Contents
Main Report05 FOREWORD
07 EXECUTIVE SUMMARY
09 CCU REPORT
09 A. Definition of CCU
10 B. The CCU system
11 C. CCU in the context of societal services
11 D. Simplified system analysis of service delivery
12 E. Framework for the assessment of CCU potential opportunities
15 F. Analysis of technology chains
16 G. Innovation needed
17 H. Recommendations for action
Technical Report19 1. PREAMBLE
22 2. INTRODUCTION
22 2.1. Carbon dioxide Capture and Utilisation
22 2.2. General considerations
24 2.3. Assessment of the literature
26 2.4. Data about energy and emissions
28 2.5. Time scale of deployment
31 2.5.1. Temporal resolution
32 2.6. Societal services
32 2.7. Conceptual technology chains
34 3. SYSTEM BOUNDARIES AND SYSTEMS ANALYSIS
34 3.1. Scope of analysis
34 3.2. Climate change mitigation potential
36 3.2.1. Power-to-gas or power-to-liquid CCU systems using fossil sources of CO2
38 3.2.2. Power-to-gas or power-to-liquid CCU systems using renewable sources of CO2
40 3.2.3. Energy storage and/or distribution using CCU fuels
41 3.2.4. Breakthrough technologies using CO2 directly from the atmosphere
41 3.2.5. Manufacture of carbon products from CO2
42 3.3. Other environmental impacts
42 3.4. Cost considerations
44 3.5. Social aspects
45 4. TECHNOLOGY OVERVIEW
45 4.1. Power generation
45 4.1.1. Natural gas
46 4.1.2. Hydrogen
46 4.1.3. Solar power
46 4.1.4. Wind power
47 4.1.5. Hydro power
47 4.2. Mobility3
47 4.2.1. Battery electric vehicles
48 4.2.2. Fuel cell electric vehicles
48 4.2.3. Natural gas vehicles
49 4.2.4. Methanol vehicles
49 4.3. CO2 capture
49 4.3.1. CO2 capture from concentrated point sources (CPS)
50 4.3.2. Direct CO2 capture from air (DAC)
50 4.4. H2 generation
50 4.4.1. Alkaline electrolyser
50 4.4.2. Proton exchange membrane (PEM) electrolyser
52 4.4.3. Solid oxide electrolyser
52 4.5. CO2 conversion
55 5. SIMPLIFIED SYSTEM ANALYSIS OF SERVICE DELIVERY
55 5.1. Technology chains to provide power and mobility services
55 5.1.1. 100% electrification
55 5.1.2. Hydrogen-based system
56 5.1.3. CCU
57 5.1.4. Comparison of alternative technology chains
58 5.2. Carbon fluxes, in the context of power and mobility services
59 5.2.1. Fossil-NG based L
60 5.2.2. Fossil-NG based with Carbon Dioxide Capture and Storage (CCS)
60 5.2.3. CCU for mobility
61 5.2.4. CCU for power generation
61 5.2.5. CCU for both mobility and power generation
62 5.2.6. Comparative assessment
62 5.2.7. Net-zero-emission natural gas-fired power plants
64 5.3. Storage and transport of renewable electricity
69 5.4. Manufacturing of industrial products
69 5.4.1. Alternative technology chains for carbon-bearing chemicals and materials
70 5.4.2. Minimisation of CO2 emissions via conversion
71 6. REQUIRED INNOVATIONS
71 6.1. Systemic aspects
72 6.2. Political boundary conditions
72 6.3. Technical gaps in knowledge
76 7. ASSESSMENT OF POTENTIAL
76 7.1. Methodology
77 7.2. Services and figures of merit
78 7.3. Options for action
79 7.3.1. Option 1
79 7.3.2. Option 2
80 7.3.3. Option 3
81 7.3.4. Concluding remarks
82 8. LITERATURE
89 9. GLOSSARY OF SELECTED ABBREVIATIONS
91 10. WORKING GROUP MEMBERS
92 11. ACKNOWLEDGEMENTS
93 ANNEX: BACKGROUND TO THE REPORT
4
Foreword
As the effects of climate change are becoming more visible, technologies for mitigating these effects are being sought. Do Carbon Capture and Utilisation (CCU) technologies have the potential to contribute significantly to such mitigation efforts? These technologies aim to extract CO2 either from concentrated sources such as the chimneys at coal- or natural gas-fired power stations, steel mills or cement factories or directly from the ambient air, and then use it as a raw material for carbon-containing products, such as fuels, chemical products, and building materials. At the same time, carbon dioxide is a notoriously inert molecule and conversion processes can be a highly energy intensive process and it is therefore crucial that this energy comes from carbon-free sources. This is the framework within which this report discusses CCU.
Commissioner Miguel Arias Cañete (Climate Action & Energy) asked Carlos Moedas, Commissioner for Research, Science and Innovation to entrust the new Scientific Advice Mechanism and its scientific and engineering networks of European academies with the mandate of exploring the potential of CCU and provide a scientific opinion on the challenges and opportunities of novel carbon capture and utilisation technologies, thereby providing a direct link between scientific expertise and policy makers in the European Commission.
SAPEA set up an international Working Group of experts in the various domains concerned (energy systems, economy, chemistry, catalysis, electrolysis, etc.) that provided the necessary specialist knowledge about the concerned subjects. Euro-CASE was assigned the role of Lead Network in this project, acting as project manager to ensure high quality and timely outputs.
SAPEA is particularly indebted to the individual members of the Working Group and their unabated commitment to making the present body of knowledge and what it can tell us about potential future developments, supported by scientific and technological
Novel carbon capture and utilisation technologies: research and climate aspects – a presentation of the results from the SAPEA Working Group
5

advances, available to policy-makers. Special thanks go to Robert Schlögl, the Working Group Chair, and Marco Mazzotti, his Deputy, for presenting this knowledge in this report.
SAPEA, and in particular the Lead Academy Euro-CASE would like to thank the Group of Chief Scientific Advisors and the SAM Unit for their collaboration and continued support. The Scientific Opinion of the Group of Chief Scientific Advisors is based on this Evidence Review Report and, in order to broaden the evidence provided, on two workshops that were organised in addition to the Working Group: an External Expert Workshop (25 January 2018) and a Stakeholder Hearing (20 February 2018)
With this report, we hope to have contributed to far-reaching and visionary policy making in the field of CO2 management, energy, and climate action.
On behalf of SAPEA, we thank all those involved in bringing this project to completion, and particularly the individual members of the Working Group for their unrelenting commitment.
Prof. Bernard Charpentier,Chairman of SAPEA and President of FEAM
Prof. Reinhard Hüttl,SAPEA Board member and President of Euro-CASE
6
Executive Summary
This report aims, within the framework provided by the SAM/HLG Scoping Paper, to assess the climate mitigation potential of Carbon Capture and Utilisation (CCU), which is defined as “those technologies that use CO2 as a feedstock and convert it into value-added products such as fuels, chemicals or building materials”.
From a system perspective, CCU involves a number of steps, from capture of CO2 to its conversion into usable C-rich products, from the use of such products to their disposal as C-rich waste, and ultimately, CO2 re-emission – which may happen shortly after CO2 conversion (e.g. for synthetic fuels), or much later (e.g. for polymers). To power the CO2 capture and transformation processes and – in most cases – the synthesis of green-hydrogen as a co-reactant, C-free energy is needed. These processes consist of building blocks that also belong to other technology chains of interest for climate mitigation. As a consequence, CCU’s climate mitigation potential needs to be assessed from a systems perspective, and with regards to how it can provide societal services. These are defined here as (i) power generation and distribution through the grid, (ii) fuels (and power) for transport and mobility, (iii) long-term storage and long-range transport of intermittent renewable energies; and (iv) manufacturing of industrial products.
The report offers a simplified system analysis of service delivery, which highlights a few key features. 1) Using C-rich synthetic fuels requires the use of large amounts of Renewable Energy Sources (RES) and other carbon-free energies – much larger than what is required when RES electricity or green-hydrogen is used directly for consumption. 2) Such a decrease in efficiency in the use of RES may be acceptable in the provision of: a) C-rich synthetic fuels to power long-range aircraft and long-haul ships; and/or b) long-term storage and long-range transport of defossilised energy to compensate for the intermittency of RES. 3) For such uses, CCU-based solutions should be assessed in comparison with other alternative technologies that are beyond the scope of this report.
To consider the potential opportunities offered by CCU to European industries in supporting (i) climate change objectives, (ii) a circular economy, (iii) energy security and deployment of RES; and (iv) the evolution of CO2 capture systems, the report has defined an assessment framework. Such a framework identifies nine technology chains with respect to the generation and use of C-rich fuels and classifies them (according to a few first-order simplifying assumptions), based on whether they generate positive, net-zero, or negative CO2 emissions.
From the analysis of these technology chains, some key conclusions can be drawn: CCU may be part of a circular economy scheme where carbon atoms are recycled and re-used indefinitely over a long time scale. However, it is neither an indispensable element, nor is it sufficient, for a circular economy. True circular schemes are enabled
7
only when the CO2 generated from burning recycled synthetic (defossilised) fuel in centralised plants or in distributed facilities is again captured from the flue gas (post-combustion capture) or from the ambient atmosphere (direct air capture). CCU is not part of any negative emission technology chain, whereas CO2 capture is; the pros and cons of using biomass instead of fossil-C or of converted CO2 can be highlighted in the context of this analysis. Such analysis can also offer clear guidelines for a methodology that enables the assessment of the opportunities ((i) to (iv) above) emerging from the introduction of a set of new technology solutions, and which should be preliminary to a full Life-Cycle Assessment (LCA).
The report identifies a need for innovation in at least three domains. Firstly, from a policy perspective: measures, regulations and incentives should examine the energy system – including CCU – in a holistic, integrated, coordinated and transparent manner. Secondly, from a systemic perspective: such an approach is required when evaluating the energy system and its CCU sub-systems; further development is needed here, both in terms of stakeholder awareness and of consistent definitions of system boundaries and of reference datasets. Finally, from a technology perspective: key technical challenges must be tackled in the areas of: collection and purification of CO2 from different sources, synthesis of green-hydrogen via water splitting powered by RES, and catalytic technologies for reductive activation for CO2 conversion to fuels and chemicals. The report concludes by providing a few recommendations for action, inspired by the analysis and considerations above.
8
CCU Report
The present report on “Novel carbon capture and utilisation (CCU) technologies: research and climate aspects” addresses the following two questions posed in the Scoping Paper prepared by the SAM Unit and the Group of Chief Scientific Advisors:
• Under what circumstances CCU for production of fuels, chemicals and materials can deliver climate benefits and what are their total climate mitigation potential in the mid- and long-run?
• How can the climate mitigation potential of CO2 incorporated in products such as fuels, chemicals and materials be accounted for considering that the CO2 will remain bound for different periods of time and then may be released in the atmosphere?
The analysis, on which this report is based, has limited its scope to the technologies and systems that involve C-rich fuels and chemicals, thus considering beyond its scope potential C-free fuels such as ammonia. We assume that the energy needed to make CCU possible (as discussed in detail in the following) is provided by C-free renewable energy sources (RES). Some of these RES, such as solar and wind energy, provide electricity intermittently, and this aspect is discussed in some detail. For the sake of simplicity but without loss of generality, we have not explicitly discussed other C-free energy sources, e.g. geothermal, nuclear, tidal, etc.
The report that follows is accompanied by a more comprehensive technical report, with more information, details and references.
A. DEFINITION OF CCUCCU, Carbon dioxide Capture and Utilisation, has been defined for the scope of this study as “those technologies that use CO2 as a feedstock and convert it into value-added products such as fuels, chemicals or building materials” [SAM Scoping Paper]. Accordingly, when viewed from a system perspective, CO2 capture and utilisation (CCU) is a system consisting of at least four steps:
1 Capture of CO2 from an industrial exhaust stream, or directly from air;
2 Conversion of CO2 to a carbon-rich (C-rich) chemical product (where in most cases the Carbon atom is in a reduced state with respect to its fully oxidised state in the original CO2 molecule);
3 Utilisation of the C-rich product (to deliver a service to society, e.g. by burning the fuel to provide propulsion);
4 Disposal of the carbon atom, either by disposing of the product as such (e.g. in landfill) or by disposing of the relevant decomposition products, typically CO2 again or another greenhouse gas such as methane.
9
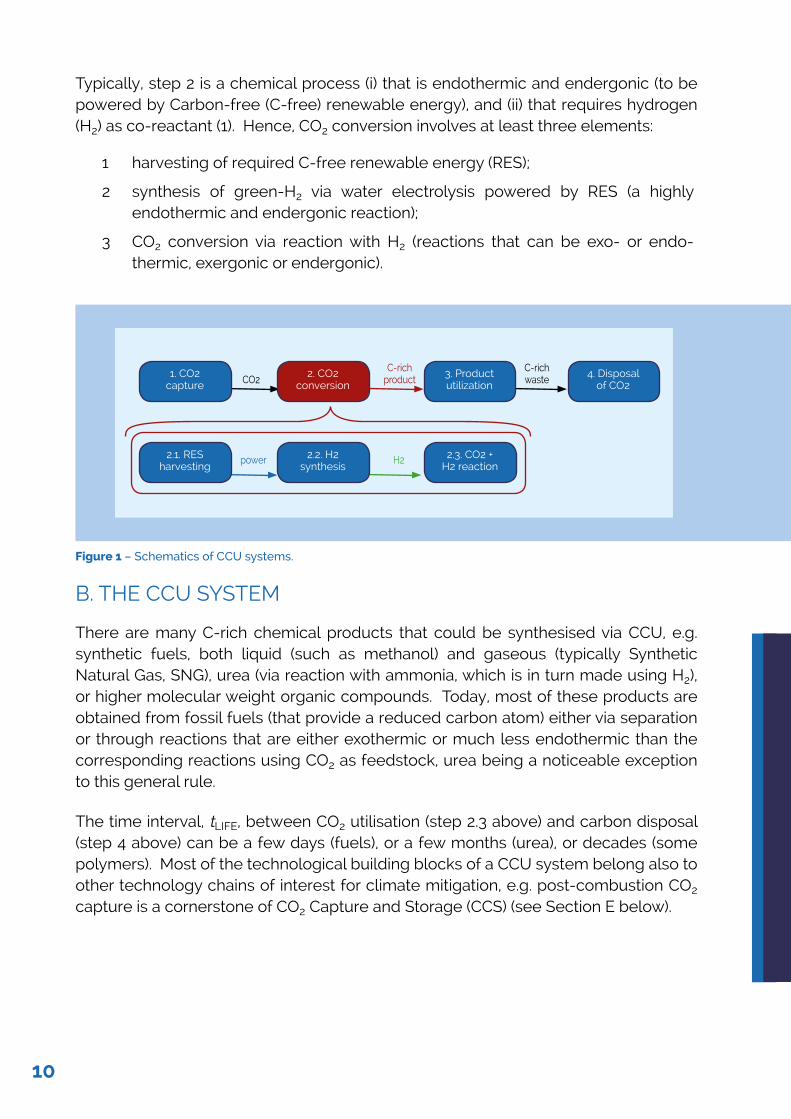
Typically, step 2 is a chemical process (i) that is endothermic and endergonic (to be powered by Carbon-free (C-free) renewable energy), and (ii) that requires hydrogen (H2) as co-reactant (1). Hence, CO2 conversion involves at least three elements:
1 harvesting of required C-free renewable energy (RES);
2 synthesis of green-H2 via water electrolysis powered by RES (a highly endothermic and endergonic reaction);
3 CO2 conversion via reaction with H2 (reactions that can be exo- or endo-thermic, exergonic or endergonic).
Figure 1 – Schematics of CCU systems.
B. THE CCU SYSTEM
There are many C-rich chemical products that could be synthesised via CCU, e.g. synthetic fuels, both liquid (such as methanol) and gaseous (typically Synthetic Natural Gas, SNG), urea (via reaction with ammonia, which is in turn made using H2), or higher molecular weight organic compounds. Today, most of these products are obtained from fossil fuels (that provide a reduced carbon atom) either via separation or through reactions that are either exothermic or much less endothermic than the corresponding reactions using CO2 as feedstock, urea being a noticeable exception to this general rule.
The time interval, tLIFE, between CO2 utilisation (step 2.3 above) and carbon disposal (step 4 above) can be a few days (fuels), or a few months (urea), or decades (some polymers). Most of the technological building blocks of a CCU system belong also to other technology chains of interest for climate mitigation, e.g. post-combustion CO2 capture is a cornerstone of CO2 Capture and Storage (CCS) (see Section E below).
CO2
power H2
C-rich product
C-rich waste
2.1. RES harvesting
2.2. H2 synthesis
2.3. CO2 +H2 reaction
1. CO2capture
3. Product utilization
2. CO2 conversion
4. Disposal of CO2
10
C. CCU IN THE CONTEXT OF SOCIETAL SERVICES
The potential climate benefits of CCU can be placed in the context of four societal services that can be provided by different energy carriers, through technology chains that may or may not include CCU:
i power generation and distribution through the grid;ii fuels (and power) for transport and mobility;iii storage and transport of renewable energies, to cope with their intermittency;iv manufacturing of industrial products.
Possible energy carriers are, for simplicity, electrons (i.e. electricity), hydrogen and C-rich synthetic fuel (gaseous or liquid).
We present an unbiased comparison of the different options and technology chains, based on a rigorous system analysis within well-specified system boundaries. In doing this, we have utilised five criteria, namely:
1 efficiency in the use of energy, particularly of carbon-free renewable energy;2 carbon fluxes, with reference to CO2 emissions first, as well as to consumption of
fossil-carbon resources and to occupation of sub-surface CO2 storage space;3 environmental impact, on top of those considered within criterion 2;4 costs, including operational and capital costs, as well as financing schemes;5 societal perception and political feasibility.
D. SIMPLIFIED SYSTEM ANALYSIS OF SERVICE DELIVERY
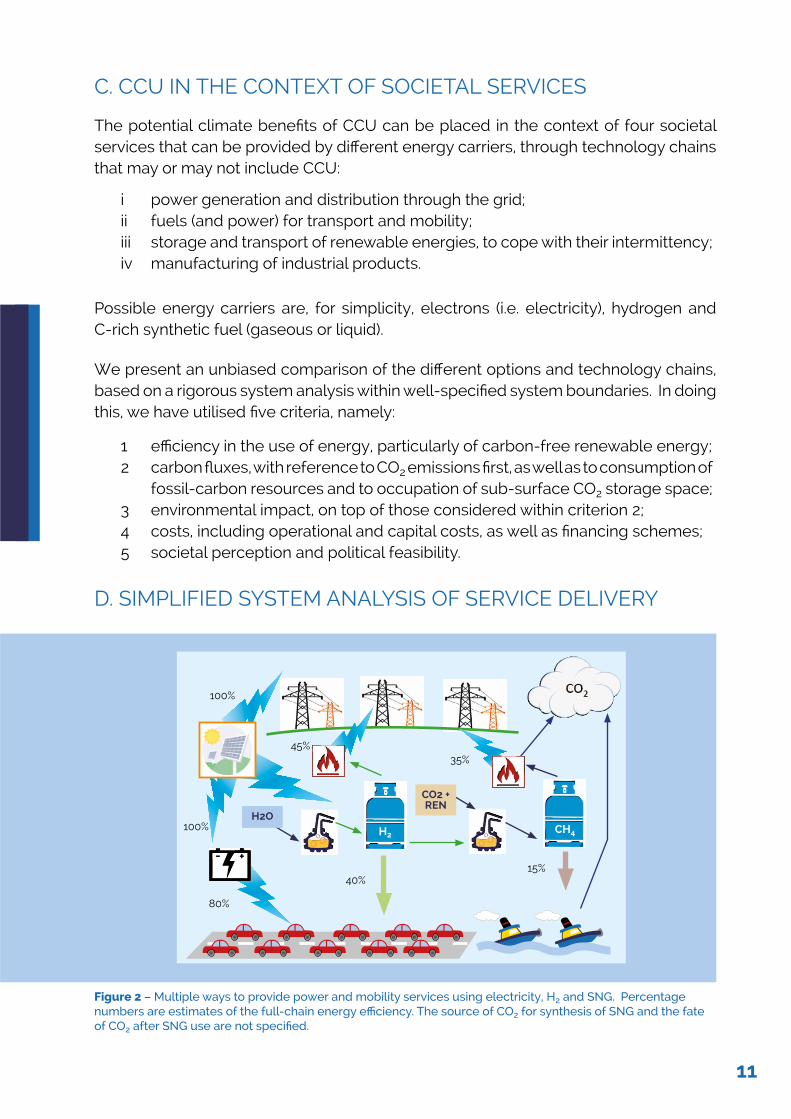
Figure 2 – Multiple ways to provide power and mobility services using electricity, H2 and SNG. Percentage numbers are estimates of the full-chain energy efficiency. The source of CO2 for synthesis of SNG and the fate of CO2 after SNG use are not specified.
35%45%
100%
100%
15%40%
H2O
CO2 + REN
80%
CH4H2
11
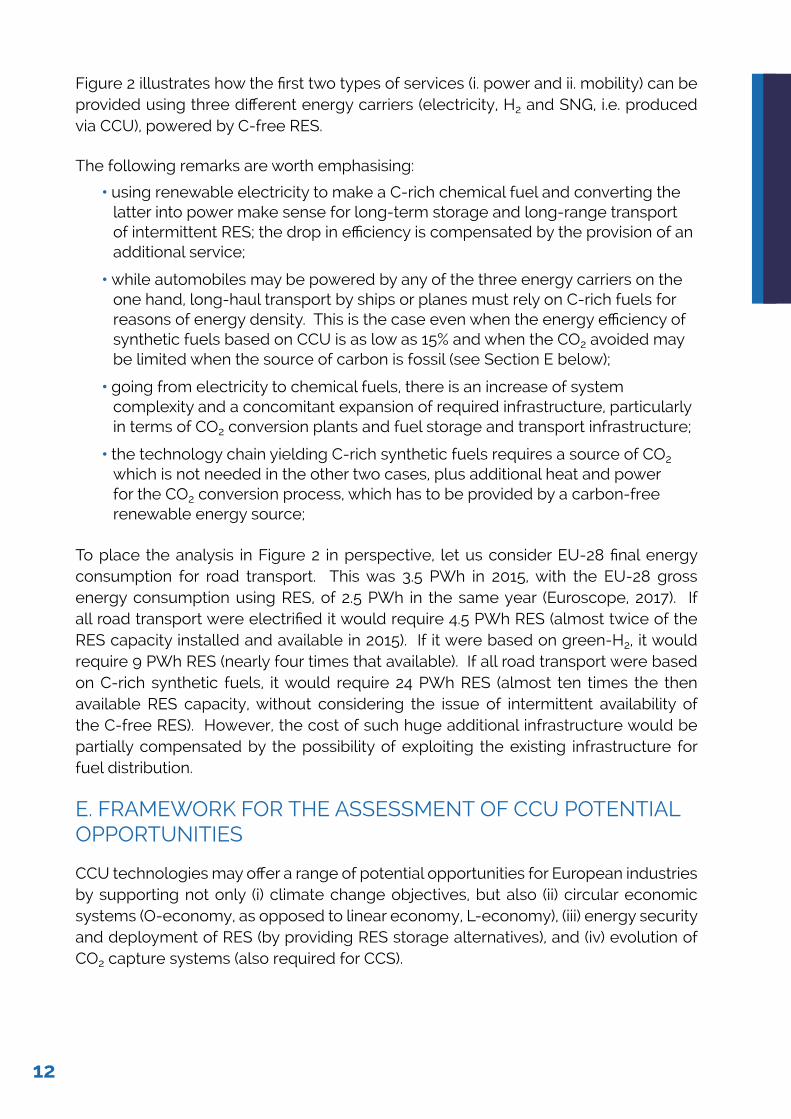
Figure 2 illustrates how the first two types of services (i. power and ii. mobility) can be provided using three different energy carriers (electricity, H2 and SNG, i.e. produced via CCU), powered by C-free RES.
The following remarks are worth emphasising:
• using renewable electricity to make a C-rich chemical fuel and converting the latter into power make sense for long-term storage and long-range transport of intermittent RES; the drop in efficiency is compensated by the provision of an additional service;
• while automobiles may be powered by any of the three energy carriers on the one hand, long-haul transport by ships or planes must rely on C-rich fuels for reasons of energy density. This is the case even when the energy efficiency of synthetic fuels based on CCU is as low as 15% and when the CO2 avoided may be limited when the source of carbon is fossil (see Section E below);
• going from electricity to chemical fuels, there is an increase of system complexity and a concomitant expansion of required infrastructure, particularly in terms of CO2 conversion plants and fuel storage and transport infrastructure;
• the technology chain yielding C-rich synthetic fuels requires a source of CO2 which is not needed in the other two cases, plus additional heat and power for the CO2 conversion process, which has to be provided by a carbon-free renewable energy source;
To place the analysis in Figure 2 in perspective, let us consider EU-28 final energy consumption for road transport. This was 3.5 PWh in 2015, with the EU-28 gross energy consumption using RES, of 2.5 PWh in the same year (Euroscope, 2017). If all road transport were electrified it would require 4.5 PWh RES (almost twice of the RES capacity installed and available in 2015). If it were based on green-H2, it would require 9 PWh RES (nearly four times that available). If all road transport were based on C-rich synthetic fuels, it would require 24 PWh RES (almost ten times the then available RES capacity, without considering the issue of intermittent availability of the C-free RES). However, the cost of such huge additional infrastructure would be partially compensated by the possibility of exploiting the existing infrastructure for fuel distribution.
E. FRAMEWORK FOR THE ASSESSMENT OF CCU POTENTIAL OPPORTUNITIES
CCU technologies may offer a range of potential opportunities for European industries by supporting not only (i) climate change objectives, but also (ii) circular economic systems (O-economy, as opposed to linear economy, L-economy), (iii) energy security and deployment of RES (by providing RES storage alternatives), and (iv) evolution of CO2 capture systems (also required for CCS).
12
Figure 3 – Schematic description of two generic functional units receiving C-rich and C-free feedstock, delivering a service and producing C-free waste and CO2.
The assessment of such opportunities calls for a CCU system analysis that goes beyond the energy efficiency comparison summarised in Section D, to focus on the C-bearing species and consider different ways of providing reduced Carbon-rich products, using them, and handling the CO2-associated waste either by disposal or reuse.
We have carried out a comprehensive analysis by considering: two generic functional units; a few process units; three sources of reduced carbon (fossil, synthetic and biogenic); a generic C-free RES; and CO2, both as a process stream and in the atmosphere. As shown in Figure 3, each functional unit utilises a reduced C-rich feedstock and a C-free resource to generate products that provide a service; in doing this both a C-free and a C-rich waste are generated. The different elements of each functional unit can be either coupled in space and time or completely decoupled, whereby the use of the C-rich feedstock (reduced carbon) and the generation of the C-rich waste (CO2) are separated by the specific product’s lifetime, tLIFE. The two types of functional unit differ in whether CO2 is formed in a centralised facility (power plant, industrial plant, incinerator with CO2 capture, large scale industrial boiler and so on), which can be equipped with a CO2 capture unit, or it is generated in a distributed manner (cars, buildings, airplanes, urea synthesis, incinerator without CO2 capture, and so on), where CO2 emission to the atmosphere cannot be avoided.
As shown in Figure 4, this results in nine possible technology chains, labelled 1 to 9, with schemes 1 and 7 consisting of two sub-schemes. These chains are grouped into categories according to their net CO2 emissions (positive, net-zero or negative), as determined by making a set of simplifying assumptions:
• the post-combustion CO2 capture rate is 100%;
• the yield and selectivity of CO2 conversion reactions are 100%;
• the biomass treatment plant has 100% yield;
• use of biomass to generate bio-energy is carbon neutral;
• CO2 conversion and DAC are powered by C-free RES.
C-free waste
C-free productC-free resources (materials and/or
energy)
C-rich productC-rich feedstock
(reduced C)
C-free waste
SERVICE
CO2CO2
processing utilization
Functional unit 1: C-use and centralized CO2 emissions
Functional unit 2: C-use and distributed CO2 emissions
13
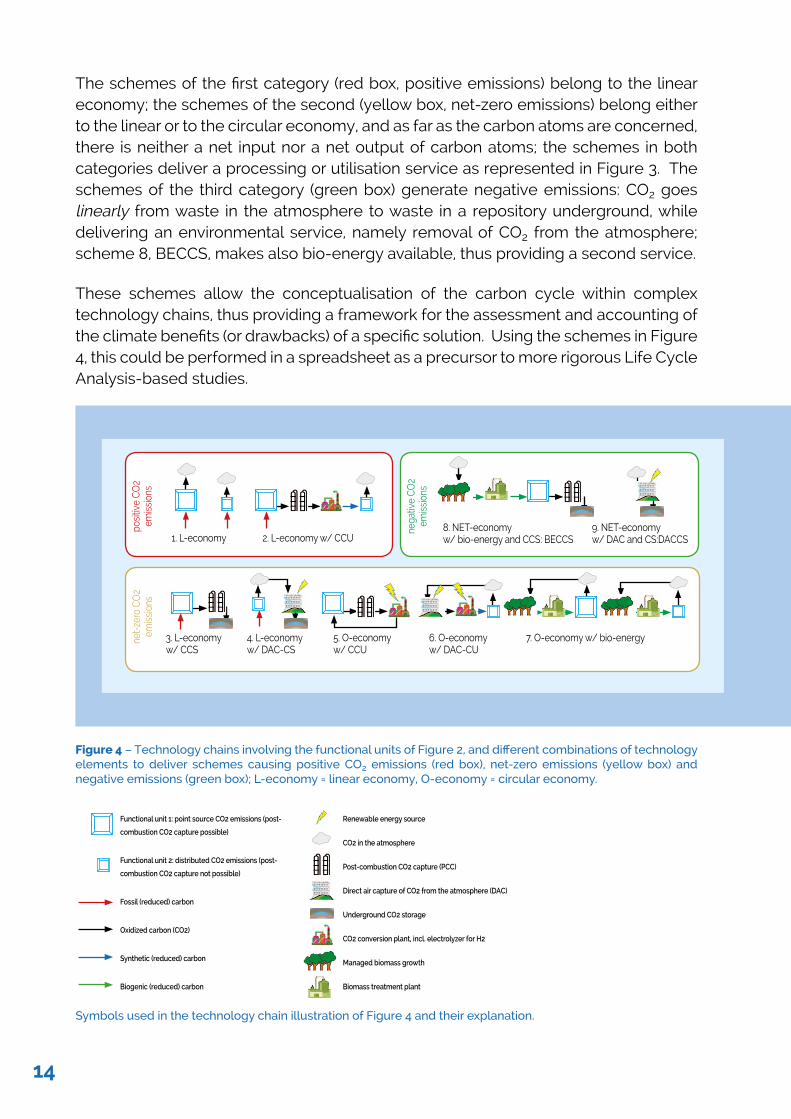
The schemes of the first category (red box, positive emissions) belong to the linear economy; the schemes of the second (yellow box, net-zero emissions) belong either to the linear or to the circular economy, and as far as the carbon atoms are concerned, there is neither a net input nor a net output of carbon atoms; the schemes in both categories deliver a processing or utilisation service as represented in Figure 3. The schemes of the third category (green box) generate negative emissions: CO2 goes linearly from waste in the atmosphere to waste in a repository underground, while delivering an environmental service, namely removal of CO2 from the atmosphere; scheme 8, BECCS, makes also bio-energy available, thus providing a second service.
These schemes allow the conceptualisation of the carbon cycle within complex technology chains, thus providing a framework for the assessment and accounting of the climate benefits (or drawbacks) of a specific solution. Using the schemes in Figure 4, this could be performed in a spreadsheet as a precursor to more rigorous Life Cycle Analysis-based studies.
Figure 4 – Technology chains involving the functional units of Figure 2, and different combinations of technology elements to deliver schemes causing positive CO2 emissions (red box), net-zero emissions (yellow box) and negative emissions (green box); L-economy = linear economy, O-economy = circular economy.
Symbols used in the technology chain illustration of Figure 4 and their explanation.
nega
tive
CO2
emis
sion
s
posi
tive
CO2
emis
sion
sne
t-ze
ro C
O2
emis
sion
s
1. L-economy
3. L-economy w/ CCS
4. L-economy w/ DAC-CS
5. O-economy w/ CCU
6. O-economy w/ DAC-CU
7. O-economy w/ bio-energy
8. NET-economy w/ bio-energy and CCS: BECCS
9. NET-economy w/ DAC and CS:DACCS2. L-economy w/ CCU
Functional unit 1: point source CO2 emissions (post-
combustion CO2 capture possible)
Functional unit 2: distributed CO2 emissions (post-
combustion CO2 capture not possible)
Fossil (reduced) carbon
Oxidized carbon (CO2)
Synthetic (reduced) carbon
Biogenic (reduced) carbon
Renewable energy source
CO2 in the atmosphere
Post-combustion CO2 capture (PCC)
Direct air capture of CO2 from the atmosphere (DAC)
Underground CO2 storage
CO2 conversion plant, incl. electrolyzer for H2
Managed biomass growth
Biomass treatment plant
14
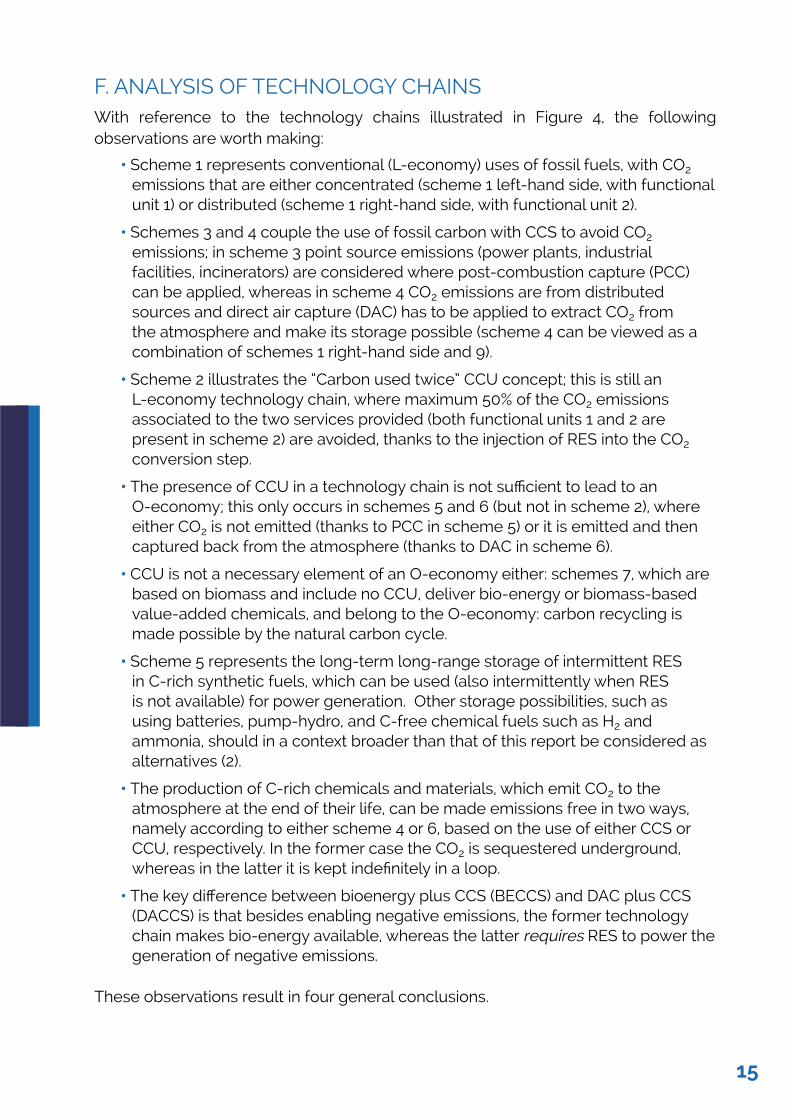
F. ANALYSIS OF TECHNOLOGY CHAINS With reference to the technology chains illustrated in Figure 4, the following observations are worth making:
• Scheme 1 represents conventional (L-economy) uses of fossil fuels, with CO2 emissions that are either concentrated (scheme 1 left-hand side, with functional unit 1) or distributed (scheme 1 right-hand side, with functional unit 2).
• Schemes 3 and 4 couple the use of fossil carbon with CCS to avoid CO2 emissions; in scheme 3 point source emissions (power plants, industrial facilities, incinerators) are considered where post-combustion capture (PCC) can be applied, whereas in scheme 4 CO2 emissions are from distributed sources and direct air capture (DAC) has to be applied to extract CO2 from the atmosphere and make its storage possible (scheme 4 can be viewed as a combination of schemes 1 right-hand side and 9).
• Scheme 2 illustrates the “Carbon used twice” CCU concept; this is still an L-economy technology chain, where maximum 50% of the CO2 emissions associated to the two services provided (both functional units 1 and 2 are present in scheme 2) are avoided, thanks to the injection of RES into the CO2 conversion step.
• The presence of CCU in a technology chain is not sufficient to lead to an O-economy; this only occurs in schemes 5 and 6 (but not in scheme 2), where either CO2 is not emitted (thanks to PCC in scheme 5) or it is emitted and then captured back from the atmosphere (thanks to DAC in scheme 6).
• CCU is not a necessary element of an O-economy either: schemes 7, which are based on biomass and include no CCU, deliver bio-energy or biomass-based value-added chemicals, and belong to the O-economy: carbon recycling is made possible by the natural carbon cycle.
• Scheme 5 represents the long-term long-range storage of intermittent RES in C-rich synthetic fuels, which can be used (also intermittently when RES is not available) for power generation. Other storage possibilities, such as using batteries, pump-hydro, and C-free chemical fuels such as H2 and ammonia, should in a context broader than that of this report be considered as alternatives (2).
• The production of C-rich chemicals and materials, which emit CO2 to the atmosphere at the end of their life, can be made emissions free in two ways, namely according to either scheme 4 or 6, based on the use of either CCS or CCU, respectively. In the former case the CO2 is sequestered underground, whereas in the latter it is kept indefinitely in a loop.
• The key difference between bioenergy plus CCS (BECCS) and DAC plus CCS (DACCS) is that besides enabling negative emissions, the former technology chain makes bio-energy available, whereas the latter requires RES to power the generation of negative emissions.
These observations result in four general conclusions.
15
• When evaluating the impact of a new technology solution in terms of the four potential opportunities summarized at the beginning of Section E, the following steps should be made:
1 the whole technology chain to which the new technology solution belongs should be described and identified as one of the schemes illustrated in Figure 4;
2 such description should include the source of C-free RES, the source of CO2 and of other chemicals needed, the product generated and its typical tLIFE;
3 accordingly, material and energy balances around the system boundaries defined in Figure 4 should be calculated, using the best estimates from the literature;
4 additionally, infrastructure needed and land use (for biomass growth and DAC) associated to the scheme of interest should be estimated from the literature;
5 the current and projected scale of the new technology solution should be estimated and the relevant assumptions articulated.
• Since some of the schemes in Figure 4, including all that involve CCU, require C-free RES, care must be taken in assuming that such RES is indeed CO2 emissions free. LCA analyses have shown that C-free RES can have a non-zero carbon footprint (3). Additionally, the carbon footprint of the current energy mix might be reduced more substantively if the RES utilised for CCU were alternatively used to replace other sources (4).
• Figure 4 clearly shows how various combinations of CO2 capture, recycling, and storage technologies can enable both O- and NET-economy schemes.
• A full LCA analysis is needed to support the conclusions of the preliminary assessment based on the simplified methodology described in the first bullet point of this list; this is also needed to determine how the possible CO2-emission benefits should be allocated to the different stakeholders involved in the complex technology chain selected (1).
G. REQUIRED INNOVATIONS
There are three major areas for innovation, where CCU systems are being looked at with increasing resolution.
1. Political boundary conditions
The system approach required to evaluate the technology chains illustrated in Figure 4 (including their CCU system elements as shown in Figure 1, with their complex and different scales in time and volumes) calls for a system of political measures, regulations and incentives equipped to look at the energy system in a holistic, co-ordinated and transparent manner.
2. Systemic aspects
With reference to Figure 4, it is clear that in terms of CO2 emissions, of efficiency in the use of RES (see Figure 2), and of infrastructure and costs, it is of paramount importance to consider the role of CCU as a subsystem of an energy system aimed at delivering
16
services of different natures under evolving environmental, economic and socio-political constraints. This calls for a systemic approach to CCU as part of a truly sustainable energy system. There are many elements of such systemic approach that need crucial further development, including developing the awareness of such system dimensions among stakeholders (so as to overcome unproductive conflicts, e.g. between CCU-advocates and CCS-proponents), and defining clear and consistent system boundaries as well as reference datasets and assumptions.
3. Technical gaps in knowledge
With reference to Figure 1, the three core technical challenges of CCU subsystems are:
• The collection and purification of CO2 from a variety of sources, where its concentration is very different, namely from 400 ppm in air, to 5% to 14% in flue gases of fossil-fuel fired power plants, to about 40% or more in certain industrial streams. Developments in this area will be beneficial for a variety of technology chains shown in Figure 4 (see also Section F); research and development should address the energy efficiency and intermittent operation of capture processes, as well as CO2 purity after capture.
• The synthesis of “green” hydrogen via water splitting powered by RES, where breakthroughs are needed to make its scale-up technically and economically feasible. Note that “green” hydrogen is a prerequisite also for C-free synthetic fuels such as hydrogen itself and ammonia; hence scientific and technical progress in this area will be beneficial in a broader context than CCU alone.
• The reductive activation catalytic technologies for CO2 conversion to fuels and chemicals, where recent scientific progress in theoretical and experimental aspects opens up opportunities for coupled material and process development.
H. RECOMMENDATIONS FOR ACTION
We have concluded that there is compelling evidence of the need to tackle in a holistic and coordinated manner the science and technology of future defossilised energy systems and of the services that they will provide. By addressing such systems with a systemic approach, the challenges posed and opportunities offered by the CCU subsystems will be naturally highlighted and dealt with. We present the following action list for consideration:
1 Establish an EU technology platform on de-fossilised energy systems, which addresses points 1 and 2 in Section G.
2 Launch a top priority R&D effort on the science and technology enabling the deployment of the future defossilised energy system, including advanced energy storage and transport concepts (C-based or C-free) as well as the technical challenges described in point 3 of Section G.
3 Support the previous two action points by the creation of frameworks and funding schemes for the research, development, piloting and demonstration of the technologies mentioned above, both at the EU level and at the state level.
17
18
1. Preamble
The present document collects scientific evidence for answering the two main questions as formulated in the CCU Scoping paper received from the Group of Chief Scientific Advisors) and SAM Unit
• Under what circumstances CCU for production of fuels, chemicals and materials can deliver climate benefits and what are their total climate mitigation potential in the mid- and long-run?
• How can the climate mitigation potential of CO2 incorporated in products such as fuels, chemicals and materials be accounted for considering that the CO2 will remain bound for different periods of time and then may be released in the atmosphere?
These questions are fundamental to our understanding of the energy transition. It is now well recognised that the services that CCU can deliver within the whole energy system, including as a technology able to provide storage for RES, may be critical for the evolution of energy systems in the medium-term time horizon defined up to 2050. More recently, CCU occurs in the literature as an option for, in particular, the mitigation of unavoidable CO2 emission sources, e.g. aviation and shipping.
Withdrawal of fossil energy from the energy system is the top priority of the energy transition effort. The radical term “decarbonisation”, meaning that all carbon-containing energy vectors should be removed from the energy system, is unlikely to be realistic; there will always be applications in the entire energy system that require carbon atoms to be used (5) and hence demand the continued existence of carbon-containing energy carriers. This does not mean that their CO2 emissions can remain unaccounted for. A cyclic utilisation of carbon and hence a circular carbon economy (6) with no new fossil carbon entering the energy supply chain will be needed. To indicate the prerequisite of removing fossil energy from the energy system rather than all carbon atoms, we use the term “defossilisation” where adequate.
CCU is a flexibilisation measure (6, 7) in an energy system that is rich in intermittent Renewable Energy Sources (RES) and that integrates all sectors of energy consumption
Novel carbon capture and utilisation technologies: research and climate aspects – SAPEA Working Group Technical Report:
19
with a balanced distribution between electric and material energy carriers. The need for carbon (5) in any energy system is then met by a technical carbon cycle (6) of which CCU is one part. The transition to such a system may aim at retaining a maximum of existing technologies and at opting for a replacement of fossil material energy carriers wherever adequate by its synthetic analogue. Such an approach requires a large surplus of RES over an all-electric energy system due to still-inadequate storage capacity and inherent inefficiencies in energy conversion chains. It is clear that other flexibilisation options such as nuclear energy, bioenergy, batteries, some geothermal, thermal storage, storage of hydrogen and demand side management can and will contribute substantially to the stabilisation issue. Intelligent design of energy systems will consider complementarity of the various sources and their competition with CCU, but this is outside the scope of this report. The Working Group (WG) agrees that any CCU scheme using fossil energy sources is counterproductive and must be avoided. The WG further agrees that the application of RES in directly defossilising energy applications is of utmost priority (8).
The WG defines CCU as a series of interconnected technologies that collect CO2 (capture) either directly from the air (direct air capture DAC) or from concentrated point sources or indirectly from using biomass in processes that are assumed to have captured CO2 from the atmosphere in a sustainable way. The use of biomass implies land use issues, water consumption and material cycles for minerals and fertilisers that need assessment in terms of sustainability; the competition of biomass use with food requirements must be avoided. The WG assigns the applications of CCU to the categories “strategic” and “climate-relevant”. Strategic uses replace fossil carbon in chemical and material applications. Climate-relevant uses are large-scale applications where the saving of fossil carbon and the avoidance of CO2 are the drivers. Likewise, bulk transport and seasonal storage of RES are also climate-relevant applications. Although relevant from a technical perspective, the WG has decided to exclude non-carbon energy vectors, such as NH3, to focus on the questions posed.
In the CCU Scoping Paper, it was stated that the WG should abstain from considering uses of CO2 that do not change its chemical structure. Explicitly, uses in enhanced oil recovery (EOR) and applications where CO2 is used as working medium are excluded.
The WG assumes that RES are used for all energy input into CCU. The WG was asked specifically to omit carbon capture and storage (CCS) from its deliberations. The analysis follows to a certain extent this request but occasionally has to refer to it to make clear that CCU and CCS are, despite their complementarity and similarities in designation, two measures with completely different (9) service functions in an energy system, which can be nonetheless analysed in a comparative manner.
The group discussed the reference frames for Life Cycle Analysis (LCA) studies. Despite examples of numerically precise LCA studies about CCU that are referred to in the main text, the WG concluded that numerical accuracy is not useful when making
20
predictions over timescales where technological progress and changing boundary conditions create large uncertainties in the set of assumptions required for LCA. This instrument is, however, most useful when looking at the needs for future technological developments or evaluating the climate mitigation effect of present CCU approaches and determining from there what critical developments will make CCU a valuable contribution to a sustainable energy system. In this way, our distinction of operational modes of CCU was accomplished and the requirement to use only renewable primary energy for CCU was identified. The WG considers the sum of all services that CCU can provide for the energy system of the future as valuable enough to go into a more detailed description of CCU functions. The request also mentions the need to take informed decisions for the funding of research and development activities by the EU. In order to provide insight into this aspect, the group indicates, in a broad way, where innovations are needed in order to effectively implement CCU should it be agreed that it is a valuable and useful tool for climate change mitigation.
Structure of the work
Chapter 2 introduces the concepts of the report and sets out a wider context of energy demand within Europe over geographical, temporal and societal scales.
Chapter 3 of the report defines the system boundaries that have to be considered when analysing different technology chains, which might include CCU or not, to provide the four types of services described in this chapter.
Chapter 4 provides technical information and specifications about the technologies that are the building blocks of the technology chains considered in this chapter as well as in Chapter 5.
Chapter 5 carries out a simplified system analysis of service delivery, based on the technical specifications reported in Section 4 and on the methods presented in Chapter 3.
Chapter 6 presents innovation pathways related to the application of CCU in the context of the services discussed in this report.
Finally, Chapter 7 summarises the report and makes a final assessment of CCU potential in the context of climate mitigation. In that chapter, a matrix representation reported underneath will be used to qualitatively rank the different combinations of service (power, mobility, energy storage and products) and energy carrier, namely carbon-free electricity, hydrogen from renewables (green-hydrogen), synthetic fuels obtained by applying CCU, and current fossil fuels.
21
2. Introduction
2.1 CARBON DIOXIDE CAPTURE AND UTILISATION
CCU, CO2 Capture and Utilisation, is defined for the scope of this study as “those technologies that use CO2 as a feedstock and convert it into value-added products such as fuels chemicals or building materials”. Accordingly, when viewed from a system perspective, CCU is a system consisting of at least four steps:
1 Capture of CO2 from an industrial exhaust stream, or directly from air;
2 Conversion of CO2 to a carbon-rich (C-rich) chemical product (where in most cases the carbon atom is in a reduced state with respect to its fully oxidised state in the original CO2 molecule);
3 Utilisation of the C-rich product to deliver a service to society, e.g. by burning the fuel to provide propulsion;
4 Disposal of the carbon atom, either by disposing of the product as such (e.g. in landfill) or by disposing of the relevant decomposition products, typically CO2 again or another greenhouse gas such as methane.
Typically, step 2 is a chemical process (i) that is endothermic and endergonic, and (ii) that requires hydrogen (H2) as co-reactant (4, 10). Hence, CO2 conversion involves at least three elements:
1 harvesting of required C-free renewable energy (RES);
2 synthesis of green-H2 via water electrolysis powered by RES (a highly endothermic and endergonic reaction);
3 CO2 conversion via reaction with H2 (reactions that can be exo- or endo-thermic, exergonic or endergonic).
2.2 GENERAL CONSIDERATIONSThis concept of using CO2 either as a synthetic building block or as raw material for carbon atoms has a long tradition in chemistry. It was also recognised early on that the hydrogen source must be without a carbon footprint. This is enabled at present largely through electrocatalysis generating hydrogen from water splitting (11, 12). An alternative concept, direct electrochemical reduction of CO2, increases the energy efficiency of the chemical reduction by avoiding the combination and dissociation of H+ + e- (13). The concept of chemical CO2 activation created a large research community (7, 14-22) and brought about a large scientific literature.
22

The seminal paper (23) of Lewis coined the term “artificial photosynthesis” and introduced the concept of CO2 as raw material for chemical energy conversion and storage. From a technical-industrial viewpoint the use of CCU (although not a known term at the time) was advocated by Asinger (24) and made famous through the work of Olah (25, 26). These concepts mainly considered step 2 as defined above, but with the different goal of replacing oil as liquid fuel and not with a CO2 mitigation service as prime motivation.
The question about the quantitative CO2 mitigation potential was less relevant for energy system researchers, and is usually discussed in dimensions of the production capacities of the chemical industry (10). This ranges to a maximum 100 Mt of the carbon containing product, with the exceptions of polyethylene and urea (27) being above that line.
This largely undisputed results of research in the chemistry field with a relatively short-term application horizon within the chemical industry (16, 18) clashes with the views of energy system research. This is documented impressively in a Faraday Discussion meeting held in 2016 (28-30).
Here, the emphasis is on the CO2 mitigation potential of a technology under discussion. In the present transitory situation, when we are moving away from fossil sources but do not have vast amounts of RES available, it is critical to prioritise the use of RES according to its CO2 reduction potential. In other words, measures requiring high specific RES input for a given CO2 saving should not be prioritised against measures that save CO2 for less RES input. The present work will critically evaluate this aspect (4, 10) particularly as it is often ignored when CCU is discussed (18) in the chemical literature.
In this discussion, the energetic efficiency of a measure serves as a quantitative descriptor. CCU technologies have long conversion chains (steps) and this leads to poor energetic efficiency. The process efficiency of a chain of chemical energy conversion (electrons to hydrogen, 0.70, and hydrogen to molecules, 0.70) and reutilisation (0.35) of the primary RES amounts with present technologies to an order of magnitude efficiency of 15% of final use energy with respect to primary RES. The heated debate over this aspect leads to quotes like: “Producing a liquid fuel via hydrogenation of CO2 and then using this to run an internal combustion vehicle is a monstrous thermodynamic crime” (28).
The thermodynamic efficiency of an element in the energy system is a valid and important descriptor but by no means the only one of relevance. It is widely accepted that future energy systems with a high abundance of stochastic RES as a primary energy source will be much more integrated between the individual elements (sectors), and will be more complex, as a whole multitude of energy options is required to match energy requirements (31) with the volatile primary source. CCU as defined above is seen as an important technology family. The quote “Which is the bigger crime? Converting curtailed renewable energy into hydrocarbon fuels that can be stored long term, albeit with thermodynamic penalties, or paying subsidies to renewable energy producers to curtail supply of electricity that can be converted into chemicals
23
to avoid the use of new fossil carbon in the form of petrochemicals? Surely CCU is just an example of resource efficiency, maximising productivity while reducing waste.” (28) underlines the need to look closer into the issue. These divergent views arise also because the level of aggregation of arguments and analyses is vastly different in the literature ranging from individual plants (32) and facilities to regional energy systems (33-35) up to the global level (36). To address the complexity challenge, the appropriate methodology is to define a proper frame of analysis of the CCU contribution to an energy system; define timescales and the evolutionary state of an energy system; and introduce the concept of service functions that an element has within the energy system. This premise will be followed in the main body of the work.
2.3 ASSESSMENT OF THE LITERATURE
The scientific literature on the term “CCU” is still relatively limited. In a search for the acronym, the term begins to occur around 2010 in the literature and cannot be found easily as multiple meanings are associated with the acronym (in medicine, biology, computer science, electrical engineering). An early mention is found in the work associated with a review discussing ionic liquids as adsorbents for CO2 that could immediately be activated by electrochemistry (37, 38).
In 2009 a comprehensive review was published (39) comparing CCU in the present definition with CCS stating that substantial potential was in the CCU approach. A recent review on the industrial options (6) of CCS and CCU comes to the conclusion that both options are technologically mature but require substantial regulatory incentives to achieve sizeable CO2 reduction.
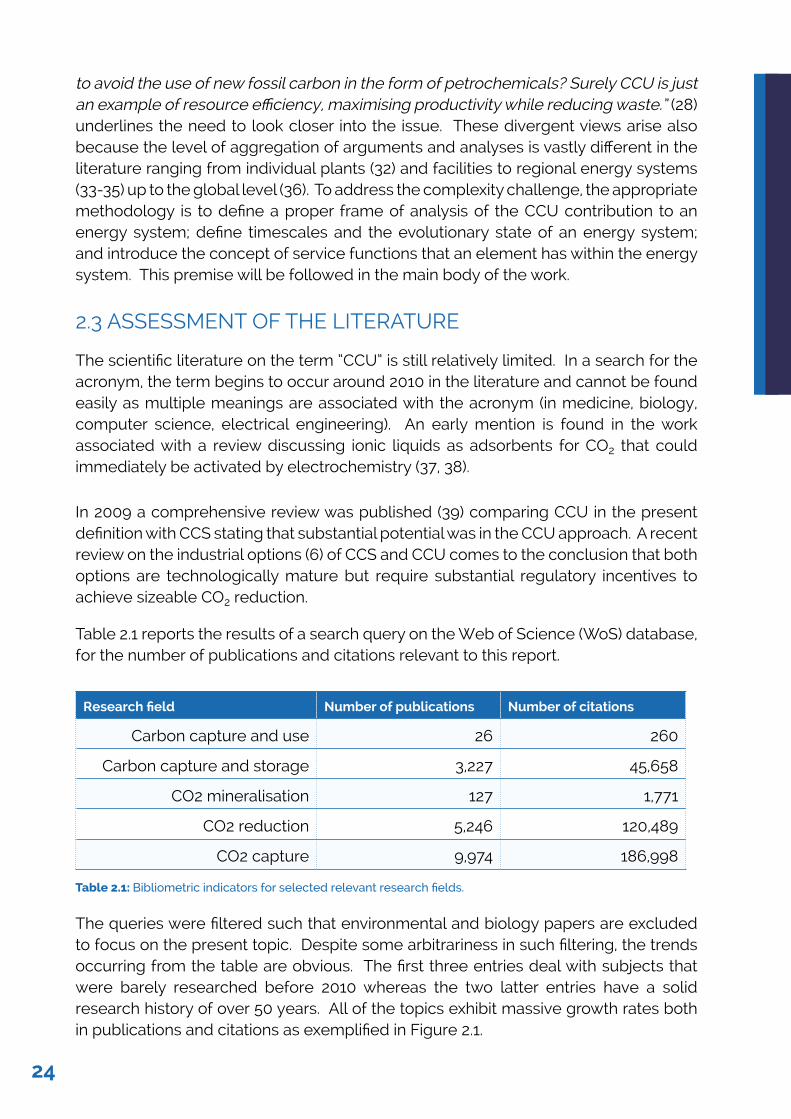
Table 2.1 reports the results of a search query on the Web of Science (WoS) database, for the number of publications and citations relevant to this report.
Research field Number of publications Number of citations
Carbon capture and use 26 260
Carbon capture and storage 3,227 45,658
CO2 mineralisation 127 1,771
CO2 reduction 5,246 120,489
CO2 capture 9,974 186,998
Table 2.1: Bibliometric indicators for selected relevant research fields.
The queries were filtered such that environmental and biology papers are excluded to focus on the present topic. Despite some arbitrariness in such filtering, the trends occurring from the table are obvious. The first three entries deal with subjects that were barely researched before 2010 whereas the two latter entries have a solid research history of over 50 years. All of the topics exhibit massive growth rates both in publications and citations as exemplified in Figure 2.1.
24
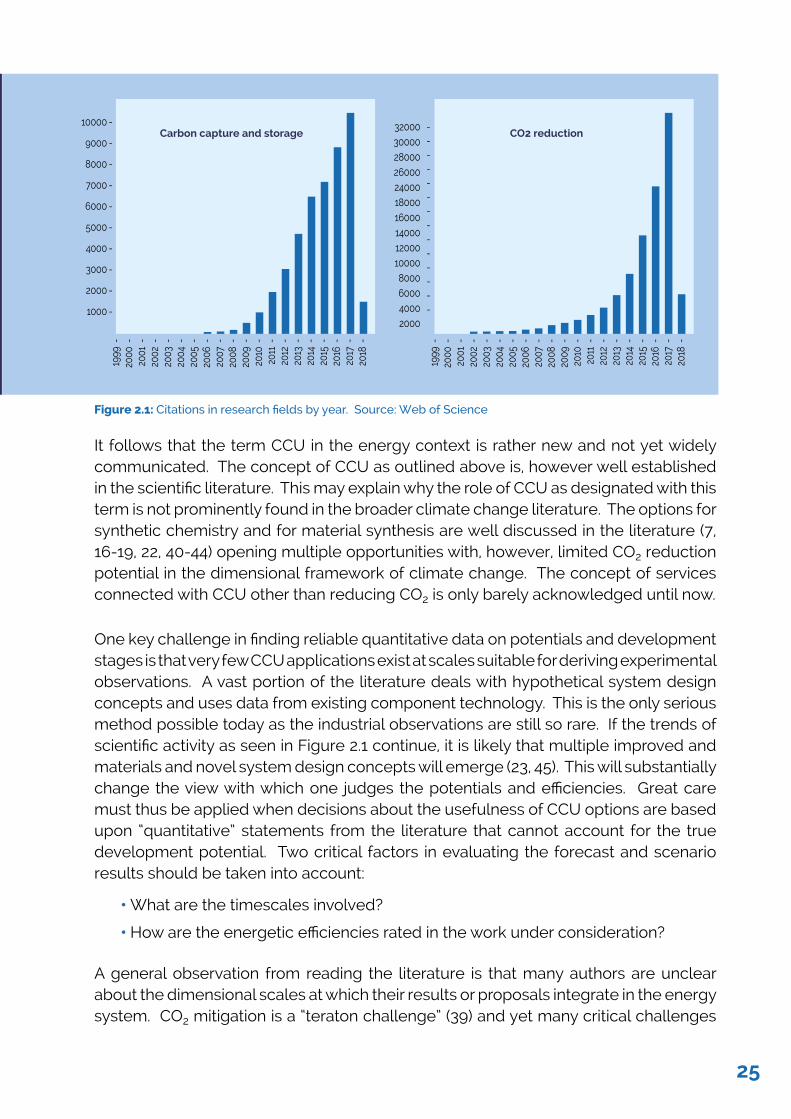
Figure 2.1: Citations in research fields by year. Source: Web of Science
It follows that the term CCU in the energy context is rather new and not yet widely communicated. The concept of CCU as outlined above is, however well established in the scientific literature. This may explain why the role of CCU as designated with this term is not prominently found in the broader climate change literature. The options for synthetic chemistry and for material synthesis are well discussed in the literature (7, 16-19, 22, 40-44) opening multiple opportunities with, however, limited CO2 reduction potential in the dimensional framework of climate change. The concept of services connected with CCU other than reducing CO2 is only barely acknowledged until now.
One key challenge in finding reliable quantitative data on potentials and development stages is that very few CCU applications exist at scales suitable for deriving experimental observations. A vast portion of the literature deals with hypothetical system design concepts and uses data from existing component technology. This is the only serious method possible today as the industrial observations are still so rare. If the trends of scientific activity as seen in Figure 2.1 continue, it is likely that multiple improved and materials and novel system design concepts will emerge (23, 45). This will substantially change the view with which one judges the potentials and efficiencies. Great care must thus be applied when decisions about the usefulness of CCU options are based upon “quantitative” statements from the literature that cannot account for the true development potential. Two critical factors in evaluating the forecast and scenario results should be taken into account:
• What are the timescales involved?
• How are the energetic efficiencies rated in the work under consideration?
A general observation from reading the literature is that many authors are unclear about the dimensional scales at which their results or proposals integrate in the energy system. CO2 mitigation is a “teraton challenge” (39) and yet many critical challenges
10000
9000
8000
7000
6000
5000
4000
3000
2000
1000
-
-
-
-
-
-
-
-
-
-
320003000028000260002400018000160001400012000100008000600040002000
--------------
Carbon capture and storage CO2 reduction
1999
2000
2001
2002
2003
2004
2005
2006
2007
2008
2009
2010
2011
2012
2013
2014
2015
2016
2017
2018
1999
2000
2001
2002
2003
2004
2005
2006
2007
2008
2009
2010
2011
2012
2013
2014
2015
2016
2017
2018
- - - - - - - - - - - - - - - - - - - - - - - - - - - - - - - - - - - - - - - -
25
exist in the sustainable energy system at mass scales many orders of magnitude smaller. This multi-dimensionality of the CCU technology is seen as one of the reasons for the passionate debate in the science community, together with a frequent fixation on uni-dimensional performance indicators that do not adequately reflect the system requirements (technical, environmental, regulatory, societal) of energy technologies.
2.4 DATA ABOUT ENERGY AND EMISSIONS
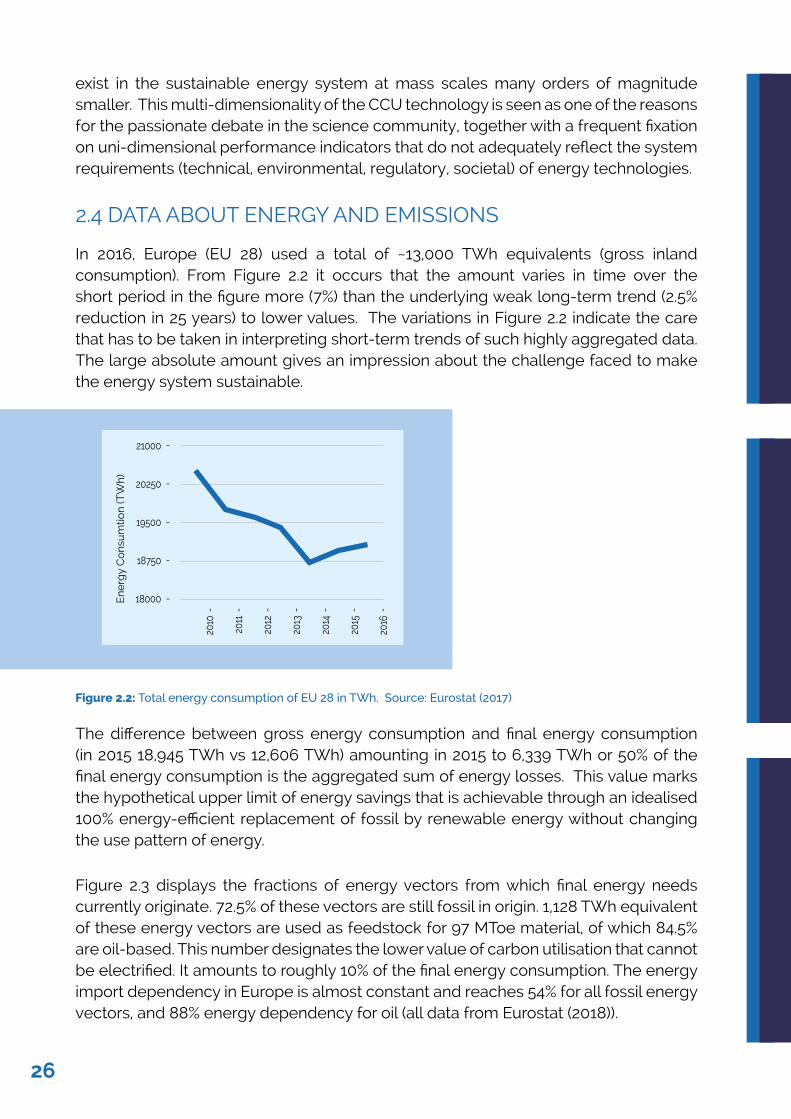
In 2016, Europe (EU 28) used a total of ~13,000 TWh equivalents (gross inland consumption). From Figure 2.2 it occurs that the amount varies in time over the short period in the figure more (7%) than the underlying weak long-term trend (2.5% reduction in 25 years) to lower values. The variations in Figure 2.2 indicate the care that has to be taken in interpreting short-term trends of such highly aggregated data. The large absolute amount gives an impression about the challenge faced to make the energy system sustainable.
Figure 2.2: Total energy consumption of EU 28 in TWh. Source: Eurostat (2017)
The difference between gross energy consumption and final energy consumption (in 2015 18,945 TWh vs 12,606 TWh) amounting in 2015 to 6,339 TWh or 50% of the final energy consumption is the aggregated sum of energy losses. This value marks the hypothetical upper limit of energy savings that is achievable through an idealised 100% energy-efficient replacement of fossil by renewable energy without changing the use pattern of energy.
Figure 2.3 displays the fractions of energy vectors from which final energy needs currently originate. 72.5% of these vectors are still fossil in origin. 1,128 TWh equivalent of these energy vectors are used as feedstock for 97 MToe material, of which 84.5% are oil-based. This number designates the lower value of carbon utilisation that cannot be electrified. It amounts to roughly 10% of the final energy consumption. The energy import dependency in Europe is almost constant and reaches 54% for all fossil energy vectors, and 88% energy dependency for oil (all data from Eurostat (2018)).
21000
20250
19500
18750
18000
-
-
-
-
-
2010
2011
2012
2013
2014
2015
2016
- - - - - - -
En
erg
y C
on
sum
tion
(TW
h)
26
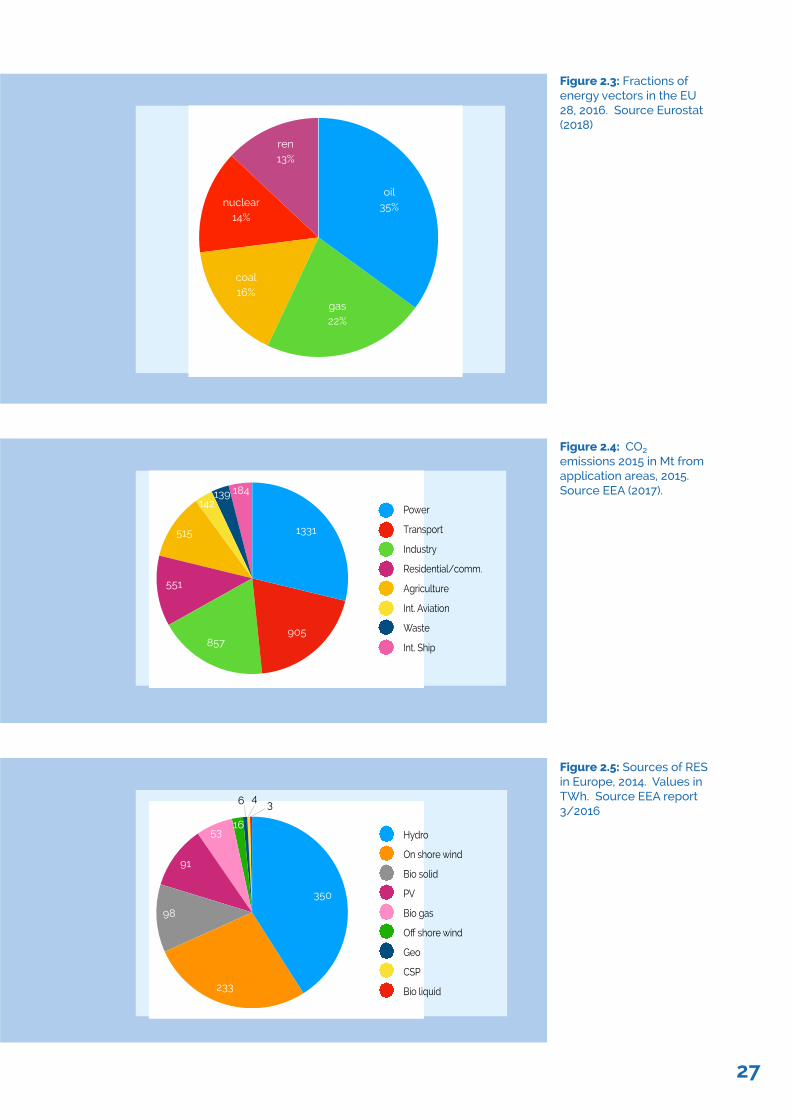
ren13%
oil35%
gas22%
coal16%
nuclear14%
Figure 2.3: Fractions of energy vectors in the EU 28, 2016. Source Eurostat (2018)
1331
905857
551
515
142139 184
Power
Transport
Industry
Residential/comm.
Agriculture
Int. Aviation
Waste
Int. Ship
Figure 2.4: CO2 emissions 2015 in Mt from application areas, 2015. Source EEA (2017).
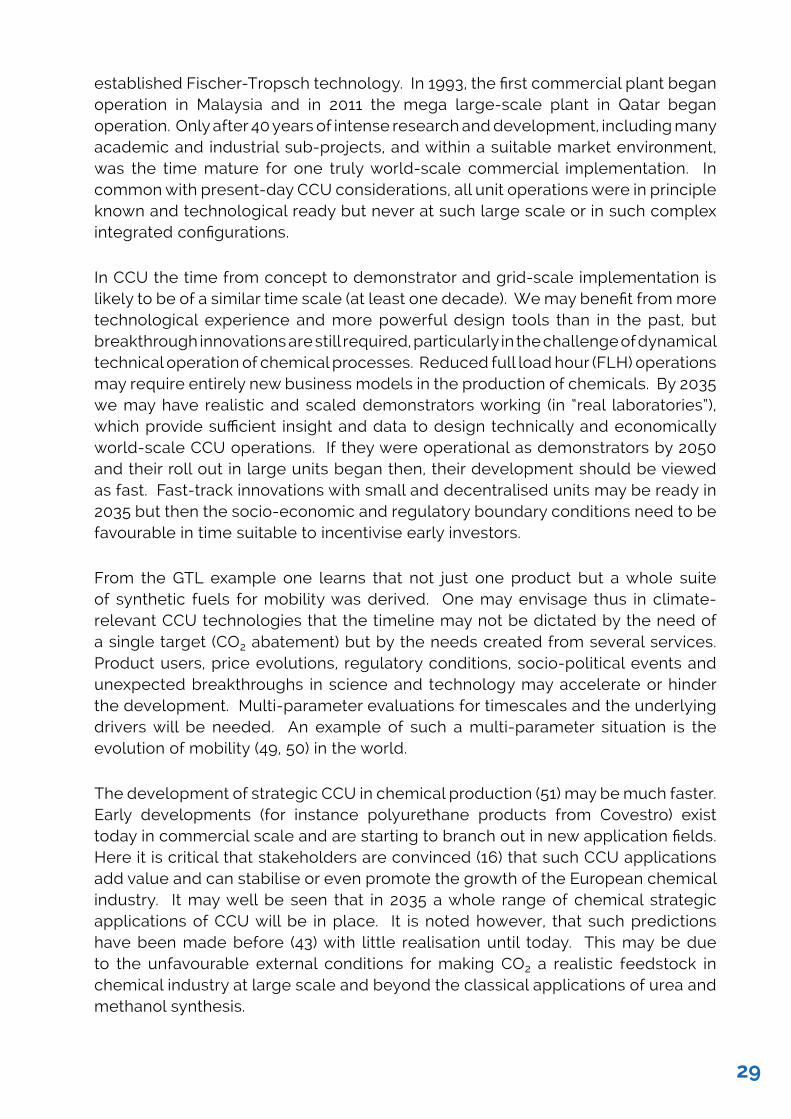
Figure 2.5: Sources of RES in Europe, 2014. Values in TWh. Source EEA report 3/2016
350
233
98
91
5316
346
Hydro
On shore wind
Bio solid
PV
Bio gas
Off shore wind
Geo
CSP
Bio liquid
27
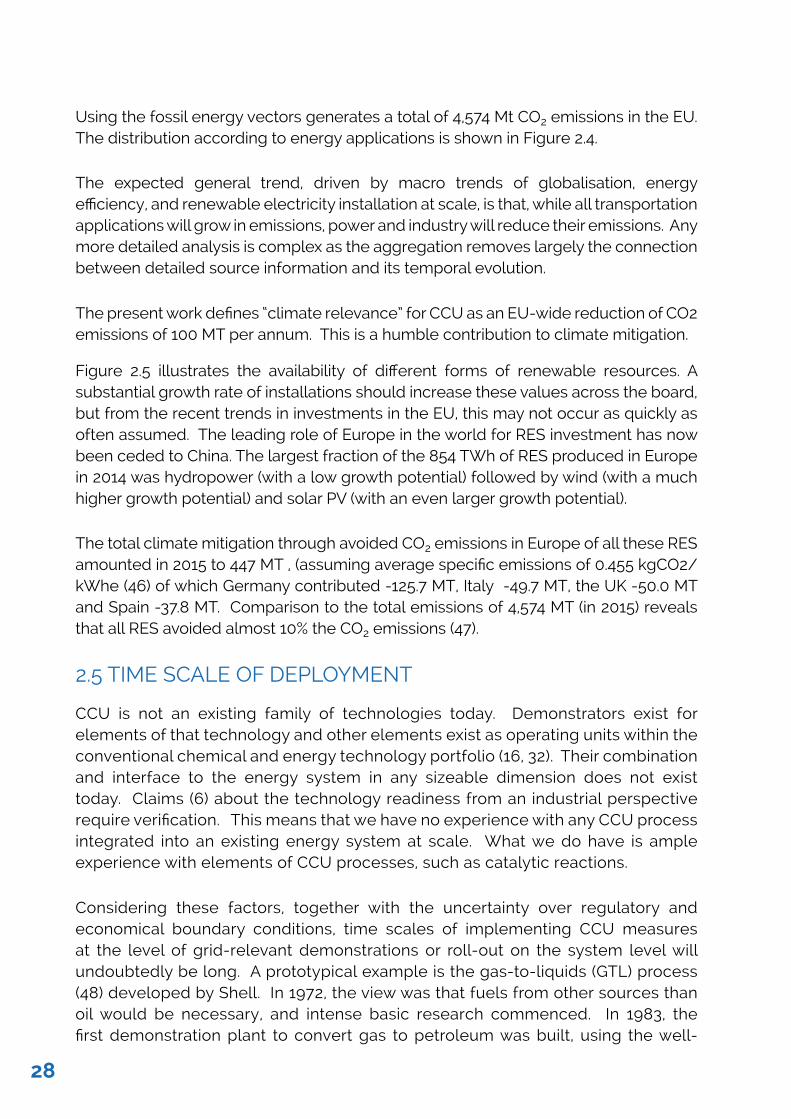
Using the fossil energy vectors generates a total of 4,574 Mt CO2 emissions in the EU. The distribution according to energy applications is shown in Figure 2.4.
The expected general trend, driven by macro trends of globalisation, energy efficiency, and renewable electricity installation at scale, is that, while all transportation applications will grow in emissions, power and industry will reduce their emissions. Any more detailed analysis is complex as the aggregation removes largely the connection between detailed source information and its temporal evolution.
The present work defines “climate relevance” for CCU as an EU-wide reduction of CO2 emissions of 100 MT per annum. This is a humble contribution to climate mitigation.
Figure 2.5 illustrates the availability of different forms of renewable resources. A substantial growth rate of installations should increase these values across the board, but from the recent trends in investments in the EU, this may not occur as quickly as often assumed. The leading role of Europe in the world for RES investment has now been ceded to China. The largest fraction of the 854 TWh of RES produced in Europe in 2014 was hydropower (with a low growth potential) followed by wind (with a much higher growth potential) and solar PV (with an even larger growth potential).
The total climate mitigation through avoided CO2 emissions in Europe of all these RES amounted in 2015 to 447 MT , (assuming average specific emissions of 0.455 kgCO2/kWhe (46) of which Germany contributed -125.7 MT, Italy -49.7 MT, the UK -50.0 MT and Spain -37.8 MT. Comparison to the total emissions of 4,574 MT (in 2015) reveals that all RES avoided almost 10% the CO2 emissions (47).
2.5 TIME SCALE OF DEPLOYMENT
CCU is not an existing family of technologies today. Demonstrators exist for elements of that technology and other elements exist as operating units within the conventional chemical and energy technology portfolio (16, 32). Their combination and interface to the energy system in any sizeable dimension does not exist today. Claims (6) about the technology readiness from an industrial perspective require verification. This means that we have no experience with any CCU process integrated into an existing energy system at scale. What we do have is ample experience with elements of CCU processes, such as catalytic reactions.
Considering these factors, together with the uncertainty over regulatory and economical boundary conditions, time scales of implementing CCU measures at the level of grid-relevant demonstrations or roll-out on the system level will undoubtedly be long. A prototypical example is the gas-to-liquids (GTL) process (48) developed by Shell. In 1972, the view was that fuels from other sources than oil would be necessary, and intense basic research commenced. In 1983, the first demonstration plant to convert gas to petroleum was built, using the well-
28
established Fischer-Tropsch technology. In 1993, the first commercial plant began operation in Malaysia and in 2011 the mega large-scale plant in Qatar began operation. Only after 40 years of intense research and development, including many academic and industrial sub-projects, and within a suitable market environment, was the time mature for one truly world-scale commercial implementation. In common with present-day CCU considerations, all unit operations were in principle known and technological ready but never at such large scale or in such complex integrated configurations.
In CCU the time from concept to demonstrator and grid-scale implementation is likely to be of a similar time scale (at least one decade). We may benefit from more technological experience and more powerful design tools than in the past, but breakthrough innovations are still required, particularly in the challenge of dynamical technical operation of chemical processes. Reduced full load hour (FLH) operations may require entirely new business models in the production of chemicals. By 2035 we may have realistic and scaled demonstrators working (in “real laboratories”), which provide sufficient insight and data to design technically and economically world-scale CCU operations. If they were operational as demonstrators by 2050 and their roll out in large units began then, their development should be viewed as fast. Fast-track innovations with small and decentralised units may be ready in 2035 but then the socio-economic and regulatory boundary conditions need to be favourable in time suitable to incentivise early investors.
From the GTL example one learns that not just one product but a whole suite of synthetic fuels for mobility was derived. One may envisage thus in climate-relevant CCU technologies that the timeline may not be dictated by the need of a single target (CO2 abatement) but by the needs created from several services. Product users, price evolutions, regulatory conditions, socio-political events and unexpected breakthroughs in science and technology may accelerate or hinder the development. Multi-parameter evaluations for timescales and the underlying drivers will be needed. An example of such a multi-parameter situation is the evolution of mobility (49, 50) in the world.
The development of strategic CCU in chemical production (51) may be much faster. Early developments (for instance polyurethane products from Covestro) exist today in commercial scale and are starting to branch out in new application fields. Here it is critical that stakeholders are convinced (16) that such CCU applications add value and can stabilise or even promote the growth of the European chemical industry. It may well be seen that in 2035 a whole range of chemical strategic applications of CCU will be in place. It is noted however, that such predictions have been made before (43) with little realisation until today. This may be due to the unfavourable external conditions for making CO2 a realistic feedstock in chemical industry at large scale and beyond the classical applications of urea and methanol synthesis.
29
A driver to accelerate CCU implementation may be the need to transport RES with the same technologies as we transport fossil energies (as liquids or compressed gas) throughout Europe and the world. It is inconceivable that sustainable energy systems will be able to only use local supplies of RES. Here, CCU has a broad and strategic potential as part of the ‘Power2X’ technology family. This may drive development such that in 2050 we have operating systems at world-scale. The development to supply Japan (52) with hydrogen through such technologies is one example, with the stated aims of the “liquid sunshine” (53) project in China being another. These are instructive examples of how other economies in the world are addressing the CCU debate. The Chinese large-scale project is relevant for the present discussion in the EU as it plans to use CCU deliberately in a staged way to bring clean energy carriers as fast as possible into cities. In the first stage coal will be the carbon and energy source for the production of methanol energy carrier, so as to demonstrate the technologies. According to the proponent plans, gradual addition of RES makes it “clean” and full CCU with biomass makes it sustainable. The project is planned over half a century on a scale larger than 100 Mt methanol per year.
The argument that CCU may compete for RES on a large scale, at times where RES is required to more directly substitute fossil power is contradicted by the timescale foreseen for CCU systems. All EU planning for the roll-out of RES in the power sector foresees a level of above 50% RES in the power system by 2050. At this level storage and transport of RES will be critical and all the flexibilisation measures will have to be in place. CCU is expected to be then a complementary technology (at least locally) rather than a competitor for RES. At the present level of RES penetration this would not be the case and thus high levels of RES are unconditionally a pre-requisite for CCU implementation beyond demonstrators. The European situation is in this respect different from that in China where this pre-condition is not relevant in considering the need for minimising local emissions in cities. Consequently, it should be recognised that such development as well as similar ones in other parts of the world create opportunities but also threats for the European export industry for infrastructure technologies.
In summary, the time at which CCU may become a climate-relevant contribution in a sustainable energy system is likely to be after the time when the available RES is developed sufficiently to replace fossil power applications. In smaller applications such as in the raw material industry where regulatory measures for mitigation are crucial, or in de-centralised applications, CCU may begin to operate earlier. The target year of 2050 is regarded as reasonable for CCU proponents as a flexibility option against temporal surplus RES, which may begin to play a role when other flexibility options might not appropriately deliver defossilised energy into non-electrifiable sectors of the system (we tentatively estimate the time horizon of this after about 2035). These applications would not endanger the prime target of using RES to replace fossil energy as much as possible in power and heat generation.
30
2.5.1 Temporal resolution
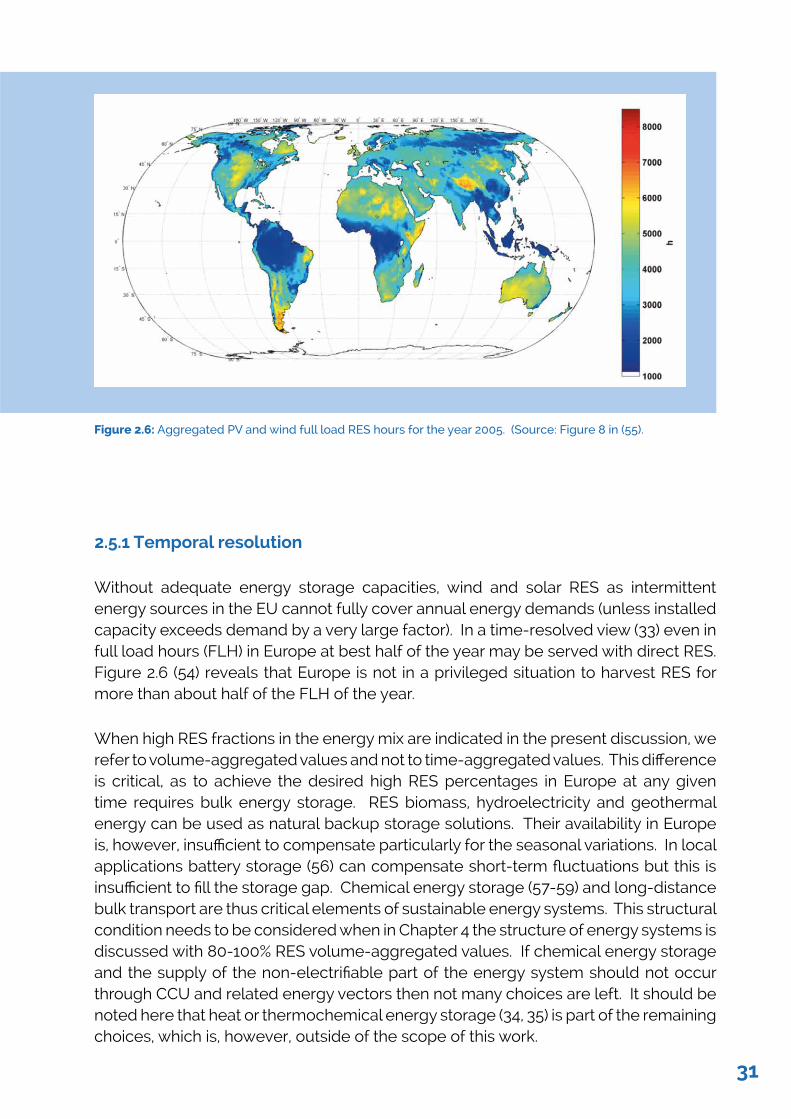
Without adequate energy storage capacities, wind and solar RES as intermittent energy sources in the EU cannot fully cover annual energy demands (unless installed capacity exceeds demand by a very large factor). In a time-resolved view (33) even in full load hours (FLH) in Europe at best half of the year may be served with direct RES. Figure 2.6 (54) reveals that Europe is not in a privileged situation to harvest RES for more than about half of the FLH of the year.
When high RES fractions in the energy mix are indicated in the present discussion, we refer to volume-aggregated values and not to time-aggregated values. This difference is critical, as to achieve the desired high RES percentages in Europe at any given time requires bulk energy storage. RES biomass, hydroelectricity and geothermal energy can be used as natural backup storage solutions. Their availability in Europe is, however, insufficient to compensate particularly for the seasonal variations. In local applications battery storage (56) can compensate short-term fluctuations but this is insufficient to fill the storage gap. Chemical energy storage (57-59) and long-distance bulk transport are thus critical elements of sustainable energy systems. This structural condition needs to be considered when in Chapter 4 the structure of energy systems is discussed with 80-100% RES volume-aggregated values. If chemical energy storage and the supply of the non-electrifiable part of the energy system should not occur through CCU and related energy vectors then not many choices are left. It should be noted here that heat or thermochemical energy storage (34, 35) is part of the remaining choices, which is, however, outside of the scope of this work.
Figure 2.6: Aggregated PV and wind full load RES hours for the year 2005. (Source: Figure 8 in (55).
31
2.6 SOCIETAL SERVICES
Two alternative visions of the CCU technologies are spelled out in the literature. In a bottom up approach, CO2 conversion is considered at the centre of a web of technologies, and the emphasis is put on conversion processes, chemical mechanisms and catalytic materials.
In a top down vision, CO2 conversion is viewed as a possible element within the complexity of the energy system and of the related material cycles. As such, it creates certain opportunities at given costs, and its effectiveness and impacts (for instance on climate mitigation) can be more easily compared with respect to those provided by other alternatives.
The two visions can be best harmonised by focusing on the services that are provided by the energy system. The services consider in the following are listed here, and constitute a representative subset of all the services provided by the energy system:
i power generation and distribution through the grid;
ii fuels (and power) for transport and mobility;
iii storage and transport of renewable energies, to cope with their intermittency and geographic mismatch between resources and consumption;
iv manufacturing of carbon-containing industrial products.
The provision of the same services through alternative routes, i.e. using different energy carriers, namely electrons, hydrogen or carbon-based fuels, establishes a basis for the comparison of different technology chains, including those entailing CCU. Different chains providing the same service shall be evaluated based on the following five criteria:
1 efficiency in the use of energy, particularly of carbon-free renewable energy;
2 carbon fluxes, with reference to CO2 emissions first, as well as to consumption of fossil-carbon resources and to occupation of sub-surface CO2 storage space;
3 environmental impact, on top of those considered within criterion 2;
4 costs, including operational and capital costs, as well as financing schemes;
5 societal perception and political feasibility.
2.7 CONCEPTUAL TECHNOLOGY CHAINS
It is useful to illustrate the relation between services and energy carriers on a conceptual basis. In such a way important details are neglected, but the function and role of various elements in a hypothetical energy system can be highlighted. To analyse how the four types of services can be provided using different energy carriers, we will consider three scenarios, firstly, 100% electrification, i.e. a system entirely based on the use of carbon-free intermittent renewable electricity; secondly, a hydrogen-based system, i.e. where
32
green-hydrogen is synthesised via electrolysis powered by renewable electricity; and thirdly, the use of synthetic natural gas (SNG) produced via CCU, i.e. a paradigmatic case of a synthetic fuel made using carbon dioxide as carbon provider, using green-hydrogen as the reducing agent and carbon-free energy whenever needed. Such alternatives require different technology chains, consisting of steps that involve energy and material balances, require infrastructure, bear costs, cause environmental impact and have varying levels of social acceptance and political feasibility.
For illustration, let us consider the technology chain delivering power via SNG: it involves power generation using for instance photovoltaic, then hydrogen synthesis via electrolysis, then the methanation reaction to convert carbon dioxide and hydrogen to SNG, and finally the combustion of SNG to generate power again; it also requires a capture step where CO2 is either captured from the flue gas of a combustion process or it is directly captured from air. The other technology chains exhibit a similar degree of complexity.
CarriersServices
RenewableElectricity
Green-Hydrogen Synthetic Fuels Fossil Fuels
Power Generation
0
ƞ C @ € ⌘
0
ƞ C @ € ⌘
0
ƞ C @ € ⌘
0
ƞ C @ € ⌘
Mobility 0
ƞ C @ € ⌘
0
ƞ C @ € ⌘
0
ƞ C @ € ⌘
0
ƞ C @ € ⌘
Energy Storgae and Transport
0
ƞ C @ € ⌘
0
ƞ C @ € ⌘
0
ƞ C @ € ⌘
0
ƞ C @ € ⌘
Carbon-based Industrial Products
N.A. N.A. 0
ƞ C @ € ⌘
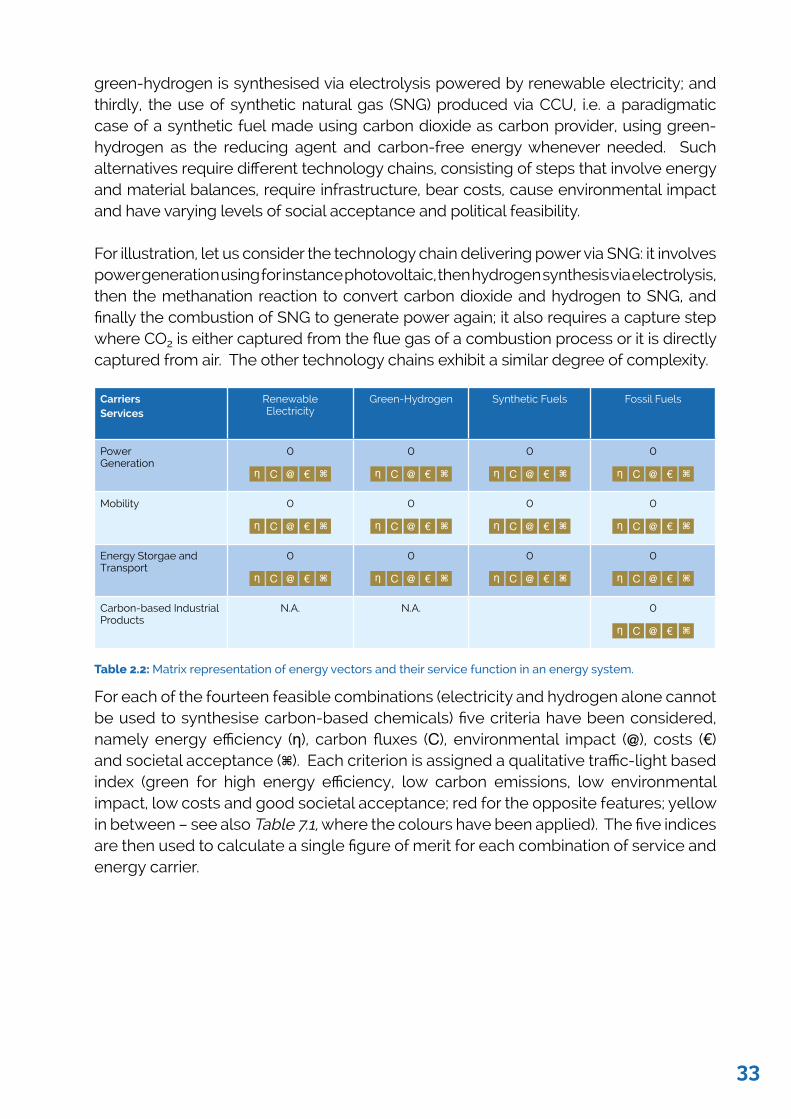
Table 2.2: Matrix representation of energy vectors and their service function in an energy system.
For each of the fourteen feasible combinations (electricity and hydrogen alone cannot be used to synthesise carbon-based chemicals) five criteria have been considered, namely energy efficiency (ƞ), carbon fluxes (C), environmental impact (@), costs (€) and societal acceptance (⌘). Each criterion is assigned a qualitative traffic-light based index (green for high energy efficiency, low carbon emissions, low environmental impact, low costs and good societal acceptance; red for the opposite features; yellow in between – see also Table 7.1, where the colours have been applied). The five indices are then used to calculate a single figure of merit for each combination of service and energy carrier.
33
3. System boundaries and systems analysis
3.1 SCOPE OF ANALYSISIt is essential that different CCU systems and their ability to meet requirements for net reductions in greenhouse gas emissions are assessed using a whole systems approach. The whole systems approach considers all activities within the CCU system on a life cycle basis, or from ‘cradle to grave’. This is illustrated in Figure 3.1, which shows the key components of CCU systems: capture of CO2 from different sources; electricity generation to produce hydrogen; and its use in a conversion process to produce different valuable products from the captured CO2. It is important to note that CCU systems must rely fully on renewable energy, otherwise the net carbon emissions would be greater than those removed by these systems. (The importance of using surplus renewable energy is discussed elsewhere in the report.)
Net atmospheric carbon dioxide reduction is a necessary requirement but is not alone sufficient to render a CCU system sustainable. As also seen in Figure 3.1, all the processes within the CCU system require various environmental resources, such as materials, fuels and water, to build and operate the renewable energy and chemical plants, transport the products and treat environmental pollution across the supply chain. These will generate different environmental impacts which must also be considered on a life cycle basis to ensure that climate change mitigation is not achieved at the expense of other impacts. In addition to environmental impacts, the sustainability of CCU systems will depend on their socio-economic costs and benefits.
The final judgment on the usefulness of a particular CCU technology has to take into consideration that the product will in all likelihood already exist. The process with which this product is being generated today has to be subject to the same life cycle analysis in the same system boundaries in order to obtain a reasonable numerical basis for comparison.
The following sections discuss how these aspects should be considered to help identify the most sustainable CCU options, starting with their climate change mitigation potential, followed by other environmental impacts, economic costs and finally societal aspects.
3.2 CLIMATE CHANGE MITIGATION POTENTIAL
As indicated in Figure 2.2, CO2 can arise from a variety of sources, including flue gases from industry and power generation, biogas production, and the atmosphere. The nature and source of the primary source of carbon are crucial for determining the climate change mitigation potential of different CCU systems. The resulting carbon
34
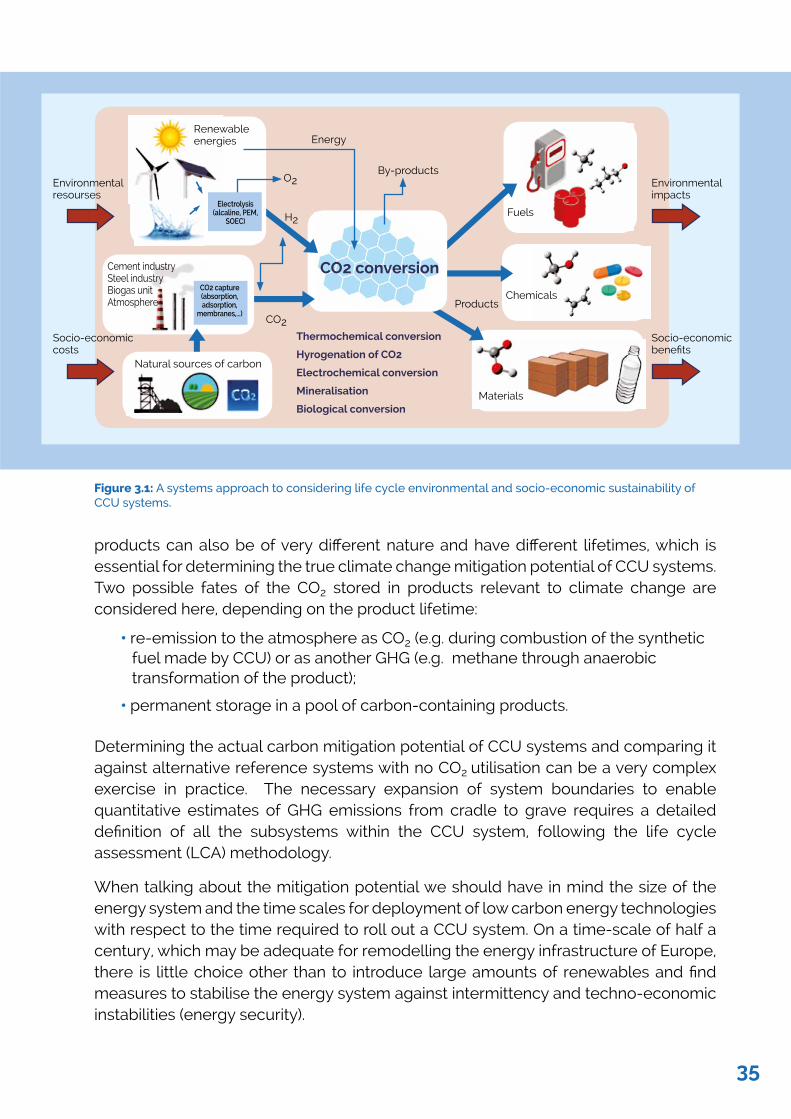
products can also be of very different nature and have different lifetimes, which is essential for determining the true climate change mitigation potential of CCU systems. Two possible fates of the CO2 stored in products relevant to climate change are considered here, depending on the product lifetime:
• re-emission to the atmosphere as CO2 (e.g. during combustion of the synthetic fuel made by CCU) or as another GHG (e.g. methane through anaerobic transformation of the product);
• permanent storage in a pool of carbon-containing products.
Determining the actual carbon mitigation potential of CCU systems and comparing it against alternative reference systems with no CO2 utilisation can be a very complex exercise in practice. The necessary expansion of system boundaries to enable quantitative estimates of GHG emissions from cradle to grave requires a detailed definition of all the subsystems within the CCU system, following the life cycle assessment (LCA) methodology.
When talking about the mitigation potential we should have in mind the size of the energy system and the time scales for deployment of low carbon energy technologies with respect to the time required to roll out a CCU system. On a time-scale of half a century, which may be adequate for remodelling the energy infrastructure of Europe, there is little choice other than to introduce large amounts of renewables and find measures to stabilise the energy system against intermittency and techno-economic instabilities (energy security).
Figure 3.1: A systems approach to considering life cycle environmental and socio-economic sustainability of CCU systems.
Environmental impacts
Socio-economic benefits
Chemicals
Fuels
Materials
Environmental resourses
Socio-economic costs
Cement industrySteel industryBiogas unitAtmosphere
CO2 capture (absorption, adsorption,
membranes,...)
Natural sources of carbon
Renewable energies Energy
H2
O2
CO2
By-products
Thermochemical conversion
Hyrogenation of CO2
Electrochemical conversion
Mineralisation
Biological conversion
CO2 conversion
Electrolysis (alcaline, PEM,
SOEC)
Products
35
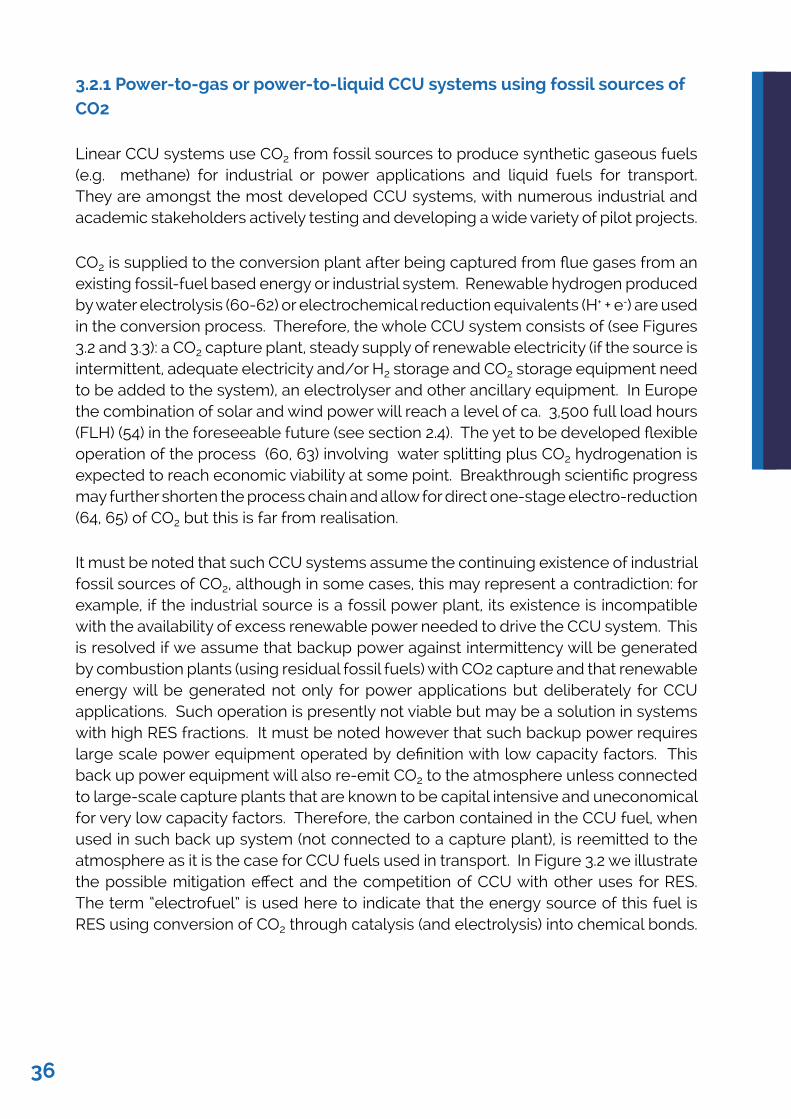
3.2.1 Power-to-gas or power-to-liquid CCU systems using fossil sources of CO2
Linear CCU systems use CO2 from fossil sources to produce synthetic gaseous fuels (e.g. methane) for industrial or power applications and liquid fuels for transport. They are amongst the most developed CCU systems, with numerous industrial and academic stakeholders actively testing and developing a wide variety of pilot projects.
CO2 is supplied to the conversion plant after being captured from flue gases from an existing fossil-fuel based energy or industrial system. Renewable hydrogen produced by water electrolysis (60-62) or electrochemical reduction equivalents (H+ + e-) are used in the conversion process. Therefore, the whole CCU system consists of (see Figures 3.2 and 3.3): a CO2 capture plant, steady supply of renewable electricity (if the source is intermittent, adequate electricity and/or H2 storage and CO2 storage equipment need to be added to the system), an electrolyser and other ancillary equipment. In Europe the combination of solar and wind power will reach a level of ca. 3,500 full load hours (FLH) (54) in the foreseeable future (see section 2.4). The yet to be developed flexible operation of the process (60, 63) involving water splitting plus CO2 hydrogenation is expected to reach economic viability at some point. Breakthrough scientific progress may further shorten the process chain and allow for direct one-stage electro-reduction (64, 65) of CO2 but this is far from realisation.
It must be noted that such CCU systems assume the continuing existence of industrial fossil sources of CO2, although in some cases, this may represent a contradiction: for example, if the industrial source is a fossil power plant, its existence is incompatible with the availability of excess renewable power needed to drive the CCU system. This is resolved if we assume that backup power against intermittency will be generated by combustion plants (using residual fossil fuels) with CO2 capture and that renewable energy will be generated not only for power applications but deliberately for CCU applications. Such operation is presently not viable but may be a solution in systems with high RES fractions. It must be noted however that such backup power requires large scale power equipment operated by definition with low capacity factors. This back up power equipment will also re-emit CO2 to the atmosphere unless connected to large-scale capture plants that are known to be capital intensive and uneconomical for very low capacity factors. Therefore, the carbon contained in the CCU fuel, when used in such back up system (not connected to a capture plant), is reemitted to the atmosphere as it is the case for CCU fuels used in transport. In Figure 3.2 we illustrate the possible mitigation effect and the competition of CCU with other uses for RES. The term “electrofuel” is used here to indicate that the energy source of this fuel is RES using conversion of CO2 through catalysis (and electrolysis) into chemical bonds.
36
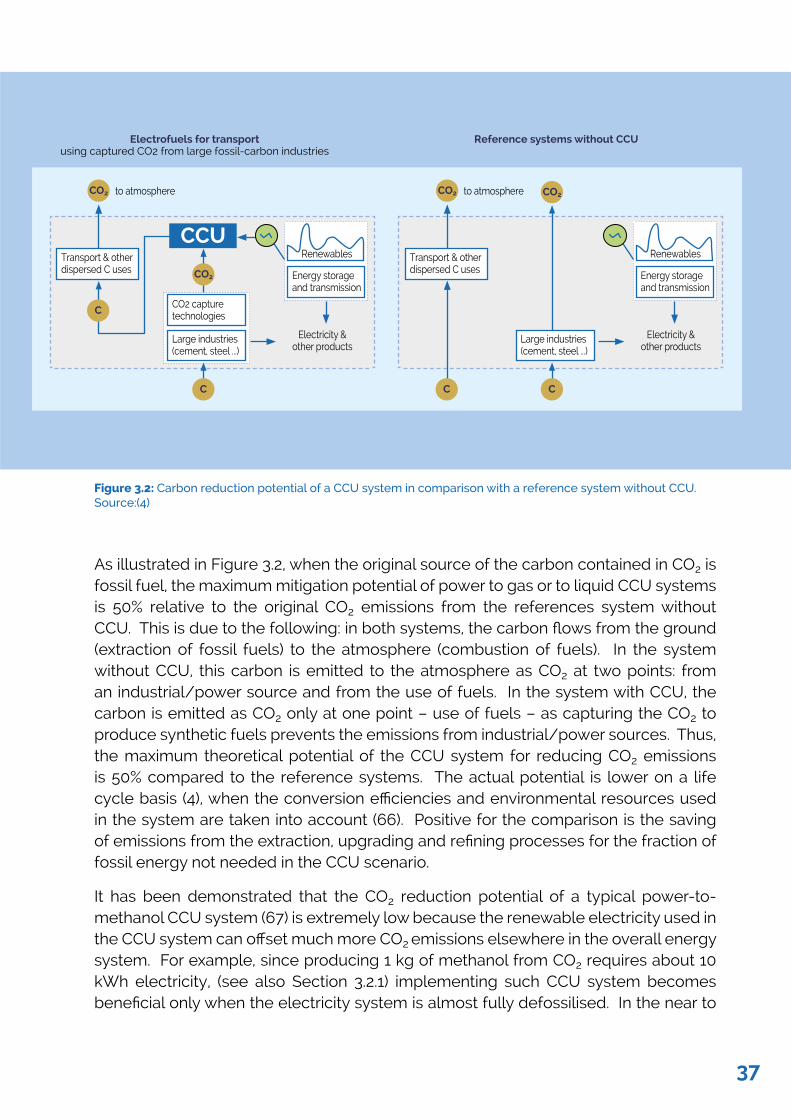
Figure 3.2: Carbon reduction potential of a CCU system in comparison with a reference system without CCU. Source:(4)
As illustrated in Figure 3.2, when the original source of the carbon contained in CO2 is fossil fuel, the maximum mitigation potential of power to gas or to liquid CCU systems is 50% relative to the original CO2 emissions from the references system without CCU. This is due to the following: in both systems, the carbon flows from the ground (extraction of fossil fuels) to the atmosphere (combustion of fuels). In the system without CCU, this carbon is emitted to the atmosphere as CO2 at two points: from an industrial/power source and from the use of fuels. In the system with CCU, the carbon is emitted as CO2 only at one point – use of fuels – as capturing the CO2 to produce synthetic fuels prevents the emissions from industrial/power sources. Thus, the maximum theoretical potential of the CCU system for reducing CO2 emissions is 50% compared to the reference systems. The actual potential is lower on a life cycle basis (4), when the conversion efficiencies and environmental resources used in the system are taken into account (66). Positive for the comparison is the saving of emissions from the extraction, upgrading and refining processes for the fraction of fossil energy not needed in the CCU scenario.
It has been demonstrated that the CO2 reduction potential of a typical power-to-methanol CCU system (67) is extremely low because the renewable electricity used in the CCU system can offset much more CO2 emissions elsewhere in the overall energy system. For example, since producing 1 kg of methanol from CO2 requires about 10 kWh electricity, (see also Section 3.2.1) implementing such CCU system becomes beneficial only when the electricity system is almost fully defossilised. In the near to
Electrofuels for transportusing captured CO2 from large fossil-carbon industries
Reference systems without CCU
CO2
CO2CO2 CO2
CCU
to atmosphere to atmosphere
Transport & other dispersed C uses
Transport & other dispersed C uses
CO2 capture technologies
Large industries (cement, steel ...)
Large industries (cement, steel ...)
Energy storage and transmission
Energy storage and transmission
Renewables Renewables
Electricity & other products
Electricity & other products
C
CC C
37
mid-term future it is much more sensible to use the 10 kWh of renewable electricity to further defossilise the electricity or even the transport systems (i.e. by BEV).
An important consequence of this result is that fossil-based CCU is a characteristic option in mature states of the energy transition when the energy-hungry electrical applications are already decarbonised and fossil-based CCU is needed to help stabilising the volatility of the electrical system and for diffusing renewable energy in the non-electrical part of the energy system. For example, decarbonisation of fuels in aviation, shipping and heavy goods transport could be achieved through this scheme. As long as the power sector is still low in renewable energy the priority argument fully applies and fossil-based CCU is a detrimental option on the path to rapid climate mitigation in early stages of the energy transition (68, 69).
In other words, the benefits of such a fossil-based CCU system for climate change mitigation can only be realised with its “50% reduction effect” as an alternative to fossil carbon sources. For this to be implemented at scale, it would require large amounts of available renewable power (4) as well as suitable and large sources of captured CO2. Neither of these is immediately available today, although the situation might obviously change in the future particularly if RES can be transported over long distances (such system is discussed in 3.2.3 below). In addition, for longer-term scenarios whereby substantial amounts of renewable-based energy may be available, the climate change mitigation benefits of fossil CO2 conversion to fuels become increasingly irrelevant. In such a scenario, widespread decarbonisation will have already occurred, and the limitation on maximum avoidable emissions noted above continues to make fossil-based CCU less attractive for deep decarbonisation than other options.
3.2.2 Power-to-gas or power-to-liquid CCU systems using renewable sources of CO2
These CCU systems capture CO2 directly from the atmosphere or from biogenic sources, such as biomass gasification/combustion or anaerobic digestion (see upper part of Figure 3.3). They have potential to achieve zero or negative carbon emissions (if the carbon remains in the technical carbon cycle) and thus have a significant, albeit theoretical, climate change mitigation potential. A critical issue is the assignment of the CO2 credit to either the supplier of the RES and/or the user of the CCU product. Suitable business models and regulations need to be developed and introduced to properly account for the service of operating the technical carbon cycle.
The operation options of such CCU are illustrated in Figure 3.3. It is clearly seen that now the CCU operates in a cyclic manner does not give off any CO2 to the atmosphere. The stochastic RES remains as a prerequisite and requires a dynamical operation (non-steady-state) of the CCU processes.
38
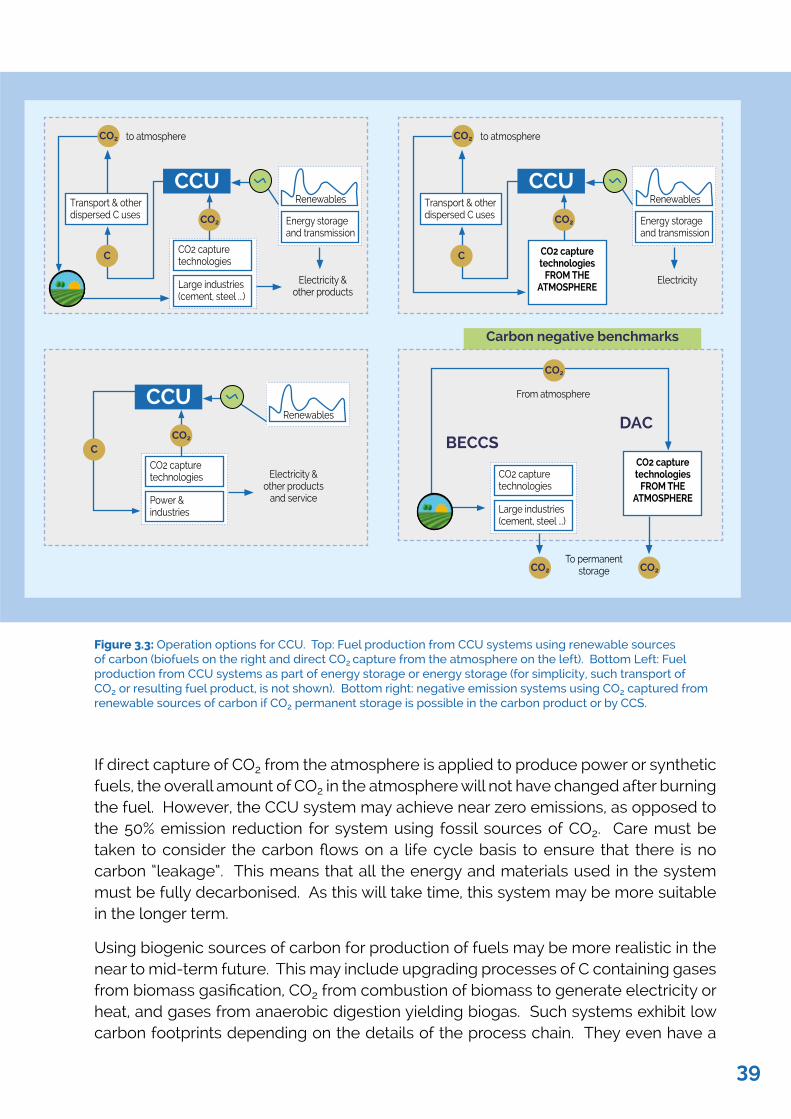
Figure 3.3: Operation options for CCU. Top: Fuel production from CCU systems using renewable sources of carbon (biofuels on the right and direct CO2 capture from the atmosphere on the left). Bottom Left: Fuel production from CCU systems as part of energy storage or energy storage (for simplicity, such transport of CO2 or resulting fuel product, is not shown). Bottom right: negative emission systems using CO2 captured from renewable sources of carbon if CO2 permanent storage is possible in the carbon product or by CCS.
If direct capture of CO2 from the atmosphere is applied to produce power or synthetic fuels, the overall amount of CO2 in the atmosphere will not have changed after burning the fuel. However, the CCU system may achieve near zero emissions, as opposed to the 50% emission reduction for system using fossil sources of CO2. Care must be taken to consider the carbon flows on a life cycle basis to ensure that there is no carbon “leakage”. This means that all the energy and materials used in the system must be fully decarbonised. As this will take time, this system may be more suitable in the longer term.
Using biogenic sources of carbon for production of fuels may be more realistic in the near to mid-term future. This may include upgrading processes of C containing gases from biomass gasification, CO2 from combustion of biomass to generate electricity or heat, and gases from anaerobic digestion yielding biogas. Such systems exhibit low carbon footprints depending on the details of the process chain. They even have a
Carbon negative benchmarks
CO2
CO2
CO2 CO2
CO2
CO2 CO2
CO2
CCU
CCU
BECCSDAC
CCU
to atmosphere to atmosphere
From atmosphere
To permanent storage
Transport & other dispersed C uses
Transport & other dispersed C uses
CO2 capture technologies
CO2 capture technologies
CO2 capture technologies
FROM THE ATMOSPHERE
CO2 capture technologies
FROM THE ATMOSPHERE
Large industries (cement, steel ...)
Power & industries
Energy storage and transmission
Energy storage and transmission
Renewables
Renewables
Renewables
Electricity & other products
Electricity & other products
and service
Electricity
C
C
C
CO2 capture technologies
Large industries (cement, steel ...)
39
potential for negative carbon emissions, reducing the overall CO2 concentration in the atmosphere, but only if the carbon is permanently stored and not re-emitted into the atmosphere. However, these systems must also be assessed on a life cycle basis to ensure that this is indeed the case.
3.2.3 Energy storage and/or distribution using CCU fuels
The high energy density of carbon-containing fuels makes them prime candidates for energy storage schemes and for their use as energy vectors to distribute renewable energy across long distances. This technology would include the following steps: captured CO2 is first converted into a fuel, the fuel is transported, it is then burned to provide energy for power/industry or for transportation, emitting CO2 (localised at industrial/power plants or dispersed in transport systems); this CO2 is then captured and transported to the CO2 conversion plant to be converted into a fuel again. Such systems must be closed loop; in other words, the captured CO2 must be used in the same type of the system it was captured from to avoid carbon “leakage”. For example, if CO2 was originally captured from a power plant or an industrial source, the fuel produced from it must be used in (another) power or industrial plant. The same principle applies for transportation systems. This limitation vanishes if an integrated energy system is operated and the technical carbon cycle connects stationary sources and sinks with mobile ones through collection of atmospheric CO2 with biomass.
The mass of carbon stored in such a loop is very small compared to current emissions but the mitigation potential may be significant due to the potentially infinite number of cycles. As mentioned above the business models must be adequate to incentivise the operation of the carbon cycle and to distribute the CO2 credits so as no double counting is introduced in the system. For such CCU systems, several factors must be taken into account. First, such a system requires significant and sometimes long-distance transportation, which, unless fully decarbonised, will lead to additional carbon emissions. Secondly, the benefits of such a system must be compared with other energy storage and distribution systems, e.g. batteries, dams, ammonia or other functional materials and long-distance electricity transmission networks. Furthermore, the credits for carbon reductions must be allocated to the CCU system rather than to the energy system they serve; otherwise, the CCU systems will not be attractive. This would go against current practice whereby the carbon abatement credits are allocated to energy sources rather than energy storage devices. It can be expected, however, that within Europe a large imbalance of renewable energy potential and energy demand will prevail (see below) and thus bulk transport of energy beyond the useful capacities of electrical storage and the electrical grid may be needed.
If the carbon cycle in these systems is broken at any point (e.g. by not capturing CO2 emissions from the fuels), they become one of the two cases described in Sections 3.2.1 and 3.2.2.
40
3.2.4 Breakthrough technologies using CO2 directly from the atmosphere
Some emerging technologies, such as artificial leaves(70, 71) or solar fuels enable utilisation of CO2 directly from the atmosphere (note however that “solar fuels” refer also to C-free fuels such as hydrogen or ammonia, when produced directly using solar energy). However, these are still at very early stage of development and their techno-economic viability is as yet unproven. The systems approach adopted in this work allows us to highlight some important boundary conditions for these advanced systems to succeed. First, these technologies will rely on dispersed and intermittent primary solar energy. Therefore, they may compete for land resources with other technologies driven by solar energy, such as solar PV and biomass. Secondly, they will have to achieve reasonable energy conversion efficiencies (72) (that have already surpassed 20% for existing competitors for solar resources, such as PV technologies (73)) and low costs to compete with the relevant alternatives. Furthermore, their potential for carbon reductions at scale should be evaluated, setting net reduction targets to ensure that they are competitive with other, more established technologies.
3.2.5 Manufacture of carbon products from CO2
CO2 can be utilised to produce different carbon-based products (15, 19), such as chemicals, polymers and carbonates. In such CCU systems (see Figure 3.2), CO2 is captured from different industrial sources and converted to a stable product. CCU products can have short, medium and long lifetimes. For example, carbonates (e.g. CaCO3 or MgCO3) have a long lifetime. The lifetime of chemicals and polymers can vary from short (e.g. plastic water bottles) to medium (e.g. platform chemicals) to long (e.g. water pipes). As the success of climate change mitigation depends on how long the CO2 is kept out of the atmosphere, it is essential to consider the lifetimes of CCU products when evaluating their carbon reduction potential. The WG suggests a conservative approach is to count the 50% as with CCU fuels, credit the avoided fossil fuels plus their processing emissions and consider for all non-mineral application the storage time as non-countable fringe benefit.
Another question that requires attention from the climate change mitigation point of view is the origin of carbon in those products. If its provenance is fossil, then the same issues apply as discussed in Section 3.2.1; if the origin of carbon is biogenic, then the discussion in Section 3.2.2 is applicable.
From the life cycle perspective, it is important to achieve net carbon reductions with CCU products. There is potential to avoid emissions when CO2 is fixed in a stable polymer chain and such polymer is continuously stored in long-life products, such as water pipes. However, the overall effect of such schemes on climate change mitigation will be small, because of the difference in several orders of magnitude between viable carbon pools and the CO2 mitigation targets. For example, if the material used to produce a CCU product requires treatment to gain affinity for CO2 so that it can capture it (e.g. calcination of CaCO3 to CaO which is then used to capture CO2 and produce CaCO3), there is only a limited net reduction in CO2 emissions (50% saving minus the
41
CO2 in coming from process energy) and in some cases (such as CaCO3 calcination), they may be higher than the emissions being captured. A certain reduction of CO2 emissions can in theory be achieved if the material has a natural affinity for CO2 and does not require treatment. The life cycle GHG emissions generated to obtain the material used in the manufacture of CCU products must also be considered, for instance in mining and transportation.
Once again, in later stages of the defossilisation of energy systems the use of CCU to provide the material industry with feedstock may become a strategic issue beyond climate mitigation. It is not expected that such a situation will occur before large amounts of renewable electricity will be available and without appropriate political support.
3.3 OTHER ENVIRONMENTAL IMPACTS The sustainability of CCU systems will depend on other environmental impacts they generate while removing CO2 from the atmosphere. These include depletion of natural resources, acidification, eutrophication, human toxicity and eco-toxicity. These must also be assessed on a life cycle basis, as indicated in Figure 3.2. However, most LCA studies of CCU systems have so far focused on the climate change impact and studies of other environmental impacts, which also need to be taken into account, are scarce (9, 74). It is important to develop a LCA methodology and apply it consistently across different CCU systems and their alternatives to aid cross-comparisons and decision-making. Currently, this is extremely difficult as all studies assume different system boundaries and units of analysis (66). This issue will be re-considered in Section 6.3.
3.4 COST CONSIDERATIONS A further sustainability issue for CCU systems is their economic cost. Like the CO2 reduction potential and other environmental impacts, the costs should also be evaluated on a life cycle basis, from cradle to grave. In addition to the CO2 conversion costs, this includes costs of input materials, energy and water, hydrogen production, transport and storage (see Figure 3.1). For CCU systems to be economically viable, the total costs should be offset against the profits from selling the products and by-products. Like LCA studies, existing cost studies tend to consider different parts of the CCU systems inconsistently which makes comparisons between different systems very difficult. Furthermore, the life cycle approach is rarely applied in cost analysis of CCU systems, suggesting that the costs may be underestimated. Here a systemic inconsistency occurs as all CCU technologies are charged with the cost of generating and storing renewable energy in chemical bonds whereas all fossil systems are not charged for this function. The request for equal system boundaries is thus systematically violated.
A further issue is benchmarking. CCU systems are often compared to mature systems in the power and petrochemical sectors, which unsurprisingly renders them uncompetitive. For example, a comparison of synthetic diesel produced from CO2 (from an anaerobic digester) and hydrogen (from natural gas) with fossil fuels suggests
42
that the former are twice as expensive to produce as conventional transport fuels, assuming large production scales(75). However, the authors point out that using more advanced CO2 capture and conversion technologies and improving the economies of scale may make synthetic fuels competitive with fossil fuels. Thus, the technology maturity as well as the economies of scale need to be considered when benchmarking CCU against others systems to ensure fair comparisons.
Another aspect to consider when benchmarking CCU with other technologies is the basis of comparison. As argued in this report, such comparison should be carried out based on the service provided by the CCU system, particularly with respect to energy storage within an integrated energy system. A typical example is the prospective power to gas system which is sometimes cited as a key storage technology to enable a 100% renewable electricity grid (76). However, the costs of producing synthetic natural gas are estimated to be, in 2050, between 2 and 3.5 times higher than the present wholesale price of fossil natural gas. Under these conditions, a carbon tax at 220 €/t CO2 would be necessary to compensate the higher production costs, assuming recovery of co-products, and 330 €/t CO2 without. Here we see a systematic deficiency; the reference frame for cost analysis is different for CCU and fossil systems and the analysis does not consider the fact that fossil NG is to be retired from the energy system. It remains in general a questionable assumption to project present-day cost of fossil energy carriers so far in the future when looking at the cost evolution of energy carriers in the past (77).
If benchmarking was performed purely on the basis of costs in comparison with fossil fuels, this CCU system would be rendered uncompetitive. However, if the comparison is on the basis of the service provided by the CCU system by enabling the full decarbonisation of the electricity grid, then the conclusions may be quite different. In such a case, the CCU system must be compared against alternative systems providing the same service (i.e. involving energy storage, biofuels, BECCS, etc.).
CCU systems are energy intensive and their overall operating costs are strongly influenced by the cost of renewable electricity available for the system. Low-cost surplus electricity from intermittent RES is likely to be available only during brief periods from the general power grid. The ensuing need for intermittent operation of the CCU system raises the problem of low capacity factors for most of the capital-intensive equipment in the system. This will be a critical factor affecting the economic viability. Using cost data from a JRC study (67, 78) even at an unrealistic capacity factor (8000 h/year) and large scale (0.64 MtCO2/yr), the cost of CO2 avoided in a methanol production plant from CO2, using renewable electricity to make hydrogen, remains quite high (520 €/t CO2 avoided) when the electricity cost is assumed to be 0.095 €/kWhe. In a dynamically operated plant, such costs would even be higher. However, if the pricing system of future electricity grids took into consideration the fact that renewable electricity comes without fuel cost we may see lower prices for bulk electricity consumers. If, alternatively, the CCU plant operator generated dedicated renewable electricity for the CCU process and sold defossilised backup power to the grid during demand peaks, the economics would drastically change. Evidently, the same principle should apply to competing technologies when providing defossilised
43
back-up power during demand peaks. If the conditions for the CCU system change, a complete reconsideration of the reference system without CCU, using the same conditions/advantages, would be needed. No specific technology should be allowed to profit from regulatory conditions that competitors (providing exactly the same services) could not profit from.
3.5 SOCIAL ASPECTS A range of sustainability issues will be relevant to CCU, including the employment opportunities created by CCU systems and health and safety associated with the production and use of CCU products. However, little is known about the social sustainability of CCU. Like the environmental impacts and costs, these should also be evaluated on a systemic basis (see Figure 3.2) to capture all relevant issues in the CCU supply chains.
One of the critical issues for social sustainability of CCU will be public acceptance of CCU systems and products (see Figure 6.1 and Table 7.1). As this is a developing technology, it is to be expected that the public in Europe will have low levels of awareness of CCU. A recent study in the UK(79) showed a very low level of public awareness of CCU – only 9% of the respondents expressed confidence in knowing what it was. The study also demonstrated that the public found certain aspects of CCU too complex to comprehend. Such poor understanding of CCU within the general public may hinder its future deployment. However, they also argued that low levels of awareness and understanding of CCU also mean that there is a considerable potential for public perception to be shaped by relevant stakeholders (79). Thus, it is recommended to carry out a similar study at the EU level and, based on the findings, formulate a strategy for raising stakeholder and public awareness of CCU and addressing any concerns they may have at an early stage.
44
4. Technology overview
This Chapter provides the quantitative techno-economic figures required for the assessment of the various aspects of the CCU framework. Such aspects include power generation, mobility, CO2 capture, H2 generation and CO2 conversion.
4.1 POWER GENERATIONRecently, the power generation sector has been riding a wave of a grand transformation. Due to the necessity of decreasing environmental impacts, we are observing a shift from fossil fuel-based power plants to a variety of technologies based on renewable energy sources, including hydroelectric power plants, solar photovoltaic (PV) panels and wind turbines, power plants based on concentrated solar, geothermal energy plants, biofuels and the renewable part of waste, as well as generation units based on tidal power and wave and ocean energy. Furthermore, hydrogen-based technologies, such as fuel cells, are being developed and tested around the world.
The share of renewable energy in gross final energy consumption in EU has almost doubled in recent years, going from 8.5% in 2004 up to 16.7% in 2015 (77) and the trend is expected to continue in the future. In 2015, electricity generation from RES contributed for more than one quarter (29.9%) to the total EU-28 gross electricity production (3234 TWh). It was followed by nuclear power plants (26.5%) and coal fired power plants (24.5%). Lower shares were noticed for gas (16.4%), oil (1.9%) and non-renewable wastes (0.7%) (80). The growth in electricity generated from RES during the 2004 to 2015 period largely reflects a rapid expansion of mainly three renewable energy sources across the EU: wind power, solar power and solid biofuels (including renewable waste). The EU reference scenario 2016 shows that the EU power generation mix will continue to shift considerably in favour of renewables (81). Among all RES, solar and wind will reach around 19% of the total net electricity generation in 2020, 25% in 2030 and 36% in 2050. This will lead to an increased variability of the power generation, demonstrating the growing need for flexibility. Energy storage will be a key component of future energy systems as they integrate several sectors and are a precondition for a 100% RES energy system. The concept of a 100% RES energy system has been proven by researchers to be technically viable in several EU countries (82, 83), and recently for the complete European Union (84).
In the following, we focus on a few relevant options, namely natural gas, hydrogen, solar, wind and hydropower, and provide the major figures required for the aforementioned calculation.
4.1.1 Natural gas
In 2015, natural gas contributed 497 TWh for the 16.4% of the total gross electricity production in the EU-28 (80). It can be converted into electricity (generating heat as a by-product) by using various technologies, the most deployed being gas turbines. Here, we focus on natural gas combined cycles (NGCC), considered as the state-of-the-art solution. This consists of a gas turbine whose hot exhaust powers a steam power plant.
45
NGCC features a net electrical efficiency (from methane LHV) in the range of 55-60% (85), and life cycle GHG emissions in the range of 350-400 gCO2eq./kWh.(86) Typical investment costs are in the range of 800-900 $/kW (85), whereas O&M costs vary in the range of 2-4 $/MWh turning into a levelised cost of electricity (LCOE) for Europe in the range of 70-100 $/MWh (55).
4.1.2 Hydrogen
Hydrogen can be converted into electricity (generating heat as a by-product) by using different types of fuel cells, the most deployed solution being proton exchange membrane fuel cell (PEMFC) (87). This type of fuel cell features an electric efficiency (from hydrogen LHV), in the range of 40-55%, and a life cycle GHG emissions in the range of 25-40 gCO2eq./kW.(88) Typical values of investment costs are in the range of 3000-4000 $/kW, whereas O&M costs are about 10% of the capital cost (87). In this case, the LCOE strongly depends on the levelised cost of hydrogen. Note that similar data would be used for solid oxide fuel cells (SOFC), characterised by a higher conversion efficiency and installation costs.
4.1.3 Solar power
Solar energy is harnessed by using photovoltaic (PV) panels and concentrated solar power (CSP) plants to generate electricity. In the last years, the growth in electricity production from solar in EU-28 was dramatic, rising from just 1.5 TWh in 2005 to 107.9 TWh in 2015, overtaking geothermal energy in 2008. Over this 10-year period, the contribution of solar power to the entire renewable electricity generated in the EU-28 rose from 0.3% to about 12% (77). In the case of solar energy, we do not refer to the conversion efficiency from solar radiation to electricity (around 15% (89)), but rather to the rated power per square meter, or density factor. Moreover, it must be noted that the intermittency of solar energy translates into a limited utilisation along the year. A capacity factor is defined, which indicates the fraction of hours of the year where the solar power plant produces energy. Average values of density factors are around 200 W/m2 (90), whereas an average capacity factor for Germany is around 12% (91). Crystalline PV panels feature a life cycle GHG emissions in the range of 25-180 gCO2eq./kWh (86). Typical values of investment and O&M costs are close to 300 $/m2, and 2 $/m2a (92), respectively, turning into a LCOE for Europe in the range of 70-150 $/MWh (55).
4.1.4 Wind power
Wind energy is converted into electricity through wind turbines. The quantity of electricity generated in the EU-28 from wind turbines increased by a factor of 4.3 from 2005 to 2015; as a result, the shares of wind power in the total quantity of renewable electricity generated rose to 31.3% in 2015 (77). Similar to solar, density and capacity factors are defined. The density factor depends on the size of the turbine, with average values for onshore wind around 1-4 W/m2 (much lower than for solar) (93), whereas an average capacity factor for Germany is around 17% (91). A great variability is observed for onshore wind the life cycle GHG emissions, ranging from 5 to 200 gCO2eq./kWh (86). Typical values of investment and
46
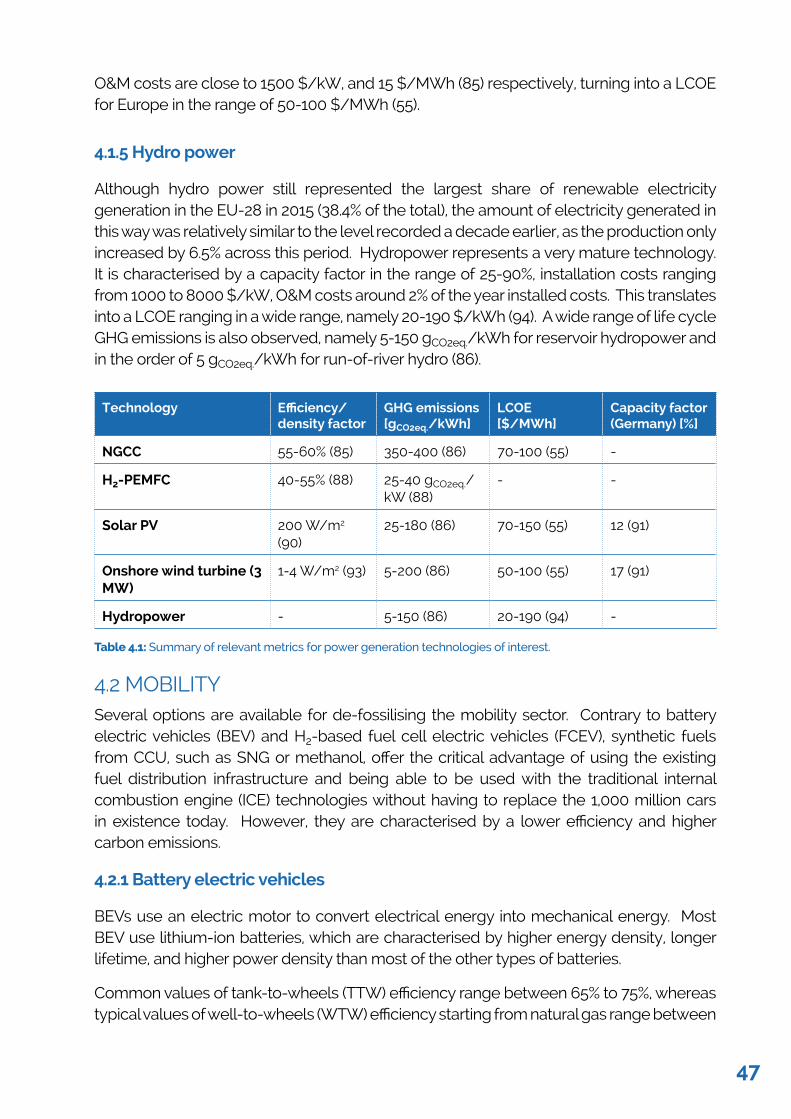
O&M costs are close to 1500 $/kW, and 15 $/MWh (85) respectively, turning into a LCOE for Europe in the range of 50-100 $/MWh (55).
4.1.5 Hydro power
Although hydro power still represented the largest share of renewable electricity generation in the EU-28 in 2015 (38.4% of the total), the amount of electricity generated in this way was relatively similar to the level recorded a decade earlier, as the production only increased by 6.5% across this period. Hydropower represents a very mature technology. It is characterised by a capacity factor in the range of 25-90%, installation costs ranging from 1000 to 8000 $/kW, O&M costs around 2% of the year installed costs. This translates into a LCOE ranging in a wide range, namely 20-190 $/kWh (94). A wide range of life cycle GHG emissions is also observed, namely 5-150 gCO2eq./kWh for reservoir hydropower and in the order of 5 gCO2eq./kWh for run-of-river hydro (86).
Technology Efficiency/ density factor
GHG emissions [gCO2eq./kWh]
LCOE[$/MWh]
Capacity factor (Germany) [%]
NGCC 55-60% (85) 350-400 (86) 70-100 (55) -
H2-PEMFC 40-55% (88) 25-40 gCO2eq./kW (88)
- -
Solar PV 200 W/m2 (90)
25-180 (86) 70-150 (55) 12 (91)
Onshore wind turbine (3 MW)
1-4 W/m2 (93) 5-200 (86) 50-100 (55) 17 (91)
Hydropower - 5-150 (86) 20-190 (94) -
Table 4.1: Summary of relevant metrics for power generation technologies of interest.
4.2 MOBILITYSeveral options are available for de-fossilising the mobility sector. Contrary to battery electric vehicles (BEV) and H2-based fuel cell electric vehicles (FCEV), synthetic fuels from CCU, such as SNG or methanol, offer the critical advantage of using the existing fuel distribution infrastructure and being able to be used with the traditional internal combustion engine (ICE) technologies without having to replace the 1,000 million cars in existence today. However, they are characterised by a lower efficiency and higher carbon emissions.
4.2.1 Battery electric vehicles
BEVs use an electric motor to convert electrical energy into mechanical energy. Most BEV use lithium-ion batteries, which are characterised by higher energy density, longer lifetime, and higher power density than most of the other types of batteries.
Common values of tank-to-wheels (TTW) efficiency range between 65% to 75%, whereas typical values of well-to-wheels (WTW) efficiency starting from natural gas range between
47
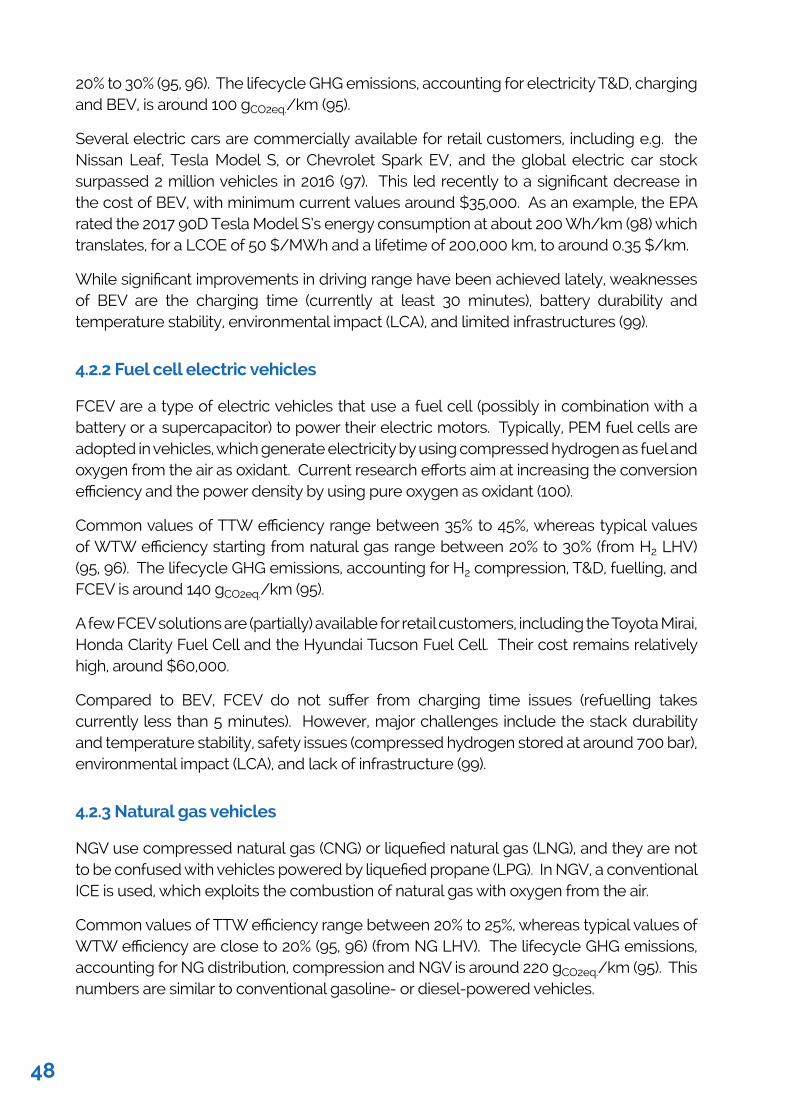
20% to 30% (95, 96). The lifecycle GHG emissions, accounting for electricity T&D, charging and BEV, is around 100 gCO2eq./km (95).
Several electric cars are commercially available for retail customers, including e.g. the Nissan Leaf, Tesla Model S, or Chevrolet Spark EV, and the global electric car stock surpassed 2 million vehicles in 2016 (97). This led recently to a significant decrease in the cost of BEV, with minimum current values around $35,000. As an example, the EPA rated the 2017 90D Tesla Model S’s energy consumption at about 200 Wh/km (98) which translates, for a LCOE of 50 $/MWh and a lifetime of 200,000 km, to around 0.35 $/km.
While significant improvements in driving range have been achieved lately, weaknesses of BEV are the charging time (currently at least 30 minutes), battery durability and temperature stability, environmental impact (LCA), and limited infrastructures (99).
4.2.2 Fuel cell electric vehicles
FCEV are a type of electric vehicles that use a fuel cell (possibly in combination with a battery or a supercapacitor) to power their electric motors. Typically, PEM fuel cells are adopted in vehicles, which generate electricity by using compressed hydrogen as fuel and oxygen from the air as oxidant. Current research efforts aim at increasing the conversion efficiency and the power density by using pure oxygen as oxidant (100).
Common values of TTW efficiency range between 35% to 45%, whereas typical values of WTW efficiency starting from natural gas range between 20% to 30% (from H2 LHV) (95, 96). The lifecycle GHG emissions, accounting for H2 compression, T&D, fuelling, and FCEV is around 140 gCO2eq./km (95).
A few FCEV solutions are (partially) available for retail customers, including the Toyota Mirai, Honda Clarity Fuel Cell and the Hyundai Tucson Fuel Cell. Their cost remains relatively high, around $60,000.
Compared to BEV, FCEV do not suffer from charging time issues (refuelling takes currently less than 5 minutes). However, major challenges include the stack durability and temperature stability, safety issues (compressed hydrogen stored at around 700 bar), environmental impact (LCA), and lack of infrastructure (99).
4.2.3 Natural gas vehicles
NGV use compressed natural gas (CNG) or liquefied natural gas (LNG), and they are not to be confused with vehicles powered by liquefied propane (LPG). In NGV, a conventional ICE is used, which exploits the combustion of natural gas with oxygen from the air.
Common values of TTW efficiency range between 20% to 25%, whereas typical values of WTW efficiency are close to 20% (95, 96) (from NG LHV). The lifecycle GHG emissions, accounting for NG distribution, compression and NGV is around 220 gCO2eq./km (95). This numbers are similar to conventional gasoline- or diesel-powered vehicles.
48
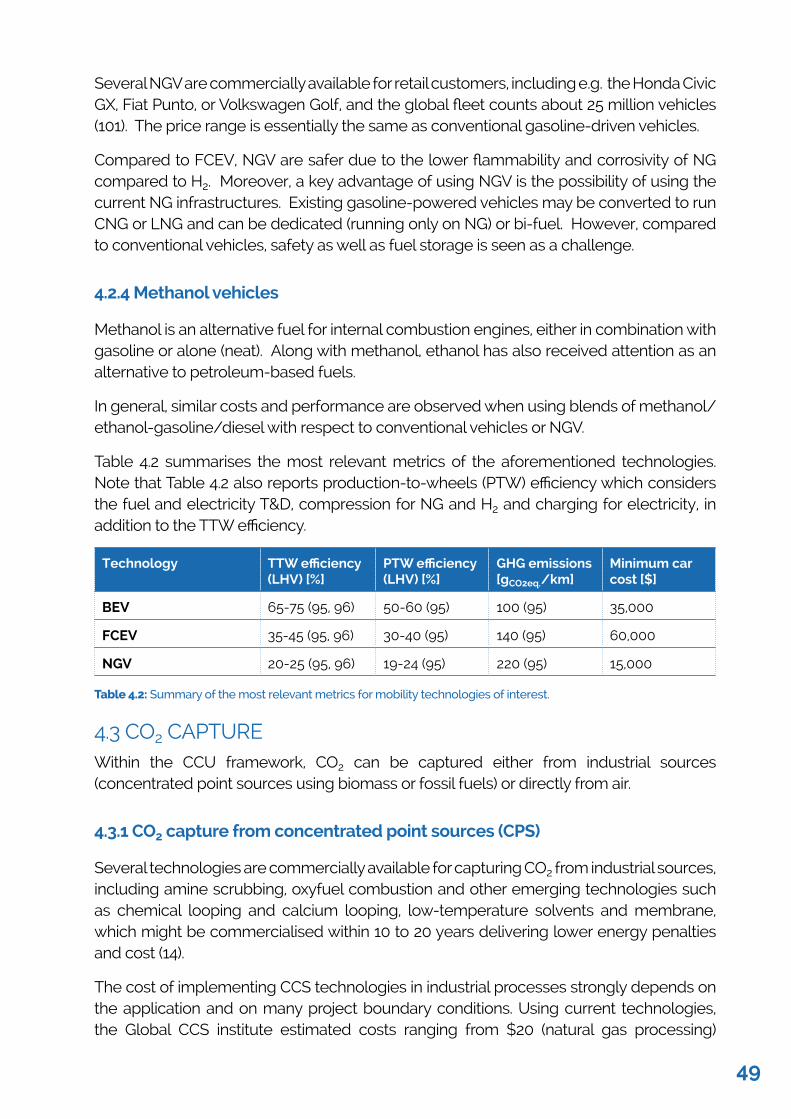
Several NGV are commercially available for retail customers, including e.g. the Honda Civic GX, Fiat Punto, or Volkswagen Golf, and the global fleet counts about 25 million vehicles (101). The price range is essentially the same as conventional gasoline-driven vehicles.
Compared to FCEV, NGV are safer due to the lower flammability and corrosivity of NG compared to H2. Moreover, a key advantage of using NGV is the possibility of using the current NG infrastructures. Existing gasoline-powered vehicles may be converted to run CNG or LNG and can be dedicated (running only on NG) or bi-fuel. However, compared to conventional vehicles, safety as well as fuel storage is seen as a challenge.
4.2.4 Methanol vehicles
Methanol is an alternative fuel for internal combustion engines, either in combination with gasoline or alone (neat). Along with methanol, ethanol has also received attention as an alternative to petroleum-based fuels.
In general, similar costs and performance are observed when using blends of methanol/ethanol-gasoline/diesel with respect to conventional vehicles or NGV.
Table 4.2 summarises the most relevant metrics of the aforementioned technologies. Note that Table 4.2 also reports production-to-wheels (PTW) efficiency which considers the fuel and electricity T&D, compression for NG and H2 and charging for electricity, in addition to the TTW efficiency.
Technology TTW efficiency (LHV) [%]
PTW efficiency (LHV) [%]
GHG emissions [gCO2eq./km]
Minimum car cost [$]
BEV 65-75 (95, 96) 50-60 (95) 100 (95) 35,000
FCEV 35-45 (95, 96) 30-40 (95) 140 (95) 60,000
NGV 20-25 (95, 96) 19-24 (95) 220 (95) 15,000
Table 4.2: Summary of the most relevant metrics for mobility technologies of interest.
4.3 CO2 CAPTURE Within the CCU framework, CO2 can be captured either from industrial sources (concentrated point sources using biomass or fossil fuels) or directly from air.
4.3.1 CO2 capture from concentrated point sources (CPS)
Several technologies are commercially available for capturing CO2 from industrial sources, including amine scrubbing, oxyfuel combustion and other emerging technologies such as chemical looping and calcium looping, low-temperature solvents and membrane, which might be commercialised within 10 to 20 years delivering lower energy penalties and cost (14).
The cost of implementing CCS technologies in industrial processes strongly depends on the application and on many project boundary conditions. Using current technologies, the Global CCS institute estimated costs ranging from $20 (natural gas processing)
49
to about $200 (cement) per ton of CO2 avoided (102), while the cost of CO2 capture in power generation was around $60/tonCO2 in 2012 and predicted to go below $40/tonCO2 in 2020 (102).
4.3.2 Direct CO2 capture from air (DAC)
DAC is the process of removing CO2 from the air and generating a concentrated stream of CO2 for sequestration or utilisation. When the carbon is permanently stored, it belongs to a group of technologies referred to as negative emissions, or carbon dioxide removal (CDR) technologies, such as, e.g., bioenergy enhanced carbon capture and storage (BECCS) or reforestation (103).
Compared with traditional CO2 capture from concentrated point sources, DAC offers both advantages and disadvantages. Among the advantages, it is clear that net-negative global emissions are needed to reach the climate change mitigation targets (104). Furthermore, DAC offers an alternative to address carbon emissions from distributed sources, such as vehicles. Moreover, DAC could be installed to manage fugitive emissions from the CCS network and leakage from geological formations. It has been suggested that DAC technologies could potentially be situated anywhere provided there is access to an available energy source and sequestration sites. However, there are also significant disadvantages to the technology. Removing and concentrating CO2 from air (390 ppm) to a pure stream (> 90%) implies a greater energy input and treated gas volume than CO2 capture from concentrated point sources. For example, the thermodynamic minimum energy required to extract CO2 from ambient air is about 250 kWh/tonCO2, much higher than the theoretical values of about 100 and 65 kWh/tonCO2 to capture and concentrate CO2 from natural gas and coal power plants, respectively (103). A thermal energy consumption around 2000 kWh/tonCO2 is considered (105). Furthermore, similarly to distributed renewable energy sources, a density factor is defined to assess the footprint of DAC, with values in the range of 0.1-0.4 m2/tonCO2 (106).
Similarly, DAC is currently more expensive than CO2 capture from point sources, with costs ranging from 200 to 1000 $/tonCO2 (103, 107).
Technology Thermal energy consumption [kWh/tonCO2]
Efficiency penalty [%]
Density factor [m2/tonCO2a]
Cost [$/tonCO2]
CPS 270-320 (103, 107)
-7% (108) - 40-60 (109)
DAC 2000 (105) - 0.1-0.4 (106) 200-1000 (103, 107)
Table 4.3: Summary of relevant metrics for CO2 capture technologies of interest.
4.4 H2 GENERATION Different options for hydrogen production include hydrocarbons steam reforming, as well as electrochemical and thermochemical water splitting. Although the former still represents the dominant technology, we focus on water electrolysis, which is seen as the
50
most promising solution to convert renewable-based electricity into hydrogen. In specific, three types of electrolysers, characterised by a different level of maturity, are listed below.
4.4.1 Alkaline electrolyser
Water electrolysis has been commercially available for decades in the form of alkaline electrolysers, which is the most mature and well understood technology. Here, an aqueous alkaline solution (KOH or NaOH) is used as the electrolyte. A-line electrolysers work either under atmospheric or elevated pressure. In general, a major advantage of high-pressure electrolysis is that H2 is compressed using a smaller additional energy input than the one required for mechanical compression (110).
Several vendors offer such systems, with a production capacity of to 750 Nm3/h. The conversion efficiency (from electricity to hydrogen LHV) range from 65% to 75% (electrolysis only) or 50% to 65% (including auxiliary consumptions), with an electricity consumption ranging from 4.3 to 5.3 kWh/Nm3
H2 (111). The life cycle GHG emissions, considering electricity coming from wind, are in the range of 35-100 gCO2eq./kWhH2 (112).
As an example, A-line electrolysers from NEL hydrogen are characterised by an efficiency ranging from 61% to 71% turning into a (very low) electricity consumption of 3.8-4.4 kWh/Nm3
H2. The design operating temperature is 80 °C and H2 is yielded at a pressure ranging from 30 to 200 bar (113).
Typical installation costs are around 1500 €/kW (87, 114). Advantages of the technology include cost and lifetime, whereas disadvantages include slow start time, low power density, narrow operation range and high maintenance costs (111).
4.4.2 Proton exchange membrane (PEM) electrolyser
PEM electrolysers(49, 115, 116) are currently under development and a few commercial products started to be available(117) in recent years. The technology is based on solid polymeric membranes and can work either under atmospheric or elevated pressure.
A few vendors offer such systems, with a production capacity up to 450 Nm3/h. The conversion efficiency ranges from 65% to 75% (electrolysis only) or 50% to 70% (including auxiliary consumptions), with an electricity consumption ranging from 4.1 to 5 kWh/Nm3
H2 (111). The life cycle GHG emissions, considering electricity coming from wind, are in the range of 5-80 gCO2eq./kWhH2 (112, 118).
As an example, the Siemens Silyzer 100 features an efficiency ranging from 50% to 55% equating to electricity consumption of around 5 kWh/Nm3
H2. The design operating temperature is 80 °C and H2 is yielded at a pressure ranging from 5 to 50 bar (119).
Typical installation costs are around 2500 €/kW (87, 114). Advantages of the technology include fast dynamics, high power density, low minimum load and absence of corrosive substances, whereas disadvantages include cost and fast degradation (111).
51
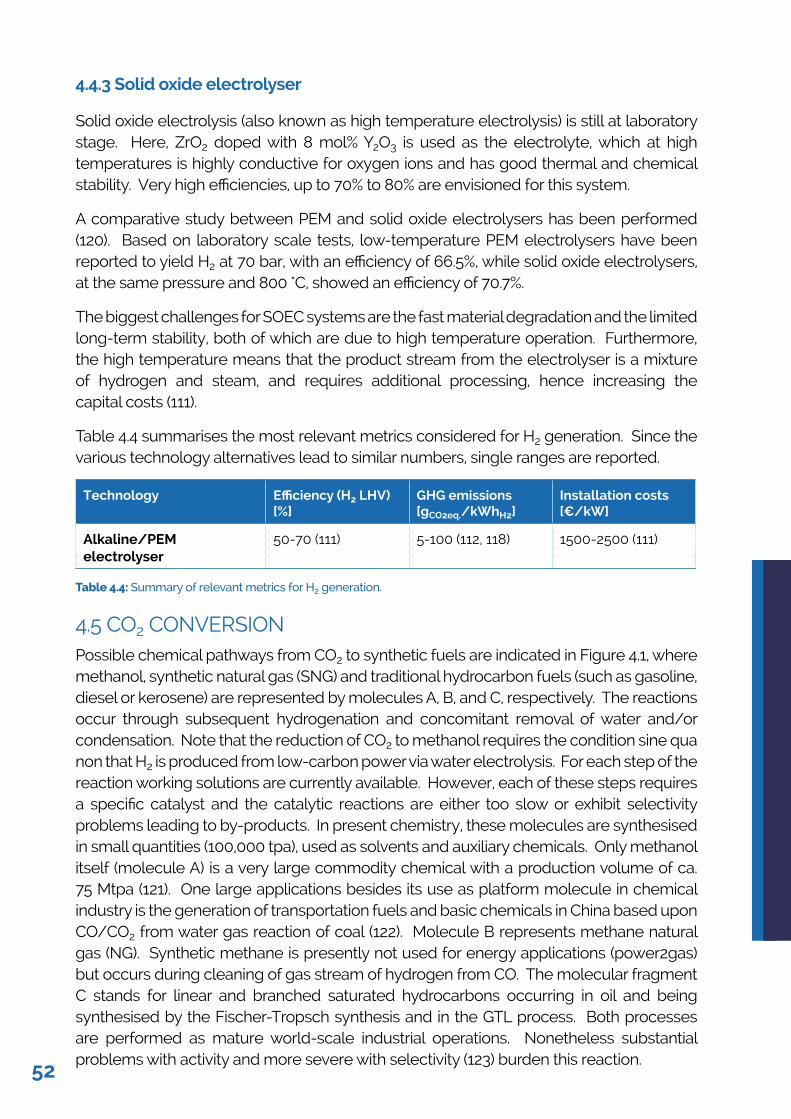
4.4.3 Solid oxide electrolyser
Solid oxide electrolysis (also known as high temperature electrolysis) is still at laboratory stage. Here, ZrO2 doped with 8 mol% Y2O3 is used as the electrolyte, which at high temperatures is highly conductive for oxygen ions and has good thermal and chemical stability. Very high efficiencies, up to 70% to 80% are envisioned for this system.
A comparative study between PEM and solid oxide electrolysers has been performed (120). Based on laboratory scale tests, low-temperature PEM electrolysers have been reported to yield H2 at 70 bar, with an efficiency of 66.5%, while solid oxide electrolysers, at the same pressure and 800 °C, showed an efficiency of 70.7%.
The biggest challenges for SOEC systems are the fast material degradation and the limited long-term stability, both of which are due to high temperature operation. Furthermore, the high temperature means that the product stream from the electrolyser is a mixture of hydrogen and steam, and requires additional processing, hence increasing the capital costs (111).
Table 4.4 summarises the most relevant metrics considered for H2 generation. Since the various technology alternatives lead to similar numbers, single ranges are reported.
Technology Efficiency (H2 LHV) [%]
GHG emissions [gCO2eq./kWhH2]
Installation costs[€/kW]
Alkaline/PEM electrolyser
50-70 (111) 5-100 (112, 118) 1500-2500 (111)
Table 4.4: Summary of relevant metrics for H2 generation.
4.5 CO2 CONVERSIONPossible chemical pathways from CO2 to synthetic fuels are indicated in Figure 4.1, where methanol, synthetic natural gas (SNG) and traditional hydrocarbon fuels (such as gasoline, diesel or kerosene) are represented by molecules A, B, and C, respectively. The reactions occur through subsequent hydrogenation and concomitant removal of water and/or condensation. Note that the reduction of CO2 to methanol requires the condition sine qua non that H2 is produced from low-carbon power via water electrolysis. For each step of the reaction working solutions are currently available. However, each of these steps requires a specific catalyst and the catalytic reactions are either too slow or exhibit selectivity problems leading to by-products. In present chemistry, these molecules are synthesised in small quantities (100,000 tpa), used as solvents and auxiliary chemicals. Only methanol itself (molecule A) is a very large commodity chemical with a production volume of ca. 75 Mtpa (121). One large applications besides its use as platform molecule in chemical industry is the generation of transportation fuels and basic chemicals in China based upon CO/CO2 from water gas reaction of coal (122). Molecule B represents methane natural gas (NG). Synthetic methane is presently not used for energy applications (power2gas) but occurs during cleaning of gas stream of hydrogen from CO. The molecular fragment C stands for linear and branched saturated hydrocarbons occurring in oil and being synthesised by the Fischer-Tropsch synthesis and in the GTL process. Both processes are performed as mature world-scale industrial operations. Nonetheless substantial problems with activity and more severe with selectivity (123) burden this reaction.
52
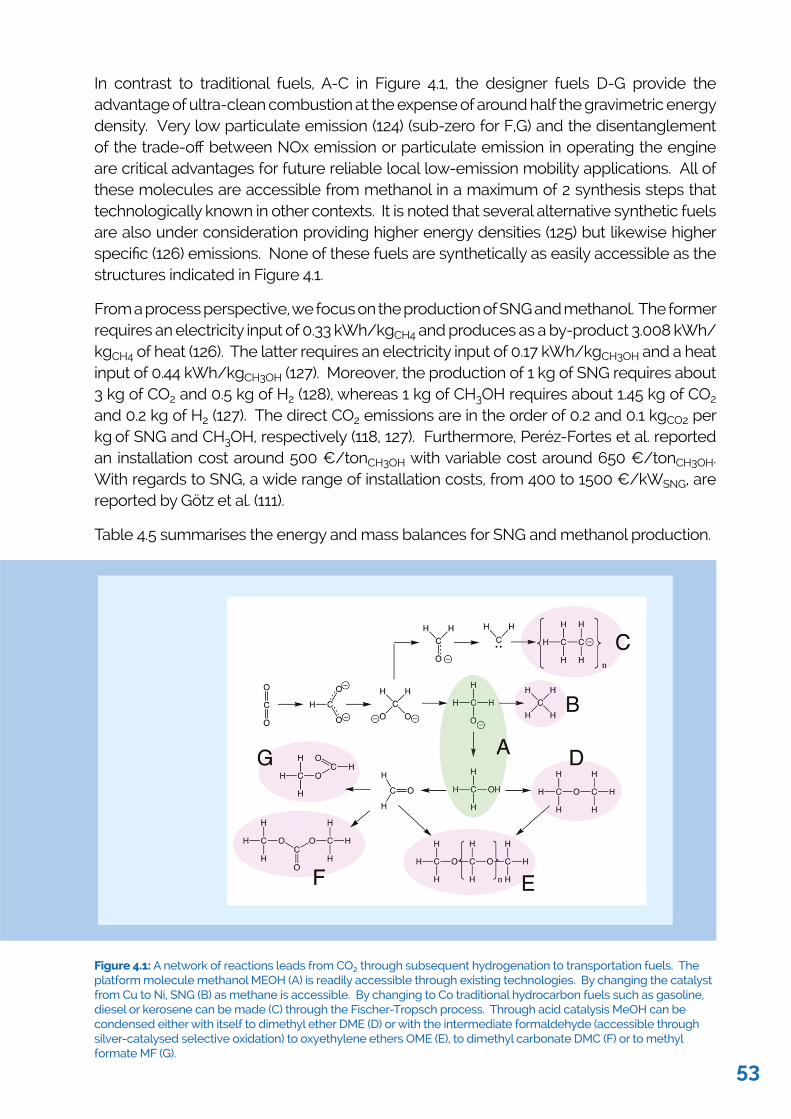
In contrast to traditional fuels, A-C in Figure 4.1, the designer fuels D-G provide the advantage of ultra-clean combustion at the expense of around half the gravimetric energy density. Very low particulate emission (124) (sub-zero for F,G) and the disentanglement of the trade-off between NOx emission or particulate emission in operating the engine are critical advantages for future reliable local low-emission mobility applications. All of these molecules are accessible from methanol in a maximum of 2 synthesis steps that technologically known in other contexts. It is noted that several alternative synthetic fuels are also under consideration providing higher energy densities (125) but likewise higher specific (126) emissions. None of these fuels are synthetically as easily accessible as the structures indicated in Figure 4.1.
From a process perspective, we focus on the production of SNG and methanol. The former requires an electricity input of 0.33 kWh/kgCH4 and produces as a by-product 3.008 kWh/kgCH4 of heat (126). The latter requires an electricity input of 0.17 kWh/kgCH3OH and a heat input of 0.44 kWh/kgCH3OH (127). Moreover, the production of 1 kg of SNG requires about 3 kg of CO2 and 0.5 kg of H2 (128), whereas 1 kg of CH3OH requires about 1.45 kg of CO2 and 0.2 kg of H2 (127). The direct CO2 emissions are in the order of 0.2 and 0.1 kgCO2 per kg of SNG and CH3OH, respectively (118, 127). Furthermore, Peréz-Fortes et al. reported an installation cost around 500 €/tonCH3OH with variable cost around 650 €/tonCH3OH. With regards to SNG, a wide range of installation costs, from 400 to 1500 €/kWSNG, are reported by Götz et al. (111).
Table 4.5 summarises the energy and mass balances for SNG and methanol production.
Figure 4.1: A network of reactions leads from CO2 through subsequent hydrogenation to transportation fuels. The platform molecule methanol MEOH (A) is readily accessible through existing technologies. By changing the catalyst from Cu to Ni, SNG (B) as methane is accessible. By changing to Co traditional hydrocarbon fuels such as gasoline, diesel or kerosene can be made (C) through the Fischer-Tropsch process. Through acid catalysis MeOH can be condensed either with itself to dimethyl ether DME (D) or with the intermediate formaldehyde (accessible through silver-catalysed selective oxidation) to oxyethylene ethers OME (E), to dimethyl carbonate DMC (F) or to methyl formate MF (G).
53
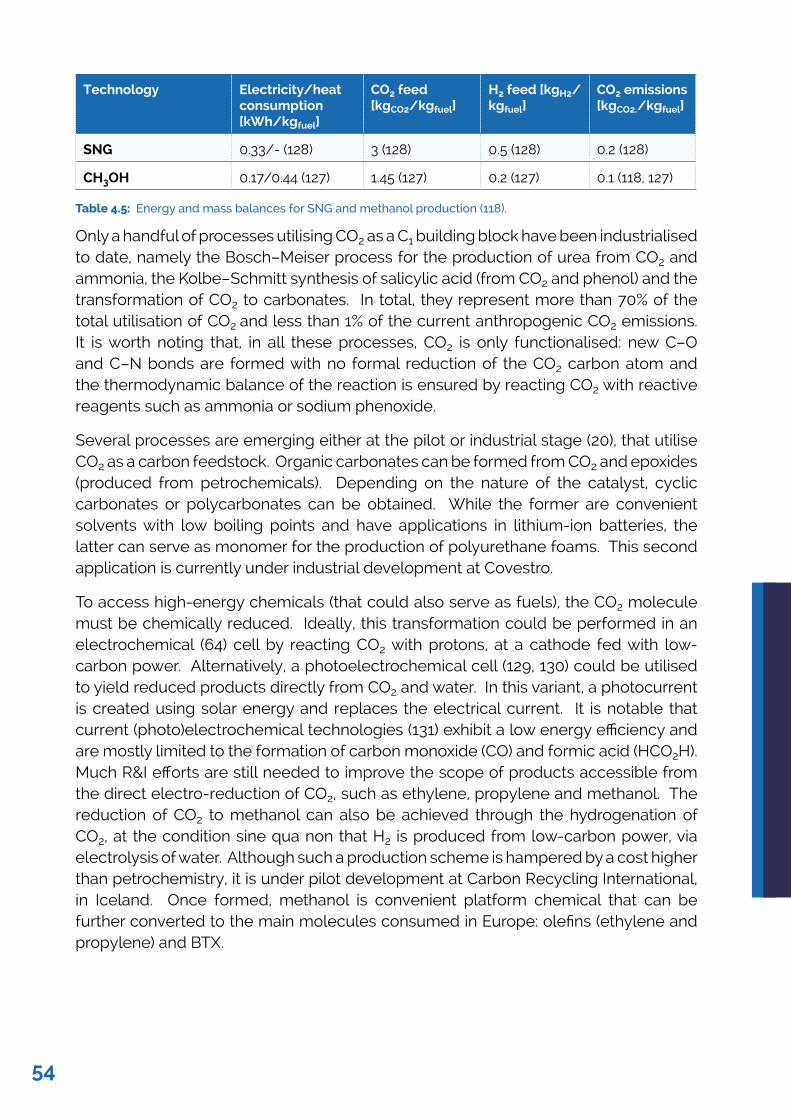
Technology Electricity/heat consumption [kWh/kgfuel]
CO2 feed [kgCO2/kgfuel]
H2 feed [kgH2/kgfuel]
CO2 emissions [kgCO2./kgfuel]
SNG 0.33/- (128) 3 (128) 0.5 (128) 0.2 (128)
CH3OH 0.17/0.44 (127) 1.45 (127) 0.2 (127) 0.1 (118, 127)
Table 4.5: Energy and mass balances for SNG and methanol production (118).
Only a handful of processes utilising CO2 as a C1 building block have been industrialised to date, namely the Bosch–Meiser process for the production of urea from CO2 and ammonia, the Kolbe–Schmitt synthesis of salicylic acid (from CO2 and phenol) and the transformation of CO2 to carbonates. In total, they represent more than 70% of the total utilisation of CO2 and less than 1% of the current anthropogenic CO2 emissions. It is worth noting that, in all these processes, CO2 is only functionalised: new C–O and C–N bonds are formed with no formal reduction of the CO2 carbon atom and the thermodynamic balance of the reaction is ensured by reacting CO2 with reactive reagents such as ammonia or sodium phenoxide.
Several processes are emerging either at the pilot or industrial stage (20), that utilise CO2 as a carbon feedstock. Organic carbonates can be formed from CO2 and epoxides (produced from petrochemicals). Depending on the nature of the catalyst, cyclic carbonates or polycarbonates can be obtained. While the former are convenient solvents with low boiling points and have applications in lithium-ion batteries, the latter can serve as monomer for the production of polyurethane foams. This second application is currently under industrial development at Covestro.
To access high-energy chemicals (that could also serve as fuels), the CO2 molecule must be chemically reduced. Ideally, this transformation could be performed in an electrochemical (64) cell by reacting CO2 with protons, at a cathode fed with low-carbon power. Alternatively, a photoelectrochemical cell (129, 130) could be utilised to yield reduced products directly from CO2 and water. In this variant, a photocurrent is created using solar energy and replaces the electrical current. It is notable that current (photo)electrochemical technologies (131) exhibit a low energy efficiency and are mostly limited to the formation of carbon monoxide (CO) and formic acid (HCO2H). Much R&I efforts are still needed to improve the scope of products accessible from the direct electro-reduction of CO2, such as ethylene, propylene and methanol. The reduction of CO2 to methanol can also be achieved through the hydrogenation of CO2, at the condition sine qua non that H2 is produced from low-carbon power, via electrolysis of water. Although such a production scheme is hampered by a cost higher than petrochemistry, it is under pilot development at Carbon Recycling International, in Iceland. Once formed, methanol is convenient platform chemical that can be further converted to the main molecules consumed in Europe: olefins (ethylene and propylene) and BTX.
54
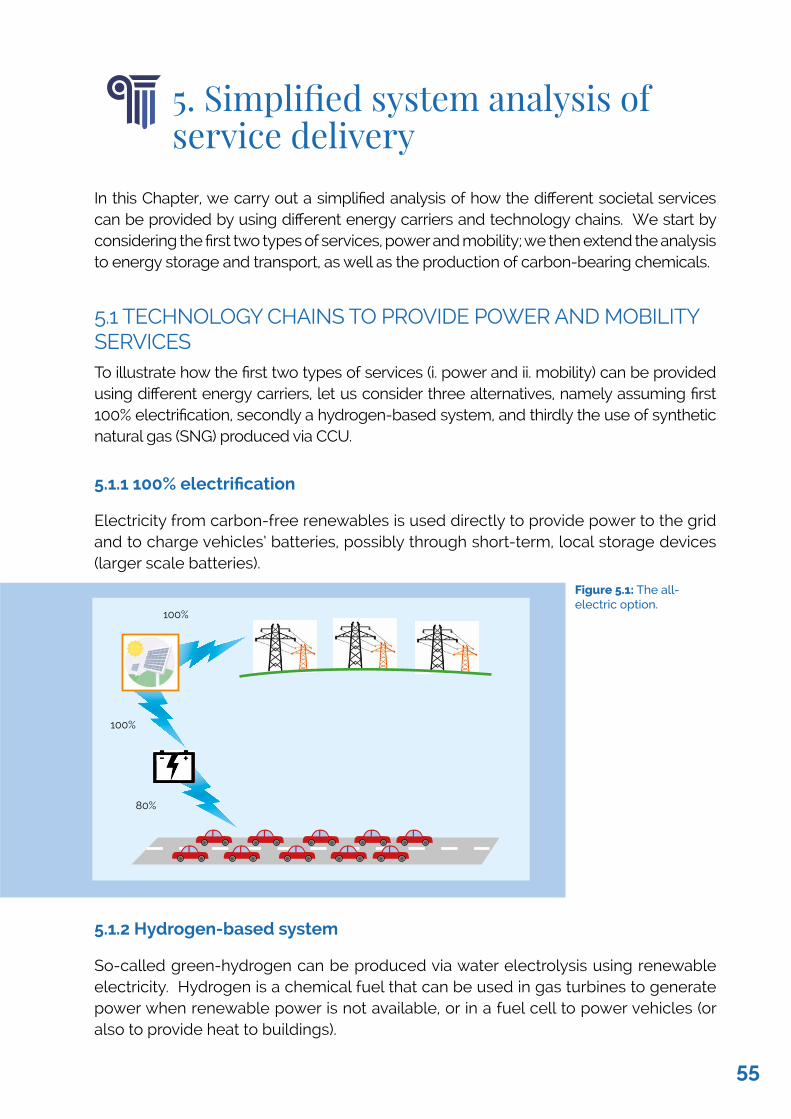
5. Simplified system analysis of service delivery
In this Chapter, we carry out a simplified analysis of how the different societal services can be provided by using different energy carriers and technology chains. We start by considering the first two types of services, power and mobility; we then extend the analysis to energy storage and transport, as well as the production of carbon-bearing chemicals.
5.1 TECHNOLOGY CHAINS TO PROVIDE POWER AND MOBILITY SERVICESTo illustrate how the first two types of services (i. power and ii. mobility) can be provided using different energy carriers, let us consider three alternatives, namely assuming first 100% electrification, secondly a hydrogen-based system, and thirdly the use of synthetic natural gas (SNG) produced via CCU.
5.1.1 100% electrification
Electricity from carbon-free renewables is used directly to provide power to the grid and to charge vehicles’ batteries, possibly through short-term, local storage devices (larger scale batteries).
5.1.2 Hydrogen-based system
So-called green-hydrogen can be produced via water electrolysis using renewable electricity. Hydrogen is a chemical fuel that can be used in gas turbines to generate power when renewable power is not available, or in a fuel cell to power vehicles (or also to provide heat to buildings).
100%
100%
80%
Figure 5.1: The all-electric option.
55
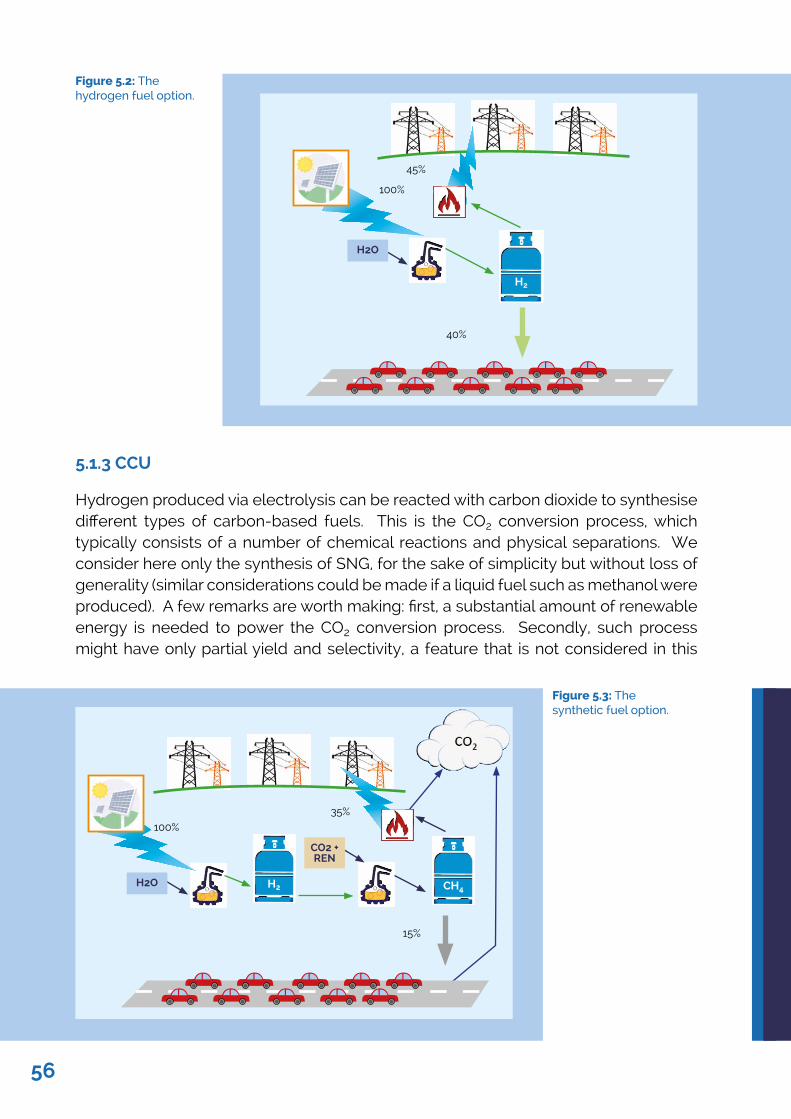
5.1.3 CCU
Hydrogen produced via electrolysis can be reacted with carbon dioxide to synthesise different types of carbon-based fuels. This is the CO2 conversion process, which typically consists of a number of chemical reactions and physical separations. We consider here only the synthesis of SNG, for the sake of simplicity but without loss of generality (similar considerations could be made if a liquid fuel such as methanol were produced). A few remarks are worth making: first, a substantial amount of renewable energy is needed to power the CO2 conversion process. Secondly, such process might have only partial yield and selectivity, a feature that is not considered in this
Figure 5.3: The synthetic fuel option.
40%
45%
100%
H2O
100%
35%
15%
H2O
CO2 + REN
Figure 5.2: The hydrogen fuel option.
H2
CH4H2
56
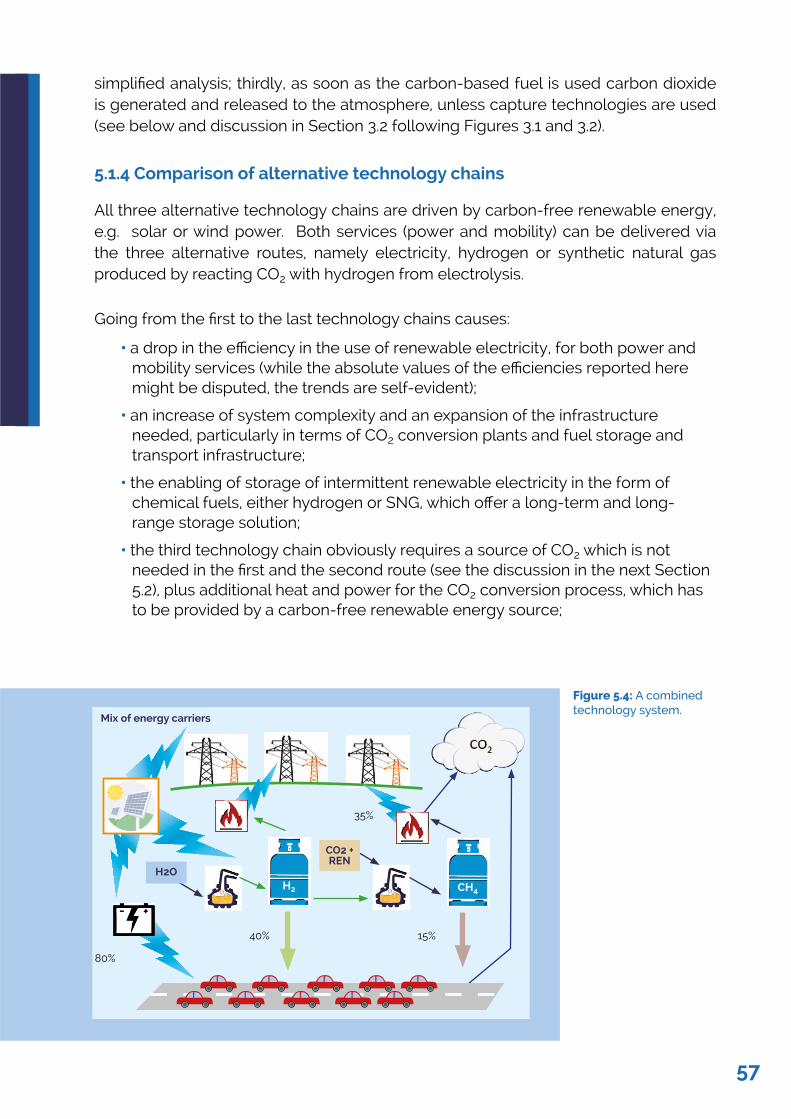
simplified analysis; thirdly, as soon as the carbon-based fuel is used carbon dioxide is generated and released to the atmosphere, unless capture technologies are used (see below and discussion in Section 3.2 following Figures 3.1 and 3.2).
5.1.4 Comparison of alternative technology chains
All three alternative technology chains are driven by carbon-free renewable energy, e.g. solar or wind power. Both services (power and mobility) can be delivered via the three alternative routes, namely electricity, hydrogen or synthetic natural gas produced by reacting CO2 with hydrogen from electrolysis.
Going from the first to the last technology chains causes:
• a drop in the efficiency in the use of renewable electricity, for both power and mobility services (while the absolute values of the efficiencies reported here might be disputed, the trends are self-evident);
• an increase of system complexity and an expansion of the infrastructure needed, particularly in terms of CO2 conversion plants and fuel storage and transport infrastructure;
• the enabling of storage of intermittent renewable electricity in the form of chemical fuels, either hydrogen or SNG, which offer a long-term and long-range storage solution;
• the third technology chain obviously requires a source of CO2 which is not needed in the first and the second route (see the discussion in the next Section 5.2), plus additional heat and power for the CO2 conversion process, which has to be provided by a carbon-free renewable energy source;
Figure 5.4: A combined technology system.
Mix of energy carriers
35%
15%40%
H2O
CO2 + REN
80%
CH4H2
57
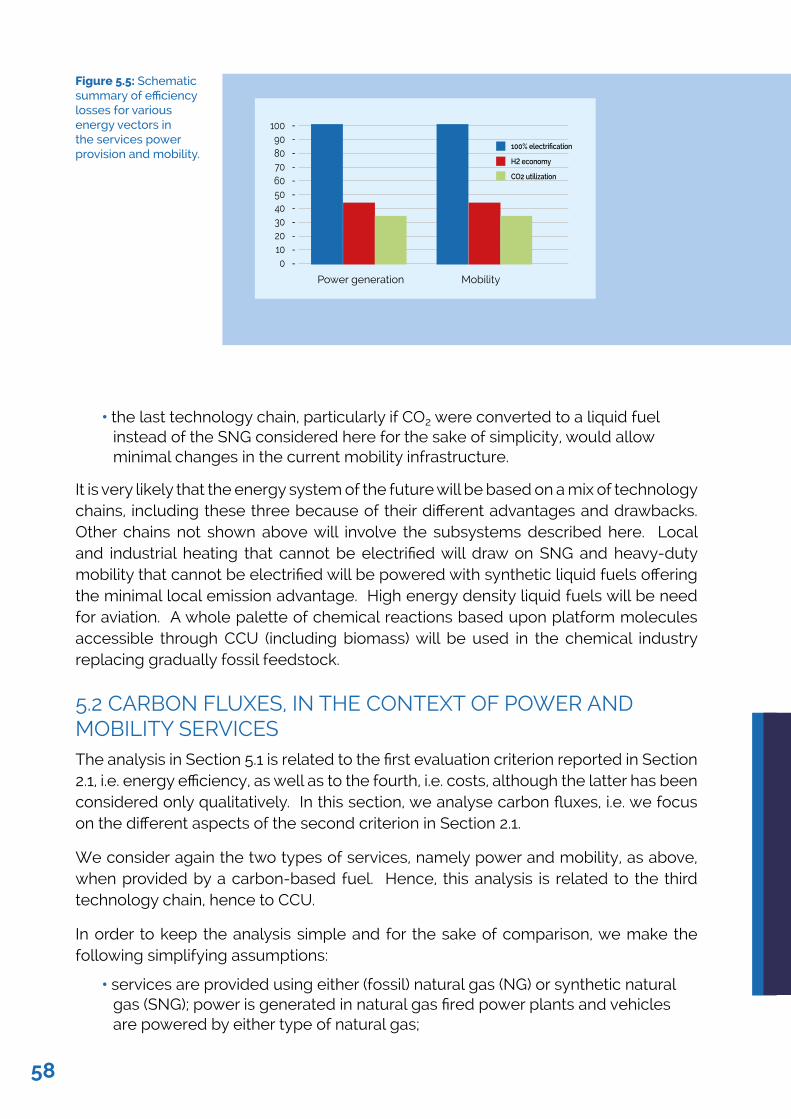
• the last technology chain, particularly if CO2 were converted to a liquid fuel instead of the SNG considered here for the sake of simplicity, would allow minimal changes in the current mobility infrastructure.
It is very likely that the energy system of the future will be based on a mix of technology chains, including these three because of their different advantages and drawbacks. Other chains not shown above will involve the subsystems described here. Local and industrial heating that cannot be electrified will draw on SNG and heavy-duty mobility that cannot be electrified will be powered with synthetic liquid fuels offering the minimal local emission advantage. High energy density liquid fuels will be need for aviation. A whole palette of chemical reactions based upon platform molecules accessible through CCU (including biomass) will be used in the chemical industry replacing gradually fossil feedstock.
5.2 CARBON FLUXES, IN THE CONTEXT OF POWER AND MOBILITY SERVICESThe analysis in Section 5.1 is related to the first evaluation criterion reported in Section 2.1, i.e. energy efficiency, as well as to the fourth, i.e. costs, although the latter has been considered only qualitatively. In this section, we analyse carbon fluxes, i.e. we focus on the different aspects of the second criterion in Section 2.1.
We consider again the two types of services, namely power and mobility, as above, when provided by a carbon-based fuel. Hence, this analysis is related to the third technology chain, hence to CCU.
In order to keep the analysis simple and for the sake of comparison, we make the following simplifying assumptions:
• services are provided using either (fossil) natural gas (NG) or synthetic natural gas (SNG); power is generated in natural gas fired power plants and vehicles are powered by either type of natural gas;
Figure 5.5: Schematic summary of efficiency losses for various energy vectors in the services power provision and mobility.
1009080706050403020100
-----------
Power generation Mobility
100% electrification
H2 economy
CO2 utilization
58
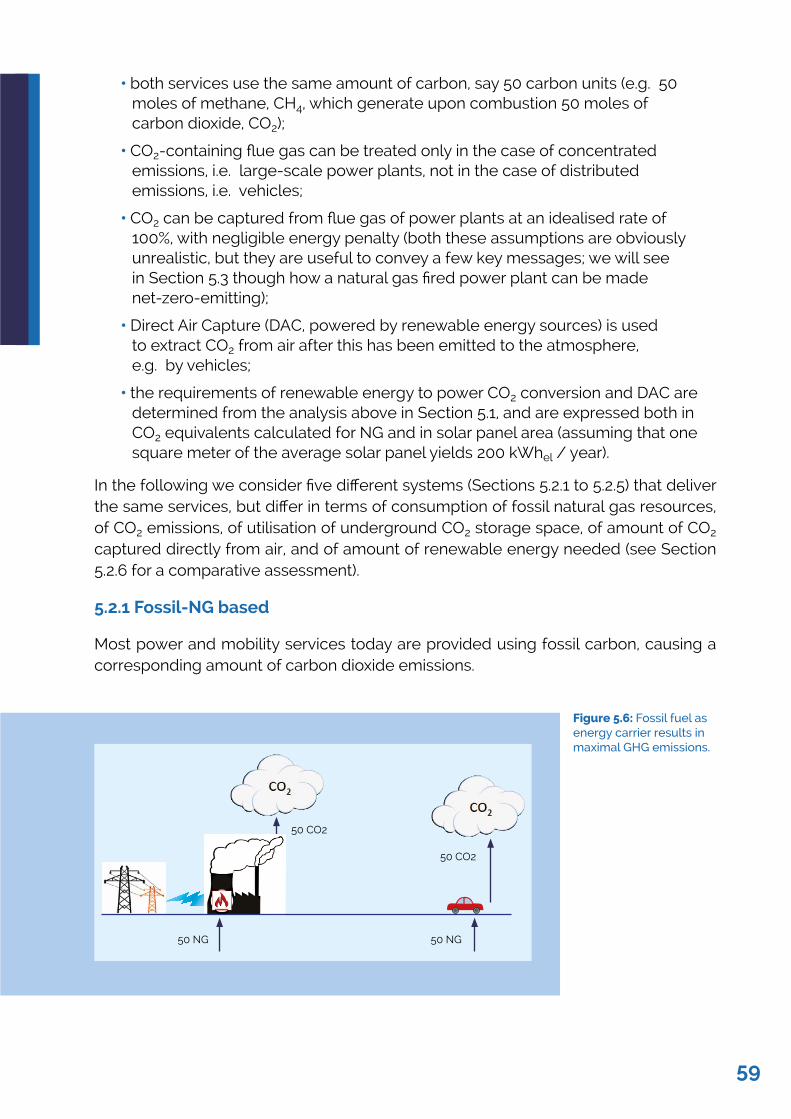
• both services use the same amount of carbon, say 50 carbon units (e.g. 50 moles of methane, CH4, which generate upon combustion 50 moles of carbon dioxide, CO2);
• CO2-containing flue gas can be treated only in the case of concentrated emissions, i.e. large-scale power plants, not in the case of distributed emissions, i.e. vehicles;
• CO2 can be captured from flue gas of power plants at an idealised rate of 100%, with negligible energy penalty (both these assumptions are obviously unrealistic, but they are useful to convey a few key messages; we will see in Section 5.3 though how a natural gas fired power plant can be made net-zero-emitting);
• Direct Air Capture (DAC, powered by renewable energy sources) is used to extract CO2 from air after this has been emitted to the atmosphere, e.g. by vehicles;
• the requirements of renewable energy to power CO2 conversion and DAC are determined from the analysis above in Section 5.1, and are expressed both in CO2 equivalents calculated for NG and in solar panel area (assuming that one square meter of the average solar panel yields 200 kWhel / year).
In the following we consider five different systems (Sections 5.2.1 to 5.2.5) that deliver the same services, but differ in terms of consumption of fossil natural gas resources, of CO2 emissions, of utilisation of underground CO2 storage space, of amount of CO2 captured directly from air, and of amount of renewable energy needed (see Section 5.2.6 for a comparative assessment).
5.2.1 Fossil-NG based
Most power and mobility services today are provided using fossil carbon, causing a corresponding amount of carbon dioxide emissions.
Figure 5.6: Fossil fuel as energy carrier results in maximal GHG emissions.
50 CO2
50 CO2
50 NG50 NG
59
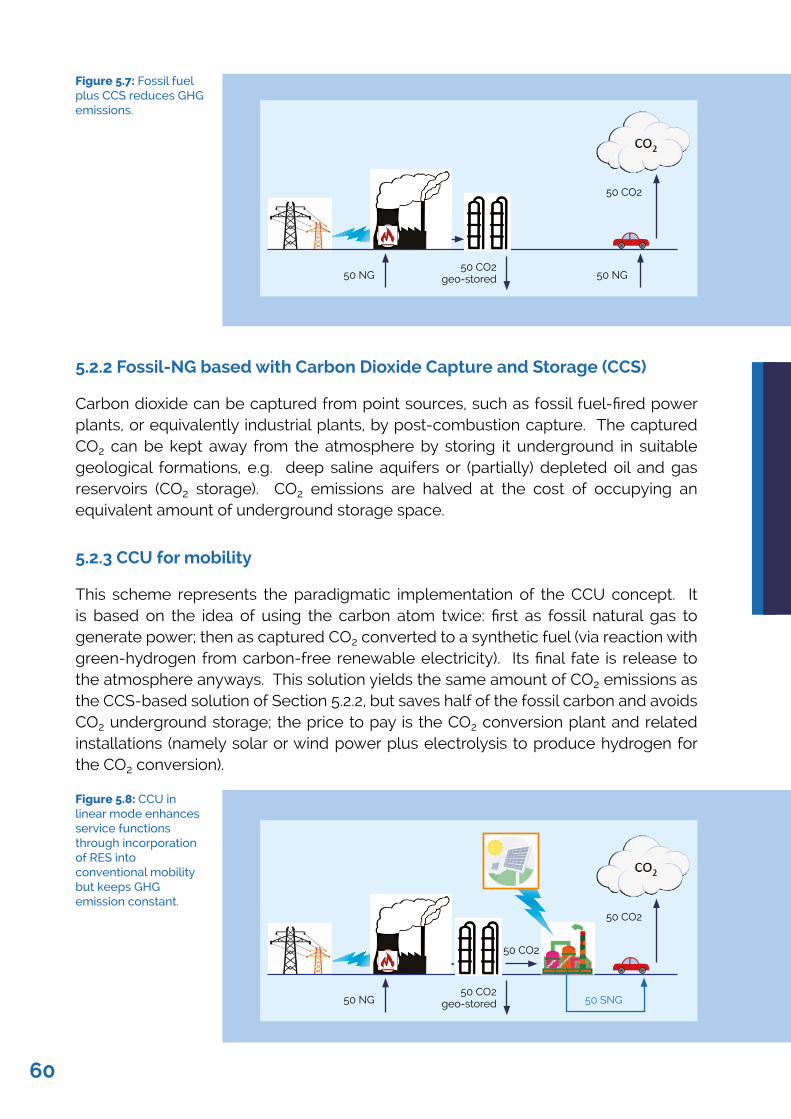
5.2.2 Fossil-NG based with Carbon Dioxide Capture and Storage (CCS)
Carbon dioxide can be captured from point sources, such as fossil fuel-fired power plants, or equivalently industrial plants, by post-combustion capture. The captured CO2 can be kept away from the atmosphere by storing it underground in suitable geological formations, e.g. deep saline aquifers or (partially) depleted oil and gas reservoirs (CO2 storage). CO2 emissions are halved at the cost of occupying an equivalent amount of underground storage space.
5.2.3 CCU for mobility
This scheme represents the paradigmatic implementation of the CCU concept. It is based on the idea of using the carbon atom twice: first as fossil natural gas to generate power; then as captured CO2 converted to a synthetic fuel (via reaction with green-hydrogen from carbon-free renewable electricity). Its final fate is release to the atmosphere anyways. This solution yields the same amount of CO2 emissions as the CCS-based solution of Section 5.2.2, but saves half of the fossil carbon and avoids CO2 underground storage; the price to pay is the CO2 conversion plant and related installations (namely solar or wind power plus electrolysis to produce hydrogen for the CO2 conversion).
Figure 5.7: Fossil fuel plus CCS reduces GHG emissions.
50 CO2
50 NG50 NG50 CO2
geo-stored
Figure 5.8: CCU in linear mode enhances service functions through incorporation of RES into conventional mobility but keeps GHG emission constant.
50 CO2
50 CO2
50 SNG50 NG50 CO2
geo-stored
60
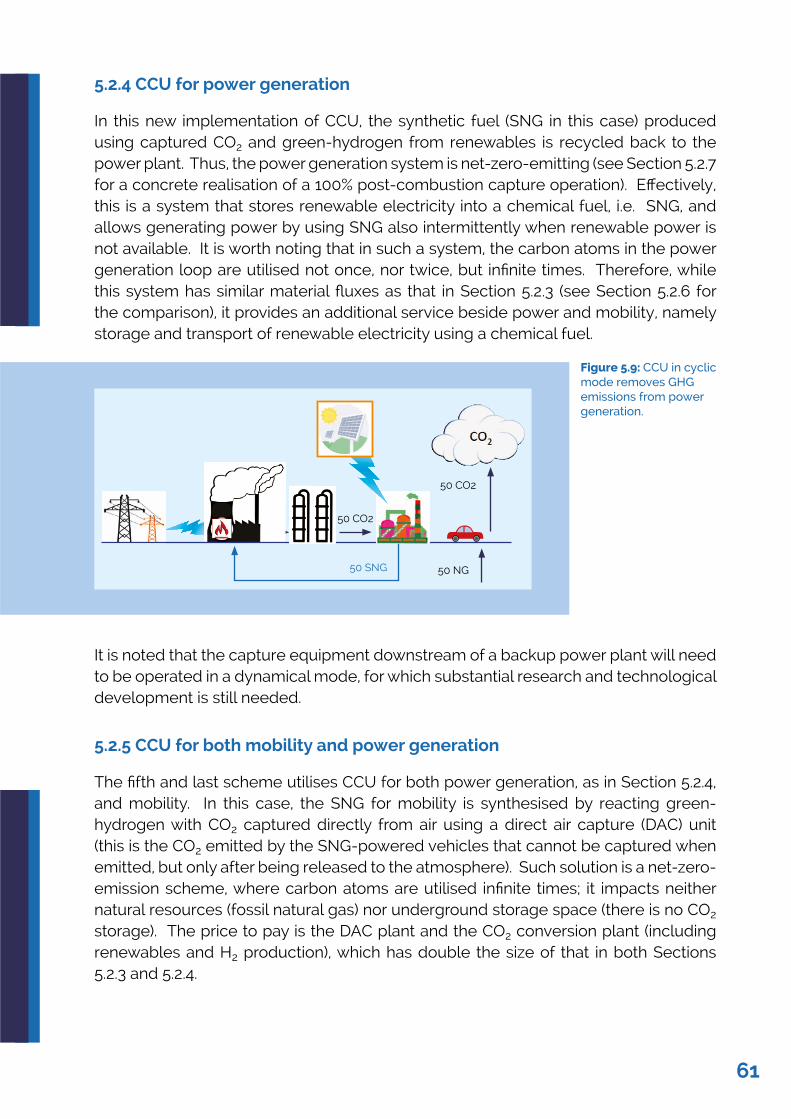
5.2.4 CCU for power generation
In this new implementation of CCU, the synthetic fuel (SNG in this case) produced using captured CO2 and green-hydrogen from renewables is recycled back to the power plant. Thus, the power generation system is net-zero-emitting (see Section 5.2.7 for a concrete realisation of a 100% post-combustion capture operation). Effectively, this is a system that stores renewable electricity into a chemical fuel, i.e. SNG, and allows generating power by using SNG also intermittently when renewable power is not available. It is worth noting that in such a system, the carbon atoms in the power generation loop are utilised not once, nor twice, but infinite times. Therefore, while this system has similar material fluxes as that in Section 5.2.3 (see Section 5.2.6 for the comparison), it provides an additional service beside power and mobility, namely storage and transport of renewable electricity using a chemical fuel.
It is noted that the capture equipment downstream of a backup power plant will need to be operated in a dynamical mode, for which substantial research and technological development is still needed.
5.2.5 CCU for both mobility and power generation
The fifth and last scheme utilises CCU for both power generation, as in Section 5.2.4, and mobility. In this case, the SNG for mobility is synthesised by reacting green-hydrogen with CO2 captured directly from air using a direct air capture (DAC) unit (this is the CO2 emitted by the SNG-powered vehicles that cannot be captured when emitted, but only after being released to the atmosphere). Such solution is a net-zero-emission scheme, where carbon atoms are utilised infinite times; it impacts neither natural resources (fossil natural gas) nor underground storage space (there is no CO2 storage). The price to pay is the DAC plant and the CO2 conversion plant (including renewables and H2 production), which has double the size of that in both Sections 5.2.3 and 5.2.4.
Figure 5.9: CCU in cyclic mode removes GHG emissions from power generation.
50 CO2
50 CO2
50 SNG 50 NG
61
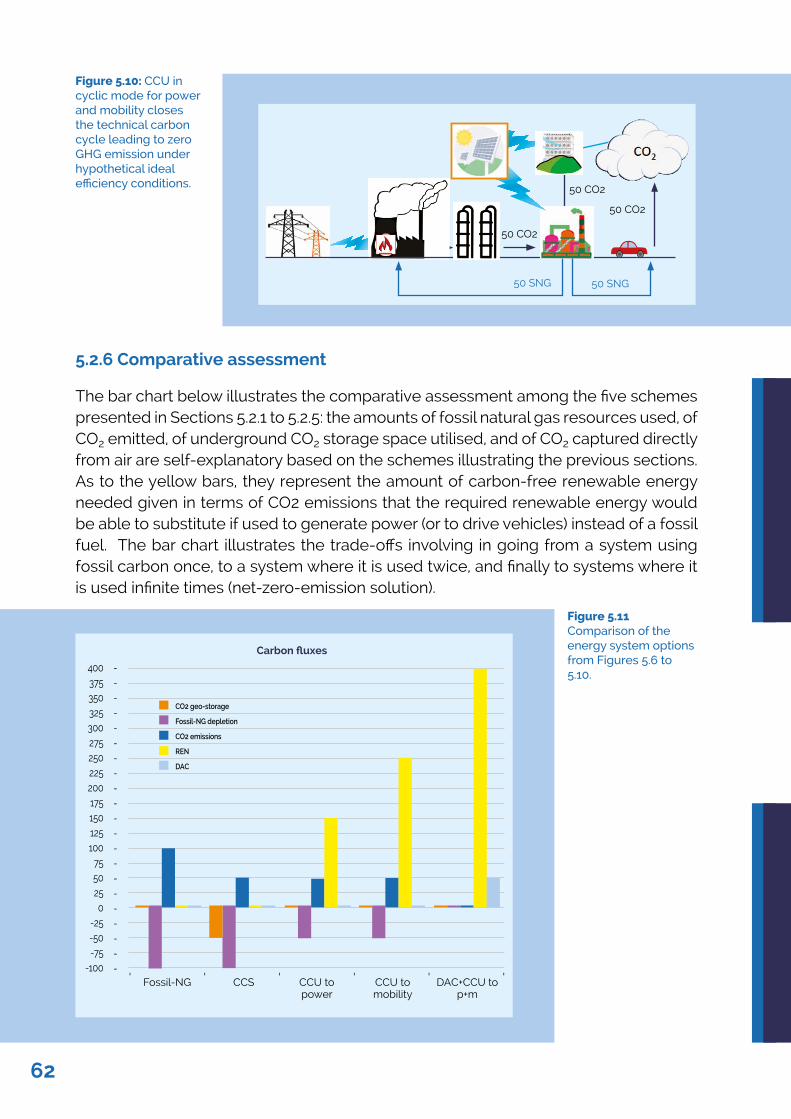
5.2.6 Comparative assessment
The bar chart below illustrates the comparative assessment among the five schemes presented in Sections 5.2.1 to 5.2.5: the amounts of fossil natural gas resources used, of CO2 emitted, of underground CO2 storage space utilised, and of CO2 captured directly from air are self-explanatory based on the schemes illustrating the previous sections. As to the yellow bars, they represent the amount of carbon-free renewable energy needed given in terms of CO2 emissions that the required renewable energy would be able to substitute if used to generate power (or to drive vehicles) instead of a fossil fuel. The bar chart illustrates the trade-offs involving in going from a system using fossil carbon once, to a system where it is used twice, and finally to systems where it is used infinite times (net-zero-emission solution).
Figure 5.10: CCU in cyclic mode for power and mobility closes the technical carbon cycle leading to zero GHG emission under hypothetical ideal efficiency conditions.
50 CO2
50 CO2
50 CO2
50 SNG 50 SNG
Figure 5.11 Comparison of the energy system options from Figures 5.6 to 5.10.
400375350325300275250225200175150125100
7550250
-25-50-75
-100
------ - -------------- - - - - - -
CO2 geo-storage
Fossil-NG depletion
CO2 emissions
REN
DAC
Fossil-NG CCS CCU to power
CCU to mobility
DAC+CCU to p+m
Carbon fluxes
62
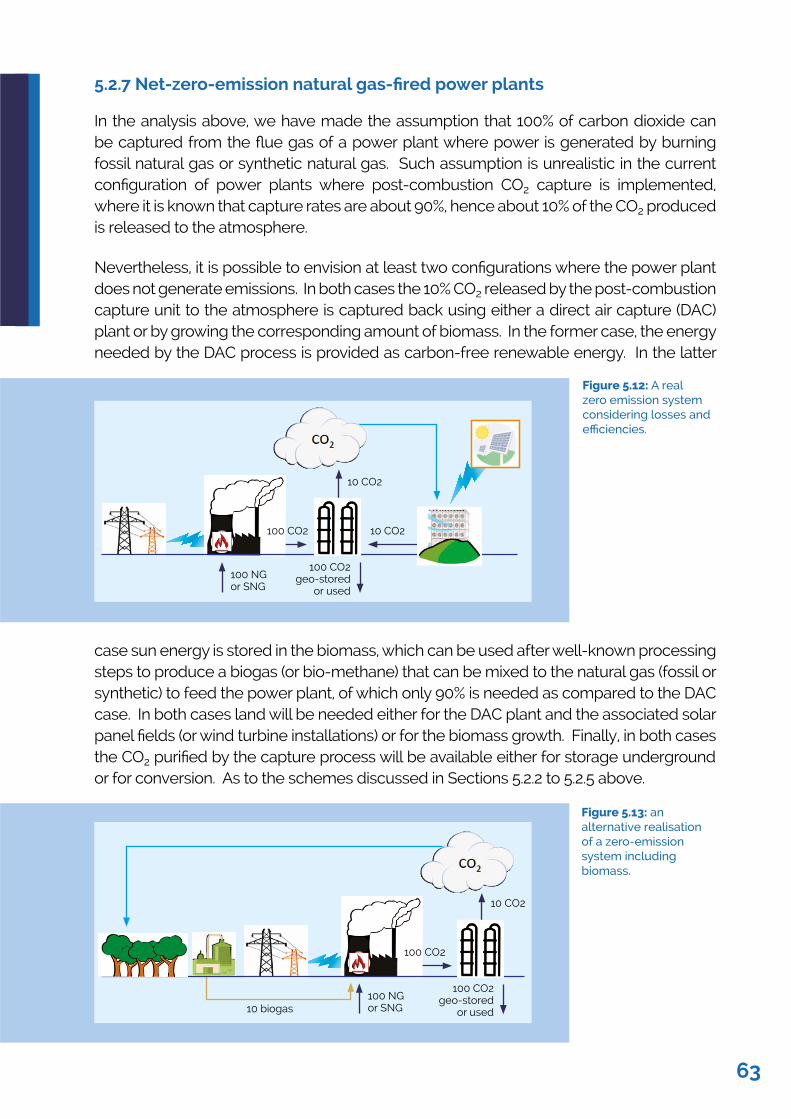
5.2.7 Net-zero-emission natural gas-fired power plants
In the analysis above, we have made the assumption that 100% of carbon dioxide can be captured from the flue gas of a power plant where power is generated by burning fossil natural gas or synthetic natural gas. Such assumption is unrealistic in the current configuration of power plants where post-combustion CO2 capture is implemented, where it is known that capture rates are about 90%, hence about 10% of the CO2 produced is released to the atmosphere.
Nevertheless, it is possible to envision at least two configurations where the power plant does not generate emissions. In both cases the 10% CO2 released by the post-combustion capture unit to the atmosphere is captured back using either a direct air capture (DAC) plant or by growing the corresponding amount of biomass. In the former case, the energy needed by the DAC process is provided as carbon-free renewable energy. In the latter
case sun energy is stored in the biomass, which can be used after well-known processing steps to produce a biogas (or bio-methane) that can be mixed to the natural gas (fossil or synthetic) to feed the power plant, of which only 90% is needed as compared to the DAC case. In both cases land will be needed either for the DAC plant and the associated solar panel fields (or wind turbine installations) or for the biomass growth. Finally, in both cases the CO2 purified by the capture process will be available either for storage underground or for conversion. As to the schemes discussed in Sections 5.2.2 to 5.2.5 above.
10 CO2
100 NGor SNG
100 CO2 geo-stored
or used
10 CO2100 CO2
Figure 5.12: A real zero emission system considering losses and efficiencies.
Figure 5.13: an alternative realisation of a zero-emission system including biomass.
10 CO2
100 NGor SNG
100 CO2 geo-stored
or used
100 CO2
10 biogas
63
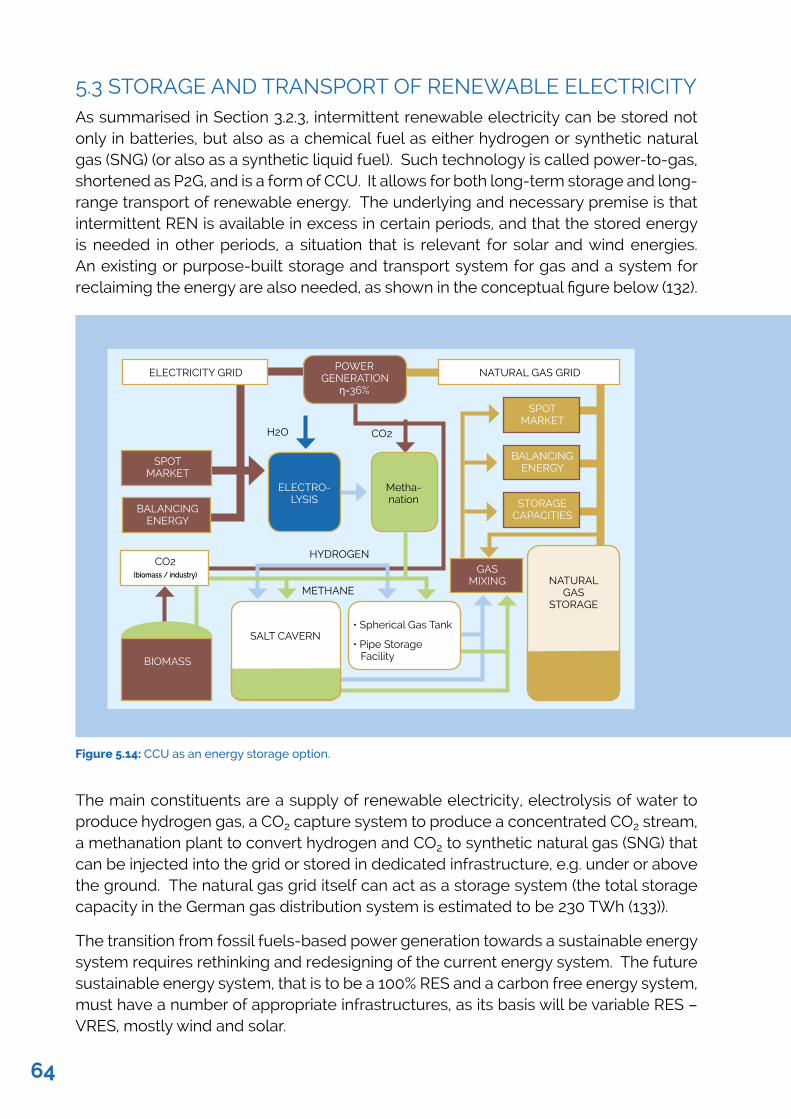
5.3 STORAGE AND TRANSPORT OF RENEWABLE ELECTRICITYAs summarised in Section 3.2.3, intermittent renewable electricity can be stored not only in batteries, but also as a chemical fuel as either hydrogen or synthetic natural gas (SNG) (or also as a synthetic liquid fuel). Such technology is called power-to-gas, shortened as P2G, and is a form of CCU. It allows for both long-term storage and long-range transport of renewable energy. The underlying and necessary premise is that intermittent REN is available in excess in certain periods, and that the stored energy is needed in other periods, a situation that is relevant for solar and wind energies. An existing or purpose-built storage and transport system for gas and a system for reclaiming the energy are also needed, as shown in the conceptual figure below (132).
The main constituents are a supply of renewable electricity, electrolysis of water to produce hydrogen gas, a CO2 capture system to produce a concentrated CO2 stream, a methanation plant to convert hydrogen and CO2 to synthetic natural gas (SNG) that can be injected into the grid or stored in dedicated infrastructure, e.g. under or above the ground. The natural gas grid itself can act as a storage system (the total storage capacity in the German gas distribution system is estimated to be 230 TWh (133)).
The transition from fossil fuels-based power generation towards a sustainable energy system requires rethinking and redesigning of the current energy system. The future sustainable energy system, that is to be a 100% RES and a carbon free energy system, must have a number of appropriate infrastructures, as its basis will be variable RES – VRES, mostly wind and solar.
Figure 5.14: CCU as an energy storage option.
SPOT MARKET
BALANCING ENERGY
STORAGE CAPACITIES
H2O
HYDROGEN
METHANE
CO2
NATURAL GAS
STORAGE
SPOT MARKET
ELECTRO-LYSIS
Metha-nation
POWER GENERATION
η=36%
NATURAL GAS GRIDELECTRICITY GRID
BALANCING ENERGY
CO2(biomass / industry)
BIOMASS
SALT CAVERN• Spherical Gas Tank
• Pipe Storage Facility
GAS MIXING
64
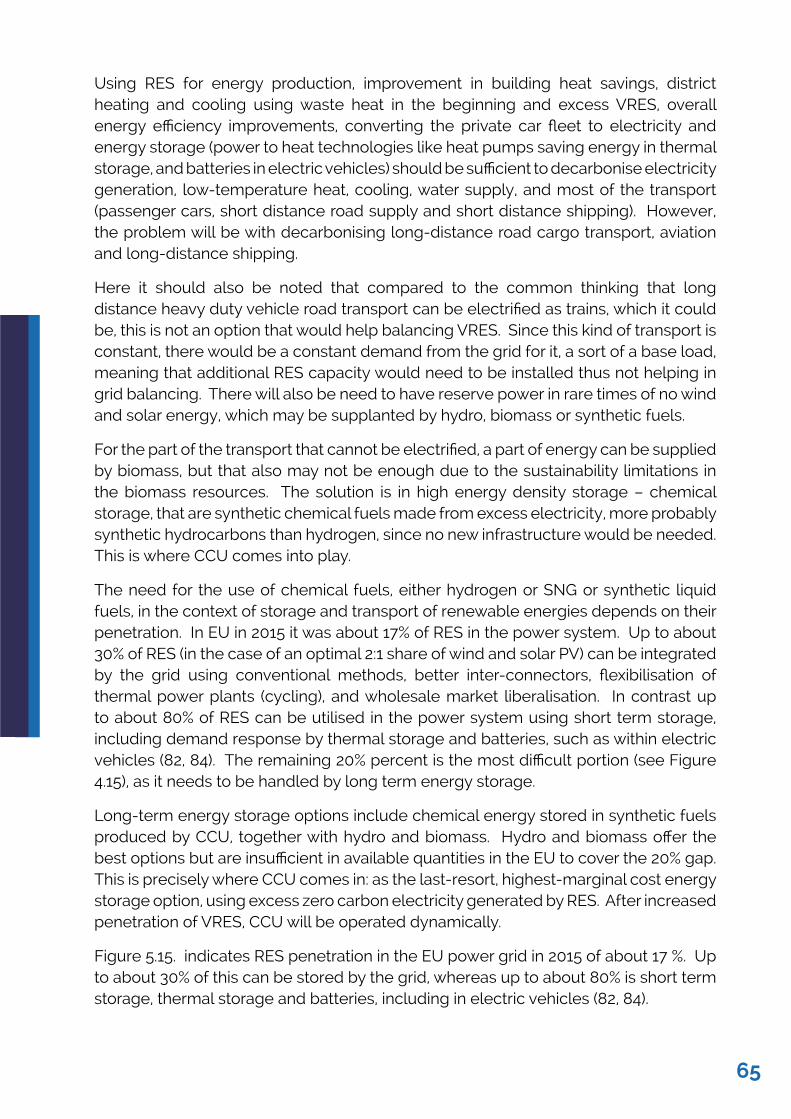
Using RES for energy production, improvement in building heat savings, district heating and cooling using waste heat in the beginning and excess VRES, overall energy efficiency improvements, converting the private car fleet to electricity and energy storage (power to heat technologies like heat pumps saving energy in thermal storage, and batteries in electric vehicles) should be sufficient to decarbonise electricity generation, low-temperature heat, cooling, water supply, and most of the transport (passenger cars, short distance road supply and short distance shipping). However, the problem will be with decarbonising long-distance road cargo transport, aviation and long-distance shipping.
Here it should also be noted that compared to the common thinking that long distance heavy duty vehicle road transport can be electrified as trains, which it could be, this is not an option that would help balancing VRES. Since this kind of transport is constant, there would be a constant demand from the grid for it, a sort of a base load, meaning that additional RES capacity would need to be installed thus not helping in grid balancing. There will also be need to have reserve power in rare times of no wind and solar energy, which may be supplanted by hydro, biomass or synthetic fuels.
For the part of the transport that cannot be electrified, a part of energy can be supplied by biomass, but that also may not be enough due to the sustainability limitations in the biomass resources. The solution is in high energy density storage – chemical storage, that are synthetic chemical fuels made from excess electricity, more probably synthetic hydrocarbons than hydrogen, since no new infrastructure would be needed. This is where CCU comes into play.
The need for the use of chemical fuels, either hydrogen or SNG or synthetic liquid fuels, in the context of storage and transport of renewable energies depends on their penetration. In EU in 2015 it was about 17% of RES in the power system. Up to about 30% of RES (in the case of an optimal 2:1 share of wind and solar PV) can be integrated by the grid using conventional methods, better inter-connectors, flexibilisation of thermal power plants (cycling), and wholesale market liberalisation. In contrast up to about 80% of RES can be utilised in the power system using short term storage, including demand response by thermal storage and batteries, such as within electric vehicles (82, 84). The remaining 20% percent is the most difficult portion (see Figure 4.15), as it needs to be handled by long term energy storage.
Long-term energy storage options include chemical energy stored in synthetic fuels produced by CCU, together with hydro and biomass. Hydro and biomass offer the best options but are insufficient in available quantities in the EU to cover the 20% gap. This is precisely where CCU comes in: as the last-resort, highest-marginal cost energy storage option, using excess zero carbon electricity generated by RES. After increased penetration of VRES, CCU will be operated dynamically.
Figure 5.15. indicates RES penetration in the EU power grid in 2015 of about 17 %. Up to about 30% of this can be stored by the grid, whereas up to about 80% is short term storage, thermal storage and batteries, including in electric vehicles (82, 84).
65
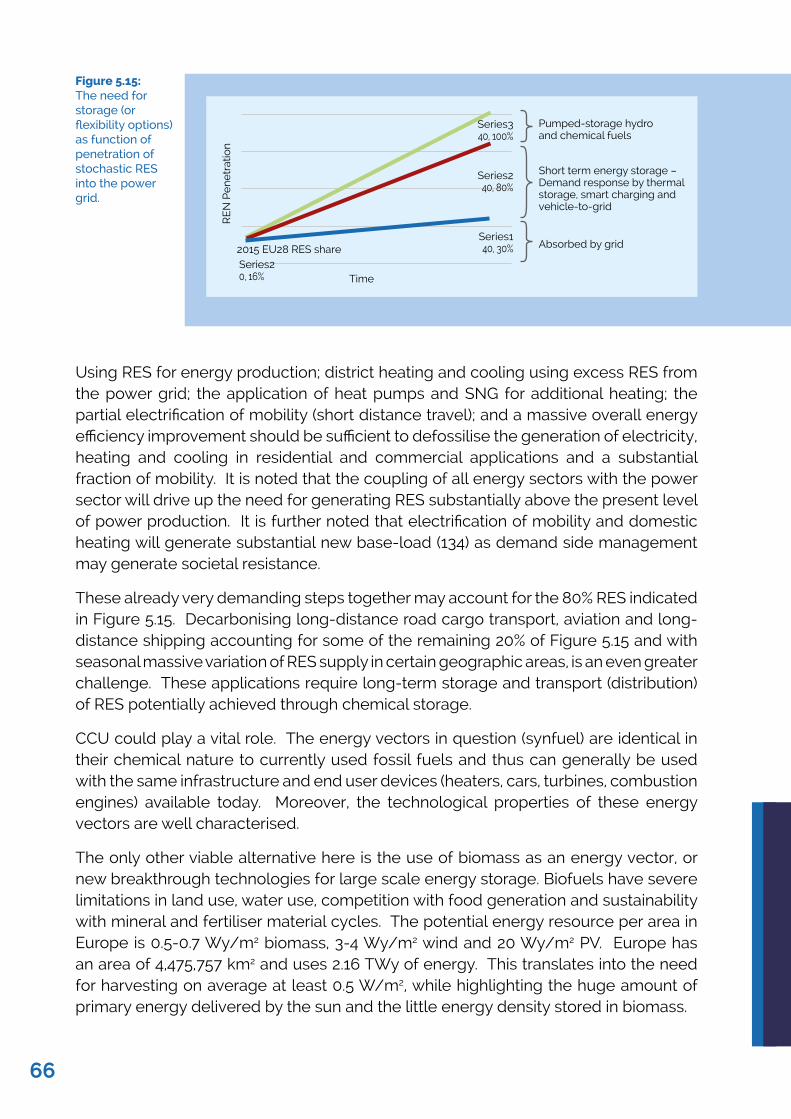
Using RES for energy production; district heating and cooling using excess RES from the power grid; the application of heat pumps and SNG for additional heating; the partial electrification of mobility (short distance travel); and a massive overall energy efficiency improvement should be sufficient to defossilise the generation of electricity, heating and cooling in residential and commercial applications and a substantial fraction of mobility. It is noted that the coupling of all energy sectors with the power sector will drive up the need for generating RES substantially above the present level of power production. It is further noted that electrification of mobility and domestic heating will generate substantial new base-load (134) as demand side management may generate societal resistance.
These already very demanding steps together may account for the 80% RES indicated in Figure 5.15. Decarbonising long-distance road cargo transport, aviation and long-distance shipping accounting for some of the remaining 20% of Figure 5.15 and with seasonal massive variation of RES supply in certain geographic areas, is an even greater challenge. These applications require long-term storage and transport (distribution) of RES potentially achieved through chemical storage.
CCU could play a vital role. The energy vectors in question (synfuel) are identical in their chemical nature to currently used fossil fuels and thus can generally be used with the same infrastructure and end user devices (heaters, cars, turbines, combustion engines) available today. Moreover, the technological properties of these energy vectors are well characterised.
The only other viable alternative here is the use of biomass as an energy vector, or new breakthrough technologies for large scale energy storage. Biofuels have severe limitations in land use, water use, competition with food generation and sustainability with mineral and fertiliser material cycles. The potential energy resource per area in Europe is 0.5-0.7 Wy/m2 biomass, 3-4 Wy/m2 wind and 20 Wy/m2 PV. Europe has an area of 4,475,757 km2 and uses 2.16 TWy of energy. This translates into the need for harvesting on average at least 0.5 W/m2, while highlighting the huge amount of primary energy delivered by the sun and the little energy density stored in biomass.
Figure 5.15: The need for storage (or flexibility options) as function of penetration of stochastic RES into the power grid.
Pumped-storage hydro and chemical fuels
Absorbed by grid2015 EU28 RES share
Time
RE
N P
en
etr
atio
nSeries140, 30%
Series240, 80%
Short term energy storage – Demand response by thermal storage, smart charging and vehicle-to-grid
Series340, 100%
Series20, 16%
66
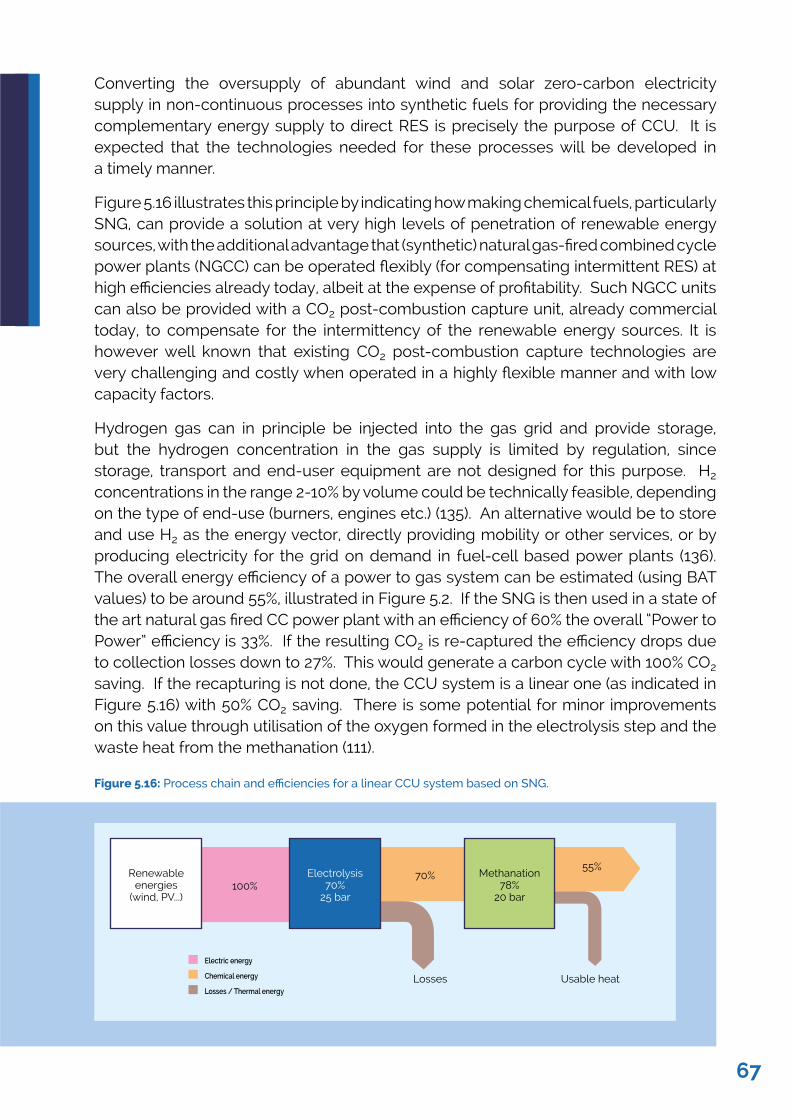
Converting the oversupply of abundant wind and solar zero-carbon electricity supply in non-continuous processes into synthetic fuels for providing the necessary complementary energy supply to direct RES is precisely the purpose of CCU. It is expected that the technologies needed for these processes will be developed in a timely manner.
Figure 5.16 illustrates this principle by indicating how making chemical fuels, particularly SNG, can provide a solution at very high levels of penetration of renewable energy sources, with the additional advantage that (synthetic) natural gas-fired combined cycle power plants (NGCC) can be operated flexibly (for compensating intermittent RES) at high efficiencies already today, albeit at the expense of profitability. Such NGCC units can also be provided with a CO2 post-combustion capture unit, already commercial today, to compensate for the intermittency of the renewable energy sources. It is however well known that existing CO2 post-combustion capture technologies are very challenging and costly when operated in a highly flexible manner and with low capacity factors.
Hydrogen gas can in principle be injected into the gas grid and provide storage, but the hydrogen concentration in the gas supply is limited by regulation, since storage, transport and end-user equipment are not designed for this purpose. H2 concentrations in the range 2-10% by volume could be technically feasible, depending on the type of end-use (burners, engines etc.) (135). An alternative would be to store and use H2 as the energy vector, directly providing mobility or other services, or by producing electricity for the grid on demand in fuel-cell based power plants (136). The overall energy efficiency of a power to gas system can be estimated (using BAT values) to be around 55%, illustrated in Figure 5.2. If the SNG is then used in a state of the art natural gas fired CC power plant with an efficiency of 60% the overall “Power to Power” efficiency is 33%. If the resulting CO2 is re-captured the efficiency drops due to collection losses down to 27%. This would generate a carbon cycle with 100% CO2 saving. If the recapturing is not done, the CCU system is a linear one (as indicated in Figure 5.16) with 50% CO2 saving. There is some potential for minor improvements on this value through utilisation of the oxygen formed in the electrolysis step and the waste heat from the methanation (111).
Figure 5.16: Process chain and efficiencies for a linear CCU system based on SNG.
100%70%
55%Renewable
energies(wind, PV...)
Electrolysis70%
25 bar
Methanation78%
20 bar
Losses Usable heat
Electric energy
Chemical energy
Losses / Thermal energy
67
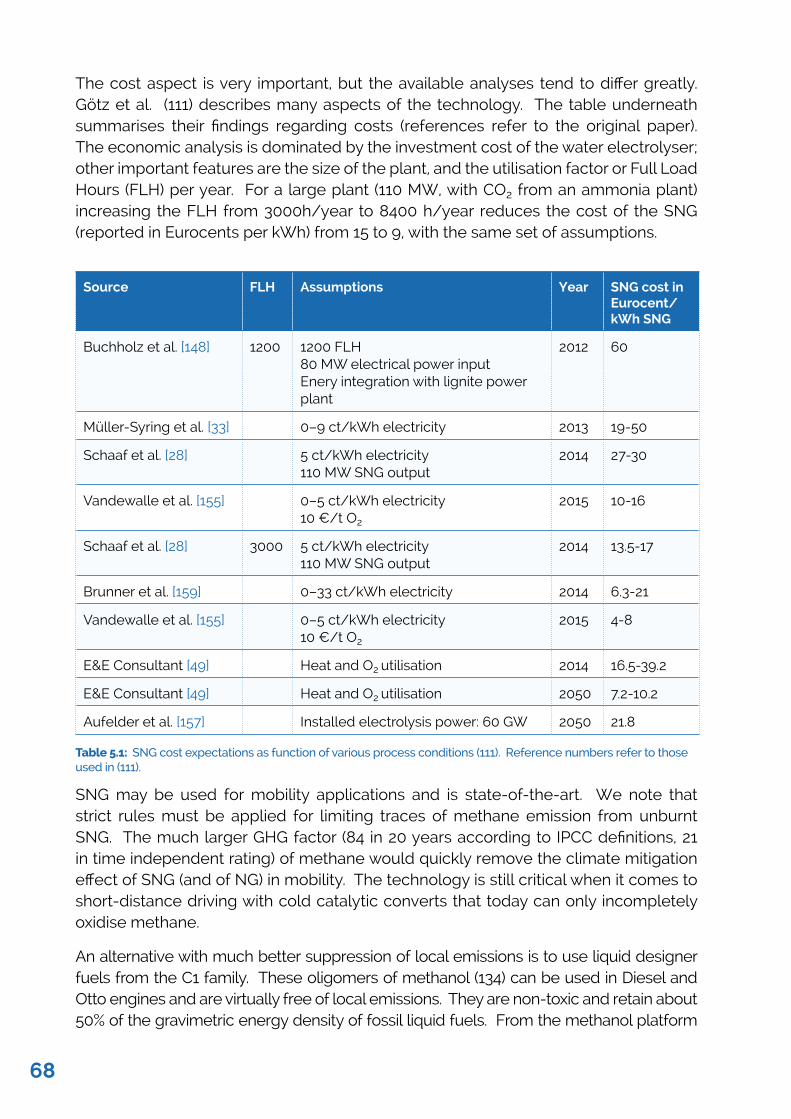
The cost aspect is very important, but the available analyses tend to differ greatly. Götz et al. (111) describes many aspects of the technology. The table underneath summarises their findings regarding costs (references refer to the original paper). The economic analysis is dominated by the investment cost of the water electrolyser; other important features are the size of the plant, and the utilisation factor or Full Load Hours (FLH) per year. For a large plant (110 MW, with CO2 from an ammonia plant) increasing the FLH from 3000h/year to 8400 h/year reduces the cost of the SNG (reported in Eurocents per kWh) from 15 to 9, with the same set of assumptions.
Source FLH Assumptions Year SNG cost in Eurocent/kWh SNG
Buchholz et al. [148] 1200 1200 FLH 80 MW electrical power input Enery integration with lignite power plant
2012 60
Müller-Syring et al. [33] 0–9 ct/kWh electricity 2013 19-50
Schaaf et al. [28] 5 ct/kWh electricity 110 MW SNG output
2014 27-30
Vandewalle et al. [155] 0–5 ct/kWh electricity 10 €/t O2
2015 10-16
Schaaf et al. [28] 3000 5 ct/kWh electricity 110 MW SNG output
2014 13.5-17
Brunner et al. [159] 0–33 ct/kWh electricity 2014 6.3-21
Vandewalle et al. [155] 0–5 ct/kWh electricity 10 €/t O2
2015 4-8
E&E Consultant [49] Heat and O2 utilisation 2014 16.5-39.2
E&E Consultant [49] Heat and O2 utilisation 2050 7.2-10.2
Aufelder et al. [157] Installed electrolysis power: 60 GW 2050 21.8
Table 5.1: SNG cost expectations as function of various process conditions (111). Reference numbers refer to those used in (111).
SNG may be used for mobility applications and is state-of-the-art. We note that strict rules must be applied for limiting traces of methane emission from unburnt SNG. The much larger GHG factor (84 in 20 years according to IPCC definitions, 21 in time independent rating) of methane would quickly remove the climate mitigation effect of SNG (and of NG) in mobility. The technology is still critical when it comes to short-distance driving with cold catalytic converts that today can only incompletely oxidise methane.
An alternative with much better suppression of local emissions is to use liquid designer fuels from the C1 family. These oligomers of methanol (134) can be used in Diesel and Otto engines and are virtually free of local emissions. They are non-toxic and retain about 50% of the gravimetric energy density of fossil liquid fuels. From the methanol platform
68
they are accessible in a two-step synthesis that is explored today technically as some of these molecules are useful solvents.
5.4 MANUFACTURING OF INDUSTRIAL PRODUCTSCarbon containing chemicals and materials use today fossil carbon as raw material in their production processes. Organic chemicals have applications as fertilisers, surfactants, solvents, cosmetics, drugs, plastics, paints, textiles, etc. Such products have significantly impacted our daily life, for example by improving crop efficiency in the agriculture, improving health and hygiene, and facilitating the packaging, transport and distribution of goods. The production of these goods is attractive, from an economic standpoint, because chemicals have an intrinsic added value that surpasses the value of the raw materials as well as of liquid and gaseous fuels. However, at the end of their life, which can be of the order of months as for instance for urea or of decades as for example for some polymers, most of such products release CO2 to the atmosphere, either directly as urea or after being incinerated in a waste treatment plant. Less than 5% of the whole consumption of fossil carbon, hence less than 5% of the whole amount of CO2 emitted today, is due to such chemicals and materials (the remaining 95% of coal, oil or gas are burnt either directly or indirectly after converting oil into different types of commercial fuels). The number gets substantially larger when also the energy needed to perform the conversions is added. The defossilisation of the energy consumption (and of the hydrogen production) of chemical industry is thus a more suitable target in particular as this industry cannot be decarbonised by definition.
5.4.1 Alternative technology chains for carbon-bearing chemicals and materials
With reference to the schemes proposed in the Section 5.2 on carbon fluxes, and with the goal of producing such chemical and materials without CO2 emissions (including during production, use and disposal) one can envision two options, namely one based on CCU and the other based on CCS. In the following we describe and assess these two approaches. It is worth keeping in mind that in both cases, in a net-zero-emissions scenario, the CO2 emitted upon or after utilisation of such products must be captured either directly from air (DAC, as in the right-hand side of the figure in Section 5.2.5) or from the flue gas of an incinerator (post-combustion capture, as in the right-hand side of the figure in Section 5.2.5).
Let us consider first the option based on CCU. The captured CO2 would have to be utilised in the synthesis process. There are a handful of chemicals that are currently produced in part from CO2. These include urea, salicylic acid and carbonates, with a potential for CO2 utilisation of about 200 Mt/yr worldwide. The corresponding technologies and markets are mature. It is hence not expected that a market growth for these specific chemicals would enable the utilisation of large volumes of CO2. All the other organic chemicals and materials are currently produced using fossil carbon as raw material, typically oil, using synthesis processes that are at the heart of petrochemical technology and industry. Among them, ethylene, propylene, BTX (benzene, toluene and xylenes), methanol and
69
acetic acid are the main chemicals produced today in the EU. All these molecules can in principle be synthesised starting from captured CO2 instead of oil derivatives, using technologies that are currently either not existing or at a rather low TRL. Since their energy of formation exceeds that of CO2 and their calorific value is similar to that of liquid fuels, their formation from CO2 would require significant amounts of carbon-free power and/or green-hydrogen from carbon-free renewables.
Let us consider the second option, based on CCS. In this case the synthesis processes would utilise fossil carbon as raw material and would remain the same as applied today, with the obvious developments and improvements in terms of material and energy efficiency, and environmental impact and costs that the chemical industry is anyways pursuing. The captured CO2 would in this case be stored underground, as illustrated in Figure 5.7.
Both these approaches require a new infrastructure to capture CO2 directly from air and from the stack of incinerators. The CCU case would avoid oil consumption (less than 5% of the whole fossil fuel consumption today) and CO2 underground storage but would require brand new chemical processes (to be developed, demonstrated and scaled up) and a large amount of renewable energy resources to power the CO2 conversion process. The CCS case is more complementary, relying on well-established processes (that will anyways be improved because of technology development) using oil derivatives as starting material and on underground storage of the captured CO2.
5.4.2 Minimisation of CO2 emissions via conversion
Scales are a prime concern in CCU and volumes of CO2 emissions avoided when exploring CO2 conversion to chemicals must first be assessed. When looking for alternative production routes for chemicals, minimising the emissions of CO2 could (and should) be accomplished by (i) avoiding CO2 emissions associated with energy generation from carbon fossil feedstocks (process and energy intensity), (ii) utilising CO2 as a carbon source (carbon conversion) and (iii) producing chemicals with enhanced properties, that can avoid CO2 emissions thanks to their lighter weight and improved insulation properties (usage).
CO2 avoided by improving process and energy intensity in the
production of chemicals
Current petrochemical routes for the production of chemicals involve energy intensive and sequential processes. Transformation and separation technologies consume large amounts of energy and the multiplication of chemical steps reduces energy efficiency as heating must be provided to overcome endothermic steps while the overall transformation is exergonic. Overall, such processes need to be made leaner, avoiding high-energy intermediate steps and processes, and using renewable energy and CO2 as feedstock.
CO2 conversion to bulk chemicals
Bulk and platform chemicals are the main chemicals produced from raw fossil feedstocks. These correspond to by-products of the refining of oil and the valorisation of natural gas and they include, for instance, ethylene, propylene, benzene, toluene and xylenes (aka BTX), acetic acid and methanol. In Europe, the potential for CO2 conversion to chemicals
70
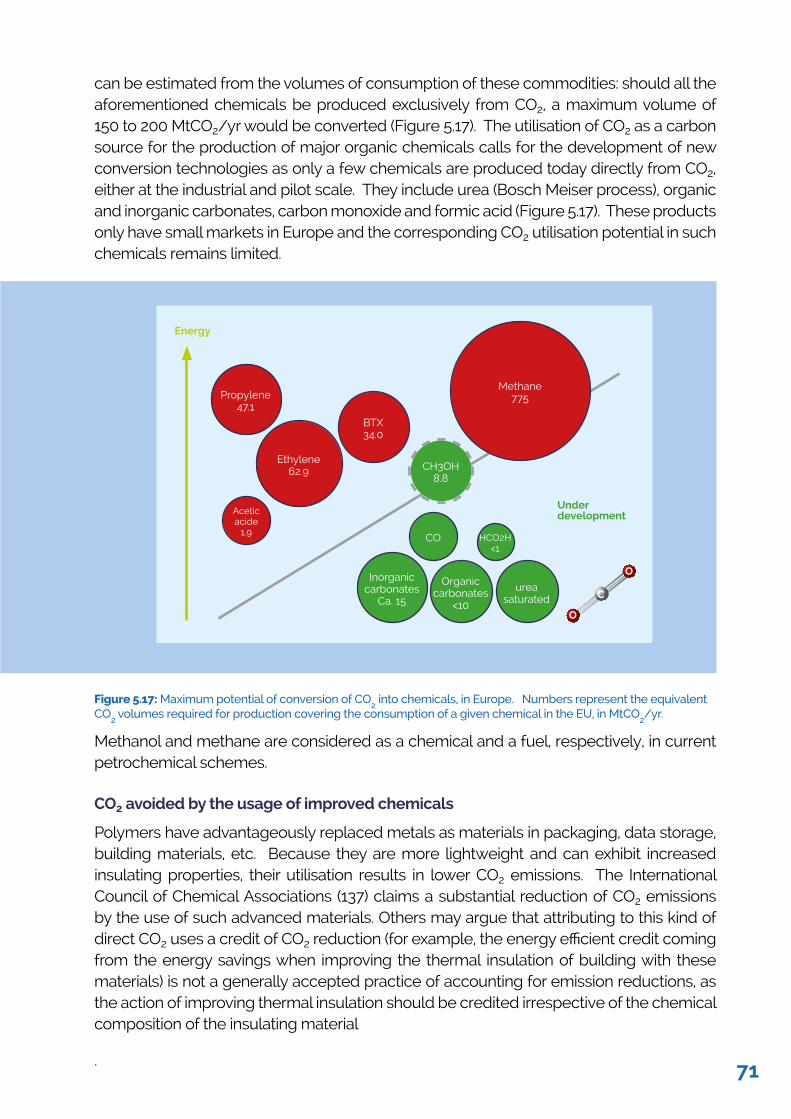
can be estimated from the volumes of consumption of these commodities: should all the aforementioned chemicals be produced exclusively from CO2, a maximum volume of 150 to 200 MtCO2/yr would be converted (Figure 5.17). The utilisation of CO2 as a carbon source for the production of major organic chemicals calls for the development of new conversion technologies as only a few chemicals are produced today directly from CO2, either at the industrial and pilot scale. They include urea (Bosch Meiser process), organic and inorganic carbonates, carbon monoxide and formic acid (Figure 5.17). These products only have small markets in Europe and the corresponding CO2 utilisation potential in such chemicals remains limited.
Figure 5.17: Maximum potential of conversion of CO2 into chemicals, in Europe. Numbers represent the equivalent
CO2 volumes required for production covering the consumption of a given chemical in the EU, in MtCO
2/yr.
Methanol and methane are considered as a chemical and a fuel, respectively, in current petrochemical schemes.
CO2 avoided by the usage of improved chemicals
Polymers have advantageously replaced metals as materials in packaging, data storage, building materials, etc. Because they are more lightweight and can exhibit increased insulating properties, their utilisation results in lower CO2 emissions. The International Council of Chemical Associations (137) claims a substantial reduction of CO2 emissions by the use of such advanced materials. Others may argue that attributing to this kind of direct CO2 uses a credit of CO2 reduction (for example, the energy efficient credit coming from the energy savings when improving the thermal insulation of building with these materials) is not a generally accepted practice of accounting for emission reductions, as the action of improving thermal insulation should be credited irrespective of the chemical composition of the insulating material
.
Propylene47.1
Methane775
CH3OH8.8
CO HCO2H<1
Inorganic carbonates
Ca. 15
Organic carbonates
<10
ureasaturated
Ethylene62.9
BTX34.0
Acetic acide
1.9
Under development
Energy
O
O
C
71
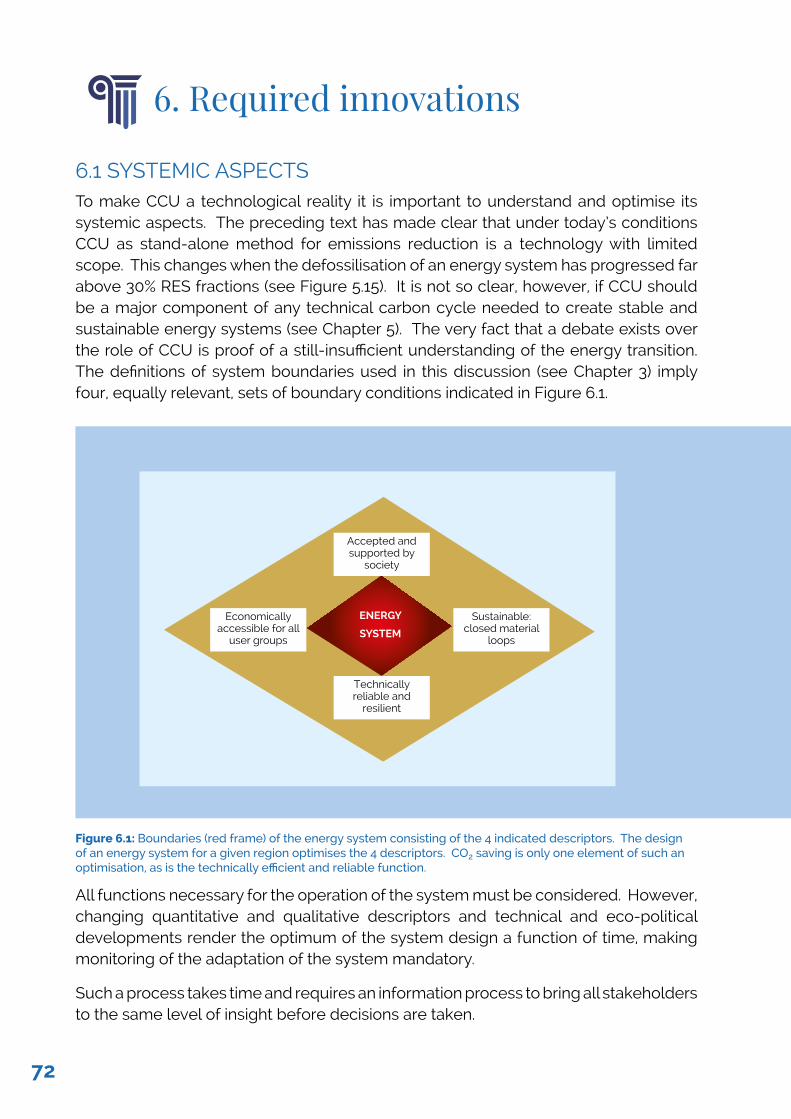
6. Required innovations
6.1 SYSTEMIC ASPECTSTo make CCU a technological reality it is important to understand and optimise its systemic aspects. The preceding text has made clear that under today’s conditions CCU as stand-alone method for emissions reduction is a technology with limited scope. This changes when the defossilisation of an energy system has progressed far above 30% RES fractions (see Figure 5.15). It is not so clear, however, if CCU should be a major component of any technical carbon cycle needed to create stable and sustainable energy systems (see Chapter 5). The very fact that a debate exists over the role of CCU is proof of a still-insufficient understanding of the energy transition. The definitions of system boundaries used in this discussion (see Chapter 3) imply four, equally relevant, sets of boundary conditions indicated in Figure 6.1.
Figure 6.1: Boundaries (red frame) of the energy system consisting of the 4 indicated descriptors. The design of an energy system for a given region optimises the 4 descriptors. CO2 saving is only one element of such an optimisation, as is the technically efficient and reliable function.
All functions necessary for the operation of the system must be considered. However, changing quantitative and qualitative descriptors and technical and eco-political developments render the optimum of the system design a function of time, making monitoring of the adaptation of the system mandatory.
Such a process takes time and requires an information process to bring all stakeholders to the same level of insight before decisions are taken.
Accepted and supported by
society
Technically reliable and
resilient
Economically accessible for all
user groups
Sustainable: closed material
loops
ENERGY
SYSTEM
72
6.2 POLITICAL BOUNDARY CONDITIONSAt present, a large array of sector-specific measures for climate change mitigation is used in policy making. Those measures comprise financial incentives, tax incentives and design measures in regulated fractions of energy markets and create in-transparent complex boundary conditions with many variants in the member states.
A critical element is the understanding of the timescales and volumes involved. Our present energy system took more than a century to come to its present form with an enormous infrastructure functioning in a way that is largely invisible to the majority of the population. The energy transition requires a novel infrastructure with radically different geographical redistributions of its elements: this will take decades and affect more stakeholders than the present system. The cost in terms of land, finance and political will is substantial and must be considered when discussing technical options (see also Figure 6.1 and discussion). A process is necessary to involve and inform stakeholders of the cost of transforming the existing energy infrastructure, the disconnection between energy unit and fuel cost in sustainable energy systems and of changes in energy access. As much as this policy-related innovation applies to the whole energy transition, it is particularly important to correctly value the services coming with CCU and to relate any possible future investment in RES for CCU to the potential of GHG emission reduction. The complexity of the issues outlined in this document requires the use of multiple descriptors (not only the CO2 saving potential) in identifying the elements of an energy system, and such an evaluation will be based on the use of system analysis tools and of Integrated Assessment Models (8, 138).
6.3 TECHNICAL GAPS IN KNOWLEDGEThe available life cycle analyses (LCAs) of CCU technologies commonly indicate that at present the underlying technologies are insufficient for attractive large-scale utilisation. This applies to the system level of such technologies as well as to the unit operations contained. This arises simply from the historical fact that the prevailing fossil energy supply has not previously required technologies that can store energy. Thus, the chemical processes of splitting water and activating CO2 at large scales were not needed. Present efforts to use our existing knowledge from other areas of chemo- and electro-catalysis both in science and technology (4, 6, 139) are required to tackle the three core challenges of CCU:
• The collection and purification of CO2
• The splitting of water to generate hydrogen; and
• The reductive activation of CO2 to allow the formation of fuels and chemicals.
Optimal performances in these challenges are far away (140, 141). We have,however, made enormous progress in theoretical and experimental understanding of the foundations of catalysis that are currently extended from gas phase reactions to those involving condensed phases. Joining forces with industry is critical to support technology transfer that is more than the diffusion of knowledge from science to
73
industry. Co-participation in discovery process can minimise resistances in industry and society against science breakthroughs.
For CCU to develop at large scale required to be relevant for climate change mitigation purposes there are technological innovations to be made and gaps that need to be filled
• “Green” hydrogen needs to be available under economically attractive conditions (60, 115, 142-146). Here we see a real chance that Europe could become a world leader in a critical technology as the basis or research and technology is well developed. The push for science is impeded by a lack of business opportunities perceived by industrial stakeholders. It is envisaged that this will be realised by water electrolysis using renewable energy. All present technologies (see Chapter 3) and their scale-up to large production need to be improved both for stability at dynamical operation and for system design (to reduce investment cost per unit power). A longer-term approach is avoiding the production of H2 as gas molecule and subsequently applying it for CO2 conversion with a double penalty in overpotential for generation and use of the H2 molecule. Direct use of H+/e-, deriving from water (photo)-electrolysis, in photoelectrocatalytic (41, 64, 131, 147) devices is a potentially more energy-effective way than hydrogen generation. This approach has much higher demands in understanding and designing chemical reactions as not only the unit reactions of water splitting, but also simultaneously the unit reactions of CO2 activation need to be coupled in space and time. As their material requirements and stability limits are not identical multi-functional materials are needed representing an enormous challenge for design and material science in order to make them in large amounts from abundant chemical elements.
• The discussion in Section 5.2 has clearly shown that carbon dioxide for CCU applications has to be obtained from biogenic sources or from the atmosphere in order to establish a circular use of the carbon atoms involved. It is therefore clear that in the longer term, and for having a strong climate change mitigation impact, CO2 capture after the use of fossil sources will be excluded from CCU application. If in the short-term CO2 streams coming from fossil sources were exploited in CCU pilot applications, this could be valuable for research and demonstration purposes but would not have any impact on CO2 emissions at least until the full energy system is virtually decarbonised (see Section 5.2 and (4)). In the short-term, industrial sources and fermentation can provide up to 300-500 Mt CO2/y, the streams being of different composition (and impurity spectra) and sometimes more concentrated than flue gases from power stations. The amount corresponds to ca. 10% of the total emission of CO2. By limiting to only biogenic CO2 sources, about 10-15 Mt CO2 is potentially available today in Europe, an amount doubling in the next 10-15 years (6-8 million tons from fermentation, 6-8 million tons from biogas after CH4
separation). This available amount of CO2, could account for i) about 15-20% of light olefins demand in Europe and ii) or nearly half of the projected transport bio-fuels in Europe for the year 2020 as primary outlet examples. The science and technology of common and less common methods to obtain suitable CO2 streams from concentrated sources is relatively well established by ongoing
74

intense R&D efforts to achieve more economic and energy efficiency solutions, while this still requires significant breakthroughs for DAC. Stability, purity and energy investments for this “auxiliary” part of CCU are important target areas for R&D efforts.
• We need to design new catalytic technologies for CO2 utilisation. These include robust catalysts for methanation (148, 149) and methanol (150-153) synthesis. Catalysts for the conversion of CO2 into olefins and long chain hydrocarbons also need to be improved for their lifetime and product selectivity. This field has a great economic interest and large-scale potential. Here in particular the scientific progress of the last two decades offers a large potential for generating disruptive progress if we are able to combine theory with experiment (154-157) and realise that material and process development must go hand in hand.
75
7. Assessment of potential
This Chapter aims (i) to summarise the WG assessment about the potential of CCU, including the related opportunities and challenges, and (ii) to provide a number of recommended options, which emerge from our study as plausible measures to be taken.
7.1 METHODOLOGYFrom a methodological point of view, we have focused on a set of four societal services that can be provided by different energy carriers by means of different technology chains (including possibly CCU). Such services can be summarised as follows:
i power generation and distribution through the grid;
ii fuels (and power) for transport and mobility;
iii storage and transport of renewable energies, to cope with their intermittency;
iv manufacturing of industrial products.
Possible energy carriers are, for the sake of simplicity, 1/ electrons, i.e. electricity, 2/ hydrogen, i.e. green-hydrogen synthesised via water electrolysis, and 3/ synthetic natural gas, i.e. a fuel made via CCU, whose characteristics and performance are representative of the whole class of synthetic fuels that can be synthesised by reacting captured CO2 with hydrogen in a CCU scheme.
Such approach lends itself naturally to a comparison of the different options and technology chains to deliver the services above, which is based on a rigorous system analysis within well-specified system boundaries. In doing this, we have utilised five criteria, namely:
1 efficiency in the use of energy, particularly of carbon-free renewable energy;
2 carbon fluxes, with reference to CO2 emissions first, as well as to consumption of fossil-carbon resources and to occupation of sub-surface CO2 storage space;
3 environmental impact, on top of those considered within criterion 2;
4 costs, including operational and capital costs, as well as financing schemes; and
5 societal perception and political feasibility.
It is worth noting firstly that such criteria differ in terms of their quantitative/qualitative character, then that the time and resources constraint of the work behind this report necessitate a simplified approach in carrying out the system analysis. We believe that such an approach has delivered results that are qualitatively robust, though they can be only approximated from a quantitative point of view.
76
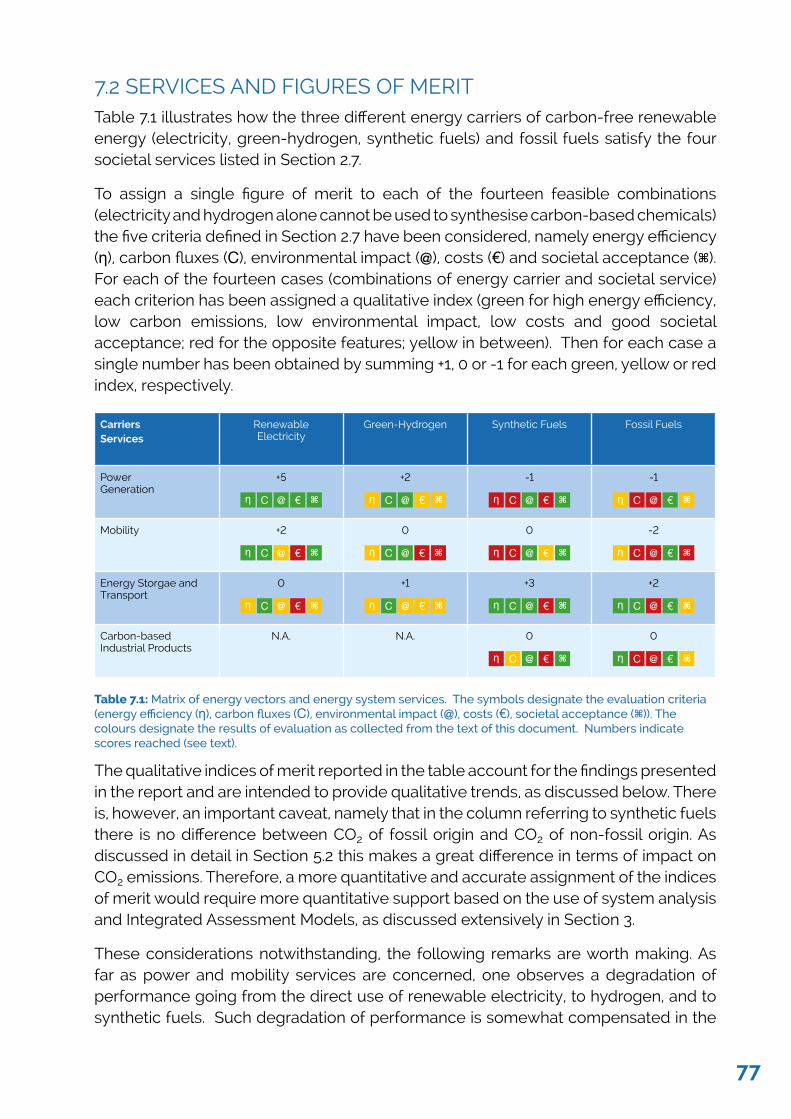
7.2 SERVICES AND FIGURES OF MERITTable 7.1 illustrates how the three different energy carriers of carbon-free renewable energy (electricity, green-hydrogen, synthetic fuels) and fossil fuels satisfy the four societal services listed in Section 2.7.
To assign a single figure of merit to each of the fourteen feasible combinations (electricity and hydrogen alone cannot be used to synthesise carbon-based chemicals) the five criteria defined in Section 2.7 have been considered, namely energy efficiency (ƞ), carbon fluxes (C), environmental impact (@), costs (€) and societal acceptance (⌘). For each of the fourteen cases (combinations of energy carrier and societal service) each criterion has been assigned a qualitative index (green for high energy efficiency, low carbon emissions, low environmental impact, low costs and good societal acceptance; red for the opposite features; yellow in between). Then for each case a single number has been obtained by summing +1, 0 or -1 for each green, yellow or red index, respectively.
CarriersServices
RenewableElectricity
Green-Hydrogen Synthetic Fuels Fossil Fuels
Power Generation
+5
ƞ C @ € ⌘
+2
ƞ C @ € ⌘
-1
ƞ C @ € ⌘
-1
ƞ C @ € ⌘
Mobility +2
ƞ C @ € ⌘
0
ƞ C @ € ⌘
0
ƞ C @ € ⌘
-2
ƞ C @ € ⌘
Energy Storgae and Transport
0
ƞ C @ € ⌘
+1
ƞ C @ € ⌘
+3
ƞ C @ € ⌘
+2
ƞ C @ € ⌘
Carbon-based Industrial Products
N.A. N.A. 0
ƞ C @ € ⌘
0
ƞ C @ € ⌘
Table 7.1: Matrix of energy vectors and energy system services. The symbols designate the evaluation criteria (energy efficiency (ƞ), carbon fluxes (C), environmental impact (@), costs (€), societal acceptance (⌘)). The colours designate the results of evaluation as collected from the text of this document. Numbers indicate scores reached (see text).
The qualitative indices of merit reported in the table account for the findings presented in the report and are intended to provide qualitative trends, as discussed below. There is, however, an important caveat, namely that in the column referring to synthetic fuels there is no difference between CO2 of fossil origin and CO2 of non-fossil origin. As discussed in detail in Section 5.2 this makes a great difference in terms of impact on CO2 emissions. Therefore, a more quantitative and accurate assignment of the indices of merit would require more quantitative support based on the use of system analysis and Integrated Assessment Models, as discussed extensively in Section 3.
These considerations notwithstanding, the following remarks are worth making. As far as power and mobility services are concerned, one observes a degradation of performance going from the direct use of renewable electricity, to hydrogen, and to synthetic fuels. Such degradation of performance is somewhat compensated in the
77
case of mobility by the undisputable advantages associated to the use of carbon-based fuels (particularly liquid ones), namely their high-energy density and the availability of the existing distribution infrastructure.
As to the storage and transport of energy the situation is just the opposite, whereby synthetic natural gas outperforms both renewable electricity and green hydrogen, particularly for long-term storage and long-range transport. It appears from our analysis that synthetic natural gas must be part of a future sustainable energy system with a very large penetration of intermittent renewables.
It is worth noting, with reference to the last column, i.e. to fossil fuels, such as natural gas (reported here for the sake of comparison), that although their figures of merit, at least in this semi-quantitative analysis, are not different from those of synthetic fuels, their feature profile is completely different, with almost complementary advantages and disadvantages.
Finally, as far as carbon-based industrial products are considered, the option of continuing using fossil oil for their production appears to be more appealing than the approach relying on CCU, particularly in a world where fossil-carbon is no more used for the other services, i.e. power and mobility.
7.3 OPTIONS FOR ACTION In the following some options for answering the questions will be formulated. These options use some assumptions resulting from the present analysis and will be repeated here for the sake of clarity. It is important to underline that the three options presented below correspond to different views about CCU, each of which is supported by only part of the WG. In line with an explicit request from the SAM and the HLG, we offer a perspective on alternative options, without trying to formulate a single recommendation, on which to find full consensus within the WG. Therefore, such options should not be interpreted as being the expression of a consensus recommendation formulated by the WG.
• CCU as technology option requires a substantial research effort to become useful in sustainable energy system.
• Only RES is used in CCU as energy source.
• The CCU technologies are used only in cyclic mode. The linear mode of CCU in which fossil CO2 is used and finally emitted into the atmosphere is considered as a technology that should merely be used for pilot demonstrators but not be rolled out throughout Europe.
• In order to minimise the excess RES necessary in the CCU process chain disruptive improvements are required in core technologies related to the supply of energy required for the reduction of the CO2 molecule. This critically includes electrochemical devices and electro-catalysts to produce hydrogen from water as well as chemo-catalytic technologies (including novel materials, reactors and processes) for the relevant reduction reactions. The largest loss fraction concerns the re-conversion of material energy carriers in
78
electricity requiring improvements in flame technologies as well as the scalable introduction of flameless conversion technologies. It is noted that this part of the CCU technology portfolio is also common to the existing energy system and could achieve immediate large reductions of CO2 emissions even in fossil scenarios.
• We discriminate CCU into climate-relevant applications with a potential to be large scale industries in contrast to other CCU applications devoted to low tonnage production of high value products, that may be economically viable are but not climate-relevant.
7.3.1 Option 1
The EU creates, independent from other options and in complement to existing target-oriented structures, a CCU technology platform to initiate throughout the member states and for the EU policy-makers a transparent and neutral stakeholder information and communication process. The platform would need an instrument generating a flow of validated information complementing fragmented views brought by stakeholders. These activities should be accompanied by suitable and lasting socio-economic research to analyse the process and its effects on policies in the member states and at the EU level. Continuous feedback to policy makers should be given. A critical function would be the information exchange about CCU activities in member states. Harmonisation of legal and economic boundary conditions would be extremely useful and could be facilitated when based upon a commonly shared information base. The platform could further catalyse the information exchange upon technology developments that is presently impeded through fragmentation. The platform should generate a standardisation of LCA activities with a suitable and common frame. Coordinated research actions of the EU should be firmly linked to the platform and give information about their results. The platform should develop as a deliverable a CCU strategy that is continuously updated, following external evolution and the progress of internal EU developments.
7.3.2 Option 2
The EU acknowledges the need of a massive deployment of advanced energy storage and energy transmission services in future defossilised energy systems, of which CCU may be one of the key providers in competition with others. The EU launches as a top priority R&D effort on the enabling technologies capable to supply such services (CCU along with other solutions involving other chemical energy vectors that not involve CO2 reactions or other energy storage and energy conversion technologies). CCU has a negligible potential for CO2 reduction in sectors of the energy system that can be electrified. It is recognised that CCU systems (in particular those upgrading biomass or those using other renewable sources of carbon) may deliver significant contribution to the climate change challenge only at late stages of the energy transition. In view of the still substantial research effort needed to bring it to bear and in view of the rapid development of RES availability in some countries inside and outside of the EU, a concerted research and development effort should be undertaken to maintain at
79
least technological leadership in this area, where European industry is strong. Large-scale deployment in the EU should only begin where the RES fraction reaches critical levels for the stability of the power system or where RES is already abundant.
7.3.3 Option 3
The EU recognises that CCU offers a whole set of service functions to energy systems of which the CO2 reduction is only one contribution. CCU is a system-critical component to any defossilisation strategy and will thus be a vital element in any energy system in the world. The relevant technologies are thus key to a European industry innovation strategy and require substantial and immediate efforts. The timescale for system-relevant rollout is seen within the long-term horizon of this document (2050). Multiple large demonstrators will be needed to assess the true functional capacity of CCU technologies in real energy systems. These have to be ready as soon as possible and should be constructed in modular form to serve as test beds for forthcoming disruptive developments and as pathfinders for business cases. In order to be effective the implementation of this option should cover the following areas:
1 Regulations
CCU is considered an action within the portfolio of climate mitigation strategies. The utilisation of RES for CCU is free of fees and taxes as it is a raw material. EU creates general and binding trade rules for the bulk transportation of RES throughout the member states.
2 Demonstrators
EU supports large-scale R+D to create world-scale demonstrator units of CCU technologies. EU accepts that as bridging technology the demonstrator may start as linear operation as long the project suitably shows the path to cyclic operation in a sustainable energy system. EU recognises that here novel technologies come into operation, which would need without EU support a long time for market penetration due to unclear positions about risk management. EU further finds suitable measures to mitigate operational risks of demonstrators arising from potential changes of regulatory conditions both at the level of member states and at the EU level. Risks from global developments cannot be covered.
3 Capital
EU finds instruments to secure long-term stability of the capital service conditions. The slow payback of infrastructure investments that replace proven and written-off fossil technologies needs stable financing conditions. This applies to the rollout phase of a CCU technology that should not be supported by technology-specific subventions. In the past it proved very difficult to remove such economic benefits when they are no more needed. Their continuous operation reduces the agility of the markets to adapt to changing conditions with disadvantages to taxpayers in state-operated and customers in private energy industries.
80
4 Research
EU organises, with member states, subsidiary large-scale research to aim for breakthroughs (158, 159) in underlying core technologies such as those described in Section 7.3. Subsidiarity means coordination with member states to provide fundamental science input and to take part in coordinating (platforms) actions for an accelerated defragmentation of the research landscape and effective technology transfer. The results of this effort are the demonstrators as well as reliable LCA results of their function and proven technologies making EU industry fit for global competition in a growing worldwide CCU technology market.
7.3.4 Concluding remarks
A possible sequence of activities could be as follows. Option 1 should be executed at once. This creates the necessary processes of information and knowledge flow between politics, industry and society to define optimal forms of all actions described in Option 3. In order not to lose time the role of CCU within the regulatory measures of EU climate mitigation needs immediate consideration and sufficient resources should be put into the research planning for generating the large coordinated research actions in the near future. All actions described in option 3 should then be initiated following the stakeholder exchange process described in option 1. This sequence of actions respects the society to participate as informed stakeholder in the planning and minimises the present industrial and technological fragmentation that impedes a world-leading position. Europe is well advised to learn from the evolution of battery and solar industries and to retain in its hands at least the CCU component as a critical component of the energy transition. The close connection between the novel CCU industry (resulting from collaboration between existing strong industries such as chemical, engineering, electrical infrastructure) and the critical mobility industry (cars, planes ships) is a strong reason to develop both aspects within Europe as integrated foundational policy.
Changing from a provider of technology-specific subsidies to an enabling mediator of stakeholder positions puts politics into the position of creating a strong, generic (to the whole energy system) and adaptive regulatory framework with predictive conditions and transparent consequences of violation. Politics may create a space where technologies are created and demonstrated jointly and under societal participation and then rolled out from there in competition. If this happens fast enough there is a good chance that such a process will create the desired strong global position of Europe in the energy transition. The required new energy systems are not created by counting CO2 saving actions but by devising sustainable systems with all services discussed here and by supporting stakeholders in finding the way to this new system. The climate mitigation effect is not the driver of the energy transition but rather the result of introducing the new energy system. The case of the CCU policy could be the initiator for the evolving energy transition into this position.
81
8. Literature1. von der Assen N, Jung J, Bardow A. Life-
cycle assessment of carbon dioxide capture and utilization: avoiding the pitfalls. Energy & Environmental Science. 2013;6(9):2721-34.
2. Grinberg Dana A, Elishav O, Bardow A, Shter GE, Grader GS. Nitrogen-Based Fuels: A Power-to-Fuel-to-Power Analysis. Angewandte Chemie (International ed in English). 2016;55(31):8798-805.
3. Bauer C, Treyer K, Heck T, Hirschberg S. Greenhouse Gas Emissions from Energy Systems, Comparison, and Overview. Reference Module in Earth Systems and Environmental Sciences: Elsevier; 2015.
4. Abanades JC, Rubin ES, Mazzotti M, Herzog HJ. On the climate change mitigation potential of CO2 conversion to fuels. Energy & Environmental Science. 2017;10(12):2491-9.
5. Aresta M, Dibenedetto A, Angelini A. Catalysis for the Valorization of Exhaust Carbon: from CO2 to Chemicals, Materials, and Fuels. Technological Use of CO2. Chemical Reviews. 2014;114(3):1709-42.
6. Koytsoumpa EI, Bergins C, Kakaras E. The CO2 economy: Review of CO2 capture and reuse technologies. Journal of Supercritical Fluids. 2018;132:3-16.
7. Markewitz P, Kuckshinrichs W, Leitner W, Linssen J, Zapp P, Bongartz R, et al. Worldwide innovations in the development of carbon capture technologies and the utilization of CO2. Energy & Environmental Science. 2012;5(6):7281-305.
8. Rogelj J, Luderer G, Pietzcker RC, Kriegler E, Schaeffer M, Krey V, et al. Energy system transformations for limiting end-of-century warming to below 1.5 degrees C. Nature Climate Change. 2015;5(6):519.
9. Cuellar-Franca RM, Azapagic A. Carbon capture, storage and utilisation technologies: A critical analysis and comparison of their life cycle environmental impacts. Journal of Co2 Utilization. 2015;9:82-102.
10. Boot-Handford ME, Abanades JC, Anthony EJ, Blunt MJ, Brandani S, Mac Dowell N, et al. Carbon capture and storage update. Energy & Environmental Science. 2014;7(1):130-89.
11. Spanos I, Auer AA, Neugebauer S, Deng XH, Tuysuz H, Schlogl R. Standardized Benchmarking of Water Splitting Catalysts in a Combined Electrochemical Flow Cell/Inductively Coupled Plasma-Optical Emission Spectrometry (ICP-OES) Setup. Acs Catalysis. 2017;7(6):3768-78.
12. Reier T, Pawolek Z, Cherevko S, Bruns M, Jones T, Teschner D, et al. Molecular Insight in Structure and Activity of Highly Efficient, Low-Ir Ir-Ni Oxide Catalysts for Electrochemical Water Splitting (OER). Journal of the American Chemical Society. 2015;137(40):13031-40.
13. Haas T, Krause R, Weber R, Demler M, Schmid G. Technical photosynthesis involving CO2 electrolysis and fermentation. Nature Catalysis. 2018;1(1):32-9.
14. Aresta M. My journey in the CO2-chemistry wonderland. Coordination Chemistry Reviews. 2017;334:150-83.
15. Aresta M, Dibenedetto A, Quaranta E. State of the art and perspectives in catalytic processes for CO2 conversion into chemicals and fuels: The distinctive contribution of chemical catalysis and biotechnology. Journal of Catalysis. 2016;343:2-45.
16. Perathoner S, Gross S, Hensen EJM, Wessel H, Chraye H, Centi G. Looking at the Future of Chemical Production through the European Roadmap on Science and Technology of Catalysis the EU Effort for a Long-term Vision. Chemcatchem. 2017;9(6):904-9.
17. Navarrete A, Centi G, Bogaerts A, Martin A, York A, Stefanidis GD. Harvesting Renewable Energy for Carbon Dioxide Catalysis. Energy Technology. 2017;5(6):796-811.
18. Centi G, Quadrelli EA, Perathoner S. Catalysis for CO2 conversion: a key technology for rapid introduction of renewable energy in the value chain of chemical industries. Energy & Environmental Science. 2013;6(6):1711-31.
19. Klankermayer J, Wesselbaum S, Beydoun K, Leitner W. Selective Catalytic Synthesis Using the Combination of Carbon Dioxide and Hydrogen: Catalytic Chess at the Interface of Energy and Chemistry. Angewandte Chemie-International Edition. 2016;55(26):7296-343.
20. Poliakoff M, Leitner W, Streng ES. The Twelve Principles of CO2 Chemistry. Faraday Discussions. 2015;183:9-17.
82
21. Peters M, Koehler B, Kuckshinrichs W, Leitner W, Markewitz P, Mueller TE. Chemical Technologies for Exploiting and Recycling Carbon Dioxide into the Value Chain. Chemsuschem. 2011;4(9):1216-40.
22. Leitner W. The coordination chemistry of carbon dioxide and its relevance for catalysis: A critical survey. Coordination Chemistry Reviews. 1996;153:257-84.
23. Lewis NS, Nocera DG. Powering the planet: Chemical challenges in solar energy utilization. Proceedings of the National Academy of Sciences of the United States of America. 2006;103(43):15729-35.
24. Asinger F. Methanol, Chemie-und Energierohstoff. Berlin: Springer; 1985. 407 p.
25. Olah GA, Goeppert A, Prakash GKS. Chemical Recycling off Carbon Dioxide to Methanol and Dimethyl Ether: From Greenhouse Gas to Renewable, Environmentally Carbon Neutral Fuels and Synthetic Hydrocarbons. Journal of Organic Chemistry. 2009;74(2):487-98.
26. Olah GA. Beyond oil and gas: The methanol economy. Angewandte Chemie-International Edition. 2005;44(18):2636-9.
27. Aresta M, Dibenedetto A, Angelini A. The changing paradigm in CO2 utilization. Journal of Co2 Utilization. 2013;3-4:65-73.
28. Wilson G, Trusler M, Yao J, Lee JSM, Graham R, Mac Dowell N, et al. End use and disposal of CO2 – storage or utilisation?: general discussion. Faraday Discussions. 2016;192:561-79.
29. Smit B, Graham R, Styring P, Yao J, Clough P, Lee JSM, et al. CCS – A technology for the future: general discussion. Faraday Discussions. 2016;192:303-35.
30. Lee JSM, Rochelle G, Styring P, Fennell P, Wilson G, Trusler M, et al. CCS – A technology for now: general discussion. Faraday Discussions. 2016;192:125-51.
31. Patricio J, Angelis-Dimakis A, Castillo-Castillo A, Kalmykova Y, Rosado L. Method to identify opportunities for CCU at regional level – Matching sources and receivers. Journal of Co2 Utilization. 2017;22:330-45.
32. Perez-Fortes M, Schoneberger JC, Boulamanti A, Tzimas E. Methanol synthesis using captured CO2 as raw material: Techno-economic and environmental assessment. Applied Energy. 2016;161:718-32.
33. Palzer A, Henning HM. A Future German Energy System with a Dominating Contribution from Renewable Energies: A Holistic Model Based on Hourly Simulation. Energy Technology. 2014;2(1):13-28.
34. Palzer A, Henning HM. A comprehensive model for the German electricity and heat sector in a future energy system with a dominant contribution from renewable energy technologies – Part II: Results. Renewable & Sustainable Energy Reviews. 2014;30:1019-34.
35. Henning HM, Palzer A. A comprehensive model for the German electricity and heat sector in a future energy system with a dominant contribution from renewable energy technologies Part I: Methodology. Renewable & Sustainable Energy Reviews. 2014;30:1003-18.
36. Mac Dowell N, Fennell PS, Shah N, Maitland GC. The role of CO2 capture and utilization in mitigating climate change. Nature Climate Change. 2017;7(4):243-9.
37. Yang ZZ, Zhao YN, He LN. CO2 chemistry: task-specific ionic liquids for CO2 capture/activation and subsequent conversion. Rsc Advances. 2011;1(4):545-67.
38. Rees NV, Compton RG. Electrochemical CO2 sequestration in ionic liquids; a perspective. Energy & Environmental Science. 2011;4(2):403-8.
39. Mikkelsen M, Jorgensen M, Krebs FC. The teraton challenge. A review of fixation and transformation of carbon dioxide. Energy & Environmental Science. 2010;3(1):43-81.
40. Klankermayer J, Leitner W. Love at second sight for CO2 and H-2 in organic synthesis. Science. 2015;350(6261):629-30.
41. Genovese C, Ampelli C, Perathoner S, Centi G. Electrocatalytic conversion of CO2 on carbon nanotube-based electrodes for producing solar fuels. Journal of Catalysis. 2013;308:237-49.
83
42. Mul G, Schacht C, van Swaaij WPM, Moulijn JA. Functioning devices for solar to fuel conversion. Chemical Engineering and Processing. 2012;51:137-49.
43. Xu XD, Moulijn JA. Mitigation of CO2 by chemical conversion: Plausible chemical reactions and promising products. Energy & Fuels. 1996;10(2):305-25.
44. Al-Mamoori A, Krishnamurthy A, Rownaghi AA, Rezaei F. Carbon Capture and Utilization Update. Energy Technology. 2017;5(6):834-49.
45. Lewis NS. Toward cost-effective solar energy use. Science. 2007;315(5813):798-801.
46. European Renewable Energy Council. Renewable energy in Europe – recent growth and knock-on effects. Wageningen University & Research Centre; 2014.
47. European Renewable Energy Council. Renewable energy in Europe – recent growth and knock-on effects: 2017 update. European Environment Agency; 2017.
48. Hao X, Djatmiko ME, Xu YY, Wang YN, Chang J, Li YW. Simulation analysis of a GTL process using ASPEN plus. Chemical Engineering & Technology. 2008;31(2):188-96.
49. Sinigaglia T, Lewiski F, Martins MES, Siluk JCM. Production, storage, fuel stations of hydrogen and its utilization in automotive applications-a review. International Journal of Hydrogen Energy. 2017;42(39):24597-611.
50. Ozel FM, Davies H, Wells P. What works? An ANFIS-based policy evaluation framework for electric vehicle technology development. International Journal of Electric and Hybrid Vehicles. 2017;9(3):222-52.
51. Leitner W, Klankermayer J, Pischinger S, Pitsch H, Kohse-Hoinghaus K. Advanced Biofuels and Beyond: Chemistry Solutions for Propulsion and Production. Angewandte Chemie-International Edition. 2017;56(20):5412-52.
52. Ishimoto Y, Kurosawa A, Sasakura M, Sakata K. Significance of CO2-free hydrogen globally and for japan using a long-term global energy system analysis. International Journal of Hydrogen Energy. 2017;42(19):13357-67.
53. Xu XY, Liu Y, Zhang F, Di W, Zhang YL. Clean coal technologies in China based on methanol platform. Catalysis Today. 2017;298:61-8.
54. Philibert C. Renewable Energy for Industry. Paris: International Energy Agency; 2017.
55. IEA (International Energy Agency) World Energy Outlook. 2017.
56. Molina MG. Energy Storage and Power Electronics Technologies: A Strong Combination to Empower the Transformation to the Smart Grid. Proceedings of the Ieee. 2017;105(11):2191-219.
57. Koytsoumpa EI, Bergins C, Buddenberg T, Wu S, Sigurbjornsson O, Tran KC, et al. The Challenge of Energy Storage in Europe: Focus on Power to Fuel. Journal of Energy Resources Technology-Transactions of the Asme. 2016;138(4).
58. Gallo AB, Simoes-Moreira JR, Costa HKM, Santos MM, dos Santos EM. Energy storage in the energy transition context: A technology review. Renewable & Sustainable Energy Reviews. 2016;65:800-22.
59. Teichmann D, Arlt W, Wasserscheid P. Liquid Organic Hydrogen Carriers as an efficient vector for the transport and storage of renewable energy. International Journal of Hydrogen Energy. 2012;37(23):18118-32.
60. Olivier P, Bourasseau C, Bouamama B. Dynamic and multiphysic PEM electrolysis system modelling: A bond graph approach. International Journal of Hydrogen Energy. 2017;42(22):14872-904.
61. Koj JC, Wulf C, Schreiber A, Zapp P. Site-Dependent Environmental Impacts of Industrial Hydrogen Production by Alkaline Water Electrolysis. Energies. 2017;10(7).
62. Dau H, Limberg C, Reier T, Risch M, Roggan S, Strasser P. The Mechanism of Water Oxidation: From Electrolysis via Homogeneous to Biological Catalysis. Chemcatchem. 2010;2(7):724-61.
63. van den Berg MWE, Polarz S, Tkachenko OP, Kaehler K, Muhler M, Gruenert W. Dynamical Changes in the Cu-ZnO (x) Interaction Observed in a Model Methanol Synthesis Catalyst. Catalysis Letters. 2009;128(1-2):49-56.
64. Reske R, Mistry H, Behafarid F, Cuenya BR, Strasser P. Particle Size Effects in the Catalytic Electroreduction of CO2 on Cu Nanoparticles. Journal of the American Chemical Society. 2014;136(19):6978-86.
84
65. Peterson AA, Abild-Pedersen F, Studt F, Rossmeisl J, Norskov JK. How copper catalyzes the electroreduction of carbon dioxide into hydrocarbon fuels. Energy & Environmental Science. 2010;3(9):1311-5.
66. Cuellar Franca R, Azapagic A. Carbon capture, storage and utilisation of technologies: A critical analysis and comparison of their life cycle environmental impacts. J of CO2 Utilization. 2015;9:82-102.
67. Abanades JC, Rubin ES, Mazzotti M, Herzog HJ. On the True Climate Change Mitigation Potential of CO2 Conversion to Fuels. Energy & Environmental Science. 2017:0-14.
68. Malins C. What role is there for electrofuel technologies in European transport’s low carbon future? : Cerulogy; 2017.
69. Christensen A, Petrenko C. CO2-based synthetic fuel: assessment of potential European capacity and environmental performance. European Climate Foundation and the International Council on Clean Transportation 2017.
70. Gust D, Moore TA, Moore AL. Solar Fuels via Artificial Photosynthesis. Accounts of Chemical Research. 2009;42(12):1890-8.
71. Barber J. Photosynthetic energy conversion: natural and artificial. Chemical Society Reviews. 2009;38(1):185-96.
72. Dana AG, Elishav O, Bardow A, Shter GE, Grader GS. Nitrogen-Based Fuels: A Power-to-Fuel-to-Power Analysis. Angewandte Chemie-International Edition. 2016;55(31):8798-805.
73. Haegel NM, Margolis R, Buonassisi T, Feldman D, Froitzheim A, Garabedian R, et al. Terawatt-scale photovoltaics: Trajectories and challenges. Science. 2017;356(6334):141-3.
74. Garcia-Herrero A, Xu J. China’s Belt and Road Initiative: Can Europe Expect Trade Gains? SSRN Electronic Journal. 2016.
75. Dimitriou I, Garcia-Gutierrez P, Elder RH, Cuellar-Franca RM, Azapagic A, Allen RWK. Carbon dioxide utilisation for production of transport fuels: process and economic analysis. Energy & Environmental Science. 2015;8(6):1775-89.
76. Zhang XJ, Bauer C, Mutel CL, Volkart K. Life Cycle Assessment of Power-to-Gas: Approaches, system variations and their environmental implications. Applied Energy. 2017;190:326-38.
77. European Commission EUROSTAT Statistics explained. Renewable energy statistics. . 2017.
78. Pérez-Fortes M, Barbosa EM. Technology Market Report Carbon Capture, Utilisation and Storage. 2016.
79. Azapagic A, Perdan S. Sustainable Chemical Engineering: Dealing with “Wicked” Sustainability Problems. Aiche Journal. 2014;60(12):3998-4007.
80. European Commission EUROSTAT Statistics explained. Electricity and heat statistics. 2017.
81. European Commission EUROSTAT Statistics explained. Energy, Transport and GHG Emissions Trends to 2050. 2016.
82. Lund H, Mathiesen BV. Energy system analysis of 100% renewable energy systems-The case of Denmark in years 2030 and 2050. Energy. 2009;34:524-31.
83. Connolly D, Mathiesen BV. A technical and economic analysis of one potential pathway to a 100% renewable energy system. Int J Sustain Energy Plan Manag 2014;1:7-28.
84. Connolly D, Lund H, Mathiesen BV. Smart Energy Europe: The technical and economic impact of one potential 100% renewable energy scenario for the European Union. Renew Sustain Energy Rev. 2016;60:1634-53.
85. Energinet.DK. Technology data for energy plants. ENERGINETDK2016
86. Bauer C, Treyer K, Heck T, Hirschberg S. Greenhouse Gas Emissions from Energy Systems, Comparison, and Overview: Elsevier Inc.; 2015.
87. Körner A. Technology Roadmap: Hydrogen and Fuel Cells. Springer Reference. 2015.
88. Simons A, Bauer C. A life-cycle perspective on automotive fuel cells. Appl Energy. 2015;157(884-896).
89. Lang T, Glörfeld E, Girod B. Don’t just follow the sun – A global assessment of economic performance for residential building photovoltaics. Renew Sustain Energy Rev. 2015;42:932-51.
85
90. Louwen A, de Waal AC, Schroop REI, Jaaij APC, van Sark WGJHM. Comprehensive characterisation and analysis of PV module performance under real operating conditions. Prog Photovolt Res Appl. 2017;35:218-32.
91. Pfenninger S, Staffell I. Long-term patterns of European PV output using 30 years of validated hourly reanalysis and satellite data. Energy. 2016;114:1251-65.
92. Bracco S, Dentici G, Siri S. DESOD : A mathematical programming tool to optimally design a distributed energy system. Energy. 2016;100:298-309.
93. Adams AS, Keith DW. Are global wind power resource estimates overstated? . Environ Res Lett. 2013;8.
94. IRENA Renewable Energy Technologies: Hydropower Cost Analysis. 2015.
95. US Department of Energy Natural Gas for Cars Using Natural Gas for Vehicles : Comparing Three Technologies. 2015.
96. International Energy Agency Global EV Outlook 2017. IEA Publ. 2017:1-17.
97. Wang M, Elgowainy A. Well-to-wheels GHG emissions of NG use in transportation: CNGVs, LNGs, EVs, FCVs. 2014.
98. US Department of Energy https://www.fueleconomy.gov. 2017.
99. Felgenhauer MF, Pellow MA, Benson SM, Hamacher T. Evaluating co-benefits of battery and fuel cell vehicles in a community in California. Energy. 2016;114:360-8.
100. Büchi FN, Hofer M, Peter C, Cabalzar UD, Bernard J, Hannesen U. Towards re-electrification of hydrogen obtained from the power-to-gas process by highly efficient H2/O2 polymer electrolyte fuel cells. RSC Adv. 2014;56139-56146.
101. NGV Global http://www.iangv.org/current-ngv-stats. 2017.
102. Global CCS Institute The Global Status of CCS: 2017. 2017;43.
103. Boot-Handford ME, Abanades JC, Anthony EJ, Blunt MJ, Brandani S, Mac Dowell N. Carbon capture and storage update. Energy Environ Sci. 2014;7:130-89.
104. IPPC. Climate Change 2013: The Physical Science Basis (Summary for Policymakers). 2013.
105. Brandani S. Carbon Dioxide Capture from Air: A Simple Analysis. Energy Environ. 2012;23:319-28.
106. Goeppert A, Czaun M, Surya Prakash GK, Olah GA. Air as the renewable carbon source of the future: an overview of CO2 capture from the atmosphere. Energy Environ Sci. 2012;5:7833.
107. Sanz-Pérez ES, Murdock CR, Didas SA, Jones CW. Direct Capture of CO2 from Ambient Air. Chem Rev. 2016;116:11840-76.
108. Rubin ES, Mantripragada H, Marks A, Versteeg P, Kitchin J. The outlook for improved carbon capture technology. Prog Energy Combust Sci. 2012;38:630-71.
109. Matuszewski M. DOE/NETL CO2 Capture R&D Program. 2014 NETL CO2 Capture Technol Meet. 2014.
110. Bhandari R, Trudewind CA, Zapp P. Life cycle assessment of hydrogen production via electrolysis – A review. J Clean Prod. 2014;85:151-63.
111. Götz M, Lefebre J, Mörs F, McDaniel Koch A, Graf F, Bajohr S. Renewable Power-to-Gas: A technological and economic review. Renew Energy. 2016;85:1371-90.
112. Zhang X, Bauer C, Mutel CL, Volkart K. Life Cycle Assessment of Power-to-Gas: Approaches, system variations and their environmental implications. Appl Energy. 2017;190:326-8.
113. Nel hydrogen http://nelhydrogen.com/product/electrolysers. 2017.
114. Müller-Syring MH, Köppel W, Mlaker H, Sterner M, Höcher T. Entwicklung von modularen Konzepten zur Erzeugung , Speicherung und Einspeisung von Wasserstoff und Methan ins Erdgasnetz. 2013.
115. Nikolaidis P, Poullikkas A. A comparative overview of hydrogen production processes. Renewable & Sustainable Energy Reviews. 2017;67:597-611.
116. Gahleitner G. Hydrogen from renewable electricity: An international review of power-to-gas pilot plants for stationary applications. International Journal of Hydrogen Energy. 2013;38(5):2039-61.
86
117. SwissHydrogen http://swisshydrogen.ch/ n.d. http://swisshydrogen.ch/mobility-2/fuel-cell-h2o2-operation/. 2008
118. Sternberg A, Jens CM, Bardow A. Life cycle assessment of CO2 -based C1-chemicals. Green Chem. 2017;19:2244-59.
119. Siemens Silyzer http://www.industry.siemens.com/topics/global/en/pem-electrolyzer/silyzer/
120. Ferrero D, Lanzini A, Santarelli M, Leone PA. A comparative assessment on hydrogen production from low- and high-temperature electrolysis. Int J Hydrogen Energy. 2013;38:3523-36.
121. Behrens M, Studt F, Kasatkin I, Hävecker M, Abild-Pedersen F. Industrial Catalysts. Science. 2012;759:893-8.
122. Xu X, Liu Y, Zhang F, Di W, Zhang Y. Clean coal technologies in China based on methanol platform. Catal Today. 2017;298:61-8.
123. Khodakov AY, Chu W, Fongarland P. Advances in the development of novel cobalt Fischer-Tropsch catalysts for synthesis of long-chain hydrocarbons and clean fuels. Chemical Reviews. 2007;107(5):1692-744.
124. Maus W, Jacob E. Future-safe combustion-engined Drives – The Role of sustainable Fuels. 2015.
125. Leitner W, Klankermayer J, Pischinger S, Pitsch H, Kohse-Hoinghaus K. Angew Chem Int Ed. 2017;56.
126. Härtl M, Seidenspinner P, Jacob E, Wachtmeister G. Oxygenate screening on a heavy-duty diesel engine and emission characteristics of highly oxygenated oxymethylene ether fuel OME1. Fuel. 2015;153:328-35.
127. Pérez-Fortes M, Schöneberger JC, Boulamanti A, Tzimas E. Methanol synthesis using captured CO2 as raw material: Techno-economic and environmental assessment. Appl Energy. 2016;161:718-32.
128. Sternberg A, Bardow A. Life Cycle Assessment of Power-to-Gas: Syngas vs Methane. ACS Sustain Chem Eng. 2016;4:4156-65.
129. Khaletskaya K, Pougin A, Medishetty R, Rosler C, Wiktor C, Strunk J, et al. Fabrication of Gold/Titania Photocatalyst for CO2 Reduction Based on Pyrolytic Conversion of the Metal-Organic Framework NH2-MIL-125(Ti) Loaded with Gold Nanoparticles. Chemistry of Materials. 2015;27(21):7248-57.
130. Ma Y, Wang XL, Jia YS, Chen XB, Han HX, Li C. Titanium Dioxide-Based Nanomaterials for Photocatalytic Fuel Generations. Chemical Reviews. 2014;114(19):9987-10043.
131. Gangeri M, Perathoner S, Caudo S, Centi G, Amadou J, Bégin D, et al. Fe and Pt carbon nanotubes for the electrocatalytic conversion of carbon dioxide to oxygenates Catal Today. 2009;143(1-2):57-63.
132. Budny C, Madlener R, Hilgers C. Energy Conversion and Management 2015;102:258-66.
133. Simonis B, Newborough M. Sizing and operating power-to-gas systems to absorb excess renewable electricity. International Journal of Hydrogen Energy. 2017;42(34):21635-47.
134. Schlögl R. E-Mobility and the Energy Transition. Angew Chem Int Ed. 2017.
135. Altfeld K, Pinchbeck D. Admissible hydrogen concentrations in natural gas systems. gas for energy 2013;3:1-12.
136. Scamman D, Newborough M. Using surplus nuclear power for hydrogen mobility, and power-to-gas in France. . Int J Hydrogen Energy. 2016;41:10080-9.
137. International Council of Chemical Associations. Innovations for greenhouse gas reductions: a life-cycle quantification of carbon abatement solutions enable by the chemical industry. 2009.
138. Clack CTM, Qvist SA, Apt J, Bazilian M, Brandt AR, Caldeira K, et al. Evaluation of a proposal for reliable low-cost grid power with 100% wind, water, and solar. Proceedings of the National Academy of Sciences. 2017;114(26):6722-7.
139. Naraharisetti PK, Yeo TY, Bu J. Factors Influencing CO2 and Energy Penalties of CO2 Mineralization Processes. Chemphyschem. 2017;18(22):3189-202.
87
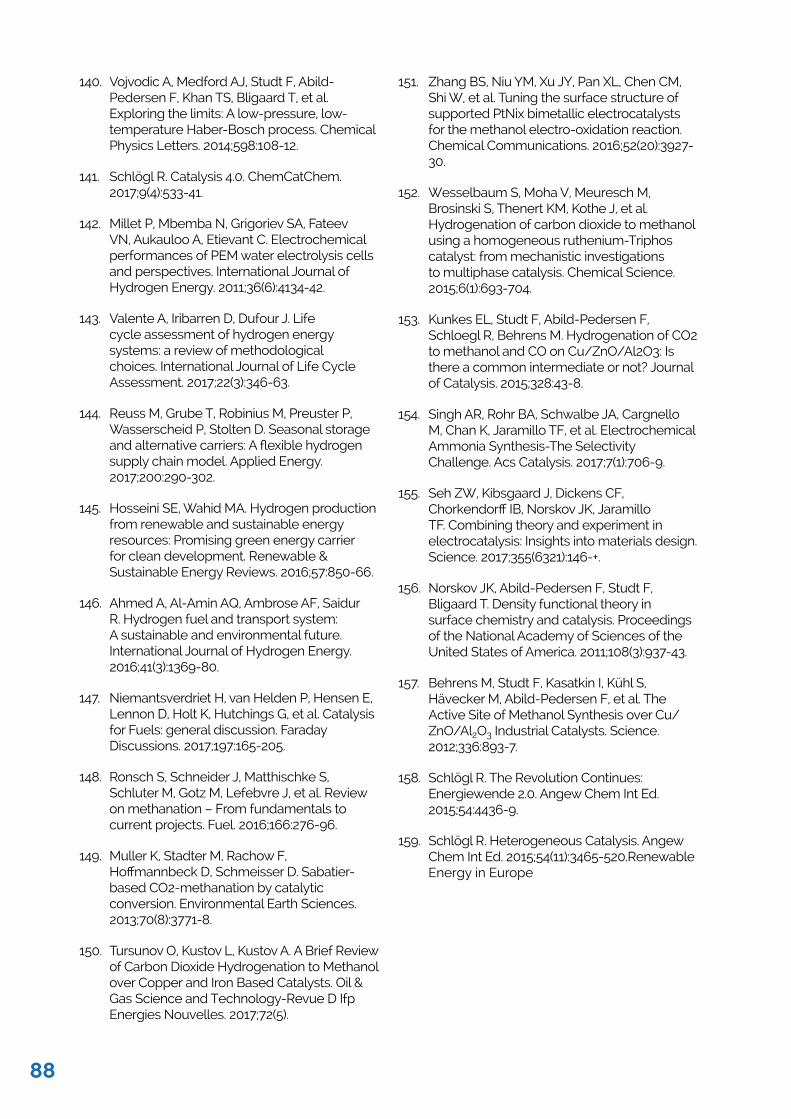
140. Vojvodic A, Medford AJ, Studt F, Abild-Pedersen F, Khan TS, Bligaard T, et al. Exploring the limits: A low-pressure, low-temperature Haber-Bosch process. Chemical Physics Letters. 2014;598:108-12.
141. Schlögl R. Catalysis 4.0. ChemCatChem. 2017;9(4):533-41.
142. Millet P, Mbemba N, Grigoriev SA, Fateev VN, Aukauloo A, Etievant C. Electrochemical performances of PEM water electrolysis cells and perspectives. International Journal of Hydrogen Energy. 2011;36(6):4134-42.
143. Valente A, Iribarren D, Dufour J. Life cycle assessment of hydrogen energy systems: a review of methodological choices. International Journal of Life Cycle Assessment. 2017;22(3):346-63.
144. Reuss M, Grube T, Robinius M, Preuster P, Wasserscheid P, Stolten D. Seasonal storage and alternative carriers: A flexible hydrogen supply chain model. Applied Energy. 2017;200:290-302.
145. Hosseini SE, Wahid MA. Hydrogen production from renewable and sustainable energy resources: Promising green energy carrier for clean development. Renewable & Sustainable Energy Reviews. 2016;57:850-66.
146. Ahmed A, Al-Amin AQ, Ambrose AF, Saidur R. Hydrogen fuel and transport system: A sustainable and environmental future. International Journal of Hydrogen Energy. 2016;41(3):1369-80.
147. Niemantsverdriet H, van Helden P, Hensen E, Lennon D, Holt K, Hutchings G, et al. Catalysis for Fuels: general discussion. Faraday Discussions. 2017;197:165-205.
148. Ronsch S, Schneider J, Matthischke S, Schluter M, Gotz M, Lefebvre J, et al. Review on methanation – From fundamentals to current projects. Fuel. 2016;166:276-96.
149. Muller K, Stadter M, Rachow F, Hoffmannbeck D, Schmeisser D. Sabatier-based CO2-methanation by catalytic conversion. Environmental Earth Sciences. 2013;70(8):3771-8.
150. Tursunov O, Kustov L, Kustov A. A Brief Review of Carbon Dioxide Hydrogenation to Methanol over Copper and Iron Based Catalysts. Oil & Gas Science and Technology-Revue D Ifp Energies Nouvelles. 2017;72(5).
151. Zhang BS, Niu YM, Xu JY, Pan XL, Chen CM, Shi W, et al. Tuning the surface structure of supported PtNix bimetallic electrocatalysts for the methanol electro-oxidation reaction. Chemical Communications. 2016;52(20):3927-30.
152. Wesselbaum S, Moha V, Meuresch M, Brosinski S, Thenert KM, Kothe J, et al. Hydrogenation of carbon dioxide to methanol using a homogeneous ruthenium-Triphos catalyst: from mechanistic investigations to multiphase catalysis. Chemical Science. 2015;6(1):693-704.
153. Kunkes EL, Studt F, Abild-Pedersen F, Schloegl R, Behrens M. Hydrogenation of CO2 to methanol and CO on Cu/ZnO/Al2O3: Is there a common intermediate or not? Journal of Catalysis. 2015;328:43-8.
154. Singh AR, Rohr BA, Schwalbe JA, Cargnello M, Chan K, Jaramillo TF, et al. Electrochemical Ammonia Synthesis-The Selectivity Challenge. Acs Catalysis. 2017;7(1):706-9.
155. Seh ZW, Kibsgaard J, Dickens CF, Chorkendorff IB, Norskov JK, Jaramillo TF. Combining theory and experiment in electrocatalysis: Insights into materials design. Science. 2017;355(6321):146-+.
156. Norskov JK, Abild-Pedersen F, Studt F, Bligaard T. Density functional theory in surface chemistry and catalysis. Proceedings of the National Academy of Sciences of the United States of America. 2011;108(3):937-43.
157. Behrens M, Studt F, Kasatkin I, Kühl S, Hävecker M, Abild-Pedersen F, et al. The Active Site of Methanol Synthesis over Cu/ZnO/Al2O3 Industrial Catalysts. Science. 2012;336:893-7.
158. Schlögl R. The Revolution Continues: Energiewende 2.0. Angew Chem Int Ed. 2015;54:4436-9.
159. Schlögl R. Heterogeneous Catalysis. Angew Chem Int Ed. 2015;54(11):3465-520.Renewable Energy in Europe
88
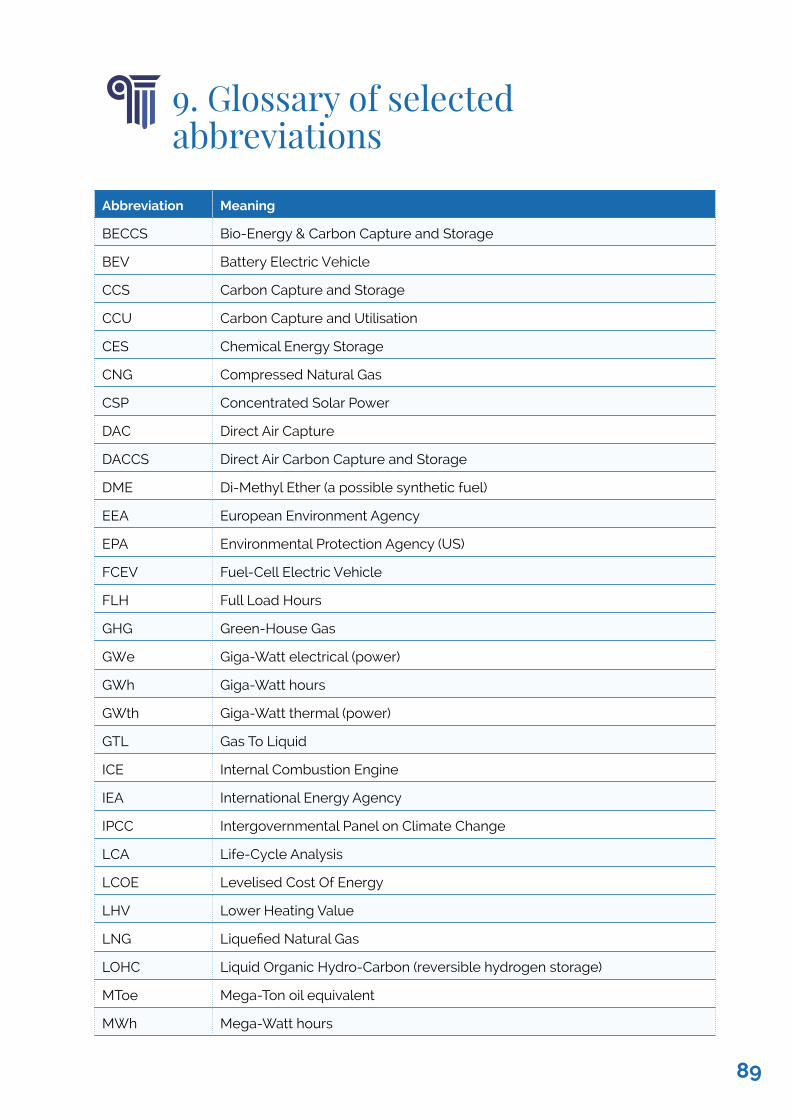
9. Glossary of selected abbreviations
Abbreviation Meaning
BECCS Bio-Energy & Carbon Capture and Storage
BEV Battery Electric Vehicle
CCS Carbon Capture and Storage
CCU Carbon Capture and Utilisation
CES Chemical Energy Storage
CNG Compressed Natural Gas
CSP Concentrated Solar Power
DAC Direct Air Capture
DACCS Direct Air Carbon Capture and Storage
DME Di-Methyl Ether (a possible synthetic fuel)
EEA European Environment Agency
EPA Environmental Protection Agency (US)
FCEV Fuel-Cell Electric Vehicle
FLH Full Load Hours
GHG Green-House Gas
GWe Giga-Watt electrical (power)
GWh Giga-Watt hours
GWth Giga-Watt thermal (power)
GTL Gas To Liquid
ICE Internal Combustion Engine
IEA International Energy Agency
IPCC Intergovernmental Panel on Climate Change
LCA Life-Cycle Analysis
LCOE Levelised Cost Of Energy
LHV Lower Heating Value
LNG Liquefied Natural Gas
LOHC Liquid Organic Hydro-Carbon (reversible hydrogen storage)
MToe Mega-Ton oil equivalent
MWh Mega-Watt hours
89
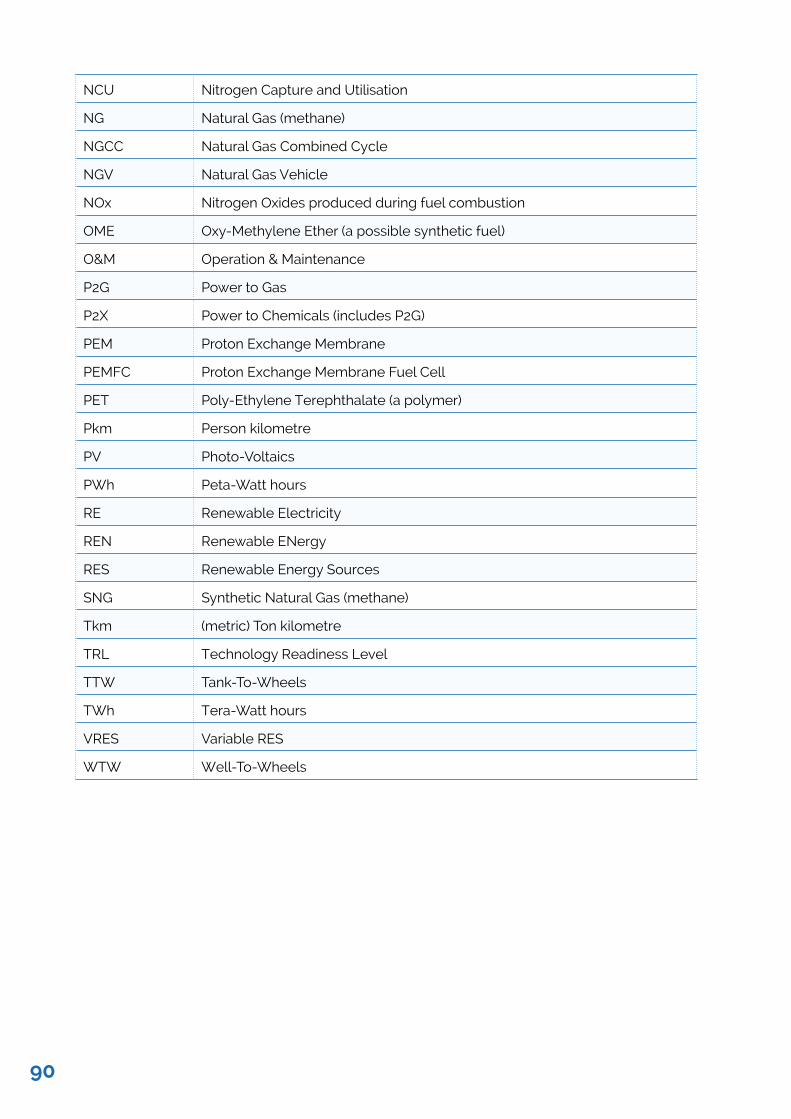
NCU Nitrogen Capture and Utilisation
NG Natural Gas (methane)
NGCC Natural Gas Combined Cycle
NGV Natural Gas Vehicle
NOx Nitrogen Oxides produced during fuel combustion
OME Oxy-Methylene Ether (a possible synthetic fuel)
O&M Operation & Maintenance
P2G Power to Gas
P2X Power to Chemicals (includes P2G)
PEM Proton Exchange Membrane
PEMFC Proton Exchange Membrane Fuel Cell
PET Poly-Ethylene Terephthalate (a polymer)
Pkm Person kilometre
PV Photo-Voltaics
PWh Peta-Watt hours
RE Renewable Electricity
REN Renewable ENergy
RES Renewable Energy Sources
SNG Synthetic Natural Gas (methane)
Tkm (metric) Ton kilometre
TRL Technology Readiness Level
TTW Tank-To-Wheels
TWh Tera-Watt hours
VRES Variable RES
WTW Well-To-Wheels
90
10. Working Group members
Schlögl (Chair) Robert Fritz-Haber-Institute Germany
Abanades Carlos Spanish Research Council Spain
Aresta Michele CIRCC, University of Bari Italy
Azapagic Adisa University of Manchester United Kingdom
Blekkan Edd Anders Norwegian University of Science and Technology
Norway
Cantat Thibault CEA France
Centi Gabriele University of Messina Italy
Duic Neven University of Zagreb Croatia
El Khamlichi Aïcha ADEME France
Hutchings Graham Cardiff University United Kingdom
Mazzotti (Co-chair) Marco ETH Zürich Switzerland
Olsbye Unni University of Oslo Norway
Mikulcic (invited member) Hrvoje University of Zagreb Croatia
Lead Network: Euro-CASE
Caristan Yves Secrétaire Général France
Gehrisch Wolf Euro-CASE France
91
11. Acknowledgements
Coordination Group membersProfessor Elvira Fortunato, Chair, Coordination Group, Member of the Group of Chief Scientific Advisors
Professor Rolf-Dieter Heuer, Chair of the Group of Chief Scientific Advisors
Standing invitees to the Coordination Group
Professor Robert Schlögl, Chair of Working Group
Professor Marco Mazzotti, Deputy Chair of Working Group
Dr. Yves Caristan, Secretary General, Euro-CASE
Chief Scientific AdvisorsProfessor Janusz BujnickiProfessor Pearl Dykstra (Deputy Chair)Professor Elvira FortunatoProfessor Rolf-Dieter Heuer (Chair)Professor Carina KeskitaloProfessor Sir Paul Nurse
SAM UnitDr. Johannes KlumpersProfessor Maria da Graça CarvalhoDr. Dulce BoavidaDr. Iphigenia PottakiDr. Maurizio SalviJacques Verraes
ReviewersDr. Jean Guy Devezeaux de Lavergne,
Director of the Institute of Techno-Economics of energy systems of the CEA/ Paris Saclay, France
SAPEA wishes to thank the following people for their valued contribution and support to the production of this report.
Professor Eirik Schrøder Amundsen, University of Bergen, Norway
Dr. Stephanie Searle, The International Council on Clean Transportation (ICCT), United States
Professor Karel Svoboda, University of Chemistry and Chem. Technology Prague, Czech RepublicWorking Group membersSee list of members in Annex
Scientific writerDr. Ella Adlen
Page layoutNewington Design
SAPEA staffLouise EdwardsLaura NortonDr. Esther Dorado-LaderaRobert VogtHamed MobasserDr. Antonella Di TrapaniDr. Cosmas LambiniDr. Nina HobbhahnDr. Wolf Gehrisch
Expert workshop participantsAll workshop participants and organisers
Literature reviewWorking Group members and Euro-CASE staff
Public engagement eventsOrganisers, speakers and sponsors at the Amsterdam and Ljubljana public engagement events, particularly Robert Thijssen, Royal Dutch Academy of Sciences/Netherlands Academy of Technology and Innovation (KNAW/AcTI); Professor Slavko Kaucic, Slovenian Academy of Engineering.
92
Annex
BACKGROUND TO THE REPORTThe request to the Scientific Advice Mechanism (SAM) to investigate the topic “Novel Carbon Capture and Utilisation Technologies (CCU) Research and Climate aspects” came from the Commissioner for Climate Action & Energy, Miguel Arias Cañete via the Commissioner for Research, Science and Innovation, Carlos Moedas, and was taken up by the Group of Chief Scientific Advisors.
Based on the scoping paper (SAM-HLG, 2017), the key questions asked were:
• Under what circumstances CCU for production of fuels, chemicals and materials can deliver climate benefits and what are their total climate mitigation potential in the mid- and long-run?
• How can the climate mitigation potential of CO2 incorporated in products such as fuels, chemicals and materials be accounted for considering that the CO2 will remain bound for different periods of time and then may be released in the atmosphere?
Within the Group of Chief Scientific Advisors, Professor Elvira Fortunato led on this topic, in cooperation with other the members of the Group of Chief Scientific Advisors, in particular Professor Rolf-Dieter Heuer.
The SAPEA Consortium was asked to conduct a rapid evidence review and toproduce an Evidence Review Report (ERR) on the topic. Staff members from SAPEA and the SAM Unit had a kick-off telephone conference in September 2017 to discuss project scope and working processes. A Coordination Group was formed, which was composed of the involved members of the Group of Chief Scientific Advisors and the SAPEA Working Group Chair and Deputy-Chair.A Coordination Group telephone conference in October 2017 and a physical meeting in December 2017 refined project scope, methodology and progress. SAPEA set up an international and interdisciplinary Working Group, based on aprocess of formal nomination by academies and the European Academy Networks participating in SAPEA. Nominee assessment by the SAPEA Board followed established guidelines (www.sapea.info/guidelines), whilst adhering to the primary criterion of scientific excellence in the field.
All members of the Working Group (Chapter 10) were required to fill in a declaration of interest form. The Working Group was chaired by Professor Robert Schlögl, Fritz-Haber-Institut of Max-Planck-Gesellschaft (Germany), with Professor Marco Mazzotti, Institute of Process Engineering, ETH Zurich (Switzerland) as Co-Chair.The Working Group held three face-to-face meetings between October 2017 and December 2017 and exchanged draft chapters between members until February 2018. Appointed staff members from SAPEA attended the meetings and the SAM Unit staff occasionally joined via telephone conference as observers. The Working Group discussed the
93
original questions, defined its approach to answering them, wrote the ERR, and provided direction for literature search and review, focussing on the essential. The SAM Unit provided further references.
A first draft of the ERR was scrutinised at an expert workshop (www.sapea.info/expertworkshopccu) with invited external experts on 25 January 2018, hosted at the Palais des académies in Brussels, and set up to review the evidence of the draft ERR and to act as a bridge between the SAPEA ERR and the Scientific Opinion of the Group of Chief Scientific Advisors. The attending experts provided written and verbal input on the first draft during and after the workshop, resulting in a revised ERR.
A Stakeholder Hearing, held at the European Commission, was organised by the SAM Unit and chaired by Elvira Fortunato. Both workshops resulted in separate reports and informed the Scientific Opinion of the Group of Chief Scientific Advisors.The revised ERR was peer-reviewed in March 2018 and revised to address reviewers’ comments.
The final version of the ERR was approved by the SAPEA Board April 24, 2018, on behalf of the Networks’ member academies.
Both the Evidence Review Report and the Scientific Opinion were published at the same time, in June 2018. Together they will make important contributions to the planning of the EU’s future policy.
SAM-HLG (2017). Scoping paper: Novel carbon capture and utilisation technologies: research and climate aspects. Available for download at https://ec.europa.eu/research/sam/pdf/meetings/hlg_sam_032017_scoping_paper_ccu.pdf#view=fit&pagemode=none
94
Spanning the disciplines of engineering,
humanities, medicine, natural sciences and social
sciences, SAPEA brings together the outstanding
knowledge and expertise from over 100 academies,
young academies and learned societies in over 40
countries across Europe.
SAPEA is part of the European Scientific Advice
Mechanism (SAM), which provides independent,
interdisciplinary and evidence-based scientific
advice on policy issues to the European
Commission. SAPEA works closely with the SAM
Group of Chief Scientific Advisors.
www.sapea.info @SAPEAnews
This project has received funding from the European Union’s Horizon 2020 research and
innovation programme under grant agreement No 737432