RESEARCH AND ANALYSIS Material Flows and Economic Growth in Developing Chinamingxu/file/J4.pdf ·...
20
RESEARCH AND ANALYSIS Material Flows and Economic Growth in Developing China Ming XU and Tianzhu ZHANG Summary The concept of sustainable development concerns not only the natural environment but also human societies and economies. The method of economy-wide material flow ac- counting and analysis (EW-MFA) is internationally recognized as a valuable tool for studying the physical dimensions of economies. EW-MFA has been carried out in many indus- trialized countries, but very little work has been done for de- veloping China; this article can be regarded as one of the first attempts to study China’s economy in terms of material flows. In this article we have compiled material flow accounts for China during the time series 1990 to 2002 and derived indi- cators associated with international comparison. Results show that the annual material consumption of China’s economy con- tinuously increased except for a slump around 1998, whereas the material efficiency exhibited a three-phase trend reflecting different macropolicies of the Eighth, Ninth, and Tenth Five- Year Plans implemented by the central government. Based on this experience with EW-MFA for China, suggestions for methodology development and further research are given for improving EW-MFA as a more effective tool for environmental management. Keywords China economy-wide material flow accounting and analysis (EW-MFA) industrial ecology industrial metabolism resource use indicators sustainability Address correspondence to: Professor Tianzhu Zhang Department of Environmental Science and Engineering Tsinghua University Beijing 100084, People’s Republic of China <[email protected]> © 2007 by the Massachusetts Institute of Technology and Yale University Volume 11, Number 1 www.mitpressjournals.org/jie Journal of Industrial Ecology 121
Transcript of RESEARCH AND ANALYSIS Material Flows and Economic Growth in Developing Chinamingxu/file/J4.pdf ·...

RESEARCH AND ANALYSIS
Material Flows and EconomicGrowth in Developing ChinaMing XU and Tianzhu ZHANG
Summary
The concept of sustainable development concerns not onlythe natural environment but also human societies andeconomies. The method of economy-wide material flow ac-counting and analysis (EW-MFA) is internationally recognizedas a valuable tool for studying the physical dimensions ofeconomies. EW-MFA has been carried out in many indus-trialized countries, but very little work has been done for de-veloping China; this article can be regarded as one of the firstattempts to study China’s economy in terms of material flows.In this article we have compiled material flow accounts forChina during the time series 1990 to 2002 and derived indi-cators associated with international comparison. Results showthat the annual material consumption of China’s economy con-tinuously increased except for a slump around 1998, whereasthe material efficiency exhibited a three-phase trend reflectingdifferent macropolicies of the Eighth, Ninth, and Tenth Five-Year Plans implemented by the central government. Basedon this experience with EW-MFA for China, suggestions formethodology development and further research are given forimproving EW-MFA as a more effective tool for environmentalmanagement.
Keywords
Chinaeconomy-wide material flow
accounting and analysis (EW-MFA)industrial ecologyindustrial metabolismresource use indicatorssustainability
Address correspondence to:Professor Tianzhu ZhangDepartment of Environmental Science
and EngineeringTsinghua UniversityBeijing 100084,People’s Republic of China<[email protected]>
© 2007 by the Massachusetts Institute ofTechnology and Yale University
Volume 11, Number 1
www.mitpressjournals.org/jie Journal of Industrial Ecology 121

R E S E A R C H A N D A N A LYS I S
Introduction
During the past century, human society hasachieved great success in economic growth. Buteconomic growth has neglected the truth thatnatural resources are not infinitely provided bythe environmental system. Thus more and moreserious resource-related and environmental prob-lems are emerging. Studying the physical dimen-sions of the economy is one way to possibly finda solution for a problem such as sustainable de-velopment. During the past 15 years, materialand energy flow analysis have emerged as signif-icant approaches to tracking the flows of mat-ter and energy and to comparing the naturalecosystem and the industrial system in a studyof “industrial metabolism” (Ayres 1994; Erkman1997). A number of studies have been presentedfor industrialized countries (e.g., Adriaanse etal. 1997; Matthews et al. 2000; Eurostat 2002)and for transition economies (e.g., Hammer andHubacek 2002; Mundl et al. 1999; Scasny et al.2003; Amann et al. 2002; Giljum 2004). ForChina, some preliminary research studies havebeen carried out (Chen and Qiao 2001; Xu andZhang 2004, 2005; Liu et al. 2005; Xu et al.2005).
In 1994, a plan for China’s sustainable devel-opment was presented in China’s Agenda 21—White Paper on China’s Population, Environment,and Development in the 21st Century.1 Sustain-able development is regarded as an increasinglyimportant issue by China’s government and pub-lic. This study focuses on the physical dimen-sions of China’s economy, using the methodof economy-wide material flow accounting andanalysis (EW-MFA). This method has receivedincreasing recognition for its ability to make thesocioeconomic system physically known. China’seconomy has been rapidly growing since theearly 1990s, with gross domestic product (GDP)growing around 10% annually. This illustriouseconomic achievement rests, though, on a vastamount of material expended, severe exhaustionof natural resources, and serious deterioration ofthe environment. Although the increase in useof materials and energy is an essential and un-avoidable prerequisite for the transition to an in-dustrialized economy, it is still very important forsustainable development to find a way to con-
sume limited natural resources with maximumefficiency.
This article first provides a brief introductionto the method of EW-MFA. The main part of thearticle is devoted to the presentation and discus-sion of the main EW-MFA indicators for Chinaduring the time series for 1990 to 2002. Next,suggestions for future research are presented. Inthe final section, conclusions for the article aredrawn.
Economy-wide Material FlowAccounting and Analysis
The EW-MFA method considers the eco-nomic system as an embedded subsystem of theecosystem, giving us new tools for monitor-ing progress toward the development of a moreeco-efficient economy and long-term sustainabil-ity. In the EW-MFA framework, materials aretracked from the extraction of natural resourcesto stocks and accumulation within the economy,and finally to waste and emission into the envi-ronment. The physical amounts of materials indifferent phases of industrial processing are to-talled, and a set of physical indicators are alsodeveloped. Using EW-MFA indicators, the phys-ical dimension of an economic system can beevaluated and analyzed.
Within the input side of the economic sys-tem, material flows are classified by EW-MFAas the following: (a) Domestic extraction used(DEU) refers to the materials that can be di-rectly observed to enter the economic systemfrom the domestic environment. (For definitionsof the acronyms used throughout this article, seetable 1.) These materials consist of fossilfuels, minerals, and biomass. (b) Imports consistof the materials imported from other countries.(c) Unused domestic extraction (UDE) is definedas the materials that are extracted from the do-mestic environment but do not enter any eco-nomic system (e.g., cover material or overburdenfrom mining or residuals from harvest in agri-culture). (d) Indirect flows associated with im-ports (IFI) are calculations of upstream materialrequirements associated with imports. For EW-MFA, indirect flows contain two components:upstream indirect flows—expressed as the rawmaterial equivalents (RME)—of the imported
122 Journal of Industrial Ecology

R E S E A R C H A N D A N A LYS I S
Table 1 Acronyms used in this article
DEU Domestic extraction used: the materials that can be directly observed to enter theeconomic system from the domestic environment.
DMC Domestic material consumption: the total amount of material directly used in aneconomy.
DMI Direct material input: the input of materials for use in the economy.DPO Domestic processed output: the materials consumed domestically within the accounting
period.EU-15 The 15 countries making up the European Union before 1 May 2004.EW-MFA Economy-wide material flow accounting and analysis.GDP Gross domestic product.IFI Indirect flows associated with imports: calculations of upstream material requirements
associated with Imports.NAS Net addition to stock: the physical growth of the economy.PTB Physical trade balance: the difference between the amounts of Imports and Exports.RME Raw material equivalents of the imported products.TDO Total domestic output (TDO): the domestic processed output plus the unused domestic
extraction.TMR Total material requirement: the total material base of the economy.UDE Unused domestic extraction: the materials that are extracted from the domestic
environment but do not enter any economic system.
products and upstream indirect flows of unusedextraction associated with this RME.
In the economic system, material inputs aretransformed into (a) net additions to stock(NAS), which are the materials accumulatedwithin the socioeconomic system, such as infras-tructure and durable goods; (b) domestic pro-cessed output (DPO), which is defined as thematerials consumed domestically within the ac-counting period (in most cases 1 yr) and thuscrossing the system boundary back to the en-vironment as waste, emissions, and dissipativeuse or loss that is dispersed into the environ-ment as a deliberate, or unavoidable (with cur-rent technology), consequence of product use;(c) exports, which consist of materials exportedto other countries.
The material flow categories and some mainindicators provided by EW-MFA are presented infigure 1. A number of aggregated physical indica-tors can be derived from material flow account-ing, which can be classified into input, output,and consumption categories. The detail of theseindicators will be described in the following sec-tion. The physical indicators can be calculatedeither absolutely or relatively by population size(per capita) and economic performance (per unitGDP).2 Indicators can be used to express material
efficiency (units of GDP per unit of material in-dicator) or material intensity (the mathematicalinverse of material efficiency). If input indicatorsare related to population size, the result also mea-sures the material intensity. The decline of ma-terial intensity and growth of material efficiencyis a necessary feature of sustainable development,but not sufficient.
The EW-MFA indicators of China’s economyfrom 1990 to 2002 are studied in this article. TheDEU data for fossil fuels, net metal-related ores,biomass, and DPO can be gained from specialyearbooks published officially. These yearbooksare the 1990–2002 China Statistical Yearbook,China Steel Yearbook, China Nonferrous Metal In-dustry Yearbook, China Energy Statistical Yearbook,and China Environment Yearbook (see NationalBureau of Statistics of China [1991–2003]; Edit-ing Committee of China Steel Yearbook [1991–2003]; Editing Committee of China NonferrousMetal Industry Yearbook [1991–2003]; EditingCommittee of China Energy Statistical Year-book [1991–2003]; and Editing Committee ofChina Environment Yearbook [1991–2003]). Forbiomass data, particularly, the online databaseprovided by the Food and Agriculture Organiza-tion of the United Nations is also used as a supple-ment (FAO 2005). For some data that are missing
Xu and Zhang, Material Flows and Economic Growth in Developing China 123

R E S E A R C H A N D A N A LYS I S
Figure 1 Material flow categories and main indicators in the economy-wide material flow accounting andanalysis (EW-MFA) method (adapted from Matthews et al. 2000). TMR = total material requirement; DMI =direct material input; TDO = total domestic output. DMI = domestic extraction + Imports; TMR = DMI +UDE + IFI; NAS (net addition to stock) = DMI − DPO − Exports; TDO = DPO + UDE.
or are provided in nonphysical units, a good dealof work is required to estimate them. The detailedmethods for dealing with these data are as follows:(a) The UDE of fossil fuel was calculated on thebasis of coefficients provided by the WuppertalInstitute for Climate, Environment and Energy(2003) in Germany. (b) The UDE of ferrous andnonferrous metal-related ores was calculated fromspecific data provided by the China Steel Yearbookand the China Nonferrous Metal Industry Yearbook,consisting of the amount of tunneling, overbur-den mining, and other unused flows. (c) The DEUand UDE of mass construction minerals were es-timated from the data of yearly products of ce-ment and flat glass and the area of constructioncompletion. The coefficients were provided byMo (2003) and Chen (2005). (d) The weightsof imports and exports mostly consisted of food-stuff, steels, coal, oil, and so forth, for which thephysical data were provided by the 1990–2002Yearbook of China’s Foreign Economic Relationsand Trade (see Editing Committee of Yearbook ofChina’s Foreign Economic Relations and Trade[1991–2003]), whereas other minor flows having
only monetary data were ignored. (e) IFI was notcalculated, due to the lack of data and meth-ods. (f) The amount of carbon dioxide emission,which makes up a large proportion in the outputside, was provided by the online database of theStatistics Division of the United Nations (UNSD2005). The weight of oxygen in carbon dioxidewas calculated with the stoichiometric formula.(g) The amounts of by-products from agriculture,direct uptake by livestock animals, and nonmar-keted animal fodder were calculated from the dataprovided by the 1990–2002 Chinese Animal Hus-bandry Yearbook (see Editing Committee of Chi-nese Animal Husbandry Yearbook [1991–2003]).(h) The weight of water used was not included inthe accounting framework because of its consid-erably larger quantity than that of other materi-als. (i) A gap of missing data caused by changesin statistical rules was estimated by mathematicinterpolation methods.
As with most countries in the world, Chinadoes not have any official statistical frameworkfor physical materials. Thus, a lot of physicaldata in EW-MFA accounting are estimated from
124 Journal of Industrial Ecology

R E S E A R C H A N D A N A LYS I S
Figure 2 Input indicators for China from 1990 to 2002, in petagrams. UDE = unused domestic extraction;DEU = domestic extraction used; DMI = direct material input; TMR = total material requirement. Onepetagram (Pg) = one billion tonnes (109 t) = 1012 kilograms (kg, SI) ≈ 1.102 × 10⁹ short tons.
Table 2 Input indicators and real GDP based on2002 prices for China (in petagrams and billion �)
Year DEU Imports UDE DMI TMR GDP
1990 3 0.1 10 3 13 3,4481991 3 0.1 11 3 14 3,7651992 3 0.2 11 3 14 4,3001993 4 0.2 12 4 16 4,8801994 4 0.3 13 4 17 5,4951995 5 0.3 15 5 20 6,0721996 5 0.3 15 5 21 6,6551997 5 0.4 16 5 21 7,2411998 5 0.3 15 5 20 7,8071999 5 0.4 14 5 19 8,3652000 5 0.5 14 6 20 9,0342001 6 0.6 16 6 22 9,7112002 6 0.7 18 7 25 10,517
Note: Input indicators in petagrams (Pg; One billiontonnes); GDP in billion � (Chinese yuan renminbi). Onepetagram (Pg) = one billion tonnes (109 t) = 1012 kilo-grams (kg, SI) ≈ 1.102 × 10⁹ short tons. DEU = domes-tic extraction used; UDE = unused domestic extraction;DMI = direct material input; TMR = total material re-quirement; GDP = gross domestic product.
previous statistics data, most of which are in mon-etary units. The data quality should be improvedin future research. The estimates used in thisstudy, though, can satisfy the data requirementfor such research on an economy-wide system,because information on most of the significantmaterials, such as fossil fuels and metal minerals,can be obtained directly.
Results and Discussion
In this article, material flow accounting forChina from 1990 to 2002 has been applied. In thissection, some analysis will be carried out based onindicators concerning material inputs, outputs,and consumption. The EW-MFA results for someindustrialized countries are compiled to comparethem with those for China.
Material Inputs
The main indicators on the input side aredirect material input (DMI) and total material
Xu and Zhang, Material Flows and Economic Growth in Developing China 125

R E S E A R C H A N D A N A LYS I S
requirement (TMR). DMI measures the input ofmaterials for use in the economy. DMI materialsare used in production and consumption activ-ities, which are of economic value. DMI equalsDEU plus imports. TMR measures the total mate-rial base of the economy. TMR equals DMI plusUDE and IFI. In this study, the calculation ofTMR excludes IFI (due to the lack of IFI dataand methods), as previously mentioned. Table 2and figure 2 show the absolute measurements ofDMI and TMR for China’s economy from 1990to 2002.
In figure 2, DMI and TMR show continualincreases from 1990 to 2002, excluding transi-tory slumps in 1998 and 1999. DMI grew from3 petagrams (Pg; one billion tonnes) in 1990 to7 Pg in 2002,3 with an average annual increaseof 7.75%. TMR grew from 13 Pg in 1990 to 25 Pgin 2002, with an average annual growth rate of5.64%. In 1998, TMR began to decrease, from21 Pg in 1997 to 20 Pg, and then to 19 Pg in 1999,and then began growing again in 2000. In thatsame period, China’s economy grew continuouslyby an average of 9.74% annually—indicated byreal GDP and based on 2002 prices (see table 2).The continuous increase of both DMI and TMRshows evidence that the extremely high rate ofgrowth of China’s economy is bringing on analmost unceasing increase of material consump-tion in China. Regarding the transitory slumpsin 1998, not only DMI and TMR, but also thesubindicators of DEU, imports, and UDE had thesame slumps at the same time.
From 1990 to 2002 the patterns of variation ofDMI and TMR can be divided into three phases,as follows: (a) from 1990 to 1995, DMI andTMR grew regularly at respective average ratesof 12.53% and 8.64% annually; (b) from 1995to 1999, DMI and TMR climbed the scale for ashort period and then decreased back to the ini-tial level before the rise; (c) from 1999 to 2002,DMI and TMR began to grow again at high rates,especially from 2000 to 2002. The annual averagegrowth rates for DMI and TMR are, respectively,11.90% and 13.05%.
During the first and third phases, annualgrowth of material inputs is higher than annualeconomic growth indicated by GDP. During thereferenced phases, the material requirement perunit of economic growth of China is increasing.
It can be concluded that the material efficiency ofChina’s economic system was not improved dur-ing either of these phases. During a given singlephase, the material consumption intensities in-dicated by DMI and TMR have nearly the sametrend. The material consumption intensity is alsosensitive to those different phases. For example,DMI and TMR changed only slightly before andincluding 2000. After 2001, though, DMI andTMR began to grow at instantly high rates. Itis important to stress that we cannot easily tellwhether the higher or lower growth rate of ma-terial consumption intensity is good or bad. ForChina, we cannot expect a developing countryas such to dematerialize during this transitionperiod. High intensity of material consumptionis an essential prerequisite for industrialization.The amount of UDE plays a significant role incomparison with the DMI in TMR. The ratio ofTMR to DMI shows a continual decrease from1990 to 2002. In 2002, the ratio of TMR to DMIwas 3.56, which means 3.56 tonnes of materialare completely removed where only 1 tonne ofmaterial is used in the economic production pro-cess. The progressive decline of the ratio of TMRto DMI shows an increasing development of ma-terial efficiency, which will be discussed in moredetail later.
Components of DMI and TMR include fossilfuels, metal-related minerals, industrial and con-struction minerals, and biomass. Figures 3 and 4present the quantitative and proportional vari-ation patterns of DMI components. Fossil fuelsconsist of oil, coal, and natural gas. Metal-relatedminerals consist of metal ores and other mineralsused in ferrous and nonferrous metallurgy indus-tries, such as clay, fluorite, and dolomite. Theserelated minerals are not calculated in subsequentcomponents of industrial and construction min-erals, which comprise various nonmetal mineralsfor industrial process and construction. Biomassincludes harvests and quarries from agriculture,forestry, fishing, and hunting.
From Figures 3 and 4, it can be found that thetotal amounts of metal minerals in DMI haveapproximately the same pattern of variation.Biomass in DMI grew continuously in amountbut stayed proportionally in the range of 25%.Fossil fuels played an important role in DMI com-ponents for the majority of the time during the
126 Journal of Industrial Ecology

R E S E A R C H A N D A N A LYS I S
Figure 3 Direct material input (DMI) components for China from 1990 to 2002, in petagrams (Pg; onebillion tonnes).
Figure 4 Proportions of direct material input (DMI) components for China from 1990 to 2002.
Xu and Zhang, Material Flows and Economic Growth in Developing China 127

R E S E A R C H A N D A N A LYS I S
Figure 5 Total material requirement (TMR) for China and eight other countries, in tonnes per capita.Sources: Data for Austria, Germany, Japan, and the Netherlands (1975–1996): Matthews and colleagues(2000); for the Czech Republic (1990–2000): Scasny and colleagues (2003); for Hungary (1993–1997):Hammer and Hubacek (2002); for the United Kingdom (1980–2000): Sheerin (2002); for the United States(1975–1994): Adriaanse and colleagues (1997).
period, which signifies that fossil fuels are an im-portant material base of growth for a developingeconomy. This presented a variation pattern thatwas very similar to that of DMI or TMR (seefigure 2), almost continuously increasing, with aslump around 1998. The amount of fossil fuelsin DMI decreased from 1997 to 2000. Duringthe same time, the net import of fossil fuels didnot show a significant increase. The proportionof fossil fuels in DMI continued to decrease from45.46% in 1990 to 25.46% in 2000, after which itbegan to increase again. At the same time, boththe total amount and the growing relative pro-portion of industrial and construction mineralsin DMI grew. After 1998, the proportion of in-dustrial and construction minerals in DMI beganto be greater than that of fossil fuels. Both thegrowing total amount and the growing relativeproportion of industrial and construction miner-als in DMI show their increasingly important role,which is also indicated by the corresponding ex-
tremely high growth rate of GDP in the construc-tion industry—an annual average of 18.99%.
For TMR, the variation patterns of each com-ponent are almost the same as those for DMI.The difference is that the relative proportions ofmetal minerals and biomass are lower than thosein DMI. It is clear that the UDE rates of fossilfuels and industrial and construction minerals aremuch higher than that of biomass. Furthermore,the total amount of metal minerals presented islower than that of fossil fuels and industrial andconstruction minerals, so that the proportion isalmost the same as that of biomass.
Figure 5 presents TMR per capita for China,and in comparison with eight countries, most ofwhose economies are industrialized. In China,TMR grew from 12 tonnes per capita (t/cap) in1990 to 20 t/cap in 2002,4 with an average annualincrease of 4.62%. It can be seen in figure 5 thatthe TMR per capita in China is lower than thatof all of the referenced countries.
128 Journal of Industrial Ecology
R E S E A R C H A N D A N A LYS I S
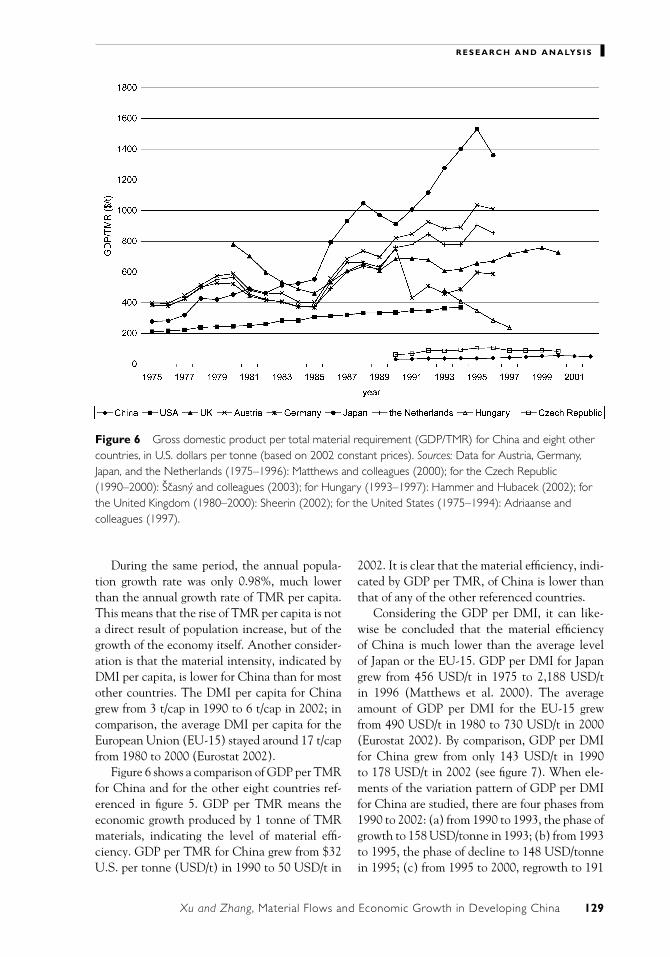
Figure 6 Gross domestic product per total material requirement (GDP/TMR) for China and eight othercountries, in U.S. dollars per tonne (based on 2002 constant prices). Sources: Data for Austria, Germany,Japan, and the Netherlands (1975–1996): Matthews and colleagues (2000); for the Czech Republic(1990–2000): Scasny and colleagues (2003); for Hungary (1993–1997): Hammer and Hubacek (2002); forthe United Kingdom (1980–2000): Sheerin (2002); for the United States (1975–1994): Adriaanse andcolleagues (1997).
During the same period, the annual popula-tion growth rate was only 0.98%, much lowerthan the annual growth rate of TMR per capita.This means that the rise of TMR per capita is nota direct result of population increase, but of thegrowth of the economy itself. Another consider-ation is that the material intensity, indicated byDMI per capita, is lower for China than for mostother countries. The DMI per capita for Chinagrew from 3 t/cap in 1990 to 6 t/cap in 2002; incomparison, the average DMI per capita for theEuropean Union (EU-15) stayed around 17 t/capfrom 1980 to 2000 (Eurostat 2002).
Figure 6 shows a comparison of GDP per TMRfor China and for the other eight countries ref-erenced in figure 5. GDP per TMR means theeconomic growth produced by 1 tonne of TMRmaterials, indicating the level of material effi-ciency. GDP per TMR for China grew from $32U.S. per tonne (USD/t) in 1990 to 50 USD/t in
2002. It is clear that the material efficiency, indi-cated by GDP per TMR, of China is lower thanthat of any of the other referenced countries.
Considering the GDP per DMI, it can like-wise be concluded that the material efficiencyof China is much lower than the average levelof Japan or the EU-15. GDP per DMI for Japangrew from 456 USD/t in 1975 to 2,188 USD/tin 1996 (Matthews et al. 2000). The averageamount of GDP per DMI for the EU-15 grewfrom 490 USD/t in 1980 to 730 USD/t in 2000(Eurostat 2002). By comparison, GDP per DMIfor China grew from only 143 USD/t in 1990to 178 USD/t in 2002 (see figure 7). When ele-ments of the variation pattern of GDP per DMIfor China are studied, there are four phases from1990 to 2002: (a) from 1990 to 1993, the phase ofgrowth to 158 USD/tonne in 1993; (b) from 1993to 1995, the phase of decline to 148 USD/tonnein 1995; (c) from 1995 to 2000, regrowth to 191
Xu and Zhang, Material Flows and Economic Growth in Developing China 129

R E S E A R C H A N D A N A LYS I S
Figure 7 Gross domestic product per direct material input (GDP/DMI) for China, Japan, and the EU-15, inU.S. dollars per tonne (based on 2002 constant prices). Sources: Data for Japan (1975–1996): Matthews andcolleagues (2000); for EU-15 (1980–2000): Eurostat (2002).
USD/t in 2000; (d) from 2000 to 2002, redeclineto 178 USD/t in 2002. The variation patterns ofGDP per TMR show the same trend as that ofGDP per DMI, but to a lesser extent.
GDP per DMI or TMR can be used to indicatethe material efficiency of an economy. Consider-ing the points discussed above, it can be con-cluded that the material efficiency of China’seconomy is much lower than that of industri-alized countries. Taking into account the con-tinuous increase of China’s GDP, the changes inmaterial efficiency are mainly due to the changesin the total amount of material consumption.
Material Outputs
Material inputs are processed by the eco-nomic system and finally transformed into phys-ical stocks in the economy and material outputs.DPO indicates the amount of materials emittedfrom domestic economic processes, being equalto dissipative flows plus emissions and wastes, thelatter two of which can be grouped by gateway as
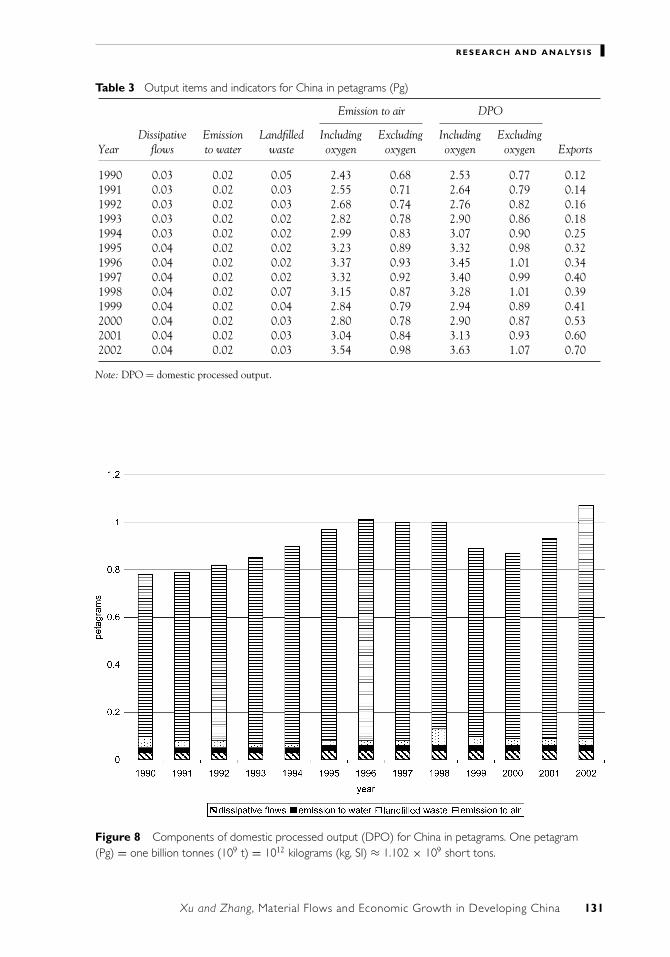
emission to air, emission to water, and landfilledwaste. Dissipative flows contain materials that aredispersed into the environment as a deliberate, orunavoidable (with current technology), conse-quence of product use. Output items and indica-tors for China are presented in table 3 and figure 8.
Oxygen drawn from the atmosphere duringcombustion processes is suggested by Eurostat(2001) to be a memorandum item for balanc-ing. It is not included in the aggregated domesticextraction accounts, but is included in the ag-gregated output indicator DPO. Therefore, bal-ancing items are needed for closing the materi-als balance and estimating NAS. In this study,DPO is calculated both including and excludingoxygen (see table 3). It can therefore be demon-strated that emission to air took a leading roleamongst the components of DPO (see figure 8),in which the amount of emission to air did notinclude oxygen. Furthermore, the DPO for Chinahas patterns of variation very similar to those ofTMR and DMI. For example, both are rising andthen slumping from 1998 to 2000, which shows
130 Journal of Industrial Ecology
R E S E A R C H A N D A N A LYS I S
Table 3 Output items and indicators for China in petagrams (Pg)
Emission to air DPO
Dissipative Emission Landfilled Including Excluding Including ExcludingYear flows to water waste oxygen oxygen oxygen oxygen Exports
1990 0.03 0.02 0.05 2.43 0.68 2.53 0.77 0.121991 0.03 0.02 0.03 2.55 0.71 2.64 0.79 0.141992 0.03 0.02 0.03 2.68 0.74 2.76 0.82 0.161993 0.03 0.02 0.02 2.82 0.78 2.90 0.86 0.181994 0.03 0.02 0.02 2.99 0.83 3.07 0.90 0.251995 0.04 0.02 0.02 3.23 0.89 3.32 0.98 0.321996 0.04 0.02 0.02 3.37 0.93 3.45 1.01 0.341997 0.04 0.02 0.02 3.32 0.92 3.40 0.99 0.401998 0.04 0.02 0.07 3.15 0.87 3.28 1.01 0.391999 0.04 0.02 0.04 2.84 0.79 2.94 0.89 0.412000 0.04 0.02 0.03 2.80 0.78 2.90 0.87 0.532001 0.04 0.02 0.03 3.04 0.84 3.13 0.93 0.602002 0.04 0.02 0.03 3.54 0.98 3.63 1.07 0.70
Note: DPO = domestic processed output.
Figure 8 Components of domestic processed output (DPO) for China in petagrams. One petagram(Pg) = one billion tonnes (109 t) = 1012 kilograms (kg, SI) ≈ 1.102 × 10⁹ short tons.
Xu and Zhang, Material Flows and Economic Growth in Developing China 131

R E S E A R C H A N D A N A LYS I S
Figure 9 Patterns of variation of domestic processed output (DPO) components for China in petagrams.
that DPO has an approximately linear relation-ship with material input.
In figure 9, the far left-hand y-axis indicatesdissipative flows, emission to water, and land-filled waste, whereas the far right-hand one indi-cates emission to air. It can be demonstrated thatemission to air, excluding oxygen, also has thesame variation pattern as material input indica-tors. It is solely due to the dominant proportionof emission to air that the DPO presents a varia-tion pattern with a rise before a slump around1998. Dissipative flows show a continuous in-crease from 1990 to 2002, which is mainly dom-inated by fertilizer used in agriculture. Emissionto water and landfilled waste both decreased withonly a small rise in each in 1995. Furthermore,landfilled waste also had a large rise around 1998.Although environmental problems in China to-day are much more serious than those in the past,it can be seen from the official statistical data thatremarkable achievements have been attainedin reducing emission to water and landfilledwaste.
Physical Trade and Material Balances
Concerning international trade and environ-mental issues, the Physical Trade Balance (PTB)is an important indicator that expresses physicaltrade surplus or the deficit of the socioeconomy.In this context, surplus refers to net import (a pos-itive number) of biophysical resources and deficitrefers to net exports (a negative number). PTBis defined as the difference between imports andexports, which is equal to the result of subtractingexports from imports.
Figure 10 presents the quantities of imports,exports, and PTB for China from 1990 to 2002.Chinese physical trade with other countries, in-dicated by both imports and exports, increasedfrom 1990 to 2002, with a slump in 1998. PTBfirst showed a decreasing deficit from 5 teragrams(Tg; one million tonnes) in 1990 to 1.81 Tg in1992,5 and then a decrease from a 45-Tg surplusin 1993 to a 54-Tg deficit in 1998, after whichPTB presented an increasing physical surplus. In2002 especially, the physical surplus for China
132 Journal of Industrial Ecology

R E S E A R C H A N D A N A LYS I S
Figure 10 Imports, exports, and physical trade balance (PTB) for China, from 1990 to 2002, in petagrams.
increased sharply to about three times that of2001. Similarly to most of the material input andoutput indicators, physical trade indicators alsoshow interruption and slumping around 1998.When compared with European countries, thePTB per capita of China is much less than thatof the EU-15. For example, in 2000, the PTBper capita of China was 0.01 tonnes per capita,whereas that of the EU-15 was 2.65 t/cap. The ex-tremely low levels of physical trade per capita forChina present an indication of very poor integra-tion into the global market and of an early stageof industrialization. On the other hand, it canalso be concluded that China’s economy becameincreasingly active in the international marketafter 1999, which is shown by rapid growth of thequantity of physical trade.
Increased energy products (disaggregated) areimportant commodities contributing to the phys-ical trade to and from China. In China there wasa sharp increase in the export of coal from 17 Tgin 1990 to 90 Tg in 2001, which then began todrop again to 84 Tg in 2002. During the sameperiod, the import of coal fluctuated around 2 Tgand then suddenly rose again to 11 Tg in 2002.
Although the trade balance of coal presented adeficit in this period, the sharp growth of importsstill shows a potential increase in the requirementfor coal after 2002. Turning to the trade in crudeoil and finished oil products, China’s economydisplayed high dependency on energy importsduring the referenced period. The trade balanceof crude oil changed from a deficit of 22 Tg in1990 to a surplus of 62 Tg in 2002, whereas thatof finished oil products changed from a deficit of3 Tg in 1990 to a surplus of 10 Tg in 2002. The in-creasing physical surplus of energy materials forChina presents a huge potential future require-ment for energy products after 2002, especiallyfor crude oil.
Material Consumption
Domestic material consumption (DMC) mea-sures the total amount of material directly usedin an economy. DMC equals DMI minus exports.Another important consumption indicator is netadditions to stock (NAS), which measures thephysical growth of the economy (Eurostat 2001).NAS indicates the quantity of new construction
Xu and Zhang, Material Flows and Economic Growth in Developing China 133
R E S E A R C H A N D A N A LYS I S
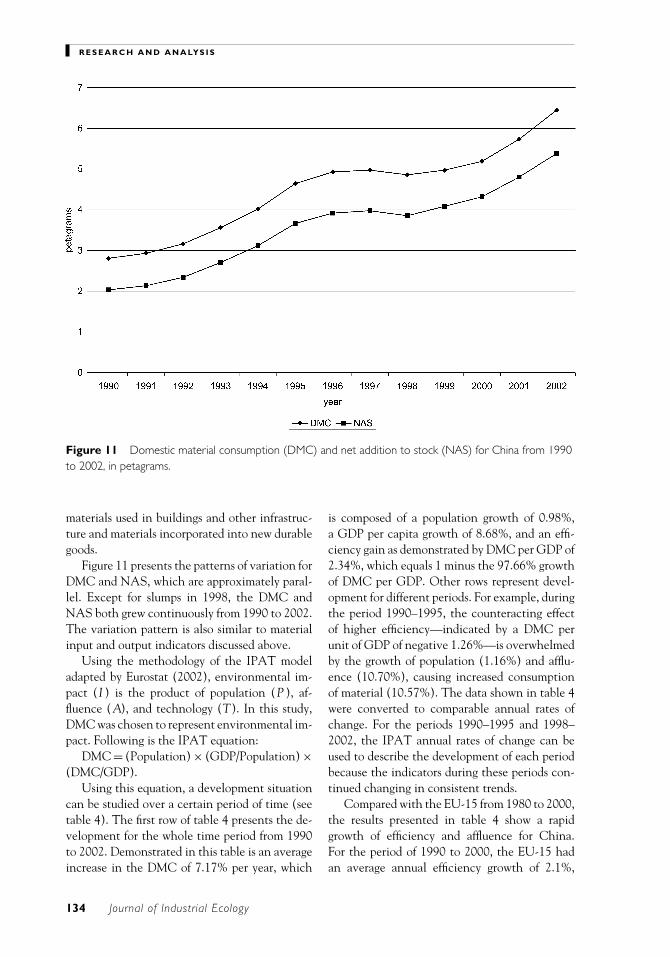
Figure 11 Domestic material consumption (DMC) and net addition to stock (NAS) for China from 1990to 2002, in petagrams.
materials used in buildings and other infrastruc-ture and materials incorporated into new durablegoods.
Figure 11 presents the patterns of variation forDMC and NAS, which are approximately paral-lel. Except for slumps in 1998, the DMC andNAS both grew continuously from 1990 to 2002.The variation pattern is also similar to materialinput and output indicators discussed above.
Using the methodology of the IPAT modeladapted by Eurostat (2002), environmental im-pact (I ) is the product of population (P ), af-fluence (A), and technology (T). In this study,DMC was chosen to represent environmental im-pact. Following is the IPAT equation:
DMC = (Population) × (GDP/Population) ×(DMC/GDP).
Using this equation, a development situationcan be studied over a certain period of time (seetable 4). The first row of table 4 presents the de-velopment for the whole time period from 1990to 2002. Demonstrated in this table is an averageincrease in the DMC of 7.17% per year, which
is composed of a population growth of 0.98%,a GDP per capita growth of 8.68%, and an effi-ciency gain as demonstrated by DMC per GDP of2.34%, which equals 1 minus the 97.66% growthof DMC per GDP. Other rows represent devel-opment for different periods. For example, duringthe period 1990–1995, the counteracting effectof higher efficiency—indicated by a DMC perunit of GDP of negative 1.26%—is overwhelmedby the growth of population (1.16%) and afflu-ence (10.70%), causing increased consumptionof material (10.57%). The data shown in table 4were converted to comparable annual rates ofchange. For the periods 1990–1995 and 1998–2002, the IPAT annual rates of change can beused to describe the development of each periodbecause the indicators during these periods con-tinued changing in consistent trends.
Compared with the EU-15 from 1980 to 2000,the results presented in table 4 show a rapidgrowth of efficiency and affluence for China.For the period of 1990 to 2000, the EU-15 hadan average annual efficiency growth of 2.1%,
134 Journal of Industrial Ecology

R E S E A R C H A N D A N A LYS I S
Table 4 DMC = P × A × T annual percentage change from 1990 to 2002
Period DMC Population GDP/Population DMC/GDP
1990–2002 107.17% 100.98% 108.68% 97.66%
1990–1995 110.57% 101.16% 110.70% 98.74%1995–1998 101.53% 100.99% 107.67% 93.37%1998–2002 107.33% 100.73% 106.95% 99.63%
Note: DMC = P × A × T, or 107.17% = 100.98% × 108.68% × 97.66%, taking the period 1990–2002 for example.Percentages are all rounded. DMC = domestic material consumption; P = population; A = affluence; T = technology.
compared with 2.34% for China from 1990 to2002. Due to the average annual growth of afflu-ence in China (8.68%) being much higher thanthat of the EU-15 (1.9%), the growth of envi-ronmental pressure was still much higher thanthat of the EU-15, which, during the same pe-riod, showed a decline in environmental pressure.The annual population growth of China is nearlyconstant at around 1%. Because of the huge base,though, China needs to accept the consequencesof population size, compared with an annual 0.3%growth of the EU-15 during the same period (Eu-rostat 2002).
Material Flow Balances
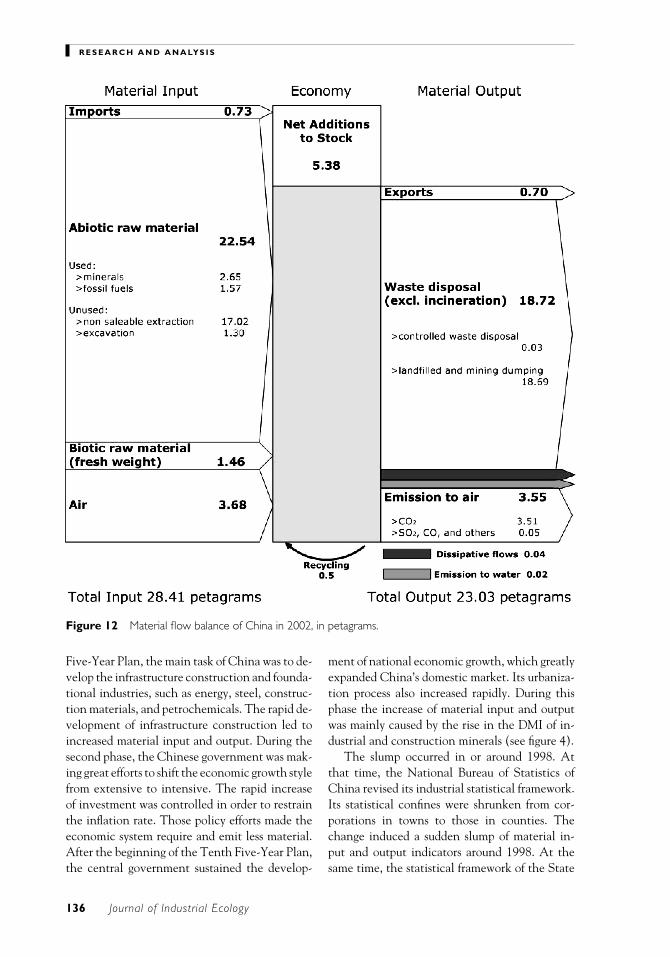
MFA provides an accounting framework forthe physical dimensions of the economy. Forexample, figure 12 presents a sample materialbalance for China in 2002. The input side doc-uments imported materials, raw materials ex-tracted from the domestic economy, unuseddomestic extraction, and the air required for fos-sil fuel combustion and for human and animalrespiration. Part of this material input stayed inthe economy, and is shown as net addition tostock, such as infrastructure and durable goods.Within the domestic economy, there is also ma-terial recycled, which is not included in the ma-terial flow balance. On the output side, the restof the materials are presented in the forms of ex-ported material, waste disposal, dissipative flows,and emission to water and air. Such a materialflow balance framework shows us the materialcomponents of an economy and gives us a com-prehensive understanding of the whole system.Although data are available enough, this frame-work shows more details about the material flowbalance of an economic system.
Trends of Material Indicators andPolicy Discussion
Figure 13 presents the trends of economic,demographic, and material indicators for Chinafrom 1990 to 2002. Both the economic indicatorGDP and the demographic indicator populationkept increasing from 1990 to 2002, and all ma-terial indicators showed continuous growth withslumps in or after 1998. Within these slump peri-ods, the nadirs of DMI, DMC, and NAS appearedin 1998, after which these three indicators beganto grow again. TMR began to decrease in 1998,and its nadir appeared in 1999, after which it roseagain. DPO decreased slightly earlier, in 1997,and its nadir appeared later, in 2000. During theperiod of the slump, DPO also increased slightlyin 1998. Although DMI started to increase againin 1999, the nadir of TMR still appeared in 1999because of the decrease of UDE during the sameyear. Similarly to TMR, the nadir of DPO in 2000was due to the decrease of emission to air in 2000.Furthermore, the slight increase of DPO in 1998was because of the sudden increase of landfilledwaste.
Based on previous discussion, the trends ofmaterial input and output for China from 1990to 2002 can be characterized as three-phasedwith one slump. The three phases are dividedby the years 1995 and 2000. Behind the threephases, there are different macro policies thatwere implemented by the government. The timeperiods of these three phases very nearly matchthe Eighth, Ninth, and Tenth Five-Year Plansfor National Economic and Social Developmentimplemented by the Chinese central govern-ment. These three Five-Year Plans began, respec-tively, in 1991, 1996, and 2001, lasting for fiveyears each. During the first period, the Eighth
Xu and Zhang, Material Flows and Economic Growth in Developing China 135
R E S E A R C H A N D A N A LYS I S
Figure 12 Material flow balance of China in 2002, in petagrams.
Five-Year Plan, the main task of China was to de-velop the infrastructure construction and founda-tional industries, such as energy, steel, construc-tion materials, and petrochemicals. The rapid de-velopment of infrastructure construction led toincreased material input and output. During thesecond phase, the Chinese government was mak-ing great efforts to shift the economic growth stylefrom extensive to intensive. The rapid increaseof investment was controlled in order to restrainthe inflation rate. Those policy efforts made theeconomic system require and emit less material.After the beginning of the Tenth Five-Year Plan,the central government sustained the develop-
ment of national economic growth, which greatlyexpanded China’s domestic market. Its urbaniza-tion process also increased rapidly. During thisphase the increase of material input and outputwas mainly caused by the rise in the DMI of in-dustrial and construction minerals (see figure 4).
The slump occurred in or around 1998. Atthat time, the National Bureau of Statistics ofChina revised its industrial statistical framework.Its statistical confines were shrunken from cor-porations in towns to those in counties. Thechange induced a sudden slump of material in-put and output indicators around 1998. At thesame time, the statistical framework of the State
136 Journal of Industrial Ecology

R E S E A R C H A N D A N A LYS I S
Figure 13 Trends of several macro indicators for China from 1990 to 2002, with 1990 = 100. GDP isbased on 2002 constant prices. GDP = gross domestic product; DMI = direct material input; TMR = totalmaterial requirement; DPO = domestic processed output; DMC = domestic material consumption; NAS =net addition to stock.
Environmental Protection Administration ofChina was also revised. Its statistical confine ofwaste was expanded, which brought on the obvi-ous increase in 1998 (see figure 9).
From 1990 to now, China has experiencedgreat changes, which create possibly the mostdynamic economy in the world. The physi-cal dimensions of China’s economy, which aremeasured by the EW-MFA method in this study,are sensitive to the macropolicy implemented bythe central government. Although the statisti-cal framework changed after 1998, the trends ofEW-MFA indicators illustrate that materials re-quired and wastes generated by China’s economyincreased parallel to economic growth. China’srapid economic growth was based on a tremen-dous requirement for natural resources.
Further Research
In the past decade, EW-MFA has been ap-plied in most industrialized countries to describe
the physical dimensions of the economy, whichare regarded as one main research area of indus-trial ecology. Based on our experience, EW-MFAcan show a macroscopic quantitative picture todescribe the material flows occurring because ofeconomic activities. Combined with other eco-nomic and social indicators, EW-MFA can alsoindicate the material efficiency of an economicsystem. The characteristics of aggregation of dif-ferent qualities of material flows provide the pos-sibility of a comparison of various physical flows.On the other hand, the advantage of aggregationis also its weakness, which has been criticized for along time. Indicators that are too aggregated hidethe different environmental impacts of differentmaterial flows; therefore, it is very difficult for thespecific policies for solving environmental prob-lems to be provided by the EW-MFA approachalone.
In the past few years, EW-MFA has devel-oped very well as a tool in the field of indus-trial ecology. What lies in its future as a scientific
Xu and Zhang, Material Flows and Economic Growth in Developing China 137
R E S E A R C H A N D A N A LYS I S
tool? Two destinations are generally possible, onebeing to continue to develop its potential, and theother, to combine it with other tools. In our opin-ion, the future destiny of EW-MFA is the latter.EW-MFA has its own field of application, whichdescribes the physical dimensions of an economy.After understanding the physical dimension, thenext step is to choose other tools or develop newtools to make the economic system run more effi-ciently. To sum up, EW-MFA can be used as oneof the pillars but it cannot be used to support awide research field.
Turning to China’s situation, physical data re-lated to the economy, under the current nationalstatistical framework, are not perfect. Therefore,in future research, more effort should be devotedto the investigation of the relationship betweeninternal characteristics of the economy and theapparent material flow scene. Although improve-ment of the national statistical framework inChina needs to be promoted, we do not suggestdiving into the work of estimation and inves-tigation to make the data more realistic, wherea certain level of precision is already satisfied.In reflection of the internal characteristics of theeconomy, we suggest, first, a study of the structureof the economy and the level of technology. Thestructure of the economy could be representedby proportions of different economic sectors. Formore comprehensive consideration, the physicalinput-output tables can also be useful, but are dif-ficult to obtain. The level of technology could berepresented by material consumption or emissionper unit of economic growth or product manu-factured. After the right indicators are found torepresent the internal characteristics of the econ-omy, a more detailed relationship between theeconomy and the environment can be presentedto aid in decision making.
Conclusions
Since the strategy of reform and opening upwas implemented in 1978, China has made greatefforts to change its development strategy and toachieve modernization. Although the macroeco-nomic data show remarkable success, especiallyin the1990s, indicators measuring environmentalpressures reveal a different picture. The amountof material consumption kept increasing almost
continuously except for a slump around 1998,which was caused by a change in the statisticalframework. Material consumption efficiency wasinfluenced by the different macropolicy strategiesof the Five-Year Plans.
In the past 15 years, the high rate of eco-nomic growth of China has basically rested uponthe growth of a second sector and inhabitant con-sumption requirements. This growth has requireda huge amount of natural resources, most of whichwere extracted from the domestic environment.Huge proportions of materials extracted led tohuge waste and emissions, polluting the envi-ronment. In conclusion, there were huge envi-ronmental pressures and serious environmentalpollution behind the compelling economic suc-cess of China in the 1990s. On the other hand,those environmental problems were unavoidableand may be ongoing for a certain period in thefuture for China, which has been suffering fromthe transition to industrialization.
From a long-term perspective on the physicaldimension of China’s economy discussed in thisarticle, we know the patterns of variation, trends,absolute amounts, relative proportions, compo-nents, and efficiencies of physical input and out-put of China’s economy. We have also deducedthat the physical dimension indicators of theeconomy are more sensitive to different macro-policies than are the monetary indicators. Basedon those results, relationships between physicalindicators and characteristics of the economyneed to be studied to support decision making.
As previously mentioned, EW-MFA can beregarded as a valuable method of painting thebackground picture to show the physical dimen-sions of the economy. In particular, EW-MFAcan also provide fresh perspectives for developingChina. But it is also illustrated that the EW-MFAmethodology needs to be further developed in or-der to help in decision making. More specifically,emphasis should be given to the study of the re-lationship between physical dimensions and theinner characteristics of the economy.
Acknowledgments
The research project “Regional MaterialMetabolism Analysis Model and Methodology”has been funded by the Ministry of Education of
138 Journal of Industrial Ecology

R E S E A R C H A N D A N A LYS I S
the People’s Republic of China, which is muchappreciated. Special thanks go to the two anony-mous referees and the MFA/SFA editor of thisjournal for their helpful comments and sugges-tions.
Notes
1. China’s Agenda 21—White Paper on China’s Pop-ulation, Environment, and Development in the 21stCentury was adopted at the 16th Executive Meet-ing of the State Council of the P.R. China on 25March 1994.
2. When combined with MFA indicators, GDP andother monetary indicators need to be transformedinto real GDP based on a constant price consideringinflation and deflation.
3. One petagram (Pg) = one billion tonnes (109 t) =1012 kilograms (kg, SI) ≈ 1.102 × 10⁹ short tons.
4. One tonne (t) = 103 kilograms (kg, SI) ≈ 1.102short tons.
5. One teragram (Tg) = one million tonnes (106 t) =109 kilograms (kg, SI) ≈ 1.102 × 10⁶ short tons.
References
Adriaanse, A., S. Bringezu, A. Hamond, Y. Moriguchi,E. Rodenburg, D. Rogich, and H. Schutz. 1997.Resource flows: The material base of industrialeconomies. Washington, DC: World Resource In-stitute.
Amann, C., W. Bruckner, M. Fischer-Kowalski, andC. Grunbuhel. 2002. Material flow accounting inAmazonia: A tool for sustainable development.Working Paper 63. IFF Social Ecology, Vienna,Austria.
Ayres, R. U. 1994. Industrial metabolism: Theory andpolicy. In Industrial metabolism: Restructuring forsustainable development, edited by R. Ayres andU. Simonis. Tokyo, Japan: United Nations Uni-versity Press.
Chen, X. and L. Qiao. 2001. A preliminary material in-put analysis of China. Population and Environment23(1): 117–126.
Chen, Y. 2005. Material flow accounting and analy-sis for construction industry in China. Master’sthesis. Tsinghua University, Beijing, China.
Editing Committee of China Energy Statistical Year-book, eds. 1991–2003. China energy statistical year-book 1990–2002. Beijing: China Statistics Press.
Editing Committee of China Environment Year-book, eds. 1991–2003. China environment yearbook1990–2002. Beijing: China Statistics Press.
Editing Committee of China Nonferrous Metal Indus-try Yearbook, eds. 1991–2003. China nonferrousmetal industry yearbook 1990–2002. Beijing: ChinaStatistics Press.
Editing Committee of China Steel Yearbook, eds.1991–2003. China steel yearbook 1990–2002. Bei-jing: China Statistics Press.
Editing Committee of Chinese Animal HusbandryYearbook, eds. 1991–2003. Chinese animal hus-bandry yearbook 1990–2002. Beijing: China Agri-culture Press.
Editing Committee of Yearbook of China’s ForeignEconomic Relations and Trade, eds. 1991–2003.Yearbook of China’s foreign economic relations andtrade 1990–2002. Beijing: China Foreign Eco-nomic Relations and Trade Publishing House.
Erkman, S. 1997. Industrial ecology: A historical view.Journal of Cleaner Production 5: 1–10.
Eurostat. 2001. Economy-wide material flow accounts andderived indicators: A methodological guide. Luxem-bourg: Statistical Office of the European Union.
Eurostat. 2002. Material use in the European Union1980–2000: Indicators and analysis. Luxembourg:Statistical Office of the European Union.
FAO. 2005. FAO Statistical Databases. <http://faostat.fao.org>. Accessed June 2005.
Giljum, S. 2004. Trade, material flows and economicdevelopment in the South: The example of Chile.Journal of Industrial Ecology 8(1–2): 241–261.
Hammer, M. and K. Hubacek. 2002. Material flows andeconomic development: Material flow analysis of theHungarian economy. Interim Report 02-057. Lux-emburg: International Institute for Applied Sys-tems Analysis (IIASA).
Liu, J., Q. Wang, X. Gu, Y. Ding, and J. Liu. 2005.Direct material input and dematerialization anal-ysis of China’s economy. Resources Science 27(1):46–51.
Matthews, E., S. Bringezu, M. Fischer-Kowalski,W. Huttller, R. Kleijn, Y. Moriguchi, C. Ottke,E. Rodenburg, D. Rogich, H. Schandl, H. Schutz,E. van der Voet, and H. Weisz. 2000. The weight ofnations: Material outflows from industrial economies.Washington, D.C.: World Resources Institute.
Mo, H. 2003. Life cycle assessment of building mate-rials based on the data quality analysis. Masterof Science thesis. Tsinghua University, Beijing,China.
Mundl, A., H. Schutz, W. Stodulski, J. Sleszynski, andM. Welfens. 1999. Sustainable development by de-materialization in production and consumption: Strat-egy for the new environmental policy in Poland. Re-port 3. Warsaw, Poland: Institute for SustainableDevelopment.
Xu and Zhang, Material Flows and Economic Growth in Developing China 139
R E S E A R C H A N D A N A LYS I S
National Bureau of Statistics of China. 1991–2003.China statistical yearbook 1990–2002. Beijing:China Statistics Press.
Scasny, M., J. Kovanda, and T. Hak. 2003. Materialflow accounts, balances and derived indicators forthe Czech Republic during the 1990s: Results andrecommendations for methodological improve-ments. Ecological Economics 45(1): 41–57.
Sheerin, C. 2002. UK material flow accounting. Eco-nomic Trends, No. 583. London, UK: Office forNational Statistics.
Wuppertal Institute for Climate, Environment and En-ergy. 2003. MIPS online. <www.wupperinst.org/Projekte/mipsonline/download/MIT v2.pdf>.Accessed December 2003.
UNSD (United Nations Statistics Division). 2005.Millennium Indicators Database. <http://millenniumindicators.un.org>. Accessed June2005.
Xu, M. and T. Zhang. 2004. Material flow analysison fossil fuel in China’s economy system. Jour-
nal of Tsinghua University (Science and Technology)44(9): 1166–1170.
Xu, M. and T. Zhang. 2005. Material input analysisof China economic system. China EnvironmentalScience 25(3): 324–328.
Xu, Y., T. Zhang, L. Shi, and M. Xu. 2005. Mate-rial flow analysis in China. Paper presented atthe 3rd International Conference of the Interna-tional Society for Industrial Ecology, 12–15 June,Stockholm, Sweden.
About the Authors
Ming Xu is a former master’s degree student at theDepartment of Environmental Science and Engineer-ing (DESE) at Tsinghua University, Beijing, People’sRepublic of China, and is currently a Ph.D. student inthe Department of Civil and Environmental Engineer-ing at Arizona State University, Tempe, AZ, USA.Tianzhu Zhang is a professor of environmental scienceand engineering at DESE.
140 Journal of Industrial Ecology