Research Activities on Earthquake-Proofing of … Major earthquakes Major developments 2007 Noto...
44
1 Research Activities on Earthquake-Proofing of Drinking Water Facilities by the Japan Water Research Center W.Adachi (Japan Water Research Center) S.Uchikoshi (Japan Water Research Center ) Y.Takahashi (Japan Water Research Center) M.Fujiwara (Japan Water Research Center) M.Miyajima (Kanazawa University )
Transcript of Research Activities on Earthquake-Proofing of … Major earthquakes Major developments 2007 Noto...
1
Research Activities
on Earthquake-Proofing
of Drinking Water Facilities
by the Japan Water Research Center
W.Adachi (Japan Water Research Center) S.Uchikoshi (Japan Water Research Center )
Y.Takahashi (Japan Water Research Center)
M.Fujiwara (Japan Water Research Center)
M.Miyajima (Kanazawa University )
2
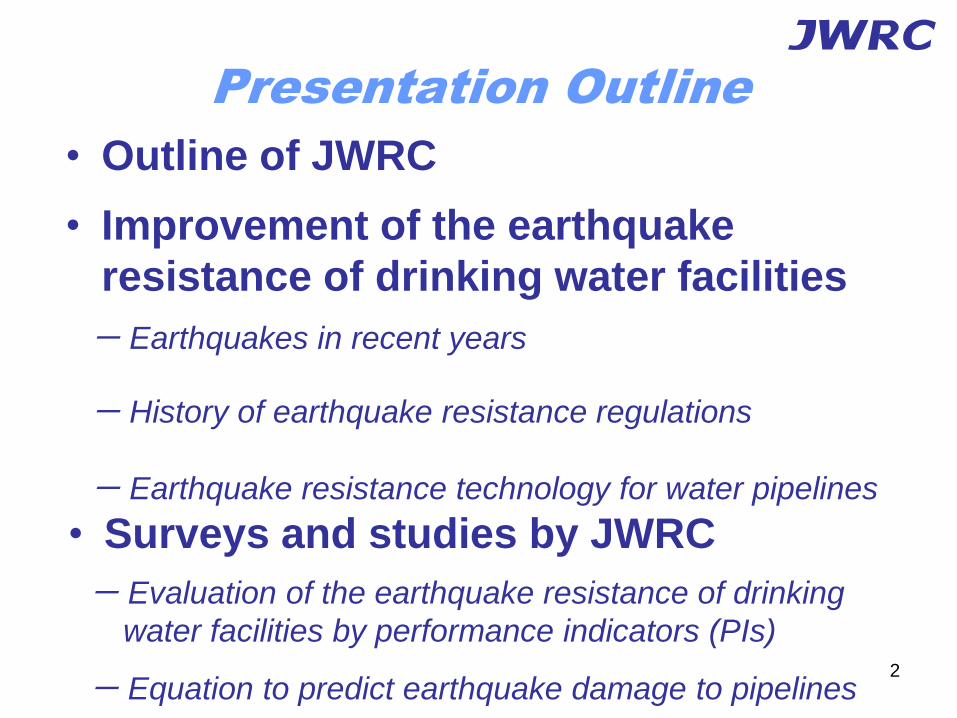
Presentation Outline
• Improvement of the earthquake
resistance of drinking water facilities
- Earthquakes in recent years
- History of earthquake resistance regulations
- Earthquake resistance technology for water pipelines
• Surveys and studies by JWRC
- Evaluation of the earthquake resistance of drinking
water facilities by performance indicators (PIs)
- Equation to predict earthquake damage to pipelines
• Outline of JWRC

Outline of JWRC
3

4
Research &
Development
Technical
Supports
International
Activities
Japan Water Research Center
JWRC Ministry of
Health Labour
and Welfare
Water utilities
Universities &
research
institutes
Private
companies
Outcomes of Reserch and Development
Applications Public Relations Activities

Improvement of the earthquake resistance of drinking water
facilities
5
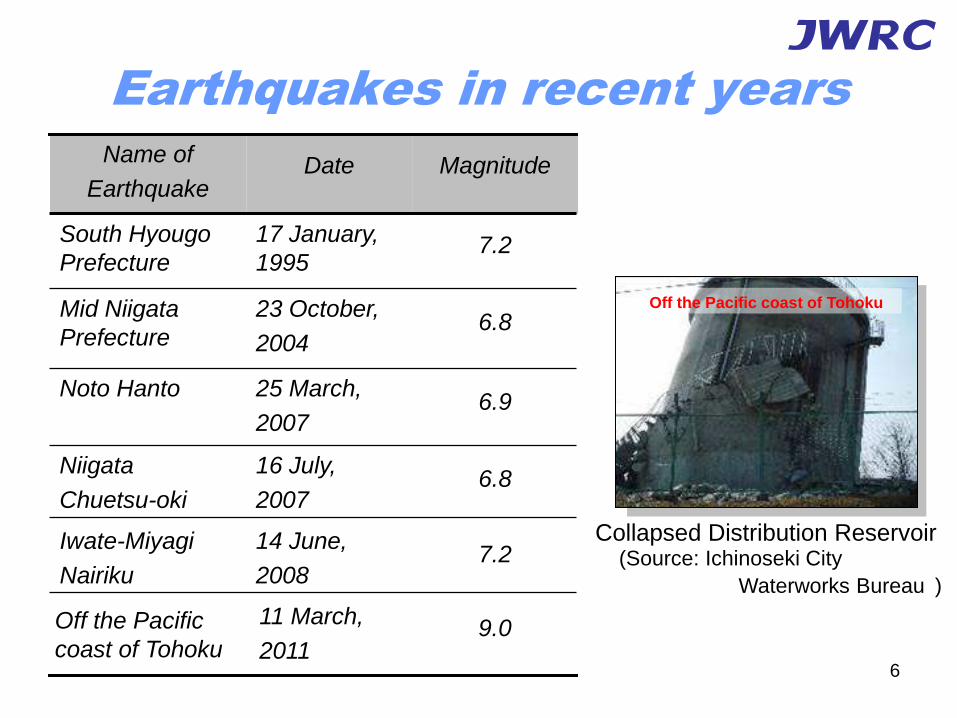
Collapsed Distribution Reservoir
Earthquakes in recent years
6.9 25 March,
2007
Noto Hanto
6.8 23 October,
2004
Mid Niigata
Prefecture
7.2 17 January,
1995
South Hyougo
Prefecture
Magnitude Date Name of
Earthquake
6.8 16 July,
2007
Niigata
Chuetsu-oki
7.2 14 June,
2008
Iwate-Miyagi
Nairiku
Off the Pacific
coast of Tohoku
11 March,
2011 9.0
Off the Pacific coast of Tohoku
(Source: Ichinoseki City
Waterworks Bureau )
6

Year Major earthquakes Major developments
1995 South Hyogo Prefecture
Earthquake (M7.2)
1997 ・The Guidelines for Earthquake-Resistant
Construction Methods for Waterworks
Facilities were revised ※1 ・Draft Guidelines for Planning to Upgrade
the Earthquake Resistance of Drinking-
Water Facilities were developed
2004 Mid Niigata Prefecture
Earthquake (M6.8)
2006 ・The Review Commission on the
Improvement of the Earthquake Resistance
of Water Pipelines produced a report
History of earthquake
resistance regulations
Table1 Revisions of seismic guidelines(1/2)
7
Level 2 ground vibration concept

Year Major earthquakes Major developments
2007 Noto Hanto Earthquake
(M6.9)
Niigataken Chuetsu-oki
Earthquake (M6.8)
2008 Iwate-Miyagi Nairiku
Earthquake (M7.2)
・The Guidelines for Planning to Upgrade
the Earthquake Resistance of Drinking-
Water Facilities were revised
2009 ・The Guidelines for Earthquake-Resistant
Construction Methods for Waterworks
Facilities were revised
2011 Off the Pacific coast of
Tohoku Earthquake (M9.0)
・Damage is being assessed and
earthquake resistance enhancements are
being developed
Table1 Revisions of seismic guidelines(2/2)
8

9
Level 1 ground vibration
Level 2 ground vibration
・・・Level 1 is the maximum level of earthquake which
may occur during the service period of the facility.
・・・ Level 2 is the maximum level of earthquake which
may occur at the site of the facility in the future.
Facility importance Rank A
・・・ Rank A are essential and non-replaceable facilities.
Facility importance Rank B
・・・ Rank B are other facilities.

Degree of
importance
Earthquake level
Level 1 Level 2
Rank A Operational capacity is
not affected.
Seismic damage is minor
and does not severely
affect operational capacity.
Restoration requires
minimum effort.
Rank B Seismic damage is minor
and does not severely
affect operational capacity.
Restoration requires
minimum effort.
Seismic damage is minor
and does not severely
affect operational capacity,
but restoration is necessary.
Table2 Level of required earthquake resistance
10

Earthquake resistance
technology for water pipelines
The main types of buried water pipes are
・Ductile cast iron pipes (DIP),
・Grey cast iron pipes (CIP),
・Steel pipes (SP),
・Polyethylene pipes (PE),
・Polyvinyl chloride pipes (PVC),
・Asbestos cement pipes (ACP).
CIPSP
PE
ACP Other
PVC
DIP
11
60%
As of 2008

Joint Characteristics
Type A A rectangular rubber gasket is placed around the socket and the joint
bolts are tightened with a gland.
Type T A rubber gasket is placed around the socket and the spigot is inserted
into the socket.
Type K A modified version of Type A. This has only a rubber gasket which a
rectangular one and a round one are combined.
Type S,
Type S-II
A rubber gasket and a lock ring are placed around the socket and the
spigot is inserted into the socket. The joint has good earthquake
resistance with high elasticity and flexibility and a disengagement
prevention mechanism.
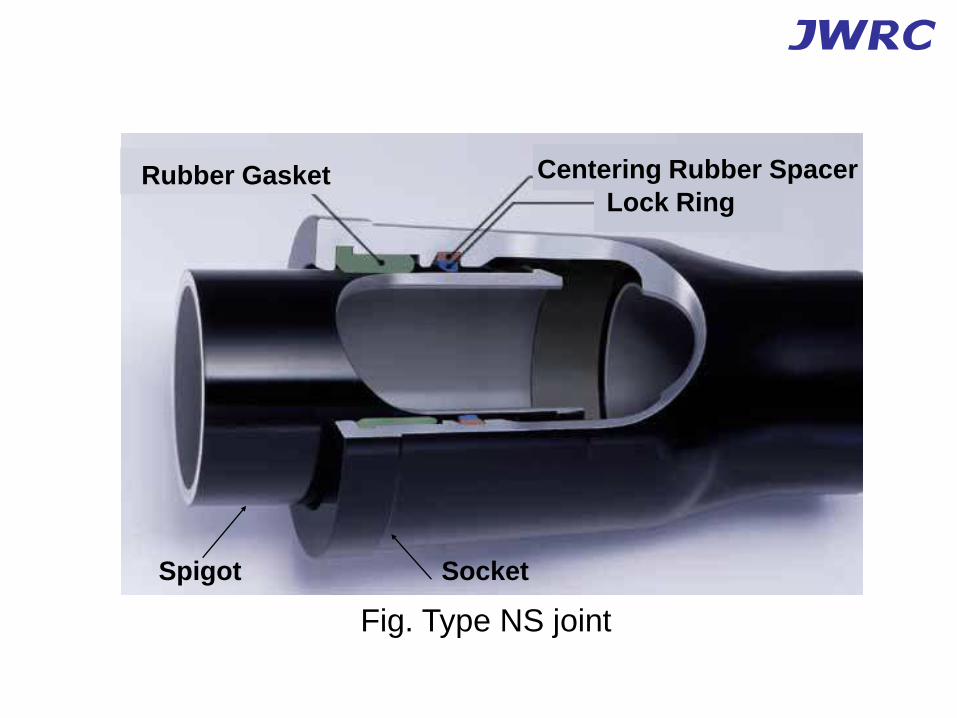
Type NS Same earthquake resistance as Type S but is easier to use than Type S.
Table3 Characteristics of joint types for DIP
12
0.000
1.5081.430
1.782
0.4730.488
0.0
0.2
0.4
0.6
0.8
1.0
1.2
1.4
1.6
1.8
2.0
DIP(S,SⅡ)
DIP(A,K,T)
SP CIP PVC ACP
Dam
age R
ates(
num
ber/
km)
No Damage
Fig. Pipe damage in the 1995 South Hyogo Prefecture Earthquake
Rubber Gasket
Lock Ring
Centering Rubber Spacer Rubber Gasket
Lock Ring
Centering Rubber Spacer
Socket Spigot
Fig. Type NS joint

Surveys and studies by JWRC
14

Evaluation of the earthquake resistance
of drinking water facilities by
performance indicators (PIs)
What is PIs?
- JWWA published “Guidelines for the Management
and Assessment of Drinking Water Supply Service”
in January 2005.
- The Guideline defines 137 PIs (Performance
Indicators), including indicators for earthquakes.
JWRC has analyzed current situation
of water utilities in Japan using PIs. 15

Ratio of earthquake-resistant water treatment facilities
39
2219 17 19
22
1317 18
10 96 8 8 7 7 5 6
3
39
0
11
0
20
40
60
80
100
0
0-5
5-10
10-15
15-20
20-25
25-30
30-35
35-40
40-45
45-50
50-55
55-60
60-65
65-70
70-75
75-80
80-85
85-90
90-95
95-<100
100
100<
2207 Ratio of earthquake-resistant treatment facility (%)
No
. o
f U
tilit
ies
0%
25%
50%
75%
100%
1182
12.3612.97
15.89 16.32
0
5
10
15
20
FY2005 FY2006 FY2007 FY2008
Rat
io o
f ea
rthq
uake
-re
sist
ant
trea
tment
fac
ilities
(%)
16

Ratio of earthquake-resistant water pipelines
201 202
130
9268
45 41 30 24 11 14 11 14 9 4 8 4 1 3 5 3 4 1 3 0 13
0
100
200
300
400
500
0
0-2
2-4
4-6
6-8
8-10
10-12
12-14
14-16
16-18
18-20
20-22
22-24
24-26
26-28
28-30
30-32
32-34
34-36
36-38
38-40
40-42
42-44
44-46
46-48
48-50
50<
2210 Ratio of earthquake-resistant pipeline (%)
No
. o
f U
tilit
ies
0%
25%
50%
75%
100%
573
17
15.18
12.0911.9310.80
0
5
10
15
20
FY2005 FY2006 FY2007 FY2008
Rat
io o
f ear
thquak
e-re
sist
ant
trunk
pipe
lines
(%)

Equation to predict earthquake
damage to pipelines
- JWRC proposed an equation to predict
earthquake damage to water pipelines based on data
from the South Hyogo Prefecture Earthquake in
March 2000.
- Later, with additional data from more recent
earthquakes, it was concluded that the extent of
damage is strongly linked with the kinds of pipe
materials, joint types, and topography.
JWRC has proposed a new equation to predict
earthquake damage .
Rm(v) = C1× C2 ×・・・ Cn × R(v) Rm(v): Predicted damage rate [locations/km]
R(v) : Reference damage rate [locations/km]
Cn : Correction factors
18

Attributes of damaged pipelines
Kobe, Ashiya, and Nishinomiya
ー (1995 South Hyogo Prefecture Earthquake; n = 2170)
Nagaoka and Ojiya ー (2004 Mid Niigata Prefecture Earthquake; n = 277)
Kashiwazaki and Kariwa
ー (2007 Niigataken Chuetsu-oki Earthquake; n = 491 )
developed a database in a geographical
information system (GIS)
●damage locations
●pipe attributes (pipe type, joint type, pipe diameter)
●the maximum velocity of ground vibration
●microtopography types (J-SHIS) 19

Reference damage rate equation
The reference damage rate was calculated from
the approximate curve obtained by the least-
squares regression equation relating to the
damage rate and the maximum ground surface
velocity.
R(v) = 9.92 × 10⁻³ × (v – 15)1.14
where R(v) = reference damage rate (locations/km)
v = maximum surface velocity of ground vibration (cm/s)
(15 ≤ v < 120). 20

Determining the correction factors in the damage
prediction equation pipelines
The values of the correction factors were
determined using cross-tabulation and
multivariate analysis based on mathematical
quantification theory class I.
Cross-tabulation
Multivariate analysis
Correction factors
Result: The damage rate by pipe type, joint type, pipe diameter
and microtopography type
The relationship of pipe type, joint type, pipe diameter
and microtopography class with the damage rate

Rm(v) = Cp × Cd × Cg × R(v) Rm(v): Predicted damage rate [locations/km]
R(v): Reference damage rate [locations/km]
= 9.92 × 10⁻³ × (v – 15)1.14
v: Maximum surface velocity of ground vibration (cm/s)
(15 ≤ v < 120)
Pipe type, joint Cp Diameter Cd
DIP (A) 1.0 ø50–80 2.0
DIP (K) 0.5 ø100–150 1.0
DIP (T) 0.8 ø200–250 0.4
DIP (disengagement prevention) 0 ø300–450 0.2
CIP 2.5 ø500–900 0.1
PVC (TS) 2.5
PVC (RR) 0.8
SP (welding) 0.5/0
SP (non-welding) 2.5
ACP 7.5
PE (electrofusion) N/A※
22

Microtopography with pipelines installed Cg
If there is no information available on liquefaction or
if there is no possibility of liquefaction
Mountain, mountain foot, hill, volcanic area, volcanic mountain foot,
volcanic hill 0.4
Gravel upland, loam upland 0.8
Valley floor, alluvial fan, backswamp, delta, coastal lowland 1.0
Natural levee, former river channel, sandbar, gravel bar, dune 2.5
Reclaimed land, drained land, lakes and marshes 5.0
If there is information available on liquefaction and if there is the possibility
of liquefaction
All topography types 6.0 23

Evaluation of the damage prediction equation
Predicted number of
damage locations per cell
0
0-4.0
4.0-8.0
8.0-12.0
12.0-16.0
16.0-20.0
Actual damage
location
Fig. Evaluation results for Takarazuka. Areas with 0 damage locations
have no pipelines or are not covered in the evaluation 24

Conclusions
・To evaluation at the national level, it is critical that
drinking water utilities calculate PIs and objectively rank
themselves against others in the country.
・Water utilities must supply safe water every day, and
conduct preventive maintenance to minimize hazards and
to prevent accidents and failures. To improve the seismic
resistance of water facilities is essential in Japan. Our
equation to predict earthquake damage to water pipelines
will contribute to this goal.
・We will next update the equation to reflect the damage
from the 2011 off the Pacific coast of Tohoku Earthquake.
25

Damage to Drinking Water System
by Off the Pacific coast of Tohoku
earthquake

27
Date and Time: 11 March 2011 14:46 JST (05:46 UTC)
Magnitude: 9.0 (interim value; the largest earthquake recorded in Japan)
Hypocenter: N38.1, E142.9 (130km ESE off Oshika Peninsula) Depth 24km
(interim value)
Mechanism: Reverse fault type with WNW-ESE compressional axis (by CMT
analysis) Earthquake Early
Warning: Issued 8.6 seconds after the detection of the first P-wave at the
nearest seismic station
JMA Seismic Intensity:
7 (Max) Kurihara City of Miyagi Prefecture
6+ 28 cities and towns (including Wakuya Town, Tome City, Osaki City, Natori City) in Miyagi, Fukushima, Ibaraki, and Tochigi Prefectures
6- or weaker Observed nationwide from Hokkaido to Kyushu
(Source)http://www.jma.go.jp/jma/en/2011_Earthquake.html
Summary of Off the Pacific coast of Tohoku

28 (Source)http://www.jishin.go.jp/main/oshirase/201103111446sanriku-oki.gif
←Hypocenter
JMA Seismic Intensity of Off the Pacific coast of Tohoku
←Hypocenter
Upper
Lower
Upper
Lower
(Note) JMA : Japan Meteorological Agency
JMA Seismic Intensity

29
Major Pattern of Damage to Drinking Water
Systems by Off the Pacific coast of Tohoku
☑Earthquake damage only (Inland area)
☑ Damage due to both earthquake and tsunami
(Northeastern coast area)
☑ Damage due to liquefaction (Reclaimed land)
☑ Adverse effect by the Fukushima No 1 nuclear
power plant accident

30
Water Outage by Off the Pacific coast of Tohoku
and Restoration of Water Supply
(Source)http://www.mhlw.go.jp/english/topics/2011eq/dl/damage_situation_110511.pdf
The number of households with interrupted water supply
Recovery rate

31
Typical Cases of Damage to
Drinking Water Systems

32
Damage due to earthquake to PC distribution reservoir in
Ichinoseki city

33
Damage due to earthquake to
φ2400 pipeline in Miyagi prefecture
34
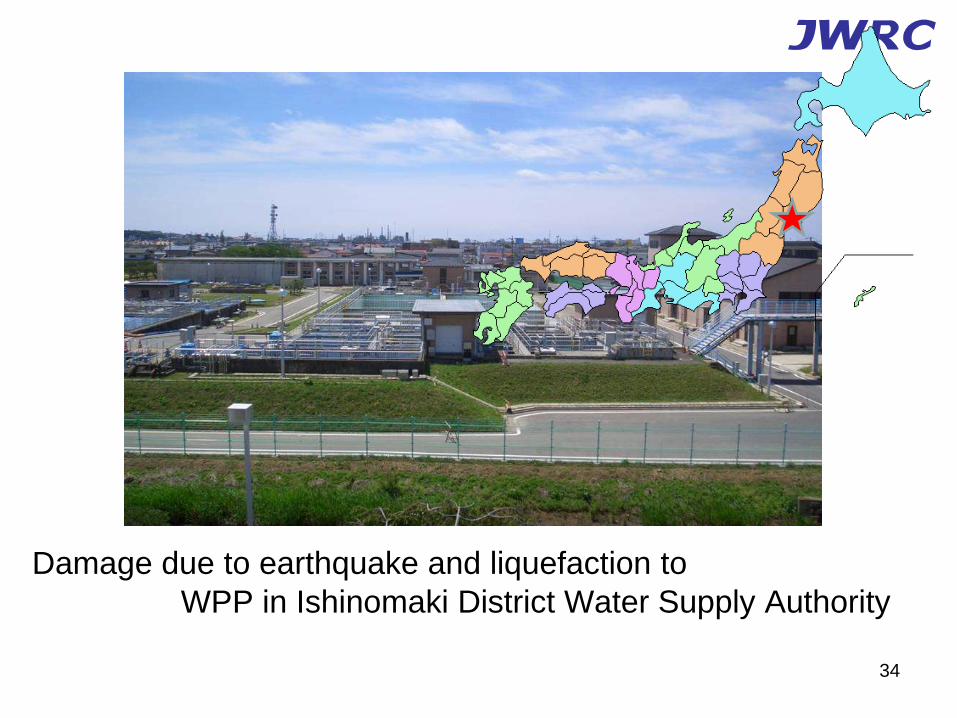
Damage due to earthquake and liquefaction to
WPP in Ishinomaki District Water Supply Authority
35
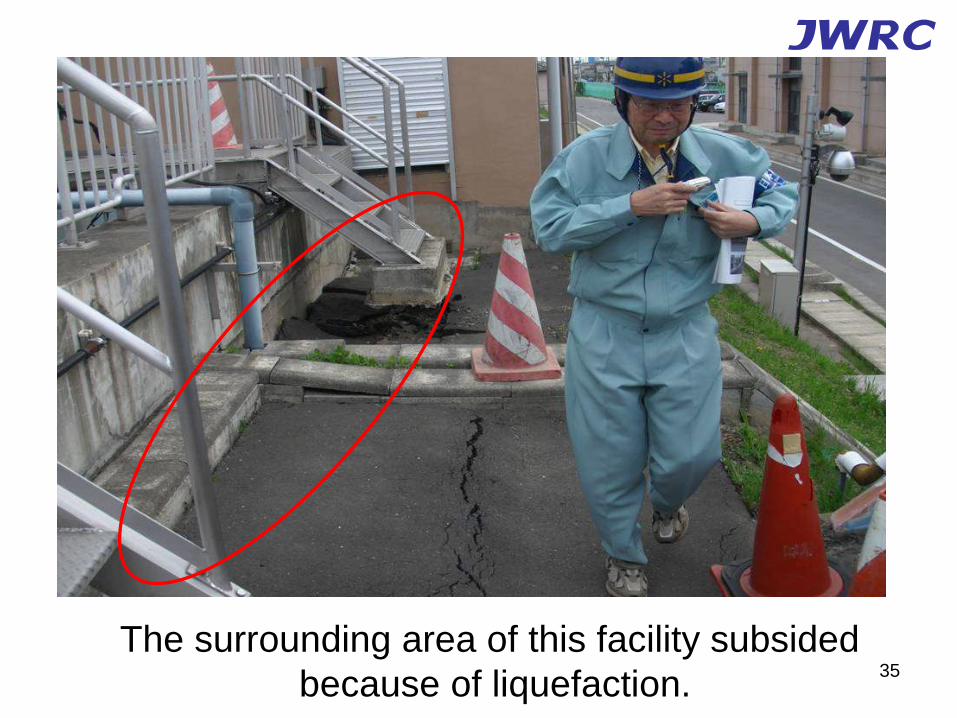
The surrounding area of this facility subsided
because of liquefaction.

36
Part of the concrete wall cracked due to the quake.

37
A sedimentation basin was disabled because of crack
on the bottom.

38
The Joint part of the stainless pipe was deformed.

39
The floor of pumping station was damaged.

40
Damage due to Tsunami to Takekoma Treatment Plant of Rikuzentakada City
Note : The water source of Takekoma TP is shallow wells which were possibly
salinized.
41
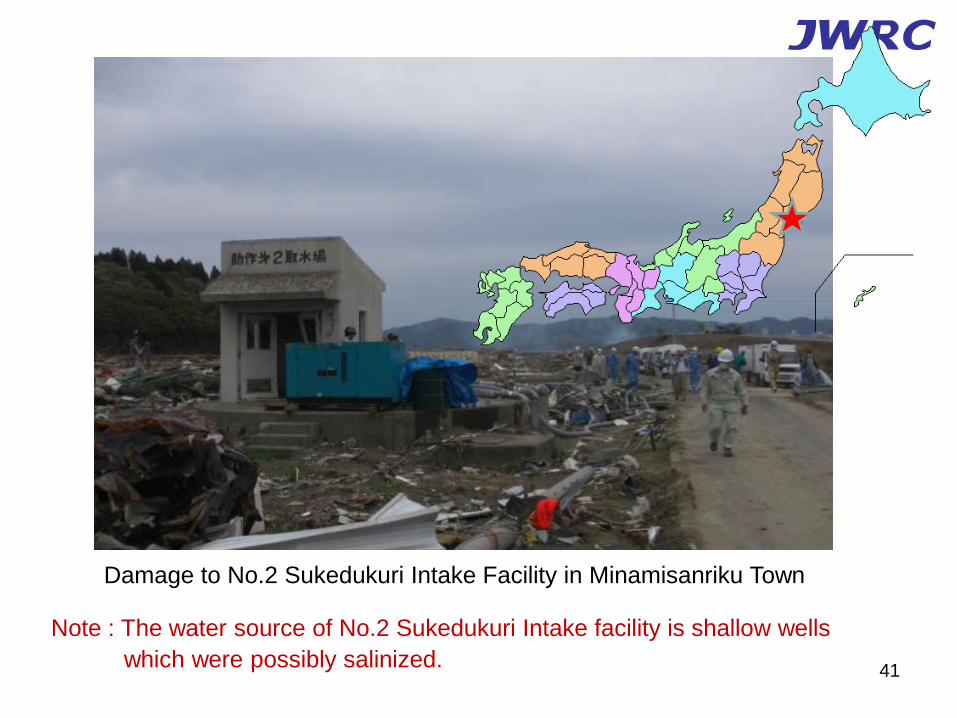
Damage to No.2 Sukedukuri Intake Facility in Minamisanriku Town
Note : The water source of No.2 Sukedukuri Intake facility is shallow wells
which were possibly salinized.
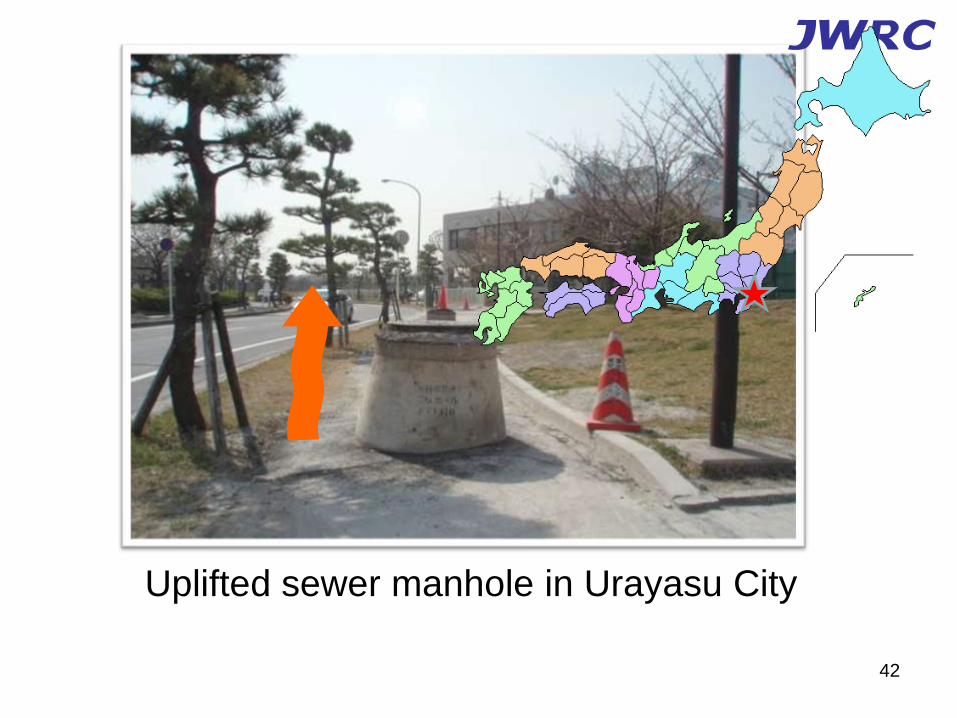
42
Uplifted sewer manhole in Urayasu City

43
Initiatives by JWRC toward full-recovery of
the affected areas
Support team for water purification facilities
・ Promote the installations of more portable
purification devices by private companies
Water quality investigative team
・ Analyze water quality of shallow wells
⇒ to check availability as water source

Thank you for your attention
Please visit our website http://www.jwrc-net.or.jp/index.html