Research Report · 2013-07-11 · Research Report. 2006 STUDENT CENSUS: ... Every reasonable...
52
Research Report 2006 STUDENT CENSUS: CORRELATIONS OF SCHOOL EXPERIENCE WITH STUDENT DEMOGRAPHICS AND ACHIEVEMENT Samuel M. Zheng Research Co-ordinator 09/10– 09 December 2009 Issued by the Organizational Development Department, Research and Information Services
-
Upload
duongquynh -
Category
Documents
-
view
213 -
download
0
Transcript of Research Report · 2013-07-11 · Research Report. 2006 STUDENT CENSUS: ... Every reasonable...

Research Report
2006 STUDENT CENSUS: CORRELATIONS OF SCHOOL EXPERIENCE WITH STUDENT DEMOGRAPHICS AND ACHIEVEMENT
Samuel M. Zheng Research Co-ordinator
09/10– 09
December 2009
Issued by the Organizational Development Department, Research and Information Services

2006 Student Census: Correlations of School Experiences with Student Demographics and Achievement
Samuel M. Zheng Copyright © (December 2009) Toronto District School Board
Reproduction of this document for use in schools of the Toronto District School Board is encouraged.
For any other purpose, permission must be requested and obtained in writing from: Organizational Development / Research and Information Services
Toronto District School Board 1 Civic Centre Court, Lower Level Etobicoke, ON M9C 2B3
Tel.: 416-394-4929 Fax: 416-394-4946 Every reasonable precaution has been taken to trace the owners of copyrighted material and to make due acknowledgement. Any omission will gladly be rectified in future printings.
R04(DemographicData\2009-2010\SchoolExperiences\StudentCensusReport-SchoolExperiencesFinal)sz.3457

TABLE OF CONTENTS EXECUTIVE SUMMARY .................................................................................................... Pg. 1 INTRODUCTION................................................................................................................. Pg. 5 METHODOLOGY................................................................................................................ Pg. 5 SCHOOL EXPEREIENCES BY STUDENT DEMOGRAPHIC BACKGROUNDS.............. Pg. 9 School Experiences by Student Grade ................................................................... Pg. 9 School Experiences by Program of Study (Grades 9-10 Only) ............................... Pg. 11 School Experiences by Student Gender ................................................................. Pg. 12 School Experiences by Student Racial Background ............................................... Pg. 14 School Experiences by Student Place of Birth ........................................................ Pg. 17 School Experiences by Sexual Orientation (Grades 9-12 Only) ............................. Pg. 18 School Experiences by Parent Presence at Home ................................................. Pg. 19 School Experiences by Parent Education ............................................................... Pg. 21 School Experiences by Family Socio-economic Status .......................................... Pg. 22 CORRELATION OF STUDENTS’ SCHOOL EXPERIENCES WITH ACHIEVEMENT ...... Pg. 24 Overall School Environment.................................................................................... Pg. 24 Class Participation................................................................................................... Pg. 26 Relationships with Other Students .......................................................................... Pg. 28 Relationships with School Adults ............................................................................ Pg. 29 School Safety .......................................................................................................... Pg. 31 Inclusive School Experience ................................................................................... Pg. 33 SUMMARY OF FINDINGS ................................................................................................. Pg. 34 REFERENCES.................................................................................................................... Pg. 41
R04(DemographicData\2009-2010\SchoolExperiences\StudentCensusReport-SchoolExperiencesFinal)sz.3457 i

FIGURES Figure 1: Grouping of School Climate Variables ..................................................... Pg. 6 Figure 2: Feeling Comfortable with Overall School Environment – by Student Grade .......................................................................................... Pg. 9 Figure 3: Feeling Comfortable Participating in Class – by Student Grade .............. Pg. 9 Figure 4: Feeling Comfortable with Other Students – by Student Grade ................ Pg. 10 Figure 5: Feeling Comfortable with School Adults – by Student Grade .................. Pg. 10 Figure 6: Feeling Safe at School – by Student Grade............................................. Pg. 10 Figure 7: Viewing School As An Inclusive Place to Learn – by Student Grade....... Pg. 10 Figure 8: Feeling Comfortable with Overall School Environment – by Program of Study...................................................................................... Pg. 11 Figure 9: Felling Comfortable Participating in Class – by Program of Study........... Pg. 11 Figure 10: Feeling Comfortable with Other Students – by Program of Study ......... Pg. 12 Figure 11: Feeling Comfortable with School Adults – by Program of Study............ Pg. 12 Figure 12: Feeling Safe at School – by Program of Study ...................................... Pg. 12 Figure 13: Viewing School As An Inclusive Place to Learn – by Program of Study................................................................................... Pg. 12 Figure 14: Feeling Comfortable with Overall School Environment – by Student Gender ...................................................................................... Pg. 13 Figure 15: Feeling Comfortable Participating in Class – by Student Gender .......... Pg. 13 Figure 16: Feeling Comfortable with Other Students – by Student Gender ............ Pg. 13 Figure 17: Feeling Comfortable with School Adults – by Student Gender .............. Pg. 13 Figure 18: Feeling Safe at School – by Student Gender......................................... Pg. 14 Figure 19: Viewing School As An Inclusive Place to Learn – by Student Gender ..................................................................................... Pg. 14 Figure 20: Feeling Comfortable with Overall School Environment – by Racial Background ................................................................................. Pg. 15 Figure 21: Feeling Comfortable Participating in Class – by Racial Background ................................................................................. Pg. 15 Figure 22: Feeling Comfortable with Other Students – by Racial Background ....... Pg. 16
R04(DemographicData\2009-2010\SchoolExperiences\StudentCensusReport-SchoolExperiencesFinal)sz.3457 ii

Figure 23: Feeling Comfortable with School Adults – by Racial Background ......... Pg. 16 Figure 24: Feeling Safe at School – by Racial Background .................................... Pg. 16 Figure 25: Viewing School As An Inclusive Place to Learn – by Racial Background ................................................................................. Pg. 16 Figure 26: Feeling Comfortable with Overall School Environment – by Place of Birth .......................................................................................... Pg. 17 Figure 27: Feeling Comfortable Participating in Class – by Place of Birth .............. Pg. 17 Figure28: Feeling Comfortable with Other Students – by Place of Birth ................. Pg. 17 Figure 29: Feeling Comfortable with School Adults – by Place of Birth .................. Pg. 17 Figure 30: Feeling Safe at School – by Place of Birth............................................. Pg. 17 Figure 31: Viewing School As An Inclusive Place to Learn – by Place of Birth....... Pg. 17 Figure 32: Feeling Comfortable with Overall School Environment – by Sexual Orientation .................................................................................. Pg. 18 Figure 33: Feeling Comfortable Participating in Class – by Sexual Orientation...... Pg. 18 Figure 34: Feeling Comfortable with Other Students – by Sexual Orientation........ Pg. 19 Figure 35: Feeling Comfortable with School Adults – by Sexual Orientation .......... Pg. 19 Figure 36: Feeling Safe at School – by Sexual Orientation..................................... Pg. 19 Figure 37: Viewing School As An Inclusive Place to Learn – by Sexual Orientation ................................................................................. Pg. 19 Figure 38: Feeling Comfortable with Overall School Environment – by Parent Presence at Home.................................................................................. Pg. 20 Figure 39: Feeling Comfortable Participating in Class – by Parent Presence at Home.................................................................................. Pg. 20 Figure 40: Feeling Comfortable with Other Students – by Parent Presence at Home.................................................................................. Pg. 20 Figure 41: Feeling Comfortable with School Adults – by Parent Presence at Home.................................................................................. Pg. 20 Figure 42: Feeling Safe at School – by Parent Presence at Home......................... Pg. 20 Figure 43: Viewing School As An Inclusive Place to Learn – by Parent Presence at Home................................................................................. Pg. 20 Figure 44: Feeling Comfortable with Overall School Environment – by Parent Education................................................................................................ Pg. 21
R04(DemographicData\2009-2010\SchoolExperiences\StudentCensusReport-SchoolExperiencesFinal)sz.3457 iii

Figure 45: Feeling Comfortable Participating in Class – by Parent Education........ Pg. 21 Figure 46: Feeling Comfortable with Other Students – by Parent Education.......... Pg. 22 Figure 47: Feeling Comfortable with School Adults – by Parent Education ............ Pg. 22 Figure 48: Feeling Safe at School – by Parent Education....................................... Pg. 22 Figure 49: Viewing School As An Inclusive Place to Learn – by Parent Education ................................................................................... Pg. 22 Figure 50: Feeling Comfortable with Overall School Environment – by Family SES............................................................................................. Pg. 23 Figure 51: Feeling Comfortable Participating in Class – by Family SES................. Pg. 23 Figure 52: Feeling Comfortable with Other Students – by Family SES................... Pg. 23 Figure 53: Feeling Comfortable with School Adults – by Family SES..................... Pg. 23 Figure 54: Feeling Safe at School – by Family SES ............................................... Pg. 23 Figure 55: Viewing School As An Inclusive Place to Learn – by Family SES ......... Pg. 23 Figure 56: Correlation of Grade 7-8 Students’ School Experience with Reading Results ..................................................................................... Pg. 24 Figure 57: Correlation of Grade 7-8 Students’ School Experience with Writing Results ....................................................................................... Pg. 24 Figure 58: Correlation of Grade 7-8 Students’ School Experience with Mathematics Results .............................................................................. Pg. 25 Figure 59: Correlation of Grade 7-8 Students’ School Experience with Science Results...................................................................................... Pg. 25 Figure 60: Correlation of Grade 9-10 Students’ School Experience with English Marks ......................................................................................... Pg. 25 Figure 61: Correlation of Grade 9-10 Students’ School Experience with Mathematics Marks ................................................................................ Pg. 25 Figure 62: Correlation of Grade 9-10 Students’ School Experience with Credit Accumulation ............................................................................... Pg. 25 Figure 63: Correlation of Grade 10 Students’ School Experience with OSSLT Outcome .................................................................................... Pg. 25 Figure 64: Correlation of Grade 7-8 Students’ School Experience with School Attendance ................................................................................. Pg. 26
R04(DemographicData\2009-2010\SchoolExperiences\StudentCensusReport-SchoolExperiencesFinal)sz.3457 iv

Figure 65: Correlation of Grade 9-10 Students’ School Experience with School Attendance ................................................................................. Pg. 26 Figure 66: Correlation of Grade 7-8 Students’ Class Participation with Reading Results ..................................................................................... Pg. 26 Figure 67: Correlation of Grade 7-8 Students’ Class Participation with Writing Results ....................................................................................... Pg. 26 Figure 68: Correlation of Grade 7-8 Students’ Class Participation with Mathematics Results .............................................................................. Pg. 27 Figure 69: Correlation of Grade 7-8 Students’ Class Participation with Science Results...................................................................................... Pg. 27 Figure 70: Correlation of Grade 9-10 Students’ Class Participation with English Marks ......................................................................................... Pg. 27 Figure 71: Correlation of Grade 9-10 Students’ Class Participation with Mathematic Marks .................................................................................. Pg. 27 Figure 72: Correlation of Grade 9-10 Students’ Class Participation with Credit Accumulation ............................................................................... Pg. 27 Figure 73: Correlation of Grade 10 Students’ Class Participation with OSSLT Outcomes .................................................................................. Pg. 27 Figure 74: Correlation of Grade 7-8 Students’ Class Participation with School Attendance ................................................................................. Pg. 27 Figure 75: Correlation of Grade 9-10 Students’ Class Participation with School Attendance ................................................................................. Pg. 27 Figure 76: Correlation of Grade 7-8 Peer Relationships with Reading Results ...... Pg. 28 Figure 77: Correlation of Grade 7-8 Peer Relationships with Writing Results......... Pg. 28 Figure 78: Correlation of Grade 7-8 Peer Relationships with Mathematics Results .............................................................................. Pg. 28 Figure 79: Correlation of Grade 7-8 Peer Relationships with Science Results ....... Pg. 28 Figure 80: Correlation of Grade 9-10 Peer Relationships with English Marks ........ Pg. 28 Figure 81: Correlation of Grade 9-10 Peer Relationships with Mathematics Marks ................................................................................ Pg. 28 Figure 82: Correlation of Grade 9-10 Students’ Peer Relationships with Credit Accumulation ............................................................................... Pg. 29 Figure 83: Correlation of Grade 10 Students’ Peer Relationships with OSSLT Outcome .................................................................................... Pg. 29
R04(DemographicData\2009-2010\SchoolExperiences\StudentCensusReport-SchoolExperiencesFinal)sz.3457 v

Figure 84: Correlation of Grade 7-8 Students’ Peer Relationships with School Attendance ................................................................................. Pg. 29 Figure 85: Correlation of Grade 9-10 Students’ Peer Relationships with School Attendance ................................................................................. Pg. 29 Figure 86: Correlation of Grade 7-8 Students’ Relationships with School Adults and Reading Results ............................................................................. Pg. 29 Figure 87: Correlation of Grade 7-8 Students’ Relationships with School Adults and Writing Results ............................................................................... Pg. 29 Figure 88: Correlation of Grade 7-8 Students’ Relationships with School Adults and Mathematics Results ...................................................................... Pg. 30 Figure 89: Correlation of Grade 7-8 Students’ Relationships with School Adults and Science Results.............................................................................. Pg. 30 Figure 90: Correlation of Grade 9-10 Students’ Relationships with School Adults and English Marks ................................................................................. Pg. 30 Figure 91: Correlation of Grade 9-10 Students’ Relationships with School Adults and Mathematics Marks ........................................................................ Pg. 30 Figure 92: Correlation of Grade 9-10 Students’ Relationships with School Adults and Credit Accumulation ....................................................................... Pg. 30 Figure 93: Correlation of Grade 10 Students’ Relationships with School Adults and OSSLT Outcome ............................................................................ Pg. 30 Figure 94: Correlation of Grade 7-8 Students’ Relationships with School Adults and School Attendance ......................................................................... Pg. 31 Figure 95: Correlation of Grade 9-10 Students’ Relationships with School Adults and School Attendance ......................................................................... Pg. 31 Figure 96: Correlation of Grade 7-8 Students’ School Safety with Reading Results ..................................................................................... Pg. 31 Figure 97: Correlation of Grade 7-8 Students’ School Safety with Writing Results ....................................................................................... Pg. 31 Figure 98: Correlation of Grade 7-8 Students’ School Safety with Mathematics Results .............................................................................. Pg. 31 Figure 99: Correlation of Grade 7-8 Students’ School Safety with Science Results...................................................................................... Pg. 31 Figure 100: Correlation of Gr. 9-10 Students’ School Safety with English Marks ....................................................................................... Pg. 32 Figure 101: Correlation of Gr. 9-10 Students’ School Safety with Mathematics Marks .............................................................................. Pg. 32
R04(DemographicData\2009-2010\SchoolExperiences\StudentCensusReport-SchoolExperiencesFinal)sz.3457 vi

Figure 102: Correlation of Gr. 9-10 Students’ School Safety with Credit Accumulation ............................................................................. Pg. 32 Figure 103: Correlation of Grade 10 Students’ School Safety with OSSLT Outcome .................................................................................. Pg. 32 Figure 104: Correlation of Grade 7-8 Students’ School Safety with School Attendance ............................................................................... Pg. 32 Figure 105: Correlation of Grade 9-10 Students’ School Safety with School Attendance ............................................................................... Pg. 32 Figure 106: Correlation of Grade 7-8 Students’ Inclusive School Experience with Reading Results ................................................................................... Pg. 33 Figure 107: Correlation of Grade 7-8 Students’ Inclusive School Experience with Writing Results ..................................................................................... Pg. 33 Figure 108: Correlation of Grade 7-8 Students’ Inclusive School Experience with Mathematics Results ............................................................................ Pg. 33 Figure 109: Correlation of Grade 7-8 Students’ Inclusive School Experience with Science Results.................................................................................... Pg. 33 Figure 110: Correlation of Grade 9-10 Students’ Inclusive School Experience with English Marks ....................................................................................... Pg. 33 Figure 111: Correlation of Grade 9-10 Students’ Inclusive School Experience with Mathematics Marks .............................................................................. Pg. 33 Figure 112: Correlation of Grade 9-10 Students’ Inclusive School Experience with Credit Accumulation ............................................................................. Pg. 33 Figure 113: Correlation of Grade 10 Students’ Inclusive School Experience with OSSLT Outcome .................................................................................. Pg. 33 Figure 114: Correlation of Grade 7-8 Students’ Inclusive School Experience with School Attendance ............................................................................... Pg. 34 Figure 115: Correlation of Grade 9-10 Students’ Inclusive School Experience with School Attendance ............................................................................... Pg. 34
R04(DemographicData\2009-2010\SchoolExperiences\StudentCensusReport-SchoolExperiencesFinal)sz.3457 vii

R04(DemographicData\2009-2010\SchoolExperiences\StudentCensusReport-SchoolExperiencesFinal)sz.3457 viii R04(DemographicData\2009-2010\SchoolExperiences\StudentCensusReport-SchoolExperiencesFinal)sz.3457 viii

EXECUTIVE SUMMARY
The Toronto District School Board (TDSB) Student Census, conducted with the Grade 7-12
students in Fall 2006, has provided the Board an unique opportunity to collect student
demographic and school experience data. Responses to the original survey questions related to
school experiences have been statistically combined into six major categories based on their
correlations: overall school environment, class participation, relationships with other students,
relationships with school adults, school safety, and inclusive school experience. Students’
school experiences in these six areas have been closely examined by student grade, program
of study in Grade 9 and 10, student gender, racial background, birth place, parent presence at
home, parent education, and family socio-economic status (SES). Grade 7-8 students’
achievement results in report card Reading, Writing, Mathematics, and Science, and Grade 9-
10 students’ final course marks in English and Mathematics, accumulated credits by the end of
Grades 9 and 10, and their outcomes on the Ontario Secondary School Literacy Test (OSSLT),
were linked to students’ school experiences to investigate the impacts of students’ school
experiences on their academic achievement. In addition, Grade 7-10 students’ school
attendance was examined by their school experiences.
Although the majority of Grade 7-12 students indicated they feel comfortable with the overall
school environment and with participating in class, the overall school satisfaction varied by
student grades: the lower the grade, the more students enjoy school, participate in class and
feel comfortable with school adults. However, student grade or age is not a factor by which
students define their relationships with other students in school, or view school as an inclusive
place to learn. Although more than 80% of students, regardless of their grade levels, indicated
they feel safe at school, a notable proportion of students (4-6%) reported they rarely or never
feel safe in schools.
There are more Grade 9-10 students in the Academic program feeling comfortable with the
overall school environment and with participating in class than in the Applied or Locally-
developed programs. The proportion of school-disengaged students in Applied and Locally-
developed programs are double or more than students in the Academic program. Students in
the Academic program had higher proportion of students feeling comfortable with other students
and with school adults, and feeling safe at school than students in the Applied or Locally-
developed programs.
R04(DemographicData\2009-2010\SchoolExperiences\StudentCensusReport-SchoolExperiencesFinal)sz.3457 1

While the majority of students feel comfortable with their overall school environment, female
students had a higher proportion (5-6% higher) than male students. In terms of class
participation, more male students (7-8% higher than female students) indicated that they
participate in class all the time or often.
South Asian students had the highest proportion indicating they enjoy school, followed by
Middle Eastern students. Black, Latin, and Mixed students had the lowest proportions, with East
Asian, White, and Southeast Asian students in between. White students had the highest
proportion feeling comfortable participating in class, followed by Middle Eastern, and South
Asian students. About half of Southeast Asian, East Asian, and Latin students indicated they
participate in class all the time or often. The majority of students indicated they feel safe at
school all the time or often, although Southeast Asian and Black students had slightly lower
proportions feeling safe at school than other racial groups. About one third of East Asian,
Southeast Asian, and White students in Grades 7-8 indicated they view school as an inclusive
place to learn. For the secondary panel, Latin (34%), East Asian (36%), and White (37%)
students had the lowest proportions indicating they view school as an inclusive place to learn.
Approximately 5% more students born outside Canada reported they feel comfortable with the
overall school environment in comparison to students born in Canada. In addition, 5% more
students in Grades 7-8 and 11% more students in Grades 9-12 viewed school as an inclusive
place to learn.
Sixty-nine percent (69%) of heterosexual Grade 9-12 students feel comfortable with the overall
school environment, compared with 52% of Lesbian/Gay/Bisexual/Transgender/Queer (LGBTQ)
students. There are also 12% more LGBTQ students indicating they rarely or never feel
comfortable with school. In terms of relationships with other students and school adults, 17%
more heterosexual students indicated they feel comfortable all the time or often than LGBTQ
students. Seventy-one percent (71%) of LGBTQ students reported they feel safe at school all
the time or often, which is 12% lower than heterosexual students.
Students living with both parents had a higher proportion feeling comfortable with the overall
school environment than students living with a single parent. Students living with both parents
also tend to participate in class more and have better relationships with other students and
school adults than students living with a single parent or with others.
R04(DemographicData\2009-2010\SchoolExperiences\StudentCensusReport-SchoolExperiencesFinal)sz.3457 2

Parent education has less impact on students’ satisfaction with overall school environment than
on students’ class participation: the higher the parent education, the more students indicated
they feel comfortable participating in class all the time or often. Parent education also seems not
to have much influence on students’ relationships with other students or school adults, or on
their perceptions of school safety and viewing school as inclusive place to learn.
Family socio-economic status (SES) has less influence on students’ overall school satisfaction
than on students’ class participation: more students from families with higher SES feel
comfortable participating in class all the time or often than students from families with lower
SES. Family SES also plays some role on students’ relationships with other students, but has
no impact on students’ relationships with school adults.
There are direct correlations between Grade 7-8 students’ perception of overall school
environment and their academic achievement in all four subjects of Reading, Writing,
Mathematics, and Science: the more students enjoy school, the higher the proportion of
students who meet the provincial standard (Level 3 or above). For students who indicated they
rarely or never feel comfortable with the overall school environment, significant proportions
(18%-30%) of them appeared to be at-risk (i.e., achieved Level 1 or below in the four subject
areas). Similar patterns exist in English and Mathematics course marks for Grade 9-10
students. Also, students who enjoy school tend to have a much better chance of accumulating
enough credits and of passing the Ontario Secondary School Literacy Test (OSSLT) than
students not enjoying school. In addition, students who feel comfortable with the overall school
environment tend to attend school more than other students.
Grade 7-8 students who feel comfortable participating in class tend to have higher achievement
results in the four subject areas than students not feeling comfortable participating in class. For
students who indicated they rarely or never feel comfortable participating in class, about half of
them achieved the provincial standards, and they represented a much higher proportion of
students achieving Level 1 or below (16%-26%). Similar patterns have been observed in
Grades 9-10 English and Mathematics course marks, credit accumulation, and in the provincial
literacy test.
For Grade 7-8 students who get along well with other students, about two thirds of them
achieved Level 3 or 4 in the four subject areas, compared with about half of the students who
reported they rarely or never feel comfortable with other students. The achievement gaps in
R04(DemographicData\2009-2010\SchoolExperiences\StudentCensusReport-SchoolExperiencesFinal)sz.3457 3

R04(DemographicData\2009-2010\SchoolExperiences\StudentCensusReport-SchoolExperiencesFinal)sz.3457 4
English and Mathematics are 17% and 12% in Levels 3 and 4 between Grade 9-10 students
who feel comfortable with other students all the time or often and students who rarely or never
feel comfortable. More students who rarely or never feel comfortable with other students were
highly at-risk or failed the provincial literacy test for the first time.
Less than half of the students not feeling comfortable with school adults achieved Level 3 or 4 in
report card marks for Reading, Writing, Mathematics, or Science, while about two thirds of the
students who always feel comfortable had achieved at or above the provincial standards.
Similar or wider achievement gaps existed for Grade 9-10 students: 25% and 23% more
students achieved Level 3 or 4 in English and Mathematics courses for students feeling
comfortable with school adults than students rarely or never feeling comfortable with school
adults. In terms of credit accumulation, nearly one third of students not feeling comfortable with
school adults were highly at-risk, and 28% of them failed the OSSLT for the first time.
About 4% of Grade 7-8 students indicated they rarely or never feel safe at school. For these
students, less than half had achieved Level 3 or 4, and 19-30% had achieved Level 1 or below
in Reading, Writing, Mathematics, or Science. For students feeling safe at school all the time or
often, between 64%-68% of them achieve Level 3 or 4 in the four subject areas. For Grade 9-10
students who indicated they rarely or never feel safe at school, only 41% had achieved a mark
of 70 or higher (Level 3 and 4) in English, while 26% had a mark below 60 (Level 1 or below). A
significant proportion of these students were highly at-risk (25%) in credit accumulation, or failed
the literacy test (28%).
Students’ inclusive school experience had little or no impact on student achievement or school
attendance.
In summary, this report drew on the recommendations of two previous TDSB research reports
(Yau & O’Reilly, 2007; Brown & Sinay, 2008) which called for further investigation of student
demographic background and student achievement data. The findings presented in this report
provide an overall global snapshot of student perceptions of their school experiences, as
collected from a wide demographic range of TDSB students. Such detailed information deepens
the collective understanding of the TDSB student population and contributes to its commitment
to the principle of equity, so that ultimately, all students do indeed learn and grow to their full
potential, in environments that welcome differences and are free from discrimination

INTRODUCTION
The Toronto District School Board (TDSB) is the largest school board in Canada, serving more
than 265,000 students in 474 elementary and 117 secondary schools in the 2007-2008 school
year in the City of Toronto, one of the world's most diverse cities. The TDSB school
communities reflect this diversity with a wide array of racial, ethnic, and cultural groups. The
publicly-funded school board is committed to the principles of equity to enable all students to
learn and grow to their full potential, in environments that welcome differences and are free from
discrimination.
The TDSB’s recent research reports, 2006 Student Census, Grades 7-12: System Overview
(Yau & O’Reilly, 2007) and 2006 Student Census: Linking Demographic Data With Student
Achievement (Brown & Sinay, 2008), used data from the 2006 Grade 7-12 Student Census
surveys (referred as 2006 Student Census hereafter) and the 2006-2007 student achievement
results in elementary report card, secondary course marks, credit accumulation, and the Ontario
Secondary School Literacy Test (OSSLT) to investigate the TDSB’s Grade 7-12 student
demographic characteristics, student experiences in school and outside of school (Yau &
O’Reilly, 2007), and the correlations of these students’ demographic backgrounds with their
academic performance (Brown & Sinay, 2008). Both reports recommended to further examine
students’ school experiences by their demographic backgrounds, and to investigate the
correlations of their school experiences with academic achievement. This report, using the
same data mentioned above, fulfills this purpose.
METHODOLOGY
The TDSB’s 2006 Student Census employed a matrix-sampling method in which two forms
(Forms A and B) were designed: the section on demographics for both forms was identical, but
each form had its own set of contextual questions with a few common items. Every second
student was randomly assigned to complete one of the two forms. In this way, alternate
students within the same class would complete Form A, while the other half would complete
Form B (Yau & O’Reilly, 2007). As the information covered by the surveys is very
comprehensive, for example, there are 23 items to ask about students’ experiences regarding
inclusive school environment from Questions 16-19 in the Grade 7-8 Form A, the analysis would
have to be greatly extended by examining each item with respect to different student
demographic backgrounds and by linking student survey response in each item to student
achievement in Reading, Writing, Mathematics, Science, credit accumulation, and the provincial
R04(DemographicData\2009-2010\SchoolExperiences\StudentCensusReport-SchoolExperiencesFinal)sz.3457 5

literacy test. Therefore, survey items related to major themes have been statistically combined
based on their correlations, using the statistical procedure of Factor Analysis. For example,
there are seven survey items (Question 19 in the Grade 7-8 Form A and Question 16 in the
Grade 7-8 Form B) regarding school climate:
1) I enjoy school;
2) My school is a friendly and welcoming place;
3) My school building is an attractive and great place to learn;
4) I get along well with other students in my school;
5) I feel accepted by students in my school;
6) I feel accepted by adults in my school; and
7) Extra help is available at this school when I need it.
Figure 1 shows the plot of the two groups of the above seven survey items related to school
climate from the Grade 7-8 student responses, based on the statistical analysis1:
1 Extraction Method: Principal Component Analysis; Rotation Method: Varimax with Kaiser Normalization.
R04(DemographicData\2009-2010\SchoolExperiences\StudentCensusReport-SchoolExperiencesFinal)sz.3457 6

It becomes very clear that Item 4 (I get along well with other students in my school) and Item 5 (I
feel accepted by students in my school) are closely related as they are questions about
relationships with other students; while the other five items (1-3 and 6-7) are about student
perceptions on the overall school environment, (i.e., enjoying school, feeling that the school is a
friendly and welcoming place, feeling accepted by school adults, feeling extra help is available
at school, etc.). Therefore, instead of using all seven survey items, two calculated variables from
the survey items related to school climate were used in this report. Similarly, survey items
related to class participation, relationships with school adults, school safety, and inclusive
school experiences were statistically combined into another four new variables. The raw scores
of all these calculated variables were then converted into five categories, representing “All the
Time”, “Often”, “Sometimes”, “Rarely”, and “Never”, to measure students’ school experiences.
In summary, student perceptions on school experiences have been classified into the following
six major themes, based on the statistical analysis of the categories used by Yau & O’Reilly in
their report:
Overall School Environment – derived from survey items in enjoying school, feeling
accepted by school adults, viewing school as a friendly and welcoming place, feeling
extra help is available at school, and viewing the school building as an attractive and
great place to learn;
Class Participation – derived from survey items in feeling comfortable participating in
class activities and discussions, answering questions, and speaking up to give their own
opinions in class;
Relationships with Other Students – derived from survey items in getting along with
other students in school, and feeling accepted by students in school;
Relationships with School Adults – derived from survey items in perception of teacher
expectations, feeling supported and encouraged by teachers, feeling comfortable to
discuss problems with teachers, and the student’s background being respected by
school staff;
School Safety – derived from survey items in feeling safe in classrooms, in different
locations in the school buildings, and outside on school properties; and
R04(DemographicData\2009-2010\SchoolExperiences\StudentCensusReport-SchoolExperiencesFinal)sz.3457 7

Inclusive School Experiences – derived from survey items in student opinions towards
school recognizing and addressing different issues in gender, cultural, racial and faith
backgrounds, and sexual orientation.
In this study, student demographic backgrounds in gender, race, country of birth, parent
presence at home, parent education and family socio-economic status (SES), as well as student
grade in the 2006-2007 school year and program of study (Grade 9-10 students only), were
used as student demographic variables to examine student experiences in the TDSB schools.
Grade 7-8 students’ achievement results in June 2007 report card Reading, Writing,
Mathematics, Science, and Grade 9-10 students’ course marks in English and Mathematics,
credit accumulation, and outcomes from the Ontario Secondary School Literacy Test (OSSLT),
were used as academic indicators to investigate the correlations of students’ school
experiences with their academic achievement.
R04(DemographicData\2009-2010\SchoolExperiences\StudentCensusReport-SchoolExperiencesFinal)sz.3457 8

SCHOOL EXPERIENCES BY STUDENT DEMOGRAPHIC BACKGROUNDS
The high return rates of the 2006 Student Census surveys, 92% for Grades 7-8, and 81% for
Grades 9-12, indicated that the student perception data collected by the surveys are quite
representative for the TDSB senior and secondary students. The following sections examine
students’ experiences in school for different student groups, i.e., by student grade and program
of study, student gender, racial background, birth place, parent presence at home, parent
education, and family socio-economic status (SES).
School Experiences by Student Grade
Figures 2-7 show the Grade 7-12 students’ school experiences by their grades in the 2006-2007
school year, at which time the Student Census surveys were conducted.
It can be seen that student satisfaction with
the overall school environment varied by
student grades (see Figure 2): 82% of Grade
7 students felt comfortable all the time or
often with their schools, while only 64% of
Grade 12 students reported so. The
unsatisfied students (reported as “Rarely or
Never”) increased from 4% in Grad
in Grade 12. Interestingly, the Grade 8 and 9
students, as well as the Grade 11 and 12 students, had almost the same view about th
e 7 to 9%
eir
chools.
.,
n that
ed students (reported as “Rarely
or Never”) increased from 9% in Grade 7 to 13% in Grade 12.
Figure 2: Feeling Comfortable with Overall School Environment - by Student Grade
64%
65%
69%
77%
77%
82%
27%
27%
23%
18%
17%
14%
9%
9%
8%
5%
6%
4%
17,729
15,252
15,481
15,608
15,447
15,716
Grade 12
Grade 11
Grade 10
Grade 9
Grade 8
Grade 7
All the Time/Often Sometimes Rarely/Never Total
s
Figure 3 shows the Grade 7-12 students’
perception on their class participation, e.g
feeling comfortable participating in class
activities and discussions, feeling comfortable
answering questions, and speaking up to give
their own opinions in class. It can be see
class participation declines with student
grades: 69% of Grade 7 vs. 57% of Grade 12
students, indicated they feel comfortable all
the time or often participating in class activities, while disengag
Figure 3: Feeling Comfortable Participating in Class - by Student Grade
58%
60%
64%
66%
69%
29%
29%
26%
24%
22%
12%
11%
9%
10%
9%
7,714
7,868
7,931
7,878
8,076
Grade 11
Grade 10
Grade 9
Grade 8
Grade 7
57% 29% 13% 9,061Grade 12
All the Time/Often Sometimes Rarely/Never Total
R04(DemographicData\2009-2010\SchoolExperiences\StudentCensusReport-SchoolExperiencesFinal)sz.3457 9

Figure 4 shows the results of the Grade 7-12 students’ relationships with other students in
school, and Figure 5 shows their relationships with school adults. Although not a factor in terms
of getting along with other students in school, student grade or age does have an impact on
defining student relationships with school adults: the younger the students, the higher the
proportions of students who feel comfortable with schools adults (90% in Grade 7 and 72% in
Grades 11-12).
Figure 4: Feeling Comfortable with Other Students - by Student Grade
83%
85%
85%
87%
86%
86%
10%
9%
9%
8%
8%
9%
7%
6%
6%
5%
6%
6% 16,118
15,713
15,994
15,821
15,520
18,090Grade 12
Grade 11
Grade 10
Grade 9
Grade 8
Grade 7
All the Time/Often Sometimes Rarely/Never Total
Figure 5: Feeling Comfortable with School Adults - by Student Grade
72%
72%
76%
83%
87%
90%
21%
21%
19%
13%
10%
8%
7%
7%
6%
3%
3%
2% 7,573
7,491
7,660
7,615
7,486
8,707Grade 12
Grade 11
Grade 10
Grade 9
Grade 8
Grade 7
All the Time/Often Sometimes Rarely/Never Total
Figure 6 shows the Grade 7-12 students’ perceptions on school safety. More than 80% of
students, regardless of their grades, reported that they feel safe all the time or often in school
(classrooms, different locations in the school buildings, and outside on school properties).
However, a notable proportion of students (4-6%) indicated they rarely or never feel safe in
school. Further investigation is needed to identify and to address the concerns of these
students.
Figure 6: Feeling Safe at School - by Student Grade
81%
82%
82%
83%
85%
84%
13%
13%
14%
12%
11%
12%
6%
5%
5%
4%
4%
4%
9,041
7,719
7,836
7,935
7,958
8,149
Grade 12
Grade 11
Grade 10
Grade 9
Grade 8
Grade 7
All the Time/Often Sometimes Rarely/Never Total
Figure 7: Viewing School As An Inclusive Place to Learn - by Student Grade
44%
41%
38%
35%
41%
40%
44%
46%
47%
44%
43%
42%
12%
13%
16%
21%
15%
18% 6,699
6,727
6,484
6,643
6,604
7,779Grade 12
Grade 11
Grade 10
Grade 9
Grade 8
Grade 7
All the Time/Often Sometimes Rarely/Never Total
Students’ inclusive school experiences were calculated from their opinions towards their schools
recognizing and addressing differences in student gender, cultural, racial and faith backgrounds,
and sexual orientation. Figure 7 shows there is no clear pattern in students’ inclusive school
R04(DemographicData\2009-2010\SchoolExperiences\StudentCensusReport-SchoolExperiencesFinal)sz.3457 10

experiences by their grades. However, although the majority of students reported they feel
positive in this area, an alarming proportion of students, ranging from 12% in Grade 12 to 21%
in Grade 9, indicated they feel their schools are not inclusive – another area which needs further
investigation in order to address the concerns of these students.
School Experiences by Program of Study (Grades 9-10 Only)
The programs of study for the Grade 9-10 students, namely Academic (university-directed),
Applied (college-directed), and Locally-developed (workplace-directed), have been determined
by the levels of the majority of their courses taken during the school year (Brown & Sinay,
2008). Figures 8-13 show the Grade 9-10 students’ school experiences by their program of
study in the 2006-2007 school year.
Figure 8: Feeling Comfortable with Overall School Environment - by Program of Study
61%
64%
76%
26%
25%
19%
13%
10%
5%
803
5,699
21,929
Locally-developed
Applied
Academic
All the Time/Often Sometimes Rarely/Never Total
Figure 9: Feeling Comfortable Participating in Class - by Program of Study
50%
55%
65%
30%
32%
26%
19%
14%
9%
420
2,902
11,123
Locally-developed
Applied
Academic
All the Time/Often Sometimes Rarely/Never Total
It becomes clear that more students in the Academic program enjoyed school than students in
the Applied or Locally-developed programs (see Figure 8). Although the number of Grade 9-10
students in the Applied and Locally-developed programs are relatively smaller than the number
of students in the Academic program, the percentages of school-disengaged students in the
Applied and Locally-developed programs are double or more (10% and 13%) than students in
the Academic program (5%). Similar patterns can be seen in their class participation (see Figure
9).
Figures 10 and 11 show the Grade 9-10 students’ relationships with other students in school
and with school adults. There are significant differences in the students’ experience in getting
along with other students: more students in the Academic program (90%) tend to feel
comfortable all the time or often with other students than students in the Applied (80%) or
Locally-developed programs (71%). With respect to their relationships with school adults,
students in the Applied and Locally-developed programs showed a similar pattern of feeling less
comfortable with school adults than do students in the Academic program (see Figure 11).
R04(DemographicData\2009-2010\SchoolExperiences\StudentCensusReport-SchoolExperiencesFinal)sz.3457 11
Figure 10: Feeling Comfortable with Other Students - by Program of Study
71%
80%
90%
17%
12%
7%
12%
8%
4%22,312
5,893
855Locally-developed
Applied
Academic
All the Time/Often Sometimes Rarely/Never Total
Figure 11: Feeling Comfortable with School Adults - by Program of Study
77%
75%
81%
17%
18%
15%
6%
7%
4%
373
2,741
10,868
Locally-developed
Applied
Academic
All the Time/Often Sometimes Rarely/Never Total
Figure 12 shows the Grade 9-10 students’ experience on school safety. There are more
students in the Academic program who felt safe at school all the time or often (85%), while only
66% of students in the Locally-developed program felt safe at school. It should be pointed out
that there are only a small number of students in the Locally-developed program included in this
study. Therefore the comparison presented here needs to be treated with caution.
Figure 12: Feeling Safe at School - by Program of Study
66%
78%
85%
24%
16%
12%
10%
6%
4%
429
2,896
11,080
Locally-developed
Applied
Academic
All the Time/Often Sometimes Rarely/Never Total
Figure 13: Viewing School As An Inclusive Place to Learn - by Program of Study
36%
35%
36%
38%
43%
46%
26%
22%
17%
305
2,229
9,572
Locally-developed
Applied
Academic
All the Time/Often Sometimes Rarely/Never Total
There is no big difference by program of study in terms of the Grade 9-10 students’ inclusive
school experience, although the proportion of students who disagreed that schools are inclusive
tend to be higher for the Grade 9-10 students in the Applied and Locally-developed programs
than students in the Academic program (see Figure 13).
School Experiences by Student Gender
Brown & Sinay (2008) reported that there is a lower proportion of male students in both Grades
7-8 and Grades 9-10 reaching academic standards in various measurements such as report
card Reading, Writing, Mathematics, Science, credit accumulation, and the Ontario Secondary
School Literacy Test (OSSLT) than female students. Although there are many factors which
may contribute to the discrepancy of achievement results for male and female students, it would
be interesting to examine students’ school experiences by student gender, using the rich data
gathered from the TDSB’s 2006 Student Census.
R04(DemographicData\2009-2010\SchoolExperiences\StudentCensusReport-SchoolExperiencesFinal)sz.3457 12

Figure 14 shows the Grade 7-12 students’ perception on the overall school environment by
student gender. It can be seen that while the majority of students said they feel comfortable with
their overall school environment, a higher proportion of female students (than male students)
enjoy school all the time or often in both Grades 7-8 and Grades 9-12. In contrast, at the
secondary level 4% more male students indicated they rarely or never feel comfortable with the
overall school environment than female students.
Figure 14: Feeling Comfortable with Overall School Environment - by Student Gender
71%
65%
82%
77%
23%
25%
14%
17%
6%
10%
4%
6%
32,064
33,898
15,485
16,491
Female
Male
Female
Male
Gr.
9-1
2G
r. 7
-8
All the Time/Often Sometimes Rarely/Never Total C
Figure 15: Feeling Comfortable Participating in Class - by Student Gender
56%
63%
63%
71%
31%
26%
26%
20%
13%
11%
11%
8%
16,426
17,163
7,948
8,434
Female
Male
Female
Male
Gr.
9-1
2G
r. 7
-8
All the Time/Often Sometimes Rarely/Never Total C
In terms of class participation, more male students in both Grades 7-8 and Grades 9-12
indicated that they participate in class all the time or often than did female students (see Figure
15).
There is no gender difference regarding relationships with other students for both senior and
secondary students (see Figure 16), and there is a very small gender difference in terms of
student experience with school adults (see Figure 17). However, fewer students in Grades 9-12,
for both genders, indicated that they feel comfortable all the time or often with school adults in
comparison to students in Grades 7-8.
Figure 16: Feeling Comfortable with Other Students - by Student Gender
85%
84%
87%
85%
9%
9%
8%
9%
6%
6%
5%
7%
32,698
34,689
15,819
16,852
Female
Male
Female
Male
Gr.
9-1
2G
r. 7
-8
All the Time/Often Sometimes Rarely/Never Total C
Figure 17: Feeling Comfortable with School Adults - by Student Gender
76%
74%
90%
87%
19%
18%
8%
10%
5%
7%
2%
3%
15,806
16,574
7,537
7,921
Female
Male
Female
Male
Gr.
9-1
2G
r. 7
-8
All the Time/Often Sometimes Rarely/Never Total C
R04(DemographicData\2009-2010\SchoolExperiences\StudentCensusReport-SchoolExperiencesFinal)sz.3457 13

There is no gender difference in students’ perceptions on school safety (see Figure 18), and a
4-5% gender difference favouring females was observed in students’ inclusive school
experience in the all the time or often category (see Figure 19).
Figure 18: Feeling Safe at School - by Student Gender
83%
81%
85%
84%
14%
13%
12%
11%
4%
7%
4%
5%
16,340
17,211
7,976
8,575
Female
Male
Female
Male
Gr.
9-1
2G
r. 7
-8
All the Time/Often Sometimes Rarely/Never Total C
Figure 19: Viewing School As An Inclusive Place to Learn - by Student Gender
42%
37%
43%
39%
45%
45%
43%
43%
13%
18%
14%
19%
13,812
14,513
6,604
7,154
Female
Male
Female
Male
Gr.
9-1
2G
r. 7
-8
All the Time/Often Sometimes Rarely/Never Total C
School Experiences by Student Racial Background
In their study, Brown & Sinay (2008) reported that significant achievement gaps exist for certain
student racial groups in the TDSB: East Asian students have the highest proportion achieving at
or above the provincial standard in Reading and Writing, followed by White, Southeast Asian,
South Asian, Mixed, Middle Eastern, Latin, and Black students. As school engagement plays a
significant role in student learning (see the “Correlation of Students’ School Experiences with
Achievement” Section of this report), it is necessary to examine students’ school experiences by
their racial backgrounds.
Figure 20 shows the satisfaction with the overall school environment of the Grade 7-12 students
by their racial backgrounds. South Asian students, in both the elementary and secondary
panels, had the highest proportion indicating they enjoy school all the time or often, followed by
Middle Eastern students. Black, Latin, and Mixed students had the lowest proportion of students
indicating they enjoy school all the time or often. East Asian and White students are in between,
along with Southeast Asian students.
R04(DemographicData\2009-2010\SchoolExperiences\StudentCensusReport-SchoolExperiencesFinal)sz.3457 14

Figure 20: Feeling Comfortable with Overall School Environment - by Racial Background
69%
67%
75%
63%
70%
60%
67%
60%
86%
73%
75%
80%
74%
23%
25%
19%
27%
22%
29%
27%
28%
15%
19%
11%
21%
14%
22%
17%
18%
8%
8%
6%
10%
8%
11%
7%
12%
5%
4%
3%
6%
6%
3%
4%
8%
79%
77%
80%
21,991
2,271
12,745
3,415
3,163
1,394
13,329
7,397
9,876
1,343
6,790
1,928
1,449
592
5,306
4,611
White
SE Asian
S Asian
Mixed
Middle E
Latin
E Asian
Black
White
SE Asian
S Asian
Mixed
Middle E
Latin
E Asian
Black
Gr.
9-1
2G
r. 7
-8
All the Time/Often Sometimes Rarely/Never Total
Figure 21: Feeling Comfortable Participating in Class - by Racial Background
67%
48%
62%
63%
66%
51%
46%
60%
72%
66%
55%
57%
66%
23%
36%
27%
25%
25%
34%
38%
28%
19%
31%
21%
24%
22%
25%
30%
23%
9%
17%
11%
12%
9%
15%
16%
12%
8%
15%
8%
10%
8%
21%
12%
10%
73%
54%
70%
11,225
1,156
6,548
1,607
1,598
738
6,703
3,831
5,052
694
3,490
946
765
306
2,707
2,396
White
SE Asian
S Asian
Mixed
Middle E
Latin
E Asian
Black
White
SE Asian
S Asian
Mixed
Middle E
Latin
E Asian
Black
Gr.
9-1
2G
r. 7
-8
All the Time/Often Sometimes Rarely/Never Total
In terms of class participation, White students had the highest proportion indicating they
participate in class all the time or often, followed by Middle Eastern, and South Asian students.
Only about half of Southeast Asian, East Asian, and Latin students (46%-57%) indicated they
participate in class all the time or often (see Figure 21).
Figures 22 and 23 show the Grade 7-12 students’ relationships with other students in school
and with school adults. One can see that student perceptions are not much different among
student racial groups, although South Asian students tend to have a slightly higher proportion
indicating they feel comfortable with other students and with school adults.
R04(DemographicData\2009-2010\SchoolExperiences\StudentCensusReport-SchoolExperiencesFinal)sz.3457 15

Figure 22: Feeling Comfortable with Other Students - by Racial Background
87%
82%
89%
84%
85%
83%
82%
82%
89%
86%
87%
84%
82%
8%
12%
7%
9%
8%
10%
12%
10%
7%
10%
7%
8%
11%
8%
10%
10%
6%
6%
4%
7%
7%
8%
6%
8%
6%
6%
4%
6%
6%
5%
6%
8%
87%
84%
83%
4,786
5,392
602
1,484
1,981
6,913
1,371
10,059
7,712
13,511
1,435
3,270
3,505
13,011
2,317
22,355White
SE Asian
S Asian
Mixed
Middle E
Latin
E Asian
Black
White
SE Asian
S Asian
Mixed
Middle E
Latin
E Asian
Black
Gr.
9-1
2G
r. 7
-8
All the Time/Often Sometimes Rarely/Never Total
Figure 23: Feeling Comfortable with School Adults - by Racial Background
79%
76%
80%
70%
73%
72%
72%
69%
92%
85%
89%
88%
84%
17%
18%
15%
22%
20%
22%
22%
21%
9%
10%
6%
12%
12%
8%
10%
11%
5%
5%
5%
8%
8%
7%
6%
10%
2%
1%
2%
3%
4%
3%
2%
5%
84%
89%
89%
10,785
1,123
6,233
1,804
1,548
671
6,564
3,552
4,769
644
3,289
980
684
280
2,565
2,204
White
SE Asian
S Asian
Mixed
Middle E
Latin
E Asian
Black
White
SE Asian
S Asian
Mixed
Middle E
Latin
E Asian
Black
Gr.
9-1
2G
r. 7
-8
All the Time/Often Sometimes Rarely/Never Total
The majority of students said they feel safe at school all the time or often, although Southeast
Asian and Black students had slightly smaller proportions than the other racial groups (see
Figure 24).
Figure 24: Feeling Safe at School - by Racial Background
86%
75%
82%
83%
81%
82%
78%
77%
86%
82%
83%
82%
80%
10%
19%
13%
12%
13%
12%
17%
15%
9%
16%
10%
12%
10%
12%
14%
14%
4%
5%
5%
4%
6%
6%
5%
8%
3%
5%
4%
6%
5%
5%
3%
6%
88%
80%
85%
11,158
1,161
6,548
1,590
1,602
737
6,736
3,840
5,103
706
3,521
957
781
311
2,726
2,419
White
SE Asian
S Asian
Mixed
Middle E
Latin
E Asian
Black
White
SE Asian
S Asian
Mixed
Middle E
Latin
E Asian
Black
Gr.
9-1
2G
r. 7
-8
All the Time/Often Sometimes Rarely/Never Total
Figure 25: Viewing School As An Inclusive Place to Learn - by Racial Background
37%
41%
49%
38%
45%
34%
36%
39%
48%
40%
44%
33%
47%
46%
44%
40%
46%
41%
49%
48%
45%
44%
49%
39%
43%
39%
42%
46%
40%
17%
16%
11%
17%
14%
18%
17%
17%
19%
16%
13%
17%
15%
14%
21%
14%
45%
35%
37%
9,687
998
5,415
1,339
1,264
606
5,916
2,967
4,351
607
2,936
1,842
2,372
246
599
796
White
SE Asian
S Asian
Mixed
Middle E
Latin
E Asian
Black
White
SE Asian
S Asian
Mixed
Middle E
Latin
E Asian
Black
Gr.
9-1
2G
r. 7
-8
All the Time/Often Sometimes Rarely/Never Total
R04(DemographicData\2009-2010\SchoolExperiences\StudentCensusReport-SchoolExperiencesFinal)sz.3457 16

In terms of inclusive school experiences, only about one third of East Asian (33%), Southeast
Asian (35%), and White (37%) students in Grades 7-8 indicated they view school as an
inclusive place. In the secondary panel, Latin (34%), East Asian (36%), and White (37%)
students had the lowest proportions indicating they view school as an inclusive place to learn
(see Figure 25).
School Experiences by Student Place of Birth
In Fall 2006 when the Student Census was conducted, 29% of all TDSB students (Kindergarten
– Grade 12) were born outside of Canada in more than 175 countries or regions. The TDSB’s
student registration data shows there are more students in secondary schools born outside
Canada (40%) than elementary students (24%). Figures 26 to 31 show the survey results on
school experiences for the two student groups: born in Canada and born outside Canada.
Figure 26: Feeling Comfortable with Overall School Environment - by Place of Birth
72%
66%
83%
78%
22%
25%
14%
16%
6%
9%
4%
5%
26,393
37,810
9,469
21,880
Outside Canada
Born in Canada
Outside Canada
Born in Canada
Gr.
9-1
2G
r. 7
-8
All the Time/Often Sometimes Rarely/Never Total
Figure 27: Feeling Comfortable Participating in Class - by Place of Birth
59%
60%
68%
67%
29%
28%
23%
23%
11%
12%
9%
10%
13,383
19,244
4,829
11,214
Outside Canada
Born in Canada
Outside Canada
Born in Canada
Gr.
9-1
2G
r. 7
-8
All the Time/Often Sometimes Rarely/Never Total
Figure 28: Feeling Comfortable with Other Students - by Place of Birth
84%
86%
84%
87%
10%
8%
10%
8%
6%
6%
6%
6% 22,364
9,659
38,528
27,037Outside Canada
Born in Canada
Outside Canada
Born in Canada
Gr.
9-1
2G
r. 7
-8
All the Time/Often Sometimes Rarely/Never Total
Figure 29: Feeling Comfortable with School Adults - by Place of Birth
76%
75%
89%
88%
18%
19%
8%
9%
6%
6%
2%
3%
13,011
18,536
4,560
10,596
Outside Canada
Born in Canada
Outside Canada
Born in Canada
Gr.
9-1
2G
r. 7
-8
All the Time/Often Sometimes Rarely/Never Total
Figure 30: Feeling Safe at School - by Place of Birth
81%
82%
85%
84%
14%
13%
11%
11%
5%
5%
4%
4%
13,408
19,177
4,885
11,310
Outside Canada
Born in Canada
Outside Canada
Born in Canada
Gr.
9-1
2G
r. 7
-8
All the Time/Often Sometimes Rarely/Never Total
Figure 31: Viewing School As An Inclusive Place to Learn - by Place of Birth
46%
35%
44%
39%
42%
47%
41%
44%
12%
17%
16%
17% 9,442
4,050
16,507
11,042Outside Canada
Born in Canada
Outside Canada
Born in Canada
Gr.
9-1
2G
r. 7
-8
All the Time/Often Sometimes Rarely/Never Total
R04(DemographicData\2009-2010\SchoolExperiences\StudentCensusReport-SchoolExperiencesFinal)sz.3457 17

Although about 10% fewer secondary students tend to enjoy school than Grade 7-8 students,
students born outside Canada feel more comfortable with their school environment than
students born in Canada (see Figure 26). However, there is not much difference in terms of
class participation (see Figure 27), relationships with other students (see Figure 28),
relationships with school adults (see Figure 29), and school safety (see Figure 30). Students
born outside Canada had 5%-11% more students indicating they view school as an inclusive
place to learn than students born in Canada (see Figure 31).
School Experiences by Sexual Orientation (Grades 9-12 only)
In the 2006 Student Census, Grade 9-12 students were asked about their sexual orientation.
Three categories have been employed in this report and in the previous two research reports:
Heterosexual, Lesbian/Gay/Bisexual/Transgender/Queer (LGBTQ), and Unsure/Questioning.
According to Brown & Sinay (2008), caution needs to be taken with the ‘unsure’ category as it
appeared some students chose this because they were unclear about the terminology used in
the survey (e.g., ESL students), while others answered this as they themselves were
questioning their sexual orientation.
While 69% of heterosexual Grade 9-12 students indicated they feel comfortable with the overall
school environment all the time or often, only 52% of LGBTQ students said so (see Figure 32).
On the other hand, 20% of LGBTQ students reported that they rarely or never enjoy school,
compared with 8% of heterosexual students. However, the difference in class participation is
quite small (3%) for the above two student groups (see Figure 33).
Figure 32: Feeling Comfortable with Overall School Environment - by Sexual Orientation
66%
52%
69%
25%
28%
24%
9%
20%
8%
2,604
2,106
59,506
Not sure/Questioning
LGBTQ
Heterosexual
All the Time/Often Sometimes Rarely/Never Total
Figure 33: Feeling Comfortable Participating in Class - by Sexual Orientation
50%
58%
61%
34%
26%
28%
16%
16%
11% 30,225
1,092
1,348Not sure/Questioning
LGBTQ
Heterosexual
All the Time/Often Sometimes Rarely/Never Total
There are also significant differences in Grade 9-12 students’ relationships with other students
in the school and with school adults: 69% of LGBTQ students reported they felt comfortable with
other students in the school, 17% lower than heterosexual students (see Figure 34). In terms of
relationships with school adults, 59% of LGBTQ students felt comfortable all the time or often,
compared with 76% of heterosexual students (another 17% difference, see Figure 35).
R04(DemographicData\2009-2010\SchoolExperiences\StudentCensusReport-SchoolExperiencesFinal)sz.3457 18

Figure 34: Feeling Comfortable with Other Students - by Sexual Orientation
72%
69%
86%
16%
13%
8%
12%
18%
5%60,727
2,156
2,663Not sure/Questioning
LGBTQ
Heterosexual
All the Time/Often Sometimes Rarely/Never Total
Figure 35: Feeling Comfortable with School Adults - by Sexual Orientation
74%
59%
76%
19%
24%
18%
7%
17%
6%
1,244
1,037
29,235
Not sure/Questioning
LGBTQ
Heterosexual
All the Time/Often Sometimes Rarely/Never Total
Regarding school safety, 71% of LGBTQ students reported they feel safe at school all the time
or often, which is 12% lower than heterosexual students (see Figure 36). On the other hand,
10% more LGBTQ than heterosexual students indicated they rarely or never feel safe at school.
Figure 36: Feeling Safe at School - by Sexual Orientation
73%
71%
83%
19%
15%
13%
9%
14%
4%30,177
1,095
1,360Not sure/Questioning
LGBTQ
Heterosexual
All the Time/Often Sometimes Rarely/Never Total
Figure 37: Viewing School As An Inclusive Place to Learn - by Sexual Orientation
42%
39%
40%
42%
42%
45%
17%
19%
15%
1,112
916
25,754
Not sure/Questioning
LGBTQ
Heterosexual
All the Time/Often Sometimes Rarely/Never Total
There is not much difference by student sexual orientation regarding their inclusive school
experience (see Figure 37).
School Experiences by Parent Presence at Home
In the 2006 Student Census, Grade 7-12 students were asked to identify their parent presence
at home. In this report, living with both parents includes living with father and mother together,
mother and step-father, father and step-mother, and half of the time with each. Living with
others includes living with adult relatives/guardians (e.g., grand parents), group home, foster
parents, with friends or others, and on their own.
Students living with both parents had higher proportion of students feeling comfortable with the
overall school environment than students living with mother only, or with father only (see Figure
38). For Grade 7-8 students, the differences are 8% and 11%; for Grade 9-12 students, the
differences are 8% and 6%. For students living with others in comparison with students living
with both parents, the gap is more significant at the secondary level (12%) than in Grades 7-8
(6%). Students living with both parents also participated more in class than students living with a
single parent or others (see Figure 39).
R04(DemographicData\2009-2010\SchoolExperiences\StudentCensusReport-SchoolExperiencesFinal)sz.3457 19

Figure 38: Feeling Comfortable with Overall School Environment - by Parent Presence at Home
58%
64%
62%
70%
75%
70%
73%
81%
27%
26%
27%
23%
17%
21%
19%
15%
15%
10%
10%
7%
9%
9%
7%
4%
3,176
1,826
11,911
48,590
1,075
547
24,681
5,317
Others
Father Only
Mother Only
Both Parents
Others
Father Only
Mother Only
Tw o Parents
Gr.
9-1
2G
r. 7
-8
All the Time/Often Sometimes Rarely/Never Total
Figure 39: Feeling Comfortable Participating in Class - by Parent Presence at Home
52%
59%
57%
61%
58%
58%
63%
69%
31%
30%
30%
28%
28%
26%
25%
22%
18%
12%
13%
11%
14%
16%
12%
9%
1,600
941
6,118
24,697
504
287
12,653
2,794
Others
Father Only
Mother Only
Both Parents
Others
Father Only
Mother Only
Tw o Parents
Gr.
9-1
2G
r. 7
-8
All the Time/Often Sometimes Rarely/Never Total
Similar patterns have been observed in Grade 7-12 students’ relationships with other students
in the school (see Figure 40) and their relationships with school adults (see Figure 41).
Figure 40: Feeling Comfortable with Other Students - by Parent Presence at Home
72%
78%
82%
87%
79%
78%
82%
87%
14%
14%
11%
8%
11%
12%
10%
8%
14%
8%
7%
5%
10%
10%
8%
5%
5,462
25,158
558
1,122
49,529
12,221
1,871
3,272Others
Father Only
Mother Only
Both Parents
Others
Father Only
Mother Only
Tw o Parents
Gr.
9-1
2G
r. 7
-8
All the Time/Often Sometimes Rarely/Never Total
Figure 41: Feeling Comfortable with School Adults - by Parent Presence at Home
66%
71%
70%
77%
82%
78%
84%
90%
20%
21%
22%
18%
11%
17%
12%
8%
14%
8%
8%
5%
6%
5%
4%
2%
2,501
11,910
249
577
23,894
5,781
879
1,580Others
Father Only
Mother Only
Both Parents
Others
Father Only
Mother Only
Tw o Parents
Gr.
9-1
2G
r. 7
-8
All the Time/Often Sometimes Rarely/Never Total
There are small differences in students’ experiences on school safety (see Figure 42) and on
viewing schools as inclusive places to learn (see Figure 43).
Figure 42: Feeling Safe at School - by Parent Presence at Home
71%
79%
81%
83%
77%
84%
81%
86%
18%
15%
14%
13%
14%
10%
13%
11%
11%
6%
5%
5%
9%
6%
5%
4%
1,592
945
6,094
24,674
506
293
12,780
2,819
Others
Father Only
Mother Only
Both Parents
Others
Father Only
Mother Only
Tw o Parents
Gr.
9-1
2G
r. 7
-8
All the Time/Often Sometimes Rarely/Never Total
Figure 43: Viewing School As An Inclusive Place to Learn - by Parent Presence at Home
42%
36%
37%
40%
44%
38%
40%
41%
36%
47%
45%
45%
39%
40%
43%
43%
22%
17%
18%
15%
17%
22%
16%
17%
2,273
10,745
241
405
21,063
5,094
776
1,286Others
Father Only
Mother Only
Both Parents
Others
Father Only
Mother Only
Tw o Parents
Gr.
9-1
2G
r. 7
-8
All the Time/Often Sometimes Rarely/Never Total
R04(DemographicData\2009-2010\SchoolExperiences\StudentCensusReport-SchoolExperiencesFinal)sz.3457 20

School Experiences by Parent Education
In the 2006 Student Census, students were also asked to identify the education levels of their
mothers and fathers. About 39% of the Grade 7-8 students and 24% of the Grade 9-12 students
chose “Don’t Know’ in their responses to the two survey questions. Therefore, the following
results should be treated with caution. In this report, mother’s and father’s education levels were
combined into parent education by taking the higher education level of the parents2.
Parent education seems to have less impact on students’ satisfaction with overall school
environment (see Figure 44), but has a significant impact on students’ class participation: the
higher the parent’s education, the higher proportion of students participated in class (see Figure
45).
Figure 44: Feeling Comfortable with Overall School Environment - by Parent Education
62%
66%
67%
72%
77%
79%
79%
82%
27%
26%
25%
22%
17%
16%
17%
14%
11%
8%
9%
7%
5%
5%
5%
4%
12,866
10,690
10,380
30,940
10,725
3,297
13,398
4,041
Don't Know
High School
College
University
Don't Know
High School
College
University
Gr.
9-1
2G
r. 7
-8
All the Time/Often Sometimes Rarely/Never Total
Figure 45: Feeling Comfortable Participating in Class - by Parent Education
50%
54%
61%
66%
59%
63%
70%
75%
33%
32%
29%
25%
28%
27%
21%
18%
17%
15%
10%
9%
13%
10%
9%
7%
6,509
5,499
5,343
15,702
5,451
1,697
6,852
2,137
Don't Know
High School
College
University
Don't Know
High School
College
University
Gr.
9-1
2G
r. 7
-8All the Time/Often Sometimes Rarely/Never Total
However, parent education seems to have less impact on the Grade 7-12 students’
relationships with other students, relationships with school adults, feeling safe at school, or
viewing schools as an inclusive place to learn (see Figures 46-49).
2 Parent presence at home was used to guide the calculation of parent education, i.e., if a student indicated he or she lives with both parents, both mother and father education levels were used to calculate parent education by taking the higher level. If a student indicated living with a single parent, the education level of the parent was used.
R04(DemographicData\2009-2010\SchoolExperiences\StudentCensusReport-SchoolExperiencesFinal)sz.3457 21

Figure 46: Feeling Comfortable with Other Students - by Parent Education
80%
82%
85%
88%
83%
83%
86%
88%
12%
10%
9%
7%
10%
10%
8%
7%
8%
7%
6%
5%
7%
7%
6%
5%
4,132
13,654
3,374
10,979
31,490
10,633
10,917
13,218Don't Know
High School
College
University
Don't Know
High School
College
University
Gr.
9-1
2G
r. 7
-8
All the Time/Often Sometimes Rarely/Never Total
Figure 47: Feeling Comfortable with School Adults - by Parent Education
72%
73%
75%
77%
88%
88%
86%
90%
20%
20%
19%
17%
9%
10%
11%
8%
8%
6%
6%
5%
3%
3%
3%
2%
1,895
6,487
1,611
5,196
15,214
5,085
5,181
6,334Don't Know
High School
College
University
Don't Know
High School
College
University
Gr.
9-1
2G
r. 7
-8
All the Time/Often Sometimes Rarely/Never Total
Figure 48: Feeling Safe at School - by Parent Education
76%
79%
82%
85%
81%
84%
85%
87%
17%
16%
14%
10%
14%
13%
11%
9%
8%
5%
5%
4%
5%
4%
4%
4%
2,155
6,904
1,710
5,529
15,682
5,347
5,464
6,520Don't Know
High School
College
University
Don't Know
High School
College
University
Gr.
9-1
2G
r. 7
-8
All the Time/Often Sometimes Rarely/Never Total
Figure 49: Viewing School As An Inclusive Place to Learn - by Parent Education
32%
42%
41%
41%
36%
41%
43%
43%
44%
45%
45%
45%
42%
44%
44%
42%
24%
13%
14%
14%
22%
14%
13%
15%
1,789
5,854
1,437
4,525
13,514
4,477
4,631
5,354Don't Know
High School
College
University
Don't Know
High School
College
University
Gr.
9-1
2G
r. 7
-8
All the Time/Often Sometimes Rarely/Never Total
School Experiences by Family Socio-economic Status
Family socio-economic status (SES), derived from students’ parents’ employment status and
occupations, employs the following five categories (for more details refer to Yau and O’Reilly’s
report, 2006):
Professional and senior management
Semi-professional and middle management
Skilled/semi-skilled clerical and trades
Unskilled clerical and trades
Non-remunerative
Figure 50 shows the Grade 7-12 students’ satisfaction on their overall school environment by
their family SES and Figure 51 shows their participation in class. One can see that the
differences among the five student groups are small or have no difference, indicating family
SES doesn’t have much influence on students’ overall school satisfaction. However, differences
do exist in students’ class participation: students from families with higher SES (professional
R04(DemographicData\2009-2010\SchoolExperiences\StudentCensusReport-SchoolExperiencesFinal)sz.3457 22

and senior management, and semi-professional and middle management) had higher proportion
of students indicating they participated in class all the time or often than students from families
of lower SES (skilled/semi-skilled clerical and trades, unskilled clerical and trades, and non-
remunerative).
Figure 50: Feeling Comfortable with Overall School Environment - by Family SES
69%
69%
69%
70%
74%
81%
81%
81%
24%
24%
24%
23%
21%
15%
14%
15%
16%
13%
7%
7%
7%
7%
6%
4%
5%
4%
5%
4%
79%
83% 6,011
6,913
6,648
3,203
800
13,553
14,683
11,282
5,215
1,356Non-Remunerative
Unskilled
Skilled
Semi-Professional
Professional
Non-remunerative
Unskilled
Skilled
Semi-Professional
Professional
Gr.
9-1
2G
r. 7
-8
All the Time/Often Sometimes Rarely/Never Total
Figure 51: Feeling Comfortable Participating in Class - by Family SES
60%
56%
57%
64%
69%
62%
65%
65%
29%
31%
30%
26%
23%
27%
24%
26%
20%
17%
11%
13%
13%
9%
8%
11%
11%
9%
8%
6%77%
73%
667
2,640
5,689
7,534
6,849
402
1,650
3,403
3,529
3,072
Non-Remunerative
Unskilled
Skilled
Semi-Professional
Professional
Non-Remunerative
Unskilled
Skilled
Semi-Professional
Professional
Gr.
9-1
2G
r. 7
-8
All the Time/Often Sometimes Rarely/Never Total
Family SES also plays a small role on students’ relationships with other students (see Figure
52), but has no impact on students’ relationships with school adults (see Figure 53).
Figure 52: Feeling Comfortable with Other Students - by Family SES
81%
83%
86%
88%
89%
82%
84%
86%
11%
10%
9%
8%
7%
10%
9%
9%
7%
6%
8%
7%
6%
5%
4%
8%
7%
5%
5%
4%
87%
90% 6,129
7,053
6,780
3,276
831
13,757
14,961
11,503
5,325
1,393Non-Remunerative
Unskilled
Skilled
Semi-Professional
Professional
Non-Remunerative
Unskilled
Skilled
Semi-Professional
Professional
Gr.
9-1
2G
r. 7
-8
All the Time/Often Sometimes Rarely/Never Total
Figure 53: Feeling Comfortable with School Adults - by Family SES
75%
76%
78%
76%
79%
88%
89%
89%
19%
19%
17%
18%
16%
8%
9%
8%
9%
8%
6%
5%
5%
5%
4%
3%
2%
2%
2%
2%
89%
91% 2,923
3,356
3,204
1,545
405
6,693
7,199
5,629
2,576
672Non-Remunerative
Unskilled
Skilled
Semi-Professional
Professional
Non-Remunerative
Unskilled
Skilled
Semi-Professional
Professional
Gr.
9-1
2G
r. 7
-8
All the Time/Often Sometimes Rarely/Never Total
For secondary students, family SES seems to have some impact on their experience in school
safety; for the Grade 7-8 students, the impact is less (see Figure 54).
Figure 54: Feeling Safe at School - by Family SES
77%
80%
81%
85%
88%
83%
83%
85%
17%
15%
14%
12%
9%
12%
12%
12%
10%
8%
6%
5%
5%
4%
3%
5%
5%
4%
3%
3%89%
86%
678
2,655
5,684
7,474
6,832
415
1,668
3,430
3,548
3,102
Non-Remunerative
Unskilled
Skilled
Semi-Professional
Professional
Non-Remunerative
Unskilled
Skilled
Semi-Professional
Professional
Gr.
9-1
2G
r. 7
-8
All the Time/Often Sometimes Rarely/Never Total
Figure 55: Viewing School As An Inclusive Place to Learn - by Family SES
44%
44%
40%
41%
40%
42%
46%
42%
42%
42%
45%
46%
47%
40%
41%
43%
44%
42%
14%
14%
15%
13%
13%
17%
13%
15%
16%
15%
40%
43% 2,649
3,029
2,876
1,373
331
6,017
6,569
4,864
2,229
553Non-Remunerative
Unskilled
Skilled
Semi-Professional
Professional
Non-Remunerative
Unskilled
Skilled
Semi-Professional
Professional
Gr.
9-1
2G
r. 7
-8
All the Time/Often Sometimes Rarely/Never Total
R04(DemographicData\2009-2010\SchoolExperiences\StudentCensusReport-SchoolExperiencesFinal)sz.3457 23

There is no clear relationship of students’ inclusive school experience with their family socio-
economic status (see Figure 55).
CORRELATION OF STUDENTS’ SCHOOL EXPERIENCES WITH ACHIEVEMENT
In this section, the Grade 7-8 students’ school experiences with the overall school environment,
class participation, relationships with other students, relationships with school adults, school
safety and inclusive school were examined with their academic achievement in Grades 7-8
report card marks for Reading, Writing, Mathematics, and Science. For the Grade 9-10
students, achievement results in final course marks in English and Mathematics, credit
accumulation, and the Ontario Secondary School Literacy Test (OSSLT), were linked to
students’ school experiences to investigate the correlation of the students’ school experience
with their achievement. In addition, students’ school attendance in the 2006-2007 school year
was used as an extra indicator to examine the impact of school experiences on student
learning.
Overall School Environment
Figures 56-59 show the Grade 7-8 students’ results on the 2006-2007 Term 3 report card
Reading, Writing, Mathematics, and Science, disaggregated by students’ experience on the
overall school environment. On the report card, Level 3 represents the provincial standard,
Level 2 means below the provincial standard but approaching standard, while Level 1 or below
means significantly below the provincial standard.
There are direct relationships between students’ experience with overall school environment
and their achievement in all four subjects: the more students feel comfortable with the overall
school environment, the higher the proportion of students meeting the provincial standard (Level
3 or above). For students who indicated that they rarely or never feel comfortable with the
overall school environment, significant proportions of them were at-risk, i.e., achieved Level 1 or
below: Reading (18%), Writing (19%), Mathematics (25%), and Science (30%).
Figure 56: Correlation of Grade 7-8 Students' School Experience with Reading Results
52%
59%
69%
30%
28%
22%
18%
13%
9%
1,437
4,671
24,010
Rarely/Never
Sometimes
All the Time/Often
Level 3 & 4 Level 2 Level 1 & Below TotalComfortable w ith Overall School Environment:
Figure 57: Correlation of Grade 7-8 Students' School Experience with Writing Results
49%
58%
68%
32%
27%
22%
19%
15%
10% 23,998
4,670
1,435Rarely/Never
Sometimes
All the Time/Often
Level 3 & 4 Level 2 Level 1 & Below TotalComfortable w ith Overall School Environment:
R04(DemographicData\2009-2010\SchoolExperiences\StudentCensusReport-SchoolExperiencesFinal)sz.3457 24

Figure 58: Correlation of Grade 7-8 Students' School Experience with Mathematics Results
49%
58%
67%
25%
23%
20%
25%
19%
13%
1,443
4,675
24,044
Rarely/Never
Sometimes
All the Time/Often
Level 3 & 4 Level 2 Level 1 & Below TotalComfortable w ith Overall School Environment:
Figure 59: Correlation of Grade 7-8 Students' School Experience with Science Results
43%
54%
65%
27%
25%
21%
30%
21%
15% 23,891
4,629
1,425Rarely/Never
Sometimes
All the Time/Often
Level 3 & 4 Level 2 Level 1 & Below TotalComfortable w ith Overall School Environment:
Similar patterns exist in the English and Mathematics course marks for the Grade 9-10 students
(see Figures 60 and 61). For students who took the English as a Second Language (ESL) or
English Literacy Development (ELD) course during the school year, their marks were not
disaggregated by levels.
Figure 60: Correlation of Gr. 9-10 Students' School Experience with English Marks
39%
50%
60%
28%
25%
20%
29%
20%
14%
4%
5%
6%
1,801
5,780
20,909
Rarely/Never
Sometimes
All the Time/Often
Level 3 & 4 Level 2Level 1 & Below ESL/ELD
TotalComfortable w ith Overall School Environment:
Figure 61: Correlation of Gr. 9-10 Students' School Experience with Mathematics Marks
33%
42%
52%
26%
25%
23%
40%
33%
25% 20,909
5,780
1,801Rarely/Never
Sometimes
All the Time/Often
Level 3 & 4 Level 2 Level 1 & Below TotalComfortable w ith Overall School Environment:
Figure 62 shows the Grade 9-10 students’ credit accumulation by the end of the school year,
including summer school. Students earning six or fewer credits by the end of Grade 9, or
earning fourteen or fewer credits by the end of Grade 10, were considered at-risk (students
normally earn eight credits per school year). Figure 63 shows the Grade 10 students’ outcomes
from the 2006-2007 Ontario Secondary School Literacy Test (OSSLT), a requirement of the
Ontario Secondary School Diploma (OSSD).
Figure 62: Correlation of Grade 9-10 Students' School Experience with Credit Accumulation
69%
80%
89%
31%
20%
11%
1,801
5,780
20,909
Rarely/Never
Sometimes
All the Time/Often
Moderate-Low Risk Highly At Risk TotalComfortable w ith Overall School Environment:
Figure 63: Correlation of Grade 10 Students' School Experience with OSSLT Outcome
71%
79%
83%
29%
21%
17% 9,325
3,125
985Rarely/Never
Sometimes
All the Time/Often
Successful Other students TotalComfortable w ith Overall School Environment:
Similar to the other findings, students who feel comfortable with the overall school environment
all the time or often tend to have a much better chance of accumulating enough credits and of
passing the OSSLT, than students who claimed they rarely or never enjoy school.
R04(DemographicData\2009-2010\SchoolExperiences\StudentCensusReport-SchoolExperiencesFinal)sz.3457 25

Figures 64 and 65 show the Grade 7-8 and Grade 9-10 students’ school attendance by their
experience with their overall school environment. In this report, student’s annual school
attendance rate is defined as number of days attending school divided by the total number of
school days during the school year. For students who moved in or out during the school year,
their attendance rates were adjusted based on their entry and exit dates.
Figure 64: Correlation of Grade 7-8 Students' School Experience with School Attendance
46%
54%
62%
42%
38%
33%
13%
8%
5% 24,802
4,862
1,514Rarely/Never
Sometimes
All the Time/Often
96-100% 86-95% 0-85% TotalComfortable w ith Overall School Environment:
Figure 65: Correlation of Gr. 9-10 Students' School Experience with School Attendance
51%
59%
69%
33%
31%
26%
16%
10%
5%
1,801
5,780
20,909
Rarely/Never
Sometimes
All the Time/Often
96-100% 86-95% 0-85% TotalComfortable w ith Overall School Environment:
Students who indicated they feel comfortable with the overall school environment tend to attend
school more than students feeling comfortable sometimes, and students rarely or never feeling
comfortable: in Grades 7-8, 62% of students attended 96% or more school days, compared with
46% of students who claimed they rarely or never enjoy school. In Grades 9-10, the difference
between the two groups is 18% (69% vs. 51%).
Class Participation
Grade 7-8 students feeling comfortable participating in class all the time or often tend to have
higher achievement results in the four subject areas of Reading, Writing, Mathematics, and
Science in report card (see Figures 66-69). For students who indicated they rarely or never feel
comfortable participating in class discussions and activities, about half of them achieved the
provincial standards, and a much higher proportion of these students achieved Level 1 or below:
16% in Reading, 17% in Writing, 24% in Mathematics, and 26% in Science.
Figure 66: Correlation of Grade 7-8 Students' Class Participation with Reading Results
52%
60%
71%
31%
28%
21%
16%
12%
8%
1,442
3,550
10,413
Rarely/Never
Sometimes
All the Time/Often
Level 3 & 4 Level 2 Level 1 & Below TotalComfortable Participating in Class:
Figure 67: Correlation of Grade 7-8 Students' Class Participation with Writing Results
52%
59%
70%
32%
28%
21%
17%
13%
9% 10,411
3,548
1,438Rarely/Never
Sometimes
All the Time/Often
Level 3 & 4 Level 2 Level 1 & Below TotalComfortable Participating in Class:
R04(DemographicData\2009-2010\SchoolExperiences\StudentCensusReport-SchoolExperiencesFinal)sz.3457 26

Figure 68: Correlation of Grade 7-8 Students' Class Participation with Mathematics Results
50%
58%
70%
26%
24%
19%
24%
18%
11%
1,450
3,558
10,431
Rarely/Never
Sometimes
All the Time/Often
Level 3 & 4 Level 2 Level 1 & Below TotalComfortable Participating in Class:
Figure 69: Correlation of Grade 7-8 Students' Class Participation with Science Results
46%
55%
66%
28%
24%
20%
26%
20%
14% 10,365
3,532
1,431Rarely/Never
Sometimes
All the Time/Often
Level 3 & 4 Level 2 Level 1 & Below TotalComfortable Participating in Class:
Similar patterns have been observed in Grade 9-10 English and Mathematics (see Figures 70-
71), credit accumulation (see Figure 72), and in the OSSLT (see Figure 73).
Figure 70: Correlation of Gr. 9-10 Students' Class Participation with English Marks
46%
52%
61%
26%
23%
20%
22%
17%
14%
6%
7%
5% 9,067
3,945
1,468Rarely/Never
Sometimes
All the Time/Often
Level 3 & 4 Level 2Level 1 & Below ESL/ELD
TotalComfortable Participating in Class:
Figure 71: Correlation of Gr. 9-10 Students' Class Participation with Mathematics Marks
43%
45%
52%
24%
25%
23%
33%
30%
25%
1,468
3,945
9,067
Rarely/Never
Sometimes
All the Time/Often
Level 3 & 4 Level 2 Level 1 & Below TotalComfortable Participating in Class:
Figure 72: Correlation of Gr. 9-10 Students' Class Participation with Credit Accumulation
77%
83%
88%
23%
17%
12% 9,067
3,945
1,468Rarely/Never
Sometimes
All the Time/Often
Moderate-Low Risk Highly At Risk TotalComfortable Participating in Class:
Figure 73: Correlation of Grade 10 Students' Class Participation with OSSLT Outcome
73%
77%
84%
27%
23%
16%
748
1,956
4,124
Rarely/Never
Sometimes
All the Time/Often
Successful Other students TotalComfortable Participating in Class:
Figures 74-75 show the Grade 7-10 students’ school attendance in the 2006-2007 school year,
disaggregated by their school experience in class participation. Interestingly, students’ class
participation had less influence on their school attendance than on their academic achievement.
Figure 74: Correlation of Grade 7-8 Students' Class Participation with School Attendance
56%
61%
60%
34%
33%
35%
9%
7%
5% 10,766
3,685
1,508Rarely/Never
Sometimes
All the Time/Often
96-100% 86-95% 0-85% TotalComfortable Participating in Class:
Figure 75: Correlation of Gr. 9-10 Students' Class Participation with School Attendance
61%
66%
66%
29%
27%
28%
10%
7%
6% 9,067
3,945
1,468Rarely/Never
Sometimes
All the Time/Often
96-100% 86-95% 0-85% TotalComfortable Participating in Class:
R04(DemographicData\2009-2010\SchoolExperiences\StudentCensusReport-SchoolExperiencesFinal)sz.3457 27

Relationships with Other Students
Figures 76-79 show the Grade 7-8 students’ results on the 2006-2007 Term 3 report card
Reading, Writing, Mathematics, and Science, disaggregated by students’ experience with other
students in school. For Grade 7-8 students who get along well with other students, about two
thirds of them achieved Level 3 or 4 in the four subject areas, compared with about one half of
students who reported they rarely or never feel comfortable with other students (on the other
hand, a much higher proportion of these students achieved Level 1 or below).
Figure 76: Correlation of Grade 7-8 Students' Peer Relationships with Reading Results
50%
58%
68%
33%
30%
22%
17%
13%
10% 26,480
2,538
1,737Rarely/Never
Sometimes
All the Time/Often
Level 3 & 4 Level 2 Level 1 & Below TotalComfortable w ith Other Students:
Figure 77: Correlation of Grade 7-8 Students' Peer Relationships with Writing Results
48%
57%
68%
33%
28%
22%
19%
14%
10%
1,732
2,538
26,469
Rarely/Never
Sometimes
All the Time/Often
Level 3 & 4 Level 2 Level 1 & Below TotalComfortable w ith Other Students:
Figure 78: Correlation of Grade 7-8 Students' Peer Relationships with Mathematics Results
51%
57%
66%
26%
24%
20%
23%
19%
14%
1,745
2,545
26,508
Rarely/Never
Sometimes
All the Time/Often
Level 3 & 4 Level 2 Level 1 & Below TotalComfortable w ith Other Students:
Figure 79: Correlation of Grade 7-8 Students' Peer Relationships with Science Results
45%
53%
64%
28%
24%
21%
27%
24%
15%
1,708
2,514
26,357
Rarely/Never
Sometimes
All the Time/Often
Level 3 & 4 Level 2 Level 1 & Below TotalComfortable w ith Other Students:
Similar patterns were observed for the Grade 9-10 students (see Figures 80-83). The
achievement gaps in English and Mathematics are 17% and 12% in Levels 3 and 4 between
students feeling comfortable with other students all the time or often and students who rarely or
never feel comfortable with other students. In credit accumulation, 14% more were highly at-risk
for students rarely or never feeling comfortable with other students. In OSSLT, the gap for the
two groups is 18% in passing the provincial literacy test for the first time.
Figure 80: Correlation of Gr. 9-10 Students' Peer Relationships with English Marks
41%
45%
58%
25%
22%
21%
23%
21%
15%
11%
11%
5% 25,350
2,343
1,434Rarely/Never
Sometimes
All the Time/Often
Level 3 & 4 Level 2Level 1 & Below ESL/ELD
TotalComfortable w ith Other Students:
Figure 81: Correlation of Gr. 9-10 Students' Peer Relationships with Mathematics Marks
38%
43%
50%
25%
25%
23%
37%
32%
27%
1,434
2,343
25,350
Rarely/Never
Sometimes
All the Time/Often
Level 3 & 4 Level 2 Level 1 & Below TotalComfortable w ith Other Students:
R04(DemographicData\2009-2010\SchoolExperiences\StudentCensusReport-SchoolExperiencesFinal)sz.3457 28

Figure 82: Correlation of Gr. 9-10 Students' Peer Relationships with Credit Accumulation
73%
77%
87%
27%
23%
13% 25,350
2,343
1,434Rarely/Never
Sometimes
All the Time/Often
Moderate-Low Risk Highly At Risk TotalComfortable w ith Other Students:
Figure 83: Correlation of Grade 10 Students' Peer Relationships with OSSLT Outcome
65%
71%
83%
35%
29%
17%
717
1,159
11,825
Rarely/Never
Sometimes
All the Time/Often
Successful Other students TotalComfortable w ith Other Students:
Relationships with other students also had some impact on the Grade 7-10 students’ school
attendance. About 10% more students attended 96% or more school days when they always
feel comfortable with other students than students who indicated they rarely or never feel
comfortable with other students (see Figures 84-85).
Figure 84: Correlation of Grade 7-8 Students' Peer Relationships with School Attendance
51%
57%
61%
38%
36%
34%
12%
7%
5%
1,839
2,644
27,363
Rarely/Never
Sometimes
All the Time/Often
96-100% 86-95% 0-85% TotalComfortable w ith Other Students:
Figure 85: Correlation of Gr. 9-10 Students' Peer Relationships with School Attendance
56%
62%
67%
31%
28%
27%
13%
10%
6%
1,434
2,343
25,350
Rarely/Never
Sometimes
All the Time/Often
96-100% 86-95% 0-85% TotalComfortable w ith Other Students:
Relationships with School Adults
The majority (89%) of the Grade 7-8 students indicated that they feel comfortable with school
adults, 9% said they sometimes feel comfortable with school adults, and 1% said they rarely or
never feel comfortable with school adults. There is a clear achievement pattern for the three
student groups – less than half of the students who do not feel comfortable with school adults
achieved Level 3 or 4 on their report card for Reading, Writing, Mathematics, or Science. For
students who feel comfortable all the time or often, about two thirds of them achieved at or
above the provincial standard in the four subject areas in the 2006-2007 school year (see
Figures 86-89).
Figure 86: Correlation of Grade 7-8 Students' Relationships with School Adults
and Reading Results
47%
56%
69%
29%
28%
22%
24%
16%
9%
364
1,291
12,924
Rarely/Never
Sometimes
All the Time/Often
Level 3 & 4 Level 2 Level 1 & Below TotalComfortable w ith School Adults:
Figure 87: Correlation of Grade 7-8 Students' Relationships with School Adults
and Writing Results
46%
55%
68%
32%
29%
22%
22%
17%
10% 12,920
1,291
364Rarely/Never
Sometimes
All the Time/Often
Level 3 & 4 Level 2 Level 1 & Below TotalComfortable w ith School Adults:
R04(DemographicData\2009-2010\SchoolExperiences\StudentCensusReport-SchoolExperiencesFinal)sz.3457 29

Figure 88: Correlation of Grade 7-8 Students' Relationships with School Adults
and Mathematics Results
44%
55%
67%
28%
23%
20%
29%
22%
14% 12,938
1,289
367Rarely/Never
Sometimes
All the Time/Often
Level 3 & 4 Level 2 Level 1 & Below TotalComfortable w ith School Adults:
Figure 89: Correlation of Grade 7-8 Students' Relationships with School Adults
and Science Results
37%
51%
64%
30%
23%
21%
33%
26%
15% 12,850
1,278
361Rarely/Never
Sometimes
All the Time/Often
Level 3 & 4 Level 2 Level 1 & Below TotalComfortable w ith School Adults:
Similar or wider achievement gaps existed for the Grade 9-10 students: 25% and 23% more
students achieved Level 3 or 4 in the English and Mathematics courses if they fell into the
category of always feeling comfortable with school adults in comparison to those who fell into
the category of rarely or never feeling comfortable with school adults. In terms of credit
accumulation, nearly one third (31%) were highly at-risk amongst the students feeling
uncomfortable with school adults, and 28% of them failed the OSSLT for the first time (see
Figures 90-93).
Figure 90: Correlation of Gr. 9-10 Students' Relationships with School Adults
and English Marks
35%
50%
60%
32%
23%
20%
28%
21%
14%
5%
6%
6%
632
2,208
11,172
Rarely/Never
Sometimes
All the Time/Often
Level 3 & 4 Level 2Level 1 & Below ESL/ELD
TotalComfortable w ith School Adults:
Figure 91: Correlation of Gr. 9-10 Students' Relationships with School Adults
and Mathematics Marks
30%
40%
53%
28%
26%
22%
43%
34%
25% 11,172
2,208
632Rarely/Never
Sometimes
All the Time/Often
Level 3 & 4 Level 2 Level 1 & Below TotalComfortable w ith School Adults:
Figure 92: Correlation of Gr. 9-10 Students' Relationships with School Adults
and Credit Accumulation
69%
79%
88%
31%
21%
12%
632
2,208
11,172
Rarely/Never
Sometimes
All the Time/Often
Moderate-Low Risk Highly At Risk TotalComfortable w ith School Adults:
Figure 93: Correlation of Grade 10 Students' Relationships with School Adults
and OSSLT Outcome
72%
80%
83%
28%
20%
17% 5,014
1,235
376Rarely/Never
Sometimes
All the Time/Often
Successful Other students TotalComfortable w ith School Adults:
R04(DemographicData\2009-2010\SchoolExperiences\StudentCensusReport-SchoolExperiencesFinal)sz.3457 30
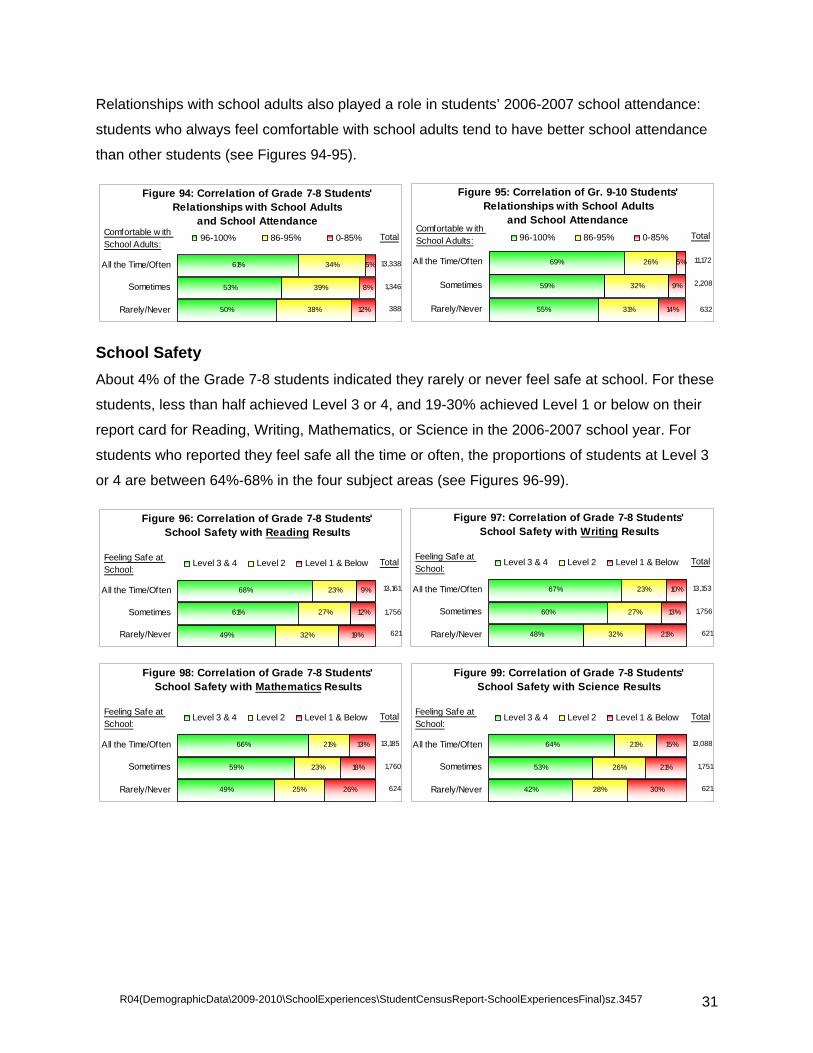
Relationships with school adults also played a role in students’ 2006-2007 school attendance:
students who always feel comfortable with school adults tend to have better school attendance
than other students (see Figures 94-95).
Figure 94: Correlation of Grade 7-8 Students' Relationships with School Adults
and School Attendance
50%
53%
61%
38%
39%
34%
12%
8%
5% 13,338
1,346
388Rarely/Never
Sometimes
All the Time/Often
96-100% 86-95% 0-85% TotalComfortable w ith School Adults:
Figure 95: Correlation of Gr. 9-10 Students' Relationships with School Adults
and School Attendance
55%
59%
69%
31%
32%
26%
14%
9%
5%
632
2,208
11,172
Rarely/Never
Sometimes
All the Time/Often
96-100% 86-95% 0-85% TotalComfortable w ith School Adults:
School Safety
About 4% of the Grade 7-8 students indicated they rarely or never feel safe at school. For these
students, less than half achieved Level 3 or 4, and 19-30% achieved Level 1 or below on their
report card for Reading, Writing, Mathematics, or Science in the 2006-2007 school year. For
students who reported they feel safe all the time or often, the proportions of students at Level 3
or 4 are between 64%-68% in the four subject areas (see Figures 96-99).
Figure 96: Correlation of Grade 7-8 Students' School Safety with Reading Results
49%
61%
68%
32%
27%
23%
19%
12%
9%
621
1,756
13,161
Rarely/Never
Sometimes
All the Time/Often
Level 3 & 4 Level 2 Level 1 & Below TotalFeeling Safe at School:
Figure 97: Correlation of Grade 7-8 Students' School Safety with Writing Results
48%
60%
67%
32%
27%
23%
21%
13%
10% 13,153
1,756
621Rarely/Never
Sometimes
All the Time/Often
Level 3 & 4 Level 2 Level 1 & Below TotalFeeling Safe at School:
Figure 98: Correlation of Grade 7-8 Students' School Safety with Mathematics Results
49%
59%
66%
25%
23%
21%
26%
18%
13% 13,185
1,760
624Rarely/Never
Sometimes
All the Time/Often
Level 3 & 4 Level 2 Level 1 & Below TotalFeeling Safe at School:
Figure 99: Correlation of Grade 7-8 Students' School Safety with Science Results
42%
53%
64%
28%
26%
21%
30%
21%
15% 13,088
1,751
621Rarely/Never
Sometimes
All the Time/Often
Level 3 & 4 Level 2 Level 1 & Below TotalFeeling Safe at School:
R04(DemographicData\2009-2010\SchoolExperiences\StudentCensusReport-SchoolExperiencesFinal)sz.3457 31
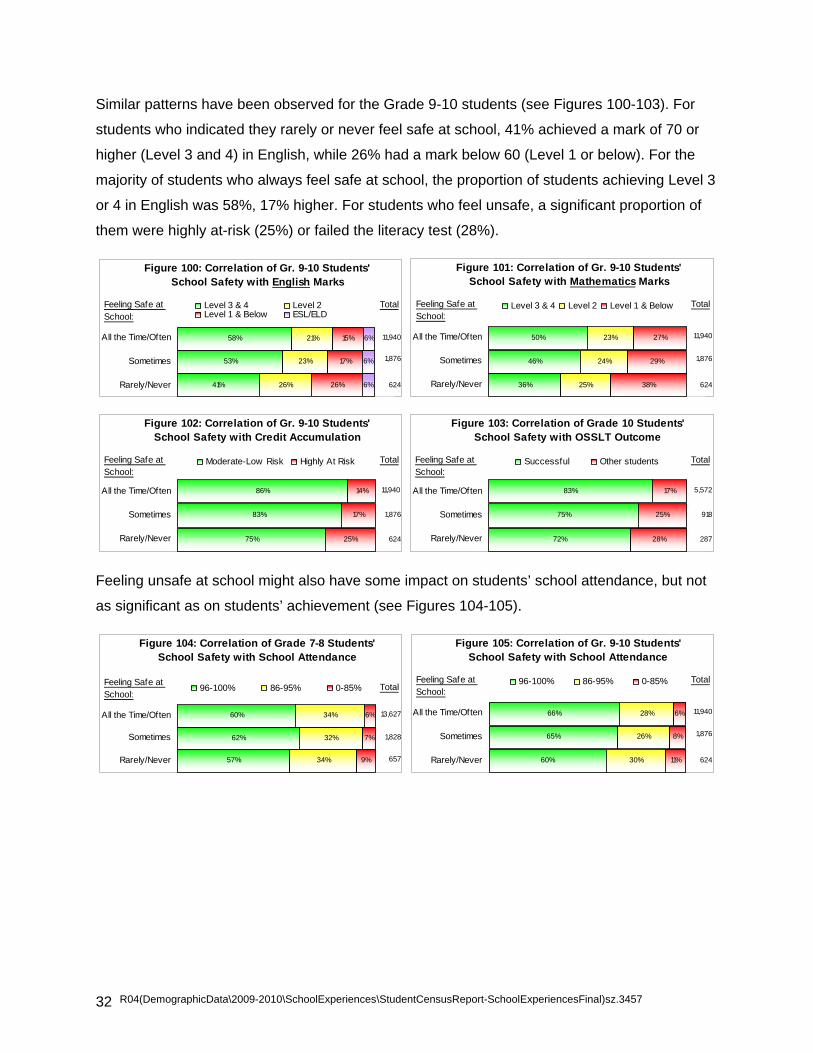
Similar patterns have been observed for the Grade 9-10 students (see Figures 100-103). For
students who indicated they rarely or never feel safe at school, 41% achieved a mark of 70 or
higher (Level 3 and 4) in English, while 26% had a mark below 60 (Level 1 or below). For the
majority of students who always feel safe at school, the proportion of students achieving Level 3
or 4 in English was 58%, 17% higher. For students who feel unsafe, a significant proportion of
them were highly at-risk (25%) or failed the literacy test (28%).
Figure 100: Correlation of Gr. 9-10 Students' School Safety with English Marks
41%
53%
58%
26%
23%
21%
26%
17%
15%
6%
6%
6% 11,940
1,876
624Rarely/Never
Sometimes
All the Time/Often
Level 3 & 4 Level 2Level 1 & Below ESL/ELD
TotalFeeling Safe at School:
Figure 101: Correlation of Gr. 9-10 Students' School Safety with Mathematics Marks
36%
46%
50%
25%
24%
23%
38%
29%
27%
624
1,876
11,940
Rarely/Never
Sometimes
All the Time/Often
Level 3 & 4 Level 2 Level 1 & Below TotalFeeling Safe at School:
Figure 102: Correlation of Gr. 9-10 Students' School Safety with Credit Accumulation
75%
83%
86%
25%
17%
14%
624
1,876
11,940
Rarely/Never
Sometimes
All the Time/Often
Moderate-Low Risk Highly At Risk TotalFeeling Safe at School:
Figure 103: Correlation of Grade 10 Students' School Safety with OSSLT Outcome
72%
75%
83%
28%
25%
17% 5,572
918
287Rarely/Never
Sometimes
All the Time/Often
Successful Other students TotalFeeling Safe at School:
Feeling unsafe at school might also have some impact on students’ school attendance, but not
as significant as on students’ achievement (see Figures 104-105).
Figure 104: Correlation of Grade 7-8 Students' School Safety with School Attendance
57%
62%
60%
34%
32%
34%
9%
7%
6% 13,627
1,828
657Rarely/Never
Sometimes
All the Time/Often
96-100% 86-95% 0-85% TotalFeeling Safe at School:
Figure 105: Correlation of Gr. 9-10 Students' School Safety with School Attendance
60%
65%
66%
30%
26%
28%
11%
8%
6% 11,940
1,876
624Rarely/Never
Sometimes
All the Time/Often
96-100% 86-95% 0-85% TotalFeeling Safe at School:
R04(DemographicData\2009-2010\SchoolExperiences\StudentCensusReport-SchoolExperiencesFinal)sz.3457 32

Inclusive School Experience
Figures 106-109 show the Grade 7-8 students’ results on the 2006-2007 Term 3 report card
marks of Reading, Writing, Mathematics, and Science, disaggregated by students’ inclusive
school experience. One can see that students’ inclusive school experience had little or no
impact on student achievement in Grades 7-8.
Figure 106: Correlation of Grade 7-8 Students' Inclusive School Experience
with Reading Results
66%
69%
67%
24%
22%
23%
10%
9%
10% 5,262
5,545
2,166Rarely/Never
Sometimes
All the Time/Often
Level 3 & 4 Level 2 Level 1 & Below TotalView ing School As An Inclusive Place to Learn:
Figure 107: Correlation of Grade 7-8 Students' Inclusive School Experience
with Writing Results
65%
69%
66%
24%
21%
24%
11%
10%
11%
2,166
5,544
5,260
Rarely/Never
Sometimes
All the Time/Often
Level 3 & 4 Level 2 Level 1 & Below TotalView ing School As An Inclusive Place to Learn:
Figure 108: Correlation of Grade 7-8 Students' Inclusive School Experience
with Mathematics Results
67%
67%
65%
20%
20%
21%
13%
13%
14%
2,172
5,553
5,274
Rarely/Never
Sometimes
All the Time/Often
Level 3 & 4 Level 2 Level 1 & Below TotalView ing School As An Inclusive Place to Learn:
Figure 109: Correlation of Grade 7-8 Students' Inclusive School Experience
with Science Results
62%
64%
62%
23%
20%
22%
15%
16%
16%
2,159
5,518
5,234
Rarely/Never
Sometimes
All the Time/Often
Level 3 & 4 Level 2 Level 1 & Below TotalView ing School As An Inclusive Place to Learn:
Similarly, the Grade 9-10 students’ inclusive school experience had little or no impact on student
achievement results in English, Mathematics, credit accumulation, or the Ontario Secondary
School Literacy Test (see Figures 110-113).
Figure 110: Correlation of Gr. 9-10 Students' Inclusive School Experiencee
with English Marks
55%
61%
58%
23%
21%
20%
18%
14%
15%
4%
4%
7%
2,238
5,507
4,385
Rarely/Never
Sometimes
All the Time/Often
Level 3 & 4 Level 2Level 1 & Below ESL/ELD
Total
View ing School As An Inclusive Place to Learn:
Figure 111: Correlation of Gr. 9-10 Students' Inclusive School Experience
with Mathematics Marks
48%
51%
51%
24%
24%
22%
28%
25%
27% 4,385
5,507
2,238Rarely/Never
Sometimes
All the Time/Often
Level 3 & 4 Level 2 Level 1 & Below Total
View ing School As An Inclusive Place to Learn:
Figure 112: Correlation of G. 9-10 Students' Inclusive School Experience
with Credit Accumulation
83%
87%
87%
17%
13%
13% 4,385
5,507
2,238Rarely/Never
Sometimes
All the Time/Often
Moderate-Low Risk Highly At Risk Total
View ing School As An Inclusive Place to Learn:
Figure 113: Correlation of Grade 10 Students' Inclusive School Experience
with OSSLT Outcome
81%
86%
80%
19%
14%
20% 2,181
2,739
909Rarely/Never
Sometimes
All the Time/Often
Successful Other students Total
View ing School As An Inclusive Place to Learn:
R04(DemographicData\2009-2010\SchoolExperiences\StudentCensusReport-SchoolExperiencesFinal)sz.3457 33

Finally, it seems students’ inclusive school experiences had some connection with the Grade 9-
10 students’ school attendance in the 2006-2007 school year, but not for the Grade 7-8 students
(see Figures 114-115).
Figure 114: Correlation of Grade 7-8 Students' Inclusive School Experience
with School Attendance
61%
60%
60%
32%
35%
33%
7%
5%
6%
2,237
5,748
5,445
Rarely/Never
Sometimes
All the Time/Often
96-100% 86-95% 0-85% TotalView ing School As An Inclusive Place to Learn:
Figure 115: Correlation of Gr. 9-10 Students' Inclusive School Experience
with School Attendance
63%
66%
68%
30%
27%
26%
7%
6%
6% 4,385
5,507
2,238Rarely/Never
Sometimes
All the Time/Often
96-100% 86-95% 0-85% Total
View ing School As An Inclusive Place to Learn:
SUMMARY OF FINDINGS
The Toronto District School Board (TDSB) Student Census, conducted with the Grade 7-12
students in the Fall 2006, has provided the Board a unique opportunity to collect student
demographic and school experience data. Two TDSB research reports, by Yau and O’Reilly
(2007), and Brown and Sinay (2008), have provided detailed analyses of the demographic
characteristics and school experiences of the TDSB Grade 7-12 students, and of the impact of
student demographics on their academic achievement. As recommended by both reports, this
report addressed students’ school experiences by their demographic backgrounds, and the
impact of school experiences on students’ academic achievement.
The responses to the original Student Census survey questions related to school experiences
have been statistically combined into six major categories based on their correlations: overall
school environment, class participation, relationships with other students, relationships with
school adults, school safety, and inclusive school experience. Students’ school experiences in
these six areas then have been closely examined by student grade, program of study in Grade
9 and 10, student gender, racial background, birth place, parent presence at home, parent
education, and family socio-economic status (SES). Grade 7-8 students’ achievement results in
report card marks of Reading, Writing, Mathematics, and Science, and Grade 9-10 students’
final course marks in English and Mathematics, accumulated credits by the end of Grade 9 and
10, and their outcomes on the Ontario Secondary School Literacy Test (OSSLT), were linked to
students’ school experiences to investigate the impacts of students’ school experiences on their
academic achievement. In addition, the Grade 7-10 students’ school attendance in the 2006-
2007 school year was examined by their school experiences.
R04(DemographicData\2009-2010\SchoolExperiences\StudentCensusReport-SchoolExperiencesFinal)sz.3457 34

School Experience by Student Grade
Although the majority of Grade 7-12 students indicated they feel comfortable with the overall
school environment and with participating in class, the overall school satisfaction varied by
student grades: the lower the grade, the more students enjoy school and participate in class all
the time or often. However, student grade or age is not a factor by which students define their
relationships with other students in school. With regards to their relationships with school adults,
there are higher proportions of younger students than older students (90% in Grade 7 and 72%
in Grade 11/12) who indicated they feel comfortable with schools adults. Although more than
80% of students, regardless of their grade levels, indicated they feel safe at school all the time
or often, a notable proportion of students (4-6%) reported they rarely or never feel safe in
schools. Students’ inclusive school experience is not affected by their grade levels.
School Experience by Program of Study
There are more Grade 9-10 students in the Academic program feeling comfortable with the
overall school environment and with participating in class than in the Applied or Locally-
developed programs. The proportion of school-disengaged students in the Applied and Locally-
developed programs are double or more than students in the Academic program. Students in
the Academic program had higher proportions of students feeling comfortable with other
students and school adults, and feeling safe at school than students in the Applied or Locally-
developed programs. There is no big difference by program of study in terms of students’
inclusive school experience, although the proportion of students who disagreed that schools are
inclusive are higher for students in the Applied and Locally-developed programs than for
students in the Academic program.
School Experience by Student Gender
While the majority of students indicated they feel comfortable with their overall school
environment, female students had a higher proportion (5-6% higher) than male students. In
terms of class participation, more male students (7-8% higher than female students) in both
Grades 7-8 and Grades 9-12 indicated that they participate in class all the time or often. There
is no gender difference with regard to students’ relationships with other students and feeling
safe at school. There is a very small gender difference (2-5% more female students) in
students’ relationships with school adults and in viewing school as an inclusive place to learn.
R04(DemographicData\2009-2010\SchoolExperiences\StudentCensusReport-SchoolExperiencesFinal)sz.3457 35

School Experience by Student Racial Background
South Asian students, in both the elementary and secondary panels, had the highest proportion
indicating they enjoy school, followed by Middle Eastern students. Black, Latin, and Mixed
students had the lowest proportions, with East Asian, White, and Southeast Asian students in
between. White students had the highest proportion feeling comfortable participating in class all
the time or often, followed by Middle Eastern and South Asian students. Only about half of the
Southeast Asian, East Asian, and Latin students (46%-57%) indicated they participate in class
all the time or often. With regard to student relationships with other students and with school
adults, the perceptions are not much different by student racial groups, although South Asian
students tend to have a slightly higher proportion feeling comfortable with other students and
with school adults. The majority of students indicated they feel safe at school all the time or
often, although Southeast Asian and Black students had slightly lower proportions feeling safe
at school than other racial groups. About one third of East Asian, Southeast Asian, and White
students in Grades 7-8 indicated they view school as an inclusive place to learn. For secondary,
Latin (34%), East Asian (36%), and White (37%) students had the lowest proportions indicating
they view school as an inclusive place to learn.
School Experience by Student Place of Birth
Approximately 5% more of students born outside Canada reported they feel comfortable with
the overall school environment in comparison to students born in Canada. In addition, 5% more
students in Grades 7-8 and 11% more students in Grades 9-12 viewed school as an inclusive
place to learn. There is not much difference with regards to class participation, relationships with
other students, relationships with school adults, and school safety.
School Experience by Sexual Orientation
Sixty-nine percent (69%) of heterosexual Grade 9-12 students indicated they feel comfortable
with the overall school environment all the time or often, compared with 52% of
Lesbian/Gay/Bisexual/Transgender/Queer (LGBTQ) students. There are also 12% more
LGBTQ students indicating they rarely or never feel comfortable with school. In terms of
relationships with other students and with school adults, 17% more heterosexual students
indicated they feel comfortable all the time or often than LGBTQ students. With regard to school
safety, 71% of LGBTQ students reported they feel safe at school all the time or often, which is
12% lower than heterosexual students. On the other hand, 10% more LGBTQ students
indicated they do not feel safe at school.
R04(DemographicData\2009-2010\SchoolExperiences\StudentCensusReport-SchoolExperiencesFinal)sz.3457 36

School Experience by Parent Presence at Home
Students living with both parents had a higher proportion feeling comfortable with the overall
school environment than students living with a single parent. For the Grade 7-8 students, the
differences are 8%-11%; for the Grade 9-12 students, the differences are 6%-8%. Students
living with both parents also tend to participate in class more and to have better relationships
with other students and with school adults than students living with a single parent or with
others.
School Experience by Parent Education
Parent education has less impact on students’ satisfaction with overall school environment than
on students’ class participation: the higher the parent education, the more students indicated
they feel comfortable participating in class all the time or often. Parent education also seems not
to have much influence on students’ relationships with other students or with school adults, or
on their perceptions of school safety and viewing school as an inclusive place to learn.
School Experience by Family SES
Family socio-economic status (SES), derived from student parents’ employment status and
occupations, has less influence on students’ overall school satisfaction than on students’ class
participation: more students from families with higher SES feel comfortable participating in class
all the time or often than students from families with lower SES. Family SES also plays some
role on students’ relationships with other students, but has no impact on students’ relationships
with school adults. There is no clear relationship of students’ inclusive school experience with
their family socio-economic status.
Overall School Environment and Academic Achievement
There are direct correlations between the Grade 7-8 students’ perception of overall school
environment with their academic achievement in all four subjects of Reading, Writing,
Mathematics, and Science in report card: the more students enjoying school, the higher
proportion of students meeting the provincial standard (Level 3 or above). For students who
indicated they rarely or never feel comfortable with the overall school environment, significant
proportions of them appeared to be at-risk (i.e., achieved Level 1 or below): Reading (18%),
Writing (19%), Mathematics (25%), and Science (30%). Similar patterns exist in English and
Mathematics course marks for the Grade 9-10 students. Also, students who feel comfortable
with the overall school environment tend to have a much better chance of accumulating enough
credits (seven or more credits by the end of Grade 9 and fifteen or more credits by the end of
R04(DemographicData\2009-2010\SchoolExperiences\StudentCensusReport-SchoolExperiencesFinal)sz.3457 37

Grade 10) and of passing the Ontario Secondary School Literacy Test (OSSLT) than students
not enjoying school. In addition, students who indicated they feel comfortable with the overall
school environment tend to attend school more than other students.
Class Participation and Academic Achievement
Grade 7-8 students who feel comfortable participating in class all the time or often tend to have
higher achievement results in the four subject areas than students not feeling comfortable
participating in class. For students who claimed they rarely or never feel comfortable
participating in class discussions and activities, only about half of them achieved the provincial
standards, and they represented a much higher proportion of students achieving Level 1 or
below: 16% in Reading, 17% in Writing, 24% in Mathematics, and 26% in Science. Similar
patterns have been observed in Grade 9-10 English and Mathematics, credit accumulation, and
the OSSLT. However, students’ class participation had little or no impact on their school
attendance.
Relationships with Other Students and Academic Achievement
For the Grade 7-8 students who get along well with other students, about two thirds of them had
achieved Level 3 or 4 in the four subject areas, compared with about one half of students who
reported they rarely or never feel comfortable with other students (on the other hand, a much
higher proportion of these students had achieved Level 1 or below). Similar patterns were
observed for the Grade 9-10 students. The achievement gaps in English and Mathematics are
17% and 12% in Levels 3 and 4 between students feeling comfortable with other students all the
time or often and students who rarely or never feel comfortable with other students. In credit
accumulation, 14% more of the students who rarely or never feel comfortable with other
students were highly at-risk in credit accumulation. In OSSLT, the gap for the two groups is 18%
in passing the provincial literacy test for the first time.
Relationships with School Adults and Academic Achievement
The majority (89%) of the Grade 7-8 students indicated that they feel comfortable with school
adults all the time or often, while 9% said sometimes, and 1% reported they rarely or never feel
comfortable. There are clear achievement gaps for the three student groups: less than half of
the students not feeling comfortable with school adults had achieved Level 3 or 4 in report card
marks of Reading, Writing, Mathematics, or Science; for students feeling comfortable all the
time or often, about two thirds of them achieved at or above the provincial standard in the four
subject areas in the 2006-2007 school year. Similar or wider achievement gaps existed for the
R04(DemographicData\2009-2010\SchoolExperiences\StudentCensusReport-SchoolExperiencesFinal)sz.3457 38
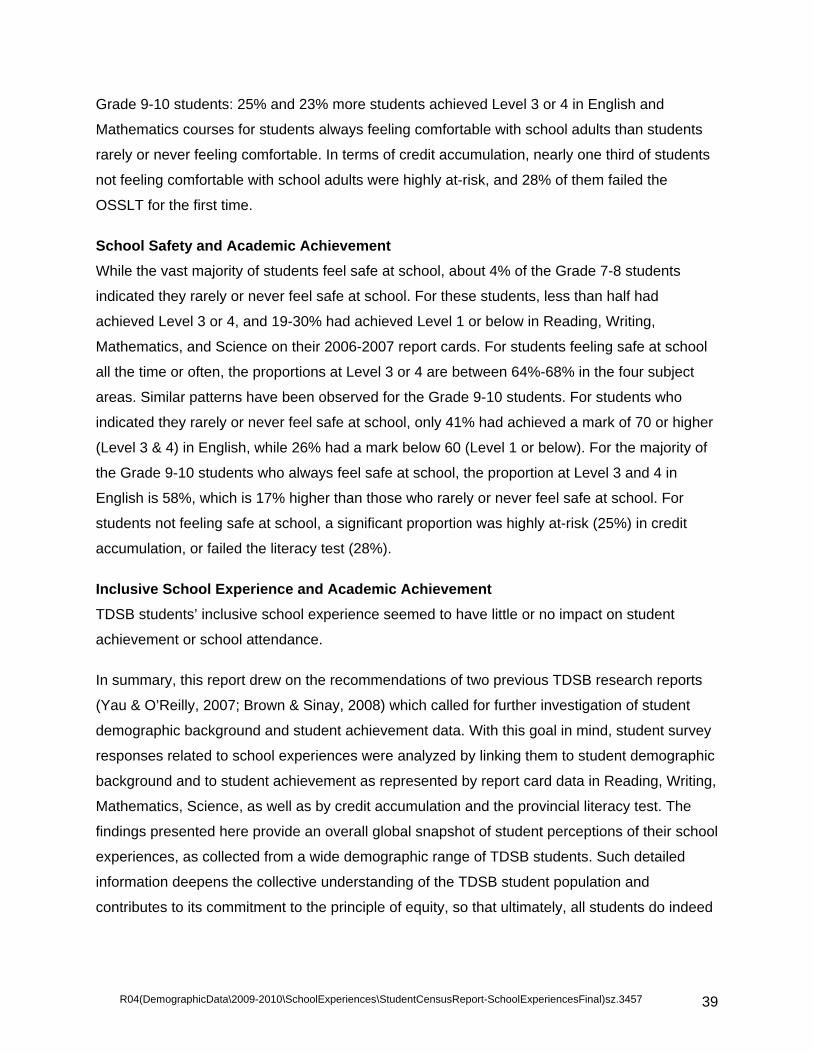
Grade 9-10 students: 25% and 23% more students achieved Level 3 or 4 in English and
Mathematics courses for students always feeling comfortable with school adults than students
rarely or never feeling comfortable. In terms of credit accumulation, nearly one third of students
not feeling comfortable with school adults were highly at-risk, and 28% of them failed the
OSSLT for the first time.
School Safety and Academic Achievement
While the vast majority of students feel safe at school, about 4% of the Grade 7-8 students
indicated they rarely or never feel safe at school. For these students, less than half had
achieved Level 3 or 4, and 19-30% had achieved Level 1 or below in Reading, Writing,
Mathematics, and Science on their 2006-2007 report cards. For students feeling safe at school
all the time or often, the proportions at Level 3 or 4 are between 64%-68% in the four subject
areas. Similar patterns have been observed for the Grade 9-10 students. For students who
indicated they rarely or never feel safe at school, only 41% had achieved a mark of 70 or higher
(Level 3 & 4) in English, while 26% had a mark below 60 (Level 1 or below). For the majority of
the Grade 9-10 students who always feel safe at school, the proportion at Level 3 and 4 in
English is 58%, which is 17% higher than those who rarely or never feel safe at school. For
students not feeling safe at school, a significant proportion was highly at-risk (25%) in credit
accumulation, or failed the literacy test (28%).
Inclusive School Experience and Academic Achievement
TDSB students’ inclusive school experience seemed to have little or no impact on student
achievement or school attendance.
In summary, this report drew on the recommendations of two previous TDSB research reports
(Yau & O’Reilly, 2007; Brown & Sinay, 2008) which called for further investigation of student
demographic background and student achievement data. With this goal in mind, student survey
responses related to school experiences were analyzed by linking them to student demographic
background and to student achievement as represented by report card data in Reading, Writing,
Mathematics, Science, as well as by credit accumulation and the provincial literacy test. The
findings presented here provide an overall global snapshot of student perceptions of their school
experiences, as collected from a wide demographic range of TDSB students. Such detailed
information deepens the collective understanding of the TDSB student population and
contributes to its commitment to the principle of equity, so that ultimately, all students do indeed
R04(DemographicData\2009-2010\SchoolExperiences\StudentCensusReport-SchoolExperiencesFinal)sz.3457 39

learn and grow to their full potential, in environments that welcome differences and are free from
discrimination.
R04(DemographicData\2009-2010\SchoolExperiences\StudentCensusReport-SchoolExperiencesFinal)sz.3457 40

REFERENCES
Brown, R.S. & Sinay, E. (2008). 2006 student census: Linking demographic data with student achievement (Board Rep. No. 07/08-06). Toronto, Ontario, Canada: Toronto District School Board. Fullan, M., Rolheiser, C., & Mascall, B., (2004). Large scale literacy reform in York Region. Ontario, Canada: Ministry of Education, Government of Ontario. Johnson, D. (2005). Signposts to success: Interpreting Ontario’s elementary school test scores. Toronto, Ontario, Canada: C.D. Howe Institute. King, A., Warren, W., Boyer, J., & Chin, P. (2004). Double Cohort Study: Phase 4 Report for the Ontario Ministry of Education. Retrieved March 2009 from http://www.edu.gov.on.ca/eng/document/reports/phase4/report4.pdf Lyn Sharratt, L., & Fullan, M. (2006). The school district that did the right things right. Journal of School Leadership, 16(3). Ontario Ministry of Education and Training (1998). Guide to the Provincial Report Card, Grades 1-8. Retrieved March 2009 from http://www.edu.gov.on.ca/eng/document/forms/report/1998/report98.html Ontario Ministry of Education and Training (2003). Building Pathways to Success, Grades 7-12, The Report of the Program Pathways for Students at Risk Work Group. Retrieved March 2009 from http://www.edu.gov.on.ca/eng/document/reports/pathways.html O’Reilly, J. & Yau, M. (2009). 2008 parent census, kindergarten-grade 6: System overview and detailed findings (Board Rep. No. 08/09-16). Toronto, Ontario, Canada: Toronto District School Board. Sangster, S., Leithwood, K., Milne, S., Zheng, S., & Turner, C. (2004). Learning Plus: A System Strategy for All Students. Aurora, Ontario, Canada: York Region District School Board. Yau, M. & O’Reilly, J. (2007). 2006 student census, grades 7-12: System overview (Board Rep. No. 07/08-01). Toronto, Ontario, Canada: Toronto District School Board.
Zheng, S. (2006). Student cohort tracking studies: Impacts of gender, SES and early achievement on students’ EQAO performance. Proceeding, Quest 2006 Conference, Richmond Hill, Ontario, Canada.
Zheng, S. (2007). School Performance in Literacy: Linking Socio-Economic Factors to Grade 3 and 6 EQAO Achievement. York Region District School Board. Aurora, Ontario. Zheng, S. (2008). Possible method of identifying challenging middle and secondary schools in TDSB. Toronto, Ontario, Canada: Toronto District School Board.
R04(DemographicData\2009-2010\SchoolExperiences\StudentCensusReport-SchoolExperiencesFinal)sz.3457 41

R04(DemographicData\2009-2010\SchoolExperiences\StudentCensusReport-SchoolExperiencesFinal)sz.3457 42 R04(DemographicData\2009-2010\SchoolExperiences\StudentCensusReport-SchoolExperiencesFinal)sz.3457 42