REPUBLIC OF THE MARSHALL ISLANDS - PADDLE
101
REPUBLIC OF THE MARSHALL ISLANDS STATISTICAL ABSTRACT 2001 ECONOMIC POLICY, PLANNING AND STATISTICS OFFICE
Transcript of REPUBLIC OF THE MARSHALL ISLANDS - PADDLE

REPUBLIC OF THE MARSHALL ISLANDS
STATISTICAL ABSTRACT 2001
ECONOMIC POLICY, PLANNING AND STATISTICS OFFICE
2001 STATISTICAL ABSTRACT 14TH EDITION
ECONOMIC POLICY, PLANNING AND STATISTICS OFFICE P.O. BOX 7
MAJURO, MH 96960 Tel: (692) 625-3802 Fax: (692) 625-3805
Email: [email protected]

2001 RMI Statistical Abstract
1
TABLE OF CONTENTS
FOREWORD...................................................................................................................................................... 2
SYMBOLS AND CONVERSIONS.................................................................................................................. 3
ACRONYMS...................................................................................................................................................... 4
CHAPTER 1: GEOGRAPHY AND METEOROLOGY ............................................................................... 5
CHAPTER 2: POPULATION ........................................................................................................................ 11
CHAPTER 3: HEALTH AND VITAL STATISTICS.................................................................................. 28
CHAPTER 4: CHARACTERISTICS OF HOUSEHOLDS ........................................................................ 37
CHAPTER 5: EDUCATION .......................................................................................................................... 43
CHAPTER 6: LABOR FORCE AND EMPLOYMENT............................................................................. 51
CHAPTER 7: AGRICULTURE, LIVESTOCK AND FISHERIES ........................................................... 61
CHAPTER 8: OVERSEAS TRADE.............................................................................................................. 67
CHAPTER 9: VISITOR STATISTICS ......................................................................................................... 73
CHAPTER 10: PRICES .................................................................................................................................. 81
CHAPTER 11: NATIONAL ACCOUNTS.................................................................................................... 85
CHAPTER 12: JUSTICE AND CRIMES ..................................................................................................... 91
CHAPTER 13: OTHER INDICATORS........................................................................................................ 95

2001 RMI Statistical Abstract
2
FOREWORD Iokwe, The Economic Policy, Planning and Statistics Office (EPPSO), is pleased to present its annual publication of Statistical Abstract 2001. Like the previous editions, this Abstract contains a wide range of social and economic data on the Republic of the Marshall Islands (RMI) and its people. Most of these data have been extracted from the administrative records of various ministries and agencies of the RMI Government, statutory agencies, and from the private sector -- all to which EPPSO is highly indebted. EPPSO was established and assumed responsibilities for collection, analysis and dissemination of national statistics in early 2003. National statistics were previously the responsibility of the Office of Planning and Statistics (OPS), which was dissolved by the Government in 2002. OPS’ closure and the transfer of statistical responsibilities to the newly established EPPSO caused some delays in the data collection process. This has resulted in the delayed publication of this Abstract, as well as in delayed updates to some of the tables (some tables do not yet have 2001 data). A comprehensive editing review of the Abstract and its contents was conducted in early 2003, during which a number of formatting and other improvements were made. Public finance data was not readily available at the time of publication and has been excluded in this Abstract. The 2002 Abstract, due for publication in the fall of 2003, will include (where possible) updated and expanded tables, including new types of statistics, improved graphics, and the previously published tables on public finance. We would like to acknowledge the Office of Insular Affairs’ Statistical Enhancement Program for its technical assistance with this Abstract. For any questions or suggestions for improvement, or for electronic copies of this Abstract, please do not hesitate to contact EPPSO at: telephone (692) 625-3802, fax (692) 625-3805, email [email protected]. Users can also visit the Secretariat of the Pacific Community website at www.spc.int/prism/country/mh, or the Insular Areas Statistical Enhancement Program website at www.pacificweb.org for additional statistics. Kommool tata, Carl Hacker Director Economic Policy, Planning and Statistics Office April 24, 2003
2001 RMI Statistical Abstract
3
SYMBOLS AND CONVERSIONS
- Nil (no data) … Breakdown not available n.a. Not available Length and Area 1 mile ------------------------------------------------- 1.60934 kilometers 1 yard ------------------------------------------------- 0.91440 meter 1 foot ------------------------------------------------- 0.3048 meter 1 inch ------------------------------------------------- 2.54 centimeter 1 sq. mile------------------------------------------------ 2.5890 sq. kilometer 1 acre ------------------------------------------------- 0.40469 hectares 1 hectare (ha)------------------------------------------- 2.47105 Volume 1 gal (US)------------------------------------------------ 3.7854 liters 1 quart ------------------------------------------------- 1.13652 liters 1 pint ------------------------------------------------- 0.56826 liters 1 barrel ------------------------------------------------- 158.99 liters 1 barrel ------------------------------------------------- 42 gallons (US) Weight 1 pound (lb)-------------------------------------------16 ounces------------------------0.4536 kilograms 1 short ton---------------------------------------------2,000 lbs -------------------------907.2 kilograms 1 long ton----------------------------------------------2,240 lbs-------------------------1,016.1 kilograms 1 kilogram---------------------------------------------2,205 lbs-------------------------1,000 grams 1 metric ton--------------------------------------------1.1023 short ton----------------1,000 kilograms or .984 long ton Power 1 horsepower---------------------------------------------- 0.7457 kilowatts 1 megawatt------------------------------------------------- 1,000 kilowatts Temperature Degree Celsius (C)------------------------------------- 5/9 (F-32) Degree Fahrenheit (F) -------------------------------- 9/5 (C+32)

2001 RMI Statistical Abstract
4
ACRONYMS
ADB Asian Development Bank
ASFR Age-Specific Fertility Rate
CMI College of the Marshall Islands
CPH Census of Population and Housing
DUI Driving Under Influence
DWI Driving While Intoxicated
DPS Department of Public Safety
EPPSO Economic Policy, Planning and Statistics Office
IMR Infant Mortality Rate
MBC Majuro Broadcasting Company
MEC Marshall Energy Company
MIMRA Marshall Islands Marine Resources Authority
MISGLB Marshall Islands Scholarship, Grant and Loan Board
MISSA Marshall Islands Social Security Administration
MIVA Marshall Islands Visitors Authority
MoE Ministry of Education
MoF Ministry of Finance
MoFA Ministry of Foreign Affairs
MoH Ministry of Health
MWB Majuro Weather Bureau
NTA National Telecommunications Authority
PAS Population Analysis Spreadsheet
R&D Ministry of Resources and Development
RMI Republic of the Marshall Islands
TFR Total Fertility Rate
TTPI Trust Territory of the Pacific Islands
UNDP United Nations Development Program
USP University of the South Pacific
USAKA United States Army Kwajalein Atoll
VSD Vital Statistics Division

2001 RMI Statistical Abstract
5
CHAPTER 1: GEOGRAPHY AND METEOROLOGY
The RMI consists of 29 atolls, each made up of many islets, and 5 single islands. The RMI is in the central Pacific Ocean, between 4 degrees and 14 degrees North, and 160 degrees and 173 degrees East. The atolls and islands are situated in two parallel chain-like formations known as the Ratak (Sunrise) group and Ralik (Sunset) group. The total number of islands and islets in the whole RMI is approximately 1,225, spreading across a sea area of over 750,000 square miles (1.9 million square kilometers). The total land area is about 70 square miles (181 square kilometers). The mean height of land is about 7 feet above sea level (2 meters) Urban centers are Majuro and Kwajalein atolls. Tradewinds prevail throughout the year in Majuro and tropical storms are very rare. Minor storms of the easterly wave type are quite common from March to April and October to November. The tradewinds are frequently locally interrupted during the summer months by the movement of the zone of inter-tropical convergence across the sea. Rainfall is heavy, with the wettest months being September, October and November. Precipitation is generally of the shower type, however, continuous rain is not uncommon. The RMI has an extremely consistent temperature regime, ranging less than 2 degrees. Weather data for the RMI are provided by the Majuro Weather Station. The Station is located on southeastern end of Majuro Atoll, in Delap Village. This atoll is approximately 160 square miles in area with a lagoon of about 150 square miles. The lagoon is oblong, 22 miles long and 4 miles wide.

2001 RMI Statistical Abstract
6
Table 1.1 GEOGRAPHY OF THE MARSHALL ISLANDS
Approx. Lagoon area Land area Latitude (North) Longitude (East) Chain/Atoll Type # Islets (sq miles) (sq miles) (deg. min.) (deg. min.)
TOTAL 1,225 4,506.9 70.1 - -
Ratak Chain 641 1,672.5 34.0 - -
1 Bokak Atoll 10 30.1 1.3 14 32' - 14 42' 168 53' - 169 1' 2 Bikar Atoll 7 14.4 0.2 12 11' - 12 18' 170 4' - 170 9' 3 Utrik Atoll 10 22.3 0.9 11 12' - 11 12' 169 45' - 169 5 1' 4 Toke Atoll 6 36.0 0.2 11 5' - 11 30' 169 33' - 169 40' 5 Mejit Island 1 - 0.7 10 16' - 10 18' 170 52' - 70 53' 6 Ailuk Atoll 55 68.5 2.1 10 12' - 10 27' 169 52' - 169 59' 7 Jemo Island 1 - 0.1 10 7' 169 33' 8 Likiep Atoll 65 163.7 4.0 9 48' - 10 4' 168 58' - 169 20' 9 Wotje Atoll 75 241.1 3.2 9 21' - 9 32' 169 48' - 170 15'
10 Erikub Atoll 16 88.9 0.6 9 8' 170 0' 11 Maloelap Atoll 75 375.6 3.8 8 29' - 8 55' 170 50' - 171 15' 12 Aur Atoll 43 92.6 2.2 8 7' - 8 22' 171 1' - 171 12' 13 Majuro Atoll 64 113.9 3.8 7 3' - 7 13' 171 2' - 171 58' 14 Arno Atoll 103 130.8 5.0 6 58' - 7 18' 171 33' - 171 57' 15 Mili Atoll 92 294.7 6.2 5 53' - 6 16' 171 42' - 172 10' 16 Nadikdik Atoll 18 - - - -
Ralik Chain 584 2,834.4 36.0 - -
17 Enewetak Atoll 44 388.0 2.3 11 20' - 11 41' 162 17' - 162 24' 18 Ujelang Atoll 30 25.5 0.7 9 46' - 9 53' 160 47' - 161 0' 19 Bikini Atoll 36 229.4 2.3 11 29' - 11 42' 165 12' - 165 34' 20 Rongerik Atoll 14 55.4 0.7 11 15' - 11 25' 167 22' - 167 32' 21 Rongelap Atoll 61 387.8 3.1 11 9' - 11 29' 166 38' - 167 4' 22 Ailinginae Atoll 25 40.9 1.1 11 8' - 11 11' 166 17' - 166 2' 23 Wotho Atoll 18 36.7 1.7 10 1' - 10 11' 165 54' - 165 46' 24 Ujae Atoll 15 71.8 0.7 8 55' - 9 12' 165 30' - 166 16' 25 Lae Atoll 20 6.8 0.6 8 54' - 9 2' 166 11' - 167 46' 26 Kwajalein Atoll 93 839.3 6.3 8 48' - 9 22' 166 49' - 167 25' 27 Lib Island 1 - 0.4 8 20' - 8 22' 167 23' - 168 18' 28 Namu Atoll 54 153.5 2.4 7 45' - 8 12' 167 58' - 168 59' 29 Jabat Island 1 - 0.2 7 44' - 7 5' 168 58' - 168 59' 30 Ailinglaplap Atoll 56 289.7 5.7 7 16' - 7 36' 168 33' - 169 44' 31 Jaluit Atoll 91 266.3 4.4 5 47' - 6 18' 169 24' - 169 44' 32 Kili Island 1 - 0.4 5 37' - 5 38' 169 7' - 169 8' 33 Namdrik Atoll 2 3.3 1.1 5 35' - 5 38' 168 5' - 168 9' 34 Ebon Atoll 22 40.1 2.2 4 34' - 4 42' 168 38' - 168 47'
Note: There are 29 atolls and 5 islands that make up the Marshall Islands Source: Bryan, E.H., Guide to Place Names in the Trust Territory of the Pacific Islands, 1971
0.0
1.0
2.0
3.0
4.0
5.0
6.0
7.0
Kw
ajal
ein
Mili
Aili
ngla
plap
Arn
oJa
luit
Liki
epM
aloe
lap
Maj
uro
Wot
jeR
onge
lap
Nam
uB
ikin
iE
new
etak
Ebo
nA
urA
iluk
Wot
hoB
okak
Aili
ngin
aeN
amdr
ikU
trik
Mej
itU
jae
Uje
lang
Ron
gedr
ikE
rikub La
eLi
bK
iliT
oke
Jaba
tB
ikar
Jem
o
Figure 1.1 Land Area of Atolls/Islands (square miles)

2001 RMI Statistical Abstract
7
Table 1.2 DISTANCE BETWEEN ATOLLS/ISLANDS (nautical miles)
Atoll/Island
Ail
ingl
apla
p
Ail
uk
Air
ok (M
alol
ap)
Arn
o
Aur
Bik
ini
Ebo
n
Ebe
ye (K
waj
)
Ene
wet
ak
Jaba
t
Jalu
it
Kab
en (M
aloe
lap)
Kil
i
Lae
Lib
Lik
iep
Maj
uro
Mej
it
Mil
i
Nam
drik
Nam
u
Ron
gela
p
Tab
al (A
ur)
Uja
e
Uje
lang
Utr
ik
Wot
ho
Wot
je
Ailinglaplap - 187 160 180 150 310 165 110 452 30 95 160 105 180 100 152 150 210 208 103 75 260 150 205 485 240 240 150Ailuk 187 - 125 220 145 273 345 160 455 165 257 95 282 235 190 45 205 55 275 240 172 190 135 380 540 80 235 45Airok (Maloelap) 160 125 - 108 20 380 280 200 532 133 180 30 215 290 220 140 90 110 150 250 175 250 10 220 615 185 310 80Arno 180 220 108 - 80 420 220 200 624 170 135 108 170 345 260 230 30 200 60 225 215 385 85 375 670 275 385 175Aur 150 145 20 80 - 395 255 200 532 128 160 50 190 290 220 150 70 135 133 235 175 315 10 330 620 200 325 100Bikini 310 273 380 450 395 - 462 217 194 307 315 358 416 165 225 245 439 329 496 390 250 95 390 142 290 255 88 307Ebon 165 345 280 220 255 462 - 255 565 188 95 280 65 295 230 315 220 360 195 70 200 415 255 320 560 400 365 300Ebeye (Kwaj) 110 160 200 260 200 217 255 - 354 103 200 200 200 90 35 120 235 200 300 185 40 150 200 120 470 250 130 150Enewetak 452 455 532 624 532 194 565 354 - 455 542 508 545 276 356 432 595 518 661 497 392 271 542 240 123 444 227 453Jabat 30 165 133 170 128 307 188 103 455 - 118 128 124 182 104 125 132 188 186 140 68 242 125 220 498 250 235 120Jaluit 95 275 180 135 160 415 95 200 542 118 - 180 35 265 190 235 130 265 125 90 145 360 160 300 570 315 325 210Kaben (Malolap) 160 95 30 108 50 358 280 200 508 128 180 - 215 290 220 105 115 85 150 250 170 250 40 220 615 150 310 50Kili 105 282 215 170 190 416 65 200 545 124 35 215 - 260 185 250 160 295 160 60 150 360 190 285 550 335 325 230Lae 180 235 290 345 290 116 295 90 276 182 265 290 260 - 80 180 320 285 380 200 110 140 290 30 320 250 80 225Lib 100 190 220 260 220 225 230 35 356 104 190 220 185 80 - 140 245 240 300 165 35 170 220 105 395 225 140 170Likiep 152 45 140 230 150 245 315 120 432 125 235 105 250 180 140 - 205 95 275 260 130 160 140 215 485 95 185 60Majuro 150 205 90 30 70 439 220 235 595 132 130 115 160 320 245 206 - 200 85 215 210 360 80 350 635 265 365 160Mejit 210 55 110 200 130 329 360 200 518 188 265 85 295 285 240 95 200 - 255 320 210 240 120 320 600 85 290 65Mili 208 275 150 60 133 496 195 300 661 186 125 150 160 380 300 275 80 255 - 220 250 425 133 410 700 330 420 230Namdrik 103 240 250 225 235 390 79 185 497 140 90 250 60 220 165 260 215 320 220 - 140 350 235 250 490 350 300 260Namu 75 172 175 215 175 250 200 40 392 68 145 170 150 110 35 130 210 210 250 140 - 190 175 140 425 220 170 145Rongelap 260 190 250 385 315 95 415 150 271 242 360 250 360 140 170 160 360 240 425 350 190 - 315 150 360 190 80 220Tabal (Aur) 150 135 10 80 10 390 255 200 542 125 160 40 190 290 220 140 80 120 133 236 175 315 - 330 620 190 325 -Ujae 205 360 220 375 330 142 320 120 240 220 300 220 285 30 105 215 350 320 410 350 140 150 330 - 290 280 80 260Ujelang 485 540 615 670 620 290 650 410 123 498 570 615 550 320 395 485 635 600 700 490 425 320 620 290 - 540 300 550Utrik 240 60 185 275 200 255 400 250 444 250 315 150 335 255 225 90 265 85 330 350 220 180 190 280 540 - 235 110Wotho 240 235 310 385 325 88 365 130 227 235 325 310 325 80 140 185 365 290 420 300 170 80 325 80 300 235 - 245Wotje 150 45 80 175 100 307 300 150 453 120 210 50 230 225 170 60 160 65 230 260 145 220 90 260 550 110 245 - Source: Ministry of Transportation and Communication
Figure 1.2 Distances from Majuro (nautical miles)
0
100
200
300
400
500
600
700
Uje
lang
Ene
wet
ak
Bik
ini
Wot
ho
Ron
gela
p
Uja
e
Lae
Utri
k
Lib
Ebe
ye
Ebo
n
Nam
drik
Nam
u
Ailu
k
Liki
ep
Mej
it
Kili
Wot
je
Ailin
glap
lap
Jaba
t
Jalu
it
Kab
en
Airo
k
Mili
Taba
l
Aur
Arn
o

2001 RMI Statistical Abstract
8
Table 1.3 MONTHLY RAINFALL IN MAJURO (inches), 1959 to 2001 Year Annual Jan Feb Mar Apr May Jun Jul Aug Sept Oct Nov Dec 1990s mean 129.5 7.6 5.9 9.3 12.0 12.6 10.3 10.6 11.7 12.7 13.0 12.6 11.1 1980s mean 125.2 8.6 8.2 7.3 7.2 8.9 11.1 14.0 11.9 11.4 12.4 12.7 11.4 1970s mean 135.3 6.2 4.5 8.2 14.1 13.6 12.4 12.3 12.2 12.2 15.9 11.9 11.9 1960s mean 137.0 10.7 5.7 9.4 11.0 10.8 11.9 13.3 10.4 14.6 13.6 13.9 11.9 2001 124.3 5.7 5.1 0.5 4.1 7.1 15.1 10.0 11.7 20.9 20.2 14.9 9.0 2000 135.4 23.8 20.9 6.6 8.8 4.0 5.3 11.3 11.1 7.0 12.3 15.0 9.2 1999 120.0 7.2 3.8 10.2 5.3 8.2 13.1 8.9 11.0 11.4 17.9 13.3 9.9 1998 102.1 1.6 0.3 0.3 0.6 6.6 10.5 16.3 12.1 9.3 19.5 13.6 11.5 1997 125.2 5.4 7.0 6.6 14.5 21.3 8.2 4.9 11.7 19.1 10.9 7.9 7.6 1996 152.6 14.1 16.7 8.3 19.5 10.6 13.0 7.4 7.5 15.7 9.7 13.2 16.9 1995 131.4 8.2 4.4 4.6 22.0 7.9 12.2 10.6 11.9 15.8 10.6 11.2 12.1 1994 127.7 9.4 1.7 9.5 14.1 15.7 5.7 8.3 11.7 13.2 10.4 11.3 16.7 1993 152.6 5.8 8.5 13.5 14.1 11.3 8.2 13.9 13.3 9.8 20.5 14.4 19.2 1992 87.1 7.7 0.2 0.2 0.4 14.2 8.4 10.4 12.6 5.9 13.6 10.1 3.5 1991 177.8 9.9 11.7 29.5 20.5 13.2 16.6 16.4 11.0 19.7 10.4 15.4 3.5 1990 118.3 7.0 4.2 10.4 9.4 16.6 7.3 9.1 14.4 7.6 6.2 15.9 10.4 1989 134.8 7.8 8.3 4.8 8.5 11.2 7.2 17.4 10.3 14.6 16.4 19.8 8.5 1988 122.3 14.7 1.5 6.8 5.9 6.9 9.1 14.3 10.6 13.9 17.9 7.2 13.7 1987 122.5 6.2 10.4 4.9 2.1 9.2 14.8 21.2 8.4 11.1 11.3 15.5 7.5 1986 148.6 10.5 3.9 14.8 12.2 14.9 15.9 12.1 20.0 10.5 7.3 9.4 17.1 1985 149.7 8.7 16.6 4.6 15.4 9.7 14.7 13.2 16.8 8.0 18.1 12.8 11.3 1984 115.7 16.1 16.8 1.3 3.9 4.2 5.4 9.4 9.2 6.4 14.8 13.3 15.0 1983 86.3 0.8 1.0 0.7 2.0 1.5 14.5 12.6 6.1 11.3 13.5 9.8 12.7 1982 144.5 12.6 9.7 13.3 4.7 11.5 17.0 14.7 11.7 18.9 8.2 19.1 3.2 1981 119.2 0.9 4.3 17.4 10.2 9.0 5.4 16.5 12.2 6.7 7.3 14.6 14.5 1980 108.3 8.1 9.7 5.1 7.0 11.3 6.7 8.5 13.9 12.9 9.3 5.4 10.6 1979 109.3 6.8 2.8 7.1 11.8 7.9 13.2 6.7 13.0 6.5 15.0 11.3 7.1 1978 142.8 3.6 5.3 3.4 12.7 13.9 10.7 16.3 8.9 9.7 20.6 23.6 14.4 1977 122.0 2.4 0.8 2.6 10.6 17.2 8.4 10.9 11.2 9.7 17.6 11.9 18.9 1976 145.0 8.6 9.4 15.7 19.4 15.3 9.4 16.8 8.4 17.7 9.0 12.7 2.8 1975 151.8 5.2 3.2 7.8 12.8 10.6 17.6 14.2 16.4 16.5 18.3 15.3 14.0 1974 148.8 11.1 8.1 7.2 15.7 12.8 13.7 12.5 13.7 10.4 19.9 9.3 14.5 1973 124.0 0.8 1.8 11.1 14.6 14.3 12.2 7.3 13.9 12.8 13.8 14.2 7.2 1972 157.7 9.6 7.1 15.5 9.2 15.0 14.9 14.8 10.8 19.0 14.1 4.5 23.4 1971 162.4 8.2 5.7 9.8 31.1 19.9 13.4 15.5 14.9 7.9 18.1 9.5 8.4 1970 89.0 5.6 0.4 1.7 2.9 9.2 10.7 7.7 11.2 11.8 12.6 6.7 8.4 1969 134.3 8.2 2.4 16.2 17.2 8.8 13.0 16.7 10.2 15.7 7.1 11.7 7.2 1968 135.7 5.4 3.5 11.1 8.9 9.3 16.1 11.4 11.5 9.8 12.1 12.0 24.8 1967 126.1 11.9 9.7 12.5 7.6 4.9 11.0 13.9 8.0 13.8 15.2 11.2 6.5 1966 128.7 3.8 4.4 5.8 16.0 8.6 9.4 14.9 6.5 14.0 13.5 12.2 19.4 1965 114.8 9.9 5.3 2.0 4.7 7.9 11.5 14.9 6.9 15.5 14.7 12.1 9.6 1964 162.7 1.4 7.0 7.2 11.5 22.0 11.2 18.7 15.6 21.1 22.8 16.9 7.4 1963 131.5 17.5 9.6 12.4 6.2 11.3 12.0 11.7 10.8 6.8 13.1 11.6 8.6 1962 151.4 17.6 5.2 11.5 6.0 12.0 7.5 11.0 8.9 21.0 16.4 22.7 11.7 1961 131.7 22.0 6.5 4.2 8.5 8.3 13.9 5.3 11.3 11.1 11.5 12.0 16.9 1960 153.0 9.2 3.6 11.2 23.4 14.3 13.2 14.1 14.6 16.9 9.7 16.3 6.5 1959 130.6 1.1 9.5 8.7 12.7 6.4 14.2 11.0 5.3 16.4 11.5 19.9 14.0 Source: Majuro Weather Station
Figure 1.3 Mean Monthly Rainfall (inches), Majuro, 1990s
0.0
2.0
4.0
6.0
8.0
10.0
12.0
14.0
Jan Feb Mar Apr May Jun Jul Aug Sept Oct Nov Dec

2001 RMI Statistical Abstract
9
Table 1.4 MONTHLY AVERAGE TEMPERATURE IN MAJURO (degrees Fahrenheit), 1960 to 2001 Annual Year average Jan Feb Mar Apr May Jun Jul Aug Sept Oct Nov Dec 1990s mean 81.5 80.8 81.3 81.3 81.2 81.4 81.5 81.7 81.8 81.9 82.0 81.7 81.3 1980s mean 81.2 80.8 81.0 81.1 81.4 81.6 81.2 80.9 81.4 81.5 81.6 81.4 80.8 1970s mean 80.8 80.5 81.0 81.1 80.5 80.6 80.7 80.7 80.8 81.1 80.8 80.9 80.6 1960s mean 81.3 80.9 81.2 81.1 81.2 81.5 81.2 81.2 81.7 81.6 81.6 81.3 81.1 Max mean 82.3 82.3 82.2 83.0 83.0 83.0 82.3 82.8 82.5 82.8 82.7 82.6 82.3 Min mean 80.0 78.5 79.4 78.5 79.0 80.0 79.7 79.7 79.9 80.0 78.8 79.4 79.5 2001 82.3 81.5 81.8 82.4 82.9 82.7 81.9 82.2 82.5 82.3 82.7 82.0 82.3 2000 81.8 81.0 81.1 81.9 81.4 82.0 81.8 81.5 82.2 82.7 82.5 82.0 82.0 1999 81.7 82.0 81.5 81.1 81.5 82.2 81.2 81.8 81.6 81.5 82.5 81.6 81.7 1998 82.2 81.4 82.2 83.0 83.0 82.5 82.3 81.6 82.0 82.7 82.3 81.8 81.6 1997 81.9 82.3 81.6 82.7 81.0 81.4 82.0 82.8 81.9 82.0 81.9 82.0 81.2 1996 81.5 81.0 81.1 81.6 80.0 81.3 80.9 82.0 81.9 81.8 82.2 82.0 81.7 1995 81.5 81.2 81.1 81.6 80.6 81.3 80.9 82.0 81.9 81.8 82.2 82.0 81.7 1994 81.8 81.0 81.8 81.4 81.6 81.4 82.1 81.9 82.3 82.1 82.3 82.6 81.1 1993 80.3 78.5 79.5 78.5 79.0 80.0 81.0 81.0 81.5 81.5 81.0 81.0 80.5 1992 81.7 79.6 81.3 81.6 82.7 81.9 82.0 81.6 82.0 82.6 82.2 81.5 81.6 1991 80.9 80.1 81.4 79.6 80.3 81.1 80.9 81.3 81.4 81.1 81.8 81.0 81.0 1990 81.5 81.2 81.6 82.0 81.9 81.1 81.6 81.4 81.7 81.8 81.7 81.8 80.4 1989 80.9 80.5 80.3 80.6 80.5 80.8 81.0 80.5 80.9 81.1 81.6 81.4 82.0 1988 81.1 80.9 81.9 81.8 82.1 81.8 81.3 80.2 80.9 80.6 80.3 81.2 80.4 1987 81.4 80.6 80.7 81.0 81.8 81.5 81.1 80.9 82.1 81.8 82.2 81.8 81.2 1986 81.4 81.1 81.9 80.3 81.1 81.7 81.1 81.7 81.8 81.8 82.1 81.9 80.5 1985 80.8 80.8 80.3 80.7 79.8 81.1 80.4 80.7 80.4 81.5 81.4 81.5 80.9 1984 81.1 80.6 80.6 82.0 81.9 81.5 80.3 80.6 81.8 81.2 80.8 80.6 80.9 1983 81.3 80.1 80.5 81.4 82.2 83.0 81.4 81.3 82.2 81.8 80.9 81.0 80.3 1982 81.1 80.5 80.7 80.5 81.8 81.3 81.3 81.1 81.3 81.4 82.0 81.4 80.2 1981 81.3 81.4 81.5 81.0 80.9 81.4 82.0 80.8 81.4 82.0 82.0 81.0 80.6 1980 81.6 81.4 81.3 81.3 81.6 81.5 81.9 81.5 81.5 81.7 82.2 81.9 81.0 1979 81.3 81.2 81.0 81.6 79.7 80.9 81.5 81.5 80.9 82.0 82.1 81.8 81.7 1978 81.0 81.2 81.1 81.5 80.9 80.5 80.9 80.4 81.5 81.6 81.2 80.6 80.3 1977 81.1 80.3 81.3 81.5 80.5 80.1 81.2 80.9 81.2 82.4 81.1 81.2 81.1 1976 80.1 79.4 79.4 79.6 79.5 80.0 80.0 80.0 80.7 80.4 81.4 80.2 80.1 1975 80.0 80.4 81.0 80.7 80.2 80.5 79.7 79.7 79.9 80.0 78.8 79.4 79.5 1974 80.7 79.9 80.8 80.8 80.5 80.8 80.6 80.7 81.0 80.9 81.0 80.9 80.3 1973 80.9 80.9 81.8 81.6 81.3 80.6 80.8 80.9 80.8 80.2 80.5 80.7 81.1 1972 81.0 80.2 80.9 80.8 80.8 81.2 81.5 80.9 81.2 81.3 80.9 81.7 80.8 1971 80.5 80.6 80.9 80.9 79.5 80.0 80.2 80.5 80.1 80.8 80.5 81.1 80.5 1970 81.2 81.2 82.0 82.0 82.1 81.5 80.7 81.1 80.8 81.1 80.6 81.2 80.6 1969 81.2 80.1 81.1 81.0 80.7 81.5 81.2 80.5 81.6 81.5 82.4 82.0 81.3 1968 81.0 81.1 81.4 80.3 80.6 80.8 81.1 80.9 81.4 81.8 81.1 81.1 80.6 1967 81.4 81.0 80.8 80.2 81.2 82.0 81.3 81.4 82.2 82.0 81.4 81.2 81.5 1966 81.5 81.0 81.3 81.3 80.7 81.7 81.7 81.9 82.5 81.8 81.9 81.2 80.9 1965 81.1 80.2 80.5 81.5 81.3 81.0 81.2 80.7 82.1 81.3 81.4 81.0 80.8 1964 81.0 81.8 81.6 81.3 81.4 81.1 80.7 80.8 80.8 80.5 80.7 80.7 80.8 1963 81.6 80.5 80.5 80.7 82.1 82.3 81.8 81.7 82.2 82.8 81.7 81.8 81.3 1962 81.3 80.9 81.6 80.7 81.7 82.2 81.3 81.2 81.8 81.0 81.5 80.7 81.5 1961 81.5 81.3 81.8 82.6 81.7 81.5 81.2 81.5 81.3 81.1 81.9 81.4 80.9 1960 81.3 81.0 81.6 81.5 80.2 80.6 80.6 81.1 81.2 81.7 82.3 81.8 81.7 Note: Maximum and minimum mean temperatures are the highest annual and monthly average temperature since 1960 Source: Majuro Weather Station
Figure 1.4 Mean Monthly Temperature (F), Majuro, 1990s
80.280.480.680.881.081.281.481.681.882.082.2
Jan Feb Mar Apr May Jun Jul Aug Sept Oct Nov Dec

2001 RMI Statistical Abstract
10
Table 1.5 WIND, SUNSHINE AND HUMIDITY, 1995 to 2001 Year Jan Feb Mar Apr May Jun Jul Aug Sept Oct Nov Dec Wind speed 97-01 mean 11.8 13.0 12.5 12.7 11.7 10.4 8.7 8.4 7.7 7.6 8.9 12.1 Sunshine 97-01 mean 63.0 63.0 70.8 62.8 60.0 57.2 53.8 59.2 60.6 52.6 49.2 50.8 Humidity 97-01 mean 84.2 82.6 82.6 82.8 85.4 85.6 85.8 86.2 85.0 85.4 85.6 85.6 2001 Average wind speed 12.9 13.0 12.7 12.5 11.5 9.9 8.7 7.7 7.2 7.3 8.6 11.7 Prevailing direction 7 7 8 8 7 8 9 9 8 9 9 8 Percentage sunshine 61 64 66 59 58 59 56 61 59 56 53 53 Relative humidity 79 77 78 77 78 80 79 80 78 80 82 79 2000 Average wind speed 8.6 11.9 14.1 14.4 12.6 11.8 8.1 9.6 6.6 7.8 9.3 11.9 Prevailing direction 7 7 7 8 7 7 7 7 23 7 8 7 Percentage sunshine 67 51 79 67 71 68 59 59 65 48 44 43 Relative humidity 88 88 88 86 88 88 88 87 90 90 88 88 1999 Average wind speed 13.1 13.1 12.6 12.3 11.4 9.8 8.7 7.6 7.2 7.3 8.6 11.7 Prevailing direction 7 7 7 7 7 7 7 7 7 7 7 7 Percentage sunshine 61 64 66 59 58 55 56 61 59 53 53 58 Relative humidity 88 85 84 85 89 90 91 91 88 88 89 90 1998 Average wind speed 13.2 13.8 13.3 14.3 13.5 12.7 9.4 7.5 7.4 7.8 9.3 12.1 Prevailing direction 9 7 8 8 9 8 7 7 8 7 7 8 Percentage sunshine 65 72 77 70 55 49 42 54 61 50 43 47 Relative humidity 88 85 84 85 89 90 91 91 88 88 89 90 1997 Average wind speed 11.0 13.4 9.7 10.1 9.3 7.8 8.4 9.4 9.9 7.7 8.5 12.9 Prevailing direction 6 7 5 7 7 7 7 23 23 7 7 6 Percentage sunshine 61 64 66 59 58 55 56 61 59 56 53 53 Relative humidity 78 78 79 81 83 80 80 82 81 81 80 81 1996 Average wind speed 10.5 11.0 11.8 13.0 11.7 9.6 8.7 6.8 7.3 7.2 7.2 9.4 Prevailing direction 7 7 7 7 7 7 7 33 8 5 29 7 Percentage sunshine 55 52 63 36 46 37 61 64 57 54 56 46 Relative humidity 80 77 78 76 75 77 79 78 76 75 77 76 1995 Average wind speed 12.0 11.5 12.0 11.3 10.4 10.3 7.9 7.7 7.0 7.5 8.6 10.7 Prevailing direction 5 5 5 5 9 9 5 5 9 9 5 9 Percentage sunshine 52 54 5 5 9 9 5 5 9 9 5 9 Relative humidity 78 78 77 81 80 77 78 79 82 78 75 77 Note: Direction of wind is that from which the wind blows, indicated in tens of d egrees clockwise from true North. Example, 9 for East, 18 for South, 27 for West. Source: Majuro Weather Station
Figure 1.5 Mean Wind Speed (MPH), Majuro, 1997 to 2001
0.0
2.0
4.0
6.0
8.0
10.0
12.0
14.0
Jan Feb Mar Apr May Jun Jul Aug Sept Oct Nov Dec

2001 RMI Statistical Abstract
11
CHAPTER 2: POPULATION
This section presents data on the growth, distribution, and projection of the RMI population. The principal sources of these data are the 1988 and 1999 Censuses of Population and Housing. Some historical data are also provided. The Census of 1988 was taken with reference to midnight on Sunday, November 13, 1988. It was a de facto enumeration, which means that people were counted according to where they were on the census night. The whole RMI was included with the exception the United States Army Kwajalein Atoll (USAKA). The 1999 Census of Population and Housing, on the other hand, was taken using the de jure method of enumeration, which means that people were counted according to their place of usual residence as of census reference time, which was midnight of 1st June 1999. As in 1988, the whole of the RMI was included with the exception of the non-Marshallese residing on USAKA. The total population of the RMI in 1999 Census was 50,840. The average growth rate of the population was 1.5 percent between the Censuses of 1988 and 1999. The population projections provide guidance for future economic and social planning. Population projections for the years 2000-2019 were computed by using the software package called “PEOPLE”, which projects the population by using the demographic cohort component method. This projection is based on the population of 1999 Census of Population and Housing. It takes in to account future changes in the components of the population, which are fertility, mortality and migration. The method starts with a base population, which in this case was the 1999 population, distributed by age and sex. The fertility assumptions are then made, followed by mortality, using the life expectancy at birth. Thus, the projections are made based on the fertility and mortality conditions mentioned below, which are in fact derived from the respective census year. Both the fertility and mortality conditions are assumed to decline (slow initial decline) as a result of a steady social and economic development.
Year 1973 1988 1999 Total Fertility 7.92 7.23 5.71 Life Expectancy Male 56.2 59.6 65.7 Female 59.7 62.6 69.4
The migration component has been ignored and the net migration (migration minus emigration) has been assumed to be equal to zero.

2001 RMI Statistical Abstract
12
Table 2.1 RESIDENT POPULATION AND GROWTH RATE, 1920 to 1999 Annual Census Year Both sexes growth % Male Female Unknown 1999 50,840 1.5 26,026 24,814 - 1988 43,380 4.3 22,181 21,199 - 1980 30,873 3.6 15,851 15,022 - 1973 25,045 4.1 12,335 11,800 910 1967 18,925 3.5 9,658 9,267 - 1958 14,163 1.3 7,175 6,753 235 1935 10,446 0.1 5,480 4,966 - 1930 10,412 1.5 5,505 4,907 - 1925 9,644 -0.3 5,030 4,614 - 1920 9,800 - 5,196 4,604 - Sources: Trust Territory of the Pacific Islands, Bulletin of Statistics, Vol III. No. 2. 1973. 1988 Census of Population and Housing, EPPSO 1999 Census of Population and Housing, EPPSO
Table 2.2 POPULATION BY SINGLE YEAR OF AGE, 1988 Age Total Male Female Age Total Male Female Total 43,380 22,181 21,199 45 226 129 97 0 1,766 931 835 46 234 128 106 1 1,826 919 907 47 159 82 77 2 1,726 878 848 48 187 110 77 3 1,668 850 818 49 165 100 65 4 1,665 845 820 50 159 83 76 5 1,659 839 820 51 148 79 69 6 1,562 788 774 52 151 87 64 7 1,449 746 703 53 160 74 86 8 1,562 801 761 54 125 63 62 9 1,377 710 667 55 135 67 68 10 1,280 673 607 56 118 60 58 11 1,203 602 601 57 111 55 56 12 1,176 621 555 58 183 107 76 13 1,143 601 542 59 133 70 63 14 1,074 558 516 60 181 89 92 15 922 459 463 61 118 59 59 16 862 445 417 62 110 55 55 17 746 394 352 63 128 60 68 18 844 445 399 64 98 50 48 19 711 361 350 65 119 51 68 20 724 359 365 66 111 59 52 21 706 329 377 67 107 45 62 22 681 319 362 68 123 67 56 23 683 313 370 69 84 33 51 24 716 366 350 70 107 52 55 25 610 302 308 71 74 38 36 26 619 317 302 72 64 33 31 27 560 269 291 73 58 29 29 28 652 331 321 74 70 31 39 29 586 301 285 75 39 16 23 30 570 296 274 76 46 19 27 31 499 268 231 77 45 25 20 32 521 229 292 78 43 27 16 33 520 270 250 79 28 10 18 34 546 285 261 80 26 9 17 35 478 280 198 81 19 7 12 36 499 272 227 82 7 4 3 37 322 156 166 83 17 5 12 38 469 255 214 84 18 4 14 39 419 242 177 85 11 6 5 40 386 202 184 86 11 6 5 41 306 146 160 87 16 8 8 42 288 148 140 88+ 15 7 8 43 248 129 119 44 264 133 131 Source: 1988 Census of Population and Housing, EPPSO

2001 RMI Statistical Abstract
13
Table 2.3 POPULATION BY SINGLE YEAR OF AGE, 1999 Age Total Male Female Age Total Male Female Total 50,840 25,987 24,767 45 424 227 197 0 1,663 859 804 46 465 271 194 1 1,628 853 775 47 393 220 173 2 1,434 749 685 48 339 175 164 3 1,445 750 695 49 402 226 176 4 1,482 746 736 50 368 200 168 5 1,375 705 670 51 282 154 128 6 1,189 593 596 52 265 135 130 7 1,131 579 552 53 229 123 106 8 1,427 750 677 54 221 119 102 9 1,518 757 761 55 178 93 85 10 1,445 774 671 56 178 101 77 11 1,538 781 757 57 160 82 78 12 1,524 775 749 58 137 74 63 13 1,525 785 740 59 139 82 57 14 1,481 771 710 60 114 61 53 15 1,387 689 698 61 124 59 65 16 1,284 639 645 62 118 49 69 17 1,195 618 577 63 116 58 58 18 1,213 622 591 64 125 66 59 19 1,237 625 612 65 82 34 48 20 1,028 523 505 66 78 39 39 21 902 459 443 67 95 56 39 22 921 447 474 68 91 50 41 23 897 431 466 69 89 51 38 24 797 406 391 70 70 31 39 25 854 444 410 71 75 42 33 26 759 381 378 72 66 27 39 27 712 363 349 73 39 19 20 28 669 318 351 74 51 25 26 29 756 384 372 75 47 25 22 30 773 408 365 76 34 14 20 31 619 309 310 77 33 15 18 32 612 317 295 78 44 20 24 33 617 296 321 79 40 17 23 34 599 322 277 80 32 14 18 35 618 334 284 81 27 16 11 36 599 300 299 82 17 8 9 37 457 215 242 83 11 2 9 38 552 275 277 84 16 3 13 39 626 332 294 85 21 10 11 40 508 247 261 86 7 3 4 41 464 242 222 87 7 1 6 42 442 234 208 88 7 4 3 43 492 228 264 89+ 20 7 13 44 484 244 240 Not reported 86 39 47
Source: 1999 Census of Population and Housing, EPPSO

2001 RMI Statistical Abstract
14
Table 2.4 PROJECTIONS OF MID-YEAR POPULATION BY AGE AND SEX, BASED ON 1999 CENSUS OF POPULATION AND HOUSING, 1999 to 2019
YEAR Age Group 1999 2004 2009 2014 2019
Total 50,908 61,218 72,167 81,272 88,507 0-4 7,674 11,315 12,142 10,402 8,700 5-9 6,660 7,619 11,249 12,082 10,357 10-14 7,539 6,633 7,594 11,217 12,056 15-19 6,337 7,501 6,608 7,567 11,187 20-24 4,558 6,293 7,446 6,575 7,534 25-29 3,759 4,516 6,241 7,401 6,539 30-34 3,235 3,723 4,481 6,195 7,356 35-39 2,861 3,195 3,681 4,439 6,149 40-44 2,397 2,819 3,141 3,637 4,392 45-49 2,029 2,344 2,749 3,085 3,578 50-54 1,369 1,960 2,269 2,672 3,006 55-59 791 1,299 1,857 2,158 2,562 60-64 598 731 1,196 1,725 2,015 65-69 438 527 643 1,062 1,540 70-74 299 355 430 529 885 75+ 364 388 440 526 651
Male 26,058 31,284 36,840 41,441 45,048 0-4 3,967 5,792 6,217 5,330 4,441 5-9 3,393 3,935 5,756 6,185 5,303 10-14 3,898 3,379 3,923 5,736 6,169 15-19 3,203 3,875 3,363 3,904 5,717 20-24 2,273 3,177 3,841 3,341 3,881 25-29 1,892 2,247 3,148 3,817 3,319 30-34 1,660 1,874 2,229 3,120 3,791 35-39 1,461 1,635 1,852 2,206 3,095 40-44 1,198 1,436 1,609 1,828 2,180 45-49 1,122 1,168 1,395 1,576 1,794 50-54 732 1,078 1,124 1,353 1,529 55-59 431 688 1,011 1,062 1,288 60-64 293 391 626 930 980 65-69 233 254 339 545 816 70-74 143 183 201 271 442 75+ 159 172 206 237 303
Female 24,850 29,934 35,327 39,831 43,459 0-4 3,707 5,523 5,925 5,072 4,259 5-9 3,267 3,684 5,493 5,897 5,054 10-14 3,641 3,254 3,671 5,481 5,887 15-19 3,134 3,626 3,245 3,663 5,470 20-24 2,285 3,116 3,605 3,234 3,653 25-29 1,867 2,269 3,093 3,584 3,220 30-34 1,575 1,849 2,252 3,075 3,565 35-39 1,400 1,560 1,829 2,233 3,054 40-44 1,199 1,383 1,532 1,809 2,212 45-49 907 1,176 1,354 1,509 1,784 50-54 637 882 1,145 1,319 1,477 55-59 360 611 846 1,096 1,274 60-64 305 340 570 795 1,035 65-69 205 273 304 517 724 70-74 156 172 229 258 443 75+ 205 216 234 289 348
Source: 1999 Census of Population and Housing, EPPSO

2001 RMI Statistical Abstract
15
Table 2.5 POPULATION IN ATOLLS/ISLANDS BY SEX AND FIVE-YEAR AGE GROUPS, 1988 AGE GROUP Atoll/Island TOTAL 0-4 5-9 10-14 15-19 20-24 25-29 30-34 35-39 40-44 45-49 50-54 55-59 60-64 65-69 70-74 75+ Total 43,380 8,651 7,609 5,876 4,085 3,510 3,027 2,656 2,187 1,492 971 743 680 635 544 373 341 Ailinglaplap 1,715 398 357 289 107 100 95 115 70 51 24 18 20 21 18 18 14 Ailuk 488 104 108 69 29 38 31 27 12 14 9 13 8 7 11 2 6 Arno 1,656 389 347 236 120 126 103 80 74 41 18 21 20 25 21 23 12 Aur 438 81 87 74 43 31 25 30 22 13 4 4 8 6 3 2 5 Bikini 10 0 0 0 0 2 2 2 1 1 1 1 0 0 0 0 0 Ebon 741 137 174 132 43 41 45 32 40 30 20 5 7 3 12 9 11 Enewetak 715 153 129 93 43 82 48 46 35 23 15 17 8 6 10 2 5 Jabat 112 28 20 14 6 10 8 6 3 4 2 2 1 2 3 0 3 Jaluit 1,709 346 311 264 217 103 94 77 75 52 30 30 25 21 26 17 21 Kili 602 131 117 60 27 53 53 51 25 17 18 9 11 12 9 5 4 Kwajalein 9,311 1,927 1,606 1,249 782 798 700 605 524 344 201 153 137 97 101 44 43 Lae 319 77 69 39 24 31 24 11 10 11 5 3 7 1 1 5 1 Lib 115 25 20 17 5 6 10 9 6 5 1 4 3 1 3 0 0 Likiep 482 100 95 68 28 35 29 31 23 14 10 3 8 12 8 8 10 Majuro 19,664 3,624 3,061 2,504 2,184 1,668 1,417 1,248 1,043 713 498 393 363 346 260 192 150 Maloelap 796 160 165 110 72 57 54 43 39 22 22 9 9 14 11 6 3 Mejit 445 91 89 61 29 27 34 29 28 16 14 2 3 6 6 5 5 Mili 854 168 198 119 69 60 56 50 36 22 12 12 11 11 10 9 11 Namorik 814 184 182 129 60 43 47 31 35 27 16 10 5 20 8 5 12 Namu 801 164 161 115 79 68 52 40 24 27 15 18 11 5 6 6 10 Ujae 448 114 94 67 23 34 27 35 14 12 6 7 7 3 3 2 0 Utirik 409 97 72 53 29 38 22 26 17 11 13 3 2 4 8 7 7 Wotho 90 14 18 16 5 7 6 5 4 4 1 1 2 3 1 1 2 Wotje 646 139 129 98 61 52 45 27 27 18 16 5 4 9 5 5 6 Male 22,181 4,423 3,884 3,055 2,104 1,686 1,520 1,348 1,205 758 549 386 359 313 255 183 153 Ailinglaplap 875 206 185 143 57 44 51 63 35 26 11 7 13 12 8 8 6 Ailuk 242 42 60 33 15 23 14 18 5 6 4 8 4 3 5 1 1 Arno 858 205 182 128 59 61 50 34 43 19 12 12 12 12 10 11 8 Aur 231 42 44 42 24 14 13 16 14 6 1 2 6 2 1 1 3 Bikini 10 - - - - 2 2 2 1 1 1 1 - - - - - Ebon 400 68 94 82 25 20 24 20 22 14 11 2 3 1 6 3 5 Enewetak 395 86 74 48 26 39 20 28 23 13 8 10 6 4 5 2 3 Jabat 56 13 9 5 4 5 4 5 2 2 1 1 1 2 2 - - Jaluit 870 161 159 133 107 58 48 41 48 24 17 15 14 9 17 10 9 Kili 322 80 65 32 11 21 23 27 18 11 12 4 5 3 6 2 2 Kwajalein 4,683 951 798 644 406 366 373 291 286 168 123 75 70 43 50 22 17 Lae 170 39 33 23 13 16 14 6 7 4 2 3 4 - 1 5 - Lib 58 12 8 7 4 3 2 7 4 4 1 1 2 - 3 - - Likiep 253 48 47 36 13 23 17 16 15 8 5 2 4 6 5 4 4 Majuro 9,990 1,871 1,575 1,291 1,103 796 694 624 561 363 278 203 184 174 109 90 74 Maloelap 420 91 87 53 40 33 23 22 22 12 13 6 2 8 4 3 1 Mejit 223 45 37 32 15 12 15 19 13 9 8 1 3 3 4 3 4 Mili 456 91 104 59 39 31 28 26 23 16 6 7 6 7 4 2 7 Namorik 414 96 84 73 32 23 25 12 20 11 7 6 4 12 4 2 3 Namu 410 88 89 64 38 31 25 15 10 17 7 9 7 2 4 3 1 Ujae 243 58 51 39 17 14 16 17 7 6 5 5 3 3 1 1 - Utirik 217 51 36 31 19 16 8 16 11 5 6 2 2 2 2 6 4 Wotho 47 4 7 11 2 7 4 2 2 2 - 1 2 1 - 1 1 Wotje 338 75 56 46 35 28 27 21 13 11 10 3 2 4 4 3 - Female 21,199 4,228 3,725 2,821 1,981 1,824 1,507 1,308 982 734 422 357 321 322 289 190 188 Ailinglaplap 840 192 172 146 50 56 44 52 35 25 13 11 7 9 10 10 8 Ailuk 246 62 48 36 14 15 17 9 7 8 5 5 4 4 6 1 5 Arno 798 184 165 108 61 65 53 46 31 22 6 9 8 13 11 12 4 Aur 207 39 43 32 19 17 12 14 8 7 3 2 2 4 2 1 2 Bikini - - - - - - - - - - - - - - - - - Ebon 341 69 80 50 18 21 21 12 18 16 9 3 4 2 6 6 6 Enewetak 320 67 55 45 17 43 28 18 12 10 7 7 2 2 5 - 2 Jabat 56 15 11 9 2 5 4 1 1 2 1 1 - - 1 - 3 Jaluit 839 185 152 131 110 45 46 36 27 28 13 15 11 12 9 7 12 Kili 280 51 52 28 16 32 30 24 7 6 6 5 6 9 3 3 2 Kwajalein 4,628 976 808 605 376 432 327 314 238 176 78 78 67 54 51 22 26 Lae 149 38 36 16 11 15 10 5 3 7 3 - 3 1 - - 1 Lib 57 13 12 10 1 3 8 2 2 1 - 3 1 1 - - - Likiep 229 52 48 32 15 12 12 15 8 6 5 1 4 6 3 4 6 Majuro 9,674 1,753 1,486 1,213 1,081 872 723 624 482 350 220 190 179 172 151 102 76 Maloelap 376 69 78 57 32 24 31 21 17 10 9 3 7 6 7 3 2 Mejit 222 46 52 29 14 15 19 10 15 7 6 1 - 3 2 2 1 Mili 398 77 94 60 30 29 28 24 13 6 6 5 5 4 6 7 4 Namorik 400 88 98 56 28 20 22 19 15 16 9 4 1 8 4 3 9 Namu 391 76 72 51 41 37 27 25 14 10 8 9 4 3 2 3 9 Ujae 205 56 43 28 6 20 11 18 7 6 1 2 4 - 2 1 - Utirik 192 46 36 22 10 22 14 10 6 6 7 1 - 2 6 1 3 Wotho 43 10 11 5 3 - 2 3 2 2 1 - - 2 1 - 1 Wotje 308 64 73 52 26 24 18 6 14 7 6 2 2 5 1 2 6 Source: 1988 Census of Population and Housing, EPPSO

2001 RMI Statistical Abstract
16
Table 2.6 POPULATION IN ATOLLS / ISLANDS BY SEX AND FIVE-YEAR AGE GROUPS, 1999
AGE GROUP Not Atoll/Island TOTAL 0-4 5-9 10-14 15-19 20-24 25-29 30-34 35-39 40-44 45-49 50-54 55-59 60-64 65-69 70-74 75-
79 80+ reported
Total 50,840 7,652 6,640 7,513 6,316 4,545 3,750 3,220 2,852 2,390 2,023 1,365 792 597 435 301 198 165 86 Ailinglaplap 1,959 333 302 370 234 117 105 95 82 102 61 44 28 16 23 14 9 9 15 Ailuk 513 80 78 80 72 32 32 44 19 23 8 10 6 11 3 6 3 4 2 Arno 2,069 352 353 337 248 166 134 116 104 68 65 45 21 18 17 7 12 6 Aur 537 81 70 85 57 53 38 44 23 23 11 19 9 9 9 3 2 1 Bikini 13 1 1 2 2 2 1 1 3 Ebon 902 115 135 154 102 71 62 44 40 42 39 30 16 5 9 10 7 11 10 Enewetak 853 136 137 128 69 76 65 59 51 42 31 22 7 15 4 3 4 4 Jabat 95 13 16 25 6 5 7 3 4 7 2 3 3 1 Jaluit 1,669 251 227 302 255 117 76 70 86 77 73 40 22 25 13 13 9 10 3 Kili 774 106 107 96 86 65 55 37 79 40 29 13 25 14 12 5 4 1 Kwajalein 10,902 1,752 1,393 1,619 1,324 924 791 767 634 512 478 288 157 101 72 44 34 9 3 Lae 322 52 63 67 22 23 22 21 23 5 9 4 4 2 3 1 1 Lib 147 33 28 21 13 10 9 8 7 8 2 - 5 1 1 1 Likiep 527 63 71 112 51 33 27 33 30 27 16 10 13 7 10 6 2 4 12 Majuro 23,676 3,419 2,813 3,087 3,021 2,410 1,909 1,569 1,348 1,186 988 692 387 314 208 154 82 80 9 Maloelap 856 143 109 129 107 66 66 49 52 39 32 18 15 7 9 8 5 1 1 Mejit 416 47 60 89 44 31 23 22 25 21 21 13 8 2 1 4 4 1 Mili 1,032 167 148 176 131 96 76 46 47 38 34 27 12 10 6 5 3 5 5 Namorik 772 113 111 151 103 56 40 34 39 26 32 23 10 5 9 7 4 9 Namu 903 104 125 164 129 75 63 58 52 38 23 25 13 17 11 2 3 1 Rongelap 19 1 1 2 4 3 4 3 1 Ujae 440 70 78 75 61 25 30 26 21 14 7 8 8 5 8 1 2 1 Utirik 433 71 75 69 43 34 36 22 28 20 14 3 6 2 3 1 5 1 Wotho 145 21 21 21 19 11 17 4 9 3 3 4 5 1 2 1 3 Wotje 866 130 120 156 117 47 63 43 44 24 41 24 9 10 3 7 1 3 24 Male 26,026 3,957 3,384 3,886 3,193 2,266 1,890 1,652 1,456 1,195 1,119 731 432 293 230 144 91 68 39 Ailinglaplap 1,021 175 153 211 129 53 55 48 45 51 31 19 14 5 12 8 1 3 8 Ailuk 260 45 36 38 37 15 15 26 9 12 5 5 3 5 3 2 1 2 1 Arno 1,097 191 190 194 126 75 66 59 53 38 34 26 16 9 10 3 6 1 - Aur 281 48 39 43 25 25 20 23 14 12 6 8 5 6 4 2 1 - - Bikini 13 - - - 1 1 2 2 2 1 1 - 3 - - - - - - Ebon 456 56 73 79 48 41 28 25 21 20 19 16 11 2 4 2 4 3 4 Enewetak 439 68 68 63 36 40 34 36 22 19 19 12 3 9 2 1 3 4 - Jabat 51 5 9 18 1 3 5 1 2 4 - 1 1 - - - 1 - - Jaluit 852 137 116 141 133 57 37 35 42 43 45 21 15 11 7 2 3 5 2 Kili 417 53 66 49 47 30 26 18 45 20 21 7 15 5 8 5 2 - - Kwajalein 5,539 882 695 852 659 452 404 392 322 261 248 153 87 56 39 17 16 3 1 Lae 162 25 33 34 12 10 10 11 12 1 6 2 2 2 1 - - 1 - Lib 72 14 12 14 5 3 5 5 3 5 2 - 2 - - - 1 1 - Likiep 258 30 36 53 23 14 12 19 19 14 8 7 4 5 5 1 1 2 5 Majuro 12,075 1,782 1,422 1,559 1,520 1,217 963 792 693 574 559 375 208 147 105 83 37 34 5 Maloelap 441 73 57 75 51 34 30 25 24 21 18 11 6 4 4 4 3 - 1 Mejit 201 19 33 42 22 16 10 12 11 13 8 6 5 1 - 2 1 - - Mili 549 97 71 90 71 52 42 20 21 18 19 18 8 6 4 4 2 3 3 Namorik 402 67 60 79 51 30 20 15 22 14 18 9 4 2 5 1 2 3 - Namu 472 54 59 90 77 40 31 30 25 18 13 15 4 9 6 1 - - - Rongelap 19 - - - 1 1 2 4 3 4 3 - - - - - 1 - - Ujae 232 35 46 33 36 14 17 14 9 6 2 3 5 3 6 1 1 1 - Utirik 216 32 37 39 22 13 21 12 11 11 9 2 2 1 2 1 1 - - Wotho 74 7 11 11 9 6 10 3 4 2 1 2 3 1 1 1 2 - - Wotje 427 62 62 79 51 24 25 25 22 13 24 13 6 4 2 3 1 2 9 Female 24,814 3,695 3,256 3,627 3,123 2,279 1,860 1,568 1,396 1,195 904 634 360 304 205 157 107 97 47 Ailinglaplap 938 158 149 159 105 64 50 47 37 51 30 25 14 11 11 6 8 6 7 Ailuk 253 35 42 42 35 17 17 18 10 11 3 5 3 6 - 4 2 2 1 Arno 972 161 163 143 122 91 68 57 51 30 31 19 5 9 7 4 6 5 - Aur 256 33 31 42 32 28 18 21 9 11 5 11 4 3 5 1 1 1 - Bikini - - - - - - - - - - - - - - - - - - Ebon 446 59 62 75 54 30 34 19 19 22 20 14 5 3 5 8 3 8 6 Enewetak 414 68 69 65 33 36 31 23 29 23 12 10 4 6 2 2 1 - - Jabat 44 8 7 7 5 2 2 2 2 3 2 2 2 - - - - - - Jaluit 817 114 111 161 122 60 39 35 44 34 28 19 7 14 6 11 6 5 1 Kili 357 53 41 47 39 35 29 19 34 20 8 6 10 9 4 - 2 1 - Kwajalein 5,363 870 698 767 665 472 387 375 312 251 230 135 70 45 33 27 18 6 2 Lae 160 27 30 33 10 13 12 10 11 4 3 2 2 - 2 - - - 1 Lib 75 19 16 7 8 7 4 3 4 3 - - 3 1 - - - - - Likiep 269 33 35 59 28 19 15 14 11 13 8 3 9 2 5 5 1 2 7 Majuro 11,601 1,637 1,391 1,528 1,501 1,193 946 777 655 612 429 317 179 167 103 71 45 46 4 Maloelap 415 70 52 54 56 32 36 24 28 18 14 7 9 3 5 4 2 1 - Mejit 215 28 27 47 22 15 13 10 14 8 13 7 3 1 1 2 3 1 - Mili 483 70 77 86 60 44 34 26 26 20 15 9 4 4 2 1 1 2 2 Namorik 370 46 51 72 52 26 20 19 17 12 14 14 6 3 4 6 2 6 - Namu 431 50 66 74 52 35 32 28 27 20 10 10 9 8 5 1 - 3 1 Rongelap - - - - - - - - - - - - - - - - - - Ujae 208 35 32 42 25 11 13 12 12 8 5 5 3 2 2 - 1 - - Utirik 217 39 38 30 21 21 15 10 17 9 5 1 4 1 1 - 4 1 - Wotho 71 14 10 10 10 5 7 1 5 1 2 2 2 - 1 - 1 - - Wotje 439 68 58 77 66 23 38 18 22 11 17 11 3 6 1 4 - 1 15
Source: 1999 Census of Population and Housing, EPPSO

2001 RMI Statistical Abstract
17
Table 2.7 POPULATION DISTRIBUTION BY SEX AND FIVE YEAR AGE GROUPS, 1958 to 1999 Age Group 1958 1973 1980 1988 1999
Total 14,163 25,045 30,873 43,380 50,8400-4 2,665 4,631 6,502 8,651 7,6525-9 2,115 3,899 5,023 7,609 6,64010-14 1,485 3,088 4,054 5,876 7,51315-19 928 2,764 2,956 4,085 6,31620-24 837 2,045 2,601 3,510 4,54525-29 905 1,511 2,225 3,027 3,75030-34 811 935 1,779 2,656 3,22035-39 773 861 1,136 2,187 2,85240-44 585 789 819 1,492 2,39045-49 591 727 809 971 2,02350-54 432 716 699 743 1,36555-59 421 640 664 680 79260-64 409 512 642 635 59765-69 263 348 423 544 43570-74 222 252 244 373 30175+ 319 371 297 341 363Unknown 402 956 - - 86
Male 7,080 12,335 15,851 22,181 26,0260-4 1,346 2,437 3,377 4,423 3,9575-9 1,162 2,023 2,661 3,884 3,38410-14 782 1,550 2,117 3,055 3,88615-19 452 1,379 1,434 2,104 3,19320-24 411 1,070 1,223 1,686 2,26625-29 462 741 1,142 1,520 1,89030-34 421 489 930 1,348 1,65235-39 386 429 608 1,205 1,45640-44 294 427 436 758 1,19545-49 317 358 409 549 1,11950-54 201 357 376 386 73155-59 201 328 332 359 43260-64 231 263 359 313 29365-69 151 159 212 255 23070-74 120 113 107 183 14475+ 143 182 128 153 159Unknown - 30 - - 39
Female 6,681 11,800 15,022 21,199 24,8140-4 1,319 2,194 3,125 4,228 3,6955-9 953 1,876 2,362 3,725 3,25610-14 703 1,538 1,937 2,821 3,62715-19 476 1,385 1,522 1,981 3,12320-24 426 975 1,378 1,824 2,27925-29 443 770 1,083 1,507 1,86030-34 390 446 849 1,308 1,56835-39 387 432 528 982 1,39640-44 291 362 383 734 1,19545-49 274 369 400 422 90450-54 231 359 323 357 63455-59 220 312 332 321 36060-64 178 249 283 322 30465-69 112 189 211 289 20570-74 102 139 137 190 15775+ 176 189 169 188 204Unknown - 16 - - 47 Notes: 1. Figures for 1958 indicate the Marshallese population born in Marshall Islands. Others born elsewhere numbered 402. Figures for 1967 by age not available, counts collected by Peace Corps, and figures for 1973 are actual counts of 1973 TTPI Census. Sources: Census of the Trust Territory of the Pacific Islands (TTPI), 1958 (prepared by the High Commissioner, of the TTPI, June, 1959), 1973 Population of TTPI, 1980 Census of Population, TTPI, US Bureau of Census, 1988 Census of Population and Housing, 1999 Census of Population and Housing
2001 RMI Statistical Abstract
18
Table 2.8 LAND AREA AND POPULATION DENSITY BY ATOLLS AND ISLANDS (persons per square mile), 1973 to 1999
Land area 1973 1980 1988 1999 Atoll/Island (sq miles) Population Density Population Density Population Density Population Density
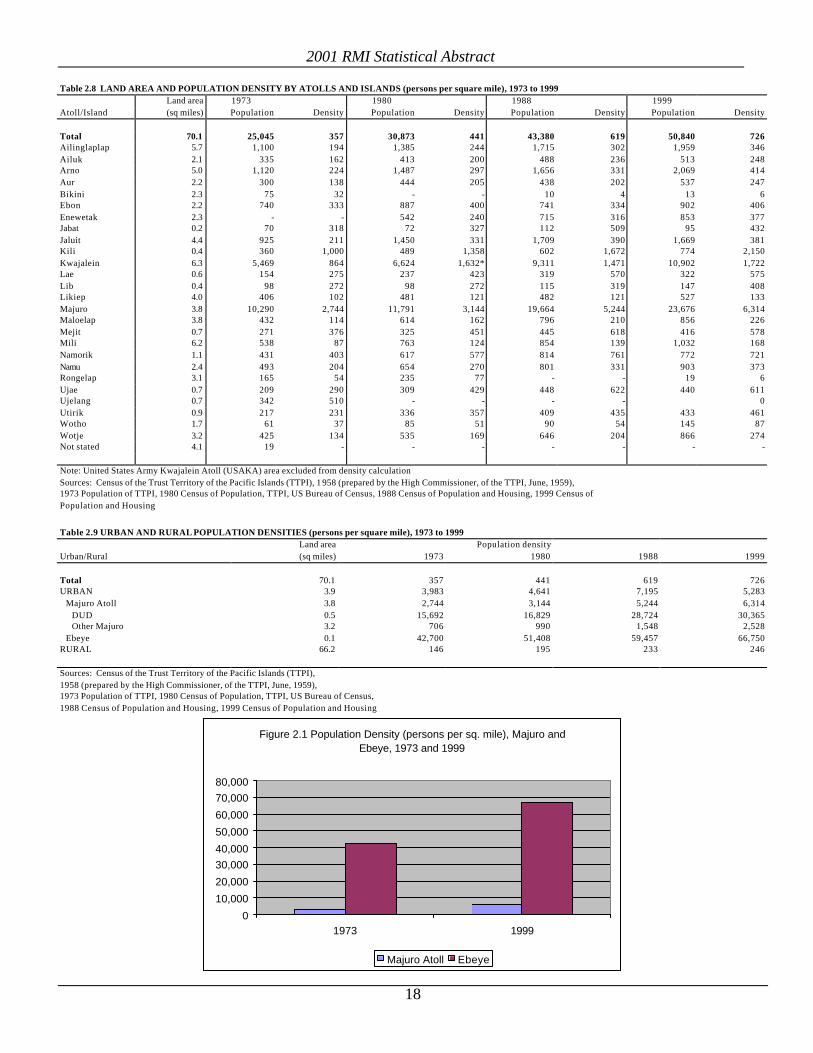
Total 70.1 25,045 357 30,873 441 43,380 619 50,840 726 Ailinglaplap 5.7 1,100 194 1,385 244 1,715 302 1,959 346 Ailuk 2.1 335 162 413 200 488 236 513 248 Arno 5.0 1,120 224 1,487 297 1,656 331 2,069 414 Aur 2.2 300 138 444 205 438 202 537 247 Bikini 2.3 75 32 - - 10 4 13 6 Ebon 2.2 740 333 887 400 741 334 902 406 Enewetak 2.3 - - 542 240 715 316 853 377 Jabat 0.2 70 318 72 327 112 509 95 432 Jaluit 4.4 925 211 1,450 331 1,709 390 1,669 381 Kili 0.4 360 1,000 489 1,358 602 1,672 774 2,150 Kwajalein 6.3 5,469 864 6,624 1,632* 9,311 1,471 10,902 1,722 Lae 0.6 154 275 237 423 319 570 322 575 Lib 0.4 98 272 98 272 115 319 147 408 Likiep 4.0 406 102 481 121 482 121 527 133 Majuro 3.8 10,290 2,744 11,791 3,144 19,664 5,244 23,676 6,314 Maloelap 3.8 432 114 614 162 796 210 856 226 Mejit 0.7 271 376 325 451 445 618 416 578 Mili 6.2 538 87 763 124 854 139 1,032 168 Namorik 1.1 431 403 617 577 814 761 772 721 Namu 2.4 493 204 654 270 801 331 903 373 Rongelap 3.1 165 54 235 77 - - 19 6 Ujae 0.7 209 290 309 429 448 622 440 611 Ujelang 0.7 342 510 - - - - 0 Utirik 0.9 217 231 336 357 409 435 433 461 Wotho 1.7 61 37 85 51 90 54 145 87 Wotje 3.2 425 134 535 169 646 204 866 274 Not stated 4.1 19 - - - - - - -
Note: United States Army Kwajalein Atoll (USAKA) area excluded from density calculation Sources: Census of the Trust Territory of the Pacific Islands (TTPI), 1 958 (prepared by the High Commissioner, of the TTPI, June, 1959), 1973 Population of TTPI, 1980 Census of Population, TTPI, US Bureau of Census, 1988 Census of Population and Housing, 1999 Census of Population and Housing
Table 2.9 URBAN AND RURAL POPULATION DENSITIES (persons per square mile), 1973 to 1999
Land area Population density Urban/Rural (sq miles) 1973 1980 1988 1999
Total 70.1 357 441 619 726 URBAN 3.9 3,983 4,641 7,195 5,283 Majuro Atoll 3.8 2,744 3,144 5,244 6,314 DUD 0.5 15,692 16,829 28,724 30,365 Other Majuro 3.2 706 990 1,548 2,528 Ebeye 0.1 42,700 51,408 59,457 66,750 RURAL 66.2 146 195 233 246
Sources: Census of the Trust Territory of the Pacific Islands (TTPI), 1958 (prepared by the High Commissioner, of the TTPI, June, 1959), 1973 Population of TTPI, 1980 Census of Population, TTPI, US Bureau of Census, 1988 Census of Population and Housing, 1999 Census of Population and Housing
Figure 2.1 Population Density (persons per sq. mile), Majuro and Ebeye, 1973 and 1999
0
10,000
20,000
30,00040,000
50,000
60,000
70,00080,000
1973 1999
Majuro Atoll Ebeye

2001 RMI Statistical Abstract
19
Table 2.10 URBAN POPULATION BY PLACE AND BROAD AGE GROUP, 1988 Area Total 0-4 yrs 5-14 yrs 15-64 yrs 65+ yrs
Total 27,988 5,340 8,082 13,798 768 Majuro Atoll 19,664 3,624 5,565 9,873 602
Majuro DUD 14,649 2,706 4,111 7,377 455Darrit 6,813 1,233 1,967 3,408 205Uliga 2,144 366 573 1,130 75Delap 5,692 1,107 1,571 2,839 175
Majuro other 5,015 918 1,454 2,496 147Jelter 24 4 8 9 3Rongrong 245 9 51 185 -Kalalen 19 4 3 10 2Biken 8 1 3 4 -Enemanet 6 3 1 2 -Denmeo 7 - 6 1 -Bokmej 14 4 4 6 -Didej 16 3 1 11 1Kora 9 2 1 6 -Ejit 170 30 58 78 4Enearmij 3 - - 3 -Rairok 2,021 365 559 1,038 59Ajeltake 556 103 179 248 26Woja 224 35 72 112 5Arrak 118 16 39 60 3Laura 1,575 339 469 723 44
Ebeye 8,324 1,716 2,517 3,925 166
Source: 1988 Census of Population and Housing, EPPSO
Table 2.11 URBAN POPULATION BY PLACE AND BROAD AGE GROUP, 1999 Not
Area Total 0-4 yrs 5-14 yrs 15-64 yrs 65+ yrs reported
Total 34,578 5,171 8,912 19,800 683 12
Majuro Atoll 23,676 3,419 5,900 13,824 524 9 Majuro DUD 15,486 2,206 3,808 9,125 340 7 Darrit 7,103 1,001 1,773 4,183 142 4 Uliga 2,044 293 483 1,215 53 Delap 6,339 912 1,552 3,727 145 3 Majuro other 8,190 1,213 2,092 4,699 184 2 Jelter 4 - - 2 2 - Rongrong 31 4 6 19 2 - Kolalen 6 - 2 3 1 - Bokaetoktok 3 - - 3 - - Lobikaire 2 - - 2 - - Aneen Wudej 5 1 - 4 - - Aneko 9 2 4 3 - - Enemanet 10 3 3 4 - - Denmeo 2 - - 2 - - Kemmaan 5 1 2 2 - - Didej 25 6 5 14 - - Ejit 219 43 58 111 7 - Rairok 3,846 574 947 2,233 90 2 Ajeltake 1,170 166 303 666 35 - Woja 343 57 86 197 3 - Arrak 249 42 57 150 - - Laura 2,256 314 617 1,281 44 - Pikiriin 5 - 2 3 - - Kwajalein Atoll 10,902 1,752 3,012 5,976 159 3 Enubirr (Santo) 621 121 157 341 2 - Ningi (Nene) 1 - - 1 - - Gugeegue 143 26 37 79 1 - Ebwaj 7 4 1 2 - - North Loi 66 6 14 44 2 - South Loi 10 - 6 4 - - Ebeye 9,345 1,484 2,579 5,137 142 3 Ebjadik 2 - - 2 - - Orpap 2 - - 2 - - Kwajalein(USAKA) 104 22 28 54 - - Enibuuj 52 7 20 23 2 - Carlos 56 3 20 33 - - Mejatto 400 67 113 214 6 - Ebadon 93 12 37 40 4 - Source: 1999 Census of Population and Housing, EPPSO

2001 RMI Statistical Abstract
20
Table 2.12 POPULATION BY ATOLL/ISLAND, 1958 to 1999 Atoll/Island 1958 1967 1973 1980 1988 1999
Total 14,163 18,925 25,045 30,873 43,380 50,840 Ailinglaplap 1,288 1,195 1,100 1,385 1,715 1,959 Ailuk 419 384 335 413 488 513 Arno 1,037 1,273 1,120 1,487 1,656 2,069 Aur 241 361 300 444 438 537 Bikini - - 75 - 10 13 Ebon 819 836 740 887 741 902 Enewetak - - - 542 715 853 Jabat - - 70 72 112 95 Jaluit 1,098 1,113 925 1,450 1,709 1,669 Kili 267 309 360 489 602 774 Kwajalein 1,284 3,540 5,469 6,624 9,311 10,902 Lae 165 131 154 237 319 322 Lib 44 142 98 98 115 147 Likiep 636 430 406 481 482 527 Majuro 3,415 5,249 10,290 11,791 19,664 23,676 Maloelap 454 494 432 614 796 856 Mejit 346 320 271 325 445 416 Mili 412 582 538 763 854 1,032 Namorik 523 547 431 617 814 772 Namu 482 597 493 654 801 903 Rongelap 264 189 165 235 - 19 Ujae 167 191 209 309 448 440 Ujelang 172 251 342 - - - Utrik 198 269 217 336 409 433 Wotho 71 - 61 85 90 145 Wotje 361 396 425 535 646 866 Not stated - 126 19 - - - Notes: Bikini people relocated to Kili Island (1958/67), Enewetak people relocated to Ujelang Atoll (1958-73). Kwajalein counts excluding non-marshallese residents of Kwajalein Missile Range Enewetak people returned to Enewetak Atoll from Ujelang in 1980 Sources: Quarterly Bulletin of Statistics, Trust Territory of the Pacific Islands, Vol. III., No. 2 1988 Census of Population and Housing, EPPSO
Figure 2.2 RMI Population, 1958 to 1999
10,000
20,000
30,000
40,000
50,000
60,000
1958 1967 1973 1980 1988 1999

2001 RMI Statistical Abstract
21
Table 2.13 POPULATION BY ATOLL AND ISLAND, 1988 Atoll/Island Pop Atoll/Island Pop Atoll/Island Pop Atoll/Island Pop Ailinglaplap 1,715 Aur 438 Kwajalein 9,311 Maloelap 796 Woja 406 Tabal 219 Ebeye 8,324 Kaben 246 Airuk 370 Aur 219 Enubirr 494 Airok 194 Jeh 367 Mejatto 282 Tarawa 147 Buoj 285 Bikini 10 Ennylabegan 67 Jang 106 Jabwan 117 Eneu 10 Ebadon 49 Wolot 103 Mejil 57 North Loi 21 Kattiej 29 Ebon 741 Gugeegue 16 Mejit 445 Enewe 22 Toka 267 Enubuj 14 Mejit 445 Beran 19 Jittaken 209 Ebioagi 13 Bikor 17 Jittoen 188 Ebijerikku 10 Mili 854 Tobomaro 9 Enekoion 52 Ningi 6 Mili 390 Ennak 9 Enilok 17 Arbwa 6 Nalu 169 Mejajok 8 Enearmij 5 Orubebbu 5 Enajet 154 Emej 3 South Loi 4 Tokewa 74 Ailuk 488 Lukonwor 67 Ailuk 333 Enewetak 715 Lae 319 Enejelar 55 Enewetak 594 Lae 296 Namorik 814 Enejabrok 43 Medren 121 Enerein 14 Namorik 814 Kapen 14 Ribon 5 Aliej 14 Jabat 112 Lejab 4 Namu 801 Biken 8 Jabat 112 Namu 293 Marib 8 Likiep 482 Majkin 237 Alkilwe 6 Jaluit 1,709 Likiep 344 Mae 151 Ajelep 4 Jabwor 674 Jebal 74 Loen 107 Barorkan 3 Jaluit 246 Melang 64 Lukoj 8 Imiej 158 Enemak 5 Arno 1,656 Mejrirok 144 Majuro 19,664 Ajeltokrok 429 Imroj 140 Darrit 6,813 Ujae 448 Kobjeltak 331 Narmej 93 Dalap 5,692 Ujae 448 Rearlaplap 254 Mejatto 65 Uliga 2,144 Langor 162 Jabnoren 44 Rairok 2,021 Utirik 409 Ulien 162 Lonone 38 Laura 1,575 Utirik 409 Tutu 106 Ajejen 34 Ajeltake 556 Bikarej 66 Bokanake 15 Rongrong 245 Wotho 90 Iloan 27 Ewo 13 Woja 224 Wotho 90 Jilane 19 Ae 13 Ejit 170 Mwejrik 16 Wotle 10 Arrak 118 Wotje 646 Boken 16 Bukantorak 8 Jelter 24 Wotje 360 Eneaitok 11 Pinglep 7 Kalalen 19 Wormej 184 Eneweto 10 Menge 3 Didej 16 Nibun 54 Namwi 9 Den 2 Bokmej 14 Bodao 15 Ajmanol 7 Nanij 2 Kora 9 Kaben 9 Bikonele 5 Biken 8 Kaijen 7 Taklep 5 Kili 602 Denmeo 7 Ukon 5 Kolalen 5 Kili 602 Enemanet 6 Wetwirok 5 Autlep 5 Enearmij 3 Kimajo 4 Kejbwe 4 Lib 115 Enejeltak 3 Enrik 4 Lib 115 Rongelap - Kabinbok 3 Ujelang - Source: 1988 Census of Population and Housing, EPPSO

2001 RMI Statistical Abstract
22
Table 2.14 POPULATION BY ATOLL AND ISLAND, 1999
Atoll/Island Pop Atoll/Island Pop Atoll/Island Pop Atoll/Island Pop Ailinglaplap 1,959 Aur 537 Kwajalein 10,902 Ujelang - Woja 487 Aur 287 Ebeye 9,345 Aerok 372 Tabal 250 Enubirr 621 Maloelap 856 Jeh 303 Mejatto 400 Kaben 266 Buoj 265 Bikini 13 Gugeegue 143 Tarawa 192 Jabwan 126 Bikini 13 USAKA 104 Airok 174 Enewe 122 Ebadon 93 Jang 125 Jah 109 Ebon 902 North Loi 66 Wolot 99 Mejil 69 Toka 310 Carlos 56 Kattiej 43 Jittaken 242 Enubuj 52 Mejit 416 Mejajok 31 Jittoen 194 South Loi 10 Mejit 416 Wolar 11 Enekoion 58 Ebwaj 7 Tobomaro 8 Enilok 55 Ebjadik 2 Mili 1,032 Bikeer 8 Rerok 34 Orpap 2 Mili 396 Beran 5 Emej 8 Ningi 1 Nallu 203 Enearmij 1 Enajet 152 Ailuk 513 Lae 322 Lukonwor 92 Ailuk 451 Enewetak 853 Lae 304 Tokewa 52 Enejabrok 22 Enewetak 823 Enerein 14 Nad 29 Biken 13 Medren 26 Lejab 4 Arbar 28 Aliej 11 Japtan 4 Bar 26 Kapen 7 Likiep 527 Anel 17 Enejelar 5 Jabat 95 Likiep 389 Bikonel Namen 11 Ajelep 4 Jabat 95 Melang 71 Aeloneo 11 Jebal 49 Jabonwod 10 Arno 2,069 Jaluit 1,669 Liklal 18 Wau 5 Ine 283 Jabwor 610 Arno Arno 271 Jaluit 293 Majuro 23,676 Ulien 196 Imiej 166 Darrit 7,103 Namorik 772 Bikarej 183 Imroj 131 Delap 6,339 Namorik 772 Langor 181 Mejrirok 98 Rairok 3,846 Tinak 176 Jabnoren 86 Laura 2,256 Namu 903 Matolen 143 Narmej 80 Uliga 2,044 Majkin 333 Japo 120 Lonone 51 Ajeltake 1,170 Namu 258 Lukoj 115 Mejatto 38 Woja 343 Loen 154 Kilange 93 Menge 28 Arrak 249 Mae 134 Malel 63 Ajejen 17 Ejit 219 Lukoj 18 Tutu 51 Bokanake 16 Rongrong 31 Eoo 6 Ijoen 34 Urbaj 12 Didej 25 Jilane 31 Arreen 11 Enemanet 10 Ujae 440 Mian 21 Ae 9 Aneko 9 Ujae 440 Taklep 18 Bokkan 8 Kalalen 6 Eneaidrik 17 Nabbe 6 Pikiriin 5 Utirik 433 Namwi 14 Anilep 5 Aneenwudej 5 Utirik 433 Kinajon 11 Dede 2 Kemman 5 Kilemman 10 Bukantorak 1 Jelter 4 Wotho 145 Neenkotkot 7 Ewo 1 Bokaetoktok 3 Wotho 145 Manrar 7 Denmeo 2 Kejbwe 6 Kili 774 Loubikaire 2 Wotje 866 Enirik 5 Kili 774 Wotje 676 Bikonele 4 Rongelap 19 Wormej 139 Najaj(Majaj) 4 Rongelap 19 Nibun 41 Meetdik 3 Lib 147 Didi 10 Boken 2 Lib 147 Source: 1999 Census of Population and Housing, EPPSO

2001 RMI Statistical Abstract
23
Table 2.15 MARITAL STATUS BY SEX AND FIVE-YEAR AGE GROUP (age 12 and over), 1988
Never Divorced/ Age group Total married Married Widowed separated Not stated
Total 24,637 9,741 13,710 788 393 5 12-14 3,393 3,363 24 1 3 2 15-19 4,085 3,467 590 5 22 1 20-24 3,510 1,394 2,040 10 65 1 25-29 3,027 600 2,345 14 68 - 30-34 2,656 331 2,258 17 50 - 35-39 2,187 195 1,929 24 39 - 40-44 1,492 122 1,310 27 32 1 45-49 971 67 855 29 20 - 50-54 743 40 638 50 15 - 55-59 680 38 542 83 17 - 60-64 635 39 474 100 22 - 65-69 544 34 349 140 21 - 70-74 373 20 218 129 6 - 75+ 341 31 138 159 13 -
Male 12,599 5,516 6,757 196 125 5 12-14 1,780 1,771 7 - - 2 15-19 2,104 1,956 145 1 1 1 20-24 1,686 863 810 1 11 1 25-29 1,520 379 1,120 3 18 - 30-34 1,348 208 1,114 5 21 - 35-39 1,205 121 1,066 3 15 - 40-44 758 75 670 5 7 1 45-49 549 45 490 5 9 - 50-54 386 24 350 9 3 - 55-59 359 19 310 19 11 - 60-64 313 16 262 26 9 - 65-69 255 18 195 35 7 - 70-74 183 9 125 44 5 - 75+ 153 12 93 40 8 -
Female 12,038 4,225 6,953 592 268 12-14 1,613 1,592 17 1 3 - 15-19 1,981 1,511 445 4 21 - 20-24 1,824 531 1,230 9 54 - 25-29 1,507 221 1,225 11 50 - 30-34 1,308 123 1,144 12 29 - 35-39 982 74 863 21 24 - 40-44 734 47 640 22 25 - 45-49 422 22 365 24 11 - 50-54 357 16 288 41 12 - 55-59 321 19 232 64 6 - 60-64 322 23 212 74 13 - 65-69 289 16 154 105 14 - 70-74 190 11 93 85 1 - 75+ 188 19 45 119 5 -
Source: 1988 Census of Population and Housing, EPPSO

2001 RMI Statistical Abstract
24
Table 2.16 MARITAL STATUS BY SEX AND FIVE-YEAR AGE GROUP (age 12 and over), 1999
Common Never Divorced/ Law/
Age group Total married Married Widowed separated Live-in Not stated
Total 33,479 14,766 12,307 781 417 5067 141 12-14 4,530 4,444 33 16 37 15-19 6,316 5,627 253 6 10 373 47 20-24 4,545 2,319 986 10 35 1,173 22 25-29 3,750 961 1,512 20 48 1,200 9 30-34 3,220 540 1,713 11 49 899 8 35-39 2,852 328 1,806 27 55 632 4 40-44 2,390 194 1,705 38 58 391 4 45-49 2,023 109 1,601 61 53 197 2 50-54 1,365 62 1,094 68 44 95 2 55-59 792 45 602 78 22 42 3 60-64 597 40 407 112 15 22 1 65-69 435 39 266 108 12 10 - 70-74 301 24 160 98 6 13 - 75-79 198 15 98 75 7 3 - 80+ 165 19 71 69 3 1 2
Male 17,091 8,040 6,113 180 134 2,514 110 12-14 2,331 2,290 9 - - 8 24 15-19 3,193 2,949 85 5 2 108 44 20-24 2,266 1,354 382 2 5 505 18 25-29 1,890 582 688 5 5 602 8 30-34 1,652 338 811 1 12 484 6 35-39 1,456 217 875 6 13 343 2 40-44 1,195 118 833 5 19 217 3 45-49 1,119 74 894 7 24 119 1 50-54 731 40 595 12 19 65 - 55-59 432 19 359 15 10 27 2 60-64 293 20 223 27 7 16 - 65-69 230 19 169 28 7 7 - 70-74 144 9 89 29 5 12 - 75-79 91 5 58 24 4 - - 80+ 68 6 43 14 2 1 2
Female 16,388 6,726 6,194 601 283 2,553 31 12-14 2,199 2,154 24 8 13 15-19 3,123 2,678 168 1 8 265 3 20-24 2,279 965 604 8 30 668 4 25-29 1,860 379 824 15 43 598 1 30-34 1,568 202 902 10 37 415 2 35-39 1,396 111 931 21 42 289 2 40-44 1,195 76 872 33 39 174 1 45-49 904 35 707 54 29 78 1 50-54 634 22 499 56 25 30 2 55-59 360 26 243 63 12 15 1 60-64 304 20 184 85 8 6 1 65-69 205 20 97 80 5 3 - 70-74 157 15 71 69 1 1 - 75-79 107 10 40 51 3 3 - 80+ 97 13 28 55 1 - -
Source: 1999 Census of Population and Housing, EPPSO

2001 RMI Statistical Abstract
25
Table 2.17 PROJECTION OF MID-YEAR POPULATION AND LIFE EXPECTANCY AT BIRTH, 1999 to 2019 Projected population Life expectancy at birth Year Total Male Female Male Female 2019 88,507 45,048 43,459 70.2 73.8 2018 87,135 44,366 42,769 69.8 73.4 2017 85,709 43,656 42,053 69.5 73.1 2016 84,243 42,925 41,318 69.3 72.9 2015 82,757 42,183 40,574 69.2 72.8 2014 81,272 41,441 39,831 69.2 72.8 2013 79,438 40,527 38,911 69.0 72.6 2012 77,629 39,621 38,008 68.8 72.4 2011 75,821 38,707 37,114 68.6 72.2 2010 74,004 37,782 36,222 68.4 72.0 2009 72,167 36,840 35,327 68.2 71.8 2008 72,070 37,765 34,305 67.9 71.6 2007 67,965 34,691 33,274 67.7 71.3 2006 65,814 33,600 32,214 67.5 71.1 2005 63,579 32,470 31,109 67.2 70.9 2004 61,218 31,284 29,934 67.0 70.6 2003 58,849 30,110 28,739 66.8 70.4 2002 56,639 29,003 27,636 66.5 70.2 2001 54,584 27,960 26,624 66.2 69.9 2000 52,671 26,976 25,695 66.0 69.7 1999 50,908 26,058 24,850 65.7 69.4 Note: Projections refer to 1 July of the respective years. Projections based on the fertility and mortality assumptions mentioned below, and using the Population Analysis Spreadsheets (PAS) to extrapolate into the future. 1973 1988 1999 TFR 7.92 7.23 5.71 Male life expect. 56.2 59.6 65.7 Female life expect. 59.7 62.6 69.4 Source: EPPSO
Figure 2.3 RMI Projected Population, 1999 to 2019
0
10,000
20,000
30,000
40,000
50,000
60,000
70,000
80,000
90,000
100,000
2019
2018
2017
2016
2015
2014
2013
2012
2011
2010
2009
2008
2007
2006
2005
2004
2003
2002
2001
2000
1999

2001 RMI Statistical Abstract
26
Table 2.18 POPULATION BY ATOLL/ISLAND AND CITIZENSHIP, 1988
Other Other Atoll/Island Total RMI Micro. Pacific Asia US Other Total 43,380 42,016 698 42 308 302 14 Ailinglaplap 1,715 1,702 8 - - 5 - Ailuk 488 487 - - - 1 - Arno 1,656 1,644 3 - - 8 1 Aur 438 438 - - - - - Bikini 10 8 - - 2 - - Ebon 741 739 - - - 2 - Enewetak 715 702 9 - 1 3 - Jabat 112 112 - - - - - Jaluit 1,709 1,689 10 - 1 9 - Kili 602 593 4 1 4 - - Kwajalein 9,311 9,028 162 1 52 68 - Lae 319 319 - - - - - Lib 115 115 - - - - - Likiep 482 480 - - - 2 - Majuro 19,664 18,732 444 40 248 187 13 Maloelap 796 792 2 - - 2 - Mejit 445 444 - - - 1 - Mili 854 811 39 - - 4 - Namorik 814 794 17 - - 3 - Namu 801 797 - - - 4 - Ujae 448 447 - - - 1 - Utirik 409 409 - - - - - Wotho 90 89 - - - 1 - Wotje 646 645 - - - 1 - Source: 1988 Census of Population and Housing, EPPSO
Table 2.19 POPULATION BY ATOLL/ISLAND AND CITIZENSHIP, 1999
Other Other Atoll/Island Total RMI Micro. Pacific Asia US Other Total 50,840 49,693 177 250 406 303 11 Ailinglaplap 1,959 1,959 - - - - - Ailuk 513 513 - - - - - Arno 2,069 2,067 - 1 1 - - Aur 537 537 - - - - - Bikini 13 10 - - 2 1 - Ebon 902 902 - - - - - Enewetak 853 841 6 1 3 2 - Jabat 95 95 - - - - - Jaluit 1,669 1,665 1 - 1 2 - Kili 774 748 2 - 21 3 - Kwajalein 10,902 10,669 76 35 55 67 - Lae 322 322 - - - - - Lib 147 147 - - - - - Likiep 527 527 - - - - - Majuro 23,676 22,821 90 210 320 224 11 Maloelap 856 856 - - - - - Mejit 416 416 - - - - - Mili 1,032 1,027 2 3 - - - Namorik 772 771 - - - 1 - Namu 903 903 - - - - - Rongelap 19 18 - - - 1 Ujae 440 440 - - - - - Utirik 433 433 - - - - - Wotho 145 140 - - 3 2 - Wotje 866 866 - - - - - Source: 1999 Census of Population and Housing, EPPSO
2001 RMI Statistical Abstract
27
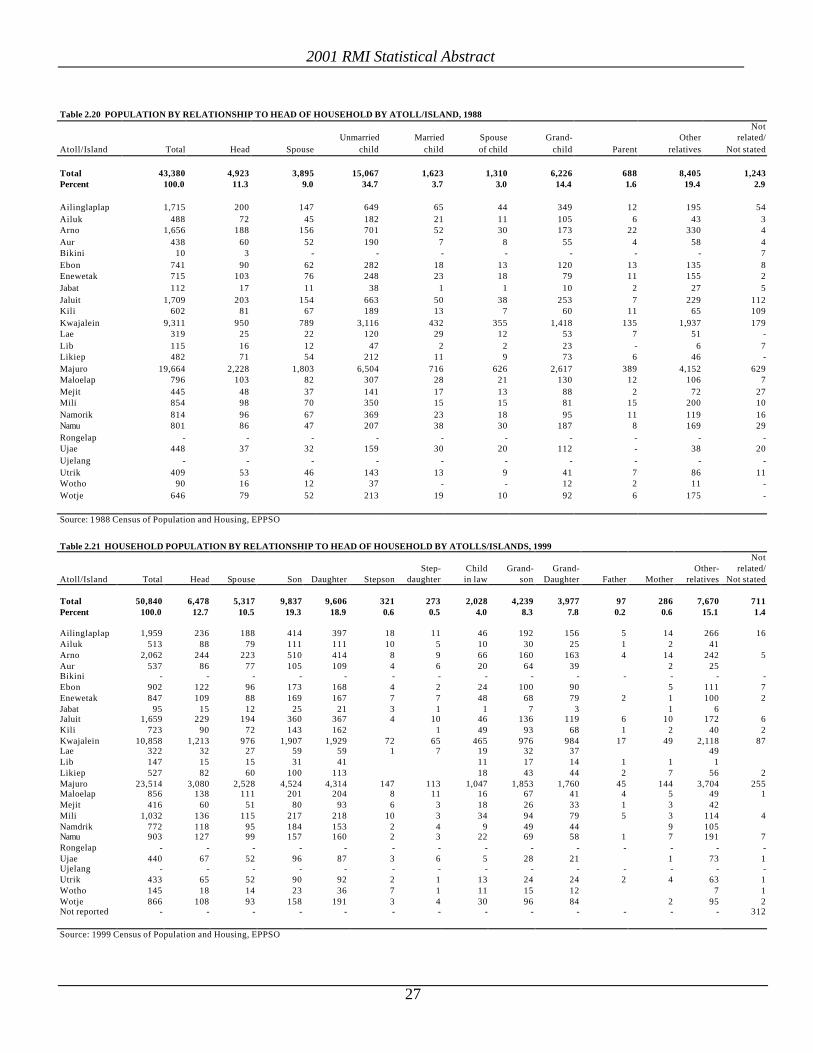
Table 2.20 POPULATION BY RELATIONSHIP TO HEAD OF HOUSEHOLD BY ATOLL/ISLAND, 1988
Not Unmarried Married Spouse Grand- Other related/ Atoll/Island Total Head Spouse child child of child child Parent relatives Not stated Total 43,380 4,923 3,895 15,067 1,623 1,310 6,226 688 8,405 1,243 Percent 100.0 11.3 9.0 34.7 3.7 3.0 14.4 1.6 19.4 2.9 Ailinglaplap 1,715 200 147 649 65 44 349 12 195 54 Ailuk 488 72 45 182 21 11 105 6 43 3 Arno 1,656 188 156 701 52 30 173 22 330 4 Aur 438 60 52 190 7 8 55 4 58 4 Bikini 10 3 - - - - - - - 7 Ebon 741 90 62 282 18 13 120 13 135 8 Enewetak 715 103 76 248 23 18 79 11 155 2 Jabat 112 17 11 38 1 1 10 2 27 5 Jaluit 1,709 203 154 663 50 38 253 7 229 112 Kili 602 81 67 189 13 7 60 11 65 109 Kwajalein 9,311 950 789 3,116 432 355 1,418 135 1,937 179 Lae 319 25 22 120 29 12 53 7 51 - Lib 115 16 12 47 2 2 23 - 6 7 Likiep 482 71 54 212 11 9 73 6 46 - Majuro 19,664 2,228 1,803 6,504 716 626 2,617 389 4,152 629 Maloelap 796 103 82 307 28 21 130 12 106 7 Mejit 445 48 37 141 17 13 88 2 72 27 Mili 854 98 70 350 15 15 81 15 200 10 Namorik 814 96 67 369 23 18 95 11 119 16 Namu 801 86 47 207 38 30 187 8 169 29 Rongelap - - - - - - - - - - Ujae 448 37 32 159 30 20 112 - 38 20 Ujelang - - - - - - - - - - Utrik 409 53 46 143 13 9 41 7 86 11 Wotho 90 16 12 37 - - 12 2 11 - Wotje 646 79 52 213 19 10 92 6 175 - Source: 1 988 Census of Population and Housing, EPPSO
Table 2.21 HOUSEHOLD POPULATION BY RELATIONSHIP TO HEAD OF HOUSEHOLD BY ATOLLS/ISLANDS, 1999 Not Step- Child Grand- Grand- Other- related/ Atoll/Island Total Head Spouse Son Daughter Stepson daughter in law son Daughter Father Mother relatives Not stated Total 50,840 6,478 5,317 9,837 9,606 321 273 2,028 4,239 3,977 97 286 7,670 711 Percent 100.0 12.7 10.5 19.3 18.9 0.6 0.5 4.0 8.3 7.8 0.2 0.6 15.1 1.4 Ailinglaplap 1,959 236 188 414 397 18 11 46 192 156 5 14 266 16 Ailuk 513 88 79 111 111 10 5 10 30 25 1 2 41 Arno 2,062 244 223 510 414 8 9 66 160 163 4 14 242 5 Aur 537 86 77 105 109 4 6 20 64 39 2 25 Bikini - - - - - - - - - - - - - - Ebon 902 122 96 173 168 4 2 24 100 90 5 111 7 Enewetak 847 109 88 169 167 7 7 48 68 79 2 1 100 2 Jabat 95 15 12 25 21 3 1 1 7 3 1 6 Jaluit 1,659 229 194 360 367 4 10 46 136 119 6 10 172 6 Kili 723 90 72 143 162 1 49 93 68 1 2 40 2 Kwajalein 10,858 1,213 976 1,907 1,929 72 65 465 976 984 17 49 2,118 87 Lae 322 32 27 59 59 1 7 19 32 37 49 Lib 147 15 15 31 41 11 17 14 1 1 1 Likiep 527 82 60 100 113 18 43 44 2 7 56 2 Majuro 23,514 3,080 2,528 4,524 4,314 147 113 1,047 1,853 1,760 45 144 3,704 255 Maloelap 856 138 111 201 204 8 11 16 67 41 4 5 49 1 Mejit 416 60 51 80 93 6 3 18 26 33 1 3 42 Mili 1,032 136 115 217 218 10 3 34 94 79 5 3 114 4 Namdrik 772 118 95 184 153 2 4 9 49 44 9 105 Namu 903 127 99 157 160 2 3 22 69 58 1 7 191 7 Rongelap - - - - - - - - - - - - - - Ujae 440 67 52 96 87 3 6 5 28 21 1 73 1 Ujelang - - - - - - - - - - - - - - Utrik 433 65 52 90 92 2 1 13 24 24 2 4 63 1 Wotho 145 18 14 23 36 7 1 11 15 12 7 1 Wotje 866 108 93 158 191 3 4 30 96 84 2 95 2 Not reported - - - - - - - - - - - - - 312 Source: 1999 Census of Population and Housing, EPPSO

2001 RMI Statistical Abstract
28
(this page left blank intentionally)
2001 RMI Statistical Abstract
29
CHAPTER 3: HEALTH AND VITAL STATISTICS
The section presents data on registered births, deaths, and causes of death in the RMI. The Planning and Vital Statistics Department of the Ministry of Health is responsible for registration of births, deaths and causes of death. Vital statistics are compiled from returns received by the department from Majuro and Ebeye hospitals and from outer island health service centers. Except where it has been stated otherwise, the data for this section have been provided by the Ministry of Health. Under-reporting of births and deaths is a common problem in developing countries, including the RMI. The RMI’s geographically scattered population creates logistical challenges to the registration process, although some improvements have been made in recent years. Users, therefore, should use the registration data with some caution.

2001 RMI Statistical Abstract
30
Table 3.1 TOTAL FERTILITY RATE AND AGE SPECIFIC FERTILITY RATE, 1959 to 1999 Period of Age Specific Fertility Rates Census estimate TFR 15-19 yrs 20-24 yrs 25-29 yrs 30-34 yrs 35-39 yrs 40-44 yrs 45-49 yrs
1999 Census 1999* 5.71 0.094 0.285 0.273 0.237 0.139 0.068 0.047 1999 Census 1998 5.89 0.091 0.268 0.287 0.244 0.183 0.079 0.025 1999 Census 1997 6.07 0.095 0.274 0.295 0.250 0.190 0.083 0.028 1999 Census 1996 6.23 0.103 0.280 0.300 0.255 0.193 0.087 0.029 1999 Census 1995 6.39 0.111 0.285 0.306 0.260 0.196 0.090 0.031 1999 Census 1994 6.54 0.118 0.290 0.311 0.264 0.198 0.093 0.325 1999 Census 1993 6.68 0.125 0.295 0.316 0.268 0.201 0.096 0.034 1999 Census 1992 6.81 0.131 0.300 0.321 0.272 0.204 0.099 0.035 1999 Census 1991 6.93 0.137 0.304 0.325 0.276 0.206 0.102 0.037 1999 Census 1990 7.04 0.141 0.308 0.329 0.279 0.209 0.104 0.038 1999 Census 1989 7.14 0.143 0.313 0.333 0.283 0.212 0.107 0.038 1988 Census 1988 7.23 0.162 0.391 0.347 0.246 0.182 0.089 0.029 1988 Census 1982/83 7.39 0.137 0.368 0.385 0.290 0.202 0.075 0.021 1988 Census 1977/78 7.51 0.121 0.360 0.382 0.307 0.247 0.063 0.023 1980 Census 1976/80 7.88 0.155 0.332 0.356 0.305 0.242 0.133 0.053 1980 Census 1971/75 7.92 0.149 0.324 0.363 0.317 0.238 0.131 0.062 1973 Census 1969/73 8.42 0.126 0.322 0.380 0.374 0.284 0.130 0.070 1980 Census 1966/70 8.14 0.147 0.346 0.377 0.344 0.241 0.124 0.049 1973 Census 1964/68 8.72 0.161 0.345 0.398 0.383 0.274 0.135 0.049 1973 Census 1959/63 7.92 0.171 0.338 0.364 0.316 0.238 0.114 0.044
An Age Specific Fertility Rate(ASFR) is calculated as the number of births in a year to mothers of a specific age per women(or per 1000 women) of the same age at midyear. The Total Fertility Rate(TFR) is a summary measure independdent of the age and sex composition of a population. It represents the average number of children a group of women would have by the end of their reproductive years. TFR for 1989-1998 are estimated by interpolating the census results of 1988 and 1999, using the Population Analysis Software's ASFRPATT program. ASFR for 1989-1998 are estimated by using the Population Analysis Software's ASFRPATT program. 1999*…refers to 1999 Census of Population and Housing results. Sources: Trust Territory of the Pacific Islands, Bulletin of Statistics Vol. III, 1973 1980 Census of Population, US Bureau of the Census and EPPSO 1988 Census of Population and Housing, EPPSO 1999 Census of Population and Housing, EPPSO
Table 3.2 TOTAL FERTILITY RATE, GROSS REPRODUCTION RATE, GENERAL FERTILITY RATE AND CRUDE BIRTH RATE BY URBAN/RURAL, RMI, 1999 Fertility indicator Total Urban Rural Total fertility rate (live births per thousand women) 5.71 5.45 6.28 Gross reproduction rate (female births per women) 2.77 2.65 3.05 General fertility rates (live births per 1000 population) 173.3 166.5 189.3 Crude birth rate (live births per 1000 population) 41.8 42.2 41.2 Sources: 1999 Census of Population and Housing, EPPSO
Figure 3.1 Total Fertility Rate, 1969 to 1999
0.00
1.00
2.00
3.00
4.00
5.00
6.00
7.00
8.00
9.00
1999
1998
1997
1996
1995
1994
1993
1992
1991
1990
1989
1988
1982
/83
1977
/78
1976
/80
1971
/75
1969
/73

2001 RMI Statistical Abstract
31
Table 3.3 INDIRECT ESTIMATES OF INFANT MORTALITY RATES (IMR)
Both Sexes Male FemaleIMR Reference period IMR Reference period IMR Reference period
63 Jul 1986 74 Feb 1982 60 Jul 198666 Jul 1984 70 Jul 1984 63 Jul 198468 Feb 1982 66 Jul 1986 61 Mar 198264 Jul 1979 70 Jun 1979 58 Aug 197968 Feb 1972 79 Oct 1979 85 Apr 1969
Note: The Infant Mortality Rate(IMR) is the number of deaths of infants under one year o f age to the number of live births occurring that year. IMR is expressed as number per thousand of live births. Sources: Susan J Levy and Heather Booth: "Infant mortility in the Marshall Islands "1988 1988 Census of Population and Housing, EPPSO
Table 3.4 ESTIMATES OF LIFE EXPECTANCY AT BIRTH, INFANT MORTALITY RATE, UNDER FIVE MORTALITY RATE AND CRUDE DEATH RATE, 1988 AND 1999 Subject 1988 1999 Life expectancy at birth (years) Both sexes 61.04 67.49
Males 59.61 65.72 Females 62.57 69.35 Infant mortality rate (per 1000 live births) Both sexes 63.0 * 56.9 ** 37.0 Males 66.0 * 58.5 ** 41.4 Females 60.0 * 55.3 ** 32.4 Under five (5) mortality* Both sexes 93.0 48.0 Crude death rate Both sexes 8.9 4.9 Males 9.4 - Females 8.4 - Note: Under 5 mortality computed by using demographic software "mortpak" and the data of CEB and children surviving of the two censuses. * West model ** Life table Source: 1988 and 1999 Census of Population and Housing, EPPSO

2001 RMI Statistical Abstract
32
Table 3.5 NUMBER OF REGISTERED LIVE BIRTHS BY ATOLL, 1986 to 2001 Atoll/Island 1986 1987 1988 1989 1990 1991 1992 1993 1994 1995 1996 1997 1998 1999 2000 2001 Total 1,454 1,727 1,587 1,554 1,555 1,266 1,195 1,249 1,386 1,476 1,500 1,607 1,664 1,630 1,576 1,561 Ailinglaplap 39 64 57 43 45 17 31 22 29 24 41 39 39 10 18 18 Ailuk 14 23 12 13 16 4 4 11 14 10 14 13 13 10 11 11 Arno 33 37 43 37 39 18 23 22 20 27 34 30 37 28 28 29 Aur 15 9 16 9 10 3 10 8 7 5 3 5 7 7 8 9 Ebon 19 24 18 19 20 7 12 6 12 2 3 5 3 6 4 3 Enewetak 7 10 6 13 4 - 10 5 9 1 5 4 5 1 3 Jabat 4 5 6 3 1 - 1 - - 1 - 1 1 2 Jaluit 28 42 50 34 42 17 15 16 19 24 28 26 35 40 33 35 Kili 9 11 19 9 4 5 1 3 10 5 10 5 5 8 8 4 Kwajalein 366 405 336 364 410 328 277 281 346 352 336 361 400 368 383 334 Lae 10 11 10 2 10 1 1 2 8 4 8 3 6 12 3 16 Lib 6 1 2 4 - - 1 4 1 - - 2 Likiep 2 7 8 4 5 - 3 1 - 5 5 3 2 7 5 6 Majuro 788 903 892 875 844 795 735 826 846 943 942 1,056 1,044 1,049 1,000 1,025 Maloelap 16 29 16 24 16 10 4 8 9 4 12 7 10 7 9 1 Mejit 7 11 11 8 7 6 5 1 3 1 - 5 4 4 Mili 11 17 14 18 17 11 12 15 15 17 15 13 15 12 10 5 Namorik 32 67 27 21 22 13 12 13 10 12 - 7 13 8 9 11 Namu 7 12 12 17 13 6 10 1 3 9 7 8 8 12 12 17 Rongelap - - - - - - - - - - - Ujae 12 18 7 4 10 9 5 - 3 8 8 7 4 11 8 2 Ujelang 2 - - - - - - - - - - Uterik 15 7 10 11 6 8 13 1 5 3 10 3 4 5 4 Wotho - 3 1 6 1 1 1 1 - 1 2 1 Wotje 12 11 14 6 13 2 9 2 17 18 17 11 12 22 15 24 Unknown - - - 10 - 5 - - - - - - 1 4 1 Source: Vital Statistics Division, Ministry of Health
Table 3.6 NUMBER OF REGISTERED LIVE BIRTHS BY AGE GROUP OF MOTHER, 1990 to 2001 Age group Mother 1990 1991 1992 1993 1994 1995 1996 1997 1998 1999 2000 2001 Total 1,555 1,266 1,195 1,249 1,386 1,476 1,500 1,607 1,664 1,630 1,576 1,561 <15 4 4 1 1 2 - - 1 7 4 5 3 15-19 250 268 248 267 272 284 264 260 308 315 296 279 20-24 545 453 418 451 513 531 551 520 533 533 560 564 25-29 392 268 297 298 330 363 363 410 423 410 368 346 30-34 227 175 149 139 171 196 214 269 241 230 231 240 35-39 98 71 62 75 73 78 82 111 123 114 84 102 40-44 38 25 20 16 21 23 23 33 27 21 29 18 45-49 1 2 - 2 4 1 3 3 2 2 1 1 50+ - - - - - - - - - 1 1 Not stated - - - 8 - - - - - - 1 8 Source: Vital Statistics Division, Ministry of Health
Table 3.7 BIRTHS BY MONTH, 2001 Month Number Total 1,561 January 122 February 122 March 131 April 102 May 124 June 128 July 97 August 129 September 148 October 132 November 166 December 111 Not stated 49
Source: Vital Statistics Division, Ministry of Health

2001 RMI Statistical Abstract
33
Table 3.8 NUMBER OF REGISTERED DEATHS BY AGE GROUP AND SEX, 1990 to 2001 Age group 1990 1991 1992 1993 1994 1995 1996 1997 1999 2000 2001
Total 213 202 230 240 244 245 233 243 233 295 274<1 42 44 38 33 29 26 40 49 21 51 401-4 8 13 21 7 15 5 12 7 12 11 85-9 4 4 1 4 6 3 6 2 2 3 210-14 3 1 4 2 1 5 4 2 6 5 415-19 8 4 7 9 4 11 3 8 9 4 1120-24 7 5 10 2 11 5 7 10 6 12 525-29 9 5 4 14 7 5 5 9 13 9 730-34 2 3 5 7 8 6 8 8 9 12 735-39 8 8 9 7 12 10 4 6 15 9 1340-44 8 7 13 12 9 13 9 10 8 9 1745-49 7 9 9 13 5 15 11 18 23 29 1750-54 13 11 7 11 8 21 10 13 15 22 2655-59 19 12 16 14 10 16 17 17 23 14 1960-64 18 18 20 21 24 18 16 17 15 31 1665-69 19 18 19 23 25 19 24 19 11 13 2670-74 18 21 21 19 21 22 27 13 17 26 2175 + 20 19 26 42 49 45 30 35 28 35 35
Male 139 124 147 137 144 148 134 135 146 174 149<1 27 29 15 14 15 16 26 17 15 27 181-4 3 9 13 5 7 1 6 1 6 9 35-9 2 2 1 3 3 2 3 1 1 2 110-14 3 1 4 - - 3 2 1 2 2 115-19 6 3 6 7 4 5 3 6 5 3 820-24 6 3 9 2 7 4 5 9 5 8 325-29 9 3 4 8 6 4 3 6 9 5 630-34 1 3 3 4 2 2 6 2 8 3 535-39 4 4 8 7 9 7 2 5 12 6 840-44 5 4 8 9 2 11 7 5 6 6 945-49 7 3 7 9 3 10 6 12 17 18 650-54 9 7 4 7 4 10 3 9 11 8 1855-59 9 8 12 8 6 11 7 10 15 11 1360-64 12 10 15 9 19 11 10 13 11 21 865-69 11 12 13 14 15 11 13 12 6 7 1670-74 12 14 11 10 10 9 13 6 4 19 1175 + 13 9 14 21 32 31 19 20 13 19 15
Female 74 78 83 103 100 97 99 108 87 121 125<1 15 15 23 19 14 10 14 32 6 24 221-4 5 4 8 2 8 4 6 6 6 2 55-9 2 2 - 1 3 1 3 1 1 1 110-14 0 0 - 2 1 2 2 1 4 3 315-19 2 1 1 2 - 6 - 2 4 1 320-24 1 2 1 4 1 2 1 1 4 225-29 0 2 - 6 1 1 2 3 4 4 130-34 1 0 2 3 6 4 2 6 1 9 235-39 4 4 1 3 3 2 1 3 3 540-44 3 3 5 3 7 2 2 5 2 3 845-49 0 6 2 4 2 5 5 6 6 11 1150-54 4 4 3 4 4 11 7 4 4 14 855-59 10 4 4 6 4 5 10 7 8 3 660-64 6 8 5 12 5 7 6 4 4 10 865-69 8 6 6 9 10 8 11 7 5 6 1070-74 6 7 10 9 11 13 14 7 13 7 1075 + 7 10 12 21 17 14 11 15 15 16 20 Note: Data for 1998 not unavailable. Source: Vital Statistics Division, Ministry of Health

2001 RMI Statistical Abstract
34
Table 3.9 NUMBER OF REGISTERED INFANT DEATHS BY CAUSE OF DEATH AND BY SEX, 1994 to 2000
Cause of death 1994 1995 1996 1997 2000 1994 1995 1996 1997 2000 1994 1995 1996 1997 2000
All causes 29 26 40 49 64 15 16 26 17 39 14 10 14 32 25 Anencephaly - 2 - - - - - - - - 2 - - - Anoxia - - - 1 1 - - - - - - - 1 1 Asphyxia 1 3 3 1 3 1 3 2 1 1 - - 1 - 2 Asphyxia Neonatorum - - - - - - - - - - - - - - - Aspiration - - - 3 2 - - - - 1 - - - 3 1 Aspiration Meconium 2 - - - - - - - - 2 - - - Aspiration Pneunomia - - - - 2 - - - - 1 - - - - 1 Bleeding Peptic Shock - - - 1 - - - - - - - - - 1 - Bronchiolitis - Severe - - - - - - - - - - - - - - - Cerebral Anoxia - - 1 - - - - 1 - - - - - - - Cerebral Hemorrhage - - - - - - - - - - - - - - - Congenital Abnormalities - - - - 1 - - - - - - - - - 1 Congenital Pulmonary - - - - - - - - - - - - - - - Congenital Pulmonary Hypoplasia - - - - - - - - - - - - - - - Congenital Heart Disease 1 - - 2 2 - - 2 1 - - 2 - Congestive Heart Failure - - 1 - - - - - - - - 1 - - Congenital Hydrocephalus - - - 1 - - - - 1 - - - - - Cord Accident - 2 - 2 - - - - 2 - 2 - - - Cord Coil - - 1 - - - - 1 - - - - - - Cord Prolapse - 1 1 - - - - 1 - - 1 - - - Dehydration 3 - 1 2 1 2 - - 1 1 1 - 1 1 - Dehydration Secondary to diarrhea severe - - - - - - - - - - - - - - - Fetal Asphyxia - - - 1 - - - - - - - - - 1 - Electrolyte Imbalance - Acidosis - - - - - - - - - - - - - - - Electrolyte Imbalance - secondary to Diarrhea - 2 - - - - 2 - - - - - - - - Hemophilus Influenza Menigitis 3 - - - - 2 - - - - 1 - - - - Hypothermia / Apnea - - - - - - - - - - - - - - - Hypoxia - - 1 2 - - - 1 2 - - - - - - Internal Injuries (Fall) - - - - - - - - - - - - - - - Intracranial Hemorrhage - - - - - - - - - - - - - - - Intrauterine Anoxia 1 - - - - 1 - - - - - - - - - Intraventricular Hemorrhage - - - - - - - - - - - - - - - Malnutrition - 4 4 1 1 - 3 2 1 1 - 1 2 - - Meconium Aspiration - - 1 - 4 - - - - 3 - - 1 - 1 Meningitis - - - 1 2 - - - 1 1 - - - - 1 Peritonitis - - - - - - - - - - - - - Perinatal Asphyxia 1 - - - - 1 - - - - - - - Pneumonia 1 1 - 3 4 - - - 1 1 1 1 - 2 3 Pneumonia Aspiration - - - - - - - - - - - - - Prematurity 7 7 13 13 20 2 6 8 5 11 5 1 5 8 9 Pulmonary Tuberculosis - - - - - - - - - - - - - - Pulmonary Arrest - - - - - - - - - - - - - - Respiratory Arrest - - - - - - - - - - - - - - Respiratory Distress Syndrome - - - - 2 - - - - 2 - - - - - Respiratory Failure - Central 7 - - - 3 6 - - - 2 1 - - - 1 Sepsis - 2 8 10 6 - 1 5 1 5 - 1 3 9 1 Sepsis Neonatorum - - - - 5 - - - - 3 - - - - 2 Sepsis Overwhelming - - - - - - - - - - - - - - - Septic Shock - - - 2 1 1 1 1 - Septicemia 2 - 2 - 1 - - 2 - 1 2 - - - - Streptococcal Meningitis - - - - - - - - - - - - - - - Submandibular Mass - - 1 - - - - 1 - - - - - - - Suffocation (accident) - - 1 - 2 - - 1 - 1 - - - - 1 Unclassified - 2 1 3 1 - 1 1 1 - 1 - 3 -
Note: Due to underregistration, the recorded number of infant deaths is lower than the number derived from the estimated rate of 63 per 1000 live births in the 1994 Household Survey of Population and Housing. Source: Vital Statistics Division, Ministry of Health

2001 RMI Statistical Abstract
35
Table 3.10 ATTEMPTED AND COMPLETED SUICIDES, 2001 Month Total Attempted Completed
Total 37 24 13 January 3 2 1 February 1 1 - March 3 3 - April 3 2 1 May - - - June 2 1 1 July 2 1 1 August 4 3 1 September 6 3 3 October 3 2 1 November 1 1 - December 9 5 4
Source: Office of Mental Health, Ministry of Health
Table 3.11 ADMISSIONS AND DISCHARGES AT MAJURO HOSPITAL, 1999 to 2001 Year Admissions Discharges 2001 6,194 6,283 2000 5,778 5,359 1999 5,696 5,185
Source: Administration Office, Ministry of Health
Table 3.12 ADMISSIONS AND DISCHARGES BY DEPARTMENT, MAJURO HOSPITAL, 2001 Department Admissions Discharges Total 6,194 6,283 Out Patient 580 580 Emerg. Room 1,408 1,045 Surgical Unit 550 566 Medical Unit 831 802 Pediatric Unit 789 593 Maternity Unit 2,036 2,697
Source: Administration Office, Ministry of Health
Table 3.13 Dental Patients, Majuro Hospital, 2001 Month Number
Total 11,454January 912February 649March 756April 816May 799June 879July 1,029August 1,116September 846October 1,362November 1,188December 1,102
Source: Dental Department, MOH

2001 RMI Statistical Abstract
36
(this page left blank intentionally)

2001 RMI Statistical Abstract
37
CHAPTER 4: CHARACTERISTICS OF HOUSEHOLDS
This section presents household level information available from the 1980, 1988, and 1999 Censuses of Population and Housing. According to each census, a household is defined as consisting of a group of persons who live together and usually cook and eat together. It may consist of one or more persons who may or may not be related to each other, and who may occupy the whole house or part of it. If two or more groups of persons have their own separate cooking and eating arrangements but are living in the same house, then they are treated as separate households. The keywords are “live,” “cook” and “eat together”. The 1999 census defines a household as “a social unit consisting of a person living alone or a group of persons who sleep in the same housing unit and have a common arrangement in the preparation and consumption of food.”

2001 RMI Statistical Abstract
38
Table 4.1 TOTAL NUMBER OF HOUSEHOLDS AND AVERAGE HOUSEHOLD SIZE, 1958 to 1999 Year No.of households Persons per household 1999 6,478 7.8 1988 4,923 8.8 1980 3,871 8.0 1973 2,987 8.4 1958 2,049 6.8 Note: 1967 data not available Sources: Census of the Trust Territory of the Pacific Islands, 1958 (prepared by the High Commissioner of the TTPI, June, 1959) Quarterly Bulletin of Statistics, TTPI, Vol. III, No. 2, 1980, 1988 Census of Population and Housing, 1999 Census of Population and Housing
Table 4.2 NUMBER OF HOUSEHOLDS AND AVERAGE HOUSEHOLD SIZE BY ATOLL/ISLAND, 1980 to 1999
1980 Census 1988 Census 1999 Census Number of Persons per Number of Persons per Number of Persons per
Atoll/Island households household households household households household Total 3,871 8.0 4,923 8.8 6,478 7.8 Ailinglaplap 156 8.9 200 8.6 236 8.3 Ailuk 53 7.8 72 6.8 88 5.8 Arno 231 6.4 188 8.8 244 8.5 Aur 57 7.8 60 7.3 86 6.2 Bikini - - 3 3.3 - Ebon 121 7.3 90 8.2 122 7.4 Enewetak 87 6.2 103 6.9 109 7.8 Jabat 11 6.6 17 6.6 15 6.3 Jaluit 207 7.0 203 7.9 229 7.3 Kili 73 6.7 81 7.4 90 8.6 Kwajalein 652 10.2 950 9.8 1,213 9.0 Lae 29 8.2 25 12.8 32 10.1 Lib 15 6.5 16 7.2 15 9.8 Likiep 63 7.6 71 6.8 82 6.4 Majuro 1,510 7.8 2,228 8.6 3,080 7.7 Maloelap 99 6.2 103 7.7 138 6.2 Mejit 38 8.6 48 9.3 60 6.9 Mili 104 7.3 98 8.7 136 7.6 Namorik 77 8.0 96 8.5 118 6.5 Namu 89 7.4 86 9.3 127 7.1 Rongelap 37 6.4 - - - Ujae 37 8.4 37 12.1 67 6.6 Ujelang - - - - - Utrik 41 8.2 53 7.7 65 6.7 Wotho 11 7.7 16 5.6 18 8.1 Wotje 73 7.3 79 8.2 108 8.0
Note: In the 1988 Census of Population and Housing(CPH), a total of 661 persons were in group quarters: 524 in Majuro Atoll, 100 in Jaluit Atoll, and 37 in Kwajalein Atoll. In the 1999 CPH, a total of 312 persons were found to be residents of institutional living quarters, and 50,528 were members of households. Sources: 1 980 Census of Population, U.S. Bureau of the Census, and 1988 Census of Population and Housing, 1999 Census of Population and Housing

2001 RMI Statistical Abstract
39
Table 4.3 BASIC HOUSEHOLD CHARACTERISTICS, 1988
Characteristic Total
Ail
ingl
apla
p
Ail
uk
Arn
o
Aur
Bik
ini
Ebo
n
Ene
wet
ak
Jaba
t
Jalu
it
Kil
i
Kw
ajal
ein
Lae
Lib
Lik
iep
Maj
uro
Mal
oela
p
Mej
it
Mil
i
Nam
orik
Nam
u
Ron
gela
p
Uja
e
Uje
lang
Uti
rik
Wot
ho
Wot
je
Total Households 4,923 200 72 188 60 3 90 103 17 203 81 950 25 16 71 2,228 103 48 98 96 86 - 37
- 53 16 79
Source of drinking water Piped (in) 1,440 - - - - 3 - - - 11 - 500 - - - 923 1 - - 2 - - - - - - - Piped (out) 1,013 2 - 1 1 - 1 2 - 6 - 320 - - - 679 - - - 1 - - - - - - - Rain Catchment 2,101 177 26 149 45 - 73 101 17 176 81 116 24 16 68 536 80 42 87 81 61 - 37 - 38 16 54 Well 267 8 44 38 7 - 12 - - 7 - 5 1 - 3 36 21 3 8 10 25 - - - 15 - 24 Other 102 13 2 - 7 - 4 - - 3 - 9 - - - 54 1 3 3 2 - - - - - - 1 Toilet facilities Flush toilet 2,150 4 1 4 3 3 1 3 - 31 81 785 - - 2 1,227 - - 2 1 - - - - 1 - 1 Water seal 882 32 16 9 6 - 18 98 8 26 - 43 4 - - 469 39 - 2 64 2 - 18 - 3 9 16 Pit latrine 601 22 7 11 27 - 15 - - 11 - 30 6 10 69 216 7 48 23 7 12 - 11 - 26 - 43 None 1,213 140 45 164 24 - 47 2 9 121 - 79 15 6 - 288 56 - 70 20 71 - 8 - 23 7 18 Other 77 2 3 - - - 9 - - 14 - 13 - - - 28 1 - 1 4 1 - - - - - 1 Source of energy for lighting Electricity 2,759 10 5 4 2 3 6 3 6 67 80 786 - 1 16 1,740 3 2 9 1 - - 2 - 11 - 2 Electricity (solar) 142 1 2 3 - - - 3 4 3 1 57 4 - - 16 1 1 1 1 - - - - 42 1 1 Kerosene 1,777 188 65 180 58 - 82 97 7 133 - 11 - 15 54 455 99 45 87 94 - - 35 - - - 72 None 225 1 - 1 - - 2 - - - - 92 21 - 1 5 - - 1 - 86 - - - - 14 1 Other 20 - - - - - - - - - - 4 - - - 12 - - - - - - - - - 1 3 Source of energy for cooking Electricity 1,827 7 - 2 1 3 - - - 50 41 615 - - 1 1,100 1 1 2 1 - - - - 2 - - Gas 53 5 - 2 - - - - 1 - 1 12 - - 2 24 1 - 2 1 1 - - - - 1 - Kerosene 2,353 114 46 114 24 - 60 102 16 73 39 318 19 8 65 1,043 80 12 51 53 14 - 15 - 43 11 33 Fire woods 680 74 26 70 35 - 30 1 - 80 - 4 6 8 3 54 21 35 42 40 71 - 22 - 8 4 46 Other 10 - - - - - - - - - - 1 - - - 7 - - 1 1 - - - - - - -
Source: 1988 Census of Population and Housing, EPPSO

2001 RMI Statistical Abstract
40
Table 4.4 BASIC HOUSEHOLD CHARACTERISTICS, 1999
Characteristic Total
Aili
ngla
plap
Ail
uk
Arn
o
Aur
Bik
ini
Ebo
n
Ene
wet
ak
Jaba
t
Jalu
it
Kil
i
Kw
ajal
ein
Lae
Lib
Lik
iep
Maj
uro
Mal
oela
p
Mej
it
Mil
i
Nam
orik
Nam
u
Ron
gela
p
Uja
e
Uje
lang
Uti
rik
Wot
ho
Wot
je
Total Households 6,478 236 88 244 86 0 122 109 15 229 90 1,213 32 15 82 3,080 138 60 136 118 127 - 67 - 65 18 108 Source of drinking water Piped (in) 404 1 - - - - - 19 - 4 19 170 - - - 191 - - - - - - - - - - - Piped (out) 520 - - - - - - 4 - 4 3 345 - - - 164 - - - - - - - - - - - Rain Catchment 4,560 232 52 239 45 - 111 86 15 208 68 385 20 15 77 2,321 93 59 118 110 109 - 65 - 44 18 70 Well 223 3 35 4 29 - - - - - - 1 12 - 3 35 42 1 3 2 9 - 1 - 21 - 22 Bottled Water 353 - - - - - - - - 11 - 62 - - 1 279 - - - - - - - - - - - Other 407 - 1 - 12 - 11 - - 2 - 246 - - - 88 3 - 15 6 9 - 1 - - - 13 Not Reported 11 - - 1 - - - - - - - 4 - - 1 2 - - - - - - - - - - 3
Toilet facilities Flush toilet (inside) 2,498 7 5 11 - - 7 12 - 36 87 828 - - 4 1,483 3 1 3 1 - - 2 - 4 - 4 Flush toilet (outside) 1,478 24 7 23 35 - 39 32 - 21 3 267 - - 4 948 14 30 2 1 1 - 24 - - - 3 Water sealed (inside) 270 8 2 56 1 - 2 - 2 15 - 3 1 - - 98 8 5 7 16 3 - 1 - 3 6 33 Water sealed (outside) 576 106 24 12 8 - 15 4 11 11 - 21 4 - 2 223 17 8 2 57 4 - 21 - 5 6 15 Pit latrine 370 2 - 17 5 - 1 31 - 1 - 47 - 15 71 35 10 15 15 1 56 - 7 - 8 - 33 Other 59 2 1 3 - - 1 1 - - - 14 1 - - 28 1 1 1 - 3 - - - - - 2 None 1,210 81 48 121 37 - 57 29 2 144 - 29 26 - - 264 84 - 106 42 60 - 12 - 45 6 17 Not Reported 17 6 1 1 - - - - - 1 - 4 - - 1 1 1 - - - - - - - - - 1
Source of energy for lighting Electricity 4,102 8 1 17 1 - - 46 - 82 90 1,089 - - 13 2,720 18 - 5 - 3 - 1 - 1 - 7 Kerosene 2,004 203 67 187 80 - 114 62 4 145 - 117 28 15 62 339 105 60 113 5 119 - 58 - 25 13 83 Solar Energy 337 23 18 38 5 - 8 - 11 - - - 4 - 5 8 15 - 18 112 3 - 8 - 39 5 17 Others 29 2 2 1 - - - 1 - 2 - 5 - - 1 12 - - - 1 2 - - - - - - Not Reported 6 - - 1 - - - - - - - 2 - - 1 1 - - - - - - - - - - 1
Source of energy fo r cooking Electricity 1,702 - - 6 - - - 2 - 34 89 466 - - - 1,105 - - - - - - - - - - - Kerosene 2,621 13 5 38 1 - 6 22 2 53 - 720 1 - 9 1,666 32 1 2 1 13 - 5 - - 4 27 Propane Gas 108 1 - 5 - - - - - 1 1 4 - 1 2 87 - - 2 1 - - 1 - - 2 - Charcoal 72 47 - 1 - - 1 8 - 1 - 1 - - - 2 8 - - - 1 - - - - - 2 Wood 1,935 173 80 193 85 - 115 77 12 138 - 13 30 14 70 206 96 59 131 116 112 - 61 - 65 12 77 Solar Energy 12 - 1 - - - - - 1 2 - 3 1 - - - 2 - 1 - - - - - - - 1 Others 12 2 1 - - - - - - - - 3 - - - 5 - - - - 1 - - - - - - None 9 - 1 - - - - - - - - - - - - 8 - - - - - - - - - - - Not Reported 7 - - 1 - - - - - - - 3 - - 1 1 - - - - - - - - - - 1
Source: 1999 Census of Population and Housing, EPPSO

2001 RMI Statistical Abstract
41
Table 4.5 HOUSEHOLDS ENGAGED IN SUBSISTENCE ACTIVITIES BY ATOLL/TYPE OF ACTIVITY, 1999 Growing Producing Breeding Making Atoll/Island food copra Fishing livestock handicrafts Other Total 2,401 1,562 3,399 2,253 1,771 274 Percent 37.1 24.1 52.5 34.8 27.3 4.2 Ailinglaplap 131 173 164 98 110 3 Ailuk 57 66 67 56 64 1 Arno 179 180 184 184 154 - Aur 48 53 55 42 56 - Bikini 3 - 3 - - - Ebon 69 79 64 36 38 1 Enewetak 43 3 85 37 9 2 Jabat 14 17 16 10 2 - Jaluit 139 107 176 128 127 1 Kili 30 13 73 31 72 - Kwajalein 67 16 588 111 110 196 Lae 23 23 25 24 12 - Lib 12 7 9 11 6 - Likiep 70 53 67 69 49 - Majuro 997 243 1,287 924 600 66 Maloelap 87 92 94 86 79 1 Mejit 44 45 46 46 46 - Mili 96 90 94 95 72 1 Namorik 88 85 80 87 52 - Namu 55 68 57 29 60 1 Ujae 33 30 31 24 1 - Utirik 43 40 45 44 4 - Wotho 13 10 14 15 - - Wotje 60 69 75 66 48 1 Source: 1999 Census of Population and Housing, EPPSO
Figure 4.1 Percent Households Engaged in Subsistence Activities by Activity, 1999
0.0
10.0
20.0
30.0
40.0
50.0
60.0
Growing food Producingcopra
Fishing Breedinglivestock
Makinghandicrafts
Other

2001 RMI Statistical Abstract
42
(this page left blank intentionally)

2001 RMI Statistical Abstract
43
CHAPTER 5: EDUCATION
This section presents data on public and private schools, school teachers and enrollment, as well as data on graduates from eighth grade and Marshall Islands Scholarship holders. Data were provided by the Ministry of Education. The number of schools, teachers and students refer to the beginning of the school year, which starts in late August to early September of one year and ends in June of the next year. Primary schools are those with grades 1 through 8 and Secondary schools are those with grades 9 through 12. Marshall Islands Scholarship holders are those who received scholarship assistance from the government scholarship fund to study at colleges or universities.

2001 RMI Statistical Abstract
44
Table 5.1 PUBLIC AND PRIVATE PRIMARY SCHOOLS, TEACHERS AND ENROLLMENT, 94/95 to 00/01
Number of schools Number of teachers Number of students School Type/Atoll 94/95 95/96 96/97 97/98 98/99 99/00 00/01 94/95 95/96 96/97 97/98 98/99 99/00 00/01 94/95 95/96 96/97 97/98 98/99 99/00 00/01
Total 103 104 104 104 103 103 104 665 611 610 656 548 630 664 13,355 12,217 12,283 12,402 12,421 11,695 11,450
Public 76 76 76 77 77 77 77 447 434 433 482 366 436 459 9,749 9,202 9,268 9,257 9,340 8,719 8,449 Ailinglaplap 9 9 9 9 9 9 9 34 28 28 29 25 24 29 547 532 546 551 581 550 512 Ailuk 2 2 2 2 2 2 2 8 8 8 7 4 7 5 127 141 141 98 76 110 130 Arno 9 9 9 9 9 9 10 19 22 21 24 23 23 25 548 435 441 488 526 529 483 Aur 2 2 2 2 2 2 2 10 9 9 9 8 11 8 152 148 148 158 142 124 123 Ebon 3 3 3 3 3 3 3 14 14 14 12 12 14 15 327 290 290 306 246 236 228 Enewetak 1 1 1 1 1 1 1 15 18 18 19 9 14 19 306 265 295 247 238 242 177 Jabat 1 1 1 1 1 1 1 2 4 4 2 3 4 4 57 50 50 53 38 37 30 Jaluit 8 8 8 8 8 8 8 23 19 19 21 22 20 19 497 431 431 413 428 356 339 Kili 1 2 2 2 2 2 2 14 7 7 15 12 15 11 223 224 224 181 178 175 198 Kwajalein 3 3 3 3 3 3 3 55 89 89 91 41 54 67 1,338 1,318 1,318 1,278 1,306 1,193 1,128 Lae 1 1 1 1 1 1 1 6 6 6 5 6 6 5 110 118 118 106 119 112 108 Lib 1 1 1 1 1 1 1 2 2 2 2 2 2 1 47 52 52 50 48 38 49 Likiep 3 3 3 3 3 3 3 13 10 10 12 9 12 10 202 176 176 170 195 189 174 Majuro 9 8 8 9 9 9 8 145 119 119 143 113 137 153 3,384 3,236 3,236 3,407 3,534 3,144 3,171 Maloelap 5 5 5 5 5 5 5 14 15 15 20 13 17 15 264 260 260 241 229 208 214 Mejit 1 1 1 1 1 1 1 6 7 7 9 6 7 7 165 166 166 151 149 155 147 Mili 5 5 5 5 5 5 5 11 11 11 15 12 13 14 327 264 280 288 250 245 256 Namorik 1 1 1 1 1 1 1 7 9 9 8 8 10 8 246 252 252 227 226 227 184 Namu 4 4 4 4 4 4 4 14 16 16 13 13 18 14 246 266 266 251 258 255 227 Ronglap/Mejatt 1 1 1 1 1 1 1 6 4 4 6 4 7 6 121 102 102 99 106 107 94 Ujae 1 1 1 1 1 1 1 7 5 5 4 5 5 4 193 147 147 148 155 139 149 Utrik 1 1 1 1 1 1 1 5 2 2 5 4 5 5 114 89 89 111 100 108 116 Wotje 3 3 3 3 3 3 3 12 8 8 8 8 10 12 166 192 192 193 178 199 172 Wotho 1 1 1 1 1 1 1 5 2 2 3 4 1 3 42 48 48 42 34 41 40 Private 27 28 28 27 26 26 27 218 177 177 174 182 194 205 3,606 3,015 3,015 3,145 3,081 2,976 3,001 Ailinglaplap 3 3 3 2 2 2 3 11 9 9 7 6 9 8 103 83 83 45 52 78 60 Ailuk 1 1 1 1 1 1 1 5 4 4 4 4 3 - 64 28 28 64 64 55 - Arno 3 3 3 3 3 3 3 12 12 12 12 12 8 7 177 216 216 200 199 126 120 Jaluit 2 2 2 2 2 2 2 8 8 8 9 8 6 8 127 132 132 137 127 121 116 Kwajalein 6 6 6 6 6 6 6 62 51 51 54 53 73 80 1,285 1,151 1,151 1,145 1,161 1,159 1,234 Majuro 10 11 11 11 11 11 11 111 87 87 81 95 91 98 1,757 1,311 1,311 1,456 1,411 1,375 1,407 Namu 1 1 1 1 - - - 5 2 2 2 - - - 18 17 17 16 - - - Wotje 1 1 1 1 1 1 1 4 4 4 5 4 4 4 75 77 77 82 67 62 64
Source: Ministry of Education
Figure 5.1 Reported Public and Private Students, SY94/95 to SY00/01
0
2,000
4,000
6,000
8,000
10,000
12,000
94/95 95/96 96/97 97/98 98/99 99/00 00/01
Public Private

2001 RMI Statistical Abstract
45
Table 5.2 PUBLIC AND PRIVATE PRIMARY SCHOOL ENROLLMENT BY GRADE AND SEX, 89/90 to 00/01
Grade and sex 1989/90 1990/91 1991/92 1992/93 1993/94 1994/95 1995/96 1996/97 1997/98 1998/99 1999/00 2000/01
Total 11,343 10,981 12,248 12,237 12,566 13,355 12,217 12,283 12,402 12,421 11,695 11,450 1st 1,863 1,782 2,515 1,996 2,129 1,993 1,657 1,657 1,599 1,435 1,394 1,778 2nd 1,585 1,493 1,436 1,766 1,725 1,894 1,580 1,578 1,525 1,389 1,339 1,241 3rd 1,541 1,525 1,623 1,452 1,665 1,683 1,661 1,658 1,514 1,536 1,396 1,273 4th 1,449 1,430 1,469 1,624 1,463 1,679 1,716 1,715 1,664 1,499 1,420 1,389 5th 1,329 1,358 1,461 1,513 1,585 1,446 1,522 1,519 1,595 1,614 1,477 1,420 6th 1,265 1,183 1,356 1,400 1,376 1,521 1,520 1,516 1,494 1,576 1,530 1,478 7th 1,166 1,132 1,175 1,306 1,351 1,339 1,233 1,292 1,374 1,436 1,474 1,441 8th 1,145 1,078 1,213 1,180 1,272 1,332 1,328 1,326 1,297 1,582 1,353 1,430 Not reported - - - - - 468 - 22 340 354 312 -
Male 5,812 5,585 6,394 6,220 6,414 6,618 6,192 6,185 6,169 6,150 5,878 5,857 1st 972 893 1,324 1,026 1,106 1,034 851 851 851 697 732 870 2nd 839 765 744 937 875 970 846 845 782 741 697 629 3rd 778 800 874 730 860 850 836 836 822 773 757 655 4th 726 709 789 842 751 864 869 868 861 808 730 782 5th 688 690 748 741 794 761 769 766 799 831 778 698 6th 700 605 693 698 700 757 778 776 759 796 779 787 7th 556 610 590 654 708 696 610 610 689 710 742 736 8th 553 513 632 592 620 686 633 633 606 794 663 700
Female 5,531 5,396 5,854 6,017 6,152 6,269 6,025 6,076 5,893 5,917 5,505 5,593 1st 891 889 1,191 970 1,023 959 806 806 748 738 662 908 2nd 746 728 692 829 850 924 734 733 743 648 642 612 3rd 763 725 749 722 805 833 825 822 692 763 639 618 4th 723 721 680 782 712 815 847 847 803 691 690 607 5th 641 668 713 772 791 685 753 753 796 783 699 722 6th 565 578 663 702 676 764 742 740 735 780 751 691 7th 610 522 585 652 643 643 623 682 685 726 732 705 8th 592 565 581 588 652 646 695 693 691 788 690 730
Source: Ministry of Education
Table 5.3 PUBLIC AND PRIVATE SECONDARY SCHOOLS, TEACHERS AND ENROLLMENT, 94/95 to 00/01
Number of schools Number of teachers Number of students School Type/Atoll 94/95 95/96 96/97 97/98 98/99 99/00 00/01 94/95 95/96 96/97 97/98 98/99 99/00 00/01 94/95 95/96 96/97 97/98 98/99 99/00 00/01
Total 13 14 15 14 16 16 16 144 152 152 163 162 197 161 2,400 2,510 2,514 2,562 2,667 2,586 2,853 Ailinglaplap 1 2 2 1 1 1 1 4 8 8 3 4 4 4 48 79 79 38 53 81 81 Kwajalein 3 4 4 5 5 5 5 22 25 25 38 40 56 33 457 451 434 554 567 516 609 Jaluit 1 1 1 1 1 1 1 18 17 17 19 19 17 19 262 238 238 260 261 286 273 Majuro 7 7 7 7 8 8 8 97 102 102 103 95 112 98 1,614 1,742 1,742 1,710 1,634 1,391 1,609 Namu 1 0 1 0 0 0 0 3 0 0 0 0 0 0 19 0 0 0 0 0 0 Wotje 0 0 0 0 1 1 1 0 0 0 0 4 8 7 0 0 0 0 152 201 281 Not reported - - - - - - - - - - - - - - - - 21 - - 111 -
Public 2 2 2 2 3 3 3 63 67 67 64 64 81 66 997 998 998 1,070 1,185 1,118 1,380 Jaluit 1 1 1 1 1 1 1 18 17 17 19 19 17 19 262 238 238 260 261 286 273 Majuro 1 1 1 1 1 1 1 45 50 50 45 41 56 40 735 760 760 810 772 631 826 Wotje - - - - 1 1 1 - - - - 4 8 7 - - - - 152 201 281 Private 11 12 13 12 13 13 13 81 85 85 99 98 116 95 1,403 1,512 1,495 1,492 1,482 1,357 1,473 Ailinglaplap 1 2 2 1 1 1 1 4 8 8 3 4 4 4 48 79 79 38 53 81 81 Kwajalein 3 4 4 5 5 5 5 22 25 25 38 40 56 33 457 451 434 554 567 516 609 Majuro 6 6 6 6 7 7 7 52 52 52 58 54 56 58 879 982 982 900 862 760 783 Namu 1 - 1 - - - - 3 - - - - - - 19 - - - - - -
Source: Ministry of Education

2001 RMI Statistical Abstract
46
Table 5.4 PUBLIC AND PRIVATE SECONDARY SCHOOL ENROLLMENT BY GRADE AND SEX, 89/90 to 00/01 Grade and sex 89/90 90/91 91/92 92/93 93/94 94/95 95/96 96/97 97/98 98/99 99/00 00/01
Total 1,966 2,143 2,215 2,377 2,482 2,400 2,510 2,514 2,562 2,667 2,586 2,853 9th 711 673 813 854 865 893 879 879 901 963 908 968 10th 516 652 584 622 646 614 709 713 645 702 699 787 11th 417 459 443 511 548 464 507 507 580 504 572 625 12th 322 359 375 390 423 429 415 415 436 498 407 473
Male 981 1,044 1,080 1,197 1,224 1,179 1,259 1,259 1,251 1,342 1,281 1,391 9th 346 326 399 445 443 437 452 452 462 483 434 453 10th 269 315 268 305 314 304 338 338 309 350 339 399 11th 212 228 222 248 259 221 242 242 280 269 294 301 12th 154 175 191 199 208 217 227 227 200 240 214 238
Female 985 1,099 1,135 1,180 1,258 1,221 1,251 1,255 1,311 1,325 1,305 1,462 9th 365 347 414 409 422 456 427 427 439 480 474 515 10th 247 337 316 317 332 310 371 375 336 352 360 388 11th 205 231 221 263 289 243 265 265 300 235 278 324 12th 168 184 184 191 215 212 188 188 236 258 193 235
Source: Ministry of Education Table 5.5 NUMBER OF STUDENTS GRADUATED FROM EIGHT GRADE IN PUBLIC SCHOOLS, 1996 to 2000
June, 1996 June, 1998 June, 1999 June, 2000 Both Both Both Both
Atoll/Island sexes Male Female sexes Male Female sexes Male Female sexes Male Female
Total 1,017 488 529 1,297 606 691 1,581 794 787 1,353 663 690 Ailinglaplap 49 32 17 58 35 23 73 41 32 71 34 37 Ailuk 16 4 12 13 6 7 20 8 12 15 4 11 Arno 31 17 14 67 31 36 78 40 38 65 27 38 Aur 14 6 8 10 4 6 18 8 10 11 8 3 Ebon 33 14 19 43 26 17 30 16 14 23 14 9 Enewetak 31 15 16 19 13 6 20 12 8 22 7 15 Jabat 8 4 4 4 1 3 8 4 4 7 4 3 Jaluit 57 28 29 84 39 45 83 39 44 61 29 32 Kili 30 15 15 16 6 10 9 1 8 12 10 2 Kwajalein 139 63 76 222 91 131 269 148 121 273 138 135 Lae 7 5 2 14 9 5 18 8 10 8 4 4 Lib 7 4 3 11 9 2 4 0 4 8 5 3 Likiep 13 6 7 20 9 11 15 7 8 22 8 14 Majuro 388 183 205 514 214 300 743 360 383 539 265 274 Maloelap 32 15 17 24 17 7 27 14 13 24 12 12 Mejit 12 4 8 18 14 4 10 4 6 19 9 10 Mili 30 14 16 36 15 21 24 13 11 34 17 17 Namorik 16 5 11 22 12 10 29 16 13 25 10 15 Namu 51 33 18 44 25 19 40 20 20 48 28 20 Ronglap(Mejatto) 14 9 5 7 4 3 14 8 6 16 6 10 Ujae 9 7 2 14 11 3 18 13 5 11 4 7 Utrik 6 3 3 4 2 2 5 3 2 4 2 2 Wotho 2 1 1 4 3 1 4 1 3 6 3 3 Wotje 22 1 21 29 10 19 22 10 12 29 15 14 Not reported - - - - - - - - - - - -
Note: 1997 and 2001 data not available Source: Ministry of Education

2001 RMI Statistical Abstract
47
Table 5.6 MARSHALL ISLANDS SCHOLARSHIP HOLDERS BY AGE AND SEX, 89/90 to 00/01 Sex and Age 89/90 90/91 91/92 92/93 93/94 94/95 95/96 96/97 97/98 99/00 00/01
Total 174 156 191 138 107 110 137 145 147 138 172 15 - 19 43 30 43 24 26 21 29 15 15 26 4 20 - 24 91 93 103 76 36 44 51 63 63 62 85 25 - 29 11 14 20 15 20 17 26 34 36 19 37 30 - 34 9 5 8 12 10 9 10 12 12 15 26 35 - 39 11 9 9 5 8 6 7 5 5 3 7 40 - 44 6 3 6 2 5 5 6 6 6 6 7 45 - 49 3 2 2 4 2 8 4 9 9 6 3 50 + - - - - - - 4 1 1 1 3
Male 121 102 122 89 60 70 78 68 69 62 97 15 - 19 28 18 21 18 14 9 14 6 6 12 1 20 - 24 59 58 64 49 20 28 25 28 28 26 44 25 - 29 9 11 17 8 11 14 20 16 17 8 23 30 - 34 6 4 6 6 5 3 6 5 5 10 19 35 - 39 10 6 7 2 5 6 4 1 1 1 4 40 - 44 6 3 5 2 3 3 4 3 3 2 3 45 - 49 3 2 2 4 2 7 3 8 8 3 1 50+ - - - - - - 2 1 1 - 2
Female 53 54 69 49 47 40 59 77 78 76 75 15 - 19 15 12 22 6 12 12 15 9 9 14 3 20 - 24 32 35 39 27 16 16 26 35 35 36 41 25 - 29 2 3 3 7 9 3 6 18 19 11 14 30 - 34 3 1 2 6 5 6 4 7 7 5 7 35 - 39 1 3 2 3 3 0 3 4 4 2 3 40 - 44 - - 1 - 2 2 2 3 3 4 4 45 - 49 - - - - - 1 1 1 1 3 2 50+ - - - - - - 2 - - 1 1 Source: Marshall Islands Scholarship, Grant & Loan Board, Ministry of Education Table 5.7 TOTAL NUMBER OF TWO AND FOUR YEAR COLLEGE GRADUATES, 1997 to 2001
1997 1988 1999 2000 2001 Sex and Age 2 yrs 4 yrs 2 yrs 4 yrs 2 yrs 4 yrs 2 yrs 4 yrs 2 yrs 4 yrs
Total 19 6 14 10 12 4 4 11 6 1 15 - 19 - - - - - - - - - - 20 - 24 15 2 4 1 6 3 3 6 1 - 25 - 29 2 1 4 4 1 1 - 2 1 - 30 - 34 1 2 4 2 2 - 1 1 2 1 35 - 39 - - - 1 1 - - 2 1 - 40 - 44 1 1 2 ̀ ̀ - - - - - 45 - 49 - - - 2 2 - - - 1 - 50 + - - - - - - - - - -
Male 13 4 6 4 2 1 2 3 - - 15 - 19 - - - - - - - - - - 20 - 24 9 - 4 - - 1 1 1 - - 25 - 29 2 1 - 2 - - - 1 - - 30 - 34 1 2 - - - - 1 1 - - 35 - 39 - - - - - - - - - - 40 - 44 1 1 2 - - - - - - - 45 - 49 - - - 2 2 - - - - - 50+ - - - - - - - - - -
Female 6 2 8 6 10 3 2 8 - - 15 - 19 - - - - - - - - - - 20 - 24 6 2 - 1 6 2 2 5 - - 25 - 29 - - 4 2 1 1 - 1 - - 30 - 34 - - 4 2 2 - - - - - 35 - 39 - - - 1 1 - - 2 - - 40 - 44 - - - - - - - - - - 45 - 49 - - - - - - - - - - 50+ - - - - - - - - - -
Note: 2001 data on male and female was not available and preliminary (subject to change) Source: Marshall Islands Scholarship, Grant & Loan Board, Ministry of Education

2001 RMI Statistical Abstract
48
Table 5.8 TEACHER -SCHOOL, STUDENT TEACHER RATIOS IN PRIMARY, SECONDARY SCHOOLS, 89/90 to 00/01
Primary School Secondary School Teacher/school Student/teacher Teacher/school Student/teacher
School year ratio ratio ratio ratio
2000/01 6.5 17.2 10.1 17.7 1999/00 5.8 19.3 10.4 15.5 1998/99 5.3 22.7 10.1 16.5 1997/98 6.3 18.9 11.6 15.7 1996/97 5.9 20.0 10.1 16.4 1995/96 5.9 20.0 10.9 16.5 1994/95 6.5 20.0 10.9 17.0 1993/94 5.3 23.9 12.5 18.0 1992/93 5.1 23.6 12.3 16.4 1991/92 5.1 23.9 12.5 16.2 1990/91 5.0 22.7 16.3 13.7 1989/90 5.5 21.7 12.6 16.9
Source: Ministry of Education
Table 5.9 GROSS ENROLLMENT RATES FOR PRIMARY AND SECONDARY SCHOOLS, 93/94 to 00/01 School year Total Primary Secondary
2000/01 81.7 105.0 47.1 1999/00 86.2 115.0 37.6 1998/99 84.5 109.9 40.7 1997/98 85.0 109.8 40.6 1996/97 85.3 109.1 41.1 1995/96 86.3 108.9 43.8 1994/95 93.9 119.3 43.0 1993/94 94.1 117.3 46.1
Source: Ministry of Education
Table 5.10 GRADUATES FROM THE COLLEGE OF THE
MARSHALL ISLANDS BY GENDER 1995 TO 2001
Year Total Male Female
2001 33 16 17 2000 55 26 29 1999 39 24 15 1998 48 25 23 1997 54 28 26 1996 58 32 26 1995 34 22 12
Source: Office of Admissions and Records, College of the Marshall Islands

2001 RMI Statistical Abstract
49
Table 5.11 STUDENTS ENROLLED/COMPLETING STUDIES, RMI-USP PROGRAM, 1996 to 2001 Students Enrolled Completing Studies Year Total Male Female Number Percent 2001 60 26 34 27 45.0 2000 60 26 34 35 58.3 1999 47 24 23 30 63.8 1998 82 50 32 41 50.0 1997 75 48 27 48 64.0 1996 74 35 39 36 48.7
Note: The figures include both Foundation and Preliminary courses Source: RMI-USP Joint Education Program
Table 5.12 EIGHTH GRADE GRADUATES FROM PUBLIC SCHOOLS BY SEX AND URBAN/RURAL RESIDENCE, 96/97 TO 00/01 Total Urban Rural Year Total Male Female Total Male Female Total Male Female 00/01 1,430 700 730 864 415 449 566 285 28199/00 1,353 663 690 812 403 409 541 260 28198/99 1,581 794 787 1,012 508 504 569 286 28397/98 1,297 606 691 736 305 431 561 301 26096/97 1,017 488 529 527 246 281 490 242 248 Source: Ministry of Education
Figure 5.2 Public Elementary Graduates, SY96/97 to SY00/01
0
200
400
600
800
1,000
1,200
1,400
1,600
1,800
00/0199/0098/9997/9896/97

2001 RMI Statistical Abstract
50
(this page left blank intentionally)

2001 RMI Statistical Abstract
51
CHAPTER 6: LABOR FORCE AND EMPLOYMENT
This section presents data on labor force, employment and unemployment in terms of occupational groups, industry, public and private sectors, and nationality. Major sources of information for labor force and employment data are the 1980, 1988 and 1999 censuses. Statistics bulletins of the Trust Territory of the Pacific Islands (TTPI) provide some historical data on employment. The Labor Force or economically active population consists of the employed and the unemployed. According to the 1999 Census of Population and Housing, the employed population is defined as “those who were active during the week before the census in providing for themselves or their families.” The unemployed population is defined as “ those who sought work during the week before the census as well as those who did not seek work but were available for work.” Those who were not in the labor force (not economically active) were defined as: Home-makers, who were occupied with purely domestic duties; Students who were attending school, college or training courses full-time; Old people whose ages were fifty years or more and who, on account of age, were not economically active; Disabled persons, or those who were not active by reason of mental or physical disability; and
Other persons who were in institutions, such as patients, prisoners, and the like; students boarding at high schools, and those who were reported as temporary visitors were not include in the category.

2001 RMI Statistical Abstract
52
Table 6.1 WORKING AGE POPULATION BY EMPLOYMENT STATUS, 1980 to 1999
1980 1988 1999 Employment Status Number Percent Number Percent Number Percent
Working age pop (15+ years ) Total 15,294 - 21,244 - 28,698 - Male 7,696 - 10,819 - 14,595 - Female 7,598 - 10,425 - 14,103 -
Economically Active Total 7,309 47.8 11,488 54.1 14,677 51.2 Male 5,042 65.5 8,353 77.2 9,679 66.3 Female 2,267 29.8 3,135 30.1 4,998 35.4
Employed Total 6,598 90.3 10,056 87.5 10,141 69.1 Male 4,587 91.0 7,335 87.8 7,008 72.4 Female 2,011 88.7 2,721 86.8 3,133 62.7
Unemployed Total 711 9.7 1,432 12.5 4,536 30.9 Male 455 9.0 1,018 12.2 2,671 27.6 Female 256 11.3 414 13.2 1,865 37.3
Economically Not Active Total 7,985 52.2 9,546 44.9 14,015 48.8 Male 2,654 34.5 2,328 21.5 4,913 33.7 Female 5,331 70.2 7,218 69.2 9,102 64.6
Not Stated Total - - 210 1.0 6 0.02 Male - - 138 1.3 3 0.02 Female - - 72 0.7 3 0.02
Source: 1980,1988 and 1999 Census of Population and Housing, EPPSO
Table 6.2 ECONOMICALLY ACTIVE, EMPLOYED AND UNEMPLOYED POPULATION, 1980 Subject Total Male Female
Total Population 30,873 15,851 15,022 Working Age Population (15 years & over) 15,294 7,696 7,598 Percentage of Total Population 49.5 48.6 50.6 Economically Active Population 7,309 5,042 2,267 Percentage of Working Population 47.8 65.5 29.8 Employed Population 6,598 4,587 2,011 Unemployed Population 711 455 256 Unemployment Rate 9.7 9.0 11.3
Source: 1980 Census of Population, US Bureau of Census and EPPSO
Table 6.3 ECONOMICALLY ACTIVE, EMPLOYED AND UNEMPLOYED POPULATION, 1988 Subject Total Male Female
Total Population 43,380 22,181 21,199 Working Age Population (15 years & over) 21,244 10,819 10,425 Percentage of Total Population 49.0 48.8 49.2 Economically Active Population 11,488 8,353 3,135 Percentage of Working Population 54.1 77.2 30.1 Employed Population 10,056 7,335 2,721 Unemployed Population 1,432 1,018 414 Unemployment Rate 12.5 12.2 13.2
Source: 1988 Census of Population and Housing, EPPSO

2001 RMI Statistical Abstract
53
Table 6.4 ECONOMICALLY ACTIVE, EMPLOYED AND UNEMPLOYED POPULATION, 1999 Subject Total Male Female
Total Population 50,840 26,026 24,814
Working Age Population (15 years & over) 28,698 14,595 14,103 Percentage of Total Population 56.4 56.1 56.8
Economically Active Population 14,677 9,679 4,998 Percentage of Working Population 51.1 66.3 35.4
Employed Population 10,141 7,008 3,133 Unemployed Population 4,536 2,671 1,865 Unemployment Rate 30.9 27.6 37.3
Source: 1999 Census of Population and Housing, EPPSO
Table 6.5 GROWTH OF POPULATION AND LABOR FORCE, 1988 and 1999 Both Sexes Males Females Subject 1988 1999 1988 1999 1988 1999
Total population 43,380 50,840 22,181 26,026 21,199 24,814Percent increase 1988-99 - 17.2 - 17.3 - 17.1Annual growth rate 1988-99 - 1.5 - 1.6 - 1.5
Labor force 11,488 14,677 8,353 9,679 3,135 4,998Percent increase 1988-99 - 27.8 - 15.9 - 59.4Annual growth rate 1988-99 - 2.4 - 1.4 - 4.6
Crude activity rate 26.5 28.9 37.7 37.2 14.8 20.1 Notes: Crude Activity Rate is the ratio of the labor force to the total population Source: 1988 and 1999 Census of Population and Housing, EPPSO
Table 6.6 GROWTH OF POPULATION AND LABOR FORCE AGED 15 YEARS AND OVER, 1988 and 1999 Both Sexes Males Females Subject 1988 1999 1988 1999 1988 1999
Population 15+ years 21,244 28,698 10,819 14,595 10,425 14,103Percent increase 1988-99 - 35.1 - 34.9 - 35.3
Labor force 15+ years 11,488 14,677 8,353 9,679 3,135 4,998Percent increase 1988-99 - 27.8 - 15.9 - 59.4
Activity rate 54.1 51.1 77.2 66.3 30.1 35.4 Note: Activity Rate is the ratio of the labor force to the total population 15+ years Source: 1988 and 1999 Census of Population and Housing, EPPSO
Table 6.7 AGE-SPECIFIC ACTIVITY RATES BY SEX AND BY MARITAL STATUS, 1999 Both sexes Males Females Widowed/ Widowed/ Widowed/ Never divorced/ Never divorced/ Never divorced/ Age group married Married separated married Married separated married Married separated 15-19 17.7 37.4 31.3 20.3 56.0 28.6 14.8 29.1 33.3 20-24 45.1 51.7 42.2 52.4 72.5 28.6 34.8 37.2 44.7 25-29 62.7 62.0 48.5 70.8 84.7 60.0 50.4 41.4 46.6 30-34 66.3 66.3 76.7 75.4 90.3 100.0 51.0 42.7 70.2 35-39 64.6 68.0 67.1 77.0 91.1 78.9 40.5 44.9 63.5 40-44 69.1 69.8 68.8 80.5 91.7 87.5 51.3 47.7 62.5 45-49 59.6 70.9 64.0 67.6 92.4 71.0 42.9 43.1 61.4 50-54 56.5 67.3 54.5 65.0 88.9 61.3 40.9 40.3 51.9 55-59 40.0 60.6 46.0 63.2 78.0 72.0 23.1 34.5 37.3 60-64 32.5 42.7 31.5 40.0 58.6 47.1 25.0 22.6 25.8 65-69 20.5 27.9 16.7 26.3 34.7 34.3 15.0 16.0 9.4 70-74 8.3 14.5 16.3 0.0 17.8 23.5 13.3 9.7 12.9 75+ 5.9 7.5 8.4 9.1 10.8 11.4 4.3 2.8 7.3 All age groups 33.8 61.4 41.2 40.7 82.9 50.6 25.2 40.2 37.9 Note: Activity Rate is the ratio of the labor force to the total population 15+ years Source: 1999 Census of Population and Housing, EPPSO
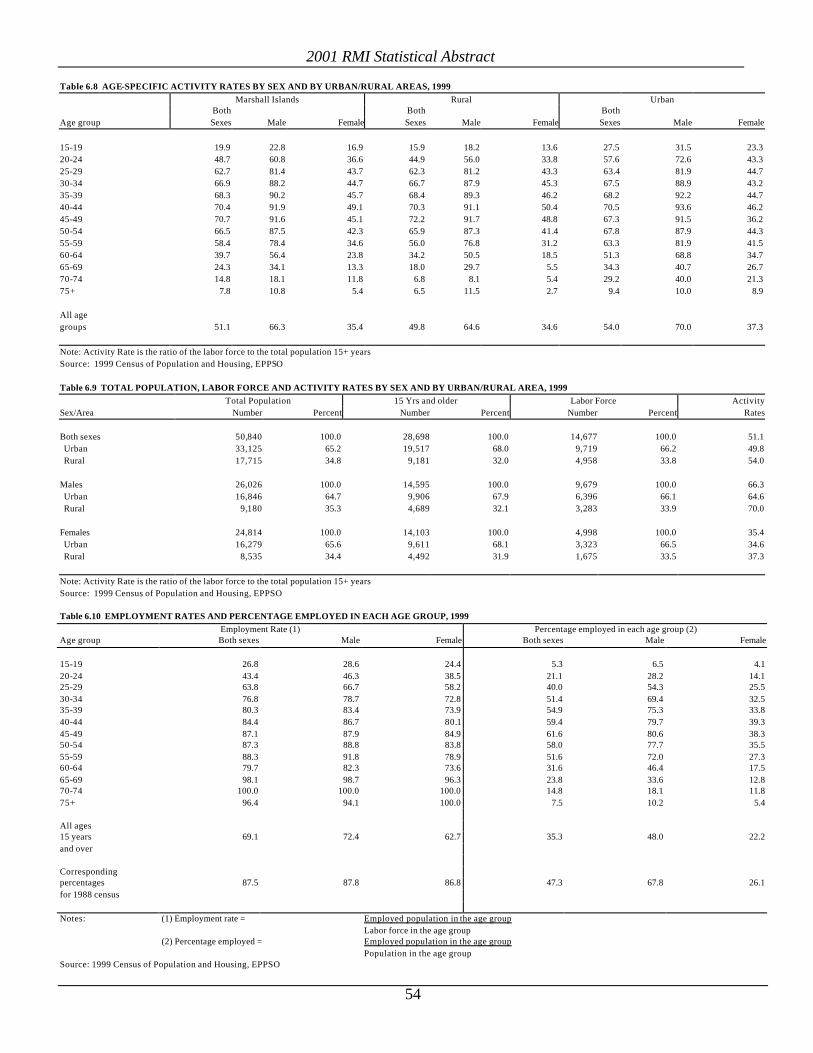
2001 RMI Statistical Abstract
54
Table 6.8 AGE-SPECIFIC ACTIVITY RATES BY SEX AND BY URBAN/RURAL AREAS, 1999 Marshall Islands Rural Urban Both Both Both Age group Sexes Male Female Sexes Male Female Sexes Male Female 15-19 19.9 22.8 16.9 15.9 18.2 13.6 27.5 31.5 23.3 20-24 48.7 60.8 36.6 44.9 56.0 33.8 57.6 72.6 43.3 25-29 62.7 81.4 43.7 62.3 81.2 43.3 63.4 81.9 44.7 30-34 66.9 88.2 44.7 66.7 87.9 45.3 67.5 88.9 43.2 35-39 68.3 90.2 45.7 68.4 89.3 46.2 68.2 92.2 44.7 40-44 70.4 91.9 49.1 70.3 91.1 50.4 70.5 93.6 46.2 45-49 70.7 91.6 45.1 72.2 91.7 48.8 67.3 91.5 36.2 50-54 66.5 87.5 42.3 65.9 87.3 41.4 67.8 87.9 44.3 55-59 58.4 78.4 34.6 56.0 76.8 31.2 63.3 81.9 41.5 60-64 39.7 56.4 23.8 34.2 50.5 18.5 51.3 68.8 34.7 65-69 24.3 34.1 13.3 18.0 29.7 5.5 34.3 40.7 26.7 70-74 14.8 18.1 11.8 6.8 8.1 5.4 29.2 40.0 21.3 75+ 7.8 10.8 5.4 6.5 11.5 2.7 9.4 10.0 8.9 All age groups 51.1 66.3 35.4 49.8 64.6 34.6 54.0 70.0 37.3 Note: Activity Rate is the ratio of the labor force to the total population 15+ years Source: 1999 Census of Population and Housing, EPPSO Table 6.9 TOTAL POPULATION, LABOR FORCE AND ACTIVITY RATES BY SEX AND BY URBAN/RURAL AREA, 1999 Total Population 15 Yrs and older Labor Force ActivitySex/Area Number Percent Number Percent Number Percent Rates Both sexes 50,840 100.0 28,698 100.0 14,677 100.0 51.1 Urban 33,125 65.2 19,517 68.0 9,719 66.2 49.8 Rural 17,715 34.8 9,181 32.0 4,958 33.8 54.0 Males 26,026 100.0 14,595 100.0 9,679 100.0 66.3 Urban 16,846 64.7 9,906 67.9 6,396 66.1 64.6 Rural 9,180 35.3 4,689 32.1 3,283 33.9 70.0 Females 24,814 100.0 14,103 100.0 4,998 100.0 35.4 Urban 16,279 65.6 9,611 68.1 3,323 66.5 34.6 Rural 8,535 34.4 4,492 31.9 1,675 33.5 37.3 Note: Activity Rate is the ratio of the labor force to the total population 15+ years Source: 1999 Census of Population and Housing, EPPSO Table 6.10 EMPLOYMENT RATES AND PERCENTAGE EMPLOYED IN EACH AGE GROUP, 1999
Employment Rate (1) Percentage employed in each age group (2) Age group Both sexes Male Female Both sexes Male Female 15-19 26.8 28.6 24.4 5.3 6.5 4.1 20-24 43.4 46.3 38.5 21.1 28.2 14.1 25-29 63.8 66.7 58.2 40.0 54.3 25.5 30-34 76.8 78.7 72.8 51.4 69.4 32.5 35-39 80.3 83.4 73.9 54.9 75.3 33.8 40-44 84.4 86.7 80.1 59.4 79.7 39.3 45-49 87.1 87.9 84.9 61.6 80.6 38.3 50-54 87.3 88.8 83.8 58.0 77.7 35.5 55-59 88.3 91.8 78.9 51.6 72.0 27.3 60-64 79.7 82.3 73.6 31.6 46.4 17.5 65-69 98.1 98.7 96.3 23.8 33.6 12.8 70-74 100.0 100.0 100.0 14.8 18.1 11.8 75+ 96.4 94.1 100.0 7.5 10.2 5.4 All ages 15 years 69.1 72.4 62.7 35.3 48.0 22.2 and over Corresponding percentages 87.5 87.8 86.8 47.3 67.8 26.1 for 1988 census Notes: (1) Employment rate = Employed population in the age group
Labor force in the age group (2) Percentage employed = Employed population in the age group Population in the age group
Source: 1999 Census of Population and Housing, EPPSO

2001 RMI Statistical Abstract
55
Table 6.11 AGE DISTRIBUTION OF THE UNEMPLOYED BY SEX, AND AGE-SPECIFIC UNEMPLOYMENT RATES, 1999 Age distribution of unemployed population (%) Age specific unemployment rates Age group Both sexes Male Female Both sexes Male Female 15-19 20.1 19.4 21.3 73.2 71.4 75.6 20-24 27.4 27.4 27.3 56.6 53.7 61.5 25-29 18.6 18.9 18.1 36.2 33.3 41.8 30-34 11.0 11.5 10.2 23.2 21.3 27.2 35-39 8.4 8.0 8.9 19.7 16.6 26.1 40-44 5.7 5.4 6.2 15.6 13.3 19.9 45-49 4.0 4.6 3.3 12.9 12.1 15.1 50-54 2.5 2.7 2.3 12.7 11.2 16.2 55-59 1.2 1.0 1.4 11.7 8.2 21.1 60+ 1.1 1.2 1.1 12.3 10.9 15.6 All ages 15 years 100.0 100.0 100.0 30.9 27.6 37.3 and over
Source: 1999 Census of Population and Housing, EPPSO
Table 6.12 LABOR FORCE, EMPLOYED AND UNEMPLOYED BY AGE (15 to 59 only) AND SEX, 1988
Economically Employed Unemployed Age/sex active Number Percent Number Percent
Total 10,884 9,452 86.8 1,432 13.2 15-19 1,120 686 61.3 434 38.8 20-24 1,962 1,511 77.0 451 23.0 25-29 1,904 1,655 86.9 249 13.1 30-34 1,721 1,593 92.6 128 7.4 35-39 1,572 1,490 94.8 82 5.2 40-44 1,005 973 96.8 32 3.2 45-49 688 657 95.5 31 4.5 50-54 480 467 97.3 13 2.7 55-59 432 420 97.2 12 2.8 Male 7,945 6,927 87.2 1,018 12.8 15-19 795 508 63.9 287 36.1 20-24 1,392 1,077 77.4 315 22.6 25-29 1,414 1,228 86.8 186 13.2 30-34 1,256 1,158 92.2 98 7.8 35-39 1,168 1,104 94.5 64 5.5 40-44 726 703 96.8 23 3.2 45-49 521 498 95.6 23 4.4 50-54 357 344 96.4 13 3.6 55-59 316 307 97.2 9 2.8 Female 2,939 2,525 85.9 414 14.1 15-19 325 178 54.8 147 45.2 20-24 570 434 76.1 136 23.9 25-29 490 427 87.1 63 12.9 30-34 465 435 93.5 30 6.5 35-39 404 386 95.5 18 4.5 40-44 279 270 96.8 9 3.2 45-49 167 159 95.2 8 4.8 50-54 123 123 100.0 - - 55-59 116 113 97.4 3 3.0 Source: 1988 Census of Population and Housing, EPPSO

2001 RMI Statistical Abstract
56
Table 6.13 LABOR FORCE, EMPLOYED AND UNEMPLOYED BY AGE AND SEX, 1999 Economically Employed Unemployed Age/sex active Number Percent Number Percent Total 14,677 10,141 69.1 4,536 30.9 15-19 1,249 335 26.8 914 73.2 20-24 2,193 951 43.4 1242 56.6 25-29 2,324 1,482 63.8 842 36.2 30-34 2,139 1,642 76.8 497 23.2 35-39 1,928 1,548 80.3 380 19.7 40-44 1,665 1,405 84.4 260 15.6 45-49 1,414 1,231 87.1 183 12.9 50-54 898 784 87.3 114 12.7 55-59 454 401 88.3 53 11.7 60-64 236 188 79.7 48 20.3 65-69 105 103 98.1 2 1.9 70-74 44 44 100.0 - - 75+ 28 27 96.4 1 3.6 Male 9,679 7,008 72.4 2,671 27.6 15-19 724 207 28.6 517 71.4 20-24 1,366 633 46.3 733 53.7 25-29 1,517 1,012 66.7 505 33.3 30-34 1,441 1,134 78.7 307 21.3 35-39 1,293 1,079 83.4 214 16.6 40-44 1,081 937 86.7 144 13.3 45-49 1,009 887 87.9 122 12.1 50-54 632 561 88.8 71 11.2 55-59 331 304 91.8 27 8.2 60-64 164 135 82.3 29 17.7 65-69 78 77 98.7 1 1.3 70-74 26 26 100.0 - - 75+ 17 16 94.1 1 5.9 Female 4,998 3,133 62.7 1,865 37.3 15-19 525 128 24.4 397 75.6 20-24 827 318 38.5 509 61.5 25-29 807 470 58.2 337 41.8 30-34 698 508 72.8 190 27.2 35-39 635 469 73.9 166 26.1 40-44 584 468 80.1 116 19.9 45-49 405 344 84.9 61 15.1 50-54 266 223 83.8 43 16.2 55-59 123 97 78.9 26 21.1 60-64 72 53 73.6 19 26.4 65-69 27 26 96.3 1 3.7 70-74 18 18 100.0 - - 75+ 11 11 100.0 - - Source: 1999 Census of Population and Housing, EPPSO
Figure 6.1 Unemployment Rate by Age Group (15 to 64), 1999
0.0
10.0
20.0
30.0
40.0
50.0
60.0
70.0
80.0
15-19 20-24 25-29 30-34 35-39 40-44 45-49 50-54 55-59 60-64

2001 RMI Statistical Abstract
57
Table 6.14 EMPLOYED POPULATION CLASSIFIED BY MAJOR OCCUPATIONAL GROUP AND SEX, 1988 Total Male Female Occupation Number Percent Number Percent Number Percent
All occupation groups 10,056 100.0 7,335 100.0 2,721 100.0 Professional, Technical and Related Workers 1,682 16.7 1,148 15.7 534 19.6 Administrative, Executive and Managerial Workers 265 2.6 247 3.4 18 0.7 Clerical and Related Workers 902 9.0 428 5.8 474 17.4 Sales Workers 501 5.0 281 3.8 220 8.1 Service Workers 1,322 13.1 825 11.2 497 18.3 Agriculture and Related Workers/Fishermen 2,129 21.2 2,067 28.2 62 2.3 Production Workers, Transport Equipment, Operators & Laborers 3,249 32.3 2,335 31.8 914 33.6 Not reported 6 0.1 4 0.1 2 0.1
Source : 1988 Census of Population and Housing, EPPSO Table 6.15 EMPLOYED POPULATION CLASSIFIED BY MAJOR OCCUPATIONAL GROUP AND SEX, 1999
Total Male Female Occupation Number Percent Number Percent Number Percent All occupation groups 10,141 100.0 7,008 100.0 3,133 100.0 Professional, Technical and Related Workers 1,546 15.2 991 14.1 555 17.7 Administrative, Executive and Managerial Workers 436 4.3 352 5.0 84 2.7 Clerical and Related Workers 1,365 13.5 534 7.6 831 26.5 Sales Workers 344 3.4 212 3.0 132 4.2 Service Workers 1,687 16.6 1,155 16.5 532 17.0 Agriculture and Related Workers/Fishermen 2,079 20.5 1,838 26.2 241 7.7 Production Workers, Transport Equipment, Operators & Laborers 2,471 24.4 1,780 25.4 691 22.1 Not reported 213 2.1 146 2.1 67 2.1
Source: 1999 Census of Population and Housing, EPPSO Table 6.16 EMPLOYED POPULATION CLASSIFIED BY MAJOR INDUSTRY GROUP AND SEX, 1988
Total Male Female Industry Number Percent Number Percent Number Percent All Industries 10,056 100.0 7,335 100.0 2,721 100.0 Agriculture & fishing 2,150 21.4 2,080 28.4 70 2.6 Mining & Quarrying 2 - 2 0.0 - - Manufacturing 945 9.4 84 1.1 861 31.6 Electricity & water 82 0.8 78 1.1 4 0.1 Construction 1,076 10.7 1,043 14.2 33 1.2 Wholesale/Retail Restaurants & Hotels 1,394 13.9 753 10.3 641 23.6 Transport, Storage & Communication 537 5.3 482 6.6 55 2.0 Finance, Insurance Real Estate & Business 833 8.3 660 9.0 173 6.4 Community, Social & Personal Services 3,035 30.2 2,151 29.3 884 32.5 Not Stated 2 - 2 0.0 - -
Source : 1988 Census of Population and Housing, EPPSO Table 6.17 EMPLOYED POPULATION CLASSIFIED BY MAJOR INDUSTRY GROUPS AND SEX, 1999
Total Male Female Industry Number Percent Number Percent Number Percent All Industries 10,141 100.0 7,008 100.0 3,133 100.0 Agriculture & Fishery 2,114 20.9 1,867 26.6 247 7.9 Mining & Quarrying - - - - - - Manufacturing 761 7.5 81 1.2 680 21.7 Electricity, Gas & Water 258 2.5 242 3.5 16 0.5 Construction 848 8.4 834 11.9 14 0.5 Wholesale & Retail Trade 788 7.8 364 5.2 424 13.5 Transportation, Storage & Communication 763 7.5 659 9.4 104 3.3 Finance, Insurance, Real Estate & Business Services 559 5.5 305 4.3 254 8.1 Community, Social & Personal Services 3,803 37.5 2,493 35.6 1,310 41.8 Not Reported 247 2.4 163 2.3 84 2.7
Source: 1999 Census of Population and Housing, EPPSO

2001 RMI Statistical Abstract
58
Table 6.18 EMPLOYED POPULATION BY CLASS OF WORKER, 1980
Total Male Female Class of Worker Number Percent Number Percent Number Percent Total 6,598 100.0 4,587 100.0 2,011 100.0 Paid employees, total 3,440 52.1 2,669 58.2 771 38.3 Private Wage & Salary Workers 1,631 24.7 1,212 26.4 419 20.8 Government Workers 208 3.2 176 3.8 32 1.6 Local Government Workers 1,601 24.3 1,281 27.9 320 15.9 Other workers, total 3,158 47.9 1,918 41.8 1,240 61.7 Self-Employed Workers 144 2.2 107 2.3 37 1.8 Unpaid Family Workers 12 0.2 4 0.1 8 0.4 Primarily Subsistence Workers 3,002 45.5 1,807 39.4 1,195 59.4 Source: 1980 Census of Population, US Bureau of Census and EPPSO Table 6.19 EMPLOYED PERSONS BY EMPLOYMENT STATUS, 1994
Total Male Female Employment status Number Percent Number Percent Number Percent Total 12,055 100.0 8,035 100.0 4,020 100.0 Employee of private company or business 3,447 28.6 2,309 28.7 1,138 28.3 Government employee 3,234 26.8 2,426 30.2 808 20.1 Employer with paid employees 110 0.9 82 1.0 28 0.7 Self-employed or own account worker 2,964 24.6 1,802 22.4 1,162 28.9 Unpaid worker in family farm or business 2,266 18.8 1,397 17.4 869 21.6 Not stated 34 0.3 19 0.2 15 0.4
Source: 1994 RMI Multi-subject Household Survey, EPPSO
Table 6.20 EMPLOYED POPULATION BY CLASS OF WORKER, 1999
Total Male Female Class of Worker Number Percent Number Percent Number Percent Total 10,141 100.0 7,008 100.0 3,133 100.0 Employee (Public Sector) 3,106 30.6 2,234 31.9 872 27.8 Employee (Private Sector) 4,115 40.6 2,870 41.0 1,245 39.7 Self Employed 2,622 25.8 1,732 24.7 890 28.4 Employer in Own Farm or Business 115 1.1 70 1.0 45 1.5 Paid Worker in Family Farm or Business 96 1.0 45 0.6 51 1.6 Unpaid Worker in Family Farm/Business 87 0.9 57 0.8 30 1.0 Source: 1999 Census of Population and Housing, EPPSO
Table 6.21 UNEMPLOYMENT BY HIGHEST GRADE COMPLETED, SEX AND AGE, 1988 Highest Males Females grade Percent unemployed by age Percent unemployed by age completed 15-19 20-24 >24 Ave 15-19 20-24 >24 Ave None 7.7 4.8 4.8 5.6 8.8 5.1 3.1 5.8 G1-5 8.7 7.3 4.3 6.5 4.8 2.2 3.8 3.6 G6-7 19.5 7.0 4.6 9.5 8.8 6.6 7.6 7.7 G8 25.4 21.3 25.5 24.2 32.0 18.4 21.4 24.2 G9-11 28.2 31.7 28.9 29.6 34.7 39.7 27.5 34.1 G12 9.4 21.6 23.3 18.9 10.2 23.5 30.5 21.0 Post Secondary 1.0 5.4 8.2 5.3 0.7 4.4 6.1 3.6 Not stated 0.1 0.9 0.4 0.4 0.0 0.1 0.0 0.0 Actual No. 287 315 416 1,018 147 136 131 414 % of Total 28.2 30.9 40.9 100.0 35.5 32.9 31.6 100.0 Source: Census of Population and Housing, 1988, EPPSO

2001 RMI Statistical Abstract
59
Table 6.22 UNEMPLOYMENT BY HIGHEST GRADE COMPLETED, SEX AND AGE, 1999 Highest Males Females grade Percent unemployed by age Percent unemployed by age completed 15-19 20-24 >24 Ave 15-19 20-24 >24 Ave None 4.1 3.1 3.5 3.5 2.3 3.3 4.0 3.4G1-5 6.6 4.5 3.2 4.2 8.1 4.3 3.5 4.7G6-7 13.5 11.2 6.1 8.9 13.1 8.1 9.0 9.6G8 33.8 22.2 27.3 27.2 28.9 18.3 25.8 24.4G9-11 31.3 29.8 27.2 28.7 31.0 31.8 28.1 29.8HSG/GED 9.3 20.6 23.1 19.7 13.6 23.8 21.3 20.3Some college 0.6 5.7 5.1 4.4 1.2 7.8 4.5 4.7ACOP/ACAP 0.2 1.8 2.5 1.9 0.0 1.4 1.3 1.1Bachelor 0.0 0.3 0.5 0.4 0.0 0.0 0.4 0.2Not stated 0.6 0.8 1.5 1.1 1.8 1.2 2.1 1.8 Actual No. 517 733 1,421 2,671 397 509 959 1,865% of Total 19.4 27.4 53.2 100.0 21.3 27.3 51.4 100.0 Note: G=Grade, HSG/GED= High school graduate/General education diploma, ACOP/ACAP= Associate college, Occupational program/Associate college, Academic program Source: Census of Population and Housing, 1999, EPPSO
Table 6.23 UNEMPLOYMENT BY HIGHEST GRADE COMPLETED, SEX AND AGE, EBEYE, 1999 Highest Males Females grade Percent unemployed by age Percent unemployed by age completed 15-19 20-24 >24 Ave 15-19 20-24 >24 Ave None 1.5 1.6 2.3 2.0 2.4 1.3 2.0 1.9 G1-5 5.8 1.6 1.6 2.2 2.4 1.3 4.5 3.3 G6-7 8.7 9.6 3.2 5.5 12.2 6.8 6.5 7.4 G8 21.7 14.4 26.3 22.7 17.1 10.8 17.5 15.6 G9-11 47.8 40.8 33.0 37.0 51.2 39.2 30.5 36.1 HSG/GED 14.5 24.8 29.8 26.5 14.7 32.4 36.4 32.0 Some college 0.0 4.8 2.6 2.7 0.0 6.8 2.0 2.9 ACOP/ACAP 0.0 2.4 0.6 1.0 0.0 1.4 0.0 0.4 Bachelor 0.0 0.0 0.0 0.0 0.0 0.0 0.6 0.4 Not stated 0.0 0.0 0.6 0.4 0.0 0.0 0.0 0.0 Actual No. 69 125 312 506 41 74 154 269 % of Total 13.6 24.7 61.7 100.0 15.2 27.5 57.3 100.0 Note :G=Grade, HSG/GED= High school graduate/General education diploma, ACOP/ACAP= Associate college, Occupational program/Associate college, Academic program Source: Census of Population and Housing, 1 999, EPPSO
Table 6.24 UNEMPLOYMENT BY HIGHEST GRADE COMPLETED,SEX AND AGE, MAJURO, 1999 Highest Males Females grade Percent unemployed by age Percent unemployed by age completed 15-19 20-24 >24 Ave 15-19 20-24 >24 Ave None 5.8 2.1 4.0 3.8 2.3 2.6 2.5 2.5 G1-5 7.1 5.6 3.2 4.6 8.5 4.2 2.7 4.3 G6-7 12.8 10.4 5.7 8.3 11.9 6.4 4.9 6.7 G8 27.0 19.9 23.6 23.1 24.4 17.4 23.0 21.6 G9-11 34.1 27.6 25.5 27.6 31.8 30.6 34.0 32.6 HSG/GED 11.5 23.9 26.5 23.1 18.2 27.5 23.6 23.7 Some college 0.9 7.4 6.9 6.0 2.3 9.4 6.6 6.6 ACOP/ACAP 0.4 2.1 3.6 2.6 0.0 1.5 2.3 1.6 Bachelor 0.0 0.5 0.7 0.5 0.0 0.0 0.4 0.2 Not stated 0.4 0.5 0.3 0.4 0.6 0.4 0.0 0.2 Actual No. 226 377 698 1,301 176 265 474 915 % of Total 17.4 29.0 53.6 100.0 19.2 29.0 51.8 100.0 Source: Census of Population and Housing, 1999, EPPSO

2001 RMI Statistical Abstract
60
Table 6.25 EMPLOYMENT TRENDS IN MONETISED AND SUBSISTANCE SECTORS, SELECTED YEARS, 1973 to 1999
Total Monetised sector Subsistence Year and source Employment Total Public Private sector 1999, Census 10,141 7,221 3,106 4,115 2,920 1988, Census 10,056 7,983 3,392 4,591 2,073 1980, Census 6,598 3,596 1,809 1,787 3,002 1979, Skill & Occupation Su rvey 6,999 3,632 1,415 2,217 3,367 1973, Census 5,749 3,468 - - 2,281
Note: The 1999 CPH results show a reduction of employment in the monetised sector (both in the public and private sub-sector) reflecting the impact of the Public Sector Reform Program of the Government. This naturally would tend to increase the number engaged in the subsistence sector. However, the number of 2920 in the subsistence sector should be treated with caution, because there is a chance that those in some small fa mily businesses who are paid may be included due to the vague borderline interpretation between subsistence activity and other small private and other small private enterprises. The figures in this table include those employed for short durations as well. Source: TTPI, Office of Planning and Statistics, quarterly Bulletin of Statistics, Vol.No.3 December 1978, Table 9 (for 1973 Census) and Vol. 1, No.3, September 1979, Table 3.8 (for skill survey 1977 results), 1980 Census of Population, US Bureau of the Census and EPPSO, 1988 Census of Population and Housing, EPPSO Table 6.26 COMPENSATION OF EMPLOYEES (FY ending 9/30, US $ thousands) 1981 to 1990
Items 1981 1982 1984 1986 1988 1990
TOTAL EMPLOYEE COMPENSATION 12,054 15,455 17,426 24,112 36,139 39,947
GOVERNMENT 8,470 9,728 10,928 13,210 16,814 19,537 Taxed 8,110 9,298 10,353 12,617 16,149 18,904 Benefits (incl. free housing) 360 430 575 593 665 633 GOVERNMENT ENTERPRISES 280 446 567 447 954 4,407 PRIVATE 3,204 5,177 5,805 10,293 18,237 15,838 Taxed 2,924 4,803 5,392 9,623 17,122 14,649 Other 73 120 135 239 425 489 Free Accommodation 100 104 113 172 253 289 Social Security Contribution 107 150 165 259 437 411 DOMESTIC SERVICE 100 104 126 162 134 165 Sources: TTPI Office of Planning and Statistics K.N.C. Pillai; "Report on National Accounts", Advisory Mission to Republic of the Marshall Islands", ESCAP, 1985
Table 6.27 GOVERNMENT EMPLOYEES BY OCCUPATIONAL CLASSIFICATION AND GENDER, RMI, 2001 Occupational classification Both sexes Percent Male Female All occupations 1,923 100.0 1,334 589 General Admin, Managerial & related 347 18.0 201 146 Legal and related 14 0.7 10 4 Data, information & related 191 9.9 95 96 Agriculture & related 19 1.0 17 2 Fisheries & related 19 1.0 18 1 Medical, Public Health & related 274 14.2 139 135 Education, Social and related 418 21.7 251 167 Technical, Mechanical, Engineering, Trade & related 641 33.3 603 38
Source: Public Service Commission, EPPSO
Table 6.28 ALIEN WORKERS BY GENDER, 1995 to 2001 Year Total Male Female 2001 812 548 264 2000 585 421 164 1999 505 371 134 1998 464 359 105 1997 341 254 87 1996 322 233 89 1995 297 223 74
Source: Division of Labor, MoFA

2001 RMI Statistical Abstract
61
CHAPTER 7: AGRICULTURE, LIVESTOCK AND FISHERIES This section presents production data on crops, livestock, and fisheries. Agriculture in the RMI is primarily subsistence-based, except for the commercial production of copra. The production figures shown here for crops and livestock were provided by the Agriculture Division of the Ministry of Resources and Development. Since the RMI has no system of agricultural surveys, these data are subjective estimates. Copra production and price data were obtained from the Tobolar Processing Plant, which is the sole agency for copra processing and export. Total landing of fish by subsistence fishermen is not available, however, commercial fish catch by foreign fishing vessels are available from MIMRA and some data are presented here.

2001 RMI Statistical Abstract
62
Table 7.1 PRIMARY PRODUCTION BY HOUSEHOLDS FOR OWN CONSUMPTION, 1995 to 1999
1995 1996 1997 1998 1999 Quantity Value Quantity Value Quantity Value Quantity Value Quantity Value
Item Short Tons US $ Short Tons US $ Short Tons US $ Short Tons US $ Short Tons US $
Agricultural 2,370 1,215,763 2,468 1,301,704 2,564 1,372,425 2,651 1,418,073 2,703 1,447,707 Banana 158 90,491 164 96,745 170 102,065 176 105,545 179 107,750 Breadfruit 1,155 546,371 1,197 583,226 1,238 612,095 1,280 632,967 1,306 646,196 Pandanus 105 48,109 109 51,439 112 53,760 116 55,593 118 56,754 Coconuts (all types) 815 357,739 856 385,424 898 410,800 928 424,808 947 433,686 Taro 105 140,320 109 150,035 112 157,244 116 162,606 118 166,004 Other vegetables 32 15,360 33 16,315 34 16,830 35 17,403 35 17,766 Fruits - 17,373 - 18,520 - 19,631 - 19,151 - 19,551
Meat 813 1,713,471 - 1,889,305 - 2,050,540 - 1,953,730 - 2,086,582 Pork 591 1,200,785 - 1,354,200 - 1,500,453 - 1,400,378 - 1,495,603 Chicken 222 512,686 - 535,105 - 550,087 - 553,352 - 590,979
Fish/shellfish 1,521 3,238,828 1,593 3,729,126 - 3,747,476 1,647 3,856,288 1,758 3,998,969 Fish 1,521 3,168,096 1,593 3,655,848 - 3,672,000 1,647 3,780,512 1,758 3,920,390 Shellfish/crabs - 70,732 - 73,278 - 75,476 - 75,776 - 78,579
Note: Data for 2000 and 2001 not available. Sources: Ray Shaw, St rengthening of Agricultural Support Services Consultant Report for ADB, 1994, Lal Perera National Income Estimates 1991 and 1992, Census of Population and Housing 1988, EPPSO, RMI
Table 7.2 LIVESTOCK, 1991 to 1999
Pig Poultry Total value Value Value Year (thousands) Number (thousands) Number (thousands)
1999 4,305 14,778 4,144 89,563 161 1998 4,368 13,159 4,205 58,805 163 1997 4,158 13,341 3,962 56,728 196 1996 4,094 13,216 3,899 57,814 195 1995 3,913 12,222 3,721 57,385 192 1994 3,588 11,794 3,420 55,391 168 1993 3,591 11,877 3,437 53,465 154 1992 3,294 11,420 3,152 51,608 142 1991 3,020 11,024 2,894 48,232 126
Note: Data for 2000 and 2001 not available Source: EPPSO

2001 RMI Statistical Abstract
63
Table 7.3 COPRA PRODUCTION (SHORT TONS) BY ATOLL/ISLAND, 1978 and 1992 to 2001
Atoll/Island 1978 1992 1993 1994 1995 1996 1997 1998 1999 2000 2001
Total 5,877 5,861 4,627 4,972 7,201 6,464 6,031 4,273 3,348 4,273 5,256 Ailinglaplap 606 834 660 713 1,121 696 721 543 404 516 864 Ailuk 137 166 145 40 108 146 131 58 155 65 86 Arno 888 1,021 790 827 1,320 906 876 811 736 819 671 Aur 223 185 235 201 251 278 278 31 202 198 267 Ebon 485 421 264 371 523 417 423 308 178 382 438 Enewetak 15 19 - - - - - - - - - Jabat 4 54 24 56 59 38 56 38 - 45 21 Jaluit 496 346 202 420 613 558 442 316 48 293 274 Kili 47 - - 1 5 - - - - - - Kwajalein 15 13 9 14 15 31 33 5 5 - 9 Lae 86 30 42 46 67 57 54 32 6 22 86 Lib 47 44 27 40 61 52 52 30 15 36 81 Likiep 141 65 96 48 86 80 66 36 55 44 72 Majuro 369 302 202 151 211 177 169 127 60 98 70 Maloelap 276 312 426 426 429 527 445 390 264 260 325 Mejit 169 217 84 387 186 149 136 139 108 157 Mili 626 533 425 610 685 753 781 444 390 424 600 Namorik 345 342 222 330 223 430 422 282 116 294 370 Namu 332 235 205 258 422 309 307 187 59 282 345 Rongelap 47 - - - - - - - - - - Ujae 90 49 20 32 39 77 75 27 5 24 28 Ujelang - - - - - - - - - - 9 Utirik 100 107 106 76 86 156 131 70 75 45 76 Wotho 15 164 12 0 53 15 14 11 21 10 32 Wotje 318 402 433 314 438 577 407 391 415 308 375
Note: Except for 2001, copra produced in Ujelang Atoll was added to production in Enewetak Atoll. In 1989, 1,187 short tons of copra were imported from Kiribati and processed at Tobolar. Source: Tobolar Processing Plant
Table 7.4 INDEX OF COPRA PRODUCTION (1978=100) BY ATOLL/ISLAND, 1978 and 1992 to 2001
Atoll/Island 1978 1992 1993 1994 1995 1996 1997 1998 1999 2000 2001
Total 100 100 79 85 123 110 103 73 57 73 89 Ailinglaplap 100 138 109 118 185 115 119 90 67 85 143 Ailuk 100 121 105 29 79 106 95 42 113 47 63 Arno 100 115 89 93 149 102 99 91 83 92 76 Aur 100 83 105 90 113 124 124 14 91 89 120 Ebon 100 87 54 76 108 86 87 64 37 79 90 Enewetak 100 126 - - - - - - - - - Jabat 100 1,345 590 1,395 1,480 953 1,389 950 - 1,125 529 Jaluit 100 70 41 85 124 113 89 64 10 59 55 Kili 100 - - 3 11 - - - - - - Kwajalein 100 85 59 91 99 204 222 33 33 - 60 Lae 100 35 49 53 78 66 63 37 7 26 100 Lib 100 94 57 84 130 112 111 64 32 77 172 Likiep 100 46 68 34 61 57 47 26 39 31 51 Majuro 100 82 55 41 57 48 46 34 16 27 19 Maloelap 100 113 154 154 155 191 161 141 96 94 118 Mejit 100 128 50 0 229 110 88 80 82 64 93 Mili 100 85 68 97 109 120 125 71 62 68 96 Namorik 100 99 64 96 65 125 122 82 34 85 107 Namu 100 71 62 78 127 93 92 56 18 85 104 Rongelap 100 - - - - - - - - - - Ujae 100 54 22 36 44 85 83 30 6 27 31 Ujelang 100 - - - - - - - - - - Utirik 100 107 106 76 86 156 131 70 75 45 76 Wotho 100 1,095 77 0 351 100 91 73 140 67 212 Wotje 100 126 136 99 138 181 128 123 131 97 118
Notes: Jemo has been excluded as its production was nil in 1978 and hence no index figures can be calculated The people of Ronglap moved to Mejjato in Kwajalein Atoll in May 1985.

2001 RMI Statistical Abstract
64
Table 7.5 COPRA PRICES PAID TO OUTER ISLANDS(Selected months), 1978 to 2001
Price perYear Selected month short ton ($)
2001 Feburary 1502000 September 2401999 December 3001998 (not stated) 1981997 July 2201996 March 3201995 December 3901994 November 3901993 July 4301992 December 5001991 March 180
October 140December 220
1990 July 200September 140March 180October 140
1989 December 2201988 December 2201987 January 160
September 200December 220
1986 December 1201985 May 260
June 200September 180December 120
1984 February 250July 290
1983 May 100July (15) 140July (27) 180September 220
1982 June 150September 130
1981 January 190November 170
1980 January 375 April 340May 210November 150
1979 January 310February 370April 400September 470October 400November 387
1978 February 134May 159June 174September 190October 205November 220December 270
Note: the prices in Majuro for 1988 to 1992 were $30 higherSource: Tobolar Processing Plant and EPPSO
Table 7.6 COPRA PRODUCTION, AVG PRODUCER PRICE AND TOTAL PRODUCER INCOME: 1951 to 2001
Copra Average Estimated total production producer price producer income
Year (short tons) per ton ($) ('000)
2001 5,063 187 9472000 4,273 277 1,1841999 3,348 246 8241998 4,273 180 7691997 6,031 357 2,1531996 6,464 420 2,7151995 7,201 433 3,1181994 4,972 423 2,1031993 4,627 470 2,1751992 5,861 449 2,6321991 4,213 155 6531990 5,159 187 9651989 5,805 220 1,2771988 5,475 220 1,2051987 5,405 200 1,0811986 6,815 120 8181985 4,301 208 8951984 4,483 316 1,4171983 6,491 174 1,1291982 5,773 136 7851981 5,760 171 9851980 6,257 223 1,3951979 6,488 416 2,6991978 5,877 182 1,0701977 6,075 - -1976 5,685 160 9101975 6,482 270 1,7501974 6,336 356 2,2561973 4,574 110 5031972 5,715 122 6971971 5,344 154 8231970 7,348 170 1,2491969 6,401 156 9991968 6,311 194 1,2241967 6,272 132 8281966 5,554 182 1,0111965 5,807 184 1,0681964 5,742 166 9531963 4,975 154 7661962 4,521 142 6421961 6,060 126 7641960 4,436 148 6571959 3,700 102 3771958 5,701 106 6041957 6,034 108 6521956 5,480 102 5591955 4,434 128 5681954 3,896 102 3971953 4,580 78 3571952 4,565 94 4291951 4,980 84 418
Note: The average price in this table is different from the average price in table 7.5,in that the average price in this table is for the whole country whereas the averageprice in table 7.5 is for outer islands only.Source: Tobolar Processing Plant
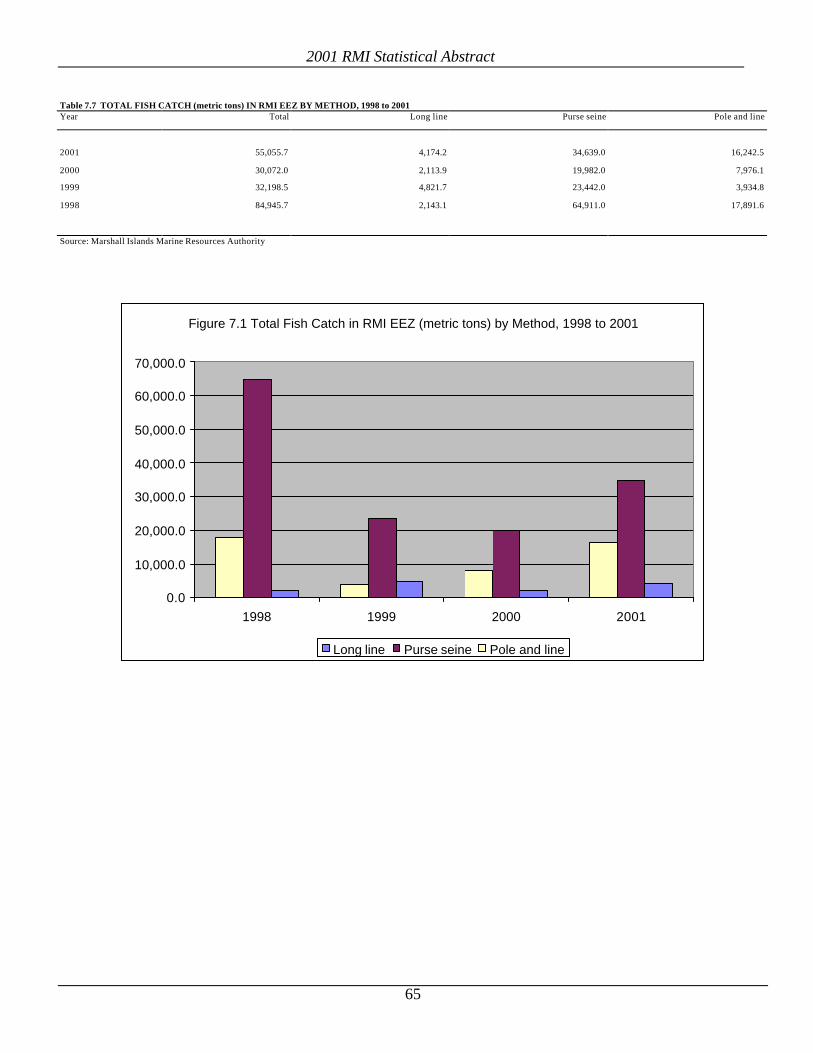
2001 RMI Statistical Abstract
65
Table 7.7 TOTAL FISH CATCH (metric tons) IN RMI EEZ BY METHOD, 1998 to 2001 Year Total Long line Purse seine Pole and line
2001 55,055.7 4,174.2 34,639.0 16,242.5
2000 30,072.0 2,113.9 19,982.0 7,976.1
1999 32,198.5 4,821.7 23,442.0 3,934.8
1998 84,945.7 2,143.1 64,911.0 17,891.6
Source: Marshall Islands Marine Resources Authority
Figure 7.1 Total Fish Catch in RMI EEZ (metric tons) by Method, 1998 to 2001
0.0
10,000.0
20,000.0
30,000.0
40,000.0
50,000.0
60,000.0
70,000.0
2001200019991998
Long line Purse seine Pole and line

2001 RMI Statistical Abstract
66
(this page left blank intentionally)

2001 RMI Statistical Abstract
67
CHAPTER 8: OVERSEAS TRADE This section presents data on imports and exports. Imports data are presented by commodity classification and by trading partners. The RMI adopted the Harmonized System (HS) of classification for goods imported and exported from the beginning of fiscal year 1990 (October 1, 1990). The Standard International Trade Classification (SITC) was used previously, but in this edition no data has been presented on the basis of this system. Data on imports and exports were obtained from the Customs and Revenue Division of the Ministry of Finance. Starting with imports data from the last quarter of 1989, imports data have been processed with PC/TRADE software, developed by Statistics New Zealand. Until recently, the data did not cover tax-exempted goods. Government was not paying any import duties and so the quantity and amount of government imports did not appear in the data. A commodity taxed on the basis of quantity values was not recorded, and a duty based on quantity values was sometimes missing. However, steps were taken to minimize these errors from 1990 and onwards. The value of total imports up until and including 1988 were given on f.o.b basis. Starting from 1989, imports values are given on c.i.f basis. Data for 2001 were not available at the time of publication.
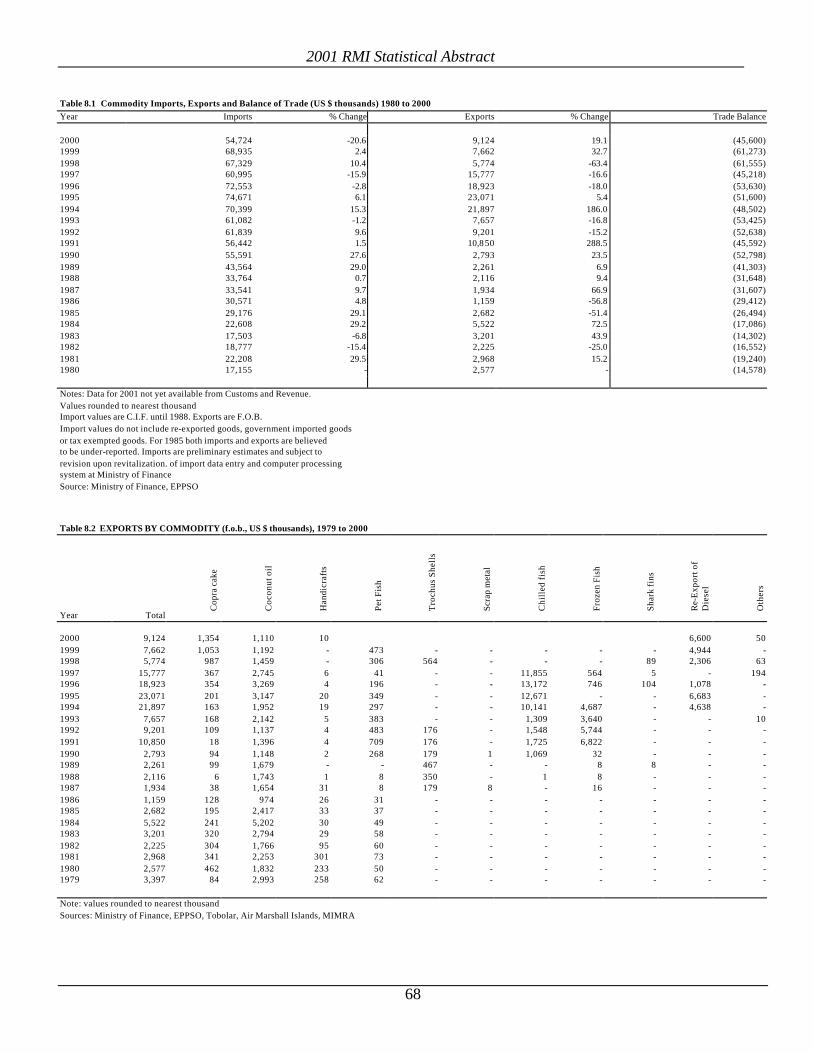
2001 RMI Statistical Abstract
68
Table 8.1 Commodity Imports, Exports and Balance of Trade (US $ thousands) 1980 to 2000 Year Imports % Change Exports % Change Trade Balance 2000 54,724 -20.6 9,124 19.1 (45,600) 1999 68,935 2.4 7,662 32.7 (61,273) 1998 67,329 10.4 5,774 -63.4 (61,555) 1997 60,995 -15.9 15,777 -16.6 (45,218) 1996 72,553 -2.8 18,923 -18.0 (53,630) 1995 74,671 6.1 23,071 5.4 (51,600) 1994 70,399 15.3 21,897 186.0 (48,502) 1993 61,082 -1.2 7,657 -16.8 (53,425) 1992 61,839 9.6 9,201 -15.2 (52,638) 1991 56,442 1.5 10,850 288.5 (45,592) 1990 55,591 27.6 2,793 23.5 (52,798) 1989 43,564 29.0 2,261 6.9 (41,303) 1988 33,764 0.7 2,116 9.4 (31,648) 1987 33,541 9.7 1,934 66.9 (31,607) 1986 30,571 4.8 1,159 -56.8 (29,412) 1985 29,176 29.1 2,682 -51.4 (26,494) 1984 22,608 29.2 5,522 72.5 (17,086) 1983 17,503 -6.8 3,201 43.9 (14,302) 1982 18,777 -15.4 2,225 -25.0 (16,552) 1981 22,208 29.5 2,968 15.2 (19,240) 1980 17,155 - 2,577 - (14,578) Notes: Data for 2001 not yet available from Customs and Revenue. Values rounded to nearest thousand Import values are C.I.F. until 1988. Exports are F.O.B. Import values do not include re-exported goods, government imported goods or tax exempted goods. For 1985 both imports and exports are believed to be under-reported. Imports are preliminary estimates and subject to revision upon revitalization. of import data entry and computer processing system at Ministry of Finance Source: Ministry of Finance, EPPSO
Table 8.2 EXPORTS BY COMMODITY (f.o.b., US $ thousands), 1979 to 2000
Year Total
Cop
ra c
ake
Coc
onut
oil
Han
dicr
afts
Pet F
ish
Tro
chus
She
lls
Scra
p m
etal
Chi
lled
fish
Froz
en F
ish
Shar
k fi
ns
Re-
Exp
ort o
f D
iese
l
Oth
ers
2000 9,124 1,354 1,110 10 6,600 50 1999 7,662 1,053 1,192 - 473 - - - - - 4,944 - 1998 5,774 987 1,459 - 306 564 - - - 89 2,306 63 1997 15,777 367 2,745 6 41 - - 11,855 564 5 - 194 1996 18,923 354 3,269 4 196 - - 13,172 746 104 1,078 - 1995 23,071 201 3,147 20 349 - - 12,671 - - 6,683 - 1994 21,897 163 1,952 19 297 - - 10,141 4,687 - 4,638 - 1993 7,657 168 2,142 5 383 - - 1,309 3,640 - - 10 1992 9,201 109 1,137 4 483 176 - 1,548 5,744 - - - 1991 10,850 18 1,396 4 709 176 - 1,725 6,822 - - - 1990 2,793 94 1,148 2 268 179 1 1,069 32 - - - 1989 2,261 99 1,679 - - 467 - - 8 8 - - 1988 2,116 6 1,743 1 8 350 - 1 8 - - - 1987 1,934 38 1,654 31 8 179 8 - 16 - - - 1986 1,159 128 974 26 31 - - - - - - - 1985 2,682 195 2,417 33 37 - - - - - - - 1984 5,522 241 5,202 30 49 - - - - - - - 1983 3,201 320 2,794 29 58 - - - - - - - 1982 2,225 304 1,766 95 60 - - - - - - - 1981 2,968 341 2,253 301 73 - - - - - - - 1980 2,577 462 1,832 233 50 - - - - - - - 1979 3,397 84 2,993 258 62 - - - - - - -
Note: values rounded to nearest thousand Sources: Ministry of Finance, EPPSO, Tobolar, Air Marshall Islands, MIMRA

2001 RMI Statistical Abstract
69
Table 8.3 IMPORTS BY TRADING PARTNER (US $ thousands), 1985 to 2000
Hong New Philip- Singa- Mainland Year Values Total Australia Fiji Guam Hawaii Kong Japan Zealand pines pore Taiwan USA Others 2000 c.i.f. 54,724 5,463 372 2,286 2,382 3,213 5,072 235 1,034 214 668 31,051 2,734 1999 c.i.f. 68,935 1,379 483 3,447 b/ 1,310 3,309 827 414 17,234 965 37,914 1,653 1998 c.i.f. 67,329 1,885 337 6,733 b/ 1,145 2,828 673 269 14,813 741 36,023 1,882 1997 c.i.f. 60,995 1,836 309 2,290 b/ 1,054 2,412 563 303 14,257 926 35,276 1,769 1996 c.i.f. 72,553 1,364 430 1,601 b/ 1,306 2,944 759 240 22,605 1,301 38,758 1,245 1995 c.i.f. 74,671 1,410 612 10,933 b/ 1,259 5,571 1,066 403 - 622 38,363 14,432 1994 c.i.f. 70,399 1,332 447 16,999 b/ 1,466 4,169 511 269 - 767 42,924 1,515 1993 c.i.f. 61,082 1,058 198 6,692 b/ 664 5,906 709 127 - 269 42,443 3,016 1992 c.i.f. 61,839 2,106 115 11,506 b/ 836 7,652 1,328 154 - 233 37,657 252 1991 c.i.f. 56,442 895 821 9,216 5,024 482 5,446 247 241 - 98 33,008 964 1990 c.i.f. 55,591 1,148 1,133 4,939 9,360 1,573 8,335 761 115 - 261 27,314 652 1989 c.i.f. 43,564 a/ 452 2,588 3,932 700 6,488 736 40 - 196 28,332 100 1988 f.o.b. 33,764 1,052 - 6,065 2,107 522 5,929 31 168 - 388 17,330 172 1987 f.o.b. 33,541 2,080 - 7,379 1,610 436 6,641 268 34 - 201 14,724 168 1986 f.o.b. 30,571 1,579 - 8,098 1,386 382 5,945 204 23 - 180 12,684 90 1985 f.o.b. 29,176 1,370 - 6,337 1,253 311 6,097 163 41 - 108 13,352 144 Note: values rounded to nearest thousand. a/ included under other countries b/ included under U.S.A. Data given for 1989 were estimated using data for the last quarter of that year 1995 Ebeye Postal imports estimate was included under USA (Mainland) 1996 Ebeye import figures estimate was included under USA (Mainland) 1997July and December import figures estimate was included under USA, Fiji, Singapore and all others. Source: Ministry of Finance, EPPSO
Table 8.4 IMPORTS TO MAJURO BY PRODUCT CATEGORY (US $ thousands), 1992 to 2000 SITC Classification 1992 1993 1994 1995 1996 1997 1998 1999 2000 Total 61,839 61,082 70,399 74,671 72,553 60,995 67,329 68,935 54,7240. Food and Live Animals 15,132 17,757 19,861 18,056 6,240 18,935 5,382 5,697 4,9841. Beverages and Tobacco 3,347 4,129 4,038 3,133 5,752 1,564 7,404 7,512 5,9622. Mineral Fuels and Lubricants 8,524 8,528 15,323 22,520 28,344 12,113 23,815 25,680 20,3843. Crude Materials 4,014 5,160 5,036 5,119 7,873 2,293 3,076 3,253 2,5814. Animal and Vegetables oils 101 167 266 331 3,535 3,407 2,875 3,012 2,3905. Chemical Products 1,938 2,701 2,356 1,915 106 411 119 124 976. Manufactured Goods 7,500 5,265 5,953 4,873 3,033 3,968 3,692 3,676 2,9177. Machinery and Transport Equipment 11,153 10,495 8,716 9,599 1,442 7,679 1,749 1,738 1,3798. Miscellaneous Manufactured Articles 976 1,379 1,882 1,724 7,770 1,768 10,133 10,381 8,2399. Unclassified commodities 9,154 5,501 6,968 7,401 8,458 8,857 9,084 7,862 5,791 Note: 1995 E beye postal imports estimate was distributed among comodities usually imported through postal services. 1996 Ebeye imports estimate was distributed among comodities usually imported through. 1997 Import figures for July and December were mostly distributed under SITC 0. Sources: Custom Division, Ministry of Finance .

2001 RMI Statistical Abstract
70
Table 8.5 IMPORTS CLASSIFIED BY TWO-DIGIT HARMONIZED SYSTEM CODES (US $ c.i.f.), 1997 to 2000 Code Description 1997 1998 1999 2000 Total 60,996,913 67,331,052 68,937,065 54,726,355 01 ANIMALS; LIVE 2,238 02 MEAT AND EDIBLE MEAT OFFAL 3,069,983 3,309,793 3,516,811 3,554,090 03 FISH AND CRUSTACEANS, MOLLUSCS AND OTHER AQUATIC INVERTEBRATES 169,906 445,371 500,190 397,101 04 DAIRY PRODUCE; BIRDS' EGGS; NATURAL HONEY; EDIBLE PRODUCTS OF ANIMAL ORIGIN, NOT 730,438 804,768 793,410 629,888 ELSEWHERE SPECIFIED OR INCLUDED 05 ANIMAL ORIGINATED PRODUCTS; NOT ELSEWHERE SPECIFIED OR INCLUDED 06 TREES AND OTHER PLANTS, LIVE; BULBS, ROOTS AND THE LIKE; CUT FLOWERS AND ORNAMENTAL 3,112 6,409 6,790 5,391 FOLIAGE 07 VEGETABLES AND CERTAIN ROOTS AND TUBERS; EDIBLE 386,462 309,056 330,972 262,758 08 FRUIT AND NUTS, EDIBLE; PEEL OF CITRUS FRUIT OR MELONS 230,117 159,802 171,298 135,993 09 COFFEE, TEA, MATE AND SPICES 296,222 347,310 377,704 299,859 10 CEREALS 1,590,750 1,690,074 1,777,198 1,794,970 11 PRODUCTS OF THE MILLING INDUSTRY; MALT; STARCHES; INULIN; WHEAT GLUTEN 609,114 705,333 738,355 586,180 12 OIL SEEDS AND OLEAGINOUS FRUITS; MISCELLANEOUS GRAINS, SEEDS A ND FRUIT, INDUSTRIAL OR 1,160 1,360 1,079 MEDICINAL PLANTS; STRAW AND FODDER 13 LAC; GUMS, RESINS AND OTHER VEGETABLE SAPS AND EXTRACTS 491 13,508 15,830 12,567 15 ANIMAL OR VEGETABLE FATS AND OILS AND THEIR CLEAVAGE PRODUCTS; PREPARED ANIMAL
FATS; 410,369 234,444 274,645 218,041
ANIMAL OR VEGETABLE WAXES 16,165 2,471 1,962 16 MEAT, FISH OR CRUSTACEANS, MOLLUSCS OR OTHER AQUATIC INVERTEBRATES; PREPARATIONS 1,683,818 1,785,696 1,834,587 1,456,479 THEREOF 17 SUGARS AND SUGAR CONFECTIONERY 870,485 1,171,831 1,219,639 1,232,323 18 COCOA AND COCOA PREPARATIONS 37,035 72,368 68,935 54,727 19 PREPARATIONS OF CEREALS, FLOUR, STARCH OR MILK; PASTRYCOOKS' PRODUCTS 1,225,658 1,713,662 1,578,896 1,253,486 20 PREPARATIONS OF VEGETABLES, FRUIT, NUTS OR OTHER PARTS OF PLANTS 826,738 716,498 778,801 618,290 21 MISCELLANEOUS EDIBLE PREPARATIONS 7,133,059 4,670,207 4,806,542 3,815,914 22 BEVERAGES, SPIRITS AND VINEGAR 1,317,769 2,083,323 2,081,312 1,652,353 23 RESIDUES AND WASTE FROM THE FOOD INDUSTRIES; PREPARED ANIMAL FODDER 69,660 77,969 78,867 62,612 24 TOBACCO AND MANUFACTURED TOBACCO SUBSTITUTES 246,646 1,076,245 1,102,089 874,948 25 SALT; SULPHUR; EARTHS, STONE; PLASTERING MATERIALS, LIME AND CEMENT 314,843 656,072 685,361 544,108 26 ORES SLAG AND ASH 27 MINERAL FUELS, MINERAL OILS AND PRODUCTS OF THEIR DISTILLATION; BITUMINOUS
SUBSTANCES; 12,113,455 14,509,678 16,119,958 16,261,3 48
MINERAL WAXES 28 INORGANIC CHEMICALS; ORGANIC AND INORGANIC COMPOUNDS OF PRECIOUS METALS; OF RARE 440 10,352 11,973 9,505 EARTHMETALS, OF RADIO-ACTIVE ELEMENTS AND OF ISOTOPES 29 ORGANIC CHEMICALS 22,781 14,813 15,206 12,072 30 PHARMACEUTICAL PRODUCTS 530,135 635,968 705,800 560,335 31 FERTILIZERS 279 327 260 32 TANNING OR DYEING EXTRACTS; TANNINS AND THEIR DERIVATIVES; DYES, PIGMENTS AND OTHER 131,889 223,661 241,926 192,065 COLOURING MATTER; PAINTS, VARNISHES; PUTTY, OTHER MASTICS; INKS 33 ESSENTIAL OILS AND RESINOIDS; PERFUMERY, COSMETIC OR TOILET PREPARATIONS 142,411 190,759 195,859 155,493 34 SOAP, ORGANIC SURFACE -ACTIVE AGENTS; WASHING, LUBRICATING, POLISHING, SCOURING 684,476 703,909 743,774 590,482 PREPARATIONS; ARTIFICIAL, PREPARED WAXES; CANDLES ETC., MODELLING PASTES, DENTAL WAXES, PREPARATIONS WITH A BASIS OF PLASTER 35 ALBUMINOIDAL SUBSTANCES; MODIFIED STARCH ES; GLUES; ENZYMES 38,609 23,920 25,591 20,317 36 EXPLOSIVES; PYROTECHNIC PRODUCTS; MATCHES; PYROPHORIC ALLOYS; CERTAIN COMBUSTIBLE 16,990 25,941 26,273 20,858 PREPARATIONS 37 PHOTOGRAPHIC OR CINEMATOGRAPHIC GOODS 5,543 35,480 34,787 27,618 38 CHEMICAL PRODUCTS N.E.S. 333,315 366,369 343,715 272,875 39 PLASTICS AND ARTICLES THEREOF 1,500,012 869,368 935,247 742,492 40 RUBBER AND ARTICLES THEREOF 235,394 251,998 269,935 214,301 41 RAW HIDE AND SKINS (OTHER THAN FURSKINS) AND LEATHER 42 ARTICLES OF LEATHER; SADDLERY AND HARNESS; TRAVEL GOODS, HANDBAGS AND SIMILAR 32,283 48,374 52,274 41,500 CONTAINERS; ARTICLES OF ANIMAL GUT (OTHER THAN SILK-WORM GUT) 43 FURSKINS AND ARTIFICIAL FUR; MANUFACTURES THEREOF 125 2,069 1,489 1,182 44 WOOD AND ARTICLES OF WOOD; WOOD CHARCOAL 837,654 1,312,559 1,293,037 1,026,542 45 CORK AND ARTICLES OF CORK 83,949 66,647 46 MANUFACTURES OF STRAW, ESPARTO OR OTHER PLAITING MATERIALS; BASKETWARE AND
WICKERWORK
47 PULP OF WOOD OR OF OTHER FIBROUS CELLULOSIC MATERIAL; WASTE SCRAP OF PAPER OR PAPERBOARD;
PAPER AND PAPERBOARD ARTICLES THEREOF 48 PAPER AND PAPERBOARD; ARTICLES OF PAPER PULP, OF PAPER OR PAPERBOARD 671,172 959,983 996,035 790,752 49 PRINTED BOOKS, NEWSPAPERS, PICTURES AND OTHER PRODUCTS OF THE PRINTING INDUSTRY; 99,968 300,244 315,430 250,420 MANUSCRIPTS, TYPESCRIPTS AND PLANS 50 SILK (continued next page)

2001 RMI Statistical Abstract
71
Table 8.5 IMPORTS CLASSIFIED BY TWO-DIGIT HARMONIZED SYSTEM CODES (US $ c.i.f.), 1997 to 2000 (CONTINUED) Code Description 1997 1998 1999 2000 51 WOOL, FINE OR COARSE ANIMAL HAIR; HORSEHAIR YARN AND WOVEN FABRIC 15,215 4,903 5,642 4,479 52 COTTON 9,988 33,720 38,192 30,321 53 VEGETABLE TEXTILE FIBRES; PAPER Y ARN AND WOVEN FABRICS OF PAPER YARN 8,337 4,665 3,703 54 MAN-MADE FILAMENTS 55 MAN-MADE STAPLE FIBRES 56 WADDING, FELT AND NONWOVENS, SPECIAL YARNS; TWINE, CORDAGE, ROPES AND CABL ES AND 8,696 12,285 11,380 9,035 ARTICLES THEREOF 57 CARPETS AND OTHER TEXTILE FLOOR COVERINGS 14,743 34,162 37,105 29,457 58 FABRICS; SPECIAL WOVEN FABRICS, TUFTED TEXTILE FABRICS, LACE, TAPESTRIES, TRIMMINGS, 44,126 16,298 17,345 13,770 EMBROIDERY 59 TEXTILE FABRICS; IMPREGNATED, COATED, COVERED OR LAMINATED; TEXTILE ARTICLES OF A
KIND 8,877 8,959 9,758 7,747
SUITABLE FOR INDUSTRIAL USE 60 FABRICS; KNITTED OR CROCHETED 9,784 2,247 2,633 2,090 61 APPAREL AND CLOTHING ACCESSORIES; KNITTED OR CROCHETED 21,421 15,716 15,714 12,476 62 APPAREL AND CLOTHING ACCESSORIES; NOT KNITTED OR CROCHETED 180,896 107,889 110,552 87,767 63 TEXTILES, MADE UP ARTICLES; SETS; WORN CLOTHING AND WORN TEXTILE ARTICLES; RAGS 2,020,120 2,698,761 2,659,996 2,111,771 64 FOOTWEAR; GAITERS AND THE LIKE; PARTS OF SUCH ARTICLES 521,434 748,306 770,407 611,626 65 HEADGEAR AND PARTS THEREOF 4,899 7,131 8,018 6,365 66 UMBRELLAS, SUN UMBRELLAS, WALKING-STICKS, SEAT STICKS, WHIPS, RIDING CROPS; AND PARTS 4,336 4,732 3,337 2,649 THEREOF 67 FEATHERS AND DOWN, PREPARED; AND ARTICLES MADE OF FEATHER OR OF DOWN; ARTIFICIAL 4,322 6,548 6,638 5,270 FLOWERS; ARTICLES OF HUMAN HAIR 68 STONE, PLASTER, CEMENT, ASBESTOS, MICA OR SIMILAR MATERIALS; ARTICLES THEREOF 69 CERAMIC PRODUCTS 48,660 100,623 98,958 78,563 70 GLASS AND GLASSWARE 52,279 101,161 102,620 81,470 71 NATURAL OR CULTURED PEARLS, PRECIOUS, SEMI-PRECIOUS STONES, PRECIOUS METALS, METALS 1,617 14,097 9,826 7,801 CLAD WITH PRECIOUS METAL, ARTICLES THEREOF; IMITATION JEWELLERY; COIN 72 IRON AND STEEL 13,929 51,711 48,072 38,164 73 IRON OR STEEL ARTICLES 679,937 1,088,774 1,078,575 856,281 74 COPPER AND ARTICLES THEREOF 48,905 123,317 120,802 95,905 76 ALUMINIUM AND ARTICLES THEREOF 126,036 357,943 368,693 292,705 78 LEAD AND ARTICLES THEREOF 746 120 132 105 79 ZINC AND ARTICLES THEREOF 1,380 8,032 9,413 7,473 80 TIN; ARTICLES THEREOF 27,084 53,022 60,726 48,211 81 METAL; N.E.S. CERMETS AND ARTICLES THEREOF 3,763 4,410 3,501 82 TOOLS, IMPLEMENTS, CUTLERY, SPOONS AND FORKS, OF BASE METAL; PARTS THEREOF, OF BASE 199,953 292,740 305,063 242,190 METAL 83 METAL; MISCELLANEOUS PRODUCTS OF BASE METAL 34,272 132,730 130,800 103,842 84 NUCLEAR REACTORS, BOILERS, MACHINERY AND MECHANICAL APPLIANCES; PARTS THEREOF 2,356,649 3,225,676 3,352,428 2,661,493 85 ELECTRICAL MACHINERY AND EQUIPMENT AND PARTS THEREOF; SOUND RECORDERS AND
REPRODUCERS, 864,679 1,804,602 1,708,793 1,356,611
TELEVISION IMAGE AND SOUND RECORDERS AND REPRODUCERS PARTS AND ACCESSORIES OF SUCH ARTICLES 86 RAILWAY, TRAWAY LOCAMOTIVES, ROLLING STOCK, PARTS THEREOF: RAILWAY, TRAMWAY, TRACK FIXTURES AND FITTINGS AND PARTS; MECHANICAL (AND ELECTRO -MECHANICAL) TRAFFIC SIGNALLING EQUIPMENT OF ALL KIND 87 VEHICLES; OTHER THAN RAILWAY OR TRAMWAY ROLLING STOCK, AND PARTS AND ACCESSORIES 4,389,208 3,757,273 3,902,086 3,097,866 THEREOF 88 AIRCRAFT, SPACECRAFT AND PARTS THEREOF 4,382 470,538 484,360 384,533 89 SHIPS, BOATS AND FLOATING STRUCTURES 29,651 392,336 431,910 342,893 90 OPTICAL, PHOTOGRAPHIC, CINEMATOGRAPHIC, MEASURING, CHECKING, MEDICAL OR SURGICAL 81,249 83,868 83,751 66,490 INSTRUMENTS AND APPARATUS; PARTS AND ACESSORIES 91 CLOCKS AND WATCHES AND PARTS THEREOF 262,215 102,721 97,776 77,625 92 MUSICAL INSTRUMENTS; PARTS AND ACCESSORIES OF SUCH ARTICLES 7,758 16,357 15,186 12,056 93 ARMS AND AMMUNITION; PARTS AND ACCESSORIES THEREOF 1,069 1,222 970 94 FURNITURE; BEDDING, MATTRESSES, MATTRESS SUPPORTS, CUSHIONS ETC. STUFFED FURNISHINGS; 639,240 586,257 619,375 491,722 LAMPS AND LIGHTING FITTINGS N.E.S.; ILLUMINATED SIGNS, ILLUMINATED NAMEPLATES AND THE LIKE; PREFABRICATED BUILDINGS 95 TOYS, GAMES AND SPORTS REQUISITES; PARTS AND ACCESSORIES THEREOF 395,247 984,319 678,368 538,557 96 MISCELLANEOUS MANUFACTURED ARTICLES 382,084 202,342 206,314 163,793 97 WORKS OF ART; COLLECTORS' PIECES AND ANTIQUES 98 MISCELLANEOUS HEADING NOT ELSEWHERE SPECIFIED IN THE TARIFF 8,857,334 7,110,881 6,159,377 12,826 Source: Ministry of Finance, EPPSO

2001 RMI Statistical Abstract
72
(this page left blank intentionally)

2001 RMI Statistical Abstract
73
CHAPTER 9: VISITOR STATISTICS This section presents data on travelers and visitors to Majuro Atoll, capital of the RMI. The collection of data on travelers to the RMI was facilitated by the implementation of the Arrival Card System by the Immigration Division of the Ministry of Foreign Affairs in 1989. Data entry and analysis of these data were carried out by MIVA. Visitor: A person visiting a country other than in which he/she has his/her usual place of residence for any reason other than following an occupation remunerated from within the country visited. Tourist: A visitor staying in the country visited for at least one night and not more than one year. Data on non-military visitors to Kwajalein Atoll as well as sea-based visitors to the RMI (private yachts and cruise ships) are not yet recorded by the Immigration Division and are therefore not available here.

2001 RMI Statistical Abstract
74
Table 9.1 VISITORS (by air only) AND OTHER TRAVELERS TO MAJURO, 1969 to 2001 Year Total Visitors Other travelers 2001 5,399 5,399 na 2000 5,246 5,246 na 1999 4,622 4,622 na 1998 6,374 6,374 na 1997 7,418 6,254 1,064 1996 7,563 6,116 1,334 1995 6,760 5,426 1,334 1994 6,330 4,876 1,454 1993 6,731 5,024 1,707 1992 7,176 5,648 1,528 1991 6,843 5,872 971 1990 4,856 na na 1989 3,691 3,183 508 1988 3,578 3,165 413 1987 3,131 2,441 690 1986 3,290 2,845 445 1985 2,914 2,494 420 1984 3,913 3,144 769 1983 3,630 2,950 680 1982 2,258 na na 1981 1,242 na na 1980 na na na 1979 2,833 na na 1978 3,801 na na 1976 2,919 na na 1975 3,347 na na 1974 2,705 na na 1973 3,153 na na 1972 1,359 na na 1971 1,862 na na 1970 1,246 na na 1969 905 na na
Source: Marshall Islands Visitors Authority
Table 9.2 VISITORS TO MAJURO (by air only) BY MONTH AND MAIN PURPOSE OF VISIT, 2001
Visiting friends/ Not Total Transit/Stopover Business Holiday/vacation relatives Other Stated
Month Number Percent Number Percent Number Percent Number Percent Number Percent Number Percent Number
Total 5,399 100.0 672 100.0 1,883 100.0 1,475 100.0 652 100.0 369 100.0 348 January 358 6.6 44 6.5 130 6.9 63 4.3 50 7.7 44 11.9 27 February 296 5.5 23 3.4 116 6.2 73 4.9 45 6.9 27 7.3 12 March 525 9.7 85 12.6 184 9.8 120 8.1 58 8.9 38 10.3 40 April 433 8.0 51 7.6 178 9.5 82 5.6 57 8.7 35 9.5 30 May 387 7.2 57 8.5 179 9.5 86 5.8 45 6.9 15 4.1 5 June 508 9.4 55 8.2 154 8.2 139 9.4 90 13.8 38 10.3 32 July 596 11.0 66 9.8 171 9.1 194 13.2 59 9.0 48 13.0 58 August 655 12.1 92 13.7 167 8.9 256 17.4 77 11.8 29 7.9 34 September 568 10.5 43 6.4 167 8.9 247 16.7 49 7.5 30 8.1 32 October 460 8.5 44 6.5 224 11.9 86 5.8 33 5.1 23 6.2 50 November 348 6.4 67 10.0 130 6.9 74 5.0 37 5.7 22 6.0 18 December 265 4.9 45 6.7 83 4.4 55 3.7 52 8.0 20 5.4 10
Source: Marshall Islands Visitors Authority
Figure 9.1 Visitors to Majuro by Month, 2001
0
100
200
300
400
500
600
700
Janua
ry
Febru
aryMarc
hAp
rilMay
June Ju
ly
Augus
t
Septe
mber
Octobe
r
Novem
ber
Decem
ber

2001 RMI Statistical Abstract
75
Table 9.3 VISITORS TO MAJURO (by air only) BY COUNTRY OF USUAL RESIDENCE AND MAIN PURPOSE OF VISIT, 2001
Visiting friends/ Not Total Transit/Stopover Business Holiday/vacation relatives Other Stated
Country Number Percent Number Percent Number Percent Number Percent Number Percent Number Percent Number
Total 5,399 100.0 672 100.0 1,883 100.0 1,475 100.0 652 100.0 369 100.0 348 Canada 42 0.8 6 0.9 10 0.5 20 1.4 2 0.3 4 1.1 USA 1,922 35.6 185 27.5 867 46.0 413 28.0 222 34.0 174 47.2 61 Other America 6 0.1 1 0.1 3 0.2 0.0 0.0 1 0.3 1 Australia 134 2.5 7 1.0 92 4.9 9 0.6 10 1.5 15 4.1 1 Fiji 147 2.7 15 2.2 96 5.1 7 0.5 10 1.5 13 3.5 6 FSM 239 4.4 15 2.2 95 5.0 20 1.4 75 11.5 19 5.1 15 Kiribati 275 5.1 199 29.6 17 0.9 7 0.5 38 5.8 7 1.9 7 Nauru 70 1.3 9 1.3 0.0 34 2.3 25 3.8 1 0.3 1 New Zealand 88 1.6 3 0.4 65 3.5 8 0.5 7 1.1 5 1.4 Palau 35 0.6 3 0.4 21 1.1 3 0.2 4 0.6 2 0.5 2 Tuvalu 12 0.2 1 0.1 4 0.2 0.0 4 0.6 1 0.3 2 Other Pacific 285 5.3 7 1.0 189 10.0 28 1.9 31 4.8 23 6.2 7 China 78 1.4 6 0.9 22 1.2 6 0.4 26 4.0 3 0.8 15 Taiwan 353 6.5 15 2.2 71 3.8 132 8.9 79 12.1 16 4.3 40 Japan 933 17.3 60 8.9 121 6.4 659 44.7 36 5.5 14 3.8 43 Korea 75 1.4 19 2.8 22 1.2 18 1.2 5 0.8 4 1.1 7 Philippines 180 3.3 24 3.6 71 3.8 9 0.6 29 4.4 22 6.0 25 Other Asia 153 2.8 57 8.5 50 2.7 11 0.7 8 1.2 16 4.3 11 British 40 0.7 10 1.5 5 0.3 16 1.1 5 0.8 4 1.1 Germany 9 0.2 1 0.1 3 0.2 4 0.3 0.0 1 0.3 Other Euro Union 44 0.8 4 0.6 10 0.5 25 1.7 2 0.3 1 0.3 2 Other Europe 20 0.4 0.0 3 0.2 12 0.8 1 0.2 4 1.1 Others 20 0.4 6 0.9 6 0.3 2 0.1 0.0 4 1.1 2 Not stated 239 4.4 19 2.8 40 2.1 32 2.2 33 5.1 15 4.1 100
Source: Marshall Islands Visitors Authority
Figure 9.2 Visitors to Majuro by Country of Residence, 2001 (top 15 shown)
0
500
1,000
1,500
2,000
2,500
US
A
Japa
n
Tai
wan
Oth
er P
acifi
c
Kiri
bati
FSM
Not
sta
ted
Phi
lippi
nes
Oth
er A
sia
Fiji
Aus
tral
ia
New
Zea
land
Chi
na
Kor
ea
Nau
ru
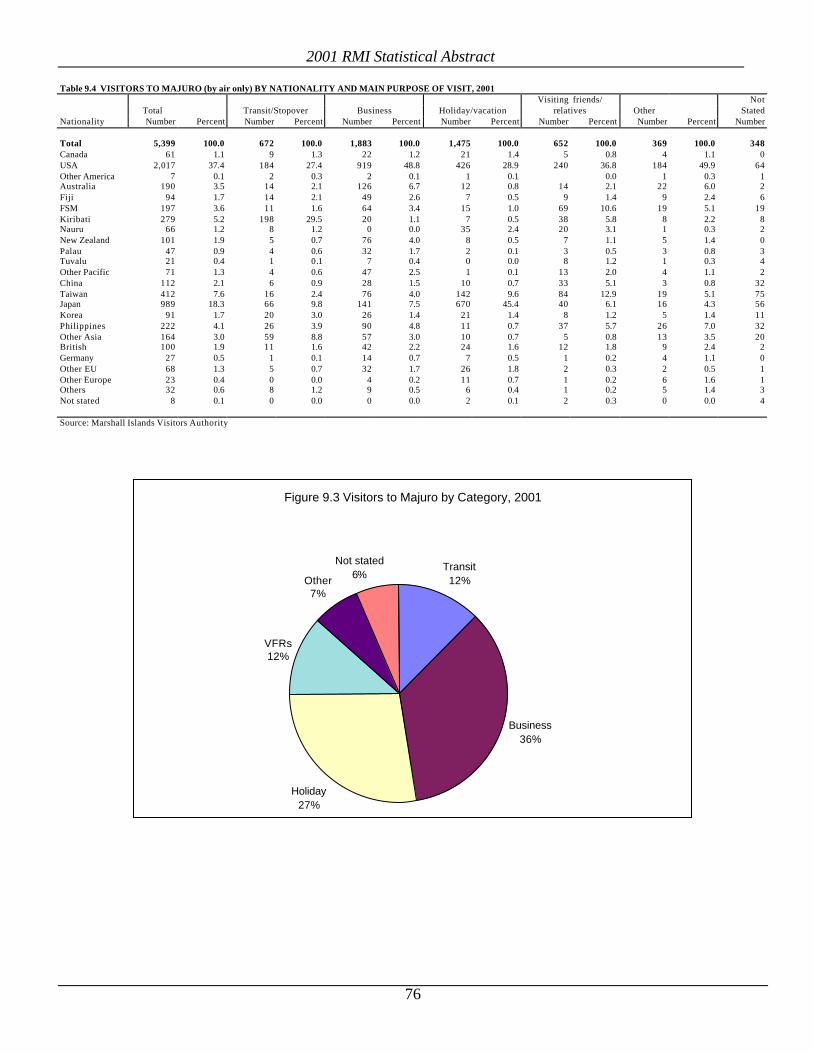
2001 RMI Statistical Abstract
76
Table 9.4 VISITORS TO MAJURO (by air only) BY NATIONALITY AND MAIN PURPOSE OF VISIT, 2001
Visiting friends/ Not Total Transit/Stopover Business Holiday/vacation relatives Other Stated
Nationality Number Percent Number Percent Number Percent Number Percent Number Percent Number Percent Number
Total 5,399 100.0 672 100.0 1,883 100.0 1,475 100.0 652 100.0 369 100.0 348 Canada 61 1.1 9 1.3 22 1.2 21 1.4 5 0.8 4 1.1 0 USA 2,017 37.4 184 27.4 919 48.8 426 28.9 240 36.8 184 49.9 64 Other America 7 0.1 2 0.3 2 0.1 1 0.1 0.0 1 0.3 1 Australia 190 3.5 14 2.1 126 6.7 12 0.8 14 2.1 22 6.0 2 Fiji 94 1.7 14 2.1 49 2.6 7 0.5 9 1.4 9 2.4 6 FSM 197 3.6 11 1.6 64 3.4 15 1.0 69 10.6 19 5.1 19 Kiribati 279 5.2 198 29.5 20 1.1 7 0.5 38 5.8 8 2.2 8 Nauru 66 1.2 8 1.2 0 0.0 35 2.4 20 3.1 1 0.3 2 New Zealand 101 1.9 5 0.7 76 4.0 8 0.5 7 1.1 5 1.4 0 Palau 47 0.9 4 0.6 32 1.7 2 0.1 3 0.5 3 0.8 3 Tuvalu 21 0.4 1 0.1 7 0.4 0 0.0 8 1.2 1 0.3 4 Other Pacific 71 1.3 4 0.6 47 2.5 1 0.1 13 2.0 4 1.1 2 China 112 2.1 6 0.9 28 1.5 10 0.7 33 5.1 3 0.8 32 Taiwan 412 7.6 16 2.4 76 4.0 142 9.6 84 12.9 19 5.1 75 Japan 989 18.3 66 9.8 141 7.5 670 45.4 40 6.1 16 4.3 56 Korea 91 1.7 20 3.0 26 1.4 21 1.4 8 1.2 5 1.4 11 Philippines 222 4.1 26 3.9 90 4.8 11 0.7 37 5.7 26 7.0 32 Other Asia 164 3.0 59 8.8 57 3.0 10 0.7 5 0.8 13 3.5 20 British 100 1.9 11 1.6 42 2.2 24 1.6 12 1.8 9 2.4 2 Germany 27 0.5 1 0.1 14 0.7 7 0.5 1 0.2 4 1.1 0 Other EU 68 1.3 5 0.7 32 1.7 26 1.8 2 0.3 2 0.5 1 Other Europe 23 0.4 0 0.0 4 0.2 11 0.7 1 0.2 6 1.6 1 Others 32 0.6 8 1.2 9 0.5 6 0.4 1 0.2 5 1.4 3 Not stated 8 0.1 0 0.0 0 0.0 2 0.1 2 0.3 0 0.0 4
Source: Marshall Islands Visitors Authority
Figure 9.3 Visitors to Majuro by Category, 2001
Transit12%
Business36%
Holiday27%
VFRs12%
Other7%
Not stated6%
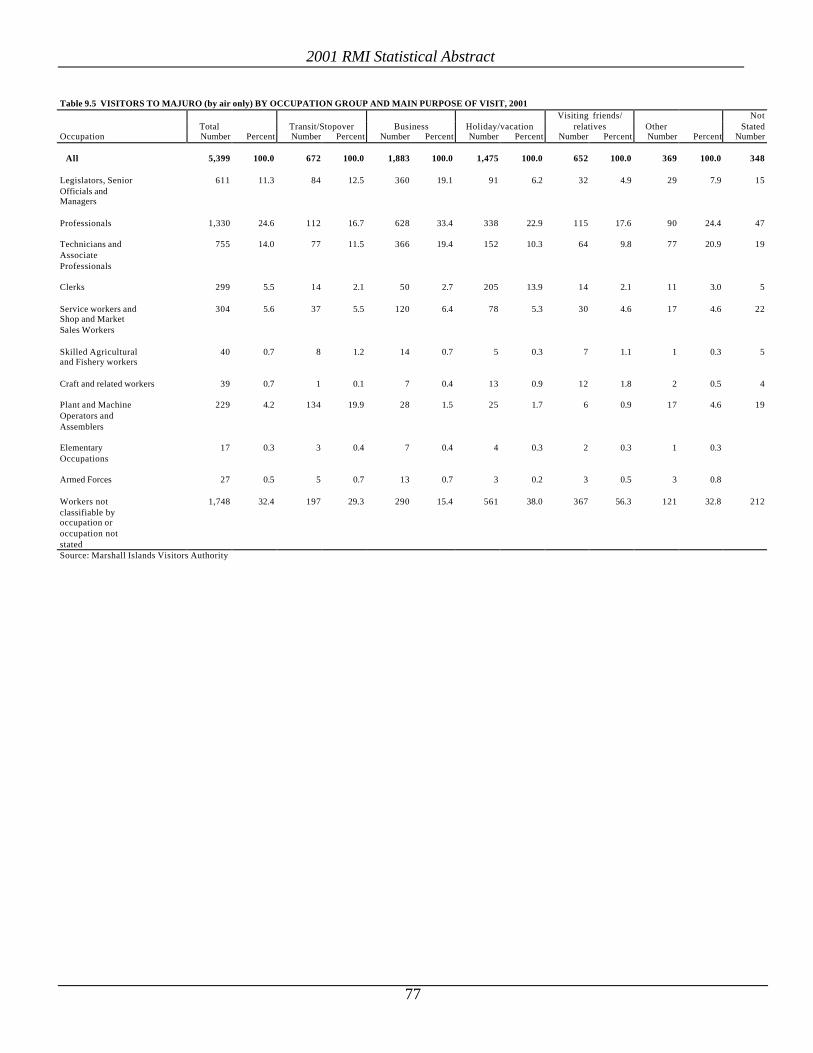
2001 RMI Statistical Abstract
77
Table 9.5 VISITORS TO MAJURO (by air only) BY OCCUPATION GROUP AND MAIN PURPOSE OF VISIT, 2001
Visiting friends/ Not Total Transit/Stopover Business Holiday/vacation relatives Other Stated
Occupation Number Percent Number Percent Number Percent Number Percent Number Percent Number Percent Number
All 5,399 100.0 672 100.0 1,883 100.0 1,475 100.0 652 100.0 369 100.0 348
Legislators, Senior 611 11.3 84 12.5 360 19.1 91 6.2 32 4.9 29 7.9 15 Officials and Managers
Professionals 1,330 24.6 112 16.7 628 33.4 338 22.9 115 17.6 90 24.4 47
Technicians and 755 14.0 77 11.5 366 19.4 152 10.3 64 9.8 77 20.9 19 Associate Professionals
Clerks 299 5.5 14 2.1 50 2.7 205 13.9 14 2.1 11 3.0 5
Service workers and 304 5.6 37 5.5 120 6.4 78 5.3 30 4.6 17 4.6 22 Shop and Market Sales Workers
Skilled Agricultural 40 0.7 8 1.2 14 0.7 5 0.3 7 1.1 1 0.3 5 and Fishery workers
Craft and related workers 39 0.7 1 0.1 7 0.4 13 0.9 12 1.8 2 0.5 4
Plant and Machine 229 4.2 134 19.9 28 1.5 25 1.7 6 0.9 17 4.6 19 Operators and Assemblers
Elementary 17 0.3 3 0.4 7 0.4 4 0.3 2 0.3 1 0.3 Occupations
Armed Forces 27 0.5 5 0.7 13 0.7 3 0.2 3 0.5 3 0.8
Workers not 1,748 32.4 197 29.3 290 15.4 561 38.0 367 56.3 121 32.8 212 classifiable by occupation or occupation not stated Source: Marshall Islands Visitors Authority

2001 RMI Statistical Abstract
78
Table 9.6 VISITORS TO MAJURO (by air only) BY SEX, AGE AND PURPOSE OF VISIT, 2001
Visiting friends/ Not Total Transit/Stopover Business Holiday/vacation relatives Other Stated
Country Number Percent Number Percent Number Percent Number Percent Number Percent Number Percent Number Total 5,399 100.0 672 100.0 1,883 100.0 1,475 100.0 652 100.0 369 100.0 348 0-4 years 90 1.7 18 2.7 28 1.5 15 1.0 15 2.3 1 0.3 13 5-9 years 0 0.0 0 0.0 0 0.0 0 0.0 0 0.0 0 0.0 0 10-14 years 3 0.1 0 0.0 0 0.0 1 0.1 2 0.3 0 0.0 0 15-19 years 13 0.2 2 0.3 0 0.0 6 0.4 3 0.5 0 0.0 2 20-24 years 44 0.8 8 1.2 8 0.4 11 0.7 12 1.8 1 0.3 4 25-29 years 71 1.3 10 1.5 12 0.6 22 1.5 8 1.2 9 2.4 10 30-34 years 165 3.1 13 1.9 43 2.3 46 3.1 22 3.4 30 8.1 11 35-39 years 274 5.1 26 3.9 111 5.9 75 5.1 25 3.8 23 6.2 14 40-44 years 446 8.3 64 9.5 210 11.2 96 6.5 32 4.9 31 8.4 13 45-49 years 659 12.2 54 8.0 328 17.4 139 9.4 61 9.4 34 9.2 43 50-54 years 628 11.6 64 9.5 269 14.3 142 9.6 80 12.3 39 10.6 34 55-59 years 692 12.8 78 11.6 290 15.4 181 12.3 60 9.2 32 8.7 51 60-64 years 644 11.9 79 11.8 225 11.9 216 14.6 56 8.6 31 8.4 37 65-69 years 583 10.8 71 10.6 160 8.5 222 15.1 62 9.5 25 6.8 43 70 years and over 1,082 20.0 184 27.4 199 10.6 301 20.4 212 32.5 113 30.6 73 Not stated 5 0.1 1 0.1 0 0.0 2 0.1 2 0.3 0 0.0 0
Male 3,624 100.0 523 100.0 1,488 100.0 812 100.0 341 100.0 253 100.0 207 0-4 years 61 1.7 13 2.5 21 1.4 9 1.1 9 2.6 1 0.4 8 5-9 years 0 0.0 0 0.0 0 0.0 0 0.0 0 0.0 0 0.0 0 10-14 years 2 0.1 0 0.0 0 0.0 1 0.1 1 0.3 0 0.0 0 15-19 years 5 0.1 1 0.2 0 0.0 3 0.4 1 0.3 0 0.0 0 20-24 years 34 0.9 8 1.5 7 0.5 9 1.1 8 2.3 1 0.4 1 25-29 years 45 1.2 7 1.3 12 0.8 14 1.7 4 1.2 7 2.8 1 30-34 years 110 3.0 10 1.9 40 2.7 19 2.3 15 4.4 19 7.5 7 35-39 years 201 5.5 20 3.8 90 6.0 47 5.8 18 5.3 17 6.7 9 40-44 years 333 9.2 51 9.8 171 11.5 63 7.8 15 4.4 22 8.7 11 45-49 years 479 13.2 41 7.8 269 18.1 90 11.1 31 9.1 23 9.1 25 50-54 years 441 12.2 47 9.0 212 14.2 93 11.5 36 10.6 33 13.0 20 55-59 years 486 13.4 63 12.0 223 15.0 108 13.3 35 10.3 22 8.7 35 60-64 years 431 11.9 67 12.8 174 11.7 120 14.8 25 7.3 24 9.5 21 65-69 years 348 9.6 50 9.6 126 8.5 99 12.2 26 7.6 19 7.5 28 70 years and over 645 17.8 144 27.5 143 9.6 136 16.7 116 34.0 65 25.7 41 Not stated 3 0.1 1 0.2 0.0 1 0.1 1 0.3 0.0
Female 1,775 100.0 149 100.0 395 100.0 663 100.0 311 100.0 116 100.0 141 0-4 years 29 1.6 5 3.4 7 1.8 6 0.9 6 1.9 0 0.0 5 5-9 years 0 0.0 0 0.0 0 0.0 0 0.0 0 0.0 0 0.0 0 10-14 years 1 0.1 0 0.0 0 0.0 0 0.0 1 0.3 0 0.0 0 15-19 years 8 0.5 1 0.7 0 0.0 3 0.5 2 0.6 0 0.0 2 20-24 years 10 0.6 0 0.0 1 0.3 2 0.3 4 1.3 0 0.0 3 25-29 years 26 1.5 3 2.0 0 0.0 8 1.2 4 1.3 2 1.7 9 30-34 years 55 3.1 3 2.0 3 0.8 27 4.1 7 2.3 11 9.5 4 35-39 years 73 4.1 6 4.0 21 5.3 28 4.2 7 2.3 6 5.2 5 40-44 years 113 6.4 13 8.7 39 9.9 33 5.0 17 5.5 9 7.8 2 45-49 years 180 10.1 13 8.7 59 14.9 49 7.4 30 9.6 11 9.5 18 50-54 years 187 10.5 17 11.4 57 14.4 49 7.4 44 14.1 6 5.2 14 55-59 years 206 11.6 15 10.1 67 17.0 73 11.0 25 8.0 10 8.6 16 60-64 years 213 12.0 12 8.1 51 12.9 96 14.5 31 10.0 7 6.0 16 65-69 years 235 13.2 21 14.1 34 8.6 123 18.6 36 11.6 6 5.2 15 70 years and over 437 24.6 40 26.8 56 14.2 165 24.9 96 30.9 48 41.4 32 Not stated 2 0.1 0 0.0 0 0.0 1 0.2 1 0.3 0 0.0 0
SOURCE: MARSHALL ISLANDS VISITORS AUTHORITY

2001 RMI Statistical Abstract
79
Table 9.7 VISITORS TO MAJURO (by air only) BY PURPOSE OF VISIT, 1989 to 2000
Transit/ Holiday/ Visit. friends/ Not Year Total Stopover Business vacation relatives Other Stated 2001 5,399 672 1,883 1,475 652 369 348 2000 5,246 548 2,256 1,323 621 325 173 1999 4,622 556 2,047 1,093 462 464 0 1998 6,374 1,276 1,905 874 568 489 1,262 1997 6,254 1,806 2,499 862 630 270 187 1996 6,116 1,447 2,513 1,113 634 281 128 1995 5,426 1,493 2,029 679 778 340 107 1994 4,876 967 2,090 563 857 399 0 1993 5,024 1,193 1,889 760 705 435 42 1992 5,648 1,306 2,118 825 709 650 40 1991 5,872 1,633 2,271 947 606 390 25 1990 4,856 na na na na na na 1989 3,183 1,232 1,158 355 277 153 8 Source: Marshall Islands Visitors Authority
Figure 9.4 Holiday/vacation Visitors to Majuro, 1989 to 2001(1990 not available)
0
200
400
600
800
1,000
1,200
1,400
1,600
200120001999199819971996199519941993199219911989

2001 RMI Statistical Abstract
80
(this page left blank intentionally)

2001 RMI Statistical Abstract
81
CHAPTER 10: PRICES The RMI Consumer Price Index (CPI) was developed in 1977 by the Office Planning and Statistics of the Trust Territory of the Pacific in Saipan. The current base year for the CPI is 1982. Although the RMI continues to rely on this CPI to monitor price changes (the CPI is for Majuro only), the methodology utilized to develop this initial CPI is questionable (no formal surveys were conducted to derive household consumption). The CPI was revised in early 2003, based on a Household Income and Expenditure Survey conducted in 2002. The CPI is meant to measure changes in the general level of the prices of goods and services which households purchase. The current CPI is based on prices of goods and services classified in four expenditures groups in Majuro only.
(i) Food (ii) Household/Personal (iii) Apparel, and (iv) Durables/Furniture

2001 RMI Statistical Abstract
82
Table 10.1 QUARTERLY CONSUMER PRICE INDEX, MAJURO (1982 = 100), 1992 to 2001
Annual Household/ Durables/ All Groups Average Food Personal Apparel Fuel Annual
B A S E W E I G H T Inflation Year/Quarter 100.0 57.71 14.76 11.95 15.58 Rate
2001 First quarter 198.74 173.46 287.53 230.26 184.08 Second quarter 200.11 200.57 174.09 291.30 233.84 184.24 1.75 Third quarter 200.47 174.10 292.29 236.39 183.60 Fourth quarter 202.94 174.76 293.55 252.29 183.63 2000 First quarter 196.26 173.53 276.00 221.38 185.65 Second quarter 196.91 197.12 173.31 281.40 222.38 185.66 1.62 Third quarter 197.57 173.72 281.69 224.35 185.66 Fourth quarter 197.75 173.89 282.01 225.14 185.27 1999 First quarter 198.69 174.82 269.00 199.18 181.62 Second quarter 192.96 193.99 174.86 269.30 200.19 182.12 1.66 Third quarter 192.35 173.40 269.33 201.94 182.28 Fourth quarter 191.95 172.52 269.65 202.24 182.44 1998 First quarter 189.90 171.39 266.77 196.98 180.26 Second quarter 190.54 190.82 171.98 267.49 198.85 180.07 2.18 Third quarter 191.26 172.80 267.55 198.85 181.57 Fourth quarter 191.58 173 .15 268.11 199.07 181.58 1997 First quarter 184.31 166.23 253.03 194.78 178.17 Second quarter 185.31 186.75 166.66 256.18 195.25 179.62 4.85 Third quarter 187.73 170.49 257.10 195.71 179.75 Fourth quarter 189.63 171.20 266.55 196.50 179.77 1996 First quarter 171.35 149.88 243.43 189.10 172.83 Second quarter 178.65 178.12 161.43 246.11 189.5 8 174.04 9.58 Third quarter 180.01 164.10 250.83 190.41 174.15 Fourth quarter 182.45 165.51 252.00 194.22 174.18 1995 First quarter 154.33 136.29 212.79 162.64 159.41 Second quarter 160.87 162.54 138.21 217.97 189.40 168.83 8.29 Third quarter 165.59 145.12 216.97 191.12 173.14 Fourth quarter 169.37 146.84 237.30 188.70 173.66 1994 First quarter 145.49 136.97 165.08 155.00 151.21 Second quarter 149.84 150.10 137.84 191.07 159.43 147.92 5.69 Third quarter 152.95 138.22 207.88 161.45 148.95 Fourth quarter 152.13 136.89 200.71 156.66 159.08 1993 First quarter 140.20 136.30 155.80 155.60 128.30 Second quarter 142.10 142.03 136.10 157.70 155.30 139.40 4.96 Third quarter 141.73 133.68 165.72 149.98 142.48 Fourth quarrter 144.08 135.82 169.24 153.12 143.90 1992 First quarter 130.20 128.80 147.40 130.10 119.40 Second quarter 133.09 135.32 129.02 158.91 131.71 124.77 10.33 Third quarter 137.07 134.25 170.67 125.71 124.41 Fourth quarter 140.92 136.21 172.51 144.79 125.48
Source: EPPSO

2001 RMI Statistical Abstract
83
Table 10.2 CONSUMER PRICE INDEX BY MAJOR GROUP, 1997 to 2001
1997 1998 1999 2000 2001
All Group 186.7 190.8 193.9 197.1 200.5
Food 168.6 172.3 173.9 173.6 174.1 Household/Personal 258.2 267.5 269.3 280.3 291.2 Apparel 195.6 198.4 200.9 223.3 238.2 Durable/Fuel 179.3 180.9 182.1 185.6 183.9
Percent Change All Group - 2.2 1.7 1.6 1.7
Food - 2.1 0.9 -0.17 0.3 Household/Personal - 3.5 0.7 3.92 3.74 Apparel - 1.4 1.2 10.03 6.3 Durable/Fuel - 0.9 0.7 1.9 -0.9
Source: Economic Policy, Planning and Statistics Office
Figure 10.1 Annual Rate of Inflation, 1992 to 2001
0.00
2.00
4.00
6.00
8.00
10.00
12.00
2001 2000 1999 1998 1997 1996 1995 1994 1993 1992

2001 RMI Statistical Abstract
84
(this page left blank intentionally)

2001 RMI Statistical Abstract
85
CHAPTER 11: NATIONAL ACCOUNTS RMI Gross Domestic Product estimates have been developed with assistance from ESCAP and the Forum Secretariat. The estimates for the period 1981-90 were prepared by ESCAP based on the Income Approach, and those for 1991 and 1992 were prepared by the Forum Secretariat based on the Value Added Approach. For this exercise, an establishment survey as well as a housing survey were conducted for gathering the necessary data on various sectors of the economy. The estimates for 1993 through 2001 are based on the Value Added Approach, following the methodology recommended by the Forum Secretariat, with revisions where appropriate. These estimates are provisional and subject to revision with the availability of more accurate and better data.

2001 RMI Statistical Abstract
86
Table 11.1 GROSS DOMESTIC PRODUCT (NOMINAL) 1983 to 1990 (FY ending September 30, US $ thousands)
YEAR Items 1983 1984 1985 1986 1987 1988 1989 1990
1. Net Domestic Product 31,093 33,418 33,100 41,939 48,883 55,295 57,555 60,573
1.1 Total Compensation of Employees: 16,641 17,425 19,003 24,113 30,249 36,139 37,469 39,947 Government 10,822 11,495 11,810 13,657 15,570 17,768 19,205 23,944 Government 9,791 10,353 10,923 12,617 14,219 16,149 17,527 18,904 Free Housing Provided 500 575 580 593 611 665 510 633 Enterprise - Government 531 567 308 447 740 954 1,168 4,407 Private 5,819 5,930 7,193 10,456 14,679 18,371 18,264 16,003 Private 5,292 5,392 6,559 9,589 13,582 17,036 17,027 14,544 Other 132 135 164 239 339 425 386 489 Free Housing Provided 110 113 134 172 235 253 234 289 Social Security Contribution 161 165 194 259 350 437 420 411 Domestic Services 124 126 127 162 133 134 120 165 Non - Profit Institution (Museum) N.A. N.A. 15 34 40 86 77 105 1.2 Total Operating Surplus 14,452 15,993 14,098 17,827 18,634 19,156 20,086 20,626 Government Enterprises 383 939 -1,519 -327 842 197 -449 -3,584 Private Enterprises - Taxed 5,975 6,266 6,721 8,935 7,767 8,349 9,247 11,443 Enterprises not covered by Tax 149 157 167 222 192 207 229 283 Copra marketed 1,141 1,365 1,031 847 1,080 1,213 1,209 1,079 Other agricultural Products Marketed 743 793 841 890 956 1,004 1,076 1,246 Non Market Production 4,964 5,302 5,617 5,950 6,387 6,706 7,188 8,323 Rental - Rented Buildings 283 303 320 338 364 382 409 473 Imputed rental-owner occupied houses 814 869 920 973 1,046 1,098 1,177 1,363
2. Consumption of Fixed Capital 1,730 1,805 1,933 2,445 2,902 3,075 2,896 3,189 3. Indirect Taxes 4,477 5,109 5,158 7,510 5,545 5,505 6,273 7,804 4. Subsidies 757 819 1,785 2,887 2,200 2,001 3,003 2,875
5. Gross Domestic Product 36,543 39,513 38,406 49,007 55,130 61,874 63,721 68,691
Note : (a) These figures are nominal values and hence not corrected for inflation. The figures are also provisional as they are subject to revision when better data become available. (b) This table differs from previous tables because the earnings of Marshallese workers in the Kwajalein Missile Base, legally a foreign entity, are considered as factor incomes from abroad and will be included in the estimates of Gross National Product. Sources: S.G. Tiwari. Report on Development of National Accounts and Related Matters in the Republic of Marshall Islands (TTPI), ESCAP, K.N.C. Pillai, Report on National Accounts Mission to the Republic of the Marshall Islands, ESCAP, Bangkok, Thailand, J. Kumar Regional Adviser on National Accounts, ESCAP, Bangkok, Thailand, (Unpublished Report), EPPSO

2001 RMI Statistical Abstract
87
Table 11.2 GROSS DOMESTIC PRODUCT OF THE REPUBLIC OF THE MARSHALL ISLANDS, 1981 TO 1990 (FY ending September 30, US $ millions) YEAR Item 1981 1982 1983 1984 1985 1986 1987 1988 1989 1990
1. Net Domestic Product at Factor Cost 23.26 26.24 31.09 33.42 33.10 41.94 48.88 55.30 57.56 60.58
Compensation of Employees 12.05 15.46 16.64 17.43 19.00 24.11 30.25 36.14 37.47 39.95 Operating Surplus 11.21 10.78 14.45 15.99 14.10 17.83 18.63 19.16 20.09 20.63
2. Consumption of fixed Capital 1.15 1.57 1.73 1.81 1.93 2.45 2.90 3.08 2.90 3.19 3. GDP at Factor Cost 24.41 27.81 32.82 35.23 35.03 44.39 51.78 58.38 60.46 63.77 4. Indirect Taxes less Subsidies 2.74 2.76 3.72 4.29 3.37 4.62 3.35 3.50 3.27 4.93 5. GDP at Market Prices 27.15 30.57 36.54 39.52 38.40 49.01 55.13 61.88 63.73 68.70 6. Mid-year Population estimate 31,927 33,036 34,199 35,420 36,702 38,044 39,449 42,692 44,407 46,188 7. Per Capita GDP at Market Prices 850 925 1,068 1,116 1,046 1,288 1,397 1,450 1,435 1,487 8. Percentage increase over previous year GDP at market prices - 12.6 19.5 8.2 -2.8 27.6 12.5 12.3 3.0 7.8 Per Capita GDP at market prices - 8.8 15.5 4.4 -6.2 23.1 8.5 3.7 -1.0 3.6 Note : The estimates are at current prices in US dollar. This data is provisional. The table is restricted by data availability and will be revised whenever more data becomes available. Sources: S.G.Tiwari Report on Development of National Accounts and Related Matters in the Republic of Marshall Islands (TTPI), ESCAP, Bangkok, Thailand, K.N.C. Pillai, Report on National Accounts Mission to the Republic of the Marshall Islands, ESCAP, Bangkok, Thailand, J. Kumar. Regional Adviser on National Accounts, ESCAP, Bangkok, Thailand, (Unpublished Report) EPPSO

2001 RMI Statistical Abstract
88
Table 11.3 ESTIMATES OF GROSS DOMESTIC PRODUCT, 1996 to 2001 (At current prices, US $ thousands)
1996 1997 1998 1999 2000 2001* Economic Sector GDP Percent GDP Percent GDP Percent GDP Percent GDP Percent GDP Percent 1. Agriculture, Forestry and Fishing 13,589.4 14.0 12,963.2 14.1 11,403.8 11.9 8,274.4 8.7 9,715.2 13.4 10,296.1 10.4 Agriculture Copra 2,016.2 2.1 1,915.4 2.1 1,636.6 1.7 1,578.5 1.7 2,186.0 2.2 1,638.2 1.7 Food Crops 1,985.6 2.0 2,010.0 2.2 1,165.3 1.2 994.3 1.0 1,716.5 1.7 2,139.1 2.2 Livestock 1,942.1 2.0 2,136.3 2.3 1,804.8 1.9 1,855.7 1.9 1,892.3 1.9 2,251.8 2.3 Agricultural Services 171.8 0.2 175.2 0.2 163.0 0.2 165.9 0.2 166.7 0.2 208.7 0.2 Fishing 7,473.7 7.7 6,726.3 7.3 6,634.1 6.9 3,680.0 3.9 3,753.6 7.3 4,058.3 4.1 2. Mining and quarrying 310.8 0.3 322.2 0.3 281.3 0.3 289.5 0.3 284.3 0.3 291.4 0.3 3. Manufacturing 1,488.0 1.5 1,561.0 1.7 1,491.4 1.6 3,229.2 3.4 4,476.0 1.7 4,489.5 4.5 Processed Copra Products (128.0) (0.1) (55) 0.0 (291.3) (0.3) (165.4) (0.2) (82.6) 0.0 (76.0) (0.1) Other Manufactured Goods 1,193.0 1.2 1,193.0 1.3 1,378.6 1.4 2,985.2 3.1 4,080.0 1.4 4,161.6 4.2 Handicrafts 423.0 0.4 423.0 0.5 404.1 0.4 409.4 0.4 396.0 0.4 403.9 0.4 4. Electricity, Gas and Water 2,566.0 2.6 2,808.0 3.0 2,015.1 2.1 2,245.4 2.4 3,092.5 3.1 3,402.2 3.4 Electricity 2,380.0 2.5 2,618.0 2.8 1,955.2 2.0 2,101.8 2.2 2,942.5 3.0 3,237.2 3.3 Water 186.0 0.2 190.0 0.2 59.9 0.1 143.6 0.2 150.0 0.2 165.0 0.2 5. Construction 6,625.8 6.8 6,294.5 6.8 10,622.4 11.1 10,648.5 11.2 10,775.3 11.0 11,314.1 11.4 6. Wholesale/Retail Trade and 17,743.0 18.3 16,207.4 17.6 17,055.1 17.8 17,222.8 18.1 17,082.1 17.3 16,937.3 17.1 Restaurants/Hotels Wholesale and retail Trade 12,969.0 13.4 11,672.1 12.7 12,668.1 13.2 12,766.7 13.4 12,623.7 12.8 12,516.7 12.6 Restaurants and Hotels 4,774.0 4.9 4,535.3 4.9 4,387.0 4.6 4,456.1 4.7 4,458.4 4.5 4,420.6 4.5 7. Transport, Storage and Communications 6,895.8 7.1 7,183.0 7.8 5,058.2 5.3 5,515.7 5.8 5,215.2 5.3 5,044.8 5.1 Land Transport 1,589.9 1.6 1,510.4 1.6 1,624.1 1.7 1,627.7 1.7 1,316.9 1.3 1,273.8 1.3 Water Transport 692.9 0.7 658.3 0.7 683.5 0.7 693.2 0.7 571.0 0.6 552.3 0.6 Air Transport 600.4 0.6 600.4 0.7 (480.4) (0.5) (302.0) (0.3) 244.6 0.3 236.6 0.2 Communications 4,012.6 4.1 4,413.9 4.8 3,231.0 3.4 3,496.8 3.7 3,082.7 3.1 2,982.0 3.0 8. Finance, Insurance, Real Estate 14,958.6 15.4 14,265.5 15.5 15,271.1 16.0 15,490.2 16.2 15,688.4 16.0 15,458.2 15.6 and Business Services Financial Institutions 3,893.0 4.0 3,503.7 3.8 4,308.3 4.5 4,355.5 4.6 4,331.3 4.4 4,267.7 4.3 Insurance 170.9 0.2 170.9 0.2 419.3 0.4 398.8 0.4 368.9 0.4 363.5 0.4 Real Estate 2,869.7 3.0 2,726.2 3.0 2,871.2 3.0 2,891.1 3.0 2,949.0 3.0 2,905.7 2.9 Owner-occupied dwellings 7,226.0 7.4 6,864.7 7.4 6,449.4 6.7 6,608.1 6.9 6,842.7 7.0 6,742.2 6.8 Business Services 799.0 0.8 1,000.0 1.1 1,222.9 1.3 1,236.7 1.3 1,196.5 1.2 1,179.0 1.2 9. Community, Social and Personal Services 30,782.0 31.7 28,832.0 31.3 30,985.3 32.4 31,236.7 32.8 30,902.5 31.3 31,043.6 31.3 Public Administration and Defense 13,000.0 13.4 11,050.0 12.0 13,094.3 13.7 13,153.3 13.8 12,763.6 13.0 13,018.8 13.1 Public Utility Services 947.5 1.0 947.5 1.0 930.9 1.0 908.9 1.0 904.0 1.0 898.3 0.9 Education Services 9,141.8 9.4 9,141.8 9.9 9,164.9 9.6 9,325.2 9.8 9,347.3 9.5 9,288.4 9.4 Health Services 4,646.7 4.8 4,646.7 5.0 4,513.2 4.7 4,554.3 4.8 4,617.7 4.7 4,588.6 4.6 Other Social and related Community Services 1,187.6 1.2 1,187.6 1.3 1,404.7 1.5 1,410.0 1.5 1,387.7 1.4 1,379.0 1.4 Recreation and Cultural Services 954.6 1.0 954.6 1.0 994.8 1.0 994.2 1.0 985.6 1.0 979.4 1.0 Personal and Household Services 903.8 0.9 903.8 1.0 882.5 0.9 890.8 0.9 896.7 1.0 891.0 0.9 10. Total 94,959.4 97.9 90,436.8 98.1 94,183.7 98.5 94,152.4 98.7 97,231.5 99.1 98,277.1 99.1
11. LESS imputed bank service charges 4,905.2 5.1 4,905.2 5.3 5,714.5 6.0 5,809.4 6.1 6,160.0 6.2 6,283.2 6.3
12. PLUS import duties 6,981.5 7.2 6,652.3 7.2 7,190.1 7.5 7,017.3 7.4 7,039.1 7.1 7,179.9 7.2
13. Gross Domestic Product 97,035.7 100.0 92,183.9 100.0 95,659.3 100.0 95,360.3 100.0 98,848.6 100.0 99,173.8 100.0 *Preliminary estimates which are provisional and subject to revision. Sources: L.N. Perera Report on RMI Gross Domestic Product and Sector Accounts South Pacific Forum Secretariat, EPPSO ANALYSIS BY OFFICE OF PLANNING AND STATISTICS IN 2000: There are a few important points to note. During the mid to late 1990's, there were several big events that led to some economic contraction in the RMI. Firstly, during the 1996-97 public sector reforms, the government cut its employment by more than 30 percent. Then came the December 1997 Typhoon Paka that virtually handicapped the Copra Industry, followed by the early to mid 1998 El Nino event, which further exacerbated the situation. We also suspected that although RMI is well protected because it uses the US dollar as domestic currency, the 1997 Asian Financial Crisis affected domestic demand to some extent. In early 1997, the Ting Hong Fishing Company closed and moved out of the RMI. The above estimates on Fish contribution to GDP are based on an ADB consultant who estimated that without Ting Hong, fish fell from its peak of over $7 million value-added to just over $3 million starting in 1999. We assumed fishing activities to begin to pick up slightly by about 2 percent as increases in fishing activities were expected from other sectors. In late 1999, the Fish Loining Plant began to operate. However, the ADB consultant stated this activity falls under food processing, in this case manufactur ing, which is estimated to have a value-added of around $3 to $4 million a year. The Construction and the Government sectors were both increasing consistently as Government was now rehiring more workers and there were a few significant Government construct ion projects managed by Public Works and funded out of the Inter-Agency Development Fund, and as construction of private houses on Majuro alone was increasing.

2001 RMI Statistical Abstract
89
Table 11.4 ESTIMATES OF REAL GROSS DOMESTIC PRODUCTION, 1987 to 2001 (At 1991 constant prices ) Year
1. G
DP
(c
urre
nt p
rice
s,
US
$ th
ousa
nds)
2. G
DP
defl
ator
(Maj
uro
CPI
)
3. R
eal G
DP
(Tho
usan
d U
S $)
4. C
hang
e in
R
eal G
DP
(Per
cent
)
5. E
stim
ated
M
id-Y
ear
Popu
lati
on
6. P
er C
apita
R
eal G
DP
(U
S $)
7. C
hang
e in
Pe
r Cap
ita
R
eal G
DP
(Per
cent
)
2001* 99,173.8 200.6 60,636.4 -1.52 54,584 1,111 -4.9 2000 98,960.5 197.1 61,574.2 -2.04 52,671 1,168 -5.1 1999 97,325.0 194.0 62,857.0 0.81 50,840 1,231 20.6 1998 95,223.0 190.8 62,351.0 2.99 49,546 1,020 2.5 1997 92,184.0 186.8 60,542.0 -9.39 48,814 995 -12.5 1996 97,036.0 178.1 66,817.0 -15.86 48,092 1,137 -18.8 1995 105,239.0 162.5 79,411.0 2.74 47,381 1,401 -15.4 1994 94,596.0 150.1 77,296.5 2.82 46,681 1,656 1.3 1993 87,059.0 142.0 75,179.8 4.06 45,991 1,635 2.5 1992 79,709.0 135.3 72,245.9 0.04 45,312 1,594 -1.4 1991 72,219.0 122.7 72,219.0 1.13 44,642 1,618 -0.4 1990 68,691.0 118.0 71,410.0 7.04 43,982 1,624 5.5 1989 63,721.0 117.2 66,712.6 0.84 43,332 1,540 -0.6 1988 61,874.0 114.7 66,156.8 9.43 42,692 1,550 1.1 1987 55,130.0 111.9 60,453.2 13.17 39,449 1,532 9.1 1986 49,007.0 112.5 53,419.0 22.44 38,044 1,404 18.1 1985 38,406.0 108.0 43,627.8 -2.59 36,702 1,189 5.9
*Preliminary estimates which are provisional and subject to revision. Note: The previous figures have been updated on the basis of the mid-year population figures, derived from the 1999 Census of Housing. Population and which indicated an annual p opulation growth rate of only 1.5% as compared to the projected growth rate of 3.6% revealed earlier by the 1994 Multi-Purpose House Survey. Source: EPPSO
Figure 11.1 Real GDP (US$ thousands, 1991 constant prices), 1986 to 2001
0.0
10,000.0
20,000.0
30,000.0
40,000.0
50,000.0
60,000.0
70,000.0
80,000.0
90,000.0
2001
2000
1999
1998
1997
1996
1995
1994
1993
1992
1991
1990
1989
1988
1987
1986

2001 RMI Statistical Abstract
90
(this page left blank intentionally)

2001 RMI Statistical Abstract
91
CHAPTER 12: JUSTICE AND CRIMES
This section presents data on justice and crimes. The data are from the Courts of the Marshall Islands (Community, District and High Courts), the National Department of Public Safety, and the Departments of Public Safety of Majuro Atoll Local Government and Kwajalein Atoll Local Government. The collection, compilation and presentation of justice and crime statistics are in their early stages, so users should use caution with these numbers.

2001 RMI Statistical Abstract
92
Table 12.1 CRIMINAL CASES DISPOSED OF AT THE HIGH COURT OF MAJURO, 1994 to 2001 Offenses 1994 1995 1996 1997 1998 1999 2000 2001 Total 59 46 41 42 45 83 100 107 Assault and battery 24 22 15 12 7 20 21 20 Attempted murder 2 - - - - - 2 - Burglary 5 7 7 6 - 4 9 9 Child abuse/molestation - - - - - - - 1 Embezzlement 5 - 2 1 1 1 1 4 Grand Larceny 3 - 5 1 - - 3 4 Murder - 2 1 1 1 - 3 - Narcotics 1 - - - - - 2 1 Rape/Attempted rape 2 1 0 1 1 1 1 5 Reckless driving/ DWI - - - 1 - 2 6 2 All other offenses 17 14 11 19 35 55 52 61 Source: High Court of Majuro and EPPSO
Table 12.2 CRIMINAL CASES DISPOSED OF AT THE DISTRICT COURT OF MAJURO, 1996 to 2000 Offenses 1996 1997 1998 1999 2000 Total 180 161 70 210 179 Aiding and abetting - - - 1 - Altering, Damaging, Contaminating water line 6 - - - - Altering, tampering with CableTV Line - - - 2 2 Assault and battery 7 7 3 15 6 Disturbance of peace - 2 - 3 1 DUI/Drunken driving 18 10 2 20 31 Escape 1 2 - - - Excessive speeding 5 1 2 3 8 Failure to yield/vehicle 7 1 2 8 5 Faulty brakes - - - - - Faulty tail lights 3 1 3 1 12 Following too closely - 1 1 1 1 Grand larceny - 1 - - - Hour of operation - 10 2 5 11 Illegal stopping/parking 4 - 3 8 7 Improper signal - - - 2 - Littering 4 - 1 0 - Malicious mischief 7 10 1 16 17 Muffler 1 - - - - Negligent driving 13 3 16 13 22 No drinking permit 83 77 26 50 38 No driving license 11 8 1 14 2 No insurance policy - - 1 - - No license plate - - 2 - - No registration card 4 5 1 7 2 Obstructing driver's view - - - 1 - Petit larceny - 4 0 - 2 Possession, removal of Government property - 1 - - - Receiving stolen property - - - - - Reckless driving 2 3 3 4 1 Restriction use of alcolhol - - - 1 - Selling alcohol to minor - - - - - Tresspass - - - 2 - Underage drinking 1 2 - 0 - Unsafe passing 1 1 - 7 3 Other - - - 3 - Not stated/Unknown 2 11 - 23 8
Source: District Court, Majuro, RMI

2001 RMI Statistical Abstract
93
Table 12.3 OFFENSES KNOWN TO THE POLICE BY TYPE, RMI (excluding Ebeye), 1997 to 2001 Offenses 1997 1998 1999 2000 2001
Total 308 612 950 1,452 1,187 Affray - - - - 1 Aggravated assault 12 17 11 3 2 Arson - - - 3 - Assault 9 26 12 14 33 Assault and battery 0 41 46 79 80 Assault/battery with weapon 14 44 56 46 54 Attempted suicide 5 - - 2 1 Auto theft 0 2 5 1 - Burglary 32 49 66 71 76 Disturbing the peace 70 92 45 88 135 Drunken disorderly conduct 87 218 409 842 595 Embezzlement 2 4 1 1 3 Escaped - - 7 2 1 Forgery 1 5 1 2 1 Grand Larceny 18 20 21 49 46 Involuntary/vol. manslaughter - - - 1 - Malicious mischief 19 44 68 96 92 Murder 1 1 2 1 - Obstructing justice - - 2 - - Petit larceny 10 9 11 - 29 Rape - 1 4 1 3 Receiving stolen goods - 3 - - - Robbery - - - - 3 Suicide 22 - 2 4 2 Tresspassing 5 33 6 145 27 Weapon violation - 2 2 1 3 Other 1 1 173 - -
Source: DPS, Majuro
Table 12.4 PERSON ARRESTED BY AGE GROUP AND GENDER, RMI (excluding Ebeye), 2001 Age group Both sexes Male Female Total 1,242 1,201 41 18-19 513 479 34 20-30 320 315 5 31-40 192 190 2 41-50 154 154 - 51+ 63 63 -
Source: DPS, Majuro
Table 12.5 PERSONS ARRESTED BY CITIZENSHIP, RMI (excluding Ebeye), 2001 Citizenship Persons Total 1,242 Marshallese 1,207 Chine (PRC) 23 Republic of China 2 Gilbertese 9 Indonesia 1
Source: DPS, Majuro
Table 12.6 TRAFFIC ACCIDENTS, DRUNKEN DRIVING, AND TRAFFIC CITATIONS ISSUED, RMI (excluding Ebeye), 1999 to 2001 Offenses 1999 2000 2001 Total 499 197 899 Traffic accidents 174 102 223 Drunken driving offenses 102 53 496 Traffic citations issued 223 42 180
Source: DPS, Majuro

2001 RMI Statistical Abstract
94
Table 12.7 TRAFFIC ACCIDENTS BY TYPE, RMI (excluding Ebeye), 1999 to 2001 Type of accidents 1999 2000 2001
Total 174 102 223 Auto-Auto Accident 108 72 149 Auto-Pedestrian Accident 21 10 29 Auto-Object Accident 41 19 43 Fatal Accident 4 1 2
Source: DPS, Majuro
Table 12.8 PERSONS ARRESTED BY OFFENSE, EBEYE, 1995 to 2001 Offenses 1995 1996 1997 1998 1999 2000 2001
Total 224 213 315 245 189 283 388 Affray 8 4 12 6 4 12 35 Aggravated assault 4 - 1 1 1 3 - Arson - - - - - - - Assault 5 - - - 5 4 38 Assault/battery with weapon 11 9 8 9 3 8 - Assault and battery 18 24 8 10 19 23 - Attempted suicide - - - - - - - Auto theft - - - - - - - Burglary 4 10 21 8 12 19 25 Contempt of court 1 2 8 - - 8 22 Disturbing the peace 83 86 196 151 103 132 196 Drunk driving 1 - 3 3 4 2 8 Drunken disorderly conduct 68 37 16 22 9 20 10 Embezzlement - - - - - - - Escaped 1 3 - - 1 2 - Forgery 1 - - 1 - 1 Larceny/grand larceny 6 8 2 10 4 7 18 Involuntary/vol. manslaughter 1 - - - - - - Malicious mischief 2 2 5 11 6 8 12 Murder - - - 1 - 1 - Obstructing justice - 5 9 3 4 9 11 Petit larceny 3 10 4 6 - 7 - Possession/Distribution of narcotic drug 1 - - - - 2 - Rape 1 2 4 - 3 3 3 Receiving stolen goods - - - - 2 2 - Robbery - - - 1 1 1 4 Suicide - - - - - - - Tresspassing 4 11 18 2 7 9 5 Weapon violation 1 - - - 1 - - Other - - - - - - 1
Source: Department of Public Safety, Ebeye, Kwajalein

2001 RMI Statistical Abstract
95
CHAPTER 13: OTHER INDICATORS
This section presents data that are not part of the regular sections of the Abstract. EPPSO’s objective is not only to collect and disseminate national statistics, but also to improve the statistical and data collection systems and processes at the organizational level (i.e., within ministries, agencies and in the private sector). As EPPSO strives to do this, the range and depth of this section (and the entire Abstract, for that matter) should continue to expand.

2001 RMI Statistical Abstract
96
Table 13.1 REGISTERED MOTOR VEHICLES BY TYPE, MAJURO ATOLL, 1986 to 2001 Type of Vehicle 1986 1987 1988 1989 1990 1991 1992 1993 1994 1995 1996 1997 1998 1999 2000 2001
Total 932 1,080 1,142 975 928 1,488 2,062 1,761 1,647 1,666 1,307 1,800 1,939 2,575 2,386 2,442
Bus 4 5 10 4 14 4 4 6 6 4 7 4 14 75 94 34 Jeep 20 24 18 19 22 24 31 42 36 41 28 26 53 79 78 85 Mini-Pick up 49 36 43 53 39 28 12 13 21 29 48 71 Pick Up 258 309 289 198 24 498 485 581 586 562 369 691 451 587 522 69 Scooter 10 12 22 18 28 42 - 31 39 30 16 37 20 47 - 86 Sedan 525 606 676 526 647 806 1,196 809 793 743 567 748 1,138 1,404 1,326 1,695 Truck 50 54 58 66 82 33 118 70 - 73 48 27 41 64 33 11 Van 65 70 69 95 75 38 175 183 187 185 126 98 74 66 50 75 H-equipment - - - - - - - - - - 70 91 66 112 149 112 Mini Van - - - - - - - - - - 30 28 14 55 27 82 Station Wagon - - - - - - - - - - 34 37 47 57 22 122 Motorcycle - - - - - - - - - - - - - - 37 -
Source: Ministry of Justice, Department of Public Safety, Majuro Local Government Police Department
Figure 13.1 Registered Vehicles on Majuro, 1986 to 2001
0
500
1,000
1,500
2,000
2,500
3,000
1986
1987
1988
1989
1990
1991
1992
1993
1994
1995
1996
1997
1998
1999
2000
2001

2001 RMI Statistical Abstract
97
Table 13.2 POWER GENERATED, NUMBER OF ELECTRICITY CONSUMERS AND PRODUCTION, 1994 to 2001
Power Characteristics Total Jan Feb Mar Apr May Jun Jul Aug Sep Oct Nov Dec
2001 MW Hrs Generated 73,523.0 5,936.7 5,438.9 6,100.0 6,158.0 6,187.1 5,935.2 6,192.2 6,343.8 6,066.6 6,436.5 6,072.8 6,655.2 Cost per KW/H (cent) … na na na na na na na na na na na na No. of consumers … 3,150 3,149 3,173 3,170 3,149 3,151 3,148 3,136 3,154 3,166 3,196 3,202 Total Production … na na na na na na na na na na na na 2000 MW Hrs Generated 69,243.6 5,331.9 5,595.7 5,534.9 5,547.2 5,981.5 6,022.9 5,560.9 5,958.5 5,956.3 5,838.7 5,750.7 6,164.4 Cost per KW/H (cent) … 4.51 4.18 4.42 5.84 5.62 5.40 6.17 5.40 6.01 6.20 6.09 6.92 No. of consumers … 3,049 3,076 3,078 3,087 3,090 3,082 3,099 3,126 3,146 3,157 3,158 3,148 Total Production 4,106 226 254 266 344 363 349 361 346 383 389 374 451 1999 MW Hrs Generated 62,930.8 5,297.5 4,768.5 5,262.0 5,186.3 5,114.3 5,116.7 5,320.6 5,350.8 5,162.2 5,235.3 4,984.7 6,131.9 Cost per KW/H (cent) … 3.03 3.19 3.09 2.87 3.32 3.85 4.04 3.78 3.85 4.02 5.14 1.09 No. of consumers … 2,903 2,906 2,914 2,935 2,960 2,990 3,006 2,983 2,997 3,017 3,028 3,034 Total Production 2,520 188 166 178 162 189 212 228 219 214 230 278 256 1998 MW Hrs Generated 64,109.9 5,476.6 5,107.5 5,313.5 5,389.2 5,587.4 5,289.9 5,478.6 5,279.0 5,364.2 5,408.0 5,094.7 5,321.3 Cost per KW/H (cent) … 4.70 4.20 4.60 4.60 4.20 4.20 4.60 3.70 3.30 3.60 3.20 3.30 No. of consumers … 2,843 2,853 2,864 2,877 2,886 2,971 2,881 2,891 2,868 2,868 2,867 2,866 Total Production 2,644 268 226 227 225 251 238 231 210 193 208 174 193 1997 MW Hrs Generated 62,115.5 2,547.1 4,982.0 5,625.6 5,243.8 5,458.2 5,286.2 5,707.8 5,638.7 5,402.2 5,563.0 5,321.7 5,339.2 Cost per KW/H (cent) … 6.21 5.73 6.07 5.65 6.38 5.97 5.93 6.14 5.54 5.81 5.48 5.12 No. of consumers … 2,742 2,749 2,766 2,765 2,785 2,780 2,777 2,786 2,794 2,795 2,845 2,838 Total Production 6,451 … … … … … … … … … … … … 1996 MW Hrs Generated 62,619.5 5,249.2 4,863.5 5,301.8 4,841.4 5,202.7 4,967.6 5,368.6 5,151.9 5,280.9 5,572.4 5,272.4 5,547.1 Cost per KW/H (cent) … 4.60 5.10 4.70 4.80 4.50 4.40 5.40 5.50 5.20 5.80 5.60 5.50 No. of consumers … 2,643 2,666 2,671 2,667 2,660 2,681 2,696 2,686 2,695 2,731 2,734 2,742 Total Production 6,046 735 509 422 549 424 486 461 390 671 517 425 457 1995 MW Hrs Generated 61,667.9 5,307.3 4,691.8 5,167.2 4,934.3 5,278.8 4,941.4 5,275.1 5,443.3 5,060.9 5,261.3 5,040.2 5,266.3 Cost per KW/H (cent) … 4.60 4.50 4.60 4.60 4.50 4.40 4.60 4.30 5.10 4.10 4.20 4.50 No. of consumers … 2,529 2,552 2,561 2,558 2,573 2,602 2,608 2,625 2,624 3,198 3,215 3,227 Total Production 5,651 588 490 543 427 457 431 442 518 294 878 358 225 1994 MW Hrs Generated 57,890.8 4,745.3 4,152.1 4,724.5 4,647.0 4,808.3 4,771.1 4,962.2 5,030.7 4,834.7 5,059.3 4,977.1 5,178.5 Cost per KW/H (cent) … 5.70 5.00 4.90 5.20 4.40 4.30 4.20 4.10 4.30 4.60 4.30 4.30 No. of consumers … 2,866 2,891 2,897 2,923 2,937 2,968 2,974 3,023 3,038 2,484 2,496 2,502 Total Production 5,404 305 423 462 357 321 384 235 371 371 528 1,326 321
Source: Marshalls Energy Company
Table 13.3 ELECTRICITY CHARGES AT MAJURO, 1987 to 2000
Price Per KWH Year Residential Business Government
2001 0.12 0.16 0.16 2000 0.12 0.16 0.13 1999 0.11 0.16 0.13 1998 0.11 0.16 0.13 1997 0.11 0.15 0.15 1996 0.11 0.13 0.15 1995 0.11 0.13 0.15 1994 0.11 0.13 0.15 1993 0.10 0.12 0.14 1992 0.10 0.12 0.12 1991 0.09 0.11 0.11 1990 0.08 0.10 0.10 1989 0.08 0.10 0.10 1988 0.11 0.16 0.13 1987 0.08 0.10 0.10
Note: Government rate increased from .13 to .16 in June of 2001 Source: Marshalls Energy Company

2001 RMI Statistical Abstract
98
Table 13.4 LOCATIONS OF MAJOR INFRASTRUCTURE IN RMI Locations of Health Centers/ Sea Power Water Resorts/ Local Gov't Solar Fishbases/ Atoll Name Airports Schools Dispensaries Ports Plants Catchments Hotels, etc. Headquarters Power Facilities Ailinglaplap Aerok Airok Airok Aeinen Airok Buoj Jeh Enewe Buoj Aerok Woja Buoj Jah Jah Jabwon Jeh Jabwon Jah Katiej Enewe Jeh Woja Buoj Kattiej Jeh Mejel Mejel Woja Woja Ailuk Ailuk Ailuk Ailuk Ailuk Ailuk Ailuk Enejelar Enejelar Enejelar Arno Arno Arno Bikarej Arno Arno Bikarej Bikarej Inne Ine Ine Ine Lukoj Kilange Kilange Malel Longar Longar Matolen Lukoj Tinak Tinak Matolen Tutu Tutu Tutu Ulien Ulien Ulien Aur Tobal Aur Aur Aur Aur Aur Tobal Tobal Tobal Tobal Bikini Enyu Bikini in Majuro Ebon Ebon Ebon Ebon Ebon Ebon Enekoion Toka Enekoion Toka Toka Enewetak Enewetak Enewetak Enewetak Enewetak Enewetak Enewetak Medren Jabat Jabat Jabat Jabat Jabat Jabat Jaluit Jabwor Imiej Imiej Imiej Jabwor Jabwor Jabwor Imroj Imroj Imroj Jaluit Jabnoren Jabnoren Jabnoren Jabor Jabwor Jabwor Jaluit Jaluit Jaluit Mejatto Mejatto Mejatto Mejrirok Mejrirok Mejrirok Narmij Narmij Narmij Kili Kili Kili Kili Kili Kili Kili, Majuro Kwajelein Kwajelein* Carlos Ebadon Ebadon Ebeye Ebeye Ebeye Elenak/Mejatto Ebadon Mejatto Mejatto Kwajelein Ebeye Santo Santo Eniburr Mejatto Mejatto Lae Lae Lae Lae Lae Lae Lib Lib Lib Lib Lib Likiep Likiep Jebal Likiep Likiep Likiep Likiep Likiep Likiep Jebal Jebal Melan Melan Melan Majuro Majuro* Majuro Majuro Majuro Delap Majuro Majuro Majuro Majuro Ronrong Rongrong Kidenen Maloelap Kaben Aerok Aerok Aerok Tarawa Jang Jang Jang Kaben Kaben Kaben Ollet Ollet Ollet Tarawa Tarawa Tarawa Mejit Mejit Mejit Mejit Mejit Mejit Mili Mili Enejet Enejet Enejet Mili Wau Enejet Lukwonwod Lukwonwod Mili Mili Mili Nadikdik Nallo Nallo Nallo Tokewa Tokewa Tokewa Namdrik Namdrik Namdrik Namdrik Namdrik Namdrik Namdrik Namu Majkin Loen Loen Loen Namu Mae Mae Mae Majkin Majkin Majkin Namu Namu Namu continued next page

2001 RMI Statistical Abstract
99
Table 13.4 LOCATIONS OF MAJOR INFRASTRUCTURE IN RMI (continued) Locations of Health Centers/ Sea Power Water Resorts/ Local Gov't Solar Fishbases/Atoll Name Airports Schools Dispensaries Ports Plants Catchments Hotels, etc. Headquarters Power Facilities Rongelap Rongelap Rongelap Rongelap Rongelap Rongelap Majuro Ujae Ujae Ujae Ujae Ujae Ujae Utrik Utrik Utrik Utrik Utrik Utrik Majuro Utirik Wotho Wotho Wotho Wotho Wotho Wotje Wotje Nibun Nibun Nibun Wotje Nibun Wodmej Wodmej Wodmej Wodmej Wotje Wotje Wotje Note: * Marks International Airports. Majuro facilities located throughout Majuro Island. Kwajalein military-affiliated facilities not included. Sources: AMI, MOE, MOHE (OIDS), T&C, MWSC, MIVA, R&D, MIMRA
Table 13.5 Cable TV, Telephone and Internet Subscribers, 1995 to 2001
Year Cable TV Telephones Cellular phones Mini-Sat. Phones Internet 2001 922 3,710 528 16 472 2000 760 3,566 486 14 409 1999 657 2,463 452 - 324 1998 569 3,445 345 - 263 1997 499 3,167 - - - 1996 544 3,012 - - - 1995 527 2,921 - - - Source: MBC and NTA
Table 13.6 Water Supply to Majuro by Area, 1997 to 2001 [Millions of gallons] Year Total Airport-Rita Airport-Laura 2001 229.0 187.2 41.8 2000 201.1 162.0 39.1 1999 184.3 146.7 37.6 1998 136.0 85.2 50.8 1997 196.3 175.2 21.1
Source: Majuro Water and Sewer Company
Table 13.7 Water Supply to Majuro by Area and Month, 2001 [Millions of gallons]
Year Total Airport-Rita Airport-Laura Total 229.0 187.2 41.8 January 20.4 17.6 2.8 February 18.2 14.8 3.4 March 15.8 13.6 2.2 April 13.8 10.0 3.8 May 15.4 10.1 5.3 June 12.5 7.7 4.8 July 19.3 16.2 3.1 August 20.0 17.2 2.8 September 19.3 16.2 3.1 October 28.0 24.0 4.0 November 21.4 18.2 3.2 December 24.9 21.6 3.3 Source: Majuro Water and Sewer Company