Republic of Indonesia A Resilient and Progressive Economy of... · About Investor Relations Unit of...
102
July 2017 Republic of Indonesia A Resilient and Progressive Economy
Transcript of Republic of Indonesia A Resilient and Progressive Economy of... · About Investor Relations Unit of...

July 2017
Republic of Indonesia
A Resilient and Progressive Economy

1
About Investor Relations Unit of the Republic of Indonesia
Investor Relations Unit (IRU) of the Republic of Indonesia has been established as a joint effort between Coordinating Ministry of
Economic Affairs, Ministry of Finance and Bank Indonesia since 2005. The main objective of IRU is to actively communicate Indonesian
economic policy and to address concerns of investors, especially financial market investors.
As an important part of its communication measures, IRU maintains a website under Bank Indonesia website which is administered by
International Department of Bank Indonesia. However, day-to-day activities of IRU are supported by all relevant government agencies,
among others: Bank Indonesia, Ministry of Finance, Coordinating Ministry for Economic Affairs, Investment Coordinating Board, Ministry of
Trade, Ministry of State Owned Enterprises, Ministry of Energy and Mineral Resources and Financial Services Authority.
IRU also convenes an investor conference call on a quarterly basis, answers questions through email, telephone and may arrange direct
visit of banks/financial institutions to Bank Indonesia and other relevant government offices.
Published by Investor Relations Unit – Republic of Indonesia
Website: http://www.bi.go.id/en/iru/default.aspx
Contact: Wiwit Widyastuti (International Department - Bank Indonesia, Phone: +6221 2981 8279)
Adrianto (Fiscal Policy Office - Ministry of Finance, Phone: +6221 345 0012)
I Gede Yuddy Hendranata (Directorate General of Budget Financing and Risk Management - Ministry of Finance,
Phone: +62213510714)
E-mail: [email protected]
This Presentation Book also can be downloaded from: http://www.bi.go.id/en/iru/presentation/red/Default.aspx

2
Overview
1
2
3
4
5
6
Institutional and Governance Effectiveness: Accelerated Reforms Agenda with Institutional Improvement
Economic Factor:Strong and Stable Growth Prospects Remain Intact
External Factor: Improved External Resilience
Fiscal Performance and Flexibility: More Fiscal Stimulus with Prudent Fiscal Management
Monetary and Financial Factor: Credible Monetary Policy Track Record and Favourable Financial Sector
Progressive Infrastructure Development:Strong Commitment on Acceleration of Infrastructure Provision

Institutional and Government Effectiveness:Accelerated Reforms Agenda with Institutional Improvement
Section 1

4
Positive Global Perception
1. Source: World Bank – Doing Business 2017 Report;2. Source: Transparency International – Corruption Perceptions Index 2016 Report;3. Source: World Economic Forum –The Global Competitiveness Report 2016 – 20174. Source: World Bank
World Governance Indicators4
Ease of Doing Business1
Global Competitiveness Index3
Corruption Perception Index2
Higher rank is better
Higher score is better
4139
81
57
55
30
45
60
75
90
2009 2010 2011 2012 2013 2014 2015 2016
Indonesia India Brazil Phillipines Turkey
91
130123
99
69
50
70
90
110
130
150
2008 2009 2010 2011 2012 2013 2014 2015 2016
Indonesia India Brazil Philippines Turkey
37
40
35
41
25
30
35
40
45
50
55
2012 2013 2014 2015 2016
Indonesia India Brazil Philippines Turkey
* Both India and Brazil shared the same score (40) in 2016
Higher rank is better
Higher rank is better
52
25
4746
38
40
15
25
35
45
55
2010 2011 2012 2013 2014 2015
Voice and Accountability Political Stability/Absence of ViolenceRegulatory Quality Government EffectivenessControl of Corruption Rule of Law

5
Fitch
JCRA
2006 2007 2008 2009 2010 2011 2012 2013 2014 2015 2016 2017
BBB- / Positive
Baa3 / Positive
BBB- / Stable
Feb 2017, Baa3, Outlook Revised to Positive
“We changed the outlook on Indonesia's sovereign rating to positive from stable to reflect emerging signs of a reduction in structural constraints, including its level ofexternal vulnerability and the strength of its institutions.“
May 2017, BBB-, Rating Upgraded
“We raised the long-term sovereign credit to BBB- as the Indonesian authorities have taken effective expenditure and revenue measures to stabilize the public finances despite the terms of trade shock.”
July 2017, BBB-, Positive Rating Affirmed
“Indonesia's ratings balance a low government debt burden, favourable growth outlook and limited sovereign exposure to banking sector risks with weak - but strengthening - external finances compared with 'BBB' category peers and some lagging structural factors, including governance standards and a still difficult - but improving - business environment.”
BBB- / Positive
March 2017, BBB-, Outlook Revised to Positive
“JCR has changed the rating outlook from Stable to Positive, based on the recent improvement on the investment climate promoted by a series of Economic Policy Packages & the containment of private external debt brought by Bank Indonesia’s prudential regulations on external borrowing.”
BBB- / Positive
April 2017, BBB-, Outlook Revised to Positive
“Indonesia's macroeconomics stability has been maintained for several years. Its external position is also improving,. fiscal deficits have been reined in and government debt is low. In light of such factors, coupled with improved policy management, R&I has changed the rating outlook to Positive.’
BBB-
BB+
BB
B+
BB-
Investment Grade Status From Rating Agencies
Below Investment Grade
S&PR&IMoody’s

6
Indonesia Remains the Investment Destination of Choice
1. Source: The Economist – Asia Business Outlook Survey 2017 2. Source: IMF World Economic Outlook, Database April 2017
3. Source: United Nations Conference on Trade and Development (UNCTAD) – World Investment Report 20174. Source: JBIC – Outlook for Japanese Foreign Direct Investment (28th Annual Survey)
Total Inve
stm
ent / G
DP (%)
Indonesia Enjoys Large Investments Relative to Peers within the Region2
JBIC: Amongst ASEAN countries, Indonesia is the most preferred place for business investment (December 2016)4
The Economist: Indonesia among the top 3 destination for attracting investors in Asia (January 2017)1
2,5
3,1
3,5
4,8
6,8
7,2
10,1
10,6
19,3
25,9
29,4
32,7
35,8
42,0
47,6
0 5 10 15 20 25 30 35 40 45 50
Turkey
Korea
Russia
Singapore
Malaysia
Brazil
Myanmar
Philippines
USA
Mexico
Thailand
Vietnam
Indonesia
China
India
% of surveyed who consider each country has promising prospects
18
18,9
21,3
24,8
25,3
26,3
27,7
28,4
33,3
39,4
46,2
53,7
55,7
71,6
0 10 20 30 40 50 60 70 80
Taiwan
Singapore
Japan
Hong Kong
South Korea
Australia
Malaysia
Myanmar
Thailand
Phillipines
Vietnam
Indonesia
India
China
UNCTAD: Indonesia is listed as the top 5 prospective investment destination in the world (June 2017)3
32,75
34,17
25,09
20,55
22,25
27,58
31,42
34,29
26,06
23,60
22,01
26,58
31,43
34,30
25,48
25,41
24,30
27,18
0
5
10
15
20
25
30
35
40
India Indonesia Malaysia Philippines Thailand Vietnam
2015 2016 2017*
* 2017 estimation
3444
56
777
91111
2036
40
0 10 20 30 40 50
Australia (13)
Canada (18)
Singapura (18)
Vietnam (14)
Spain (25)
Philippines (9)
Mexico (7)
Germany (5)
United Kingdom (4)
Brazil (7)
Thailand (14)
Indonesia (8)
India (3)
China (2)
United States (1)
% of executives responding(x) = 2016 ranking

7
National Strategic Development Plan (Nawa Cita)
Human Development
Education
Health
Housing
Character
Priority Sector Development
Food Security
Energy & Electrical Security
Maritime & Marine
Tourism & Industry
Water Security, Basic Infrastructure & Connectivity
Equitable Development
Inter- Income Group
Inter-Region:
(1) Rural Area,
(2) Periphery,
(3) Outside Java,
(4) Eastern Area.
Security & Order Politic & Democracy Governance
The 3 Dimensions on Economic Development
Necessary Condition
Legal Certainty & Law Enforcement

8
Equitable Economy Policy
Source: Coordinating Ministry for Economic Affairs
The Economic Equalization Policy announced in April 2017 embodies national economic transformation to successfully overcome the middle income trap and achieve the status of a developed country in the long-term
Land
Social Forestry The Ministry of Environment and Forestry (KLHK) will distribute access to social forest management covering an area of
211,522 ha for 48,911 families with total permits of 134 Initial focus will be on 11 villages with a total area of 15.576 ha for 9,411 households
Agrarian Reform and Transmigration Land Legalization
Transmigration land of 220,000 ha and 3,800 ha under the National Agrarian Operation Project (PRONA) is ready to be legalized from a total of 4.5 million ha, while 23,000 ha of displaced land and 707,000 ha of forest disposal are also ready to be redistributed from a total of 4.5 million ha
The Land Object of Agrarian Reform (TORA) will be expanded to several provinces, including Banten, West Java, Central Java, Riau, West Kalimantan, West Sumatra, North Sumatra, and Maluku
Affordable Housing for the Urban Poor
Committed to housing development within urban areas that are well connected to the center of activity, economic resources and public transportation for the urban poor
Core housing policies, among others, include provision of land for affordable housing (land availability), implementation of Housing Scheme for MBR (social housing), and the Housing Financing Scheme
Three Key Pillars and “Quick Win” Programs
Oppor
-tunity Targeted
Developmentof Key Sectors
Focused on addressing issues related to the tax system, development of manufacturing and IT industries and retail sector
Improve the competitiveness of the retail sector and strengthen synergies between traditional and modern retail
Human C
apital
Vocational Training and Labour Markets
Vocational and labor policies structured for capacity building of human resources, especially to align with industry needs and to support government priority programs
Policy steps will be taken by the government to draft and improve on the road map for vocational education and training, through reclassification and prioritization of business fields and positions
Job matching program that will focus on strengthening vocational programs for industries
Vocational schemes in place for the automotive, tourism and transportation sectors

9
The Economic Policy Packages
“To improve national industry competitiveness, export and investment to generate significant economic growth”
Phase III (7 Oct ’15)Boosting investment, spurring exports, and maintaining people‘s purchasing power
Phase IV (15 Oct ’15)Simplifying wage formula and expanding loans for small business
Phase V (22 Oct ’15)Improving industry and investment climate through tax incentives and deregulation on sharia banking
Harmonizing Regulations Simplifying Bureaucratic Process Ensuring Law Enforceability
Phase VI (5 Nov ’15)Stimulating economic activities in border areas and facilitating strategic commodities availability
Phase I (9 Sept ’15)Improving national industry competitiveness
Phase II (29 Sept ’15)Easing permit requirement and simplifying export proceeds requirement
Phase VII (7 Dec ’15)Stimulating business activities in labor-intensive industries nation-wide through incentives in the form of accelerating land certification process for individuals
Phase VIII (21 Dec ’15)Resolving land acquisition disputes, intensifying domestic oil production, stimulating domestic parts and aviation
industries
Phase IX (27 Jan ’16)Accelerating electricity generation, stabilizing meat prices
and improving rural–urban logistics sector
Phase X (11 Feb ’16)Revising the Negative investment List and
improving protection for SMEs
Phase XI (29 Mar ’16)Stimulating national economy through facilitation to
SMEs and industries
Phase XII (28 Apr’16)Improving Indonesia’s rank on Ease of Doing Business (EODB)
Phase XIII (24 Aug ’16)Low Cost Housing for Low-Income Communities
Phase XIV (10 Nov ’16)Roadmap for E-commerce
Source: Coordinating Ministry for Economic Affairs
Phase XV (15 Jun ’17)Development of Business and Competitiveness
of National Logistics Service Providers

10
Boosting the Competitiveness through Logistical Efficiency..15th Economy Policy Package has been launched
Source: Coordinating Ministry for Economic Affairs
Policy Goals and Benefits
Strengthen the Institution
of the Indonesia National
Single Window (INSW)
Provide Market Opportunities
for Shipping Companies,
Marine Insurance, and National
Ship Maintenance Businesses
Increase Competitivenes
of Logistic Service
Providers
Policy Targets
1
2
3
4
5
Import duty for 115 types of ship’s spare parts and components 0%
Opportunities for national shipping to serve export and import transportation of around
USD 600 million/year
70-100 units of new ships worth USD 700 million
New employment opportunity of
2,000 sailors
Improve the Regional Government’s role in development of Regional Logistics
System to control inflation and reduce post-harvest product damage up to 30%

11
Thematic Policy Issues on Deregulation
Next Phase of Policy Packages based on Sectoral and Thematic Issues
Six policy issues under Packages I-XV:
improvement of
industry competitiveness
improvement of
society’spurchasing power
widening of
investment
expansion of
export
efficiency of
logistics sector
improvement of
tourism sector
Education and Vocational Training
Logistics Agrarian reform Energy
Industry, Manufacture, Tourism, Fishery & Service
sectorFood
Invention, Innovation and Creative Economy
Source: Coordinating Ministry for Economic Affairs

12
Progress of the Economic Policy Packages*
Initially, there are 233 regulations which need to be deregulated
As of July 3rd, 2017, deregulation of 215 regulations arefinished (97%), comprising 50 regulations at Presidentiallevel and 165 regulations at Ministrial/Institutional level
Unfinished regulations: Proposed Policy on Developmentof Business and competitiveness of National LogisticsService Providers
I–XII
215SET 97%
11REVOKEDREGULATIONS
7ON GOINGDISCUSSION 3%
170TOTAL 165
MINISTRIAL/INSTITUTIONAL LEVEL
97%
47 42SELESAI
PRESIDENTIAL52TOTAL 50 FINISHED
PRESIDENTIAL LEVEL
96%
I–XV
FINISHED
I–XII233TOTAL INITIALREGULATIONS I–XV
I–XII222TOTALREGULATIONS I–XV
Based on the further assessment, 11 regulations has been revoked from deregulation process
Total regulation subject to be deregulated: 222regulations
Source: Coordinating Ministry for Economic Affairs
*as of July 5th, 2017

13
Other Progress on Economic Policy Packages
14 Provinces have set 2016 Minimum WageSystem in accordance to the GovernmentRegulation (GR) No. 78/2015 (KepulauanRiau, Kalimantan Barat, Nusa TenggaraBarat, Sumatera Barat, Jambi, Aceh,Kalimantan Selatan, Banten, Gorontalo,Nusa Tenggara Timur, Jawa Barat, Bali,Sumatera Utara, and Bangka Belitung)
Fair, Simplified & Projectable Wage System
State-owned train manufacturer PT IndustriKereta Api (INKA) in Madiun, East Java, hasbegun its first passenger train exports byshipping 15 train wagon to Bangladesh.
Export-Oriented Business Credit (KURBE)
Development of Spesial Economic Zone (SEZ)
• Total value of facilities and incentives forSEZs amounted IDR 33.8 trillion (as ofSeptember 2016)
• 18 companies benefitted from thesimplification of fiscal incentive processwith average processing time of 13.4days (previously 2 years)
• North Sulawesi has sucessfully exportedcoconut product through SOEs’ jointprogram
• 30 Bonded Logistic Center has beenlaunched to support various industries
Deregulation on Logistics Sector

14
Improving Investment Climate…implement 3-hour investment licensing service to complement the One Stop Service (OSS)
BKPM
• Arrive at OSS at BKPM directly from the airport
• Consult with Director of Investment Service
• Submit the required documents & data
Requirement for utilizing 3-hour Investment Lisencing Service:
No requirements for investment in infrastructure sector
9 documents obtained
Wait at the lounge while documents are processed by BKPM, in-house notary, ministries, & other government institutions
Obtain eight documents & letter of land availability within three hours to start the business
• RPTKA/Employment plan• IMTA/Working permit
• Investment license• Certificate of incorporation• NPWP/Tax Registration Number• TDP/Company Registration
• APIP/Import identification• NIK/Customs registration
• Letter of land availability
Certainty to start a business
Certainty to Import capital goods
Certainty to work Accurate land information
1. Minimum investment of IDR 100 billion (USD 8 million) and/or employing 1,000 local workers.
2. Application must be submitted directly by at least one candidate of the proposed company stakeholder
2 documents needed
• ID Card• And/or Deed of Establishment (Indonesian company) orArticle of Association (Foreign company)
• Containing workflow from raw material production to thefinished products
Investor identitiy as the prospective shareholders
Flowchart of business activities workflow
Source: Investment Coordinating Board (BKPM)
Until March 2017, 313 projects* have utilized the “3 hours services”
* Since January 2016, including 12 projects in EMR sector

15
Improving Investment Climate…implement 3-hour investment licensing service for Energy and Mineral Resources Sector
Director arrives at central OSS, then submit required documents*
Waiting in priority lounge, while the documents processed
1 2 3
Applicant receive the requested licensing products
Note *: ESDM3J service is given if the company has fulfilled the checklist of administrative & technical requirements as regulated on MEMR Ministrial Decree No.15 of 2016
9 Types of licensing issued by ESDM3J service
No. Type of Licensing Duration for reguler service (work days)
1 Temporary Business License for Electricity
20
2 Temporary Business License for Oil/Fuel/LPG storage
32
3 Temporary Business License for Storage of Processed Products/CNG
32/40
4 Temporary Business License for LNG Storage
32
5 Temporary Business License for Oil Refinery
32
6 Temporary Business License for Processing Oil Residue Industry
32
7 Temporary Business License for Natural Gas Processing
32
8 Temporary Business License for General Trade of Oil/Fuel
40
9 Temporary Business License for General Trade of Processed Product
40
Source: Investment Coordinating Board (BKPM)
Until March 2017, 12 projects have utilized the 3 hours services for EMR Sector

16
Improving Investment Climate…implement Direct Construction Permit to attract investment in Industrial Estates
Direct Construction (KLIK)
No Requirements• No minimum investments or workers is
required. • Available for 32 selected industrial estates.• Construction permits can be obtained in
parallel with construction process.
Investors can directly start their project construction beforeobtaining construction permits. This service is supported byboth Central and Regional Governments which become thefirst step to synergize between central and local licensing
Obtain investment licence at OSS at national or regional level.
• Survey a land within selected industrial estates.
• Acquire the land for your industry.
• Start the construction of your project. No other permits are required.
• Apply for building construction permit & environmental permit, in parallel with construction process.
Priority Investment Service
Until May 2017, 90 projects have utilized the “KLIK services”
Source: Investment Coordinating Board (BKPM)

17
Improving Investment Climate…Direct Construction Permit is expanded to 32 Industrial Estates (IE) throughout Indonesia
1
Banten(3 IE; 3,150 ha)
1. Modern Cikande Industrial Estate/MCIE (1,800 ha)
2. Wilmar Integrated Industrial Park/WIIP (800 ha)
3. Krakatau Industrial Estate Cilegon/KIEC (570 ha)
West Java (5 IE; 1.151 ha)
1. Bekasi Fajar Industrial Estate/BFIE (300 ha)
2. Delta Silicon 8 (158 ha)3. Karawang Internasional
Industrial City/KIIC (293 ha)
4. Suryacipta City of Industry/SCI (300 ha)
5. GT Tech Park @ Karawang (100 ha)
Central Java (3 IE; 840 ha)
1. Kendal Industrial Park/KIP (700 ha)
2. Bukit Semarang Baru/BSB (40 ha)
3. Wijayakusuma Industrial Estate/KIW (100 ha)
East Java (1 IE; 1,761 ha)
KI Java Integrated Industrialand Port Estate/JIIPE(1,761 ha)
North Sumatera (1 IE; 100 ha)
Medan Industrial Estate/KIM(100 ha)
South Sulawesi (1 IE; 3,000 ha)
Bantaeng Industrial Park/BIP(3,000 ha)
KLIK 1st Stage (14 IE)
KLIK 2nd Stage (18 IE)
1
2 3 45
63
56
7
1
2
3
4
5
6
East Java(2 IE; 341 ha)
1. IE Maspion (151 ha)2. IE Tuban (190 ha)
East Kalimantan(1 KI;133.8 ha)
IE Kariangau (133.8 ha)
Riau Island(5 IE; 556 ha)
1. Batamindo Industrial Park (61.4 ha)
2. Bintang Industrial Park II (20 ha)
3. Kabil Integrated Industrial Estate(142.5 ha)
4. Bintan Inti Industrial Estate (229.6 ha)
5. West Point Maritim Industrial Park (102.5 ha)
West Java(6 IE; 1,814.1 ha)
1. Artha Industrial Hill(315.1 ha)
2. Greenland International Industrial Center(GIIC)/Deltamas (400 ha)
3. Jababeka Tahap III(45 ha)
4. Kota Bukit Indah Ind. City (510 ha)
5. Indotaisei Kota Bukit Indah (300 ha)
6. Marunda Center (300 ha)
Central Java(1 IE; 285.7 ha)
IE Demak (285.7 ha)
2
1
Riau(1 IE; 198.9 ha)
IE Dumai (198.9 ha)
2
4
DKI Jakarta(2 IE; 129 ha)
1. Kawasan Berikat Nusantara/KBN (118.6 ha)
2. Jakarta Industrial Estate Pulagadung/JIEP (10.4 ha)
3
6
4
7
5
Source: Investment Coordinating Board (BKPM)

18
(Pusat Logistik Berikat/PLB) is afacility provided by Ministry ofFinance as part of theimplementation of the2nd Economic Policy Package.
PLB facility aims to improveefficiency and reduce the cost oftransportation and logistics inIndonesia; support the growth ofthe domestic industry, includingsmall and mediumindustries; increaseinvestment; and to makeIndonesia to become a logisticshub in Asia Pacific.
To date, 30 Bonded Logistic Center has beenlaunched to support various industries.
Improving Investment Climate…Bonded Logistic Center to Improve Indonesia’s Competitiveness
Oil and gas, and mining industry
Food & beverages industry
Auto-motive industry
Personal care/
home care industry
Textile (cotton) industry.
Small and medium industry
Synthetictextile
(chemical substances) industry.
Bonded Logistic Center

19
Improving Investment Climate …revising the Negative Investment List
1 For total project value of IDR10bn and above
Before
Cold storage Restaurants, Bars Pharmaceutical Raw Materials Manufacturing
Sports Center,Film Processing Lab, Crumb Rubber
Revision of "Partnership" category to refer to partnership with Micro, Small and Medium Enterprises
(MSMEs)
Grandfather Law: If a particular sector is tightened in future, existing foreign investor does not need to
comply with tighter stake
Key Reforms in Negative Foreign Investment List
Strengthen implementation of negative investment law through
active roles from ministries, agencies and regional governments
100% 49% 100%51%
100% 85% 100%
95%100%
33%67%
51%67%
67%55%
67%65%
67%
Distribution, Warehousing Private Museum, Catering, apparel Manufacturing, Exhibitions &
Conventions
Toll Road Operator, Telecommunication Testing Company
Consultancy for Construction1Telecommunication Provider with Integrated Services
Professional Training, Golf Course Management, Air Transport Support Services,
Travel Bureau
After Before After Before After Before After
Before After Before After Before After
Before After Before After Before After
33%
49%
Introduction of New Foreign Ownership Regulation for Strategic Sectors
Source: Investment Coordinating Board (BKPM)

20
Improving Investment Climate …improving Indonesia’s Rank on Ease of Doing Business (EODB)*
EODB 2017 Rank
EODB 2016 Rank
Change in Rank
EODB 2017 Points
EODB 2016 Points
Change in Points
Overall 91 106 15 61.52 58.51 3.01
Starting a business 151 167 16 76.43 67.51 8.92
Dealing with Construction Permit 116 113 3 65.73 65.26 0.47
Getting Electricity 49 61 12 80.92 77.60 3.32
Registering Property 118 123 5 55.72 53.24 2.48
Getting Credit 62 70 8 60.00 55.00 5.00
Protecting Minority Investors 70 69 1 56.67 56.67 0
Paying Taxes 104 115 11 69.25 64.47 4.78
Trading Across Borders 108 113 5 65.87 63.53 2.34
Enforcing Contracts 166 171 5 38.15 35.37 2.78
Resolving Insolvency 76 74 2 46.46 46.48 0.02
- Government efforts to boost business growth through deregulations and de-bureaucratization have been recognized by the improvement of EODB- Structural reforms will continue including in the budget and real sectors
Source: World Bank
* Higher rank is better, EoDB 2017 was published in October 2016

21
Improving Investment Realization (Q2-2017)
IDR tn
2013 2014 2015
Rising Direct Investments
2016
Mining
Wood Industry
Rubber and Plastic IndustryMetal, Machinery &
Electronic Industry
US$100.6 mn
US$62.7 mn
US$137.3 mn
US$1006.3 mn
US$1131.2 mn
US$705.3 mn
Food Industry
35.7%
US$437.1 mn
102.7%
26.6%
40.8%
1.5%
6.8%
87.6%
Investment Realization
Textile Industry
US$76.1 mn
20.9%
FDI Realization by Sectors
Source: Investment Coordinating Board (BKPM), compared to Q2-2016 period
2017
Rp145.4 T
Rp159.4 T
IDR99.4tnIDR109.9tn
IDR52.2tn
434,463
9.6% 15.6%
10.6% 16.9%
Q1-2016 Q1-2017
Q2-2016 Q2-2017
Q1-2016Q1-2017
Q2-2016 Q2-2017
*
* person
375,982IDR151.6tn
IDR170.9tn
12.7%Q2-2016 Q2-2017
IDR61tn
Trade & Reparation
Non MetallicMineral Industry
110
61
171
0
20
40
60
80
100
120
140
160
180
Q1 Q2 Q3 Q4 Q1 Q2 Q3 Q4 Q1 Q2 Q3 Q4 Q1 Q2 Q3 Q4 Q1 Q2
FDI DDI TOTAL

Economic Factor:Strong and Stable Growth Prospects Remain Intact
Section 2

23
Conducive Environment Underpinning Strong Growth Fundamentals
Largest Economy in South East
Asia
4th Most Populous country
in the World; 64% in
productive age
Manageable Inflation Rate
Growing Middle Income Class
From commodity-based to manufacturing and service sectors via infrastructure
development
From consumption-led to investment-led growth via a stronger manufacturing sector
and more investment initiatives
Policies to maintain purchasing power to stimulate domestic economy in the midst of weakening macroeconomic conditions
Budget reform as a part of larger economic reform
initiative
Tax base to be broadened from
one reduce dependency on commodities
Fuel subsidies significantly reduced and
spending redirected to more productive
allocation
Prudent debt management
Reform-Oriented Administration
Three main sources of financing for investment needs: State and regional
budget, State Owned Enterprises and PPP
Continuing from 2015 policy, infrastructurewill be higher than fuel subsidy
Fiscal and non-fiscal incentives to attract infrastructure investment and promote PPP
Infrastructure spending focused on basic infrastructure projects
Large and Stable
Economy
Consistent Budget Reform
New Economic Structure
High Infrastructure Investments

24
Indonesia’s Strong GDP
Growth ProspectGDP Growth Based on Expenditures (%, YoY)1
Strong GDP Growth1
By expenditure2014 2015 2016 2017
Q1 Q2 Q3 Q4 Tot. Q1 Q2 Q3 Q4 Tot. Q1 Q2 Q3 Q4 Tot. Q1
HH. consumption 5.2 5.2 5.1 5.1 5.1 5.0 5.0 5.0 4.9 5.0 5.0 5.1 5.0 5.0 5.0 4.9
Non profit HH. consumption
23.2 22.4 5.8 (0.5) 12.2 (8.1) (8.0) 6.6 8.3 (0.6) 6.4 6.7 6.6 6.7 6.6 8.0
Government consumption
6.1 (1.8) 1.2 0.9 1.2 2.9 2.6 7.1 7.1 5.3 3.4 6.2 (2.9) (4.0) (0.1) 2.7
Gross Fixed Cap. Formation
5.4 4.0 4.4 4.1 4.4 4.6 4.0 4.9 6.4 5.0 4.7 4.2 4.2 4.8 4.5 4.8
Exports 3.1 1.5 4.9 (4.4) 1.1 (0.7) (0.3) (0.9) (6.4) (2.1) (3.3) (2.2) (5.6) 4.2 (1.7) 8.0
Imports 5.1 0.4 0.2 3.0 2.1 (2.6) (7.4) (6.6) (8.7) (6.4) (5.1) (3.2) (3.7) 2.8 (2.3) 5.0
GDP 5.1 4.9 4.9 5.0 5.0 4.8 4.7 4.8 5.2 4.9 4.9 5.2 5.0 4.9 5.0 5.0
%
Institutions2017 GDP growth
(%YoY)
2017 R-Budget Plan 5.2
Bank Indonesia 5.0-5.4
IMF 5.1
World Bank 5.2
ADB 5.1
Consensus Forecast (July 2017) 5.2
Favourable GDP Growth Compared to Peers2
1. Source: Central Bureau of Statistics of Indonesia (BPS)2. Source: World Economic Outlook Database - April 2017; * indicates estimated figure
%QoQ YoY
-5,0
-3,0
-1,0
1,0
3,0
5,0
7,0
9,0
2012 2013 2014 2015 2016 2017* 2018*
Brazil India Indonesia Malaysia
Philippines Singapore Thailand Turkey
0,04
3,83 3,27
(2,07)
(0,17)
3,75 3,30
(1,70)
(0,40)
4,01 3,13
(1,77) (0,34)
5,12 4,94 4,93 5,05 4,82 4,74 4,77 5,17 4,92 5,18 5,01 4,94 5,01
-3,0
-1,0
1,0
3,0
5,0
7,0
Q1 Q2 Q3 Q4 Q1 Q2 Q3 Q4 Q1 Q2 Q3 Q4 Q1
2014 2015 2016 2017

25
Strong and Stable GDP Performance
Contributors to GDP Growth by Sector (%, YoY)
Spatial GDP Growth
By sectors2014 2015 2016 2017
Q1 Q2 Q3 Q4 Tot. Q1 Q2 Q3 Q4 Tot. Q1 Q2 Q3 Q4 Tot. Q1
Agriculture, forestry, and fishery 5.2 4.9 3.6 3.3 4.2 3.8 6.5 2.9 1.6 3.8 1.5 3.4 3.0 5.3 3.3 7.1
Mining (1.2) 0.7 0.7 1.5 0.4 0.6 (3.6) (4.4) (6.0) (3.4) 1.2 1.2 0.3 1.6 1.1 (0.5)
Industrial processing 4.5 4.9 5.0 4.2 4.6 4.1 4.2 4.6 4.4 4.3 4.7 4.6 4.5 3.4 4.3 4.2
Construction 7.2 6.5 6.5 7.7 7.0 6.0 5.4 6.8 7.1 6.4 6.8 5.1 5.0 4.2 5.2 6.3
Big traders, wholesale, retail 6.1 5.1 5.2 4.4 5.2 3.8 1.6 1.4 3.7 2.6 4.1 4.1 3.6 3.9 3.9 4.8
Transportation and warehousing 7.0 7.6 7.7 7.2 7.4 5.8 5.9 7.3 7.7 6.7 7.9 6.9 8.3 7.9 7.7 7.6
Information and communication 9.9 10.7 9.8 10.1 10.1 9.7 9.3 10.6 9.2 9.7 7.6 9.3 9.0 9.6 8.9 9.1
Financial service and insurance 3.6 5.5 1.9 7.9 4.7 8.6 2.6 10.4 12.8 8.6 9.3 13.6 9.0 4.2 8.9 5.7
Other Services 8.4 9.5 9.5 8.4 8.9 8.0 8.1 8.1 8.2 8.1 7.9 7.9 7.7 7.7 7.8 8.0
GDP 5.1 4.9 4.9 5.0 5.0 4.8 4.7 4.8 5.2 4.9 4.9 5.2 5.0 4.9 5.0 5.0
Java: 58.5%
Sumatera: 22.0%
Maluku & Papua: 2.5%
Sulawesi: 5.9%
Kalimantan: 8.3%
Bali & Nusa Tenggara: 3.0%
Spatial GDP Growth Contribution
SumateraGDP GrowthQ1 2017: 4.1%
JavaGDP GrowthQ1 2017: 5.7%
KalimantanGDP GrowthQ1 2017:4.9% Sulawesi
GDP GrowthQ1 2017:6.9%
Maluku & PapuaGDP GrowthQ1 2017: 4.2%
Bali & Nusa TenggaraGDP GrowthQ1 2017: 2.4%

External Factor:Improved External Resilience
Section 3

27
-0,33
1,96
1,63
-3,0
-2,0
-1,0
0,0
1,0
2,0
3,0
1 3 5 7 9 11 1 3 5 7 9 11 1 3 5 7 9 11 1 3 5 7 9 11 1 3 5 7 9 11 1 3 5
2012 2013 2014 2015 2016 2017
OG Non-OG Total
-
3
6
9
12
15
-
20
40
60
80
100
120
140
1 3 5 7 9 11 1 3 5 7 9 11 1 3 5 7 9 11 1 3 5 7 9 11 1 3 5 7 9 11 1 3 5
2012 2013 2014 2015 2016 2017
FX Reserves (LHS) Month of Import & Debt Service (RHS)
Month
A Narrower, Structurally-Stronger Current Account Deficit
Improving Current Account DeficitStrong Balance of Payments
Supported by Substantial FX Reserves to Mitigate External ChallengesTrade Balance Surplus Continues
Source: Bank IndonesiaSource: Bank Indonesia
US$bn US$bn 2015:CA Deficit(US$17.5bn)
2012:CA Deficit(US$24.4bn)
2013:CA Deficit(US$29.1bn)
2014:CA Deficit(US$27.5bn)
US$bn
(7.5)
(1.4)
5.7
0.8
(2.4)
Source: Bank Indonesia
FX Reserves as of June 2017: US$123.09bn (Equiv. to 8.5 months of imports + servicing of government debt)
US$bn
2016*:CA Deficit(US$16.9bn)
Source: BPS
* Preliminary Figure ** Very Preliminary Figure
0
40
80
120
160
-20
-10
0
10
20
Q1 Q3 Q1 Q3 Q1 Q3 Q1 Q3 Q1* Q3* Q1*
2012 2013 2014 2015 2016* 2017**
Current Account Capital & Financial Account
Overall Balance Reserve Assets (RHS) -12
-8
-4
0
4
8
Q1 Q3 Q1 Q3 Q1 Q3 Q1 Q3 Q1* Q3* Q1*
2012 2013 2014 2015 2016* 2017**
Goods Service Income Secondary Inc. Current Account
121.8
7.9
4.5
(2.4)
US$bn 2015:Surplus
US$7.59bn
2012:Deficit
(US$1.79bn)
2013:Deficit
(US$4.10bn)
2014:Deficit
(US$2.37bn)
2016: Surplus
US$8.83bn
2017: Surplus
US$7,63bn*

28
2,85
1,55
1,37
1,30
1,15
1,13
0,92
0,8
0,17
0,00
-0,12
-0,38
-2,70
0,33
1,59
0,33
0,20
-1,43
0,55
-0,27
0,51
-0,04
-0,11
-1,29
-2,14
-2,45
-3,5 -2,5 -1,5 -0,5 0,5 1,5 2,5 3,5
ZAR
EUR
THB
TRY
JPY
CNY
MYR
SGD
IDR
INR
PHP
KRW
BRL
Point to Point Average
Exchange Rate In Line with Fundamentals
Stable Movement of Rupiah
Point-to-point, the rupiah strengthened 1.08%(ptp) to close at a level of Rp13,328/USD. Theappreciation was bolstered by the ongoing FXsales by corporations and a considerably largeinflux of foreign capital into the domesticmarket, and also in line with the appreciation inthe regional currencies.
Rupiah Exchange Rate Fared Relatively Well Compared to Peers
Source: Bank Indonesia
IDR/US$
*data as of June 30th, 2017
YTD 2017* vs 2016 June vs May 2017
*data as of June 30th, 2017 *data as of June 30th, 2017% %11,17
9,60
2,14
1,62
1,60
-0,19
-2,19
-4,88
-5,57
-16,85
5,09
-1,60
5,18
5,61
5,39
1,08
7,96
-1,72
4,51
0,08
-20,0 -15,0 -10,0 -5,0 0,0 5,0 10,0 15,0
ZAR
BRL
INR
THB
KRW
IDR
EUR
PHP
MYR
TRY
Point to Point Average
1332813361
13338 13345
13304
13321
13298
1334813309
13.200
13.250
13.300
13.350
13.400
13.450
13.500
3-Jan
11-Jan
19-Jan
27-Jan
4-Feb
12-Feb
20-Feb
28-Feb
8-M
ar
16-M
ar
24-M
ar
1-Apr
9-Apr
17-Apr
25-Apr
3-M
ay
11-M
ay
19-M
ay
27-M
ay
4-Jun
12-Jun
20-Jun
IDR/USD Monthly Average Quarterly Average

29
Ample Lines of Defense Against External Shocks
Ample level of FX reserves to buffer against external shock
FX Reserves as of June 2017: US$123.09 billion
South Korea Renewed a 3 year KRW/IDR swap arrangement with the size of up to 10.7 tn KRW/IDR115 tn in March 2017
Australia Established a 3 year A$/IDR swap arrangement with the size of up to A$10 bn or IDR100 tn in Dec. 2015
Chiang Mai Initiative
Multilateralization (CMIM)
Agreement
Entitled to a maximum swap amount of US$ 22.76 bn under the ASEAN+3 (Japan, China, and Korea) FX reserves pool created under the agreement
Came into effect in 2010 with a pool of US$120 bn
Doubled to US$240 bn effective July 2014
Japan US$22.76 billion swap line with Japan currently in place
The size of the swap line was increased from US$12 bn in December 2013
IMF Global Financial Safety
Net - GSFN
Indonesia is entitled to access IMF facilities for crisis prevention to address potential (actual) BOP problem
Such facilities include Flexible Credit Line (FCL) and Precautionary and Liquidity Line (PLL)
Bilateral
Regional
Global
FX Reserve
Ample Reserves
Swap Arrangement
Source: Bank Indonesia

30
Measures to Manage External Volatility
Pre-emptive Measures
Implementing Crisis Management Protocol (CMP)
Implementing Bond Stabilization Framework (BSF)
Enhancing coordination between government institutions and continuous dialogue with market participants
Specific policies in place to address crises enacted in 2017 budget law
Swap facility arrangements based on international cooperation
Crisis Management Protocol
Indicators to determine crisis level of Government Securities Market condition (normal, aware, alert, crisis)
Several market indicators that are monitored daily:
- Yield of benchmark series;- Exchange rate;- Jakarta Composite Index;- Foreign ownership in government securities
Policies to address the crisis at every level :
‐ Repurchase the government securities at secondary market
‐ Postpone or stop the issuance
First Line of Defense
State’s Budget
Buyback fund at DG of Budget Financing and Risk Management
Investment fund at Public Service Agency (BLU) (min. level Aware)
State Owned Enterprises’s Budget
Related SoE (min. level Aware)
Social Security Organizing Agency (BPJS)’s Budget
BPJS (min. level Aware)
Second Line of Defense
State’s Budget
State General Treasury Account (Rekening KUN) (min. level Alert)
Accumulated cash surplus (SAL) (min. Level Crisis)
State Owned Enterprises’s Budget
Related SoE (min. level Alert)
Social Security Organizing Agency (BPJS)’s Budget
BPJS (min. level Alert)
Bond Stabilization Framework
Source: Ministry of Finance

31
Comply Not Comply
2,257 (93.3%) 161
(6.7%)
Comply Not Comply
2,170 (89.7%)
248
(10.3%)
0
50
100
150
200
250
300
350
400
0
50
100
150
200
250
300
2013 2015 Feb
2016*
Apr
2016*
Jun
2016*
Aug
2016*
Oct
2016*
Dec
2016*
Feb
2017*
Apr
2017*
Public (Govt. & BI) Private Total (RHS)
Strengthened Private External Debt Risk Management
(US$bn)
Source: External Debt Statistics of Indonesia, July 2017 Source: Moody’s Statistical Handbook, May 2017
Regulation Key PointsPhase 1
Jan 1,2015 –Dec 31,2015
Phase 2Jan 1,2016 –Dec 31,2016
Phase 3Jan 1, 2017 and beyond
Object of Regulation Governs all Foreign Currency Debt
Hedging Ratio
< 3 months 20%* 25%**
> 3 – 6 months 20%* 25%**
Liquidity Ratio ( < 3 months) 50% 70%
Credit Rating Not applicable Minimum rating of BB-
Hedging transaction to meet hedge ratio
not necessarily be done with a bank in Indonesia
Must be done with a bank in
Indonesia
Sanction As of Q IV-2015 Applied
External Debt / GDP (%)(US$bn)
Debt Burden Indicator (External Debt / GDP) Remains Comparable to PeersPrivate External Debt is Stabilizing and Trending Down
Encouraging Corporates Compliance on Hedging Ratio
(%)
> 3 – 6 months< 3 months
Total Ext. Debt: US$334bn
Private Sector Ext. Debt:US$165bn
Source: Bank Indonesia* Provisional Figures
26,2
26,5
33,3
36,1
37,4
46,1
26
24,6
36,4
34,1
34
47,1
0 5 10 15 20 25 30 35 40 45 50
India
Philippines
Thailand
Indonesia
Brazil
Turkey
2016 2015
Q1-2017 (Total = 2,418) Q1-2017 (Total = 2,418)

32
Manageable External Debt Profile...short term non-bank corporate debt (non affiliation) represents only 8.9% of total private external debt
Private
Short-Term1
Private Non-Bank
External DebtPosition
Affiliation
Non Affiliation
US$118.8bnor
71.9%of Private Ext.
Debt
US$19.9bnor
12.0%of Private Ext. Debt
US$11.9bnor
7.2%of Private Ext. Debt
US$14.7bnor
8.9%of Private Ext. Debt
Public Long Term 1 Private Bank
US$26.5bnor
16.1%of Private Ext. Debt
US$165.2bnor
49.5%of total Ext. Debt
US$46.4bnor
28.1%of Private Ext. Debt
External Debt Position as of May 20171 Based on remaining maturity
Source: External Debt Statistics of Indonesia, July 2017
US$333.6bn
US$168.4bnor
50.5%of Total Ext.
Debt

Fiscal Performance and Flexibility:More Fiscal Stimulus with Prudent Fiscal Policy
Section 4

34
Integrated Reform to Provide Higher Quality of Economic Growth...synergy between authorities to drive economy navigating the challenges
• Productive and realistic budget• Credible budget execution
• Policy to maintain consumption and improve investment climate
• Economic policy packages
• Inflation management • Monetary policy to ensure
macroeconomic and financial system stability
• Macro-prudential policies
Fiscal
Real SectorMonetary & Financial Sector
Synergy in reform to boost the more sustainable
and inclusive growth
Source: Ministry of Finance

35
Long Term Strategies to Achieve Sustainable Growth…stimuli to maintain purchasing power
Consumption is still the largest contributor to Indonesia’s
GDP
Private consumption has been a key factor driving
Indonesia’s economic growth in recent years
The government has designed stimulus program to
maintain and enhance purchasing power for households
The government has increased non-taxable income level
and adjusted wage policy to ensure that the lowest
income bracket has the greatest support
Funds are targeted at not only to improve basic village
infrastructure but also to create jobs through labor
intensive projects as well as other job creation programs
u
Fuel price and electricity adjustment
Predictable labourwages
Boosting housing
development
Elimination of luxury goods tax for consumer
goods
2 months addition of rice subsidy program
Rural transfer for productive spending
Ease of land certification and licensing for street vendors
Maintaining Purchasing
Power
Increase non-taxable income limit
Stabilized price for meat
products
The Virtuous Cycle of Purchasing Power Stimuli
36
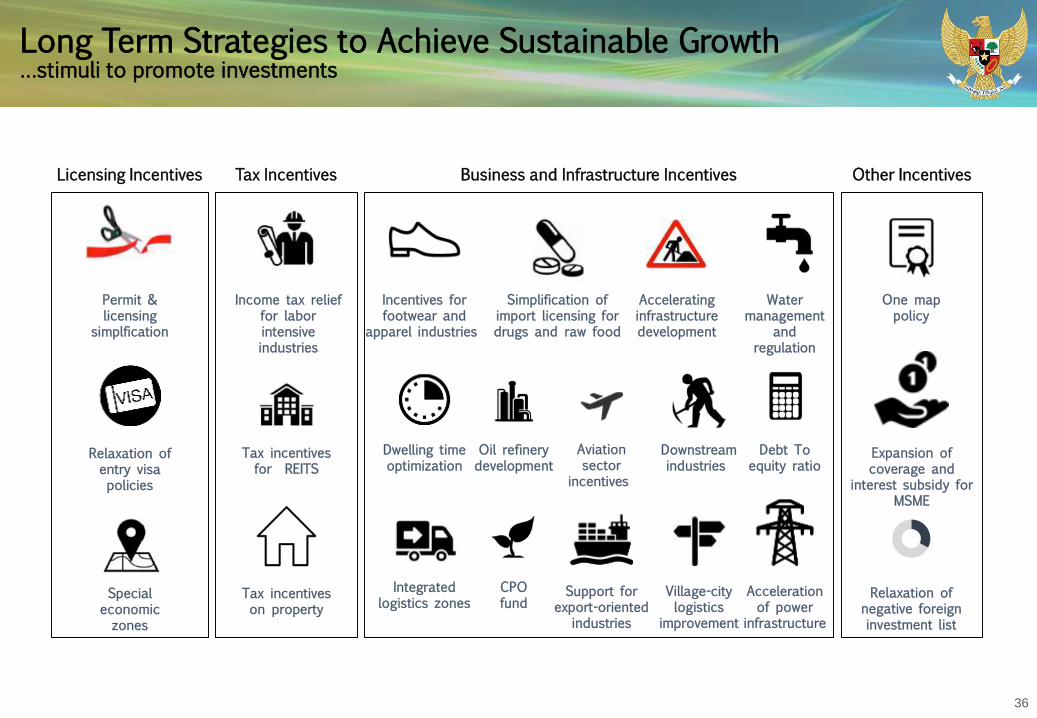
Long Term Strategies to Achieve Sustainable Growth…stimuli to promote investments
Licensing Incentives Tax Incentives Other IncentivesBusiness and Infrastructure Incentives
Tax incentives on property
Special economic zones
Relaxation of negative foreign investment list
Integratedlogistics zones
CPOfund
Support forexport-oriented
industries
Village-citylogistics
improvement
Accelerationof power
infrastructure
Income tax relief for labor intensive industries
Permit & licensing
simplfication
One map policy
Incentives forfootwear and
apparel industries
Simplification ofimport licensing fordrugs and raw food
Acceleratinginfrastructuredevelopment
Water management
and regulation
Tax incentives for REITS
Relaxation of entry visa policies
Expansion of coverage and
interest subsidy for MSME
Dwelling timeoptimization
Oil refinerydevelopment
Aviationsector
incentives
Downstreamindustries
Debt Toequity ratio

37
Building a Credible and Realistic Budget…providing more certainty to all stakeholders
Indicator2016 2017
Realization¹ Budget June Real. R-Budget4
Economic growth (%, yoy) 5.02 5.1 5.012 5.2
Inflation (%, yoy) 3.02 4.0 4.37 4.3
3-Month Treasury Bill (SPN) (%) 5.7 5.3 5.1 5.2
Exchange Rate (Average, IDR/USD, Avg. YTD) 13,307 13,300 13,331 13,400
ICP (USD/barrel) 40 45 48.9 50.0
Oil Production (thousand barrel/day) 829 815 784.23 815.0
Gas Production (thousand barrel oil equivalent/day) 1,180 1,150 1,0943 1,150
3. Data as of May 20174. Approved by Budget Committee of Parliament
Macroeconomic Assumption for 2017 R- Budget
Source: Ministry of Finance1. Audited2. Q1 GDP Growth
• Credible and realistic budget with 2016 outlook numbersused as the basis for the 2017 State Budget
• Q1 2017 realization has been on track with the budget,relative to Q1 2016
• Tax revenue in 2016 grew 3.6%, which includes IDR103.1 trn from the tax amnesty program, which hasfurther increased to IDR 134.8 trn as of Q1 2017
• Budget prioritizes efficiency in terms of operationalspending, without compromising capital spending
• Exemplifies discipline in maintaining budget deficit atreasonable levels
Description (IDR Trillion)
2016 2017
AuditedRealization
Budget R-Budget∆ R-Budget to
Budget1H Realization
% Realization to Budget
A. Revenues and Grants 1,555.9 1,750.3 1,736.1 (14.2) 718.2 41.0%
I. Domestic Revenue 1,546.9 1,748.9 1,733.0 (15.9) 718.0 41.0%
1. Tax Revenue 1,284.9 1,498.9 1,472.7 (26.2) 571.9 38.2%
2. Non Tax Revenue 262.0 250.0 260.2 10.2 146.1 58.4%
II. Grants 9.0 1.4 3.1 1.7 0.2 15.5%
B. Expenditure 1,864.3 2,080.5 2,133.3 52.8 893.3 42.9%
I. Central Government Expenditure 1,154.0 1,315.5 1,367.0 51.5 498.6 37.9%
1. Ministerial Spending 684.2 763.6 773.1 9.5 263.9 34.6%
2. Non Ministerial Spending 469.8 552.0 593.9 41.9 234.6 42.5%
II. Transfer to Region and Village Fund 710.3 764.9 766.3 1.4 394.8 51.6%
1. Regional Transfer 663.6 704.9 706.3 1.4 360.4 51.1%
2. Village Fund 46.7 60.0 60.0 - 34.4 7.3%
C. Primary Balance (125.6) (109.0) (178.0) (69.0) (68.2) 62.6%
D. Surplus (Deficit) (308.3) (330.2) (397.2) (67.0) (175.1) 53.0%
% of GDP (2.49) (2.41) (2.92) (0.51) (1.29)
E. Financing 334.9 330.2 397.2 67.0 209.4 63.4%

38
A More Realistic 2017 Tax Revenue Target…taxation policies are directed at expanding the tax base and increase compliance
Source: Ministry of Finance
Target
1,472.7IDR 26,2 trillion lower than 2017 budget
R-Budget 2017:
2014:
1,146.8
2015:
1,240.5
2016:
1,285.0
Budget 2017:
1,498.9
8,2
3,6
6,8
16,0
IDR 41,8 T
IDR 1.241,8 T
IDR 189,1 T
↑ IDR 5,8 T (16,2%)
↓ IDR 2,1 T (-1,1%)
Tax Collection Growth (yoy, %) Comparison between 2017 R-Budget with 2017 Budget
Tax Revenue (in IDR Trillion)• Tax collection in 1H2017 has been higher by 9.6% than 1H2016
• Tax collection growth target has been adjusted from 16.0% to 14.6% in order to be more credible
• Optimization of post tax amnesty program and tax treaty, tax audit, as well as law enforcement are expected to support tax collection
14,6
↓ IDR 29,9 T (-2,4%)

39
Indonesia’s Tax Amnesty Program – A Success StoryWith more than 965,000 taxpayers participating in the program
Source: Ministry of Finance
Tax Amnesty Result (as of the end of March 31st, 2017)
Redemption Money Assets Declared
114,2
18,8
1,7
Preliminary Evidence Payment
1%
Redemption Money85%
Tax Arrears Payment14%
Revenue
IDR 134.8tn (~1.1% GDP)
3.323,36
861,81
594,99
85,59
Individuals 68%
Individual SMEs18%
Companies12%
SMEs2%
Composition of Participants
Based on Asset Declared
0,040,15
0,20
0,62
1,10
0,58
0,170,12
0,04
Germany
(2004)
Belgium
(2004)
Italy
(2009)
Chile
(2015)
Indonesia
(2016)
India
(1997)
South
Africa
(2003)
Spain
(2012)
Australia
(2014)
% o
f GDP
2,13,9
8,3
39,3
5,23,6
0,3
India(1997)
Spain(2012)
Chile(2015)
Indonesia(2016)
Italy(2009)
SouthAfrica(2003)
Australia(2014)
% o
f GDP
3,698
1,036
147,1
Onshore Declaration
76%
Offshore Declaration
21%
Repatriation3%
Asset Declared
IDR 4,881tn (~39.4% of GDP)

40
Comprehensive Tax Reform to Improve and Sustain Revenue CollectionFocused on expanding taxpayer database, improving business processes, revising regulations and strengthening support system
56.2%
59.2%60.4%
62.3%
49%
54%
59%
64%
0
10
20
30
40
2013 2014 2015 2016
Registered Taxpayers
Registered Taxpayers – Tax Report Required
Submitted Tax Report
Compliance Rate = Submitted Tax Report/Registered Taxpayers-Tax Report Required
Expected Tax Revenue / GDP Increase (%) Ongoing Comprehensive Tax Reform on 4 Pillars
Compliance Rate in Submitting Annual Tax Report
Source: Ministry of Finance
Human Resources
BusinessProcess
• Improvement of the humanresources andorganizational capacity andcapabilities
• Establishment of tax reformtask force team
• Discipline in terms of Plan-Do-Check-Action to monitortax collection
• Stronger law enforcement• Authorization to gather 3rd
party data (banking)• Implementation of
Automatic Exchange of Information
• Simplification of tax registration
Regulation
• General Provision and Tax Procedures
• VAT Law• Income Tax Law• Stamp Duty Law
IT Support
• Improvement of IT and communication system
• Increased accessibility of public data for individual data management
• Enhancement of data management
11,2 11,4 11,3 10,8 10,7 10,411,5
0
5
10
15
2011 2012 2013 2014 2015 2016 2017 Budget

41
Regional Revenue and Expenditure Profile…effective expenditure policy as a tool to promote equality across Indonesia
SUMATERA
Revenue 141.1
a. Tax 66.9
b. Custom & Excise 6.8
c. Non Tax Revenue 70.4
Expenditure 232.3
a. Transfer to Region 176.1
b. Ministerial Spending
56.2
Nett (88.2)
JAVA
Revenue 1.143.2
a. Tax 884.9
b. Custom & Excise 161.6
c. Non Tax Revenue 96.6
Expenditure 302.8
a. Transfer to Region 201.8
b. Ministerial Spending
101
Nett 840.4
BALI & NUSRA
Revenue 15.5
a. Tax 11.7
b. Custom & Excise 1.5
c. Non Tax Revenue 2.3
Expenditure 56.4
a. Transfer to Region 39.5
b. Ministerial Spending 17.0
Nett (40.9)
KALIMANTAN
Revenue 86.0
a. Tax 32.0
b. Custom & Excise 1.1
c. Non Tax Revenue 52.9
Expenditure 93.9
a. Transfer to Region 73.7
b. Ministerial Spending
20.3
Nett (7.9)
SULAWESI
Revenue 19.7
a. Tax 16.6
b. Custom & Excise 0.6
c. Non Tax Revenue 2.5
Expenditure 104.5
a. Transfer to Region 73.3
b. Ministerial Spending 31.2
Nett (84.8)
PAPUA & MALUKU
Revenue 18.4
a. Tax 10.7
b. Custom & Excise 1.7
c. Non Tax Revenue 6.0
Expenditure 89.6
a. Transfer to Region 71.7
b. Ministerial Spending 17.9
Nett (71.3)
Notes:1. Average data 2014 - 20162. Revenue amount collected from certain region for central government budget3. Expenditure amount spent for certain region from central government budget4. Figure in IDR trillion
Source: Ministry of Finance

42
Maintaining Productive and Effective Spending PoliciesContinue the efficiency of operational expense and increase the priority expenditures
Ministerial Spending
798.6 T↑ IDR 35.0 T from 2017 Budget
Operational ExpenseEfficiency
↓ 16.0 T
Additional Priority
Spending
↑ 48.2 T
UN Mission to Center Africa
Preparation for Regional Election and 2019 General Election
Land Certification
Asian Games 2018
Development program of agriculture and horticulture
Non Ministerial Spending
568.4 T↑ IDR 17.4 from 2017 Budget
%Interest Payment
219.2 T↓ Rp2,0 T from 2017 Budget
Energy Subsidy
89.9T↑ Rp12,5 T from 2017 Budget
Non Energy Subsidy
79.0T↓ Rp3.7 T from 2017 Budget
2017 R-Budget

43
2016 Budget Realization Did Not Impede Priority ProjectsAlthough deficit was capped at manageable level, infrastructure development continued to accelerate
Infrastructure Realization1 Infrastructure Development Achievement in 2016
Food Security Realization
0
100
200
300
400
Budget Realization Budget Realization
Ministerial Spending Non Ministerial Spending Regional Transfer Financing
290.3256.2
317.2
267.0
2015: 88.2% of budget 2016: 84.9% of budget
IDR tn
0
50
100
150
200
Budget Realization Budget Realization
Ministerial Spending Non Ministerial Spending Regional Transfer Financing
2015: 87.5% of budget 2016: 84.3% of budget
IDR tn
125.9110.3 117.9
99.3
Road Development (km)Target: 3,149.6Realization: 2,528.7
AirportTarget: 15 (up to 2019)Realization: 3
Bridge (km)Target: 12.9Realization: 10.6
Railway2 (km)Target: 114.9Achievement: 114.9
DamTarget: 37Achievement: 37
Irrigation (km)Target: 4,889Achievement: 1,025
Source: Ministry of Finance1. Not including LRT South Sumatra and Jabodetabek2. Land issues are in progress

44
Education and Health Spending Well Delivered in 2016Investment to improve social welfare in the longer term
Education Expenditure Health Expenditure
Immunization for infants between 0 – 11 monthsRealization: 4 million infantsTarget 4 million infants
University scholarships for underprivileged students (Bidikmisi)Realization: 324 thousand college studentsTarget: 332 thousand college students
Health Insurance Subsidy (PBI)Realization: 91.1 million peopleTarget 92.4 million people
School Operational Assistance (BOS)
Realization: 8.0 million students
Target: 8.2 million students
Vaccine availability in Community Health Centre (Puskesmas)
Realization: 81.5%
Target 80.0%
School Rehabilitation
Realization: 28,400 rooms
Target: 30,300 rooms
Malaria EradicationRealization: 247 citiesTarget 245 cities
Indonesia Smart Card (KIP)Realization: 20.7 million students
Target: 19.5 million students Accredited Regional Hospital
Realization: 201 hospitalsTarget 190 hospitals
0
100
200
300
400
500
600
Budget Realization Budget Realization
Ministerial Spending Non Ministerial Spending Regional Transfer Financing
0
20
40
60
80
100
120
Budget Realization Budget Realization
Ministerial Spending Non Ministerial Spending Regional Transfer Financing
2016: 88.9% of budget
408.5 390.2 416.6370.5
2015: 88.1% of budget
2016: 88.6% of budgetIDR tn
74.867.0
104.1
92.32015: 95.5% of budget
IDR tn
Source: Ministry of Finance

45
Better Targeting of Subsidy Policy in 2017...more budget allocated to non energy subsidy and priority programs to improve basic services
BidikmisiScholarship
0
50
100
150
200
250
300
350
400
450
2009 2010 2011 2012 2013 2014 2015 2016 2017
Budget
IDR tn
416.1
2,7 2,83,0
2,7 2,83,3
3,8
5,0 5,0
0,0
1,0
2,0
3,0
4,0
5,0
6,0
0
50
100
150
200
2009 2010 2011 2012 2013 2014 2015 2016 2017
Budget
Budget % of R-Budget
IDR tn %
Basic & complete immunization for 92% of 0-11 months old infants
Immunization
94.4 million people
Health Insurance Subsidy (PBI)
Stunting prevention to 29.6% of children below 2
years old
Stunting Prevention
700 regencies
Community Health Centre (Puskesmas)
6.7 million people
Family Plan Program (KB)
Budget for Education Program Budget for Health Program
360.5 thousandscollege students
19.5 million students
Indonesia Smart Card (KIP)
101,100 teachers10,200 lecturers
Certification
School Rehabilitation
41,128 rooms8.5 million students
School Operational Assistance (BOS)
107 Colleges/Universities
Operational Assistancefor Colleges

46
Improved Budget Allocation Between Central & Local Government…promoting better allocation of budget spending to local government
65.85%
22.67%
0.98%
2.65%
7.85%
Gradually increasing Village Fund allocationAverage allocation of IDR800.5 million per
village
Village Fund (IDR60.0 tn)
Improving efficiency and effectiveness of Special Autonomy & DIY Fund.
Special Autonomy & D.I Yogyakarta - DIY (IDR20.2 tn)
Incentive Fund (IDR7.5 tn)
Minimum of 25% (IDR125.9 tn) earmarked for public service
facility development acceleration. It provides revenue sharing fund to promote equal opportunity for
natural resource producers & high tax earners
General Transfer Fund (IDR494.0 tn)
Special Transfer Fund allocation is based on eachregions’ proposal and national priorities
Special Transfer Fund (IDR184.6 tn)
Incentive Fund allocation has been increased (317 regions were awarded an incentive ranging between IDR 7.5bn and IDR 65. 3bn)
• Implementation of policy to allocate spending to regions
• Minimum 25% of general transfer fund has to be used for public service infrastructure
2017 Transfer to Regions and Village Funds (R-Budget) Transfer to Regions/Village Funds & Ministerial Spending
IDRtn2013
Audited2014
Audited2015
Audited2016
Audited
2017 Budget
2017 R-Budget
Transfer to Region 513.3 573.7 602.4 663.6 704.9 697.7
Village Fund - - 20.8 46.7 60.0 58,2
Total Intergovernmental Transfer
513.3 573.7 623.2 710.3 764.9 755.9
Ministerial Spending 582.9 577.2 732.1 677.6 763.6 769.2
Source: Ministry of Finance

47
Policy of Infrastructure Spending and Transfer to Regions…developing the nation through targeted spending
In 2017, minimum 25% of general transfer fund has to be used for public service infrastructure
Kalimantan
2016 : 2,889.92017 : 3,641.6
2016 : 597.92017 : 634.5
2016 : 2,694.42017 : 4,117.1
2016 : 606.22017 : 1,042.6
2016 : 3,749.12017 : 3.686.3
2016 : 1,680.22017 : 1,941.7
Sumatera
2016 : 3,895.42017 : 3,545.7
2016 : 1,044.82017 : 1,320.4
2016 : 3,229.42017 : 3,257.8
2016 : 461,12017 : 1,147.5
2016 : 661.32017 : 1,207.3
2016 : 101.1 2017 : 308.2
Java
76
86
114.2
145.5
168,5
154,1
256,1
317,1
387,3
8,1 8,3 8,89,8 10,2
8,7
14,215,2
18,6
0
5
10
15
20
0
100
200
300
400
500
2009 2010 2011 2012 2013 2014 2015 2016 2017
%IDR tnAnggaran Infrastruktur
% thd Belanja Negara (RHS)
Infrastructure budget
% of total state expenditure (RHS)Maluku & Papua
Sulawesi
Bali & Nusa Tenggara
Infrastructure Budget Allocation 2017 Infrastructure Budget Allocation (IDR billion) and
2016 realization
2017 Construction Target
Road DevelopmentTarget: 815 km
AirportTarget: 13
BridgeTarget: 9,399 m
RailwaysTarget: 550 km
SeaportTarget: 55 locations
Bus stationTarget: 3 locations
Source: Ministry of Finance

48
Financing Policy 2017: General Objective & Policy
To conduct active debt
portfolio
To manage debt-to-GDP ratio
To o
ptimize
the use
of
external
and
domestic
loans T
o
optim
ize
curre
ncy
mix o
f issu
ance
General Policy
To support market development
To enhance public accountability as part of transparent Government debt management
To meet financing needs at optimum cost and tolerable
risk
Source: Ministry of Finance

49
Budget Financing Breakdown in 2017
Debt (Gross)
IDR735.6tn
(eq. USD 55.2bn)
Redemption
IDR350.9tn
(eq. USD 26.3bn)
Budget Financing
IDR330.2tn
(eq. USD 24.8bn)
Non-Debt Financing
IDR54.5tn
(eq. USD 4.1bn)
USD/IDR: 13,323 as of 31 May 2017
Note: Subject to change in market conditions and other factors
Breakdown of budget financing IDR tn USD bn
Government debt (net) 384.7 28.9
Government securities (net) 400.0 30.0
Domestic loans (net) 1.5 0.1
Foreign loans (net) -16.8 -1.3
Source: Ministry of Finance

50
Government Securities: Indicative Financing Plan for 2017…prudent and sustainable fiscal management
Government Issuance Targets International Bonds
• Issuance of internationalbonds as a complement toavoid crowding out thedomestic market;
• Consists of USD, YEN orEURO global bonds;
• International bond issuancecan be maximized up to25% from gross target,depends on financing need
Domestic Bonds
Weekly Auction:
Conventional securities 24 x
Islamic securities 24 x
Non-Auction:
Retail bonds
Private Placement Based on request
Front Loading Issuance For Budget Financing
• Pre-funding to optimize cost ahead of potential Fed rate hike
• Anticipate developments in global environment
• Government Securities target for 1st semester 2017 is 57.4% from
gross issuance target
• Government Securities target in Rupiah for 1st semester 2017 is
42.7% from gross issuancce target
Debt Securities
71%
Sukuk29%
Average Tenor Maturity (ATM) for Government Securities: 6-8 years
Composition
Domestic 79%
Auction 93%
Non-Auction 7%
International Bond 21%
Source: Ministry of Finance
Instruments
Budget
Indicative Target (IDR trn)
Indicative Target (USD bn)*
Government Securities (Net) 399.99 30.03
Government Securities (Gross) 684.83 51.42
* USD/IDR: 13,323 as of 31 May 2017

51
Sound Government Debt Portfolio ManagementPortfolio management characterized by stable debt/GDP ratio and well-diversified debt
Stable Debt to GDP Ratio Over the Years
Weighted Average Debt Maturity of ~8.9 Years** (As of June 2017)
US$ bn
Remarkable Debt Reduction Initiative Over the Past 10 Years
Change in Debt to GDP Ratio (2007 – 2017) (%)
Source: IMF World Economic Outlook Database, April 2017
Well Diversified Across Different Currencies
% of Yearly Issuance
Government Debt / GDP (%)
Source: Ministry of Finance
Source: Ministry of FinanceSource: Ministry of Finance
*Based on 2016 realization, ** Using GDP assumption in 2016 R-Budget, ***SDR, AUD, and other
140,76 136,27 155,24 174,7206,95 220,98
63,76 56,6154,47
54,74
54,3754,6523
24,9 24,727,4 28,3 28,1
0
5
10
15
20
25
30
0
50
100
150
200
250
300
2012 2013 2014 2015 2016* May 2017
Securities (LHS) Loans (LHS) Gross Debt/GDP (%) (RHS)
9,79,6
9,7
9,4
9,08,9
8,0
8,3
8,5
8,8
9,0
9,3
9,5
9,8
10,0
2012 2013 2014 2015 2016 Jun-17
Years
56% 53% 57% 56% 58% 59%
24% 29% 29% 31% 30% 29%
14% 12% 9% 8% 7% 7%3% 3% 3% 3% 4% 4%3% 3%
2% 2% 1% 1%
2012 2013 2014 2015 2016 Jun-17
IDR USD JPY EUR Others***
113,56
93,46
55,08
52,33
40,31
27,32
16,18
-2,75
-8,43
-12,88
-21,94
-27,07
-40,00 10,00 60,00 110,00
Russia
South Africa
Vietnam
Mexico
Malaysia
Brazil
Thailand
Argentina
India
Indonesia
Turkey
Philippines

52
Well Balanced Maturity Profile With Strong Resilience Against External Shocks
Declining Interest Rate Risks
Debt Maturity Profile
Declining Exchange Rate Risks
Upcoming Maturities (Next 5 Years)
IDR tn
1 Variable Rate Ratio is defined as ratio between debt instruments with variable rate divided by total debt instruments (variable + fixed rates)2 Refixing Rate ratio is defined as ratio between debt instruments with variable rate + debt instruments with fixed rate maturing in 1 year divided by total debt instruments (variable + fixed rates)*Preliminary Figures **Using GDP assumption in 2017 Budget.
Source: Ministry of Finance
16,2 16,014,8
13,712,3
11,2
22,5 23,2
21,0 20,7
17,819,3
0
5
10
15
20
25
2012 2013 2014 2015 2016* Jun-17
Variable Rate Ratio¹ Refixing Rate²
%
10,2 11,7 10,7 12,2 11,7 11,0
44,446,7
43,4 44,541,8 40,8
0
10
20
30
40
50
2012 2013 2014 2015 2016* Jun-17
FX Debt to GDP Ratio** FX Debt to Total Debt Ratio
%
101
201
189
116
140
107
98
168
45
126
100
53 100
29
124
66
52
97
5
90
22
22
7 15 26
23
20 28
0
44
110
135
112 123
128
103
88
116
88
71
46
21
20
18
17
16
12
29
5
23 28
2
1
1 31
21 28
27
39
0
50
100
150
200
250
300
2017 2019 2021 2023 2025 2027 2029 2031 2033 2035 2037 2039 2041 2043 2045
IDR-Denominated Other Currencies
2046-2055
7,2 8,6 7,7 8,46,6
9,1
21,5 21,8 20,1 21,4 23,0 23,5
32,4 33,4 33,9 34,736,5
39,1
0,0
10,0
20,0
30,0
40,0
50,0
2012 2013 2014 2015 2016* Jun-17
In < 1 year In < 3 year In < 5 year
%

53
Profile of Total Central Government Debt
Foreign Ownership of Government Securities at Longer Tenors
Holders of Government IDR Bonds – Composition June 2017
Government Debt Outstanding
(%)
(%)
Source: Ministry of Finance
34,34 31,18 29,96 25,87 24,19 23,84 22,01 21,14 20,67 19,62
65,66 68,82 70,04 74,13 75,81 76,16 77,99 78,86 79,33 80,38
199,48 204,51 194,55 209,41 214,88 229,40 255,14 258,03 265,98 278,29
0
50
100
150
200
250
300
0
10
20
30
40
50
60
70
80
90
100
2011 2012 2013 2014 2014 2015 Jun-16 Des-16 Jan-17 Jun-17
Loan (LHS) Government Securities (LHS) Total (RHS)
(%) USD bn
11,9 7,8 5,2 4,6 3,2 2,7 3,5 3,4 5,2 5,4
25,019,3
18,3 18,913,1 13,7
23,1 19,8 18,6 22,5
63,2 72,8 76,5 76,4 83,7 83,6 73,4 76,8 76,1 72,1
30,833,0 32,5
38,1 38,2 39,1 37,5 37,8 38,2 39,5
0
20
40
60
80
100
2011 2012 2013 2014 2015 Jun-16 Des-16 Jan-17 Mar-17 Jun-17
0-1 1-5 >5 Foreign Ownership to Total
30,8 33,0 32,5 38,1 38,2 38,9 39,1 37,5 37,8 37,5 38,2 39,0 39,1 39,5
32,6 30,5 33,830,8
37,9 31,338,9 39,9 34,9 34,5 35,5 35,0 34,6
40,1
36,63 36,53 33,70 31,0423,95 29,81
21,95 22,5 27,27 28,03 26,22 26 26 20,4
0
20
40
60
80
100
2011 2012 2013 2014 2015 Jan-16 Jun-16 Dec-16 Jan-17 Feb-17 Mar-17 Apr-17 May-17 Jun-17
Foreign Holder Domestic Non Banks Domestic Banks

54
Ownership of IDR Tradable Central Government Securities
1) Non Resident consists of Private Bank, Fund/Asset Manager, Securities Company, Insurance Company and Pension Fund.2) Others such as Securities Company, Corporation, and Foundation.*) Including the Government Securities used in monetary operation with Bank Indonesia.**) net, excluding Government Securities used in monetary operation with Banks.
(IDR tn)
Source: Ministry of Finance
Description Dec-14 Dec-15 Jun-16 Dec-16 Jun-17
Banks* 375.55 31.04% 350.07 23.95% 361.54 21.95% 399.46 22.53% 399.19 20.45%
Govt Institutions (Bank Indonesia**)
41.63 3.44% 148.91 10.19% 150.13 9.12% 134.25 7.57% 175.89 9.01%
Bank Indonesia (gross) 149.07 9.05% 157.88 8.90% 180.28 9.23%
GS used for Monetary Operation
-1.05 -0.06% 23.63 1.33% 4.39 0.22%
Non-Banks 792.78 65.52% 962.86 65.87% 1135.18 68.93% 1239.57 69.90% 1377.15 70.54%
Mutual Funds 45.79 3.78% 61.60 4.21% 76.44 4.64% 85.66 4.83% 91.56 4.69%
Insurance Company 150.60 12.45% 171.62 11.74% 214.47 13.02% 238.24 13.43% 254.21 13.02%
Foreign Holders 461.35 38.13% 558.52 38.21% 643.99 39.10% 665.81 37.55% 770.55 39.47%
Foreign Govt's&CentralBanks
103.42 8.55% 110.32 7.55% 118.53 7.20% 120.84 6.81% 131.94 6.76%
Pension Fund 43.30 3.58% 49.83 3.41%64.67
3.93%87.28
4.92% 89.11 4.56%
Individual 30.41 2.51% 42.53 2.91% 48.90 2.97% 57.75 3.26% 60.49 3.10%
Others 60.51 5.00% 78.50 5.37% 86.72 5.27% 104.84 5.91% 111.23 5.70%
Total 1,209.96 100% 1,461.85 100% 1,646.85 100% 1,773.28 100% 1,952.23 100.00%

55
Government Securities Realization
(IDR mn)
Source: Ministry of Finance
Budget 2017Budget Realization (a.o. Jun. 22, 2017)
% Realization to Budget 2017
Government Securities Net 399,992,586 253,339,039 63.34%
Government Securities Maturing in 2017 and Buyback 284,842,264 141,754,317 49.77%
Issuance Need for 2017* 684,834,850 395,093,356 57.69%
Government Debt Securities (GDS) 273,214,088
IDR Denominated GDS 213,173,000
-Coupon GDS 107,130,000
-Conventional T-Bills 105,650,000
-Private Placement 393,000
-Retail Bonds -
International Bonds 60,041,088
-USD GMTN 47,197,500
-Euro GMTN -
-Samurai Bonds 12,117,580
-Domestic Foreign Denominated Bonds 726,008
Government Islamic Debt Securities 121,879,267
Domestic Government Islamic Debt Securities 81,910,267
- IFR/PBS/T-Bills Sukuk (Islamic Fixed Rated Bond/Project Based Sukuk) 65,872,957
- Retail Sukuk 14,037,310
- Private Placement 2,000,000
Global Sukuk 39,969,000
*Adjusted with issuance related to cash management realization

56
Positive Response of Government Securities Issuance in 2016
Global Conventional Bond Global Sukuk Euro-Denominated Bonds Samurai Bonds
Tenure 10 yr 30 yr 5 yr 10yr 7 yr 12 yr 3 yr 5 yr
Pricing Date December 8th, 2015 March 29th, 2016 June 14th, 2016 June 21st , 2016
Nominal US$ 2.25 bnUS$ 1.25
bnUS$0.75 bn US$1.75 bn EUR 1.5 bn EUR 1.5 bn JPY62 bn JPY38 bn
Coupon Rate 4.75% 5.95% 3.40% 4.55% 2.625% 3.750% 0.83% 1.16%
Yield 4.80% 6.00% 3.40% 4.55% 2.772% 3.906% 0.83% 1.16%
Incoming Bid US$8.1 bn US$8.6 bn EUR 8.4 bn JPY100 bn
• The average incoming bids in 2016 was
IDR18.81tn/auction, higher than 2015
(IDR14.05tn/auction);
• The average awarded bids in 2016 was
IDR9.44tn/auction, higher than 2015
(IDR6.75tn/auction);
• Bid to cover ratio of government securities issuance
in 2016 was 1.99 times (2015 was 2.08 times).
IDR bn
Increasing Incoming Bids in 2016’s Government Securities Issuance
Incoming Bid 2016 Bid to Cover Ratio 2016 (RHS)Awarded Bid 2016
Source: Ministry of Finance

Monetary and Financial Factor:Credible Monetary Policy Track Record and Favourable Financial Sector
Section 5

58
Bank Indonesia Policy Mix: July 2017
Holds the BI 7-day Repo Rate at4.75%
Deposit and credit growth are expected to increase, to reach the
range of 9-11% and 10-12%. The potential
growth, however, are still shadowed by a number
of risks, namely domestic demand
recovery prospects and developments in the banking consolidation.
Continues to strenghten
coordination with the central
government and regional
administrations, to keep inflation within it’s target corridor
Continues to stabilise Rupiah exchange rates in line with the
currency’s fundamental value, while maintaining
market mechanisms
Predicts 2017 domestic economic growth in the
5.0-5.4% range, supported by stronger export performance and
investment
The BI Board of Governors agreed on 19th and 20th July 2017 to hold the BI 7-days Repo Rate at4.75%, as well as the Deposit Facility at 4.00% and Lending Facility at 5.50%
Monitors closely various global risks,
especially coming from the US, including the planned FFR hike, the Fed’s plan to unwind its large balance
sheet, and uncertainties in the
fiscal policy.

59
Bank Indonesia Policy Mix: 2015-2017
14 Jan 2016• Cut BI Rate 25 bps to 7.25%, DF & LF Rate at 5.25% & 7.75%
• BI lower its monetary operation rates even further, ranging from 25bps to 45bps (O/N to 1Y)
19 Jan – 20 July 2017
Held BI 7-day RR Rate at 4.75%,
DF Rate at 4.00% and LF Rate at
5.5 %
20 Oct 2016Cut BI 7-day RR Rate to
4.75%, DF and LF Rate to 4.00% and
5.50%
19 Aug 2016• Held BI 7-day RR Rateand DF Rate at 5.25%and 4.5%
• Cut LF Rate to 6.00%.
16 Jun 2016• Cut BI Rate 25 bps to 6.5%, DF & LF Rate at 4.5% & 7.0% respectively
• Relaxed the loan-to-value ratio (LTV) and financing-to-value ratio (FTV) on housing loans/financing
• Relaxed partially prepaid loans/financing
• Raised the floor on the Reserve Requirement - Loan to Funding Ratio (RR-LFR) from 78% to 80%, with the ceiling maintained at 92%. The change was effective on Aug. 2016
18 Mar 2016Cut BI Rate 25 bps to
6.75%, DF & LF Rate at 4.75% & 7.25%
17 Nov –15 Dec 2016Held BI 7-day RR Rate at 4.75%, DF
Rate at 4.00% and LF Rate at 5.5 %
22 Sep 2016Cut BI 7-day RR Rate to
5.0%, DF and LF Rate to 4.25% and
5.75%.
21 Jul 2016• Held BI Rate at 6.5%, & maintained BI 7-day RR Rate, DF & LF Rate at 5.25%, 4.5% & 7.00% respectively.
• BI continued to conduct financial market deepening by introducing new investment & hedging products in the financial market, strengthenedmonetary management strategies, & encouraged the real sector to make optimal use of repatriation funds to support the implementation of the 2016 Tax Amnesty Law
21 April 2016• Held BI Rate at 6.75%, and maintained DF & LF Rate at 4.75% & 7.25% respectively.
• Reformulated policy rate from BI Rate into the 7 day (Reverse) Repo Rate to improve the effectiveness of monetary policy transmission. The change was effective on Aug. 19th 2016
18 Feb 2016• Cut BI Rate 25 bps to 7%, DF & LF Rate at 5% & 7.5%
• BI lower the rupiah denominated primary reserve requirement by 1%, from 7.5% to 6.5%, effective from Mar. 16th 2016
17 Nov 2015Lowering IDR Primary RR by 50bps from
8.0% to 7.5%. Effective since 1 Dec 2015
26 Jun 2015• RR-LDR
RR-LFR• Accomodate
banks SMEs loan in RR calculation
18 Jun 2015• Increase the Loan-to-Value (LTV) ratio
• Reduce down payments for automotive loans

60
3,0
3,5
4,0
4,5
5,0
5,5
6,0
6,5
7,0
7,5
8,0
Jan-16 Mar-16 May-16 Jul-16 Sep-16 Nov-16 Jan-17 Mar-17 Mei-17 Jul-17
LF Rate BI Rate BI-7Day RR Rate DF Rate
11,17
9,60
2,14
1,62
1,60
-0,19
-2,19
-4,88
-5,57
-16,85
5,09
-1,60
5,18
5,61
5,39
1,08
7,96
-1,72
4,51
0,08
-20,0 -15,0 -10,0 -5,0 0,0 5,0 10,0 15,0
ZAR
BRL
INR
THB
KRW
IDR
EUR
PHP
MYR
TRY
Point to Point Average
Stable Monetary Environment Despite Challenges
Rupiah Exchange Rate Remains Comparable to Peers
YTD 2017* vs. 2016
Inflation Continues Under Controlled Strengthened Monetary Policy Framework
Source: Bank Indonesia
Credit Growth Supported by Macroprudential Policy
(%)
LF Rate: 7.00
LF Rate: 5.50
BI Rate: 6.50
BI 7Day RR Rate:4.75
DF Rate: 4.50
DF Rate: 4.00
19 August 2016
The New MonetaryOperation Framework
(YoY)
4,37
3,132,17
10,64
-1
4
9
14
19
1 3 5 7 9 11 1 3 5 7 9 11 1 3 5 7 9 11 1 3 5 7 9 11 1 3 5 7 9 11 1 3 5 7 9 11 1 3 5
2011 2012 2013 2014 2015 2016 2017
(%) CPI (%, yoy) Core (%, yoy) Volatile Food (%, yoy) Administered (%, yoy)
*data as of June 30th, 2017
%
8,7%
8,5%9,4%
8,3%
0%
5%
10%
15%
20%
25%
30%
35%
40%
1 3 5 7 9 11 1 3 5 7 9 11 1 3 5 7 9 11 1 3 5 7 9 11 1 3 5
2013 2014 2015 2016 2017
Total Growth Working Capital loansConsumption Loans Investment Loans

61
6 Measures to Control Inflation in 2017
On January 25th, 2017, the Government and Bank Indonesia agreed on six strategic measures to control inflation in 2017 within the targetcorridor of 4±1% (as well as in 2018 at 3.5±1%), while also setting the inflation targets for 2019-2021 at 3.5±1%, 3±1% and 3±1%respectively.
Those measures are needed to address several onerous domestic and external challenges that demand vigilance and early mitigations.The external challenges mainly stem from rising international commodity prices, while the domestic challenges stem from ongoingenergy reform through adjustments of electricity tariffs for 900VA subscribers as well as fuel prices as the global oil prices continues torise. The current aforementioned reform is warranted to ensure equitable development and to create more healthy fiscal space.
Maintaining volatile food (VF) inflation at 4-5% by:1 2 3
4 5 6
Strengthening infrastructure for food
logistics in local areas, particularly warehousing for
storage
Developing a commodity flow data system, specifically for food commodity
Utilising fiscal instruments and
incentives to extend the local government’s role in price stability
Dampening the second-round effect of Administered Price adjustments
Introducing Administered Price Sequencing
Establishing the National Inflation Control Team
Strengthening central and local government coordination
Through Eighth National TPID Coordination Meeting in July 2017
Strengthening the Bank Indonesia policy mix to maintain macroeconomic stability
Through Presidential Decree to strengthen the National Inflation Task Force (TPI) and Regional Inflation Task Forces (TPID)
Strengthening interregional cooperation
Encouraging diverse food consumption in the
community, especially of fresh chillies and alliums,
by fostering product innovation in the
processed foods industry
Accelerating connectivity infrastructure development
Improving planting patterns
Example: Controlling transportation fares
Including the planned conversion of several direct subsidies to cash transfers (fertilizer, rice for the poor and 3kg LPG)
3kg
Source: Bank Indonesia
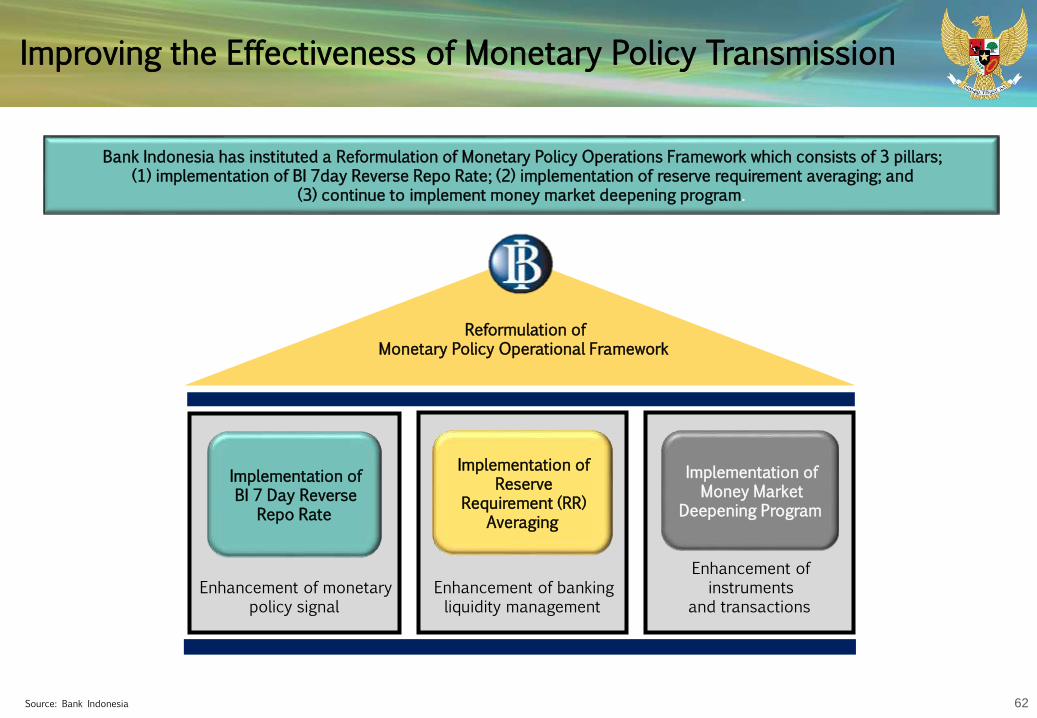
62
Improving the Effectiveness of Monetary Policy Transmission
Bank Indonesia has instituted a Reformulation of Monetary Policy Operations Framework which consists of 3 pillars; (1) implementation of BI 7day Reverse Repo Rate; (2) implementation of reserve requirement averaging; and
(3) continue to implement money market deepening program.
Enhancement of monetary policy signal
Enhancement of banking liquidity management
Implementation of BI 7 Day Reverse
Repo Rate
Implementation of Reserve
Requirement (RR) Averaging
Reformulation of Monetary Policy Operational Framework
Source: Bank Indonesia
Enhancement of instruments
and transactions
Implementation of Money Market
Deepening Program

63
Enhancement of Monetary Operations Framework...positive results thus far
• Can be traded among contributor banks for 10 minutes.
• Up to the amount of Rp10 billion.• Up to 1-month tenor.
• Can be traded among contributor banks for 20 minutes.
• Up to a total of Rp20 billion.• Up to 3-month tenor.
CURRENT JIBOR (as per June 1st, 2016)
PREVIOUS JIBOR
O/N 1W 2W 3W 1M 3M 6M 12M
JIBOR IBMM Repo FX Swap MO
IBMM: Interbank Money Market MO: Monetary Operation
Domestic Money Market Yield Curve (2nd week of July 2017)
Source: Bank Indonesia
Domestic money market yield curve tend to converge
Monetary operation term structure is being referred by money market rates

64
Introducing Reserve Requirement (RR) Averaging
The Purpose of RR Averaging
Previously, RR ratio is set at 6.5% (fixed) of the TPF (Third Party Fund) and to be maintain on daily basis. From 1 July 2017, the fulfilment method of RR has been adjusted to daily RR of 5% of TPF and average RR of 1.5% of TPF within
a fixed period
1 2 3
To provide flexibility in liquidity management
in order to increase bank efficiency
To function as an interest rate buffer in order to reduce
interest rate volatility in the money market
$
To provide space for liquidity placement
in order to boost financial market deepening
Source: Bank Indonesia

65
Financial Intermediation Improves in Early 2017
The growth of banking loans has improved from the previous year and is expected to further expand by 9-12% this year. In thedomestic capital markets, capital raising by corporations (particularly right issues and corporate bond issuance) remained strong.
Source: Financial Service Authority (OJK)
The growth of financing distributed by multifinance companies in May 2017 was still in an increasing trend
Gross premium revenue in the domestic insurance industry is also countinuously growing…
Capital raising through rights issues & corporate bond issuance in H1 - 2017 increased from the same period last year
The growth of banking loans was 8.71% (yoy) in May 2017
IDR tn
IDR tn
IDR mn
IDR tn
8.71%
0%
5%
10%
15%
20%
25%
0
1000
2000
3000
4000
5000
2012 2013 2014 2015 2016 Jan-17 Feb-17 Mar-17 Apr-17 May-17
Bank Loans YoY Growth (rhs)
9.24%
-5%
5%
15%
25%
35%
-50
50
150
250
350
450
2012 2013 2014 2015 2016 Jan-17 Feb-17 Mar-17 Apr-17 May-17
Financing YoY Growth (rhs)
12.14.1
67.153.8
116.2
84.7
0
20
40
60
80
100
120
140
2012 2013 2014 2015 2016 Jan-Jun 2017
IPO Equity
Rights Issue
Corporate Bonds & Sukuk
147
0
50
100
150
200
250
300
350
400
2012 2013 2014 2015 2016 Jan-May17

66
Financial Institutions Remain Robust and Less Vulnerable
Banking sector’s capital adequacy ratio (CAR) was maintained at a high level. As of May 2017, CAR & Tier 1 Capital was 22.86% & 20.08% respectively
Risk-based capital (RBC) of the insurance industry also remains high, well above the minimum threshold (120%)
Gearing ratio of multifinance companies was 3.03 times (well below the maximum requirement of 10 times), providing ample room for future growthProfitability of the banking sector is relatively stable
Domestic financial institutions exhibit generally robust condition. Capital adequacy is maintained well above the minimum requirements.Profitability and leverage are maintained at a sufficient level. Further, gearing (debt-to-equity) ratio of multifinance companies providesample room for future growth.
Source: Financial Service Authority (OJK)
22.86
20.08
0,0
5,0
10,0
15,0
20,0
25,0
2012 2013 2014 2015 2016 Jan-17 Feb-17 Mar-17 Apr-17 May-17
% CAR Tier-1 Capital
503%
281%
150%
180%
210%
240%
270%
300%
400%
450%
500%
550%
600%
650%
700%
May-16
Jun-16
Jul-16
Aug-16
Sep-16
Oct-16
Nov-16
Dec-16
Jan-17
Feb-17
Mar-17
Apr-17
May-17
RBC - Life Insurance RBC - General Insurance (rhs)
5.36
2.46
0
1
2
3
4
5
6
2012 2013 2014 2015 2016 Jan-17 Feb-17 Mar-17 Apr-17 May-17
%Net Interest Margin Return on Assets
3.03
1
2
3
4
2012 2013 2014 2015 2016 Jan-17 Feb-17 Mar-17 Apr-17 May-17

67
Adequate Liquidity, Manageable Credit Risks
Banks are equipped with adequate liquid assets to anticipate depositors’ withdrawal. Insurance industry also demonstrates an enhancedlevel of investment adequacy ratio. The non-performing loan/financing (NPL/NPF) ratio is also maintained below the threshold.
The ratio of liquid assets to deposits in the banking sector was well maintained at a high level.
As of May 2017, the gross & net NPL ratios of the banking sector were 3.07% & 1.33% respectively, maintained below the threshold
NPF ratio in the multifinance industry was 3.45% as of May 2017, maintained well below the 5% threshold
Investment adequacy ratio in the insurance industry is maintained above 100%
Source: Financial Service Authority (OJK)
88.85
18.58
6
10
14
18
22
26
60
70
80
90
100
110
Dec-16 Jan-17 Feb-17 Mar-17 Apr-17 May-17 Jun-17
%% Liquid Assets to Non-Core Deposits (lhs)
Liquid Assets to Deposit (rhs)
116.80
125.10
90
100
110
120
130
140
May-16
Jun-16
Jul-16
Aug-16
Sep-16
Oct-16
Nov-16
Dec-16
Jan-17
Feb-17
Mar-17
Apr-17
May-17
% Life Insurance General Insurance
1.33
3.07
0
1
2
3
4
2012 2013 2014 2015 2016 Jan-17 Feb-17 Mar-17 Apr-17 May-17
%NPL Net NPL Gross
3.45%
0%
1%
2%
3%
4%
2013 2014 2015 2016 Jan-17 Feb-17 Mar-17 Apr-17 May-17

68
Manageable Market Risk Amidst Fluctuations
Being exposed to market fluctuations, financial institutions demonstrated resiliency in dealing with such risks. Net open position ofthe banking sector remains low, while the investment value of domestic institutional investors (mutual funds, insurers, and pensionfunds) continues to increase.
Net open position in the banking sector was kept far below the maximum limit (20%)
The investment value of insurers & pension funds remained in an increasing trend
Multifinance companies’ exposures to foreign debt have generally been mitigated through hedging measures
The movement of mutual funds’ net asset value (NAV) is in line with that of market index, but with much lower volatility
Source: Financial Service Authority (OJK)
2.12
0
1
2
3
4
5
2012 2013 2014 2015 2016 Jan-17 Feb-17 Mar-17 Apr-17 May-17
%
4.600
4.800
5.000
5.200
5.400
5.600
5.800
6.000
260
280
300
320
340
360
380
400
Jun-16
Jul-16
Aug-16
Sep-16
Oct-16
Nov-16
Dec-16
Jan-17
Feb-17
Mar-17
Apr-17
May-17
Jun-17
Jul-17
IDR tnNAV of Mutual Funds (lhs) IDX Stock Composite Index (rhs)
868
244
100
150
200
250
300
550
600
650
700
750
800
850
900
May-16 Jul-16 Sep-16 Nov-16 Jan-17 Mar-17 May-17
IDR tnIDR tn
Investment of Insurers Investment of Pension Funds (rhs)162
85 60
80
100
120
140
160
May-16 Jul-16 Sep-16 Nov-16 Jan-17 Mar-17 May-17
IDR tnDomestic Debt Foreign Debt

69
Capital Market Demonstrate Strengthening Trend
In the middle of unfavorable global environment, the domestic capital markets continues its strengthening trend. The volatility of themarkets is relatively low.
Source: Bloomberg, IBPA, Indonesia Stock Exchange, Ministry of Finance
Both the stock & bond markets are in a strengthening trend in July 2017, with a low level of volatility
Despite FFR hike, the equity and government debt markets still attract nonresident inflows
The IDX Stock Composite Index continues to strengthen and is among the best-performing indices in the region (as of July 14th, 2017, ytd)
In line with the stabilizing IDR and improving domestic prospects, the government bond yields continued to decline
34,60
8,65-12,18
9,49
5,24
5,26
6,90
3,83
15,2814,12
19,95
10,10
19,16
2,26
11,24
-20 -10 0 10 20 30 40
TURKBRAZRUSAS
EUROJPNMALCHINPHILSINHKNINDO
KOREATHAI
WORLD
%
4.200
4.700
5.200
5.700
6.200
180
190
200
210
220
230
Jan-16
Feb-16
Mar-16
Apr-16
May-16
Jun-16
Jul-16
Aug-16
Sep-16
Oct-16
Nov-16
Dec-16
Jan-17
Feb-17
Mar-17
Apr-17
May-17
Jun-17
Jul-17
Comp Bond Index Comp Stock Index (rhs)
-9
-5-40
-20
0
20
40
60
80
100
120
2015
Jan-16
Feb-16
Mar-16
Apr-16
May-16
Jun-16
Jul-16
Aug-16
Sep-16
Oct-16
Nov-16
Dec-16
Jan-17
Feb-17
Mar-17
Apr-17
May-17
Jun-17
Jul-17
IDR tn
Gov't Debt Securities Equity
6
7
8
9
10
Jan-16
Feb-16
Mar-16
Apr-16
May-16
Jun-16
Jul-16
Aug-16
Sep-16
Oct-16
Nov-16
Dec-16
Jan-17
Feb-17
Mar-17
Apr-17
May-17
Jun-17
Jul-17
Yield (%)5-yr Yield 10-yr Yield 20-yr Yield

70
Maintaining Financial System Stability…maintaining resilience in confronting possible shocks and enhancing financial system stability
Strengthening financial sector supervision
Assessment on the soundness of financial institutions Liquidity coverage ratio for banks Regulations on risk management for financial
institutions Minimum capital requirement for banks Enhancement of GCG for financial institutions and
publicly-listed companies
Strengthening & structuring financial sector based on international standards
Risk-based supervision for all financial sectors Regulations on domestic systemically-important banks
and capital surcharge Enhancement of crisis management protocol and
interagency coordination
Financial conglomerates account for 66.96% of the total assets of financial sector…
Improving the integrated regulation & supervision framework…
Such improvement has become even more important due to the dominance of financial conglomerates in the domestic financial sector.
OJK has issued regulations on GCG, risk management, and minimum capital requirements for financial conglomerates. These will be followed by regulations on liquidity management, capital management, and intragroup transaction exposures.
Source: Financial Service Authority (OJK), March 2017
Financial Conglomerates66,96%
Others33,04%

71
A Comprehensive Financial Deepening Program...strategy to tackle challenges in deepening Indonesia’s financial markets
Source: Bank Indonesia
Financial Market Deepening Program
First Priority:Continuous Basis
Market Development Coordination
Monitoring, match making, and solution:• Repo
• Hedging
Money MarketEncourage well-functioning money market (deep and efficient, risk mitigation, and market integrity), through:• Bank Indonesia Regulation (PBI) on Negotiable Certificate of Deposit (NCD)
Enriching money market instruments, encourage banks to raise long term funding, and acts as an alternative investment for investors
• Bank Indonesia Regulation (PBI) on Commercial PaperAlternative sources of financing for non-bank corporations, as well as an investment outlet for investors
FX Market• Development roadmap of Indonesia CCP in OTC Derivatives
To support FX market development and reduce market segmentation.• Establish Local Currency Settlement Framework
Reducing dependency on USD payment for international trade.• Encourage product development to increase hedging Supply in domestic market
To provide hedging instrument alternative for corporations to manage their risk exposure
• Corporate Bonds
• Government Bonds
• Medium term notes
• Other instruments
• Infrastructure (ETP, etc)
Supporting Regulations
Money Broker Certification of Dealer and Code of ConductStrengthening JISDOR
• Increase the governance of money broker• Revitalize role of money broker in financial
market
• Obligation on certification for dealers• Obligation to honor code of conduct
• Dealers’ training for certification
• Strengthening the credibility of JISDOR• Extend the usage of JISDOR
Inter-agency Cooperation
On April 2016, the Minister of Finance, the Governor of Bank Indonesia, and the Chairman of the Board of Commissioners of the Financial Services Authority have launched a Coordination Forum for the Development Financing through Financial Market (FK-PPPK). The three authorities have agreed to formulate “The National Strategy to Develop Indonesian Financial
Market Towards 2025” which is expected to be concluded by the end of 2017/early 2018.

72
Progress on General Market Repo Agreement (GMRA)
4 Banks 74 Banks
4 Banks 47 Banks
IDR 0.0 IDR 1.0 – 4.6 tn
Signing
Transaction
Daily Volume
January 2016 March 2017
Source: Bank Indonesia

73
Continuous Program on Capital Market Deepening…continuously strengthened, including through capital market deepening initiatives
The utilization of capital markets by domestic corporations (including financial institutions) demonstrates an increasing trend
Strengthening market infrastructure
Expansion of Single Investor Identification (SID) coverage Development of electronic trading platform (ETP) in the
debt market Development of integrated investment management
system Enhancement of the clearing and settlement process Enhancement of capital market data warehouse
Enhancing the supply-side
Simplification of public-offering requirements & procedures
Development of financial market products (mutual funds, private equity funds, REITs, ABS)
Development of municipal bonds Cross-border offering (harmonizing regulations with
ASEAN Disclosure Standards established by ACMF)
Enhancing the demand-side
Expansion of the domestic investor base (conducting investor education programs)
Expansion of mutual fund distribution channels, including the marketing methods of securities companies
Strengthening governance
Development of market players’ capacity Enhancement of GCG for publicly-listed companies Development of repo regulations and infrastructure
Source: Financial Service Authority (OJK), July 2017
12.14.1
67.153.8
116.2
84.7
0
20
40
60
80
100
120
140
2012 2013 2014 2015 2016 Jan-Jun 2017
IDR tnIPO Equity
Rights Issue
Corporate Bonds & Sukuk

74
Macroprudential Policy Mix to Support Growth
Effective from August 29th, 2016, Bank Indonesia relaxed the Loan to Value Ratio (LTV) and Financing to Value Ratio (FTV) on
housing loans at 85-90% for the first mortgage lending facility, 80-85% for the second mortgage lending facility, and 75-80% for
the third mortgage lending facility. The relaxation is only applicable to banks with nett NPL for total loan below 5% and gross
NPL for property loan/financing below 5%.
Housing Loans and Financing Based on Murabahah and Istishna Contracts
Property type (m2)
Lending/Financing Facility
First Second Third
House
>70 m2 85% 80% 75%
22 - 70 m2 - 85% 80%
<21 m2 - - -
Apartment
>70 m2 85% 80% 75%
22 - 70 m2 90% 85% 80%
<21 m2 - 85% 80%
Home Shop/Office - 85% 80%
Housing Financing Based on MMQ and IMBT Contracts
Property type (m2)Lending/Financing Facility
First Second Third
House
>70 m2 90% 85% 80%
22 - 70 m2 - 90% 85%
<21 m2 - - -
Apartment
>70 m2 90% 85% 80%
22 - 70 m2 90% 85% 80%
<21 m2 - 85% 80%
Home Shop/Office - 85% 80%
The rationale is to stimulate domestic demand in order to drive domestic economic growth momentum while maintaining
compliance to prudential principles.
Source: Bank Indonesia
1
2
Effective from August 24th, 2016, Bank Indonesia raised the lower limit of the primary reserve requirement’s loan financing ratio
(GWM – LFR) from 78% to 80% with the upper limit unchanged at 92%, in order to support credit growth.
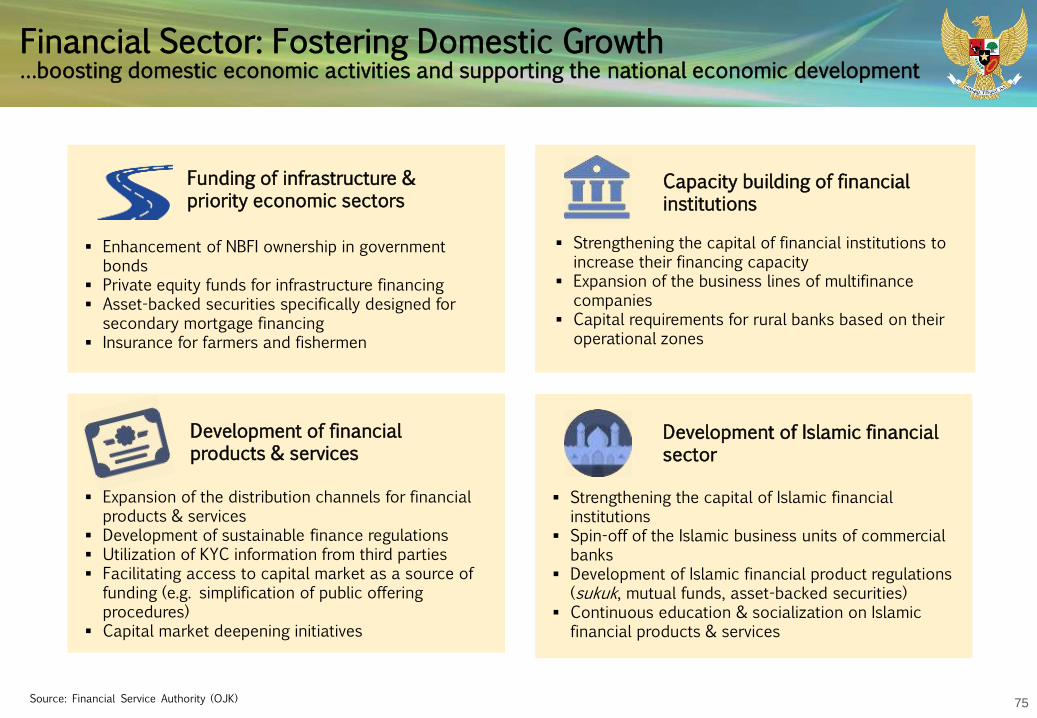
75
Financial Sector: Fostering Domestic Growth…boosting domestic economic activities and supporting the national economic development
Funding of infrastructure & priority economic sectors
Enhancement of NBFI ownership in government bonds
Private equity funds for infrastructure financing Asset-backed securities specifically designed for
secondary mortgage financing Insurance for farmers and fishermen
Capacity building of financial institutions
Strengthening the capital of financial institutions to increase their financing capacity
Expansion of the business lines of multifinancecompanies
Capital requirements for rural banks based on their operational zones
Development of financial products & services
Expansion of the distribution channels for financial products & services
Development of sustainable finance regulations Utilization of KYC information from third parties Facilitating access to capital market as a source of
funding (e.g. simplification of public offering procedures)
Capital market deepening initiatives
Development of Islamic financial sector
Strengthening the capital of Islamic financial institutions
Spin-off of the Islamic business units of commercial banks
Development of Islamic financial product regulations (sukuk, mutual funds, asset-backed securities)
Continuous education & socialization on Islamic financial products & services
Source: Financial Service Authority (OJK)
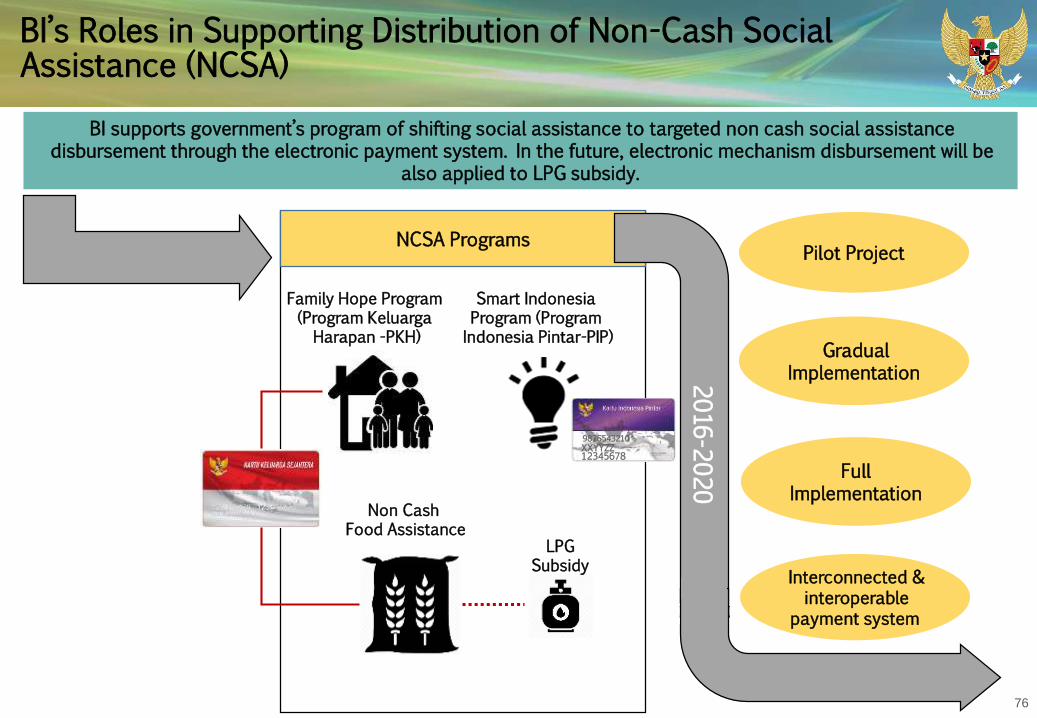
76
BI’s Roles in Supporting Distribution of Non-Cash Social Assistance (NCSA)
BI supports government’s program of shifting social assistance to targeted non cash social assistancedisbursement through the electronic payment system. In the future, electronic mechanism disbursement will be
also applied to LPG subsidy.
NCSA Programs
Family Hope Program (Program Keluarga Harapan -PKH)
Smart Indonesia Program (Program Indonesia Pintar-PIP)
Non Cash Food Assistance
2016-2020
Pilot Project
Gradual Implementation
Interconnected & interoperable
payment system
LPGSubsidy
FullImplementation
XXYYZZ12345678
9876543210

77
Progress of NCSA Programs
Family Hope Program(Program Keluarga Harapan -
PKH)
Prosperous Rice(Beras Sejahtera / Rastra)
• The Family Hope Program (PKH) is a program that provides cash to very poor households. Rp 2 million /year will be granted for each household (hh). PKH will be granted every February, May, August, and November
• In 2017, PKH is targeted for 6 million hh (50% or3 million distributed on non-cash basis and theremaining in cash basis. However, in the 2nd
semester of 2017 all PKH will be distributed onnon-cash basis.
• As of June 2017, Non-Cash PKH was granted to 2.65 million hh (88,33% of 3 million hh).
• Rastra is a poverty alleviation and social protection program that is managed by the central government. It provides subsidized rice to low-income households. Rp 110 thousand/month will be granted for each hh as Non-Cash Rastra.
• For 2017, Non-Cash Rastra was targeted for 1.6 million hh (9% of total target 15.5 million hh) in 45 cities and 6 regencies. Non-cash Rastra can be used in certain stores: Toko Sembako, E-warong, and Rumah Pangan Kita.
• As of February 2017, Non-Cash Rastra wasgranted to 881 thousand hh.
• Non-Cash Rastra will be expandedto 10 million families in 200regencies in 2018.
Cash
50%
Non-
Cash
50%
January 2017
Non-
Cash
100%
2nd Semester of 2017
PKH Target
• In December 2016, Non-Cash PKH was granted to 23% of total target of household.

78
Stronger Fundamentals Facing the Headwinds
-197
-35
5,62
1998
2008
Sep 16
82,4
12,1
6,8
1998
2008
Sep-15
30,0
3,8
2,8
1998
2008
Agu-15
17,4
50,2
1998
2008
Sep-15
Inflation Rate (%) IDR Movement (%)
Non-Performing Loan/NPL (%)
Government Debt/GDP
Foreign Reserves (USD bn)
100.0%1998
27.4%2008
28.1%
May 20171
8.6x
1998
3.1x
2008 2.7x
Q1-2017
116.8%
199833.2%
200834.1%
Q1-2017
More Liquid Market (%)
External Debt (Public & Private) to FX Reserve Ratio
External Debt/GDP
Inflation controlled within the target range IDR still appreciated in H1 - 2017
NPL level is below the maximum threshold of 5%
Consistently well-maintained below 30%
Significantly higher than 1998 & 2008, ample to cover 8.6 months of import and external debt repayment
Significantly lower than 1998 crisisSlightly higher than 2008, but significantly lower than 1998
June 17 123.09June 17 4.37 (yoy)
May 17 3.07
62
10,55,7
1998 2008 Jul-15
Overnight interbank money market rate is relatively lower
June 17
4.39
1.1 (ytd)June 17
1 2017 year end position of debt/GDP ratio is projected based on GDP assumptions in APBN (Budget 2017)

79
Outlook of Domestic Economy Remains Robust...domestic economic growth is predicted to be higher in 2017
2017 Economic Outlook
Economy to grow in the range of 5.0-5.4% (yoy) in 2017, supported by stronger export performance and investment.
Inflation is predicted to be within the 2017 inflation target of 4±1%, with the current account deficit projected below 2.5% of GDP
Credit is expected to grow 10-12% in line with expectations of expected economic gains and ongoing impact of previous monetary and
macroprudential policy easing.
2016(Realization)
Economic Growth
5.02%
Inflation
3.02%
CAD (% of GDP)
1.8%
Credit Growth
7.9%
2017 5.0-5.4% 4.0±1% <2.5% 10-12%
Global Domestic
Opportunities • Improving global economic growth• Acceleration of world trade volume
• Continous economic recovery process
Challenges • Further FFR hikes• Fed’s plan to shed its large balance sheet• Uncertainties in the US fiscal policy
• Ongoing consolidation in the corporate and banking sectors
2017 Economic Opportunities & Challenges
Source : Bank Indonesia
Progressive Infrastructure Development:Strong Commitment on Acceleration of Infrastructure Provision
Section 6

81
The Government has Enacted Various Reforms to Accelerate Infrastructure Provision
Fiscal Reforms Institutional Reforms Regulatory Reforms
Source: Committee for Acceleration of Priority Infrastructure Delivery (KPPIP)
Viability Gap Funding (VGF) KPPIP Direct Lending
Issuance of MoF Reg. No. 223/2012. To increase project financial feasibility by contributing up to 49% of the construction cost
Availability Payment
Land Revolving Fund
Risk-sharing Guidelines
Issuance of regulatory framework for annuity payment scheme by the Government (MoF Reg. No. 190/2015 for Central Gov’r and MoHA Reg. No. 96/2016 for Regional Gov’t.) during the concession period after the project operational by private sector in order to make the project bankable
Issuance of MoF Reg. No. 220/2010. A revolving-fund sourced from State Budget, to accelerate land acquisition
IIGF has issues risk allocation and mitigation guidelines for PPP project
KPPIP is actively involved in accelerating delivery of priority infrastructure projects
PT. Sarana Multi Infrastruktur
Merging between PT. SMI and Gov’t Investment Center (PIP) to become an infrastructure funding company
Indonesia Infrastructure Guarantee Fund (IIGF)
IIGF has the potential to provide project guarantee for non-PPP projects
PPP Unit
Provide facilities to help GCA on preparing PPP project (PDF/TA)
BLU LMAN
The State Asset Management Agency is mandated to provide land fund for National Strategic Projects to ensure timely land acquisition process
Issuance of Presidential Reg. No. 82/2015.Allow guarantee for direct lending to SOE to accelerate financial close process for infrastructure projects
Land Acquisition
Issuance of Presidential Reg. No. 148/2015.To stipulate land acquisition acceleration based on Law No. 2/2012
Economy Packages
Conduct deregulation for issues hindering infrastructure delivery and develop a task force under CMEA to ensure the effectiveness of economic packages implementation

82
Reforms Along the Project’s Life Cycle...to encourage and accelerate infrastructure project using PPP scheme
Government of Indonesia
Project Development Facility (PDF)
Viability Funding
Gap (VGF)
Guarantee Fund
Tax FacilitiesAvailability Payment
Land Acquisition
Preparation Bidding Process Construction
Project development facility contributing to assist GCA on PPP project preparation (PDF&TA)
Managing entity:KPPIP, PT SMI PT IIF, and Ministry of Finance
A facility with contribution to construction cost to increase project financial viability
Managing Entitiy:Ministry of Finance based on GCA proposal
Gov’t. commitment:49% max. Per project cost
Guaranteeing Govt. contractual obligations under infrastructure concession agreements and Mof Regulation No 130/PMK. 08/2016 re: Govt guarantee for electricity project acceleration
Managing entity:IIGF and MoF
Govt’s comitment:US$ 450 mn
MoF Reg. No. 159/PMK. 010/2015 re: tax holiday for pioneer sector, such as base metal, oil refinery, basic petrochemical, machinery, renewable energy, & telco equipment industries. Sector will be further expanded
Managing entitiy:Ministry of Finance
A scheme in which concessionaires receive sum of money periodically from central or regional government after the completion of an asset.MoF Regulation, and MoHARegulation on Availability Payment has been ratified.
Managing entity:Ministry of Finance & Ministry of Home Affairs
A facility to support land acquisition for infrastructure projects particularly projects that involve private sector
Managing enitiy:Ministry of Finance, Ministry of Agrarian and Land Spatial/BPN and BLU-LMAN
Gov’t. commitment:US$ 12 mn (2016)
Source: Committee for Acceleration of Priority Infrastructure Delivery (KPPIP)

83
Efforts to Accelerate Infrastructure Provision
Regulation improvement to accelerate land procurement process
The Government of Indonesia issued Law No. 2 of 2012 on Land Acquisition for Public Interest, with a purpose to provide certaintyabout the land acquisition duration for the Government Contracting Agencies and the Investors. The Law sets an estimated 583days maximum time to complete the land acquisition process.
For its implementation, the Law No. 2 of 2012 was supported by the PresidentialRegulation No. 71 of 2012 on Land Acquisition Implementation for DevelopingPublic Facilities, which has been revised into the Presidential Regulation No. 30of 2015. The Amendment to the Regulation allows a Business Entity to allocatefunding for a land acquisition which can be reimbursed by the Governmentfollowing the completion of land acquisition process. With this Regulation, theland acquisition process is expected not to be delayed by the unallocatedbudget or the delay on the budget disbursement.
Land Procurement Process as Stipulated in Law No. 2 of 2012
Law No. 2/2012 was successfully applied in:
1. Palembang – Indralaya section of the TransSumatera Toll Road Project
2. Java North Line Double Track Rail Project
Source: Committee for Acceleration of Priority Infrastructure Delivery (KPPIP)

84
Efforts to Accelerate Infrastructure Provision…the establishment of Indonesia Asset Management Agency (LMAN)
Source: Ministry of Finance
On December 12th, 2016, Indonesia Asset Management Agency (Lembaga Manajemen Aset Negara/LMAN) has been launchedto optimize the use of state assets. LMAN should plan for funding and utilization of land banks as well as pay compensationfor land acquisition to support the government’s infrastructure development program
Mandate
1. Government Regulation No.27/2014 on the Management of State/Region Property
2. Finance Minister Regulation No.219/PMK/2015 on the Governance and Organization of State Asset Management
3. Finance Minister Regulation No.1319/KMK.05/2015 on the Appointment of Indonesia Asset Management Agency as Government Agency to Implement Financial Management of Public Service Agency
Legal Basis1. Property Management
2. Land Funding for National Strategic Project
1. Asset of ex-Pertamina: LNG Badak Bontang, LNG Arun, and Tarogong Land
2. Asset of ex-Indonesian Bank Restructuring Agency (BPPN)
Other portfolio: Asset of ex-Asset Management Company (PPA) and ex-Contractor Cooperation Contract (KKKS)
Portfolio Assets

85
Under Presidential Reg. No.3/2016 j.o. the Presidential Reg. No.58/2017, 245 projects and 2 programs are listed as PSN
PSN includes 15 sectors at project level and 2 sectors at program level
7IRIGASI
Project
Electricity 1 PROGRAMSmall-Medium Airplane 1 PROGRAM
74 12647549333081023
61 2427
13
15
ProjectsProyek
93
10
1
12
2
Projects
Programs
US$49.0 Bn US$43.4 BnUS$13.0 Bn
US$34.2 Bn
US$100 Bn
US$0.8 Bn
US$81.9 Bn
Projects Projects Projects Projects
Projects Projects Projects Projects Projects Projects Projects Projects Projects
ROAD RAILWAY SEAPORT AIRPORT INDUSTRI-AL ZONE
HOUSING HOUSINGWATER & SANITA-TION
IRRIGA-TION
DAMTECH-
NOLOGYOIL
REFINERYSMELTER
National
Projects
Projects
Projects
Projects
Projects
Projects
1Project
FISHERY
Exchange rate: US$ 1 = IDR 13,000
1Project
SEA DIKE
Program

86
PSN may receive privileges as stipulated in the Presidential Reg. No. 3/2016 j.o. the Presidential Reg. No. 58/2017
0102
03
Determination of National Strategic Projects
04
05
0607
08
09
10
11
12Permit & Non-
permit Completion
Spatial Planning
Land clearing acceleration
Local Content Utilization
Government Guarantee Provision
Projects Monitoring via KPPIP IT System
SOE’s Assignment
Problems and Hindrance Completion
Accelerate Goods and Service Procurement
Settlement of Legal Issues
Acceleration of Non-State Budget
Projects
Additional Facilities
Existing Facilities
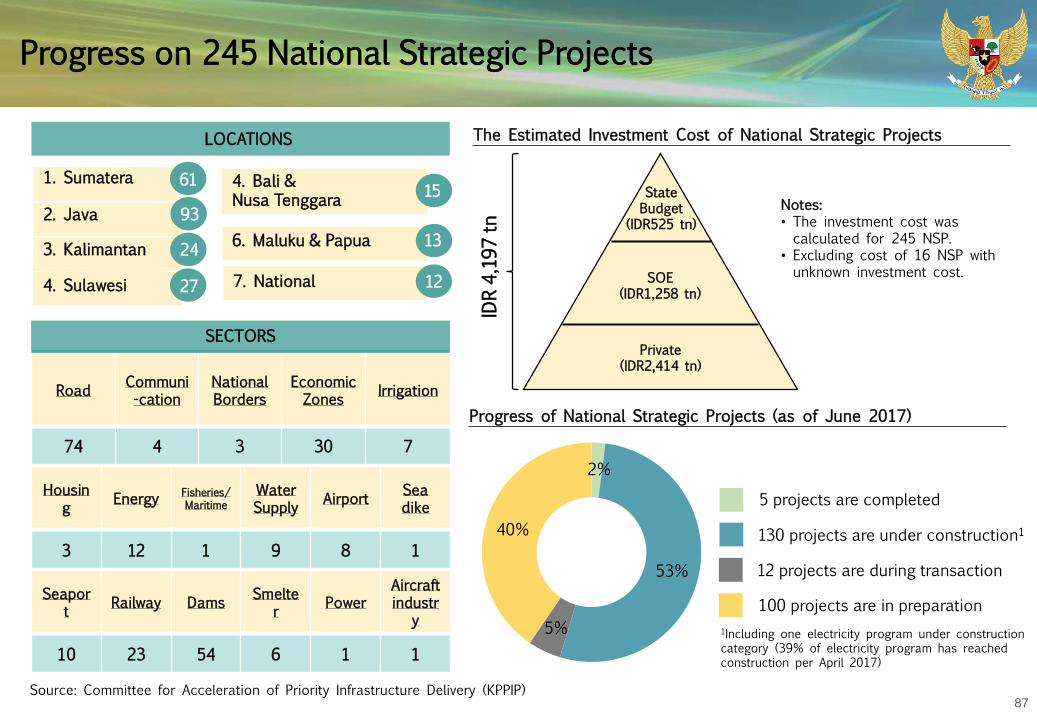
87
Progress on 245 National Strategic Projects
SECTORS
LOCATIONS
1. Sumatera 61
2. Java 93
3. Kalimantan 24
4. Bali & Nusa Tenggara
15
4. Sulawesi 27
6. Maluku & Papua 13
7. National 12
2%
53%
5%
40%
5 projects are completed
130 projects are under construction1
12 projects are during transaction
100 projects are in preparation
RoadCommuni-cation
National Borders
Economic Zones
Irrigation
74 4 3 30 7
Housing
EnergyFisheries/Maritime
WaterSupply
AirportSea dike
3 12 1 9 8 1
Seaport
Railway DamsSmelte
rPower
Aircraft industr
y
10 23 54 6 1 1
Progress of National Strategic Projects (as of June 2017)
The Estimated Investment Cost of National Strategic Projects
Private(IDR2,414 tn)
SOE(IDR1,258 tn)
StateBudget
(IDR525 tn)
IDR 4,197 tn
Notes:• The investment cost was calculated for 245 NSP.
• Excluding cost of 16 NSP with unknown investment cost.
Source: Committee for Acceleration of Priority Infrastructure Delivery (KPPIP)
1Including one electricity program under construction category (39% of electricity program has reached construction per April 2017)

88
Progress on 30 Priority Projects
1. Balikpapan-Samarinda Toll Road2. Manado-Bitung Toll Road3. Panimbang-Serang Toll Road4. Trans-Sumatera Toll Road (8 Sections)5. SHIA Express Railway6. MRT Jakarta South-North Line7. Makassar-Parepare Railway8. Kuala Tanjung International Port Hub9. Bitung International Port Hub10. Karangkates IV & V (2x250MW)
Hydro-Electric Plant11. Kesamben (37MW) Hydro-Electric Plant12. Lodoyo (10MW) Hydro-Electric Plant
13. Inland Waterways Cikarang-Bekasi-Laut (CBL)14. Light Rail Transit (LRT) South Sumatera15. Integrated LRT Jakarta-Depok-Bogor-Bekasi16. National Capital Integrated Coastal Development
(NCICD) Phase A17. Jakarta Sewerage System18. West Semarang Water Supply System19. High Voltage Direct Current (HVDC)20. Sumatera 500 kV Transmission Line
21. Central-West Java 500 kV Transmission Line22. Batang, Central Java Powerplant23. Indramayu Powerplant24. Mine to Mouth Powerplant South Sumatera 8-1025. Bontang Refinery26. Revitalization of the Existing Refineries
(Balikpapan, Cilacap, Balongan, Dumai, Plaju)27. New Port Development in West Java (North Part)28. Tuban Refinery29. Palapa Ring Broadband30. East Kalimantan Railway
Transaction
Preparation
Reassessed
8
5
9
18
1713
23
25
26
27
28
30
16
10
1
3
2
4
6
7
4
44
44
44
15
14
20
2122
29
29
29
29 29
29
29
29
2929
1112
19
24
Construction
From the National Strategic Projects, the Government has selected a list of 30 Priority Project to be the focus ofinfrastructure delivery in the beginning of 2016.
Source: Committee for Acceleration of Priority Infrastructure Delivery (KPPIP)

89
Progress on 30 Priority Projects
Recent MilestonesProgress of 30 Priority Projects (as of July 2017)
Funding Scheme of 30 Priority Projects
13 projects are in construction
3 projects are in transaction
9 projects are in preparation
5 projects are reassessed1
Private(IDR770 tn)
SOE(IDR325 tn)
StateBudget
(IDR255 tn)
Consultant team of OBC PHI Bitung has been established, PT Mott MacDonald Indonesia, PT Deloitte KonsultanIndonesia, dan PT Hanafiah Ponggawa & Partners
KA-ANDAL assessment process is completed after fulfilling administrative pre-requirements including letter from Spatial Planning Director General, Seaport Transport Director General and project’s inclusion in National Port Master Plan.
PPP has been agreed as the financing scheme by the main stakeholders
Governor regulation No. 53/2017 regarding the assignment to PT. MRT Jakarta was published.
15 projects reassessed include HVDC; Mine Mouth South Sumatera 8,9,10 Plant; Karangkates IV & V, Kesamben and Lodoyo Plants.
Bitung International Port Hub
Cilacap Refinery Revitalization
West Semarang Water Supply
Jakarta MRT (South-North Line)
Source: Committee for Acceleration of Priority Infrastructure Delivery (KPPIP)
10%
43%30%
17%

90
Energy Sector: the Progress of 35.000 MW Program
No Phase MW %
1 Operating 758 2
2 Construction 14,593 41
3 Signed Power-purchase Agreement 8,150 23
4 Procurement 5,355 15
5 Planning 6,970 19
17 Dec ‘14
Cabinet Meeting“There’s electricity crisis in
Indonesia, requires construction of large capacity plant "
Jan ‘15
Average economic growth of 6.7% requires 7,000 MW / year or
35,000 MW / 5 years
(Kepmen ESDM No. 0074/2015 onRUPTL 2015-2024)
Jan ‘15
Debottlenecking through regulation:
1. Regulation No.1/2015 concerning electricitysupply cooperation & joint utilization of theelectrical network among license holders.
2. Regulation No.3/2015, concerningProcedures of Purchasing Electrical Powerand benchmark prices for Electrical Powerthrough the Direct Selection & Appointment.
16 Mar ‘15 4 May ‘15
June‘17
Cabinet MeetingProgress of 35,000 MW
Launching 35.000 MW by the President in Goa Beach Sanden
DIY
The progress so far:
Source: KPPIP
SulawesiPLN: 2,000 MWPrivate: 1,470 MWTransmission: 5,275 ckt.kmSubstation: 4,390 MVA
MalukuPLN: 260 MWPrivate: 12 MWTransmission: 653 ckt.kmSubstation: 620 MVA
PapuaPLN : 220 MWPrivate: 0 MWTransmission: 364 ckt.kmSubstation: 460 MVA
KalimantanPLN: 900 MWPrivate: 1,735 MWTransmission: 5,604 ckt.kmSubstation: 3,500 MVA
Nusa TenggaraPLN: 670 MWPrivate: 0 MWTransmission: 2,347 ckt.kmSubstation: 1,410 MVA
SumateraPLN: 1,100 MWPrivate: 8,990 MWTransmission: 18,729 ckt.kmSubstation: 35,521 MVA
Jawa & BaliPLN: 5,000 MWPrivate: 13,697 MWTransmission: 9,185 ckt.kmSubstation: 66,265 MVA
35,000 MW Program Distribution
Source: PLN

91
Acceleration of 35.000 MW Program
Government
PT PLN
EPC Powerplant and Transmission
PLN Subsidiary(Joint Venture)
IndependentPower Producer
Strengthen Equity
2B1
Government Support (outside Guarantee)• Provision of Primary Energy• Provision of Renewable Energy• Simplicity of Permits and non-Licensing• Spatial Planning• Land acquisition• Resolution on Legal Matters
Local Content Obligation on the usage of local content through an open book system, price guideline, reverse engineering or other methods to maximise the local content.
2A
Assignment
SJKU* Ministry of Finance
Strengthen PLN‘s Balance Sheet
*)SJKU=Surat Jaminan Kelayakan Usaha/ Business Viability Guarantee Letter
The Government has issued Presidential Regulation No. 4/2016 on Electricity Infrastructure Acceleration to accelerate power projects
Provision of Electricity
Refinancing Hedging
Financial Asset OptimizationDirect Lending
Direct Lending
Bond issuance by PT PLN
Company Tax Holiday
PT PLN’s divident allocation
Loan from independent lenders
Asset Revaluation
Other typesof funding
Equity Injection by the Government
Source: Committee for Acceleration of Priority Infrastructure Delivery (KPPIP)

92
Significant Progress on Infrastructure Projects
DatabaseProject information such as map, track, existing study and
latest project status.
An integrated IT system with
monitoring capacity for stakeholders, so that they can have
real time data.
Platform data outlook that is efficient and functional using a user-friendly framework.
Record decisions related to projects and synchronize the implementation schedule that can be utilized by stakeholders.
KPPIP developed an integrated IT System for monitoring ofnational strategic and priority projects, providing database onprojects’ latest status which can be effectively utilized formonitoring and decision-making purposes.
Improving Monitoring System on Infrastructure Projects1Roads
Trans-Sumatra Toll Road Merah Putih Bridge, Ambon
Dams
Jatigede Dam (Operational)
Transportation
Jakarta MRT Project2
Drinking Water Processing
Umbulan Drinking Water Provision System, East Java
1 Source: Committee for Acceleration of Priority Infrastructure Delivery (KPPIP)2 Not funded from National Budget
Terminal 3 Ultimate Soekarno-Hatta2
New Tanjung Priok Port Project2 Nop Goliat Dekai, Papua

93
Investment in Iron Ore, Alumina and Bauxite Smelter
Existing Iron Ore Refinery Facility
No. Company ProductOre Input
Capacity (ton)Concentrate Input Capacity
(ton)Investment(USD mn)
Progress Completion Date
1 PT DPS Sponge iron 1.100.000 220.000 40 100% 2012
2 PT MJISSponge iron, slab, billet
3.300.000 660.000 150 100% 2013
3 PT SBP Cold Bricket Iron 240.000 65.800 120 100% 2017
No. Company ProductOre Input
Capacity (ton)Concentrate Input Capacity (ton)
Investment (USD mn)
Progress Completion Date
1 PT SILO Sponge iron 8.000.000 6.300.000 170 61% 2021
2 PT RSSponge iron
3.200.000 264.000 6,9 0% 2020
Completed but not operating
No. Company Product Input Capacity (ton)Investment (US$ mn)
Progress Completion Date
1PT Indonesia Chemical
AluminaChemical Grade Alumina 851.725 0,49 100% 2013
2 PT Well Harvest Winning Smelter Grade Alumina3.000.000 (Phasa 1)6.000.000 (Phase 2)
1,1Phase 1 : 100% Phase 2 : 0%
2016 (Phase 1)2017 (Phase 2)
Upcoming Iron Ore Refinery Facility
Existing Alumina and Bauxite Refinery Facility
Completed and operating
Source: Ministry of Energy and Mineral Resources, July 2017

94
Investment in Nickel Smelter
Source: Ministry of Energy and Mineral Resources, July 2017

95
Financing Needs and Schemes
95
Source: Ministry of Finance
145.9
SOE Private
234.8 88.8
Financing Needs
Gov’t Budget
Financing Gap
399.6 164.8
*(USD bn)
41,3%
58,7%
22,2%
36,5%
100%
• Government Budget is used for basic infrastructure projects, mainly for projects that are economically feasible but financially are not.
• SOE scheme is used for projects managed under SOEs (electricity, toll roads, oil, etc.) to leverage public funding channeled through capital injections (PMN) and empower SOEs
• PPP scheme is mainly targeted for projects that are both economically and financially feasible.
• The government may provide financial support to make certain projects financially feasible.
• The government may appoint certain SOEs to assign specific infrastructure projects
• To support the infrastructure provision through the SOEs, the government provide a number of financial facilities, such as:• Capital Injection (PMN)• Lending• Credit Guarantees• Guarantees for SOE Direct Lending• Business Viability Guarantees
Infrastructure Financing Need 2015-2019 General criteria for financing schemes
Financial Facilities Provided to SOEs Infrastructure Projects
PPP scheme and facilities provided to PPP Projects

96
Management of Contingent Liabilities
Credit Guarantee
PPP Guarantee
Business Viability
Guarantee
Power (Electricity) – Full credit guarantee for PLN’s default on its payment obligation (FTP 1 10,000 MW, 35GW)
Water – 70% guarantee of PDAM’s principal payment obligation
Infrastructure - Full credit guarantee on SOE’s default (for lending from international financial institution) & guarantee for PT SMI (local infrastructure financing)
Toll road – Full credit guarantee on Hutama Karya’s payment obligation (Sumatra Toll Road Development)
Power (Electricity) – Guarantee on the viability of PLN to fulfill Purchase Contract Electricity & guarantee against political risk
Infrastructure – Guarantee on the obligation of Government related entities in accordance to the Agreement
No.Central Government Guarantee
for Infrastructure ProgramsGuarantee Documents
Committed Guarantee Amount
(USD bn)1
Exposure/Outstanding (USD bn)1
1Coal Power Plant 10,000MW Fast Track Program (FTP 1)
36 6,98 3,47
2 Clean Water Supply Program 10 0,02 0,01
3Direct Lending from International Financial Institution to SOEs
2 1,10 0,23
4 Sumatra Toll Road Development 3 0,20 0,07
5Renewable energy, Coals & Gas Power Plant 10,000 MW (FTP 2)
12 11,91 1,47
6 Public-Private Partnerships (PPP) 5 5,81 0,83
Total 68 26,03 6,08
As % of GDP 2.8% 0.7%
For the period 2017 – 2020, the Maximum Guarantee Limit is set at 6% of GDP
In compliance with the guarantee limit, with projected 2020 GDP of IDR 18,000tn (eq. USD 1,349bn), the capacity for guarantee issuance during 2017-2020 is IDR 1,083tn (eq. USD 81bn) – cumulative
1. USD/IDR: 13,360 as of 14 Mar 2017
Government Guarantee Program and Portfolios 2008 - Present Guarantee Program Based on Guarantee Classification

97
Government Financial Facilities for PPP Projects
Financial Facilities to Attract More Private Participation
Those financial facilities were instrumental in supporting the execution of PPP projects, indicated by the signing of financial close
of the following PPP projects:
Viability Gap Fund (VGF)
Project Development Facility (PDF)
Government Guarantees (directly by MoF or through IIGF)
Financing from PT. SMI and PT. IIF
Availability Payment Schemes
More Funding Schemes are on the Pipelines
Project Financing funded by the private sector through the granting of concessions for an operating asset owned by the Government/SOE (based on the policy of the Government) to the private sector to be operated & managed.
Project Financing funded by any source of funds other than Government’s budget, e.g. long term management funds (insurance, repatriated funds from tax amnesty, pension funds, etc.), private equity investors and infrastructure funds. Supported & facilitated by National Development Planning Ministry/Bappenas.
• Asset is owned by public sector• Operating asset, not greenfield project• Records positive cash flow for the last
several years• Predicted revenue
• Asset is owned by private sector• Greenfield / brownfield / operating projects
Scheme Characteristics
Scheme Characteristics
LCS(Limited
Concession Scheme)
PINA(Non-Government
Budget Infrastructure Financing)

98
Progress of PPP Infrastructure Projects
No Project NameProject Cost
(IDR tn)Financial Facilities Status
1 Central Java Power Plant 40 Guarantee (MoF & IIGF) FC on June 6th, 2016; Construction 30%; COD Target: May 2020
2 Palapa Ring – West Package 1.28 PDF, IIGF Guarantee & AP FC on August 11th, 2016; COD target: February 2018
3 Palapa Ring – Central Package 1.38 PDF, IIGF Guarantee & AP FC on September 29th, 2016; COD target: March 2018
4 Palapa Ring – East Package 5.13 PDF, IIGF Guarantee & AP FC on March 29th, 2017; COD target: September 2018
5 Umbulan Water 2.1 PDF, VGF & IIGF Guarantee FC on August 30th, 2016; COD target: July 2019
Successful Projects Reaching Financial Close in 2016 and 2017
No Project NameProject Cost
(IDR tn)Financial Facilities Status
1 Batang–Semarang Toll Road 11 IIGF Guarantee PPP & guarantee contracts signed on April 27th, 2016
2 Manado–Bitung Toll Road 5.1 IIGF Guarantee PPP & guarantee contracts signed on June 8th, 2016
3 Samarinda–Balikpapan Toll Road 9.9 IIGF Guarantee PPP & guarantee contracts signed on June 8th, 2016
4 Pandaan–Malang Toll Road 5.9 IIGF Guarantee PPP & guarantee contracts signed on June 8th, 2016
5 Serpong–Balaraja Toll Road 6.0 - PPP contracts signed on June 8th, 2016
6 Jakarta–Cikampek Elevated Toll Road 14.8 Co guarantee (MoF & IIGF) PPP & guarantee contracts both signed on December 5th, 2016 and February 22nd, 2017
7 Krian–Legundi-Krian Toll Road 9.0 Co guarantee (MoF & IIGF) PPP & guarantee contracts both signed on December 5th, 2016 and February 22nd, 2017
8 Serang–Panimbang Toll Road 5.3 Co guarantee (MoF & IIGF) PPP & guarantee contracts signed on February 22nd, 2017
9 Cileunyi–Sumedang-Dawuan Toll Road
8.2 Co guarantee (MoF & IIGF) PPP & guarantee contracts signed on February 22nd, 2017
Signed PPP Projects in 2016 and 2017
Source: Ministry of Finance, as of July 2017

99
New Guarantee Schemes for Non-PPP Projects
The Government had issued Presidential Regulation No 82/2015 and Ministry of Finance Regulation No 189/2015 to provideguarantee for SOE Direct Lending from IFIs for the Development of Infrastructure Projects.
Guarantee on SOE Direct Lending from International Financial Institutions (IFIs)
Guarantee for Regional Infrastructure Financing Provision
State finance soundness Fiscal sustainabiliyBest practice of fiscal risk
management
The objective of this guarantee is to provide credit enhancement in terms of low interest rate and long tenor financing, with 3 main principles:
The Government had issuedMinistry of Finance Regulation No174 of 2016 to provide guaranteeto PT SMI on the assignment ofregional infrastructure financingprovision, by loan to localgovernments that is transferredfrom PIP to PT SMI, and new loanchanneled by PT SMI to the localgovernment.
Based on Government RegulationNo. 95/2015 and Ministry ofFinance Regulation No. 232/2015,Minister of Finance assigns PT SMI(Sarana Multi Infrastruktur) to carryout functions in providing loan tolocal government, as previouslycarried out by PIP (GovernmentInvestment Center).
The objective is to give stimulus tothe acceleration of localinfrastructure development throughthe ease of access to infrastructurefinancing and to boost localeconomic growth, as well as toprovide alternative financingschemes in order to meet localinfrastructure development needsand to reduce reliance onstate/local budget.

100
Progress of SOE’s Projects
Progress of Projects Benefiting from Guarantees on SOE Loans
No SectionsLength(Km)
Project Cost (IDR bn)
Status (as of March 10th, 2017)
1 Medan-Binjai 17 2.74 Construction progress: 54.18%Land Acquisition: 89.91%
2 Palembang-Indralaya 22 3.30 Construction progress: 52.68%Land Acquisition: 97.68%
3 Bakauheni-Terbanggibesar 140 16.79 Construction progress: 23.88%Land Acquisition: 78.14%
4 Pekanbaru-Dumai 131 16.21 Construction progress: 41.02%Preparation for DED
5 Terbanggibesar-Pematangpanggang 100 11.86 Preparation
6 Pematangpanggang-Kayuagung 85 10.08 Preparation
7 Kisaran-Tebingtinggi 60 6.99 Survey and Planning
8 Palembang-Tanjungapiapi 90 14.29 Survey and Planning
The Government issued government guarantees to loans of PT. Hutama Karya in the development of Trans-Sumatera Toll Road, ascomprise as follow:

101
Progress of SOE’s Projects
Progress of Projects Benefiting from Guarantees on SOE Direct Lending
No Project NameProject Cost (IDR mn)
Lender SOE Status
1 Sumatera Power Transmission and Distribution
600 ADB PT. PLN Guarantee is effective
2 Sumatera Power Distribution 500 World Bank PT. PLN Guarantee is effective
3 The Enhancement of Electricity Grid 330 IDB PT. PLN Preparation of guarantee issuance (recommendation to the Minister of Minister for Approval)
Other Guarantees That Have Been Provided to SOE Projects
No ProgramGuarantee Commited
(IDR bn)SOE Number of Guarantees
1 Fast Track Program 1 6.98 PT. PLN 36
2 Fast Track Program 2 11.91 PT. PLN 12
3 Clean Water Supply Program 0.02 PDAM 10