Reproductions supplied by EDRS are the best that can … · Slides were automatically timed for 10...
99
DOCUMENT RESUME ED 443 387 IR 020 096 AUTHOR McConnohie, Bruce Vernon TITLE A Study of the Effect of Color in Memory Retention When Used in Presentation Software. PUB DATE 1999-08-09 NOTE 96p.; Master of Arts in Educational Technology and Bible, Action Research Project, Johnson Bible College. PUB TYPE Dissertations/Theses Masters Theses (042) EDRS PRICE MF01/PC04 Plus Postage. DESCRIPTORS *Color; *Computer Software; Educational Media; Intermediate Grades; Junior High Schools; *Memory; Metacognition; Recall (Psychology); Retention (Psychology); Screen Design (Computers); Student Reaction IDENTIFIERS Presentations ABSTRACT A study of the effects of color as used in presentation software on short-range (immediately following treatment) and long-range (one hour following treatment) memory retention was conducted. Previous studies have concentrated on color as cueing or coding mechanisms primarily in print media and have not explored the effect of individual colors as presented on CRT (Cathode Ray Tube) computer screens. Twenty-eight subjects were selected from 6th and 7th grade students enrolled in a public school. Subjects were shown a series of alphanumeric characters (three per slide times three slides, equaling nine total per color) using black text upon white, blue, and green backgrounds. The slides were prepared using presentation software. Slides were automatically timed for 10 seconds each. Subjects were given answer sheets and asked immediately (time 0) following treatment to write down what they remembered from the series. One hour later (time 1), the subjects were given another answer sheet and asked to write what they remembered. The white, blue, and green slides were presented at one week intervals using a different set of randomly selected alphanumeric characters upon each subsequent background. The answers were scored for number correct in order and sequence from all colors and time references and t-tests were conducted on the data. Results show a statistically significant memory loss from time 0 to time 1 at the .05 level in the trial using blue and in the trial using green. Additionally, in a comparison between mean number of correct responses, a trend may have been discovered which shows black text upon a white background to rank higher than both colors in both time 0 and time 1. Blue may rank second in time 0 and third (worst) in time 1 while green may rank third in time 0 and second in time 1. Recommendations for additional research are given. Several appendices provide information on specifics of the study. (Contains 37 references.) (Author/AEF) Reproductions supplied by EDRS are the best that can be made from the original document.
-
Upload
dinhkhuong -
Category
Documents
-
view
215 -
download
0
Transcript of Reproductions supplied by EDRS are the best that can … · Slides were automatically timed for 10...

DOCUMENT RESUME
ED 443 387 IR 020 096
AUTHOR McConnohie, Bruce VernonTITLE A Study of the Effect of Color in Memory Retention When Used
in Presentation Software.PUB DATE 1999-08-09NOTE 96p.; Master of Arts in Educational Technology and Bible,
Action Research Project, Johnson Bible College.PUB TYPE Dissertations/Theses Masters Theses (042)EDRS PRICE MF01/PC04 Plus Postage.DESCRIPTORS *Color; *Computer Software; Educational Media; Intermediate
Grades; Junior High Schools; *Memory; Metacognition; Recall(Psychology); Retention (Psychology); Screen Design(Computers); Student Reaction
IDENTIFIERS Presentations
ABSTRACTA study of the effects of color as used in presentation
software on short-range (immediately following treatment) and long-range (onehour following treatment) memory retention was conducted. Previous studieshave concentrated on color as cueing or coding mechanisms primarily in printmedia and have not explored the effect of individual colors as presented onCRT (Cathode Ray Tube) computer screens. Twenty-eight subjects were selectedfrom 6th and 7th grade students enrolled in a public school. Subjects wereshown a series of alphanumeric characters (three per slide times threeslides, equaling nine total per color) using black text upon white, blue, andgreen backgrounds. The slides were prepared using presentation software.Slides were automatically timed for 10 seconds each. Subjects were givenanswer sheets and asked immediately (time 0) following treatment to writedown what they remembered from the series. One hour later (time 1), thesubjects were given another answer sheet and asked to write what theyremembered. The white, blue, and green slides were presented at one weekintervals using a different set of randomly selected alphanumeric charactersupon each subsequent background. The answers were scored for number correctin order and sequence from all colors and time references and t-tests wereconducted on the data. Results show a statistically significant memory lossfrom time 0 to time 1 at the .05 level in the trial using blue and in thetrial using green. Additionally, in a comparison between mean number ofcorrect responses, a trend may have been discovered which shows black textupon a white background to rank higher than both colors in both time 0 andtime 1. Blue may rank second in time 0 and third (worst) in time 1 whilegreen may rank third in time 0 and second in time 1. Recommendations foradditional research are given. Several appendices provide information onspecifics of the study. (Contains 37 references.) (Author/AEF)
Reproductions supplied by EDRS are the best that can be madefrom the original document.

A STUDY OF THE EFFECT OF COLORIN MEMORY RETENTION
WHEN USED IN PRESENTATION SOFTWARE
An Action Research Project Presented to the
Department of Teacher Education
Johnson Bible College
In Partial Fulfillment
of the Requirement for the Degree
Master of Arts in Educational Technology and Bible
PERMISSION TO REPRODUCE ANDDISSEMINATE THIS MATERIAL HAS
BEEN GRANTED BY
_13 ..McConnohle
TO THE EDUCATIONAL RESOURCESINFORMATION CENTER (ERIC)
1
by
Bruce Vernon McConnohie
August 9, 1999U.S. DEPARTMENT OF EDUCATION
NATIONAL INSTITUTE OF EDUCATIONEDUCATIONAL RESOURCES INFORMATION
CENTER (ERIC)This document has been reproduced asreceived from the person or organizationoriginating it.
Minor changes have been made to improvereproduction quality.
Points of view or opinions stated in this docu-ment do not necessarily represent official NIEposition or policy.
BEST COPY AVAILARLF

APPROVAL PAGE
This Action Research Project by Bruce Vernon McConnohie is accepted in itspresent form by the Department of Teacher Education at Johnson Bible Collegeas satisfying the Action Research Project requirements for the degree Master ofArts in Educational Technology and Bible
Datey
Chairperson, Examining C mmittee
4.4A4f_taa,te.Member, Examining Committee
E4trAYMember, xamin ng Committee
M2111'4ber, Examining Committeec.
3
Member, Examining Committee

4
ABSTRACT
A STUDY OF THE EFFECT OF COLOR
IN MEMORY RETENTION
WHEN USED IN PRESENTATION SOFTWARE
An Action Research Project Presented to the
Department of Teacher Education
Johnson Bible College
In Partial Fulfillment
of the Requirement for the Degree
Master of Arts in Educational Technology and Bible
by
Bruce Vernon McConnohie
August 9, 1999

ABSTRACT
A study of the effects of color as used in presentation software on short
(immediately following treatment) and long range (one hour following treatment) memory
retention was conducted. Previous studies concentrated on color as cueing or coding
mechanisms primarily in print media and have not explored the effect of individual colors
as presented on CRT (Cathode Ray Tube) computer screens. Twenty-eight subjects were
selected from 6th and 7th grade students who were enrolled in a public school. Subjects
were shown a series of alphanumeric characters (3 per slide x 3 slides = 9 total per color)
using black text upon white, blue, and green backgrounds. The slides were prepared using
presentation software. Slides were automatically timed for ten seconds each. Subjects
were given answer sheets and asked immediately (time 0) following treatment to write
down what they remembered from the series. One hour later (time 1), the subjects were
given another answer sheet and asked to write what they remembered. The white, blue,
and green slides were presented at one week intervals using a different set of randomly
selected alphanumeric characters upon each subsequent background. The answers were
scored for number correct in order and sequence from all colors and time references and t-
tests were conducted on the data. Results show a statistically significant memory loss from
time 0 to time 1 at the .05 level in the trial using blue and in the trial using green.
Additionally, in a comparison between mean number of correct responses, a trend may
have been discovered which shows black text upon a white background to rank higher in
both time 0 and time 1 than blue or green. Blue may rank 2" in time 0 and 3rd (worst) in
time 1 while green may rank 3rd (worst) in time 0 and 2" in time 1. Suggestions of
evidence to support additional research in this area are inferred.

ACKNOWLEDGMENTS
My sincerest gratitude is expressed to the Lord who granted me the patience tocomplete this project and to my wife and son who shared their support, encouragement,and time.
Gratitude is also expressed to the congregation of Laurel Springs Christian Churchfor their support and understanding in completing this project.
I would like to thank the staff and students of the school used in this study for theirassistance and cooperation in conducting this research.
ii
6

TABLE OF CONTENTS
Page
ACKNOWLEDGEMENTS ii
LIST OF TABLES
Chapter
1. INTRODUCTION 1
Significance of the Problem 1
Consideration of the Scope of the Problem 1
The Problem 4
The Importance of the Study 5
Definition of Terms 6
Assumptions .7
Limitations 7
Delimitations .8
Null Hypotheses 11
2. REVIEW OF RELATED LITERATURE 13
Historical Overview of the Concept and Methodology 13
Color - Physics and Methodology 18
Color Research 19
Introduction to Current Memory Research 26
Overview of Current Brain-Memory Research 26
Current Considerations in Memory Research and Theory 29
iii

iv3. METHODS AND PROCEDURES 37
Design of the Study 37
Subjects 38
Environment of Study 39
Selection and Screening of Subjects 40
Time Interval Investigation 40
Preparation of Materials Used in Treatments 41
Treatment Used in This Study 42
4. RESULTS 45
Statistical Analysis 45
Analysis of Data 45
Consideration of Hypotheses 46
5. SUMMARY, CONCLUSIONS, AND RECOMMENDATIONS 51
Summary 51
Conclusions 52
Recommendations 56
BIBLIOGRAPHY 58
APPENDICES 64
A. Color Production 65
B. Description of Hardware, System Properties, and Color Values 67
C. Hexadecimal System 69
D. Dithering 70
8

vE. Color on a Cathode Ray Tube (CRT) 71
F. Gamma 72
G. Physics, Physiology, and History of Color 73
H. Gamma Settings Information and Sources 81
I. Determination of Color Values in Hexadecimal Terms 82
J. An Amplified Explanation of the Terminology Used to Describe theDesign of This Study 83
K. An Explanation of What May Appear as Discrepancies Between MeanScores Across Trials 85
L. Example of Type Style, Font Size and Characters Used in This Project 86
M. Permission Letter 87
9

LIST OF TABLESTable
Page
1. Comparison Between Time 0 and Time 1 When Utilizing a White Background 46
2. Comparison Between Time 0 and Time 1 When Utilizing a Blue Background 47
3. Comparison Between Time 0 and Time 1 When Utilizing a Green Background 48
4. Comparison Between Time 0 Using a White Background and Time 0 Using aBlue Background 48
5. Comparison Between Time 1 Using a White Background and Time 1 Using aBlue Background 49
6. Comparison Between Time 0 Using a White Background and Time 0 Using aGreen Background 49
7. Comparison Between Time 1 Using a White Background and Time 1 Using aGreen Background 50
8. Comparison of the Mean of Number of Correct Responses in Time 0 andTime 1 of White, Blue, and Green 53
10
Chapter 1
INTRODUCTION
Significance of the Problem
The relationship between human learning and technology is a complex issue. As
society advances in its applications of technology it must also insure that technology is
used to its best advantage. Multimedia capable computers and presentation software,
such as PowerPoint ®, present a new medium with which to explore the limits of this
concept. While previous studies reviewed in this paper have involved themselves with
various aspects of multimedia, such as motion, sound, color, and background, few if any,
have examined any of these elements as a single entity to determine their relative effect
on human learning (Chen, p. 431). These studies have concentrated on combinations of
different elements and have inferred a positive influence on the learning experience, but
they have not been specific as to which individual element had the most effect, and in
which area. This current study seeks to isolate the single, yet complex, element of color
and to explore its effect on the single, yet complicated, aspect of memory retention in 6th
and 7th Grade students.
A Consideration of the Scope of the Problem
"Whenever the rainbow appears in the clouds, I will remember the everlasting
covenant between God and all living creatures of every kind on the earth" Genesis 9:16
(NIV, p.9). The relationship between color and remembering has been an integral part of
1
11

2
the human experience from the beginning. In this post-diluvian quotation from the Bible,
God himself uses color as an instrument for recalling certain aspects of His relationship
with mankind. The authorship of this reference is attributed to Moses, which might make
this connection between color and memory dating from about the 14th century BC
possibly the earliest mention of this topic available (McClintock, p.776). Throughout the
subsequent eons, mankind has expressed or developed multitudes of various meanings,
preferences, and applications for color. It is in the modern era, however, that we have
begun to develop both the methods and the means to conduct an analysis of this
previously elusive subject. Yet, this endeavor is not as simple as it may appear on the
surface. Evidence of the difficulty of the task may be seen by considering each of the
elements of color and memory as a separate entity.
Philosophers, psychologists, and many others have speculated, postulated, and
hypothesized about the nature and construction of human memory. Aristotle, in his
considerations "On Memory and Reminiscence (ca.350b.c.), related to the complexity of
the relationship between an image and the associated mental process by stating: "a picture
painted on a panel is at once a picture and a likeness: that is, while one and the same, it is
both of these, although the being of both is not the same, and one may contemplate it
either as a picture, or as a likeness" (Green, p. 3). He attempts to clarify the dilemma by
stating: "Acts of recollections, as they occur in experience, are due to the fact that one
movement has by nature another that succeeds it in regular order" (Green, p.4). He uses
both color and alphanumeric character sequences as examples of possible memory
triggers or methods of the quantification of memory functions (Green, p. 5).
12

3
It appears that no matter who makes the attempt to either qualify or quantify the
workings of the human mind, the conceptualization escapes us. It may be that until
current and future technologies, such as Positron Emission Tomography (PET) and
beyond, allow us to precisely map the geography and operations of the human brain, we
may be reliant upon external examinations of the processes involved. One such external
method is found in Gestalt Psychology which attempts to study entire patterns of mental
process rather than isolating the phenomena into single operations or sensations in order
to deal with the utter complexity of the task (Bram, p.203). Whatever the method or the
outcome of these examinations may be, several questions are raised. We must ask first,
what is real? Secondly, we ask what does color mean? Eventually we ask, are colors
perceived in exactly the same way by two different persons? Ultimately, the answers to
these questions may still remain in the realm of the subjective or speculative. It may be
possible, however, to describe certain aspects of mental activity, such as retention of
information, in a reasonably accurate format. This approach has historically been
accomplished by the use of a variety of tests, including written examinations, to
determine the degree that a person remembers or recalls information on both a short-term
and a long-term basis.
The element of color itself has also been an elusive target to either quantify or
qualify. A method for describing the virtually limitless variations of the elements of color
in precise terms has been sought for centuries. Such a method would permit more
accurate experimentation and replication of color across fields as well as more complete
13

4
descriptions of exactly which elements of color were used. For a description of color
production see Appendix A.
The Problem
One of the most difficult problems in past color research has been that of precisely
describing the attributes of particular colors. The researcher of the past has not been able
to control for the differences in the descriptions and in the reproduction of various hues,
shades, saturation, and etc. when either conducting primary research or in replicating the
research of others. It is possible that, with the development of digital technologies,
researchers may, at last, be able to utilize this digital format as a standardization toward a
higher level of assurance of their results. One of the areas that needs to be examined is
whether or not certain specific colors, or wavelengths of light, affect the process of the
retention of information by the human mind. If, as it appears from prior research, some
direct relationship does exist and can be found, continued research should be conducted
to determine exactly which colors have an effect on mental activity. Exploration should
determine what particular areas of human thought are involved with color. Once the
relationship is established then it should be determined just how to apply these findings in
the development of educational materials.
This study attempts to use the additive primary colors of blue and green, as
available on a computer monitor CRT screen and as produced within a digital format on
PowerPoint 95® presentation software, to determine whether either of these colors has an
effect on the short-term and long-term memory retention of a series of unrelated
alphanumeric characters by a group of 6th
14
and 7th grade students. Additional descriptions

5
will be seen in the Methods and Procedures sections of this paper. A detailed description
of the hardware, software, and color values and descriptions used in this study are
included in the Appendix B.
The Importance of the Study
The importance of this study extends beyond the results of this experiment. With
the development of digital color media, researchers may eventually be able to consider
the efficacy of the use of color in the educational environment. If, for example, it could
be scientifically determined that a particular saturation level or hue of a color would
actually improve or inhibit the retention of certain types of information, it could
revolutionize the actions we take in presentations and in the perception of educational
materials. Past work in color as associated with memory, as seen in this paper, has
concentrated on combinations of different elements of multimedia which involved color,
motion, sound, and background, and have inferred a positive influence on the learning
experience. However, they have not been specific as to which individual element had the
most effect, and in which area. Few, if any, of these studies have examined any of these
elements as a single entity to determine their relative effect. This study seeks to isolate
the single, yet complex, element of color and to explore its effect on the single, yet
complicated, aspect of memory retention in 6th
15
and 7th grade students.

6
Definition of Terms
Additive color mixing describes what occurs when colors of light overlap and add
to each other. Mixing the additive primary colors, red, green, and blue, produce white.
Brightness or value refers to the lightness or darkness of a color as measured by the
amount of light that the sample reflects or transmits.
CRT is an abbreviation used to refer to a Cathode Ray Tube used in current
televisions and computer monitors, although the pixels are aligned differently in each.
See Appendix E.
Dithering is the process used by software (i.e. a web browser) to mix intermediate
colors from its common palette of 256 colors. See Appendix D.
Gamma (a greatly simplified definition) is a measurement derived by a
mathematical formula which describes the relationship between the voltage input and the
brightness of the image on a monitor (CRT) screen. See Appendix F.
Hexadecimal is a counting system analogous to the decimal system, but it uses base
16 instead of base 10. See Appendix C for additional information including descriptions
of colors used in this study as expressed in hexadecimal terms.
Hue is the common term for a particular color, such as red, green, or blue.
Saturation or chroma is the degree of pure color in the sample, measured by the
amount or strength of redness, greenness, blueness, and etc.
Subtractive color mixing describes what occurs within the solid pigment media of
paint and ink. Mixing the subtractive primary colors, cyan, magenta, and yellow produce
black.
16

7
Assumptions
It was assumed that the subjects used in this study understood the instructions and
complied to the requests made of them to the best of their abilities.
Limitations
The limitations of this study include several considerations that are discussed
below.
The use of a pre-set gamma in this current study could be seen as a limitation for
reasons of accuracy in color reproduction. This current research used a PC computer
system which had a pre-set and unchangeable gamma as opposed to a gamma corrected
Macintosh ® or Silicon Graphics® system. The use of a gamma estimate of 1.6 on the
equipment used in this study could be seen by some as a limitation because of subtle
shifts in reproduction of color and intensity. However, a gamma of 1.6 was deemed by
this researcher to be within acceptable parameters for accurate color production and
display and for use in this research. A gamma closer to 1.8 or 2.0 might be slightly better
but, as previously stated, those elements were pre-set and were not changeable on the
equipment used in this study. The use of the computer system utilized in this current
study was selected by the principal of the school and the selection of equipment was not
under the control of the researcher.
The relatively small size of the sample of subjects involved could be seen as a
limitation toward conclusive results. Out of the 28 students enrolled, sometimes only 23
were able to participate due to illness and absence. Attendance was not under the control
of the researcher.
1 7

8
Another limitation could be seen in the lack of a pure randomization of the sample.
The school used in this study was selected by the researcher because of proximity and
because of a previously established rapport with the school. Selection of this particular
sample group was made by the principal of the school not the researcher. The size of the
class was controlled by the standard enrollment policies in conjunction with the class size
limitation policies of Tennessee. Those students of appropriate age were assigned to the
class by the principal as they arrived to enroll with the school. The sample is therefore
not seen to be representative of all 6th and 7th grade students. Broader generalizations of
the results of this study warrant additional research.
Delimitations
The delimitations of this study, or aspects not considered in this research, are listed
in the following sentences.
Color as either a cue or as a coding mechanism in memory retention or search
tasking was not considered in this current study.
The attributes of color in the subtractive medium of paint, ink, or other pigment
upon a dimensional surface such as paper were not considered in this current study.
The attributes of color as part of an illustration, diagram, chart, or graph were not
considered in this current study..
The preference of the subjects to a particular color was not considered in this
current study.
Issues of acuity, contrast, or legibility were not considered in this current study.
13

9
The emotional, arousal aspects, or cultural meanings of particular colors (such as
the color described as pure red which has been shown to evoke an emotional arousal
response) was not considered in this current study.
The harmony or dissonance between combinations of colors (such as black
characters and either white, blue, or green backgrounds) was not considered in this
current study.
Issues of adaptation including general adaptation (moving from a light room to a
dark one or vice versa), local adaptation (afterimages), or lateral adaptation (two colors
viewed simultaneously)(Pett and Wilson, p. 20) were not considered in this current study.
Issues of a learning curve where subjects may exhibit increased abilities upon
repeated administration of similar trial methodology were not considered in this current
study.
Aspects of color in combination with factors such as other colors, motion, sound,
integrity with content and context of a complicated background or life-like photographic
or graphic image in either still or motion format multiples of these factors were not
considered in this current study.
The effect of color upon the attention level of the subject was not considered in this
current study.
Color when used in combination with verbal or audible responses was not
considered in this current study.
19
10
Color as it may relate to field dependence of subject was not considered in this
current study as field dependence issues are terms exclusively used in the results of an
administration of the Group Embedded Figures Test® (GEFT). Subjects in this current
study were not administered the GEFT nor were these issues explored in this current
study. (Pett and Wilson, p. 27).
Human memory aspects of learning, association, reproduction, or philosophical
meaning were not considered in this current study..
The relative increase or decrease of information retention when combined with
various additional reinforcements over longer periods of time (beyond one hour) was not
considered in this current study. Reinforcements could be understood as reward,
punishment, or even the repetition of a single methodology.
A consideration of time-on-task was not seen as contributory to this current study
and so was not calculated.
On-screen afterimage and its potential for effect on memory retention was not
considered a factor in this current study.
No consideration of the conscious or unconscious involvement of either episodic,
semantic (Jensen, p. 204), or a combination of both elements by the subjects was made
during this current study.
No measurement or consideration of hormonal differences between individuals or
between males and females were made during this current study.
No record of the sleep patterns or home environment of subjects was kept for this
current study.
20

11
Neither individual brain hemisphere dominance nor breathing rate was measured for
subjects in this current study.
Null Hypotheses
1. Students who receive information through presentation software which uses
pure black text upon a pure white background exhibit no statistically significant
difference in memory retention when tested immediately (time 0) following
treatment when compared with students tested one hour (time 1) following
treatment at the .05 level of significance.
2. Students who receive information through presentation software which uses
pure black text upon a pure blue background exhibit no statistically significant
difference in memory retention when tested immediately (time 0) following
treatment when compared with students tested one hour (time 1) following
treatment at the .05 level of significance.
3. Students who receive information through presentation software which uses
pure black text upon a pure green background exhibit no statistically significant
difference in memory retention when tested immediately (time 0) following
treatment when compared with students tested one hour (time 1) following
treatment at the .05 level of significance.
4. Students who receive information through presentation software which uses
pure black text upon a pure white background exhibit no statistically significant
difference in memory retention when tested immediately (time 0) following
treatment when compared with students receiving the same type of information
21

12
using a pure black text upon a pure blue background when tested immediately
(time 0) at the .05 level of significance.
5. Students who receive information through presentation software which uses
pure black text upon a pure white background exhibit no statistically significant
difference in memory retention when tested one hour (time 1) following
treatment when compared with students receiving the same type of information
using a pure black text upon a pure blue background when tested one hour
(time 1) at the .05 level of significance.
6. Students who receive information through presentation software which uses
pure black text upon a pure white background exhibit no statistically significant
difference in memory retention when tested immediately (time 0) following
treatment when compared with students receiving the same type of information
using a pure black text upon a pure green background when tested immediately
(time 0) at the .05 level of significance.
7. Students who receive information through presentation software which uses
pure black text upon a pure white background exhibit no statistically significant
difference in memory retention when tested one hour (time 1) following
treatment when compared with students receiving the same type of information
using a pure black text upon a pure green background when tested one hour
(time 1) at the .05 level of significance.
22

Chapter 2
REVIEW OF RELATED LITERATURE
Historical Overview of the Concept and Methodology
The first modem contributions to the scope and the methodology of this study come
from a review of the work of Hermann Ebbinghaus conducted in a number of trials during
the years 1879-1890 and 1883-1884 (Green, p. 1). In his monumental work Memory: A
Contribution to Experimental Psychology, he offers certain valuable realizations as well
as establishing some important precedents for continued research. It must be noted at the
outset, however, that, even though his work was meticulous, well calculated, and
extensive, it was conducted upon only a single subject, himself. This fact, though
admitted by Ebbinghaus, precludes any broad generalizations of his findings, particularly
toward any specific application of his results. The Ebbinghaus study may provide some
general principles for methodology in conducting research.
The first of these principles is the realization that it may be possible, by "methods of
natural sciences," to obtain exact measurements, i.e., numerically exact ones, of the
"inner structure of causal relations," and so, it may be possible to describe human mental
activities, such as, retention of memories in an acceptably accurate manner. As a proof,
Ebbinghaus offers that either a reproduction of memory takes place or else it does not.
He proposes this fact as evidence of the relative nullification of most causal differences.
Ebbinghaus also adds the integration of the time factor into the research model.
13
23

14
This is seen as the differentiation between memory that is recalled immediately
following a treatment (short-term memory) and those memories recalled after a period of
time (long-term memory) in addition to the individual time intervals that are used within
the treatments.
In his study, Ebbinghaus used immediacy following the treatment as a short-term
reference, 24 hours after the treatment as a long-term determinate, and a time interval of
between 12.7 and 15 seconds pause between each series. By using a rhythm of 150 beats
per minute (a selected segmentation of time used in the verbalization of syllabic
utterances) for reading the nonsense syllables contrived for his study, he determines that
each syllable would take between 0.4 and 2.1 seconds to read and or recall.
Ebbinghaus used alphanumeric characters which were arranged into a series and
which were constructed into nonsense compilations. He makes note that he also used
numerals, but that he eventually abandoned them for that of alphabetic characters because
of their greater combined variety.
Ebbinghaus related the observation made in the 19th century by Sir. William
Hamilton of the difficulty of viewing "at most seven marbles without confusion"
indicating a consideration of the practical limitations of human memory in recalling items
in a series. Another important contribution supplied by Ebbinghaus in the ability of
humans to recall a number of syllables in a series is made by establishing a point beyond
which the rate of probable error increases when the subject is exposed to more than a
single repetition of the series. At this point a single exposure results in zero probable error
(Coopersmith, p. 161).
24

15
Ebbinghaus established, albeit upon himself, that with seven (7) syllables in a series,
there was a zero probable error in recalling the series after a single repetition. He also
showed that when using 12 syllables in a series that there was a probable error in recalling
them correctly, after 16.6 repetitions, of + 1.1. Ebbinghaus also demonstrated that the
use of seven (7) multi-character syllables (3 characters in each syllable = 21 individual
characters) in a single exposure resulted in zero probable error. It must also be observed
that the Ebbinghaus study involved the additional variable of repetition which is not
germane to this research.
It should additionally be noted that, while Ebbinghaus briefly mentions the aspect of
color, he does so only as it refers to the contemplations on the subject as were postulated
by Aristotle, and as such, were not included as elements within his own studies. In
retrospect, perhaps, one of the most important realities that was addressed by Ebbinghaus
was the expression of a two-fold difficulty in the application of the "Natural Science
Method" to issues of human mental or "psychical" processes. They are:
1. "The constant flux and caprice of mental events do not admit to theestablishment of stable experimental conditions"; and
2. "Psychical processes offer no real means for measurement orenumeration"(Green, p.7).
In studies conducted at the Harvard University Psychological Laboratories by Miller
(1958) (cited in Coopersmith, p.163) used the combination of alphabetic characters and
numerals in which subjects were shown randomized lists of alphanumeric series and then
asked to write down what they could remember. The Miller trial, again, demonstrates the
acceptance of this methodology, although their study also included repetition as an
element and excluded any connection to color. The concept of alphanumeric character
25

16
use in research is additionally supported by Underwood (1964) (cited in Coopersmith, p.
155) in an article on Forgetting in Scientific American, March, 1964. In this article
Underwood refers to the use of lists of words or non-words arranged in series of three (3)
characters in a sequence, where the subjects are asked to observe and then report upon
what they remember as a "standard procedure" (for research). Underwood also suggests a
variant of the procedure in which the non-words are paired with something else, such as
the word (or color) yellow and wherein the subject views both the non-word and the
paired variable. The subject then views the first (of the paired items), and is asked to
recall the item paired with it.
The inclusion of color names is not seen to be an inclusion of color as an element in
Underwood's considerations. He does however, offer an important insight into another
matter of interest to this study. Underwood suggests that there are important factors that
may "determine the ease or speed with which one learns a list of items" (cited in
Coopersmith, p. 155). He stated that there are, at least, two decisive variables. First,
how meaningful they are, and second, the degree of similarity or non-similarity between
the items (cited in Coopersmith, p. 155). He reports that, while dissimilarity may make
the task of remembering more difficult, "the rate of forgetting is no higher for items of
low meaningfulness than it is for highly meaningful material" (cited in Coopersmith, p.
156). This reinforces support for using dissimilar alphanumeric characters arranged into
material of low meaningfulness (nonsense).
Underwood offers additional insight by recalling a study conducted by Peterson and
Peterson (cited in Coopersmith, p. 156) of Indiana University in which subjects were
2 6

17
shown a three (3) character nonsense syllable for one second and then were asked to
recall them at various short intervals up to 18 seconds. Memory for the items was shown
to decline in direct proportion to the lapse of time and that after 18 seconds 90 per cent of
the students were unable to recall the nonsense syllables correctly. It was established,
however, that such rapid forgetting occurs only after the subjects had been tested on
several (number not given) successive items (over several different series). Miller, (cited
in Coopersmith, p. 163) also established that it is "just as easy to memorize a list
containing a lot of information as one of the same length containing less information".
This current research assumes that three (3) sets of three (3) character nonsense syllables
will not trigger a rapid decline in memory retention.
In his textbook on Neuropsychological Assessment Lezak indicates that the use of
nonsense syllables "have been a popular medium for studying memory since Ebbinghaus
first reported in 1885 on their use to explore retention and forgetting" (Lezak, p. 350).
Lezak also notes that an interval of 10 seconds for exposure followed by an immediate
response is used for both the Binet and the Wechsler memory Scales as well as by the
Benton Visual Retention Test (Benton, 1963; 1974) (Lezak, p. 368). Additionally, to
support the methodology of measuring retention based upon a single exposure of
nonsense syllables, Rock, (cited in Coopersmith, p. 146) discusses his work in the area of
using nonsense syllables to study memory. In the same article Rock, (cited in
Coopersmith, p. 146) mentions an experiment done on students by Springfield at the New
York School for Social Research. Rock reports that in the trials by Springfield (cited in
Coopersmith, p. 146) the researcher pretended to be lecturing on memory and,
277

18
as an example of syllables utilized by Ebbinghaus, held up a card containing a pair of
nonsense syllables. After different intervals of time, he conducted tests and concluded
that "virtually all of them (the subjects) had learned the syllables upon the single
exposure" even though he had not asked them to do so (Coopersmith, p. 146). Rock,
(Coopersmith, pp. 143-146) tested his subjects by showing them eight random pairs of
nonsense syllables but used an associated-pairing of the syllables to determine whether
subjects reshown the first syllable could then recall the second paired syllable. Rock's
subjects were given a single exposure by which to learn the syllables. He also conducted
similar trials using syllables comprised of letters and numbers with identical results. The
combination of the conclusions and observations of past researchers is seen to support the
methodology of this research in its use of timed, single exposure, short series, nonsense
syllables and of the measurement of the subjects memory retention over two periods of
time to assess both short-term and long-term retention of those syllables.
Color - Physics and Methodology
See Appendix G for an examination of the aspect of color as considered within this
research including a discussion of : 1) the physics and the physiology of color perception
within the eye; 2) disorders that effect color perception in humans; 3) common tests to
determine those disorders; 4) measures taken to note the presence or absence of those
disorders in the subjects of this research; and 5) a general overview of color research,
particularly as it may involve memory retention.
28

19
Color Research
An overview of recent research that relates to color, with particular emphasis on
studies pertaining to color as associated with memory retention, follows. By far the
largest and most extensively considered studies on color and its relationship to human
learning recently conducted have been those by Dwyer and by Lamberski. Dwyer and
associates conducted over 100 experimental studies from 1965-1981 involving
approximately 48,000 subjects. The studies, which were conducted at the Pennsylvania
State University, are, to date, "the most comprehensive and systematic attempt to identify
those variables which are most effective in increasing students information acquisition
relative to specific learning objectives", according to Dwyer (Dwyer, 1982, p. 23).
Dwyer offers extensive information and conclusions on the use of color in educational
materials.
However, since the Dwyer studies, though massive, deal only with color as either a
cueing or coding mechanism when used in printed (subtractive) colored diagrams, and,
since all of Dwyer's subjects took the same trial of this single model, it is doubtful that
most of the results and conclusions could be applied to this current study beyond broad
generalizations. Dwyer does not study the single aspect of color nor does he attempt to
describe the colors used in his study in any detail or by using any recognizable standard of
description. Dwyer discusses the difficulties and realities that face anyone dealing with
conducting research and with looking at previous studies upon which to base such
studies. Several suggestions that arise from the Dwyer studies include the following
realizations.
29

20
1. "Because of the lack of broad and specific studies of individual factorswithin the field of the relationship to color and human mental processes,educators have no real way of knowing whether or if any particular type ofvisual presentation is more or less effective than another in transmittinginformation;
2. Because of the paucity of studies which concentrate on the specific values ofspecific colors when used in specific mediums little can beconcluded as to their direct effect on any specific area of human mentalprocesses such as in that of retention;
3. Even though evidence shows that color plays an important role in memoryretention when used as either a cue or as a coding device, more study isneeded to determine whether individual colors or wavelengths of lightthemselves have any direct relationship to memory retention" (Dwyer,1982, p. 24).
Dwyer's studies showed a clear advantage in retention to color coding (i.e. using
colors to show blood flow in a diagram of the heart) of printed materials when compared
to the same materials when presented in black and white (Dwyer and Moore, 1992, p.
195), and (Dwyer and Moore, 1995, p. 176).
Again, Dwyer points out that "the results . . . provide substantial evidence that
colors, in fact, are a viable instructional variable," but he does not attempt to explore the
subject beyond coding, cueing, and cognitive style (Dwyer and Moore, 1992, p. 195).
Neither is an effort made by Dwyer to isolate particular colors as to their effect nor to
determine the value of any individual color on this regard. It should be noted that 8,000
of the subjects in the Dwyer research were high school students who were from the ninth
through the twelfth grades and could be seen as complimentary to studies on color and
memory conducted on students below college age. Another individual who has recently
studied the relationship between color and remembering is Pruisner. In these studies,
conducted in 1993 (Pruisner, 1993, p. 1), and 1995 (Pruisner, 1995, p. 1), Pruisner
examined the role of color as a coding mechanism in graphic (printed) materials as it
30

21
might effect the recall of verbal material. Again, the obvious shortfall in contributions to
a study in color and memory are as follows.
1. The use of color as a coding mechanism rather than as a single variable;
2. The use of color in a subtractive medium (printed form) rather than in
an additive medium (CRT display); and
3. The use of color as an element that was a representative of realism in
pictures relating to a Norse myth rather than a consideration of color as
a single entity.
Also to be considered is, that in Pruisner's (Pruisner, 1993, p. 1), 1993 studies in
remembering graphic information as in the recall of verbal material, certain elements such
as: a) the use of systematic color coding in graphic presentations and b) the use of
systematic color coding in the combination of color presentation and color assessment,
were shown to be of a positive effect (Pruisner, 1993, p. 1), while "the 1995 study shows
that the use of color did not have an effect on the recall and retention of verbal
information" (Pruisner, 1995, p.1). These discrepancies present a conflicting view at
best. Some contributions that Pruisner might be able to add, beyond generalized concepts
and the suggested value of continued research, are in the sample of subjects studied.
Pruisner used groups of 30 seventh grade students for the trials, and this would add to the
justification of subject size and age for this research.
Additional support for subject age and methodology could be seen in a study done
by Lo Bello where students from second to sixth grades were shown projected slides with
nonsense syllables printed in back type using different colored backgrounds for a
31

22
time interval of seven seconds per slide. The test was conducted with subjects who were
dyslexic. Lo Bello found two important considerations. First, he indicated that he had
found in his examination of the effects of colored backgrounds on the ability to
pronounce pseudo-words that pronunciation was not effected by background color (Lo
Bello et. al., p. 16). Secondly, he suggested that a "better strategy would be to use a
computer program that can vary background color on a screen" (such as Power Point ®)
(Lo Bello et. al., p. 19).
It should be noted that while the Lo Bello research showed that "background color
is not significantly related to phonological processing ability," it did not consider, aspects
of color as it may relate to memory retention (Lo Bello et. al., p. 19). Lo Bello also
mentioned the relative cost effectiveness of conducting such studies using computer
programs when compared with other media (Lo Bello et. al., p. 20).
In a study evaluating the differences in effect between alphanumeric, graphic, and
color presentations on CRT displays, Tullis states that "the effects of graphics and color
on human performance is highly dependent upon the complexity of the particular task"
(Tullis, p. 542). It must be noted, however, that Tullis did not consider color as a single
variable but only as broad element of the presentation type, i.e. if colored graphs were
different in effect than the same information displayed using a text only format. Also to
be considered is that the Tullis study was conducted prior to the mass acceptance of the
increasingly popular Windows® graphic format in the interface (GUI - Graphic User
Interface). Tullis was again using color only in a coding context and made no
consideration for color contrast or conflict, readability, or user preference. This can be
32

23
evidenced by some of the comments of his subjects who indicate, in their own words,
"states of confusion, distraction, hardness on the eyes, and difficulty to read because of
color" (Tullis, p. 548). These comments not only indicate his use of conflicting colors
but also the importance of the need for continuing research in the discriminate use of
color in presentations upon CRT display screens.
Another study that may contribute to this review was conducted by Pett (Pett and
Wilson, p. 20). Their study was a meta-analysis of previous research and is an excellent
source of insights on subjects related to color and learning. Additional conclusions from
other studies that may relate to this review are included in the following list.
1. "The color of objects appears to be constant regardless of the energydistribution of the light source" (i.e. incandescent, fluorescent, natural, ormixed) (Pett and Wilson, p. 20).
2. The capacity of certain colors to physiologically arouse persons needs to beconsidered in research. According to Pett (Pett and Wilson, p. 21) it was foundthat the color red has been shown to produce higher anxiety rates and that itincreases heart rate when compared to blue or green.
3. In many of the previous studies conducted on colors, the colors used have notbeen adequately specified, with the exception of those who have used preciseMunsell color designations. (Pett and Wilson, p. 23). Again, thisdemonstrates the need for the use of a designation system for color descriptionthat is both precise and acceptable for replication such as the two (2) digithexadecimal code. Note must be made that these previous studies utilizedcolor as derived from the subtractive medium, such as in printed material,and that studies such as those mentioned by Pett and Wilson (Pett and Wilson,p. 31), which considered color as a reference on a CRT display, should,therefore, be continued.
4. Based on several studies, there appears to be a relationship between color usedand memory retention but that the specific elements and their relationshipsneed further study (Pett and Wilson, p. 26,27).
5. When used on CRT display there is apparently no strong relationship betweenthe color used and the time interval used in the examination. The most
33

24important influence on preference appears to be that of saturation (low saturationof color is preferred). It also appears that black, for text color, provides the bestcontrast with most background colors (Pett and Wilson, p. 28, 29).
When reviewing the related research on the relationship of color to human learning,
a threshold of practicality eventually arises because of the hundreds of studies conducted
on the many variables and aspects of those subjects, whether combined or separate. It
becomes impractical to examine completely every one of the hundreds of color related
studies. A more efficient approach seems to be the examination of some of the larger
overviews of the subject which were conducted over longer periods of time than those
allowed for in this paper. Lamberski is, perhaps, second only to Dwyer and associates in
contributing to the field of color research. Lamberski is noted both for his experimental
research on color and for his extensive review of previous related research. Lamberski
agrees with Dwyer on the basic problem of sorting out, from the myriad of studies, just
how color research may effect the educational environment. Dwyer says, in his extensive
review of research, "there is very little experimental evidence available as to how the
addition of color to various types of visual illustrations will affect students achievement
. . . and . . . guidelines for the use of color should be established as quickly as possible"
(cited in Lamberski, 1975, p. 3). It should be noted that while this current study will not
resolve the debate on the subject, it anticipates a contribution to the mounting body of
evidence for the importance of the use of color in instructional media.
Most of Lamberski's work on color centered around color vs. black and white as a
coding mechanism. An overview of his research provides an inconsistent conclusion as
to the relationship of color coding to different elements in human learning, inferring that
34

25
additional research is needed. In his eight year review of several hundred references on
color research, Lamberski cites several others who themselves conducted reviews of
related research. Lamberski's reviews, then, could be considered as a meta-review and,
as such, he offers some important conclusions and observations. Perhaps the most
relevant connections to this review are in the following list.
1. In spite of vast amounts of research, only a few generalizations about thespecific role of color in the learning process can be made (such as color as acoding mechanism appears to enhance retention, and that some colors appearto increase aspects as legibility and contrast) (Lamberski, 1980, p.9).
2. Conclusions are difficult to correlate because of limitations in experimentaldesign (Lamberski, 1980, p.9) (which include non-standardization of colordescriptions).
3. "Color may have a direct, but difficult to determine, relationship betweencolor and retention or recall in certain types of presentations" (such as whenused as a coding mechanism in diagrams and charts which are presented usingsubtractive media) (Lamberski, 1980, p.10, 12).
4. Once encoded, color may "inhibit forgetting and facilitate delayed retention"(long-term memory) but, that "further investigations are necessary tosubstantiate, this proposition" (Lamberski, 1980, p.16).
5. "The questions of the value of color on retrieval tasks appears to have nosimple answer" (Lamberski, 1980, p.21).
6. "The relationship of color to time remains unclear but, appears to be relatedto the perceptual task, code strategy, and required response" (Lamberski,1980, p. 29).
In completion of this current review of related literature concerning research on the
relationship of color to human memory learning and retention, it should be obvious that
the conclusions are inconsistent across the field. There is also an admitted need by those
in the field for further research and more precise methodologies (such as the use of CRT
screens and hexadecimal descriptions for colors).
It should also be added that some type of learning machine has been utilized by
humans throughout modern history. These machines and concepts include the ancient
35

26
abacus, the punch cards of Jacquard, the considerations of the use of binary codes in
memory research made by Miller, in 1956, the use of teaching machines by B. F. Skinner
in 1961. The use of the advanced computer systems of today extend the need to
understand the most effective ways to use and develop instructional materials for their
application. This need for understanding the elements of human technology and education
has remained constant.
Introduction to Current Memory Research
The related research material discussed in this paper has been included to provide,
in general, an historical perspective for the understanding of classical research on both
color and memory as it may relate to this current study. The reader should understand
that memory research continues with the application of more technical methodologies
than previously used. Advanced technologies should provide future researchers with a
more thorough and explicit understanding of the relationship between external stimuli of
the various senses and the operations of the human brain.
Overview of Current Brain-Memory Research
In an overview of current brain-memory research methodologies it appears that
much of the observation of brain-based activity is being conducted on two main fronts.
The first is in that of Psychology which often uses a behaviorist model of studying
internal function by the observation of external stimuli and response. The second area of
concentration is in the Biological or Physiological examination of the internal mechanics
and mechanisms of the brain to deduce some measure of operation. The bulk of
biological function research is currently being done through the use of the two main
36

27
technologies of more sensitive Electroencephalography (EEG) and of Positron Emission
Tomography scans (PET). EEG studies involve the examination of the electrical activity
of the brain as registered through highly sensitive electrical leads attached to the scalp
(McConnohie, interview, June, 1999). PET scans follow certain injected chemical tracers
through the human brain during certain activities in order to image specific locations for
brain activity (Jensen p.16).
Recently, PET scans have produced the greatest impact in understanding how the
human brain functions. By tracing the flow of glucose mixed with an ionized tracer such
as 015 as it travels through the brain during certain activities brain activity can be
localized to a resolution of approximately 1 to 2cm (Luger, et.al., p.176). PET scans have
greatly enhanced our understanding of the exact areas of the brain that are involved
with particular activities and with diagnosing certain brain dysfunctions. One of the areas
that is being explored is that of the parts of the brain involved with memory. It has been
found that memory is more holistic (Jensen, p. 38) and involves more areas of the brain
than previously thought. Human memory is linked to emotions in the amigdala, while
formation and storage of memory involves the hippocampus. At the same time the
thalamus and the hypothalamus regulate our emotions while the limbic portions give us a
sense of reality to our experiences (Jensen, p. 28-29). The hippocanthus area of the brain
is related to the most recent discoveries in memory research.
It is currently believed that the process of creating lasting memories begins when
the neuron's endings, or dendrites, receive the initial signals of a particular stimulus.
Those signals induce reactions involving protein kinase A, which in turn set off the
37

28
cyclic amp-response element binding protein (CREB) activator in the nucleus. The CREB
protein then activates genes in the cell's DNA. The genes are then converted into
messenger RNA which is then used as a blueprint to produce proteins that secure a
memory. This process takes place upon receiving a stimulus and apparently takes about
an hour to recycle. The recycling is associated with long-term potentiation (LTP) in the
establishment of long-term memories. LTP is the tendency of an activated synapse to
lower its threshold. Lowering the threshold of the synapse makes it more likely to
transmit a signal in the future and so effectively strengthens the connection (Creb and
memory, 1997). Additional recent neuroimaging technologies that are being used in brain
research and subsequently in memory research use magnetic fields and measurements of
the electrical activity of the brain.
Electrical activity of the brain is most often measured using the venerable yet often
more cost productive electroencephalogram (EEG). "The newer, more sensitive,
computer enhanced EEG machines are still the mainstay in basic brain diagnosis and
research for reasons of cost, relative ease of use, speed, availability, and lack of potential
side-effects to the subject" (McConnohie, interview, June, 1999). The primary drawback
of the EEG is its imprecision in detecting smaller locations of activity and direct
relationships between brain areas when compared to more recent technologies. One
technology that is gaining popularity in research is Magnetoencephalography (MEG)
which detects the magnetic fields within certain populations of neurons in the brain.
Since these magnetic fields are not diffused by either the skull or scalp greater resolution
and detection of subcortical events can be obtained (Luger, p. 176).
38

29
Another new technology based on nuclear magnetic resonance is Functional
Magnetic Resonance Imaging (F-MRI). F-MRI can detect changes in blood chemistry
associated with the activation of brain regions and can compare those with images of
resting states to analyze brain functions (Luger, et.al. p. 176).
Current Considerations in Memory Research and Theory
According to Luger and Johnson (Luger, et. al. p. 80) the technologies previously
mentioned in this paper, as well as behaviorist models of research, are currently being
used to develop understandings and applications for Cognitive Science. Luger discusses
a brief history of recent methodologies used in memory studies from Tulving and
Donaldson (cited in Luger, et.al. p. 77), who distinguished between episodic and semantic
memories, to the most recent schema based approaches. The schema based view sees
memory as being interconnected rather than compartmentalized in nature.
A schema based approach to memory research might also include such
considerations as the current chaos model for seeking to describe complex processes.
Comprehending the fractal nature of human mental activity in describable terms is not
new, however. Aristotle struggled with the constant flux of mental caprice centuries ago.
It is doubtful that even he could have guessed the degree of complexity involved in the
world as we know it or that there is an apparent higher level of order within the seeming
chaos. A schema based view could perhaps see that life exists in "a universe where order
is found in patterns and processes of such scale and complexity that prediction and
control are difficult or impossible" (Euster 1994) at current levels of technology and
understanding. However, the researcher must not throw all hope to the wind for,
39
30
in research, as in life, "there are those forces, strange attractors, that limit chaos, and
patterns of order are apparent around these central tendencies" (Euster 1994).
Bringing a sense of order out of seeming chaos is, of course, the function of
randomization, sampling of populations, minimizing variables, and other factors in the
methodology of research. It could also be observed that any endeavor, particularly one
involving more than a single subject, must fit both the deliberative and chaotic models or
else they become stagnant. An example is found in the curriculum and the classroom.
Both seek to establish a sense of order and structure but, are able to adapt to the
differences in individuals and cultural applications over time and so exhibit fractal
qualities (Goff, 1998). No research, even on a single human subject, such as Ebbinghaus,
can eliminate all variables outside the study. Such work must rely on the precedents of
scientific method, randomization, and proper sample size to approximate a conclusion in
any research.
Another attempt to grasp the larger chaotic elements of understanding and
research was expressed by the Gestalt approach as alluded to earlier in this paper. The
Gestalt approach to memory study dictates that "the whole is qualitatively different from
the sum of its parts" (Rock, p. 11). The Gestalt approach was not able to fully explain the
stimulus perspective of human perception any more than the empiricist approach did and
was eventually supplanted by those researchers working in the psychophysical tradition
(Rock, p. 12). By the 1940's the psychophysical tradition lost its appeal and was replaced
by a newer discipline of the information processing perspective of perception called
Cognitive Psychology. Clearly, the complexity of human mental function mandates that

31
hypotheses of research must continue to evolve until we reach an "adequate unified
theory of all the phenomena of perception" (Rock, p. 12). In short, Rock says "while we
cannot observe people's perceptions per se, we can confirm or disconfirm their generality
and infer whether or not they actually occur" (Rock, p. 14) .
To illustrate how complex the study of the brain is and how little is actually
understood about human mental potential, Jensen (Jensen, p. 37) cites a study conducted
by Lorber (cited in Jensen, p. 37) who "found 150 adults with virtually no nerocortex (5%
or less because of hydrocephalic disease). They had normal basal and limbic structures,
but the neocortex area was 80% water . . . these 'brainless' people had IQs ranging up to
120. Many had advanced degrees, got along well with others, and had normal lives."
(Jensen, p. 37).
Another example of the remarkable ability of the human brain is found in studies
done by Sperling (Houston, p. 249) in iconic memory, where his subjects were shown a
slide of 3 rows of letters with 4 letters in each row. The slide was flashed for 1120th of a
second and subjects were asked to recall what they had seen. Without special instructions
they were able to report no more than 4 or 5 without error. The second phase of the
experiment involved an audible tone that was produced immediately after viewing a
second series of letters for 1120th of a second. A higher pitched tone indicated that they
should recall the top row of letters; a mid-range tone for the middle row; or a low tone for
the bottom row. Sperling (cited by Houston, p. 249) reported that by using a tone
subjects were able to recall any row with 100% accuracy.
41

32
While there are many names that are used describe and classify memory (e.g., short-
term, long-term, positive and negative, surface and repressed, active and passive) the
more recent descriptors are episodic and semantic or taxon memory. Episodic memory is
contextual and is stored in relationship with a particular geographic location or
circumstance. Semantic memory is thought to be based in content such as information
found in a book, list, or a computer (Jensen, p. 204).
"Prior to the 1960s the two-factor theory of interference dominated the field of
forgetting and retention" (Huston, p. 242). There are now many models of memory with
more emerging frequently. While the Separate-Store Model developed during the 1960s
and the Levels-of-Processing Model appeared in the 1970s, the Semantic-Network and
Cognitive Science approach are currently in vogue. Terminology that runs across these
various models and yet is not exclusive to any of them involves three known components
of memory. The three components that describe our present understanding of memory
are: encoding, storage, and retrieval. Murdock (1974) (cited in Houston, p. 242) defines
encoding as "the process by which the nervous system develops a representation of an
external stimuli" (Houston, p. 242). He goes on to define storage as "the persistence of
encoded material over time" (Huston, p. 242) and retrieval as "the utilization of this
stored material" (Houston, p. 242).
In relation to the Separate-Store Memory Model Houston (Houston, p. 244) states
that, in terms of primary (short-term) and secondary (long-term) memory, "a string of
dozens of digits (or letters) would be difficult to store in primary (working) memory but
that most people can handle 5, 6, 7, 8, or 9 items without too much difficulty" (Houston,
42

33
p. 244). Houston (Houston, p. 67) also suggests that performance tends to increase with
practice but, may relate to different types of learning tasks (e.g., word-list recall, classical
conditioning, instrumental conditioning, discrimination learning, serial learning, paired-
associate learning, free recall, priming in lexical decisions, concept formation, and
problem solving) (Houston, p. 22).
According to current brain research certain long held methodologies of learning
are counter-productive to the educational environment when considered against the
holistic nature of the individual. Learning appears to take place best when approached
using a pulse-style rather than a concentrated effort over a longer time span. Jensen
(Jensen, p. 48) states that "learning is best when focused, then diffused, focused, then
diffused. Constant focused learning becomes increasingly wasted over time. In fact,
Jensen continues, the whole notion of 'time on task' is biologically wrong and
educationally irrelevant" (Jensen, p. 48).
Another element in perception-memory research not previously discussed in this
paper is that of afterimaging, both on the CRT and in the human body. Rock (1997)
(Rock, p. 99) used the colors magenta and white as projected on a CRT for his studies.
Geometric figures were produced with an interstimulus interval of 397ms for three-
component figures and 251ms for four-component figures with an on-screen time of
67ms (Rock, p. 88). Since the residual energy level of the screen phosphors returned to
the baseline black monitor background within 4ms, afterimages were considered not to be
present (Rock, p. 104). Howard indicates that (Howard, p. 20) in some cases a mental
43

34
afterimage was held in store after the stimulus had gone off. The mental afterimage of
the 12 characters shown in the studies by Rock lasted long enough for the subjects to
mentally scan each letter some 10 ms.
According to Jensen (Jensen, p. 42) there are a number of external and biological
factors that effect human memory. Some of these factors include time of day, age,
biological rhythms, and gender. Englund (cited in Jensen, p. 42) found that overall
intellectual performance is greatest in the afternoon and that comprehension increases
while reading speed decreases as the day progresses. Jensen (Jensen, p. 42) indicates that
in general, short-term memory is best in morning and long-term memory is best in
afternoon. Brewer and Campbell (cited in Jensen, p. 45) found the brain to be 15% more
efficient for short-term memory from 9 - 11 AM while semantic cerebral process is
generally more efficient in the afternoon and that a 2 to 4 hour variance between
individuals can be expected. May (cited in Jensen, p. 46) found that young adults do
better on memory recall in the afternoon while older people performed better in the
mornings. Jensen (Jensen, p. 46) infers that no matter what time of day a topic is
presented it is likely to be out of sync with about one-third of the learners but that more
meaningful information is generally grasped better in the afternoon.
Jensen (Jensen, p. 42) indicates that natural human biological rhythms are also
linked to brain function and memory. An interesting example of a biological rhythm
associated with brain function is seen in cycles of breathing. According to Jensen
(Jensen, p. 42) humans breathe through one nostril for three hours and then the body
44

35
alternates to the other nostril affecting which hemisphere of the brain is used. Klein and
Armitage (cited in Jensen, p. 43) found alternating periods of efficiency for brain
hemispheres and that when spatial activity is high verbal activity is lower.
One additional consideration of biological influences on human memory and
learning that may have some relevance is that of gender. Researchers say that the female
brain is very different from the male brain with regards to function and perception
(Jensen, p. 88). They indicate that females excel at verbal memory and process language
earlier, faster, and more accurately (Jensen, p. 88). In addition, females are more
sensitive to the red end of the spectrum, excel at visual memory and context, and can
store more random and irrelevant visual information than males (Jensen, p. 89). Jensen
indicates that studies have found that female learning and performance levels changed
throughout the female cycle, varying with estrogen levels (Jensen, p. 49). In the study on
hormonal influences on the brain it was found that estrogen, which promotes brain
alertness, more active brain cells, and increases sensory awareness is found alone in the
first 14 day half of the female cycle. During the second 14 day half of the cycle
progesterone, which reduces cerebral blood flow, oxygen and glucose consumption, and
which produces sluggish, unmotivated behavior, is introduced into the system (Jensen, p.
49). Concurrently, Jensen indicates that other studies found that, in males, when
testosterone levels are lower spatial ability is higher and that male temperature cycles also
affect attention and learning (Jensen, p. 50). Jensen (Jensen, p. 50) also mentions sleep
and rest as influencing human brain function. He infers that "students from abusive
45

36
families, overcrowded homes, or affected by divorce, death of a loved one, violence or
poor nutrition are impacted" (Jensen, p. 50). Research in France (Jensen, P. 51) shows
that a loss of even two hours of sleep may impair recall ability the next day.
Lastly, Jensen (Jensen, p. 55) states that "our brain responds faster to wavelengths
of color, lightness and darkness, motion, form, and depth" (Jensen, p. 55). Jensen
continues by suggesting that over 90% of all information that comes to our brain is visual
and involves the spectrum of light which is seen in a range of between about 400 through
700 nanometers in length (Jensen, p. 55). Jensen also says that "we may want to be
taking much better advantage of this capacity" (Jensen, p. 55).

Chapter 3
METHODS AND PROCEEDURES
Design of the Study
This study utilizes a traditionalist positivist paradigm. It operates under a modernist
ontological assumption with a quasi-experimental, within-subject, passive design. It also
uses a quantitative design in the collection and computation of data. For an amplified
explanation of this terminology see Appendix J. Subjects in this current study were
exposed to the stimuli of alphanumeric characters upon various colored backgrounds.
Subjects were expected to mentally encode that stimuli using no external memory support
systems (i.e. notes, sharing with other subjects, etc.) (Scruggs & Mast., p. 97) and then to
retrieve the encoded stimuli immediately following each exposure and again after one
hour. This action was used to determine the effect of various colors on the encoding-
retrieval process over time (i.e. short-term and long-term memory). Analysis was
conducted on the data gathered and results are reported in this paper.
This study utilizes the PowerPoint 95® presentation software for Windows 95®
developed for the PC system. PowerPoint 95 ®, while not being the most technical in
capabilities or descriptive properties, is relatively easy to use, widely accepted as a
presentation medium, relatively inexpensive, accurate in color variation, productions,
37
47

38
and descriptive qualities. Power Point® is also available for use on either PC or
Macintosh® computer systems. All of this is both relevant to this current study and to
those who might seek to replicate it.
One last consideration that must be made within this current study is the estimation
of the gamma values of the monitor used within this and future research. Gamma is a
measurement attained by a mathematical formula that reflects a relationship between
electrical voltage input and the brightness of the image on a CRT monitor screen.
Gamma values are important in order to accurately produce colors on a CRT screen and
should be a consideration in all studies involving the use of CRT screens. Gamma values
can be estimated by viewing a gamma estimate scale as seen on a particular monitor. See
Appendix H for information regarding the scale used for this current study. In
conclusion, there seems to be a need for more studies in the field of color as it relates to
human memory retention. There also appears to be sufficient justification in the related
literature for additional study and for the methods and procedures used within this current
research project.
Subjects
Subjects include 28 students (eight boys and twenty girls) who were enrolled at a
public school in Tennessee. Their ages varied from approximately 11 to 14 years.
Students were placed into this classroom according to county, state, and school admission
guidelines which allow for placement as enrolled on a first come basis. The number of
students in the study was determined by random placement according to enrollment for
the 1998-99 school year. The county in which the school is located has no current
48

39
requirements or forms for approval of requests to do research in that county. This
decision is left to the discretion of the individual principal to accept requests for research
of this type. The principal approved the proposal for study and was responsible for
selecting the class that would participate in the trial. The students were enrolled into
regular programs and placed into a single, self-contained, 2 1st Century classroom.
Subjects were comprised of students enrolled into a combined class of 6th and 7th grade
students. The students were from moderately low to low income homes which are
located in a rural, mountainous area of Appalachia.
Environment of Study
The school is located in a rural Appalachian community in eastern Tennessee.
There was no carpeting on the floor of the classroom used in this study, and the flooring
had a semi-gloss hard surface. The room was painted in neutral shades of off-white to
gray and was lit by a combination of sunlight and fluorescent overhead lighting. The
sunlight that was somewhat filtered by venetian blinds which were open approximately
60 percent. The fluorescent lighting was suspended from the ceiling to an approximate
distance of ten feet above the work area. There were no bulbs unlit or missing in the
double-tube plastic lens covered fixtures which were four feet in length. There were eight
fluorescent fixtures, and they contained white or off -white bulbs.
The combination of sunlight and fluorescent lighting produced an acceptably neutral
light source for observing color, particularly those produced by a CRT computer monitor.
The PC platform computer and monitor used for this study was located in the west end of
the room, facing the windows and within eight feet of the teacher's desk.
49

40
Because the subjects were placed facing the screen, with their backs to the windows, there
was no detectable glare on the monitor screen as their bodies provided an adequate block
against glare. The CRT screen continued to be lit with ambient light from the two
independent sources. The display face of the computer monitor CRT screen was not in
clear direct sight of those in the class who were not actively involved in the small sub-
groups who participated in viewing the slides, in turn. Treatments were given between
11:00 A.M. and 3:00 P.M. during the regular school day.
Selection and Screening of Subjects
The selection of these subjects was not under the control of this researcher but may
not represent a true randomization of sample or of a population. Subjects were screened
prior to the study for color-blindness using a modified Ishahara Test. The Color Vision
Guide®, as designed by Dr. Keith Nash and as accepted by the National Science Teachers
Association, was administered to each subject individually to determine the presence of
conditions of color blindness that would prevent any of the subjects from perceiving the
colors used in this study. It was expected that, because of the high ratio of girls to boys in
the sample, that there would be a low probability of color blindness within the sample.
Any subjects that tested positive for color blindness were to participate in the study but
would be excluded from the results. There were no instances of color blindness detected
within the sample.
Time Interval Investigation
A pilot test was conducted to determine an acceptable time frame for each exposure
of each slide to be used in the larger study. The pilot test was similar in construction to
50

41
the methodology of the larger study but was conducted using white sheets of paper with
black lettering rather than a CRT medium. In the pilot study 12 students of ages which
were comparable to those subjects involved in the main study were selected at random
from a different class. Subjects were shown three sets of paper cards with black
characters on white backgrounds similar to the treatments in the main study. Subjects
were shown one set of three cards at a time with a 10 minute delay between sets . A
different time interval was used for each separate set of cards. The students were initially
given twenty seconds per card to remember the characters and were asked to write down
as quickly as possible, following viewing, what they recalled, in the order seen (i.e. the
order on each card and in each set). This process was administered two more times with
time intervals of ten seconds and five seconds accordingly. The answer sheets were
collected and individually checked by the researcher for errors. The results indicated that
twenty seconds was too long, allowing for almost complete recall of characters. It was
also seen that an interval of five seconds per card was not sufficient for retention of the
characters, with the most misses being observed. It was determined by the pilot study
that a ten second time interval for viewing each card was adequate for measuring
retention of the characters and for use on slides presented in the main study.
Preparation of Materials Used in Treatments
The slides used in this current study were produced on a PC computer system that
was not the computer used for the treatments in this study. The use of different hardware
to prepare the slides does not compromise this current study because of the nature of the
presentation software used. PowerPoint 95® was selected for this current study for its
51

42
accuracy in color production, ease of operation, wide range of colors, and for its ability to
be installed via the "Pack and Go" feature onto any computer system that uses a Windows
95® operating system. The "Pack and Go" feature operates accurately regardless of
whether or not the full version of Power Point® has been installed on that particular
system. The slides used for this current study were prepared. The "Pack and Go" function
was then utilized to save the both the presentation as well as the Presentation Viewer that
would be needed to run and view the presentation onto 3.5 inch high density floppy discs.
The presentation was taken to the school used for this current study and, with the
permission of the principal and teacher, installed into a separate folder onto the hard drive
of the computer that was utilized for the study. Color values for the slides were
determined prior to installation by using the custom color functions within PowerPoint
95® and were checked for hexadecimal code description via an Internet website designed
for that purpose. See Appendix I for location of a tool for describing color in hexadecimal
terms. This researcher sees the use of three (3) slides with three (3) characters each (for a
total of nine single characters for the series in each color variable) and for a single
exposure for each color/character set as having an acceptable margin of probable error for
this study. Cost and practicality were contributing factors that were considered in the
selection of materials used for this current research both for the initial study and on behalf
of those who might later replicate it.
Treatment Used in the Study
In the main study, the subjects were shown three sets of slides on three separate occasions.
Subjects, who had been enrolled in the class as described, were chosen by the teacher to
BEST COPY AVAILABLE
52

43
participate in each treatment and were assigned into five groups of no more than six
subjects. Subjects were asked to position themselves from one to six feet from the
computer monitor CRT screen so that there were no obstructions to clear vision. They
were asked not to talk to others, not to share answers, and to listen to brief instructions
concerning the treatment. In the instructions, the subjects were told that they would be
shown three slides, that they would have ample time to memorize the information, and
that they would be asked to write down what they remembered immediately following
viewing. Writing instruments (Bic® pens) were in the control of the researcher until
answers were to be given (to prevent writing answers during treatment and changing
answers following initial reporting of items recalled). Answer sheets and pens were
distributed immediately following treatment and were collected by the researcher when
completed. Subjects were in close proximity to the researcher and were observed for
compliance.
In treatment number one, the set of slides consisted of pure black, 200 point Lucida
Sans Unicode /TrueType® alphanumeric characters upon a pure white background.
Subjects were shown each of three slides for ten seconds. See Appendix L for example of
font style, type size, and character selection. The time intervals of the slide presentation
were not under the subject's control but was an automatic function of the presentation
software and was determined and pre-set to ten seconds per slide by the researcher. To
evaluate short-term retention of the information, subjects were asked, immediately after
viewing the slides, to write down only what they remembered in the order and sequence
53

44
of their appearance on each slide and series of slides. Answers were written on a prepared
sheet of paper, on which was drawn a cube, which was divided into nine equal blocks
arranged in three rows of three. Subjects were told that there were no passing or failing
scores and no right or wrong answers (to diminish test anxiety i.e. there will be no
negative effects for not remembering). Results were counted by determining the
characters listed correctly both in order and sequence. To evaluate long-term retention, a
second post-test was administered one hour after viewing the slides with the same
instructions and a different sheet of paper, prepared and administered in a similar fashion.
Writing instruments (pens) were distributed and controlled by the researcher and care was
taken that answers were not shared between subjects by the use of blank cover sheets
(which were checked at random for markings that might assist them in their answers).
The second treatment was administered at least one week following treatment one.
Treatment two was comprised of a set of slides that utilized pure black alphanumeric
characters of the same specifications as in treatment one on a pure blue background with
each of the three slides being viewed for ten seconds as in treatment one. Testing for
short-term and long-term retention was conducted as in treatment one.
The third treatment was administered one week following treatment two. The third
treatment was comprised of a set of slides that used pure black alphanumeric characters
of the same specifications as in treatment one upon a pure green background with each of
the three slides being viewed for ten seconds as in treatment one. Testing for short-term
and long-term retention was conducted as in treatment one.
54

Chapter 4
RESULTSStatistical Analysis
Answer sheets were collected by the researcher following each test and remained
under the control of the researcher for computation of the results. Answer sheets were
examined by using a master list of the characters to check the order and sequence for each
slide and set of slides. Correct answers were noted for both order on each slide and
sequence for each set of slides in each of the three color groups. Characters that were out
of order or out of sequence were scored as incorrect. Answers that were either in order
but out of sequence or vice versa were not considered for the study. Correct answers
were noted and entered into SPSS® for analysis. A mean score was determined from the
scores and paired samples comparison t-tests were conducted on the means of the raw
scores. All scores and results were double checked by the researcher and an independent
source, (Cerrito).
Analysis of Data
There were three different trials labeled 1, 2, and 3 representing different color
schemes. Trial 1 utilized a white background; trial 2 utilized a blue background; and trial
3 utilized a green background. All three trials utilized black as the color for the
alphanumeric characters. There were two time values representing 0 time (immediately
following treatment) and 1 hour following treatment. Each trial had a possibility of nine
45
55

46
(9) correct responses for each time reference (time 0/time 1). Each subject was scored
using the number of correct (order and sequence) responses. All responses for all three
trials and for both time references in each trial were entered into a MS Excel® spreadsheet
for use in the SPSS® statistical software. In addition, there were 28 total subjects
although not all subjects took all trials. 25 subjects took all three trials. One subject did
not take trial 3 due to absence from the class. Three subjects were new students and so
were absent for trials 1 and 2 but did participate in trial 3. The data were analyzed using
t-tests and the results are discussed in the following paragraphs and tables.
Consideration of Hypotheses
Hypothesis one is retained as the results show no statistically significant difference
at the .05 level of significance in memory retention between time 0 and time 1 when
using black text upon a white background (trial 1). 26 subjects took this trial and had a
mean difference between scores from time 0 to time 1 of (.4615) which resulted in a
significance of (.143) which is not statistically significant at the .05 level. See Table 1.
TABLE 1
TABLE OF COMPARISON BETWEEN TIME 0 AND TIME 1WHEN UTILIZING A WHITE BACKGROUND (TRIAL 1)
Groups N Mean MeanDifference
Std. Error ofMeans
t-ratio Sig.2-tailed
White T/0 26 7.6923.4615 .3050 1.513 .143*
White T/1 26 7.2308*Not Significant
56

47
Hypothesis two is rejected as the results demonstrate a statistically significant difference
at the .05 level of significance in memory retention between time 0 and time 1 when
using black text upon a blue background (trial 2). 26 subjects took this trial and had a
mean difference between scores from time 0 to time 1 of (.9615) which resulted in a
significance of (.034) which is a statistically significant loss of memory over time at the
.05 level. See Table 2.
TABLE 2
TABLE OF COMPARISON BETWEEN TIME 0 AND TIME 1WHEN UTILIZING A BLUE BACKGROUND (TRIAL 2)
Groups N Mean MeanDifference
Std. Error ofMeans
t-ratio Sig.2-tailed
Blue T/0 26 7.5385.9615 .4278 2.248 .034*
Blue T/1 26 6.5769* Significant < .05
Hypothesis three is rejected as the results demonstrate a statistically significant
difference at the .05 level of significance in memory loss between time 0 and time 1 when
using black text upon a green background (trial 3). 28 subjects took this trial and had a
mean difference between scores from time 0 to time 1 of (.5357) which resulted in a
significance of (.045) which is a statistically significant loss over time at the .05 level.
See Table 3.
57

48TABLE 3
TABLE OF COMPARISON BETWEEN TIME 0 AND TIME 1WHEN UTILIZING A GREEN BACKGROUND (TRIAL 3)
Groups N Mean MeanDifference
Std. Error ofMean
t-ratio Sig.2-tailed
GreenT/0 28 7.3214.5357 .2545 2.105 .045*
GreenT/1 28 6.7857* Significant < .05
Hypothesis four is retained as the results show no statistically significant difference
at the .05 level of significance in memory retention between time 0 when using black text
upon a white background and time 0 when using black text upon a blue background. 26
subjects took these trials and had a mean difference between scores from time 0/white to
time 0/blue of (.1538) which resulted in a significance of (.703) which is not statistically
significant at the .05 level. See Table 4.
TABLE 4
TABLE OF COMPARISON BETWEEN TIME 0 USING A WHITEBACKGROUND AND TIME 0 USING A BLUE BACKGROUND
Groups N Mean MeanDifference
Std. Error ofMean
t-ratio Sig.2-tailed
White T/0 26 7.6923.1538 .3988 .386 .703*
Blue T/O 26 7.5385* Not Significant
Hypothesis five is retained as the results show no statistically significant difference
at the .05 level of significance in memory retention between time 1 when using black text
upon a white background and time 1 when using black text upon a blue background. 26
subjects took these trials and had a mean difference between scores from time 1/white
58

49
to time 1/blue of (.6538) which resulted in a significance of (.207) which is not
statistically significant at the .05 level. See Table 5.
TABLE 5
TABLE OF COMPARISON BETWEEN TIME 1 USING A WHITEBACKGROUND AND TIME 1 USING A BLUE BACKGROUND
Groups N Mean MeanDifference
Std. Error ofMean
t-ratio Sig.2-tailed
WhiteT/1 26 7.2308.6538 .5052 1.294 .207*
Blue T/1 26 6.5769* Not Significant
Hypothesis six is retained as the results show no statistically significant difference
at the .05 level of significance in memory retention between time 0 when using black text
upon a white background and time 0 when using black text upon a green background. 25
subjects took these trials and had a mean difference between scores from time 0/white to
time 0/blue of (.6400) which resulted in a significance of (.137) which is not statistically
significant at the .05 level. See Table 6.
TABLE 6
TABLE OF COMPARISON BETWEEN TIME 0 USING A WHITEBACKGROUND AND TIME 0 USING A GREEN BACKGROUND
Groups N Mean MeanDifference
Std. Error ofMean
t-ratio Sig.2-tailed
WhiteT/0 25 7.8000.6400 .4159 1.539 .137*
GreenT/0 25 7.1600* Not Significant
59

50
Hypothesis seven is retained as the results show no statistically significant
difference at the .05 level of significance in memory retention between time 1 when using
black text upon a white background and time 1 when using black text upon a green
background. 25 subjects took these trials and had a mean difference between scores from
time 1/white to time 1/green of (.7200) which resulted in a significance of (.185) which
is not statistically significant at the .05 level. See Table 7.
TABLE 7
TABLE OF COMPARISON BETWEEN TIME 1 USING A WHITEBACKGROUND AND TIME 1 USING A GREEN BACKGROUND
Groups N Mean MeanDifference
Std. Error ofMean
t-ratio Sig.2-tailed
WhiteT/1 25 7.4800.7200 .5276 1.365 .185*
GreenT/1 25 6.7600* Not Significant
For an explanation of what may appear to be discrepancies between mean scores from
analysis across trials see Appendix K.
6 0

Chapter 5
SUMMARY, CONCLUSIONS, AND RECOMMENDATIONS
Summary
A study of the effects of color as used in presentation software on short
(immediately following treatment) and long range (one hour following treatment)
memory retention was conducted. Previous studies as discussed in the related literature
have concentrated on color as cueing or coding mechanisms primarily in print media and
have not explored the effect of individual colors as presented on CRT (Cathode Ray
Tube) computer screens. 28 subjects were selected from 6th and 7th grade students who
were enrolled in a public school. Subjects were shown a series of alphanumeric characters
(3 per slide x 3 slides = 9 slides per color = 27 slides total) using black text upon white,
blue, and green backgrounds. The slides were prepared using the "Pack and Go" feature
of Microsoft® PowerPoint® presentation software. Slides were automatically timed for ten
seconds each. Timing for the slides was determined by information gathered during a
pilot study on similar subjects from another group.
The 28 subjects in the main study were given answer sheets following exposure
and were asked immediately (time 0) following treatment to write down what they
remembered from the series. One hour later (time 1), the subjects were given another
answer sheet and asked to write what they remembered. The white, blue, and green slides
51
61

52
were presented at one week intervals using a different set of alphanumeric characters
upon each subsequent background. The answers were scored for number correct in order
and sequence from all colors and time references and t-tests were conducted on the data.
Comparisons were only made to determine differences between blue and white and
between green and white. No relationship between blue and green was considered as the
focus of the study was to determine differences between certain colors when compared to
a white background.
Results show a statistically significant memory loss from time 0 to time 1 at the
.05 level in the trial using blue and in the trial using green. Additionally, in a comparison
between the mean number of correct responses, a trend may have been discovered which
shows black text upon a white background to rank higher in both time 0 and time 1 than
blue or green. Blue may rank 2" in time 0 and 3rd (worst) in time 1 while green may rank
3rd (worst) in time 0 and 2"d in time 1. Suggestions of evidence to support additional
research in this area are inferred.
Conclusions
When based on the evidence taken from this study some inferences may be
suggested. While the ability to generalize is limited because of sample size the
information gathered in this paper may indicate a trend that may suggest a need for
additional research using a larger sample size. It appears that in a comparison between
mean number correct in time 0 and time 1 of the three colored backgrounds used (white,
blue, and green which are all described as pure) the white background provides the best
result in memory retention. The results indicate the highest scores for white backgrounds
62

53
in both immediate recall (time 0) with a mean number correct of (7.6923) and in long-
term recall (time 1) with a mean number correct of (7.230). A white background
therefore ranks 1st (highest) for memory retention in both immediate and long term
recall. The blue background ranks 2" in time 0 with a mean number correct of (7.5385)
and ranks 3rd (lowest) in time 1 with a mean number correct of (6.5769). The green
background ranks 3"I (lowest) in time 0 with a mean number correct of (7.3214) and 2nd
in time 1 with a mean number correct of (6.7857). See Table 8.
TABLE 8
TABLE OF COMPARISON OF THE MEAN OF NUMBER OF CORRECTRESPONSES IN TIME 0 AND TIME 1 OF WHITE, BLUE, AND GREEN
Trial Background Color Time 0 Time 1Mean of NumberCorrect
Mean of NumberCorrect
White 7.6923 7.2308Blue 7.5385 6.5769Green 7.3214 6.7857
It should be noted that trial 2 appears to have larger differences than the other two
trials. In the analysis it was also noted that some of the subjects scored higher on time 1
than time 0. A second analysis was conducted eliminating the three values with a
difference less than 1, (those who scored better after one hour) under the possibility that
those students were employing creative enhancement measures. Results were computed
including these scores and again excluding these scores however, the results remained the
same and so the second analysis is not included in this paper. Only the scores that
include all subjects that participated in each trial are shown in this paper.
63

54
This paper may demonstrate evidence to support additional study of the topic of
color as it relates to memory retention. It must be stated however, that these results are
only for the specific colors as described in this study. There may be other colors or
variables that were not considered here that would provide other conclusions. It also
appears that white backgrounds with black characters may provide the best short
(immediate) and longer range (one hour) memory retention when used in presentation
software. This information may also have some relevance when applied to the
development of web pages for use on the Internet although this issue was not directly
addressed here.
It would appear that if either pure blue or pure green were considered for use in
presentation software for information that is to be immediately recalled, pure blue might
be better than pure green. If a longer term (one hour) memory retention is desired and if
either pure blue or pure green is chosen, then pure green appears superior to pure blue. It
might also be of interest to the researcher to explore longer and/or shorter time intervals
of memory retention than those utilized in this study.
It was also noted previously in this paper that there were several subjects who
actually scored higher after a time interval of one hour (time 1) than immediately
following treatment (time 0). There are several possible explanations for this
inconsistency. It is possible that the subjects disregarded instructions and discussed the
answers with other subjects between time intervals. It is possible that the subjects utilized
some form of creative enhancement (i.e., writing answers down, rehearsal, or improvising
some shared memory strategy with other subjects) to improve their answers.
64

55
It is also possible that in the interval between time 0 and time 1 some form of testing
anxiety was relieved whereby the subject could genuinely remember information that was
blocked by time constraints or other factors during time 0. Considerations of improved
scores after one hour were not explored here but, should be examined or corrected for in
future studies. Subjects were not under the direct control of the researcher during the
interval between time 0 and time 1. The analysis of the data in this study was not effected
by either inclusion or exclusion of those scores.
Another issue mentioned previously in this paper is that which is associated with
learning over repeated measures and with the potential for an increased performance
curve upon continued exposure (Jensen, p. 76). In such cases prior exposure led to
quicker responses and learning while recall also increased when subjects were pre-
exposed to a pattern (Jensen, p. 76). Increased performance over repeated exposure issues
were not considered in this current study however, subjects did not appear to exhibit
characteristics which are consistent with such an understanding. If increased performance
upon continued exposure is true in all occurrences, subjects could be expected to do
better in retention with each successive exposure. Increased performance over repeated
exposure was not supported as subjects in this current study did best during the first
exposure and alternated TO and T1 performance on exposures two and three. It should
be understood that only the methodology remained constant across trials as each slide
contained new information as well as different colors within each slide set.
65

56
Recommendations
Considering the results of this study it would appear that additional research is
suggested. If replication of this study is anticipated several considerations should be
made. The first consideration is in that of sample size and homogeneity. By the use of a
larger sample size, perhaps an expanded or different conclusion may be drawn than
shown here. While homogeneity was not considered a factor in this study it might be of
interest to the researcher to compare responses of males to females, grade level to grade
level, or age level to age level.
Studies of larger sample sizes over longer periods of time (i.e., 6th grade students
from several schools studied in succession over a period of several years) might also be
considered. Additional consideration should also be made to insure the isolation of
subjects between time intervals if the study is replicated. This would explore
inconsistencies in individual scores to determine if issues such as relief of time pressure
or limiting contact between subjects alters the results.
Another consideration would be to explore what material and complexity level of
material or task was assigned to the subjects between time intervals. In this study the
subjects resumed their regular schedules of in-class work that included mathematics and
science. It was not a consideration in this study whether the resumption of a study of
mathematics had any effect on the retention of alphanumeric characters. An additional
consideration in the comparison of the mean number of correct scores to evaluate a trend
might be to determine whether the actual difference between scores (i.e., one-half point)
would be sufficient to facilitate incorporation of the result into an expanded curriculum.
66

57
Simply, is the difference found in this project great enough to matter in the particular area
in which it is being considered for application?
If a conclusion could be drawn from such a study as this one there would be the
possibility of excluding certain colors when using presentation software and perhaps in
website designs if memory retention of information is a factor. Application in the public
sector might include product identification and retention of pertinent related information
for longer or shorter periods of time. In the educational field, there might be the
possibility of enhancing the learning experience or even of improving test scores. Though
not explored here, there may be some benefit in the use of color in presentation software
for students with certain learning disorders. Additional study could provide a more
complete understanding of the role of color in learning and of the process of human
memory retention. A more complete understanding of the role of color in memory might
be obtained by replicating this current study utilizing a combination of the methodology
used for this current project and the current technologies (e.g. PET, MEG, and F-MRI)
discussed in this paper. Finally, the expanded development of the topic could provide for
the potential of a more efficient and effective use of technology in education.
67

BIBLIOGRAPHY
68

BIBLIOGRAPHY
BOOKS
Bram, Leon L., Norma H. Dickey, and Robert S. Phillips, eds. Funk & WagnallsNew Encyclopedia. (MCMLXXIX ed., Vols. 1-27. Vol. 11, Ga-Gr). New York: Funk& Wagnalls, Inc., 1979.
Coopersmith, Stanley. Frontiers of Psychological Research. San Francisco &London: W. H. Freeman and Company, 1966.
Howard, R. W. (1995). Learning and memory: Major ideas, principles,issues, and applications. Westport, CT: Praeger Publishers.
Houston, J. P., (1986). Fundamentals of learning and memory (3rd ed.). NewYork: Harcourt Brace Jovanovich, Inc..
Jensen, E. (1996). Brain-based learning. Del Mar, CA: Turing Point Publishing.
Lezak, Muriel Deutsch. Neuropsychological Assessment. New York: OxfordUniversity Press, 1976.
Livingston, A. & Livingston, I. (1998). The Thames and Hudson dictionary ofgraphic design and designers. New York: Thames & Hudson, Inc..
Luger, G. F., Johnson, P., Stern, C., Newman, J. E., & Yeo, R. (1994). Cognitivescience: The science of intelligent systems. San Diego, CA: Academic Press, Inc..
McClintock, John., and James Strong, eds. Cyclopedia of Biblical, Theological,and
Ecclesiastical Literature. (1981 ed., Vols. 1-12. Vol. III, E-G). Michigan: BakerBook House, 1981.
Parramon', J. M., (1989). Color theory. New York: Watson-Guptill Publications.
Rock, I. (1995). Perception. New York: Scientific American Books, Inc..
Rock, I., & Palmer, S. E. (Eds.) (1997). Indirect perception. Cambridge, MA:MIT Press.
"Scripture taken from the HOLY BIBLE, NEW INTERNATIONAL VERSION.Copyright ® 1973, 1978, 1984 International Bible Society."
Scruggs, T. E., & Mastropieri, M. A. (96/97). Remembering the forgotten art ofmemory [Monograph]. Educational Psychology, 11., 94-99.
59
69

60
Shibukawa, I., & Takahashi, Y. (1991). Designer's guide to color five. SanFrancisco, CA.: Chronicle Books.
Unger, Merrill F, ed. Unger's Bible Dictionary. 3"' ed. Illinois: Moody Press, 1977.
Vine, W. E. Vine's Expository Dictionary of New Testament Words: AComprehensive Dictionary of the Original Greek Words with their Precise Meanings forEnglish Readers. Unabridged edition. Virginia: Mac Donald, c. 1980.
PERIODICALS
Chen, Lin Ching. "The Effects of Color and Background Information in MotionVisuals on Children's Memory and Comprehension." Proceedings of Selected Researchand Development Presentations at the 1997 National Convention of the Association forEducational Communications and Technology. (February 1997), 429-440.
Dwyer, Francis M. "Student Perceptions of the Instructional Effectiveness ofBlack & White and Colored Illustrations." The Journal of Experimental Education,(Volume 40, Number 1, Fall 1971), 28-34.
Dwyer, Francis M. "The Program of Systematic Evaluation - A Brief Review."Intl. J. Instructional Media. (Vol. 10 (1), 1982-83), 23-37.
Dwyer, Francis M. and David M. Moore. "Effect of Color Coding on Visually andVerbally Oriented Tests with Students of Different Field Dependence Levels." J.Educational Technology Systems, (Vol. 20 (4), 1991-92), 311-319.
Dwyer, Francis M. and David M. Moore. "Effect of Color Coding on CognitiveStyle." Proceedings of Selected Research and Development Presentations at theConvention of the Association for Educational Communications and Technologyand Sponsored by the Research and Theory Division, (February, 1992), 195-202.
Dwyer, Francis M. and David M. Moore. "Effect of Color Coding and Test Type(Visual/Verbal) on Students Identified as Possessing Different Field DependenceLevels." Imagery and Visual Literacy: Selected Readings from the AnnualConference of the International Visual Literacy Association. (October 1994), 175-188.
Euster, J. A. (1994). Chaos theory as management. Wilson Library Bulletin, 68,
70

62Bridges, Bette and Judy Moody, (1992). "My Brother, John John Dalton."
<http://www.woodrow.orgiteachersici/1992/Dalton.html>. 1992 Date retrieved:August 3, 1998.
Creb and memory. (1997, November). Brain Briefings: Society for NeuroscienceJournal, 11,. 1. <http://gopher.sfn.org/briefings/creb.html>. 1997 Date retrieved: June16, 1999.
Engel, Victor. (1996). "Victor Engel's No Dither Netscape Color Palette, -- TheBrowser Safe Palette (BSP). <http://the-light.com/netcol.html>. 1996 Date retrieved:May14, 1999.
Exploratorium. (1998). "Exploratorium Exhibit & Phenomena Cross-Reference."Exploratorium.<http://www.exploratorium.edu/xref/phenomena/color_mixing_(additive).html >. 1998 Date retrieved: May 14, 1999.
Exploratorium. (1998). "Exploratorium Exhibit & Phenomena Cross-Reference."Exploratorium.<http://www.exploratorium.edu/xref/phenomena/color_mixing_(subtractive).html>. 1998 Date retrieved: May 14, 1999.
Green, Christopher D., Aristotle (ca. 350b.c.), and J. I. Beare (translator)."Classics in the History of Psychology Aristotle's On Memory and Reminiscence".<http://www.yorku.ca/dept/psych/classics/Aristotle/memory.htm>. Date retrieved:May 14, 1999.
Green, Christopher D., Ebbinghaus, Hermann (1885), and Henry A. Rugger &Clara E. Bussenius (1913) (translators). "Classics in the History of PsychologyEbbinghaus (1885) Preface" < http://www.yorku.ca/ dept/psych/classics/Ebbinghaus/index.htm>. Date retrieved: May 14, 1999.
Morton, J. L.. (1998). "Computer Color Color Matters." Color Matters.<http://www.lava.net/colorcom/comput.html>. 1998 Date retrieved June 16, 1998.
Nash, Keith. (1994). Color Vision Guide. (Nash Graphic Design).<http://htg-is.vianet.net/ht2/cvghome.html>. Menlo Park, California: EducationalColor Vision Guide.
Taramasso, Gina and Ian Harper. "A History of Mathematical Representations ofColor Mathematical Methods of Measuring Color". <http://www2.ucsc.edu/ginabina/Math181/math181.html>. 1997 Date retrieved: August 18, 1998.
Villados, Bryan. (1997). "Color Matters: Tips Adjusting color on WIN 95."Color Matters. <http://www.lava.net/colorcom/tips.html>. 1997 Date retrieved: June16, 1998.
71

63
ORIGINAL SOURCES
McConnohie, L. K., BS., Certified Electroencephalographic Technologist(CEEGT), (1999). Direct quotation from interview.
Cerrito, P., Ph.D., (1999). Associate Professor of Probability and Statistics,Department of Mathematics, University of Louisville, Louisville, Kentucky. Directquotation from consultation.
7 2

APPENDICES
7 3

APPENDIX A
Color Production
What we know as color is derived from the portion of the electromagnetic spectrum
that is both visible to the human eye as light and perceivable by the human mind. Color
is, in essence, an analog medium determined by wavelengths of visible light on a segment
of a continuum with an essentially limitless number of variables. Just as there is a
theoretically infinite number of numerical values between any two whole numbers, there
are, in practical terms, a virtually limitless number of variations of colors that exist
between two colors. Describing those variables in precise terms is a daunting task. The
production of color is accomplished in at least two ways, which are described as additive
and subtractive mixing. Additive color mixing occurs when colors of light overlap and
add to each other (Exploratorium (additive), p. 1). Mixing the additive primary colors,
red, green, and blue, produce white. This additive color mixing is the phenomenon that
most closely approximates that which is produced by a cathode ray tube (CRT) in
televisions and computer monitors. These devices utilize the three additive primary
colors, red, green, and blue, to produce an approximation of most of the other colors, as
received by the eye and perceived by the mind. Subtractive color mixing, conversely,
occurs within the solid pigment media of paint and ink. In subtractive color mixing, paint
is perceived as a particular color because it subtracts or absorbs colors from the white
light hitting it (Exploratorium (subtractive), p. 1). The unabsorbed color reflects and
reaches the eyes. In effect, what we see is all of the colors except what we name it
because the pigment absorbs or subtracts all of the other colors away from what reaches
65
74

66
our eye. The primary subtractive colors are cyan, magenta, and yellow, which can be
combined in varied proportionate amounts to produce any other color, or, when mixed at
full value, to produce the color black.
75

APPENDIX B
Description of Hardware, System Properties, and Color Values
Computer: Noblis ® by Equus ® with Pentium "r" ® processor.
Monitor: Sampo ® "Alpha Scan 411 with Plug & Play / Energy Star compliance.
Hard drive size: 3Gigabytes.
Random Access Memory: 64 MB RAM
Keyboard: (No brand name available) Standard 101/102 Key or MS Natural properties
English (U.S.) with U.S. 101 layout.
Mouse: (No brand name available) Standard serial mouse with right handed
configuration.
Modem: Noble Link ® K56 Flex PC Plug & Play voice modem / set on COMM Port 2
(maximum speed 57600 bps.).
Connection: Data bits = 8 ; stop bits = 1; parity = none; phone connection = ISDN.
Performance (status): System resources 88% free; file system 32 bit; virtual memory 32
bit; disk compression not installed; PC cards (PCMCIA) no (p) sockets installed.
Graphics: (advanced settings) Hardware acceleration (full).
File system: Role = desktop computer; read-ahead optimization (full).
Display properties: True Color® Color Palette (32 bit) / desktop area = 640x480 pixels.
Adapter/Driver: Matrox Millenium II Power Desk ® by Matrox Graphics ® / features =
Direct Draw version 4.0 @ optimal refresh rate.
Internet Browser: Netscape 3.0
Color values: (expressed in hexadecimal terms)
67
7 '6
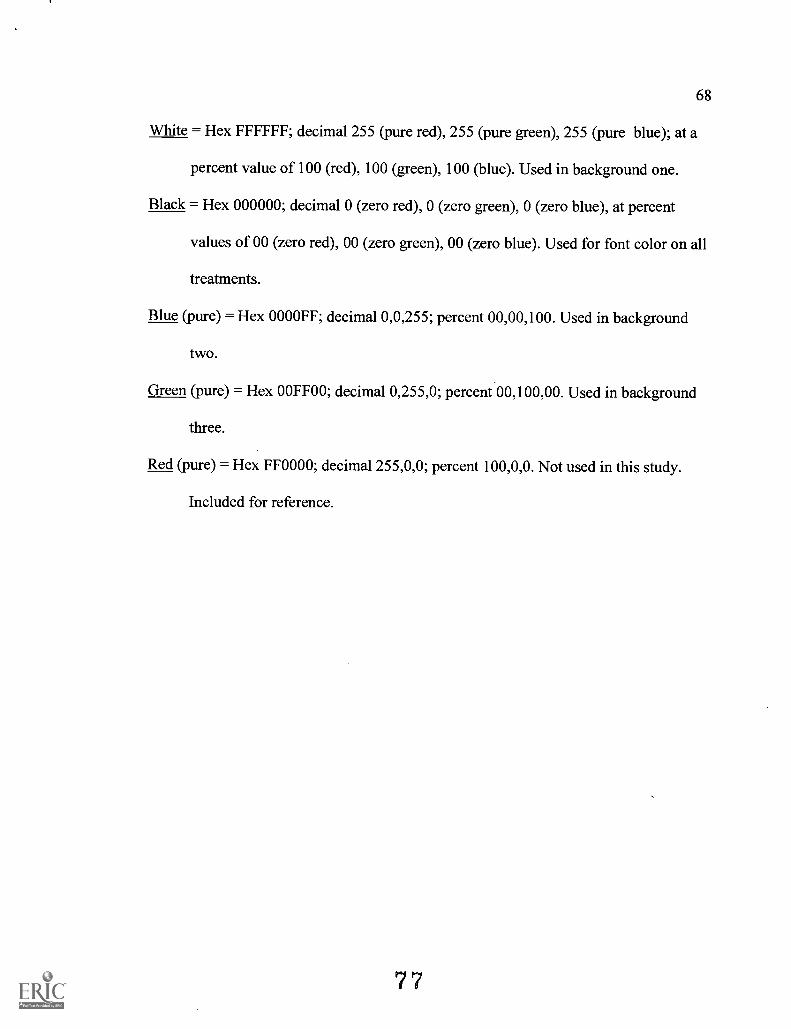
68
White = Hex FFFFFF; decimal 255 (pure red), 255 (pure green), 255 (pure blue); at a
percent value of 100 (red), 100 (green), 100 (blue). Used in background one.
Black = Hex 000000; decimal 0 (zero red), 0 (zero green), 0 (zero blue), at percent
values of 00 (zero red), 00 (zero green), 00 (zero blue). Used for font color on all
treatments.
Blue (pure) = Hex 0000FF; decimal 0,0,255; percent 00,00,100. Used in background
two.
Green (pure) = Hex OOFF00; decimal 0,255,0; percent 00,100,00. Used in background
three.
Red (pure) = Hex FF0000; decimal 255,0,0; percent 100,0,0. Not used in this study.
Included for reference.
77

APPENDIX C
Hexadecimal System
In a hexadecimal numbering system, instead of counting from 1 to 10 before
changing decimal position (a position represents units, tens, hundreds and so on in the
decimal system), the counting is done from 1 to 16 before changing position (and then
positions represent powers of 16: 16, 256, 4096). As there are no digits available beyond
9, the first 6 letters of the Latin alphabet (or of any alphabet if the Latin script is not used)
are used to represent the extra hexadecimal "digits" 10 (A), 11 (B), 12 (C), 13 (D), 14 (E),
15 (F). In this international standard, hexadecimal numbers are used to refer to the UCS,
the hexadecimal coding of which is considered as equivalent to a catalog numbering
system to select characters. Hexadecimal notation exists as a shortcut to represent groups
of 4 bits (there are 16 combinations possible with permutations of 4 digits whose values
can be either a zero or a one); it also takes less characters to express a number in
hexadecimal than in decimal.
See Appendix B for an example of colors as expressed in hexadecimal terms.
69
78

APPENDIX D
Dithering
The CRT screen only has red, green, and blue (RGB) so, software must
approximate certain hues by changing the value and chromas of the additive primaries
(RGB) in a process called dithering. Currently only 216 colors are common to all Web
browsers.
70
7 9

APPENDIX E
Color on a Cathode Ray Tube (CRT)
A color CRT uses three individual electron guns to electronically stimulate either of
three colored phosphor dots on the inside surface of the glass screen. The colors are
(RGB) red, green, and blue. The object of this study was to isolate each color from the
other colors and to investigate its relative effects on human memory retention.
71
80

APPENDIX FGamma
When expressing a color (RGB), gamma is used to specify the amount of light
which will be emitted from each phosphor, as a fraction of full power by specifying the
voltage which will be applied to each electron gun. An effective gamma rating will
deliver true colors and a good range of light, middle, and dark tones. Generally, gamma
measurements range from 1.0 to 3.0. Macintosh and Silicon Graphics based systems
have built in gamma correction while most PC and Unix systems do not. This correction
is accomplished by the operating system and/or the graphics card, particularly in PC
machines. A more complete understanding, including tests to approximate gamma, are
available on the World Wide Web at the following URLs (as of May, 1999):
<http://www.lava.net/colorcom/comput.html (also follow links). Also see:
<http://www.cgsd.com/papers/gamma_colorspace.html>
A corrected gamma of 1.8 is produced from a Macintosh or Silicon Graphics ®
system running NeXT Step ®. The gamma estimate for the equipment used for this study
was determined to be 1.6 by using the tests mentioned above. An approximate gamma of
1.6 falls within the parameters of corrected gamma with a range from 1.0 to 3.0 and mean
of 2.0. Windows 95 ® has some gamma correction and was the operating system used for
this study. Netscape 3.0, which accurately reproduces colors, was also used as a web
browser for this study. Additional information on the efficacy of using the Netscape
browser, as well as, a tool for identifying the hexadecimal codes of colors may be seen at:
<http://the-light.com/netcol.html> and <http://the-light.com/colclick.html> (May, 1999).
72
81

APPENDIX G
Physics, Physiology, and History of Color
Physics (general)
What we call "color" is relative to the small part of the electromagnetic spectrum
known as visible light. Because visible light is a segment of a continuum, it is inherently
in an analog format. There are then a theoretically infinite number of variables within
and between those values that we describe as individual colors. This presents an
immediate problem to the researcher of color and its effects. The problem is that of
describing an exact color and of replicating that exact color across additional research.
Previously, this problem has been dealt with by using various color scales in an attempt to
standardize the description of various hues and their relative values. The problem is
exacerbated by the reality that color exists on a three-dimensional scale and, as such,
cannot easily be described using a two-dimensional format. This difficulty is evidenced
by the work of Albert Henry Munsell (1859-1918), an American artist, who did extensive
work in standardizing the descriptions of colors by the use of a base 10 scaling system.
Munsell eventually developed a three-dimensional solid to describe the various vectors
used in the study of color, which became known as colorimetry. Those vectors are
derived from the variables that he described as "hue" (what we call the color, i.e. blue,
red, green), "value" (the relative brightness) ,and the "chroma" (the saturation or purity of
color). Munsell observed that this solid representation did not form a perfect sphere, as
he supposed, but rather, a shape that was more like an onion with one side extending to a
blunt point toward the red, and somewhat indented toward the center in the green-blue
73
82BEST COPY AVAILABLE

74
segment of the spectrum. Munsell's system has become adopted by the United States
Bureau of Standards since shortly after its publications in 1905, in spite of its
shortcomings when attempting to describe additive light as produced on a CRT screen.
Some of these shortfalls may be resolved by the acceptance of the digital description of
color vectors using a hexadecimal coding system. This study assumes the efficacy of
digital coding to be true and describes the vectors used within the study in two (2) digit
hexadecimal terms which should be helpful in describing or replicating this study.
History
A brief review of the history of work in color theory and standardization follows.
Early color systems were based on astronomy and used the "planets" (which included the
Sun and Moon) to represent primary "colors" (Taramasso, p.1). Another early system
associated each of the four "elements" of fire, earth, air, and water with a different color.
Proponents of this method included Josephus and the cultures of Hindu, Greek, and
Chinese people. These systems were the accepted norms until the Renaissance.
Pythagoras (582 - 507BC) is thought to be the first to associate color to solid shapes
while maintaining their connection to elements and the planets. Aristotle (384-322BC)
contemplated the nature of color and some of his misconceptions, i.e. that all colors could
be obtained by mixing black and white, prevailed for almost eighteen centuries. During
the Renaissance, when art began to flourish, painters, who had to mix their own colors for
paints, began to study light and color. Two early experimenters with the description of
color were Alberti and Cennini but their work was not of a scientific nature.
83

75
Leonardo da Vinci was, perhaps, the most scientific in his studies of color theory, naming
six primary colors including black and white. In 1666, Sir Isaac Newton (1642-1727)
conducted his experiments using prisms and light which demonstrated the visible
spectrum contained within white light. The difference in the wave-length of the light
caused the light to be refracted at different angles within the prism, resulting in a
differentiation in the various "colors". Newton was the first to arrange these elements
into a color "wheel". His work resulted in the standard color theory of physics based on
wave length radiation, now known as colorimetry.
The next notable person to express views on color theory was not a scientist but
rather a poet named Johann Wolfgang von Goethe (1749-1832). Goethe repudiated
Newton by stating that color was made by mixing light and darkness. In Goethe's color
wheel, he instigated one of the more persistent misteps of modern color theory
(Taramasso, p.1). He selected red, yellow, and blue as his primary colors and purple,
green, and orange as secondary colors. The error comes when mixing Goethe's primaries
in a subtractive medium (pigment). The resultant color is muddy brown rather than black
if corrected. Black is produced only when using the true subtractive primary colors cyan,
magenta, and yellow. This error is persistent and is still taught today (Taramasso, p.1).
Next to study color theory was Albert H. Munsell (1859-1918) as mentioned earlier
in this paper. His work was later developed into a color vision test called the
"Farnsworth-Munsell 100-hue and Dichotomous Test for Color Vision" by Farnsworth in
1943 (Lezak, p. 276). Munsell' s work has been updated in 1929, 1943, 1950, with a
84

76
glossy version being developed in 1958 and a Nearly Neutrals Collection® which was
released in 1990.
Wilhem Ostwald (1853-1932) was the first to include numerals for various
wavelengths on his color wheel, as technology had been developed to measure
wavelength. Ostwald has been popular, with mathematics researchers. He used as his
primaries, red, yellow, green, and blue, placed equidistant apart on the color wheel. In
1931, the Commission Internationale de L' Eclairage created its color model known as
CIE. This scale forms a somewhat elongated triangular shape that is straight across the
bottom and rounded at the upper most points (green). This system plots three (X,Y, & Z)
tristimulus values that were initially devised to approximate the three primary color
values thought to be perceived by the human eye, although these receptors were not fully
known until the 1950s. The CIE scale was slightly updated in 1964. Its odd shape is
owed to the fact that when measured from white, the color green is higher in comparative
wavelength than any other color, making pure green more saturated than all others. In
1976 the table was revised again to adjust the pure white to appear more to the center, yet
this was after the CIE had been accepted as a standard. Since then, the CIE L*a*b color
system has been created as the first attempt to solve for the problem of differences
between images shown on different computer monitors. The "L" stands for -luminance,"
the "a*" for the red/green balance, and the letter "b*" for the blue/yellow balance.
Theoretically, the CIE L a*b* color model can produce any color visible to the human eye
and is used in most current professional image editing programs (Taramasso, p. 1).
85

77
Additional understandings associated with color theory show that ". . . the colors
of the spectrum can be found both in the color of light and in pigment colors" (Parramon,
p.20). According to current color theory the spectrum of light is made up of at least the
colors of magenta, red, yellow, green, cyan blue, and dark blue. The primary colors of
light are red, green, and dark blue while the secondary colors of light are yellow, cyan
blue, and magenta. The secondary colors are produced by combining two of the primary
colors. Yellow is made by combining green and red, cyan blue is made by combining
dark blue and green, and magenta is made by combining red and dark blue (Parramon,
p.20). According to Shibukawa (Shibukawa and Takahashi, p.64.) "blue hues are
perceived as giving impressions of cool/cold" and is usually associated with serenity,
cleanliness, and intellect (Shibukawa and Takahashi, p.64). They also indicate that "as
blue moves closer to green it is perceived as more refreshing than cold" (Shibukawa and
Takahashi, p.64).
A final consideration in the visual impact of color and images may be found in the
use of various font styles and sizes. There may be an effect known as "appearing size"
(Livingston and Livingston, p. 16) where there is a perceived difference in the size of
letters from different typefaces but, with the same point size. This effect results from the
variation in x-height of the ascender and the descender of the letters or numbers. Point
(pts.) size is understood here to be the Anglo/American standard of typographic
measurement where one point equals 0.351mm and 72 pts. equal one inch (Livingston
and Livingston, p. 158). While only one type face (Lucida Sans Unicode) and one font
size (200 pt) was used in this current study, because of the use of both alphabetic
86

78
characters and numerals, there could have been some perceived differences between
appearing sizes but, these differences were not seen to effect the outcome of the study.
All of the previous information combines to add support for the use of a
hexadecimal code for describing the colors used in this study. With so many different
standards in use, the hexadecimal system simplifies the description and is translatable
into virtually any standard by those who might seek to describe or to replicate this
research. As a matter of reference, the wavelengths of the colors known as red (R), green
(G), and blue (B) are approximated as: R=575nm, G=535nm, and B=445nm. It is
additionally noted that by using a two (2) digit hexadecimal number for each primary
color (RGB), over 16 million colors can be produced. This is accomplished, on the CRT
monitor, by a process called "dithering" whereby the equipment approximates colors by
rapidly shifting between the red, green, and blue phosphors in combination with
variations in the X,Y, and Z values (or the values represented by La*b*). The efficiency
of using a binary coding system to conserve energy and to increase the amount of
information represented was noted by Miller (1959) (cited in Coopersmith, p. 160) in an
August, 1959 article in Scientific American. The hexadecimal code is an extension ofor
analogous to a binary code that allows for better processing in 16 bit and higher
machines. This is further support for using hexadecimal descriptions when differentiating
between the theoretically infinite combination of values within the analog nature of color.
It is agreed that there is a mathematical limit that theoretically exists between two
numbers that are in a digital format as described in two digit hexadecimal terms (i.e. that
87

79
there may be colors or units that exist between any 2 digit descriptions that are not
expressible by those two descriptors). However, in the case of this study, the difference
interval between the two hexadecimal delineations is minute and, is neither practical to
consider, able to be produced by current technologies, nor perceivable by the human eye
to a degree to resolve the issue to that extent and, as such, will not be seen to exert a
statistically significant influence upon this study.
Physiology
A simplified explanation of the physiology of human color perception begins
within the eye. The retina of the human eye contains two types of elements, rods and
cones. There are approximately 130 million of these elements with a ratio of 18 rods to
each cone. The rods are responsible for night vision, dim lighting circumstances, and
shades of gray (variables of black/white). The cones each contain pigments that are
sensitive to one of three wavelengths of light. One sees red, one sees green, and one see
blue. All color that is visible to the human eye is accomplished through an operation of
mixing between these three colors. Each of the three types of color receptors (cones)
within the eye are named by Greek terms which mean "first", "second", and "third". The
receptor for red is called protos, green is deuteron, and blue is tritos. People with various
dysfunctions of this system are commonly referred to as color blind although complete
color blindness, where the subject sees only black, white, and shades of gray
(monchromatic), occurs in only 1 in 30,000 of the population.
88

80
One of the earliest descriptions of color blindness was made by John Dalton in the
late 1700s. The condition eventually became known as Daltonism in France (Bridges, p.
1). Dr. Keith Nash, who produces the Color Vision Guide ®, a simple tool to detect color
blindness, stated that approximately 8% of males and 0.4% of females are color blind to
some extent. The subjects that were used in this study were of a high ratio of females,
but the Color Vision Guide ® test for color blindness was administered to each individual
prior to the trial. There were zero detectable incidences of color blind individuals within
this study. Lezak indicates that the accepted protocols for color blindness testing are the
Ishihara (1954) test and the Dvorine (1958) screening test and that both are considered
satisfactory (Lezak, p. 276). He mentions a third more extensive diagnostic tool called
the H-R-R Pseudoisochromatic Plates that screen for two rare forms of color blindness in
addition to those identified by the Ishihara and Dvorine tests.
The stimulus for all three of these tests are cards that are imprinted with dots of
different colors which form figures or numerals that are easily distinguishable to the
normal eye. Nash indicates that 75% of color blind people have poor green, with 24% in
red, and 1% in blue. The Color Vision Guide ® is a modified, or simplified, Ishihara test,
and as such, should be considered adequate and acceptable for this study. Subjects were
screened for their ability to distinguish the colors used within this trial, i.e. blue and
green. No anomalies were detected within either the subjects or the researcher.
89

APPENDIX H
Gamma Settings Information and Sources
The scale used for the estimation of the gamma settings on the equipment used in
this study is available over the Internet at the following URL address (as of January
1999): <http://www.vtiscan.contrwb/gama.html>. Additional information on the
importance of determining the monitor gamma is also available at this website and by
following the related links. Gamma will effect the brightness and color correction on a
CRT monitor screen. B. Villados, at <www.lava.net>, infers that the Windows 95®
operating system, used for this current study, has certain built-in gamma correction
capabilities and, as such, are not controllable by this researcher and has qualities that are
considerable acceptable for use in this current study (Villados, p. 1). It is incumbent,
however, to note that the observed estimate of gamma which was taken using the scale
noted above, and which was viewed using the Netscape 3.0 Internet Browser, was noted
at 1.6 on a scale ranging from 1.0 (low) to 3.0 (high) and having a mean of 2.0. This was
understood to be within an acceptable range, between 1.6 and 2.2, for accurate color
production. In addition, according to V. Engle, the Netscape Browser is recognized for
its accuracy of color representation and so the use of Netscape 3.0 was not only the
preferred browser used by the school in this study, it is also deemed acceptable for
accurate color production for the hue, saturation, and values used within this study
(Engel, p. 1).
81
90

APPENDIX I
Determination of Color Values in Hexadecimal Terms
The tool for determining the hexadecimal descriptions of colors is located at the
following URL address: <http://the-light.com/colclick.html> (as of May, 1999). This on-
line tool allows for the determination of the relative values of the colors available on a
CRT by moving the mouse around the palette. The color values are automatically
displayed in hexadecimal terms.
82
91

APPENDIX J
An Amplified Explanation of the Terminology Used to Describe the Design ofThis Study
"Traditionalist" describes this current study as one that approaches reality by the
numbers. It accepts that reality exists and that it can be somehow measured. The term
"positivist" is closely associated with a traditionalist approach in the realm of quantitative
studies and refers to the oldest and most widely used approach to both natural and social
science. Positivism accepts that reality exists apart from the researcher and that there is
nothing that the researcher can do to change it. Positivist research prefers quantitative
data, seeks exacting measurement, and tests hypotheses by the analysis of numerical
information derived from the measures. Positivism often uses experiments and statistics
to use in consideration of the outcome of the research. The term "paradigm" indicates a
basic orientation to theory and research and is descriptive of a system of thinking.
"Modernist" refers to a reliance upon logical reasoning involving basic beliefs, values,
and assumptions that have been long accepted such as, the existence of a measurable
reality. Modernism opposes the "postmodern" philosophy which rejects relative truth and
which suspects all forms of empirical data or meanings derived from such considerations.
Modernism holds that there are standards of truth which most people can agree upon.
An "ontological assumption" is an approach to research that seeks to study the nature of
existence as understood within a particular reference such as modernism.
"Quasi-experimental" is used to describe studies which seek to discover causal
relationships and which also involve groupings that are not truly random. A "within-
83
92

84
subject" design refers to studies using the same subjects which are assigned different
treatments. A "passive" design for a study is one where the subjects do not have any
control over the treatment. In the case of this current study the alphanumeric characters
and the timings for the individual slides were pre-set by the researcher using automatic
timing settings and were not alterable by any of the subjects during any of the trials. A
"quantitative" design uses the collection of empirical data from experimental trials in the
collection and computation of data. Quantitative designs are those studies which
primarily utilize experimental methodologies and differ in approach from studies which
use a qualitative design.
93

APPENDIX K
An Explanation of What May Appear as Discrepancies Between Mean Scores
Across Trials
Upon a closer examination of the analyzed data there appears to be a discrepancy
between the mean scores. The reason for the differences between information presented
in tables 1 through 3 and between information found in tables 4 through 7 is attributed to
the differences in sample (N) sizes in the three trials. In the trial using a white
background there were 26 subjects. In the trial using a blue background there were 26
subjects and in the trial using a green background there were 28 subjects. In comparisons
between time 0 and time 1 in the three trials the N sizes and mean scores remain constant.
The anomaly occurs when a paired samples t-test is computed. The SPSS ® software uses
only those datasets that are in common between the compared subsets. Different mean
scores are generated because only those samples that are common to both subsets are used
in the comparison. The t-tests utilized in this project were conducted under the
instruction of the professor in oversight of this paper. The numbers contained in this
project are correct as presented. The most relevant considerations in this study are, in the
opinion of the researcher, those found between time 0 and time 1 across the three color
trials.
85
94

APPENDIX L
Example of Type Style, Font Size and Characters Used in This Project
(Characters shown in 100 point print to accommodate paper format - 200 point font
example seen below)
Q3K
A
86
95

APPENDIX M
Permission Letter
September 9, 1998
Dr. Chris TemplarChair, Teacher Education DepartmentJohnson Bible College
Dear Dr. Templar, et. al.
This letter is to serve as an acceptance for research as required in your Graduateprogram. As there is no official form supplied or required for such a study by theCocke County Board of Education, this notice will suffice.
We, at Smoky Mountain School, Cosby, TN., accept the proposal for research by Mr.Bruce V. McConnohie to be conducted, at my suggestion, with Mr. Kelly's 6th and7th grade class. The proposal is for A Study of the Effect of Color in MemoryRetention When Used in Presentation Software. This study will be conductedon siteduring the 1998-99 school term.
We look forward to a continuing relationship with Mr. McConnohie and withJohnson Bible College and therefore remain
Sincerely,
Mr. Paul CogburnPrincipalSmoky Mountain School
96
87

Reproduction Release
U.S. Department of EducationOffice of Educational Research and Improvement (OERI)
National Library of Education (NLE)Educational Resources Information Center (ERIC)
Reproduction Release(Specific Document)
I. DOCUMENT IDENTIFICATION:
.............
http://ericfac.piccard.csc.com/reprod.html
ERIC
Title:
.Si of Effeek ofCc5k ..ems / RefeAdiovi witem U5d) 1'14 "rAuthor(s): 13RUCg V, M ONNO /4.M'Corporate Source: !Publication Date:
itivi50-14 Bi ale /4-1/v5-i-9)1997IL REPRODUCTION RELEASE:
In order to disseminate as widely as possible timely and significant materials of interest to the educational community,documents announced in the monthly abstract journal of the ERIC system, Resources in Education (RIE), are usually madeavailable to users in microfiche, reproduced paper copy, and electronic media, and sold through the ERIC DocumentReproduction Service (EDRS). Credit is given to the source of each document, and, if reproduction release is granted, oneof the following notices is affixed to the document.
If permission is granted to reproduce and disseminate the identified document, please CHECK ONE of the following threeoptions and sign in the indicated space following.
The sample sticker shown below will be affixedto all Level 1 documents
The sample sticker shown below will be affixed to allLevel 2A documents
',The sample sticker shown below will be affixed to 1
Iall Level 2B documents
PERMISSION TO REPRODUCE ANDDISSEMINATE THIS MATERIAL HAS
BEEN ORAN tiV
PERMISSION TO REPRODUCE ANDDISSEMINATE THIS MATERIAL IN
MICROFICHE. MD IN ELECTRONIC MEDIAFOR ERIC COLLECTION SUBSCRIBERS ONLY.
I1AS BEEN ORAN 'I BY
PERMISSION TO REPRODUCE AND
IDISSEMINATE THIS MATERIAL IN
j MICROFICHE ONLY HAS II 'N OR-ANTED I31
TO THE EDUCATIONAL RESI)URCSINFORMATION CENTER (ERK:)
10 THE EDUCATIONAL RESOURCESINFORMATION CENTER (ERR:I
to IDE E.T.IccATIoNAL RESOURCESIN FORMA DON CEN MR (ERIC)
Level 1 Level 2AI
1.-- Level 2B
t t
Check here for Level 1 release, permittingreproduction and dissemination in microfiche orother ERIC archival media (e.g. electronic) and
paper copy...... . . . . . . . . . . . ....Documents
If permission to reproduce
Check here for Level 2A release. permitting reproduction. . . . . .
and dissemination in microfiche and in electronic mediafor ERIC archival collection subscribers only... ........
will be processed as indicated provided reproduction qualityis granted, but no box is checked, documents will be
Check here for Level 2B release, permitting -.
reproduction and dissemination in microfiche only;
... ... .
permits.processed at Level 1.
1 of 3 08/24/1999 10:34 PM

Reproduction Release http://ericfac.piccard.csc.corn/reprod.html
1 hereby grant to the Educational Resources Information Center (ERIC) nonexclusive permission to reproduce anddisseminate this document as indicated above. Reproduction from the ERIC microfiche, or electronic media by personsother than ERIC employees and its system contractors requires permission from the copyright holder. Exception is madef or non-profit reproduction by libraries and other service agencies to satisfy information needs of educators in responseito discrete inquiries.
Printed Name/Position/Title:Signature:
lauketTifceAvytzt-L2Organization/Address:
BRuce_ V. Mc-Cs:DNA/01-(i E.ITelephone: Fax:
1 (c12,3)1(7-5 1/07rF,-mail Address: Date: ibUCEWC_& US ri:41 e /0//0/q?
HI. DOCUMENT AVAILABILITY INFORMATION (FROM NON-ERIC SOURCE):
If permission to reproduce is not granted to ERIC, or, if you wish ERIC to cite the availability of the document from anothersource, please provide the following information regarding the availability of the document. (ERIC will not announce adocument unless it is publicly available, and a dependable source can be specified. Contributors should also be aware thatERIC selection criteria are significantly more stringent for documents that cannot be made available through EDRS.)
rrtiblisher/Distributor:..........
:.1
Address:
Price:
IV. REFERRAL OF ERIC TO COPYRIGHT/REPRODUCTION RIGHTS HOLDER:
If the right to grant this reproduction release is held by someone other than the addressee, please provide the appropriatename and address:
1
Name:
rAddress:
V. WHERE TO SEND THIS FORM:
2 of 3 08/24/1999 10:34 PM

ReproducTion Release http://ericfac.piccard.csc.com/reprod.html
Send this form to the following ERIC Clearinghouse:
However, if solicited by the ERIC Facility, or if making an unsolicited contribution to ERIC, return this form (and thedocument being contributed) to:
ERIC Processing and Reference Facility1100 West Street, 2nd Floor
Laurel, Maryland 20707-3598Telephone: 301-497-4080Toll Free: 800-799-3742
FAX: 301-953-0263e-mail: [email protected]
WWW: http://ericfac.piccard.csc.comEFF-088 (Rev. 9/97)
3 of 3 08/24/1999 10:34 PM