Reproductions supplied by EDRS are the best that can be ... · DOCUMENT RESUME ED 469 189 CE 083...
42
DOCUMENT RESUME ED 469 189 CE 083 555 AUTHOR Kotamraju, Pradeep; Steuernagel, Bruce; Jacquart, Mary TITLE New Program Development Strategy and Supply/Demand Analysis: The Relationship between Postsecondary Degree Program Outcomes and Occupational Needs in Minnesota. SPONS AGENCY Office of Vocational and Adult Education (ED), Washington, DC. PUB DATE 2002-03-01 NOTE 41p. CONTRACT ED -99 -CO -0160 AVAILABLE FROM For full text (Microsoft Word): http://www.ed.gov/ offices/OVAE/HS/kotamraju.doc. PUB TYPE Reports Research (143) EDRS PRICE EDRS Price MF01/PCO2 Plus Postage. DESCRIPTORS College Curriculum; *College Programs; Degree Requirements; *Demand Occupations; Education Work Relationship; *Educational Planning; Employment Patterns; *Employment Projections; Futures (of Society); Higher Education; Labor Force Development; Labor Market; Labor Supply; Outcomes of Education; Program Development; *School Business Relationship; State Programs; Statewide Planning IDENTIFIERS *Minnesota State Colleges and Universities ABSTRACT This five-section paper describes how the Minnesota State Colleges and Universities (MnSCU) system, the largest system of higher education in the state, determines what degree programs will be created, based on needs for workers in various occupations in the state. The paper begins by discussing why connecting demographic trends, learner segments, and labor market information become crucial not only in helping to decide which new program ideas to implement, but also to assist in balancing the competing demands for a regional and statewide new program development strategy. The next section of the paper describes briefly a potential new program approval process that considers a supply and demand analysis in the approval of new program ideas solicited from MnSCU institutions. By refining the supply and demand analysis described in Appendix B, a more precise estimate for the total number of additional graduates that would potentially result from implementing the new program approval process is also estimated. The last two sections provide preliminary results from the analysis, and conclusions and implications are drawn about why MnSCU in particular, but all postsecondary institutions in general, must understand how labor market information could contribute to mediating the conflicting and competing interests of stakeholders in the area of new program development strategies. MnSCU serves 225,000 students annually in credit courses and nearly 95,000 students in non-credit courses. The system includes 7 state universities and 27 community, technical, and consolidated colleges located on 53 campuses across Minnesota. (KC) Reproductions supplied by EDRS are the best that can be made from the original document.
Transcript of Reproductions supplied by EDRS are the best that can be ... · DOCUMENT RESUME ED 469 189 CE 083...

DOCUMENT RESUME
ED 469 189 CE 083 555
AUTHOR Kotamraju, Pradeep; Steuernagel, Bruce; Jacquart, Mary
TITLE New Program Development Strategy and Supply/Demand Analysis:The Relationship between Postsecondary Degree ProgramOutcomes and Occupational Needs in Minnesota.
SPONS AGENCY Office of Vocational and Adult Education (ED), Washington,DC.
PUB DATE 2002-03-01NOTE 41p.
CONTRACT ED -99 -CO -0160
AVAILABLE FROM For full text (Microsoft Word): http://www.ed.gov/offices/OVAE/HS/kotamraju.doc.
PUB TYPE Reports Research (143)
EDRS PRICE EDRS Price MF01/PCO2 Plus Postage.
DESCRIPTORS College Curriculum; *College Programs; Degree Requirements;*Demand Occupations; Education Work Relationship;*Educational Planning; Employment Patterns; *EmploymentProjections; Futures (of Society); Higher Education; LaborForce Development; Labor Market; Labor Supply; Outcomes ofEducation; Program Development; *School BusinessRelationship; State Programs; Statewide Planning
IDENTIFIERS *Minnesota State Colleges and Universities
ABSTRACT
This five-section paper describes how the Minnesota StateColleges and Universities (MnSCU) system, the largest system of highereducation in the state, determines what degree programs will be created,based on needs for workers in various occupations in the state. The paperbegins by discussing why connecting demographic trends, learner segments, andlabor market information become crucial not only in helping to decide whichnew program ideas to implement, but also to assist in balancing the competingdemands for a regional and statewide new program development strategy. Thenext section of the paper describes briefly a potential new program approvalprocess that considers a supply and demand analysis in the approval of newprogram ideas solicited from MnSCU institutions. By refining the supply anddemand analysis described in Appendix B, a more precise estimate for thetotal number of additional graduates that would potentially result fromimplementing the new program approval process is also estimated. The last twosections provide preliminary results from the analysis, and conclusions andimplications are drawn about why MnSCU in particular, but all postsecondaryinstitutions in general, must understand how labor market information couldcontribute to mediating the conflicting and competing interests ofstakeholders in the area of new program development strategies. MnSCU serves225,000 students annually in credit courses and nearly 95,000 students innon-credit courses. The system includes 7 state universities and 27community, technical, and consolidated colleges located on 53 campuses acrossMinnesota. (KC)
Reproductions supplied by EDRS are the best that can be madefrom the original document.

U.S. DEPARTMENT OF EDUCATIONOffice of Educational Research and Improvement
EDUCATIONAL RESOURCES INFORMATIONCENTER (ERIC)
This document has been reproduced asreceived from the person or organizationoriginating it.
Minor changes have been made toimprove reproduction quality.
Points of view or opinions stated in thisdocument do not necessarily representofficial OERI position or policy.
New Program Development Strategy
and Supply/Demand Analysis:
The Relationship Between Postsecondary Degree Program
Outcomes and Occupational Needs in Minnesota
Pradeep Kotamraju, Ph.D.
Institutional Planning & Research
Customized Training
Dakota County Technical College
Bruce Steuernagel and Mary Jacquart, Ph.D.
Office of the Chancellor
Minnesota State Colleges and Universities
March 1, 2002
(V) This paper was prepared for the Office of Vocational and Adult Education, U.S. Department of Educationpursuant to contract no. ED -99 -CO -0160. The findings and opinions expressed in this paper do not
Q necessarily reflect the position or policies of the U.S. Department of Education.
\_)
BEST COPY AVM . LE

New Program Development Strategy and Supply/Demand Analysis:The Relationship Between Postsecondary Degree Program
Outcomes and Occupational Needs in Minnesota
Pradeep Kotamraju, Ph.D., Bruce Steuernagel, and Mary Jacquart, Ph.D.
Introduction
Minnesota State Colleges and Universities (MnSCU) is the largest system ofhigher education in the state, serving 225,000 students annually in credit courses andnearly 95,000 students in non-credit courses. The system includes 7 state universitiesand 27 community, technical, and consolidated colleges located on 53 campusesacross the state. By virtue of its unique makeup of two- and four-year higher educationinstitutions providing a wide array of occupational and technical education, the liberalarts and general education, MnSCU strives to deliver flexible and responsive educationand training to meet the lifelong learning needs of individuals at different stages of theirwork life.
MnSCU institutions have always been major players when it comes to buildingthe economic vitality of Minnesota regions as well as statewide. Their strategic role inworkforce and economic development, however, has come under greater scrutinywhenever evidence appears that points to worker shortages and/or a mismatchbetween program offerings and workforce needs. Nevertheless, industry need is butone of an ever-increasing number of multiple and conflicting missions that MnSCUinstitutions are being asked to meet by a variety of stakeholders. Besides personalstudy and career interests of students and learners, other interests include thetraditional goals of wider access to academic and occupational education, contractedand customized training, and workforce and economic development imperatives drivenby local, regional, state, and national policy. These competing stakeholder interestshave traditionally influenced the way in which MnSCU institutions offer their degreeprograms. When observing academic program activity at MnSCU institutions, there isan ever-present churn. New courses and programs are continuously introduced, thosethat have outlived their need are closed, and existing programs are modified ascampuses attempt to balance internal and external stakeholder interests. This paperaddresses only one aspect of this churn how new program development strategiesdeveloped by individual MnSCU campuses address the under- or oversupply ofgraduates in meeting Minnesota's short-term and long-term occupational need.
In 1995, when the then separate Technical College System, the Community College System, and theState University System all merged into the MnSCU System, the Minnesota State Legislature mandatedthe creation of a consolidated two-year college that was made up of a previously independent technicalcollege and a community college. There are currently 11 consolidated colleges within the MnSCUSystem.
1

New Program Development Strategy and Supply/Demand Analysis: The Relationship BetweenPostsecondary Degree Program Outcomes and Occupational Needs in Minnesota
The paper is divided into five sections. The paper begins by discussing whyconnecting demographic trends, learner segments, and labor market informationbecome crucial in not only helping to decide which specific new program ideas becomefully implemented, but also to assist in balancing the many competing demands for aregional and statewide new program development strategy. The paper then goes on tobriefly describe a potentially new program approval process that explicitly considers asupply/demand analysis in the approval of new program ideas solicited from thedifferent MnSCU institutions. While it would have been ideal for this paper to documentthe impact and outcomes that the use of this labor market information has made, that isnot possible at this time, since the new program approval process is still in its pilotstage.2 However, by refining the supply/demand analysis described in Appendix B, amore precise estimate for the potential total number of graduates that enter the laborforce and obtain employment is constructed. An estimate for the number of additionalgraduates that would result from implementing the new program approval process isalso estimated. The last two sections provide some preliminary results from theanalysis, and some conclusions and implications are drawn about why MnSCU inparticular, but all postsecondary institutions in general, must understand the critical wayin which labor market information could contribute to successfully mediating theconflicting and competing interests of various stakeholders when it comes to newprogram development strategies.
What Drives A New Program Development Strategy
Identifying new academic majors and programs to better serve students is thedesired outcome of any new program development strategy. This means seeking outnew program ideas that would lead to the approval of programs not currently offered,but for which labor market information indicates that a workforce need exists. There aretwo elements to any new program development strategy:
The labor market data elements, as identified by the Workforce InformationCouncil, that are particularly valuable include the following:
2 It should be pointed out that the new program approval is not really new in structure (see Appendix B), but itsintent is to go beyond simply approving new program ideas. The MnSCU Board of Trustees on July 18, 2001,approved Chancellor James H. McCormick's first-year action plan aimed at building consistent standards of highquality, accountability, collaboration, and service to students. Work began on refining the current programapproval process in August 2001, as part of the MnSCU Chancellor's Strategic Work Plan. One goal (MnSCUWork Plan Goal F1.1) is:To Develop New Majors and Programs to Better Serve StudentsThe outcome for this goal was to establish an operational plan to encourage responsive MnSCUprogrammatic development, including intra-system academic programming articulation and collaboration.However, full implementation of the goal requires, for first time in its history, for MnSCU to develop newanalytic processes, new program plans, and new program approval procedures with increased intra-system articulation and collaboration. While the goal could be interpreted as just developing a programprocess, it was ultimately decided to identify new programs as well. This paper uses this list of newprograms in the supply/demand analysis, outlined in the next section.
2
4

New Program Development Strategy and Supply/Demand Analysis: The Relationship BetweenPostsecondary Degree Program Outcomes and Occupational Needs in Minnesota
Labor Market Conditions Data provide information on the overall structure andcondition of the labor market, including its demographic composition, trends inemployment and unemployment, labor turnover information, and informationon labor force dynamics the movement of people into and out of the laborforce.
Industry Data organize employment, wages, and other information by the typeof production processes used. Industry data also include information on jobcreation and destruction and the life cycle of business establishments.
Occupational Data organize employment wages, and other information by thetype of work performed and identify the skill requirements and otheroccupational characteristics of workers and jobs
Labor Market Projections examine labor force, industry, and occupational trendsand provide a picture of future employment and job openings based on assumptionsabout economic growth.
Current Job Vacancies information identifies job openings for whichemployers are actively seeking workers.
The learner segment data elements, as developed for MnSCU byPricewaterhouseCoopers, which divides the adult (postsecondary) studentpopulation into six separate learner segments:
Degree completion, adult learners students who are seeking to complete adegree program (graduate or undergraduate). They are frequently workingadults over age 25.
Corporate learners students who are seeking education to maintain skillsor advance their careers. The education service purchase decision is madeby the employer and not by the individual acting alone.
Professional enhancement and life-fulfillment students who are seeking toadvance or shift careers taking credit or non-credit courses. These learnersare typically employed.
College experience learners students age 18-25 who are preparing for lifeand career.
Remediation learners students who need studies as prerequisite forenrollment in another program.
35

New Program Development Strategy and Supply/Demand Analysis: The Relationship BetweenPostsecondary Degree Program Outcomes and Occupational Needs in Minnesota
Pre - college learners students interested in taking college-level work priorto completion of secondary school.
Taken together, labor market and learner segment data elements can:
Help inform decisions made by pre-college and college experience learners atthe front end of their work life.
Advise corporate learners looking to upgrade skills to meet changingtechnological needs.
Help degree completion, adult learners, or professional enhancement and life-fulfillment learners improve skills in order to enhance their employmentoptions.
Guide remedial learners to learn new skills as they seek to enter the laborforce for the first time.
What connects the two sets of data elements is demographic information, sincepopulation growth and trends influence the pace and distribution of employment andlabor force growth. At the same time, how students get placed into the different learnersegments depends on demographic information, particularly as it relates to age,ethnicity, and life style.
The table below shows two types of labor market information employmentprojections and vacancy data that are often used by postsecondary institutions todetermine new program development. However, the table shows that the fastestgrowing occupations over the long term are not necessarily in great demand in the shortterm, as signified by the vacancy data. Given this dilemma, postsecondary institutionsattempt to strategically balance both external and internal pressures. External pressuresexist from industry where the expectation is on public higher education to constantlyprovide a supply of skilled workers educated and trained in occupations for which theyhave the greatest need. Internal pressure exists from the requests to develop newprograms that focus on the personal study and career interests of learners.

New Program Development Strategy and Supply/Demand Analysis: The Relationship BetweenPostsecondary Degree Program Outcomes and Occupational Needs in Minnesota
Table 1.Employment Projections 1998-2008, Fastest Growing OccupationsCompared to Fourth Quarter 2001 Vacancy Data
OccupationPercentChange1998-2008
YearlyAverage1998-2008
Fourth Quarter2001 Vacancy Data
Computer Systems Analysts 100 1,606 51
Retail Salespersons 16 1,378 3,884
Cashiers 19 1,226 4,654General Managers and Top Executives 17 1,086 131
General Office Clerks 17 932 1,023
Computer Support Specialists 87 895 114
Supervisors, Sales and Related Workers 18 721 780
Registered Nurses 18 703 3,260
Computer Engineers 99 698 20
Truck Drivers, Heavy 22 698 1,187
Home Health Aides 56 657 552Source: Research and Statistics Office, Minnesota Department of Economic Security
The graph below shows the distribution of learner segments for Fall 2000students at MnSCU institutions.
Graph 1.
Distribution of Learner Segments,Fall 2000 Students at MnSCU Institutions
Pre-collegeRemediation learners Degree
learners 4% completion,
7% 1 J 7 adult learners19%
College-experience
learners33% M
Professionalenhancement
and lifefulfillment
18%
Corporatelearners
19%
Source: Research and Planning, MnSCU, Office of the Chancellor, 2001
Information on learner segments can prove valuable to postsecondary institutionsas they embark on a new program development strategy. However, more preciseinformation on the learner segment data elements is just now being gathered in theMnSCU Office of the Chancellor. At the present time, only indirect information obtainedfrom recent census population and other demographic information is available to assessthe impact of a new program development strategy on learner segments.
5

New Program Development Strategy and Supply/Demand Analysis: The Relationship BetweenPostsecondary Degree Program Outcomes and Occupational Needs in Minnesota
The graphs on the next pages give some important demographic features ofMinnesota postsecondary students, which may also be reflective of similar patterns inother states, particularly in the Midwest and Northeast. An understanding of the trendsin the population served has important implications for postsecondary institutions andregional economic development strategies. This is especially important when faced withlabor shortages in specific occupational areas and changing demographics in theworkforce reflect an aging population and/or increased diversity, especially as a result ofimmigration.
Over the next decade, as illustrated in Graph 2, Minnesota will see significantrelative declines in the kindergarten through grade 12 (K-12) (age 5-17) population andthe young worker population (age 25-44). These declines will be offset by a strongincrease in the (age 18-24) college-going population.
Graph 2.
Projected Population Change inMinnesota: 2000 to 2010
Older old, 80+
Younger old, 65-79
Older worker, 45-64
Young worker, 25-44
College, 18-24
K-12, 5-17
Preschool, 0-4
-8.4%
1 1
9.8%
9%
-12.4% I
-2.6%
12.6%
36.."
-20% -10% 0% 10% 20% 30% 40%
Source: Demographer's Office, MN Planning
One out of two Twin Cities Metro MnSCU students, three out of five GreaterMinnesota (outside the Twin Cities) two-year college students, and two out of threeGreater Minnesota universities are students below age 25. However, MnSCUinstitutions have a significant proportion of students between the ages of 25 to 34.
6

New Program Development Strategy and Supply/Demand Analysis: The Relationship BetweenPostsecondary Degree Program Outcomes and Occupational Needs in Minnesota
Graph 3.
Age of Minnesota Postsecondary Students in Fall 2000
019 and Yaraer 0 20-24 25-34 9135-44 045 and ader
21.0%
Kttio1VhSCU Institutions treater IVN WSW Tvo-
Year Colleges
Gaoler MN IVhSCU
Unhersities
124.7/4
Pll aher Edumticnal
Prmiders
Research and Planning Office, MnSCU, Office of the Chancellor
Recently released 2000 census data have documented the rapid growth ofpeople of color in Minnesota during the past decade (Graph 4). There have been over100 percent increases in both the Hispanic and the Asian population in Minnesota.
Graph 4.
180
160
140
120
100
80
60
40
20
0
Minnesota Population Growth Rates, 1990-2000,by Race and Ethnic Group
168%
ID Single Race
0 Single or Multi-Race112% 113%
....
,,,... .
. .
. .
. .
87%
57%
6% 7%WITI8
wade, Not Hispanic
Source: Demographer'sOffice, MN Planning
Black, Not Hispanic Indian, Not Hispanic Asian, Not Hispanic
9
Hispanic
BEST COPY AVAILABLE

New Program Development Strategy and Supply/Demand Analysis: The Relationship BetweenPostsecondary Degree Program Outcomes and Occupational Needs in Minnesota
While still predominantly white, over the last ten years or so, the MnSCU studentbody has become somewhat more diverse, as can be seen in Table 2. This is true forboth two-year colleges and four-year state universities.
Table 2.MnSCU Enrollment Profile
Technical and Community CollegesRacial/Ethnic Background Fall 1991 Fall 2000
Number Percent Number PercentStudents of Color Total 6,538 7.1% 9,112 11.2%
American Indian 1,838 2.0% 1,195 1.5%Asian and Pacific Islander 1,657 1.8% 2,627 3.2%Black 2,157 2.3% 4,017 5.0%Hispanic 886 1.0% 1,273 1.6%
White 85,369 92.9% 71,978 88.8%Foreign Students 598 0.7% 1,238 1.5%
State UniversitiesRacial/Ethnic Background Fall 1991 Fall 2000
Number Percent Number PercentStudents of Color Total 2,094 3.8% 2,763 6.2%
American Indian 425 0.8% 435 1.0%Asian and Pacific Islander 668 1.2% 935 2.1%Black 651 1.2% 911 2.1%Hispanic 350 0.6% 482 1.1%
White 53,048 96.2% 41,450 93.8%Foreign Students 1298 2.4% 1,938 4.4%
Source: Minnesota Higher Education Services Office
The brief overview of the demographic trends in Minnesota, and the underlyinglearner segments within the MnSCU student body, reveal that, while enrollment atMnSCU institutions will likely grow, its distribution in terms of age, race, study choice,and career goals will be different from the past. More generally, knowing more detailsabout specific learner segments should help MnSCU institutions craft a new programdevelopment strategy that takes into consideration student personal interests beyondthe usual career interest of finding employment soon after graduation.
New Program Approval Process and New Program Activity
All new program activity has a life cycle. Usually, completion of programdevelopment through the approval stage averages about 18 months, but there are widetime variations for various programs. When approved, program ideas become activeprograms and then continue to be offered for many years. New program ideas comefrom a wide variety of sources, but one likely source is labor market information. Criteriasuch as available resources, institution size, program complexity, and community needsare also used to select programs for further development. Program approval beginswithin an institution. Each institution sets its own internal program approval process.Commonly, advisory committees and department faculty may review a programproposal. Institution-wide curriculum committees and administrative sign-off are alsoincluded in the approval process. Program proposals that have been approved by aninstitution are then submitted to the Office of the Chancellor. The Academic Program
8 10 BEST COPY AVAILABLE

New Program Development Strategy and Supply/Demand Analysis: The Relationship BetweenPostsecondary Degree Program Outcomes and Occupational Needs in Minnesota
Unit staff in the MnSCU Office of the Chancellor review the program proposals forconformance to criteria set in the current program approval policy and procedure. Thenew program is then submitted for action to the MnSCU Board of Trustees forapproval.
Upon approval, the institution begins implementation of the new program.Implementation includes marketing, supply and equipment purchases, hiring of faculty,course scheduling, and may include facility renovation. Existing programs, throughinstitution-designed procedures, are continuously reviewed and improved, leading toprogram expansion and improvement through modification. In fact, some institutions donot separate process of program review from those designed for program improvement.Last but not least, if external (market) and internal (campus) conditions dictate, thesereview procedures may lead to program reduction, suspension, and finally closure. Thecharts below provide some indication about overall program activity at MnSCUinstitutions.
The graphs that follow show program activity by transaction type4, with thebreakdown by education clusters and award levels. Program modification dominates,while opening and closing programs is still a relatively small activity. Certificate andmaster's level programs comprise a proportionately higher share of new programactivity. Colleges respond to internal funding constraints and external workforcedemands through the program modification process. More importantly, many of theseprogram modifications or redesigns generally do not require Board action. More to thepoint, program modifications across different groupings, and over time, seem to suggestthat the perception that colleges and universities are unresponsive to changing labormarket information is not quite accurate.
Graph 5.
100%
90%
80%
x70%.11 60%
a. co%
40%
at "30%
20%
10%
0%
Program Ac ivity by Education Cluster and by Transaction Type, FY2001
1 2 3 4 5 6 7 8 9 10 11 12 13
Education Cluster
14 15 16 17 18 19 20 AllClusters
0 OTHER
ONEW
MODIFYOCLOSE
Source: Academic Program Review and Approval Unit, Office of the Chancellor, MnSCU
3 Appendix A briefly describes the steps, and the criteria necessary for program approval, as currently laidout by the MnSCU Board of Trustees.
Any time an institution is engaged in opening, closing or modifying programs, the activity is referred toas a transaction. In the charts, "OTHER" refers to reinstating, suspending, or relocating programs.

New Program Development Strategy and Supply/Demand Analysis: The Relationship BetweenPostsecondary Degree Program Outcomes and Occupational Needs in Minnesota
1=Agric./Nat. Res; 2=Architecture & Constr.; 3=Manufacturing; Trans., Dist., & Logistics; 5=Info. Tech.; 6 =Ret.& Wholesale Sales & Service; 7=Fin. & Ins.; 8=Hosp. & Tourism; 9=Bus. & Admin.; 10=Health Science;11=Human Service; 12=Arts, A.V. Tech. & Comm.; 13=Law & Public Safety; 14=Sci. Res./Eng.; 15=Ed. & Training;16=Govt. & Pub. Admin; 17=Interdisciplinary Studies; 18=Humanities; 19=Soc. Sc.; 20=Math & Nat. Sc.
Graph 6.
100%
90%
80 %-
70/.
60%
50%
40%
30%
20% -
DI%
0% 7
Program Activity by Award Type and Transaction Type, FY 2001
Associate Bachelors Certificate Diploma Masters
Award Type
0 OTHER
0 NEW
MODIFY
0 CLOSE
Source: Academic Program Review and Approval Unit, Office of the Chancellor, MnSCU
Graph 7.
100%
90%
80%
70%
60%
50%
40%
30%
20%
10%
0%
Overall Program Activity by Transaction Type,FV1998-FY2001
1997-98 1998-99
Fiscal Year
1999-00 2000-01
o urn ER
0 MODIFY
0 NEW
0 CLOSE
Source: Academic Program Review and Approval Unit, Office of the Chancellor, MnSCU

New Program Development Strategy and Supply/Demand Analysis: The Relationship BetweenPostsecondary Degree Program Outcomes and Occupational Needs in Minnesota
Coordinating the New Program Development Process
As part of the MnSCU Chancellor's First-Year Work Plan, the new programdevelopment process under MnSCU Work Plan Goal F1.1 New Programsundertook two major activities to identify potential new program ideas. First, a survey ofthe Chief Academic Officers (CAOs) of the 34 MnSCU institutions was completed tocollect new program ideas. The second activity was a supply/demand analysis ofoccupations typically requiring postsecondary education for six sub-state regions andthe state as a whole.5 These two activities complemented each other, in that the CAOsurvey captured the informal scanning and communication from local employers andstudents that is often the genesis of new programs. The labor market analysis provideda quantitative reference to help identify gaps in current programs. The shortage/surplusreport for the appropriate region was then sent to CAOs of the MnSCU institutions inthat region. Conference calls were held on a regional basis to identify and discuss newprograms candidates, and to identify lead institution(s) and potential location(s).
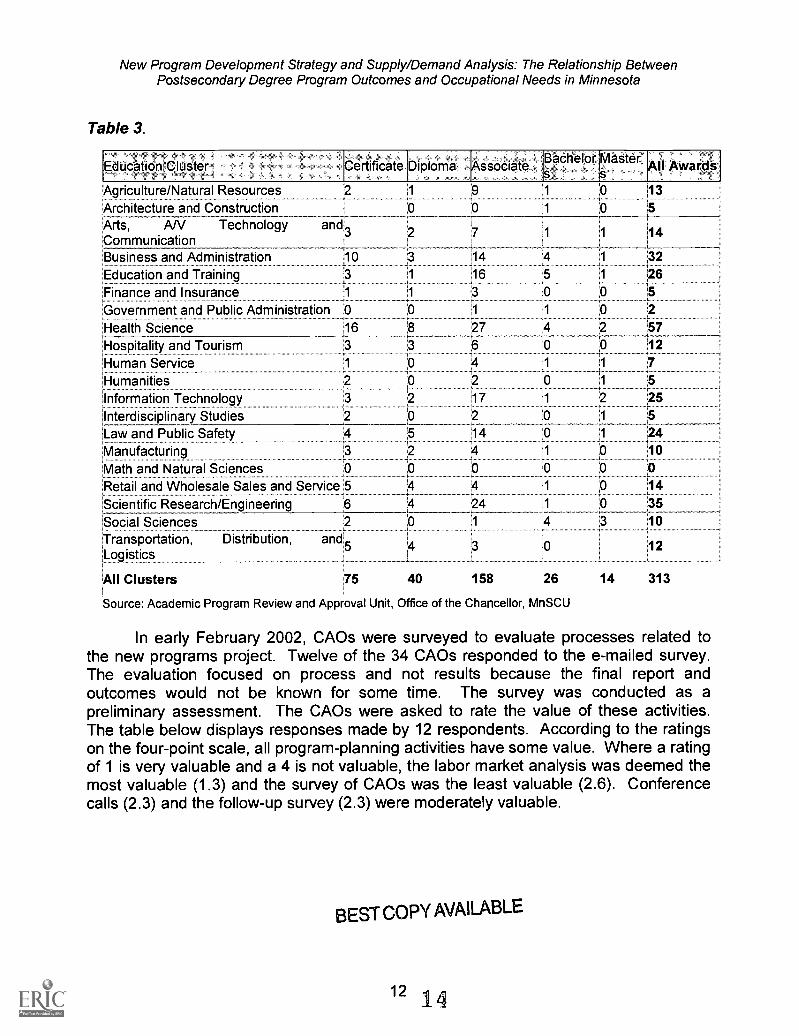
The list of program ideas (a total of 313 programs) ranged from those where agood deal of work had been done on them to programs in emerging technologies aboutwhich little is known at this time. The following table shows the distribution of newprogram ideas by award levels and education cluster.
5 The procedure to develop the supply/demand analysis is described in Appendix B.6 This number is a conservative estimate since to be included in the estimation for the total number ofprojected awards resulting from the new program approval process must meet the following criteria: aprogram (CIP) identification and the award levels at which the program will be offered.
New Program Development Strategy and Supply/Demand Analysis: The Relationship BetweenPostsecondary Degree Program Outcomes and Occupational Needs in Minnesota
Table 3.
Education Cluster Certificate Diploma AssociateBachelor MaSter
S: All Awards
Agriculture/Natural ResourcesArchitecture and ConstructionArts, Technology and3
2 7 1 1 14CommunicationBusiness and Administration 10 3 14
Education and Training 3 16
Finance and Insurance 3
Government and Public Administration 0
Health Science 16
Hospitality and Tourism 3
Human ServiceHumanitiesInformation TechnologyInterdisciplinary StudiesLaw and Public Safety 4
ManufacturingMath and Natural SciencesRetail and Wholesale Sales and Service 5Scientific Research/Engineering 6Social Sciences 2
Transportation, Distribution, and5Logistics
All Clusters 75 40 158 26
Source: Academic Program Review and Approval Unit, Office of the Chancellor, MnSCU
14 313
In early February 2002, CAOs were surveyed to evaluate processes related tothe new programs project. Twelve of the 34 CAOs responded to the e-mailed survey.The evaluation focused on process and not results because the final report andoutcomes would not be known for some time. The survey was conducted as apreliminary assessment. The CAOs were asked to rate the value of these activities.The table below displays responses made by 12 respondents. According to the ratingson the four-point scale, all program-planning activities have some value. Where a ratingof 1 is very valuable and a 4 is not valuable, the labor market analysis was deemed themost valuable (1.3) and the survey of CAOs was the least valuable (2.6). Conferencecalls (2.3) and the follow-up survey (2.3) were moderately valuable.
BEST COPY AVAILABLE
12 14

New Program Development Strategy and Supply/Demand Analysis: The Relationship BetweenPostsecondary Degree Program Outcomes and Occupational Needs in Minnesota
Table 4.
Program Planning ActivitiesFor each row, mark an X under one column.VeryValuable1 2 3
NotValuable4
a. Labor Market Analysis 9 3 0 0
b. CAO New Program IdeaSurvey (Oct)
2 2 6 1
c. Conference Calls (Nov andJan)
2 5 5 0
d. Follow-up Survey (Dec) 2 6 3 1
Source: Academic Program Review and Approval Unit, Office of the Chancellor, MnSCU
The fact that 75 percent of the CAOs surveyed indicated that the labor marketanalysis provided to them was useful is evident, as reflected in the above table. Theevaluation also reflected several themes, which indicated the need to
Allow time for in-depth communication and collaboration
Align rewards and reduce barriers and burdens
Improve program planning through better techniques, training, standards,definitions, research, and rules of engagement
Create regions that are flexible so as to align programs with needs of thestate.
In addition to meeting the intent of MnSCU Work Plan Goal F1.1 NewPrograms, both the conversation with CAOs, and the shortage supply report' providedsome valuable insights into the relationship between labor market outcomes and newprogram development strategies. First, it was an opportunity talk about the reasons whythere were shortages in some of the occupations that were identified. Will starting newprograms reduce labor shortages? Were there already programs, but not enoughstudents enrolling or completing? Were employers seeking customized training forincumbent workers rather than academic program graduates to fill the demand? Couldmore workers be trained if the courses were available on-line? While the analysispresented below does not directly answer these questions and address other caveats,8it does focus on attempting to estimate a more precise shortage/surplus measure, usingdifferent need criteria, and relating them to new program development strategiesdeveloped under MnSCU Work Plan Goal F1.1 New Programs.9
A sample page from one of the reports is shown in Appendix B.8 Appendix B discusses the limitations of the supply/demand approach in general.

New Program Development Strategy and Supply/Demand Analysis: The Relationship BetweenPostsecondary Degree Program Outcomes and Occupational Needs in Minnesota
New Program Development Strategy and Supply/Demand Analysisl°
To decide whether or not to introduce a new academic program, college facultyand administrators usually review industry and occupational information (demand),demographic information (supply), and emerging economic, business, and social trends(connecting supply to demand). As already indicated in previous sections, while usefulin the aggregate, reviewing these sets of information does not provide a precisemeasure for the average under- and oversupply of graduates in meeting current andfuture occupational demand. Also, such information provides limited guidance when itcomes to introducing new academic programs. The analysis presented below attemptsto calculate an estimate of awards for different occupational clusters and for different jobzones within the State of Minnesota. Federal and Minnesota sources were used togather the necessary data on occupational employment projections, vacancies fordifferent occupations, the number of awards granted in different program clusters andby the level of award granted. Additionally, the analysis indicates how new academicprogram development strategies relate to labor market information. By estimating thenumber of additional projected awards, a comparison can be made to the estimatedsurplus/shortage in the labor market.
The basic problem in comparing employment demand information with the supplyof graduates is how each is generally presented. Employment projection and vacancyinformation is given as the total number of jobs that would be required in the future(projections) or the number of openings (vacancy) for a particular occupation." On theother hand, the number of awards12 granted determines the supply of graduates.13 In
9 The current MnSCU Academic Approval Manual requires colleges and universities to, among otherthings, show that current and projected job openings significantly exceed the projected number ofgraduates and the intent of the Chancellor's Office is to continue using labor market information underMnSCU Work Plan Goal F1.1 New Programs.10 Appendix B outlines the original supply/demand analysis procedure that was developed in conjunctionwith MnSCU Work Plan Goal F1.1 New Programs. Subsequent to that analysis, the procedure, whilefundamentally remaining the same, was improved upon by developing a more robust crosswalk by usingadditional data from 1999 and 2000. The original procedure used data from 1998 only. Also, the analysisin this paper does not attempt to identify shortages or surpluses at a disaggregated level, as in theoriginal. Nevertheless, the limitations pointed in Appendix B still hold. However, the refined analysismakes it easier to overcome those limitations once more data become available.11 Such information can also be presented by industry. However, this paper uses occupations to definedemand. The occupations are classified by the Federal Department of Labor Standard OccupationalClassification (SOC) codes, which are then grouped into 22 different occupational clusters.12 Information on the total number of awards granted is presented at the Classification of InstructionalProgram (CIP) level, which are then organized as 16 education clusters and a NONE cluster, as identifiedby the Federal Department of Education. MnSCU has broken the NONE cluster further into four separateclusters to identify the different liberal arts and general education programs, creating a total of 20education clusters. Within each of these 20 clusters, five types of awards are generally grantedcertificates, diplomas, associate degrees, bachelor's degrees, and master's degrees. The bachelor'sdegrees includes post-baccalaureate certificates, and master's includes post-master's certificates, firstprofessional degrees, and doctorates.
14 16

New Program Development Strategy and Supply/Demand Analysis: The Relationship BetweenPostsecondary Degree Program Outcomes and Occupational Needs in Minnesota
other words, obtaining a direct estimate for the average under- and oversupply ofgraduates is not possible because supply and demand are presented using separateand noncomparable classification systems. What is needed is a crosswalk that connectsthe supply of graduates to the demand for workers. Since 1998, MnSCU has beendoing an annual graduate follow-up survey that collects, among other things, graduateemployment status and job title. The job titles were coded using the StandardOccupational Classification (SOC). The information in this follow-up survey is used tobuild a crosswalk that connects supply to demand. The crosswalk is then used toestablish an estimate for the total number of awards, including those that may arisewhen new program development strategies are put in place, for each of the four jobzones, or for each occupational cluster used in the analysis.14
Given that this paper focuses on those occupations that graduates of existingand new postsecondary academic programs would be expected to enter, demand waslimited to job openings in selected occupations in Job Zone 2 and all occupations in JobZones, 3, 4, and 5.1° A total of 505 SOC occupations were included in the analysis, theSOS occupations were then organized into the 22 occupational clusters. Two estimatesfor the annual average openings in Minnesota are obtained, one using the MinnesotaDepartment of Security 1998-2008 Projections data,16 and the other using theMinnesota Department of Security Fourth Quarter 2001 Job Vacancy Survey.17 On theone hand, the projections data provide an indication of the long-term need for workers in
13 While the term graduates is often used, particularly in the MnSCU Graduate Follow-up Survey, thefocus of the supply estimate developed here is on the number of awards granted for each award level andfor each CIP code. To the extent that some students have double majors, and some gather severalawards within a specific area of study, the number of graduating students will be fewer than the numberof awards granted.14 One could also establish an estimate for total openings for each of the education clusters. However,this would imply that the crosswalk that has been built for the analysis, using only MnSCU data, reflectthe program cluster and award level distribution of overall Minnesota employment within an occupationalcluster. This is a much stronger assumption, and, without any knowledge of how Minnesota businesseshire graduates that receive different award levels, is much harder to justify. On the other hand, theanalysis appears to be on stronger ground using the somewhat weaker assumption that the crosswalkreflects the occupational distribution of total awards in Minnesota within each education cluster.15 About half of the occupations in Job Zone 2 (some preparation) were included in the analysis if thereexisted a current postsecondary program in operation. Examples include drywall installers, fire inspectors,flight attendants, pharmacy technicians, truck drivers, to name a few.16 These data use the older Occupational Employment Statistics (OES) classification and were re-estimated for each of the SOC codes using the OES-SOC crosswalk developed by the NationalCrosswalk Center.17 Minnesota began collecting vacancy information in fourth quarter 2000. Another was conducted in thesecond quarter 2001. A third was collected in fourth quarter 2001. Initially, the methodologies used foreach were slightly different. Only recently has the Minnesota Department of Economic Security (MDES)readjusted the three vacancy surveys to make them comparable. The question of using data from justone quarter is troublesome. Ideally, one would like an annualized measure, but MDES has conductedvacancies for only the second and fourth quarters. But when using short-term labor market information,particularly for new program development, the tendency appears to use the most recent. Since thepurpose of this paper was to contrast long-term need from short-term need measures, when each iscompared to projected awards generated from a new program development strategy based on a commonranking system, only the most recent vacancy data were used.

New Program Development Strategy and Supply/Demand Analysis: The Relationship BetweenPostsecondary Degree Program Outcomes and Occupational Needs in Minnesota
the specific occupations, and the clusters to which they belong. Using the vacancy data,on the other hand, shows whether an immediate need for workers in particularoccupations, and the underlying clusters, exists.
Data on the number of graduates from Minnesota higher education institutionswere used as a measure of the supply of graduates. For ease of analysis, the supplyestimate was calculated for each of the 20 education clusters (see Note 11) and the fourjob zones. Next, a three-year average (1998-2000) for the number of awards grantedwas obtained, one for MnSCU degree programs, and another for non-MnSCU degreeprograms.18 Summing the two, an overall estimate of the total number of awards inMinnesota is developed for each cluster. Not all students receiving an award join thelabor force. Some in this group choose to continue on with their education, others arenot available for work, and the status of still others is unknown. Therefore, to estimatethe potential supply of graduates in Minnesota for each education cluster, the totalawards number was adjusted downwards to more accurately reflect the inclusion of onlythose graduates who made themselves available for the labor market.
The MnSCU Crosswalk Database, developed specifically for the analysis in thispaper, uses information available in the MnSCU Graduate Follow-up Survey.19 Amongother things, in the MnSCU Graduate Follow-up Survey, respondents are asked toidentify the job title in which they are currently employed.20 These job titles are thenindividually coded into specific six-digit SOC codes. Three years (1998-2000) of thefollow-up data have been made available. For all three years combined, approximately37,000 of the over 55,000 job titles have specific SOC codes. Further, all Job Zone 1occupations and those Job Zone 2 occupations that did not require a postsecondaryeducation were removed. For each job title, the database identifies a six-digitClassification of Instructional Program (CIP) code (indicating a particular educationalprogram), the associated award with which the respondent graduates, the six-digit SOCCode, and the related job zone where the graduate finds employment.
The MnSCU Crosswalk Database is a matrix consisting of 8,800 cells (4 jobzones x 5 award levels x 22 occupational clusters x 20 educational clusters). Each cellin the matrix shows, for a specific job zone-award levels combination, the percentage oftotal graduates within each education cluster who find employment in a particular
18 The data source for the MnSCU estimate is the Research and Planning Unit, MnSCU Office of theChancellor. The Federal Department of Education National Center for Educational Statistics IntegratedPostsecondary Education Data System (IPEDS) Peer Analysis Data files is the source for non-MnSCUprivate and public institutions, including proprietary schools.u° It is this database that is different from the one developed for the MnSCU Program Goal F1.1 NewPrograms (see Appendix B).20 The MnSCU Graduate Follow-up Survey was collected for the first time in 1998, and follow-up surveysfor 1999 and 2000 have been completed. Generally speaking, respondents' employment status, and whatwork they might be employed in, is usually determined during the year following their individualgraduating dates. Since information is collected for an entire cohort (e.g., the Class of 1998 graduatesreceiving degrees anytime between July 1, 1997, to June 30, 1998), the collection period extends throughJune 30, 1999.
16 18

New Program Development Strategy and Supply/Demand Analysis: The Relationship BetweenPostsecondary Degree Program Outcomes and Occupational Needs in Minnesota
occupational cluster. The following table, Table 5, shows a very tiny slice (24 of the8,800 cells) of the matrix. The example presented in the table shows how a single cell inthe MnSCU Crosswalk Database is calculated. Using the MnSCU Crosswalk Database,summary information can then be obtained for different groupings, or combinations ofgroupings, such as occupational clusters, educational clusters, job zones and awardlevels. For the analysis discussed below, total awards are estimated for eachoccupational cluster and for each job zone.
Table 5.A Partial Frame of the MnSCU Crosswalk Database: Selected OccupationalClusters and Selected Education Clusters for the Associate Degree and Job Zone3 Combination
Part A. Estimating an Award Total for Associate Degree -Job Zone 3 CombinationShare of Job Zone-Award Level Combination 3% 24% 4% 3%
All Job Zones and All Award levels 2696 4462 1500 1402
Total Award 68 1069 56 37
Part B. Shares of Occupational Cluster-Education Cluster forAssociate Degree -Job Zone 3 CombinationEducation Clusters
Occupational ClustersInformationTechnology
Inter-disciplinaryStudies
Law andPublicSafety
Manufacturing
Architecture and Engineering 0% 1% 0% 71%
Art, Design, Entertainment and Media 0% 4% 0% ,2%
0% 2%Building, Grounds Cleaning and Maintenance 3% 1%Business and Financial Operations 3% 5% 2% 5%
Community and Social Services 0% 0% 7% 0%
Computer and Mathematical 34% ?% 0% 0%
Total Award 68 1069 56
Part C. Estimating an Award Total for Associate Degree-Job Zone 3-Occupational Cluster-Education Cluster CombinationEducation Clusters
Occupational Clusters InformationTechnology
Inter-disciplinaryStudies
Law andPublicSafety
Manufacturing
Architecture and Engineering 0 12 0 27
Art, Design, Entertainment, and Media 0 48 0 1
Building, Grounds Cleaning and Maintenance 2 8 0 1
Business and Financial Operations 2 56 1 2
Community and Social Services 0 4 4 0
Computer and Mathematical 23 19 0 0

New Program Development Strategy and Supply/Demand Analysis: The Relationship BetweenPostsecondary Degree Program Outcomes and Occupational Needs in Minnesota
Example: To estimate an Award Total for the Computer and MathematicalOccupational Cluster Information Technology Education Cluster Associate Degree-Job Zone 3, the following calculation is undertaken:
[(0.03 x 2696) x 0.34] = 23
This calculation is repeated for each of 8,800 cells. Summing up over alleducation clusters would then establish the total number of awards for eachoccupational cluster for a particular award level and job zone combination. The 8,800cells could be reorganized into a 88 x 100 matrix, where each cell of this matrixshows an occupational cluster-education cluster-award level-job zone combination.
In addition to estimating the current distribution of total awards by occupationalcluster, an estimate for the distribution of awards by occupational cluster for the newprograms requested by college and universities within the MnSCU System also needsto be determined. The method of determination follows essentially the same techniquedescribed in Table 5. However, to arrive at this estimate, a New Program Databaseneeded to be developed from the information provided by the CAOs of the MnSCUcolleges and universities. Starting with the list of new programs, a CIP code wasattached to each of them. By doing this, the new programs could be placed in theirrespective education clusters. Then a determination was made about the different typeof awards that would be given out to potential graduates in these new programs. Usingthe education cluster and the award level, an estimate was calculated for the totalawards that would be granted if the new program was implemented. Specifically, a perprogram award estimate was made for each education cluster based on the currentpattern of distribution of awards. This per program award estimate was then multipliedby the number of new programs within each education cluster. The resulting estimategives the potential number of additional awards that would be generated as a result ofimplementing the new program development strategy. Once this estimate was obtained,the technique described in Parts B and C of Table 5 was used to determine theadditional awards by occupational cluster and job zone.
The following three measures are estimated:
1. A long-term indicator, using 1998-2008 projections data, is estimated as thedifference between total awards and total openings (growth plusreplacement); and
2. A short-term indicator, using the vacancy data, is estimated as the differencebetween total awards and total vacancies.
3. Additional awards resulting from implementing new program developmentstrategies.

New Program Development Strategy and Supply/Demand Analysis: The Relationship BetweenPostsecondary Degree Program Outcomes and Occupational Needs in Minnesota
A series of summary tables (Appendix C, Tables C1-C6) are generated and fromthese tables ranking information for the above three measures are derived. Therankings are done for occupational clusters only. It should be noted since the awardsdata, current and new, are averaged over three years, the supply measure is anaverage for the three years 1998- 2000. The projections data are an average of the ten-year projection (1998-2008). Finally, the vacancy information is currently collectedduring only two quarters of the year. The fourth quarter of 2001 reflects the most currentlabor market conditions.
Results
The purpose of obtaining the shortage/surplus measures is to determine whichoccupational clusters are in greatest demand and to use that information as oneelement in developing new academic programs. College faculty and administrators areconstantly suggesting the development of new programs. From a macro perspective,there is need to use some uniform way to determine the efficacy of developing newprograms. As already indicated, labor market information is generally usedunsystematically and often comes from heterogeneous sources. The MnSCU CrosswalkDatabase attempts to provide uniformity and rationality in the new academic programdevelopment process, particularly when it comes to the use of labor market information.
Tables C1-C6 in Appendix C summarize the information developed for thisanalysis. Table C1 shows the average annual shortage/surplus for the years 1998-2000. The table shows that, on average, over the three-year period, the number ofgraduates being produced by educational institutions in Minnesota is not going to besufficient to meet long-term occupational demand in Minnesota.21 There are many moreoccupation clusters that show shortages over the long term. The five occupationalclusters (in order) showing the greatest shortages are Production, Management; Salesand Related; Personal Care and Service; and Installation, Maintenance, and Repair.The bottom five (in order) showing the greatest surpluses are Healthcare Practitionersand Technical; Office and Administrative Support; Education, Training, and Library;Community and Social Services; and Protective Services. Table C2 below provides thesame information from Table C1, but this time the estimates are shown for different jobzones. Other than Job Zone 4, all other job zones show a shortage, indicating long-termneed for occupations in those job zones. Even though Job Zone 4 shows a surplus, it isnot very large (five percent of average total openings).
Interestingly, when compared to Table C1, Table C3 shows relatively feweroccupational clusters indicating a shortage. The five occupational clusters (in order)
21 It should be kept in mind that many students, particularly in two-year institutions, are often incumbentworkers seeking to advance themselves in their careers, who are going to school and working at thesame time. A more realistic estimate of the total awards should discount these individuals since, morethan likely, even after receiving an award from an educational institution, these individuals will beemployed at their place of work, lowering the total number of graduates that will be made available forwork, and thereby affecting estimates of the shortage and surplus for a specific occupational cluster.

New Program Development Strategy and Supply/Demand Analysis: The Relationship BetweenPostsecondary Degree Program Outcomes and Occupational Needs in Minnesota
showing the greatest shortages are Healthcare Support; Personal Care and Service;Food Preparation and Serving Related; Healthcare Practitioners and Technical; andTransportation and Material Moving. The bottom five (in order) showing the greatestsurpluses are Office and Administrative Support; Education, Training, and Library;Computer and Mathematical; Management; and Architecture. Also, overall, there is asurplus of awards. The huge surplus in Job Zone 4 occupations stands out in Table C4.On the other hand, Job Zone 2 shows a significant shortage.
Tables C5 and C6 combine the two aspects that underlie the analysis of thispaper linking new academic program development with the different estimates ofunder- and oversupply of graduates in Minnesota. Table C5 shows the five occupationalclusters (in order) with highest number of projected additional awards are HealthcarePractitioners and Technical; Office and Administrative Support; Protective Services;Education, Training and Library; and Computer and Mathematical. The fiveoccupational clusters (in order) with the least number of additional awards are Farming,Fishing, and Forestry; Building, Grounds Cleaning and Maintenance; Transportationand Material Moving; and Life, Physical, and Social Science. However, when observingthe rankings of the shortage/surplus indicators, the occupational clusters with thegreatest surpluses match up with those occupational clusters that have the highestnumber of projected additional awards. Table C6 clearly shows that the greatest need,short- or long-term, for new program development appears to be in jobs with somepreparation (Job Zone 2) or for jobs with extensive preparation (Job Zone 5). On theother hand, only one-quarter of new program requests are programs that address theneeds in these two job zones. Table 6 below presents the different rankings foroccupational clusters, ordered by the ranking for new program development. Spearmanrank correlations are estimated for these rankings and are presented in Table 7 below.

New Program Development Strategy and Supply/Demand Analysis: The Relationship BetweenPostsecondary Degree Program Outcomes and Occupational Needs in Minnesota
Table 6
Comparing New Program Ranking to Long-Term and Short-Term NeedRankings,1998-2001 Minnesota
Occupational Cluster New ProgramRanking
Long-TermNeed Ranking
Short-TermNeed Ranking
Healthcare Practitioners and Technical 1 22 4
Office and Administration Support 2 21 22Protective Service 3 18 15
Education, Training, and Library 4 20 21
Computer and Mathematical 5 6 20Business and Financial Operations 6 9 14
Management 7 2 19
Healthcare Support 8 10 1
Installation, Maintenance, and Repair 9 5 13
Community and Social Services 10 19 16
Sales and Related 11 3 10
Architecture and Engineering 12 17 18
Production 13 1 6
Personal Care and Service 14 4 2
Legal 15 14 11
Art, Design, Entertainment, and Media 16 16 17
Construction and Extraction 17 12 7
Food Preparation and Serving Related 18 7 3
Life, Physical, and Social Science 19 13 12
Transportation and Material Moving 20 8 5
Building, Grounds Cleaning and Maintenance 21 11 9
Farming, Fishing, and Forestry 22 15 8Source: Table C5
Table 7.
Rank Correlation MatrixNew ProgramRanking
Long-Term NeedRanking Short-Term Need Ranking
New Program Ranking 1 -0.258 -0.447*
Long-Term Need Ranking -0.258 1 0.327
Short-Term Need Ranking -0.447** 0.327 1
*Spearman Correlation is significant at the 0.05 level (2-tailed)
Table 6 shows that occupational clusters that show a high relative need are oftenones where there have been fewer new program requests. This is true for when newprogram ranking is compared to the rankings of both short- and long-term need. Also,there appears to be a discrepancy between the short-term and the long-term need
21 23

New Program Development Strategy and Supply/Demand Analysis: The Relationship BetweenPostsecondary Degree Program Outcomes and Occupational Needs in Minnesota
rankings. These perceptions are confirmed when one looks at the correlation matrix inTable 7. Interestingly, though, the only statistically significant relationship appears to bebetween the new program ranking and the short-term need ranking. In addition, whilethe relationship between short-term and long-term need appears to have the right sign(they are positively related), it is not statistically significant.
Conclusions and Implications
Given current patterns of award granting, it appears that Minnesota, at least overthe long-term, is unlikely to produce a sufficient number of graduates to meet the needsof the economy. This is true for several occupational clusters and for virtually all levelsof preparation. The fact that a significant number of clusters, particularly in job zoneswith lower levels of preparation, show shortages may indicate the slowness with whicheducational institutions are adjusting to the realities of the new economy. It might alsoindicate that there is a slow response to newer learner segments who generally prefershort-term education and training programs and even shorter certification processes.The undersupply of graduates, when looking several years out, may be of concern froman economic development perspective. Once again, it brings to the forefront the oft-quoted refrain that educational institutions are not adequately addressing the workforceneeds of the economy.
One could also argue that, given the relationship22 between new program rankingand the long-term need ranking is statistically insignificant, a new program developmentstrategy discounts labor market information based on employment projections andtherein lies the problem. When reviewing program activity within MnSCU, however, itbecomes apparent that modifications at all award levels are taking place, and collegesand universities are not just focusing in on new program activity. More than likely,individual MnSCU institutions are, on their own, modifying their existing programstructure, taking into consideration their local and regional needs and not necessarilystatewide needs.23 The workforce development community simply does not hear aboutthese changes within the system the churn of overall program activity. Moreimportantly, the case has to be made that this churn in overall program activity doeshave a valuable impact on the economic vitality of a region or the entire state.24
22 When employment projections data are disaggregated into replacement and new openings, apreliminary analysis by the Minnesota Department of Economic Security (MDES) suggests a strongrelationship between replacement openings and the vacancy data, but no significant one between newopenings and vacancy data. This being the case, it would imply new program development strategiesmust pay attention to the non-degree-seeking incumbent worker the corporate learner and theprofessional enhancement and life-fulfillment learner, who are usually employed and the educationservice decision is made both by employer and the employee.23 Expanding the MnSCU Crosswalk Database to include regions and individual institution information, aswell to which college configuration each belongs, will provide more detailed analysis about therelationship between new program activity and labor market information. Also see the discussion onlimitations in Appendix B.
2224

New Program Development Strategy and Supply/Demand Analysis: The Relationship BetweenPostsecondary Degree Program Outcomes and Occupational Needs in Minnesota
When looking at the very near term, the results of the analysis suggest anoverproduction of graduates in several occupational clusters and graduates requiringfour-year college degrees (Job Zone 4). This result is reinforced by the statisticallysignificant relationship between new program ranking and the short-term need ranking.The results obtained here may relate more to the current performance of the Minnesotaeconomy, which has seen vacancies for occupations requiring a postsecondaryeducation cut by one-half over a period of 18 months (Summer 2000 to Winter 2001). Areal concern that arises is what happens to the backlog of graduates from currentprogram activity and how they might influence a new program development strategy.Coupling this with demographic information, which indicates a reduction in the collegeworker population, seems to suggest the inclusion of new programs that directlyaddress the retraining of these graduates as they wait out economic downturns, such asthe one now taking place.25
It goes without saying that, when the short-term and long-term needs match, (saythat the clusters have a top ten ranking on both criteria), the labor market informationwill simply reinforce any of the other justification for implementing a new programdevelopment strategy. This appears to be the case for Healthcare Support, Sales andRelated, Production, Personal Care and Service, Food Preparation and ServingRelated, and Transportation and Material Moving. Interestingly, though, among theseoccupational clusters, only Healthcare Support, based on the new program ranking, is inthe top ten. On the face of it this may appear surprising and implies the discounting oflabor market information by individual colleges and universities. But upon closerexamination, local knowledge and experience about initiating, running, and marketingnew programs may have had an equally important influence when submitting newprogram ideas. More specifically, as indicated in the CAO conference calls, lack ofstudent interest (for example, in programs relating to Production), or institutionalresource constraints (Transportation and Material Moving, as another example) mayhave precluded their inclusion on the new program list, even though the labor marketneed factor dictates otherwise.
It appears that, if the suggested new program ideas are fully implemented, it willhave the effect of more or less adding to the surpluses that already exist for someoccupational clusters. Some of these clusters have been in great demand until recently
24 One possible way would be to link the graduate follow-up data with unemployment insurance (UI) wagedetail data. Recently, MnSCU has been engaged in a partnership with MDES (the keepers of the wagedetail data) to examine the employment success of MnSCU graduates. A preliminary analysis of thislinkage has indicated that nearly 75 percent of MnSCU graduates work in Minnesota immediately uponcompleting their degree programs. Another possibility would be to have Minnesota become more activelyinvolved in the WRIS project at the US Department of Labor. This would enable to find out informationabout graduates who have left Minnesota and now work in other states.25 The American Association of Community Colleges (AACC) has recently argued that two-year collegesare the "new graduate schools" wherein four-year graduates are returning to acquire technical skills tocomplement their liberal arts and general education degrees. The AACC estimates that one out of threecurrently enrolled two-year college students already has a four-year degree.

New Program Development Strategy and Supply/Demand Analysis: The Relationship BetweenPostsecondary Degree Program Outcomes and Occupational Needs in Minnesota
(Computer and Mathematical, and Installation, Maintenance, and Repair), but as theindustries that would potentially employ these graduates have seen a decline in activity,the demand for workers in these occupations has suffered. Nevertheless, it should bepointed out that the long-term need for these occupations would be high and growing.To what extent new program development strategies take into account long-term needis still subject to debate. In other words, are tables such Table 1 merely informational orare they much more? In the case of Computers and Mathematical, while long-term needmay have been a factor, one suspects that a "bandwagon" effect may have had more todo with starting or modifying programs in Information Technology. Also, in the case oftechnical programs such as Installation, Maintenance, and Repair, where studentinterest is at best tenuous, initiating a new program development strategy based onlong-term need could prove costly. In either case, intra-system articulation andcollaboration must be integral to a new program development strategy if the risks fromusing long-term labor market information are to be minimized.
When clusters (Health Practitioners and Technical, for example), indicate that theshort-term need is high but the shortage over the long term is nonexistent, the newprogram development requires a modification. Initiating only new programs in this casemay prove risky particularly in those areas where resource costs and institutionalconstraints are considerable. Here the strategy might be to rely more on programmodifications and shorter length programs such as a certificates. Additionally, the factthat immediate vacancies exist in these clusters implies that the strategy should includealternative program delivery formats, as non-degree learner segments see anopportunity for career advancement.
For clusters where neither a long-term need nor a short-term need dictates a newprogram development strategy (for example, Protective Services, and Education,Training, and Library), advocating for more new programs in these clusters might makelittle sense. However, a new program development strategy may include these clustersif there are strategic reasons for including them, for example the need for heightenedsecurity (Protective Services)26 or a strategic interest to expand into areas customarilyreserved for only certain segments of higher education system (Education, Training,and Library). In other words, when labor market information does not provide directionfor how to move forward on a new program development strategy, alternativejustifications must countervail the nonexistent workforce need imperative.
Next Steps and Policy Directions
This paper creates an occupational need measure (shortage/surplus indicators)by connecting postsecondary degree program outcomes (graduation leading to a job) tolabor market data elements (employment projections and vacancy information). Theseoccupational need measures (based on a ranking of the shortage/surplus indicators) are
26 Its third position in the new program ranking was probably dictated by response to the events ofSeptember 11, 2001.

New Program Development Strategy and Supply/Demand Analysis: The Relationship BetweenPostsecondary Degree Program Outcomes and Occupational Needs in Minnesota
then related to an overall new program development strategy for a large publicly fundedhigher education system (based on a ranking of potential awards resulting from newprograms submitted under a new approval process). The strength and direction of therelationship, together with demographic trends, learner segments, and overall programactivity information provide some guidance for what might be elements in a newprogram development strategy. An implication drawn appears to be that labor marketdata elements describing the near future are more useful than ones that are moredistant. Nevertheless, the analysis in the paper points out the conclusion that whilelabor market information is definitely a necessary condition, it is not always a sufficientcondition in a new program development strategy. Other factors such as currentprogram activity, student interest, and institutional constraints may have an equalbearing, and sometimes more, when campuses begin the approval process for newprograms. Last but not least, the workforce need imperative may not always be thedriving force behind a new program development strategy.
Much work needs to be done to refine the supply/demand analysis, includingpopulating and benchmarking the MnSCU Crosswalk Database. Other labor marketdata elements such as wage rates, the relative health of the industries in which thegraduates are employed, mobility of the graduate after program completion, andshortage/surplus indicators based on skill rather than employment information should beincluded. Gathering more direct and precise information on learner segments will help todetermine more accurately the true availability of the graduates for work and the specificconditions under which they might be employed. This, in turn, would provide a moreprecise shortage/surplus indicator that would become more useful as a policy tool.
Once a more robust Crosswalk Database is constructed, the analysis could movein several directions. First, one could compare different program development strategies(based on factors such as e-learning, centers of excellence, and regionalism) using theanalysis laid out in this paper. Second, by parsing the Crosswalk into its different sub-elements, a more disaggregated analysis, down to the regional, sub-regional or even atthe college level, could be done. Third, gathering more specific data on the occupationaldistribution of graduates for different types of college configurations (for example, theprivate two- or four-year colleges) should allow the analysis to mimic more correctlywhat might be happening out in the workforce. This would also test much moreprecisely what is only anecdotal at this stage. Fourth, knowing how industry degreerequirements for different jobs and clusters of jobs (for example, the proportion ofcomputer jobs in which industry requires the incumbents to have at least a two-yeardegree) are distributed should allow a comparable analysis using education careerclusters instead of occupational clusters. In other words, the shortage/surplusindicators will be developed from a program (education) perspective rather than viewingthem in an occupational (labor market) framework. More generally, the subsequentrefinements in the Crosswalk Database, and more varied applications of the analysisdeveloped in this paper, should create a more flexible but common policy framework inwhich educators and labor market analysts both could function.

Appendix A:Current MnSCU Program Approval Policies and Procedures
Initiating new programs, making changes to existing programs, or suspendingexisting programs usually starts with the faculty at each institution. The process ofapproving changes to the curriculum varies from one institution to another depending onthe size of the institution, tradition, or the formality and complexity of decision-makingstructures. In some cases external review boards or advisory boards contribute tocurriculum development and change. Generally, a formal institution-wide committee ofthe faculty then reviews the proposals and makes recommendations. The faculty'srecommendation is then forwarded to the institution's administration where it receives itsfinal review and, if approved, is submitted to the Board office for review.
The development of program recommendations generally follows a scanning ofenvironmental factors, such as industry and occupational employment, trends in skillsrequired by employers and emerging fields of knowledge. In addition, the strengths andmission of the college or university, and ways to enhance cooperation and collaborationwith other colleges and universities and industry partners is considered.
According to the MnSCU Academic Approval Manual, new program applicationssubmitted by institutions must do the following:
1. Demonstrate that the proposed program does not unnecessarily duplicateexisting programs
2. Indicate that student interest in the program significantly exceeds theprojected number of enrollment openings
3. Show that current and projected job openings significantly exceed theexpected number of graduates
4. Reflect the statutory mission of the institution
5. Fall within credit length requirements as set by policy.
Programs that meet these criteria are further reviewed for student interest andoccupational demand, resources, external relations, and collaboration. In addition,graduate program applications must undergo two external reviews: a peer review by acolleague in the same discipline, and an internal review by a member of the MnSCUGraduate Council.
Usually, the progress of a proposal toward final approval involves numerousquestions, discussions, and negotiations. Proposals are subject to critical editing, andsuggestions may be provided before it is submitted to the Board of Trustees. In somecases, proposals may be modified significantly, they may be delayed, contingencies

may be assigned such as closing the program after a span of time, or the staff and theinstitution may not reach consensus that the proposal should go forward.
In the past, the development of new programs took place in a somewhat isolatedmanner that is, individual institutions assessed the needs of their service area andresponded. There is a trend towards regional collaboration as multiple institutions in aregion have been consolidated under one president, such as in northeastern Minnesota.Also, the Minnesota Legislature provided impetus for 11 MnSCU institutions located inthe Minneapolis-St. Paul region to form the Metro Alliance and develop a masteracademic plan. The goals of the Metro Alliance are
Program and service alignment
Increased enrollment
Innovative teaching and learning
Facilities planning
Participate in and facilitate regional linkages.
The following flow chart shows the current process.
NEW PROGRAM APPROVAL PROCESSDRAFT
14-Feb-2002
Callege(s) majorDepartrnent(s) or . .
Faculty unigo or Dean(s) 0°°d°000 'r"(*)
CurriculumCommittee
Central Administrtion Office of thePresident CAO Chancellor; Board of(Graduate Dean) Trustees
Internal and Ertsmal Source. of Idea.
Cunicultim Design and Data Support
Proposal Preparation
V .s
Revise
Rs).
Upon Request
Reject
Rs
APP,sys
Ref.
Consultation
(ProgramApplication)
Support
<Consultation
Implement Program(
1
(st to List Se)for 30 days
1
"Pan
Vs.
27
BEST COPY AVAILABLE 2 9

An academic program listsery was instituted in December 2001 that hasexpanded the communication of program intent to all Chief Academic Officers (CAOs).There is now a thirty-day comment period during which concerns can be raised. Theinstitution must address all concerns about the new program before the proposal goesto the Board of Trustees for final approval.
The diagram below illustrates the loose configuration that now exists between thecurrent approval process and the refinements suggested under the MnSCUChancellor's Strategic Work Plan. The flow chart above shows four basic paths that anew program could follow to become approved by the Board of Trustees. Path One,following the left-hand boxes, describes the current new program process. Path Two,following the right-hand boxes, describes the new program process envisioned underMnSCU Work Plan Goal F1.1 New Programs.
1New Program
Idea
Current MonthlyProgram
Development andApproval Process
Board of TrusteesProgram Approval
MnSCU Goal F1.1%Program
DevelopmentProcess
Biennial BudgetRequest
Budget
Alternatively, program ideas could begin in the MnSCU Goal F1.1 programprocess but be diverted back into the current monthly program approval process. Forexample, this could occur for programs determined to be a redesign of an existingprogram or for programs that need a faster development time line. Lastly, Path Fourwould allow programs in the current monthly program approval process to be includedin the MnSCU Goal F1.1 program process and the biennial budget.
The two program development processes described above each have theiradvantages. The current program approval process is monthly. This allows institutionsto concentrate on local time lines with minimal concern for Board of Trustee approvaltime lines. Unless there are extenuating circumstances, coordination with Office of theChancellor staff and Board approval usually takes six to eight weeks. The programdevelopment process under MnSCU Work Plan Goal F1.1 New Programs hasdistinctly different advantages. Integral to the process is intra-MnSCU collaborationincluding staffs from the Office of the Chancellor.
BEST COPY AVAILABLE28 30

Appendix B:The Supply/Demand Analysis for MnSCU Work Plan Goal F1.1-NewPrograms
Four databases were created. The first was an occupational demand database.The 1998-2008 Occupational Employment Projections for Minnesota and six sub-stateregions produced by the Research and Statistics Office of the Minnesota Department ofEconomic Security were used. The total job openings figure (growth plus replacementdemand) was divided into10 to get average annual (annualized) openings. Theoccupations are currently coded by Occupational Employment Statistics (OES) code.The OES to Standard Occupational Classification (SOC) crosswalk from the NationalCrosswalk Center was used to develop annualized openings by SOC code.
The second was a supply database. Data on the number of awards fromMinnesota higher education institutions were used. At times the term graduates is used,particularly with the MnSCU Graduate Follow-up Survey. Because an individual canreceive more than one award, the Graduate Follow-up Survey focuses on the awarddegree, diploma, and certificate conferred to an individual. The 1998 MnSCU awardsby Classification of Instructional Program (CIP) code and institution came from theResearch and Planning Unit, MnSCU, Office of the Chancellor. The 1998 IPEDS27awards by CIP and institution were used for Minnesota private colleges, proprietaryschools, and the University of Minnesota. The source was the IPEDS Peer Analysisweb site, National Center for Educational Statistics. Minnesota institutions wereassigned to one of the six sub-state regions.
Data used in the first two databases are available in all states. The thirddatabase is unique and promises to provide valuable information as it is developed inthe future. A CIP-SOC database was created from the 1998 MnSCU Graduate Follow-up Survey. About 22,800 of the 28,800 MnSCU graduates responded to the Follow-upSurvey. About 18,350 of these respondents reported that they were employed and listedtheir job title. This title was coded by SOC and was used to create a CIP-SOCcrosswalk for each region. The significance of this crosswalk is that it providesinformation on the new supply of workers in a particular occupation and the connectionof instructional program(s) to the occupation. There has been a national CIP-OEScrosswalk for some time, but having a crosswalk based on actual Minnesota data marksa noteworthy improvement in understanding the occupational outcomes of instructionalprograms.
The Research and Planning Unit, MnSCU, Office of the Chancellor, compiles theMnSCU Graduate Follow-up Survey. The Research and Planning Unit staff didoccupation coding of 1998 graduates. Coding of the job titles is still in progress. Adatabase of job titles with SOC codes is being built to automate the coding process.
27Integrated Postsecondary Education Data System (IPEDS) is a national reporting system managed
through the US Department of Education, National Center for Education Statistics.

Other Resources: As identified by the Federal Department of Labor O *NETproject, occupations were classified into five job zones (1-5), in which each indicates theminimum occupational entry in terms of the levels of preparation, going from little or nopreparation to extensive preparation (For a description of the job zones, please seehttp://online.onetcenter.org/OLH _jobzones. html)
The five Job Zones are for occupations that need
Job Zone 1 Little or no preparation
Job Zone 2 - Some preparation
Job Zone 3 Medium preparation
Job Zone 4 - Considerable preparation
Job Zone 5 - Extensive preparation.
Labor demand was limited to job openings in selected occupations in Job Zone 2and all occupations in Job Zones 3, 4, and 5. This was done to focus the analysis onthose occupations that graduates of existing and new postsecondary educationacademic programs would be expected to enter.
About half of the occupations in Job Zone 2 were included in the analysis.Information from the Statewide Job Vacancy Survey collected from Minnesotaemployers gave an indication of the educational requirements for the job openings bySOC code. In addition, some Job Zone 2 occupations were included if there wascurrently a postsecondary program in operation. The following gives a brief descriptionof Job Zone 2 occupations.
Job Zone 2 (Some Preparation): Examples: These occupations often involveusing your knowledge and skills to help others. Examples include drywall installers, fireinspectors, flight attendants, pharmacy technicians, salespersons (retail), and tellers.The specific vocational preparation range is between 4.0 and 6.0. These occupationsusually require a high school diploma and may require some vocational training or job-related course work. In some cases, an associate or bachelor's degree could beneeded. Similarly, on the supply side, we included graduates only if they were employedin an occupation that was coded in the selected Job Zone 2 or higher.
Initially, the framework for the supply/demand analysis was to be US Departmentof Education Career Cluster Framework. The advantage was to be able to presentsupply/demand relationships in a more aggregated way. While this approach stilldeserves additional development, the supply/demand data were presented on a moredetailed occupational level for two reasons. The more detailed occupational leveloffered the most direct way to evaluate whether or not a new program should beconsidered. Second, the career cluster crosswalk was not as clearly defined as was
3032

needed. Some occupations did not clearly fit into a single cluster and some programs,such as liberal arts, were not included in a cluster. However, the further development ofcareer clusters and skill standards should make linkage to labor market data morevaluable.
The purpose of the supply-demand comparison is to assist institutions to identifyprogram gaps. The gap, or shortage, was determined by comparing the projectedannual number of job openings for an occupation in a region to the number of graduateswho found employment in that occupation following the completion of an instructionalprogram. An occupation was identified as a shortage occupation when the comparisonof supply and demand for the detailed occupation (at a six-digit SOC code level)showed that there was a shortage of 40 or more workers. It should be noted here thatthe accuracy of the regional supply figures is limited because it does not take intoaccount geographic mobility. An assumption is made that the graduate is employed inthe same region that the institution is located. Accuracy of supply data should beimproved in the future because we are now able to link the graduate data to theemployer location through the Unemployment Insurance Wage Detail File. Otherbenefits of this data linkage will be the understanding of which regional industries hireprogram graduates and the wage levels at which they are hired.
SOC codes for occupations related to the new program ideas submitted by theChief Academic Officers were also identified. The supply/demand data were includedfor those SOC codes, even if the shortage was less than 40. In some cases, nosupply/demand data were available because the program is for a new or emergingoccupation or it was not yet possible to identify the program or occupational outcomewith enough specificity.
The following limitations on the accuracy of both the demand and supply dataneed to be acknowledged:
Average annual openings data will overstate or understate the actual labormarket demand. While the ten-year projections take business cycles intoaccount, in any given year the demand will probably be stronger or weaker thanaverage. In 1998, for example, demand for labor was quite strong and by 2000labor demand was weak.
Occupational projections are less accurate for more detailed occupations thathave small employment levels and for more specific geographic regions than foroccupations with substantial employment or for the state as a whole.
Demand reflects openings in Minnesota only. There may be strong demand forlabor in a community from a neighboring state where employers hire Minnesotaprogram graduates. The demand for the occupation in that region would beundercounted because it is limited to only Minnesota openings. A good examplewould be demand for health care practitioners and technicians from northwestern
31
33

Minnesota who go to work at hospitals or clinics in Fargo and Grand Forks, NorthDakota.
Supply data do not take geographic mobility into account. This is particularlyimportant for the Twin Cities regional analysis and for state university programgraduates. Graduates often complete a program at an institution in greaterMinnesota and then go to work for a firm located in the Twin Cities. The shortagesituation in the Twin Cities is offset to some degree, or perhaps entirely, bymobility of graduates from other regions of the state. Mobility of graduates fromprograms in neighboring states is also not considered in these data.
Supply data reflect program graduates only. Some individuals leave a programbefore completing all the requirements and find employment in a relatedoccupation. The result is that the actual supply for this occupation is understated.
The total supply reflects the employment pattern of MnSCU program graduatesonly. There are a number of potential areas where errors occur. Not all MnSCUgraduates responded to the follow-up survey or provided a job title. Job titleswere coded with a SOC code, but the job titles are sometimes ambiguous andcoding errors were made. We have assumed that the occupational employmentdistribution of graduates of non-MnSCU programs is the same as MnSCUprograms.
Other subtle errors occur for selected occupations. For example, graduates whoreceive a master's in teaching do not add to the available labor supply. Most,estimated to be about 85 percent, are already teaching. In other cases,graduates may not be qualified to enter a profession with a bachelor's degree.This occurs in social work where a graduate degree is required.Accommodations for these nuances were not made due to a lack of availabletime.
The following page is a sample from one of the regional supply/demand reports.The 00.0000 SOC code indicates that this is a new program idea proposed from theChief Academic Officer survey. For each shortage occupation, there was a list of theprograms, institution, degree level, and number of graduates who reported on thefollow-up survey that they were working in that occupation.
32 3 4

Sam
ple
Pag
e fr
om a
Sup
ply/
Dem
and
Ana
lysi
s
Rep
ort
01
Sta
ndar
d O
ccup
atio
nal C
ode
(SO
C),
SO
C T
itle,
Cor
resp
ondi
ng M
nSC
U A
cade
mic
Cla
ssifi
catio
n of
Pro
gram
s(C
IP),
Loca
tion,
Deg
ree
Leve
l, an
d M
nSC
U G
radu
ates
Wor
king
with
inth
e S
OC
98G
radu
ates
McS
CU
Reg
iona
lIn
stitu
tions
SU
PP
LY 9
8G
radu
ates
All
MN
Reg
iona
lH
ighe
r E
dIn
stitu
tions
DE
MA
ND
Reg
iona
lA
nnua
lized
Ope
ning
s
Sho
rtag
e/S
urpl
usN
ewP
rogr
amR
eque
st
00.0
000
Pro
tect
ion
Ser
vice
sN
orm
anda
le C
CY
ES
00.0
000
Sec
urity
St.
Pau
l TC
YE
S33
-305
1P
olic
e an
d S
herif
fs P
atro
l Offi
cers
121
144
191
-46
24.0
101
Libe
ral A
rts
and
Sci
ence
s/Li
bera
l Stu
dies
Cen
tury
CT
CA
A2
24.0
101
Libe
ral A
rts
and
Sci
ence
s/Li
bera
l Stu
dies
Nor
thH
enne
pin
CC
AA
4
24.0
102
Gen
eral
Stu
dies
Met
ropo
litan
SU
BA
843
.010
7La
w E
nfor
cem
ent/P
olic
e S
cien
ceM
etro
polit
an S
UC
ert
843
.010
7La
w E
nfor
cem
ent/P
olic
e S
cien
ceIn
ver
Hill
s C
CA
S15
43.0
107
Law
Enf
orce
men
t/Pol
ice
Sci
ence
Inve
r H
ills
CC
AA
S1
43.0
107
Law
Enf
orce
men
t/Pol
ice
Sci
ence
Nor
thH
enne
pin
CC
AS
31
43.0
107
Law
Enf
orce
men
t/Pol
ice
Sci
ence
Nor
man
dale
CC
AS
21
43.0
107
Law
Enf
orce
men
t/Pol
ice
Sci
ence
Cen
tury
CT
CA
S8
43.0
107
Law
Enf
orce
men
t/Pol
ice
Sci
ence
Min
neap
olis
CT
UA
S5
43.0
107
Law
Enf
orce
men
t/Pol
ice
Sci
ence
Met
ropo
litan
SU
BS
1544
.040
1P
ublic
Adm
inis
trat
ion
Met
ropo
litan
SU
BS
1
52.0
201
Bus
ines
s A
dmin
istr
atio
n an
dM
anag
emen
t, G
ener
alM
etro
polit
an S
UM
BA
3
A z
ero
valu
e fo
r M
nSC
U A
war
ds in
dica
tes
eith
er th
e gr
adua
te d
id n
ot e
nter
the
SO
C o
ccup
atio
n or
no
awar
ds w
ere
give
n in
the
year
forw
hich
follo
w-u
p in
form
atio
n w
asga
ther
ed. T
otal
MN
aw
ards
incl
udes
onl
y th
ose
non
MnS
CU
pro
gram
s fo
r w
hich
MnS
CU
cur
rent
ly o
ffers
aw
ards
. A z
ero
valu
e fo
r op
enin
gs c
ould
occ
ur if
the
SO
C w
asro
lled
into
ano
ther
, a d
eclin
ing
occu
patio
n in
dica
ting
very
littl
e ne
ed, o
r on
e w
ith m
issi
ng d
ata.
33

App
endi
x C
: Sup
ply/
Dem
and
Ana
lysi
s T
able
s
Tab
le C
1: A
vera
ge O
peni
ngs,
Ave
rage
Aw
ards
, and
Ave
rage
Sho
rtag
e/S
urpl
us b
y O
ccup
atio
nal C
lust
er, 1
998-
2000
, Min
neso
ta
Occ
upat
iona
l Clu
ster
Ave
rage
Ann
ual
Ope
ning
s19
98-2
000*
Ave
rage
Ann
ual
Aw
ards
1998
-200
0**
Ave
rage
Ann
ual
Sho
rtag
e/S
urpl
us19
98-2
000
Long
-Ter
m N
eed
Ran
king
Pro
duct
ion
5939
2216
-372
31
Man
agem
ent
6405
3307
-309
82
Sal
es a
nd R
elat
ed46
4117
11-2
930
3
Per
sona
l Car
e an
d S
ervi
ce25
2494
9-1
575
4In
stal
latio
n, M
aint
enan
ce, a
nd R
epai
r35
4420
99-1
445
5
Com
pute
r an
d M
athe
mat
ical
4718
3374
-134
46
Foo
d P
repa
ratio
n an
d S
ervi
ng R
elat
ed17
0170
8-9
937
Tra
nspo
rtat
ion
and
Mat
eria
l Mov
ing
1370
423
-947
8
Bus
ines
s an
d F
inan
cial
Ope
ratio
ns36
6532
56-4
099
Hea
lthca
re S
uppo
rt16
6813
33-3
3510
Bui
ldin
g, G
roun
ds C
lean
ing
and
Mai
nten
ance
233
77-1
5611
Con
stru
ctio
n an
d E
xtra
ctio
n16
3415
06-1
2812
Life
, Phy
sica
l, an
d S
ocia
l Sci
ence
924
824
-100
13
Lega
l51
346
7-4
614
Far
min
g, F
ishi
ng, a
nd F
ores
try
5838
-20
15
Art
, Des
ign,
Ent
erta
inm
ent,
and
Med
ia19
8120
3252
16
Arc
hite
ctur
e an
d E
ngin
eerin
g21
8324
1923
617
Pro
tect
ive
Ser
vice
1093
1387
293
18
Com
mun
ity a
nd S
ocia
l Ser
vice
s11
8415
6337
919
Edu
catio
n, T
rain
ing,
and
Lib
rary
5872
6857
985
20O
ffice
and
Adm
inis
trat
ion
Sup
port
4896
5929
1033
21
Hea
lthca
re P
ract
ition
ers
and
Tec
hnic
al48
8761
8312
9622
All
Occ
upat
iona
l Clu
ster
s61
633
4865
7-1
2975
* S
ourc
e: M
inne
sota
Dep
artm
ent o
f Eco
nom
ic S
ecur
ity, E
mpl
oym
ent P
roje
ctio
ns, 1
998-
2008
** S
ourc
e: M
inne
sota
Sta
te C
olle
ges
and
Uni
vers
ities
(M
nSC
U);
US
Dep
artm
ent o
f Edu
catio
n, IP
ED
S D
ata,
Aut
hors
' Est
imat
es
34

Tab
le C
2: A
vera
ge O
peni
ngs,
Ave
rage
Aw
ards
, and
Ave
rage
Sho
rtag
e/S
urpl
us b
y Jo
b Z
one
and
by T
ype
of P
osts
econ
dary
Aw
ard,
1998
-200
0, M
inne
sota
JOB
ZO
NE
S*
Ave
rage
Ann
ual A
war
ds 1
998-
2000
**A
vera
geA
nnua
lO
peni
ngs
1998
-20
00**
*
Ave
rage
Ann
ual
Sho
rtag
e/S
urpl
us19
98-2
000
Cer
tific
ate
iD
plo
ma
Ass
ocia
toB
ache
lor'
sM
aste
r'sA
llA
war
ds
Job
Zon
e 2
-S
ome
Pre
para
tion
Nee
ded
(Hig
h S
choo
l Req
uire
d;In
clud
ed O
ccup
atio
ns R
equi
re 2
-Yr
Col
lege
)7%
32%
33%
27%
1%97
0013
401
-370
1
Job
Zon
e 3
-M
ediu
m P
repa
ratio
n N
eede
d (T
wo-
year
Col
lege
Req
uire
d; S
ome
Occ
upat
ions
Req
uire
a 4
-Yr
Deg
ree)
5%46
%23
%24
%2%
1343
121
784
-835
3
Job
Zon
e 4
-C
onsi
dera
ble
Pre
para
tion
Nee
ded
(Usu
ally
Fou
r-Y
ear
Col
lege
Req
uire
d; S
ome
Occ
upat
ions
May
not
Nee
d4-
Yr
Deg
ree)
14%
21%
49%
12%
2394
022
848
1092
Job
Zon
e 5
-E
xten
sive
Pre
para
tion
Nee
ded
(Fou
r-Y
ear
Col
lege
or
Mor
e R
equi
red)
3%8%
11%
60%
19%
1586
3600
-201
4
All
Job
Zon
es5%
26%
24%
38%
7%48
657
6163
3-1
2975
*Job
Zon
es In
dica
te M
inim
um O
ccup
atio
nal E
ntry
. Sou
rce:
O *
NE
T D
atab
ase;
US
Dep
artm
ent o
f Lab
or**
Sou
rce:
Min
neso
ta S
tate
Col
lege
s an
d U
nive
rsiti
es (
MnS
CU
); U
S D
epar
tmen
t of E
duca
tion,
IPE
DS
Dat
a, A
utho
rs' E
stim
ates
***S
ourc
e: M
inne
sota
Dep
artm
ent o
f Eco
nom
ic S
ecur
ity, E
mpl
oym
ent P
roje
ctio
ns, 1
998-
2008
35

Tab
le C
3: V
acan
cies
, Ave
rage
Aw
ards
, and
Sho
rtag
e/S
urpl
us b
y O
ccup
atio
nal C
lust
er, 1
998-
2001
, Min
neso
ta
Occ
upat
iona
l Clu
ster
Vac
anci
es20
01*
Ave
rage
Ann
ual
Aw
ards
1998
-200
0**
Sho
rtag
e/S
urpl
us19
98-2
001
Sho
rt-T
erm
Nee
dR
anki
ng
Hea
lthca
re S
uppo
rt31
1213
33-1
779
1
Per
sona
l Car
e an
d S
ervi
ce25
9394
9-1
644
2
Foo
d P
repa
ratio
n an
d S
ervi
ng R
elat
ed22
3270
8-1
524
3
Hea
lthca
re P
ract
ition
ers
and
Tec
hnic
al71
5061
83-9
674
Tra
nspo
rtat
ion
and
Mat
eria
l Mov
ing
1283
423
-860
5
Pro
duct
ion
3010
2216
-794
6
Con
stru
ctio
n an
d E
xtra
ctio
n15
5815
06-5
27
Far
min
g, F
ishi
ng, a
nd F
ores
try
2338
158
Bui
ldin
g, G
roun
ds C
lean
ing
and
Mai
nten
ance
4977
289
Sal
es a
nd R
elat
ed16
7417
1137
10
Lega
l31
646
715
111
Life
, Phy
sica
l, an
d S
ocia
l Sci
ence
672
824
152
12
Inst
alla
tion,
Mai
nten
ance
, and
Rep
air
1601
2099
498
13
Bus
ines
s an
d F
inan
cial
Ope
ratio
ns25
0232
5675
414
Pro
tect
ive
Ser
vice
266
1387
1121
15
Com
mun
ity a
nd S
ocia
l Ser
vice
s33
815
6312
2516
Art
, Des
ign,
Ent
erta
inm
ent,
and
Med
ia69
120
3213
4117
Arc
hite
ctur
e an
d E
ngin
eerin
g81
724
1916
0218
Man
agem
ent
1560
3307
1747
19
Com
pute
r an
d M
athe
mat
ical
566
3374
2808
20E
duca
tion,
Tra
inin
g, a
nd L
ibra
ry40
1468
5728
4321
Offi
ce a
nd A
dmin
istr
atio
n S
uppo
rt28
3659
2930
9322
All
Occ
upat
iona
l Clu
ster
s38
863
4865
797
94
* S
ourc
e: M
inne
sota
Dep
artm
ent o
f Eco
nom
ic S
ecur
ity, V
acan
cy D
ata,
Fou
rth
Qua
rter
200
1**
Sou
rce:
Min
neso
ta S
tate
Col
lege
s an
d U
nive
rsiti
es (
MnS
CU
); U
S D
epar
tmen
t of E
duca
tion,
IPE
DS
Dat
a, A
utho
rs' E
stim
ates
36

Tab
le C
4: V
acan
cies
, Ave
rage
Aw
ards
, and
Sho
rtag
e/S
urpl
us b
y Jo
b Z
one
and
by T
ype
of P
osts
econ
dary
Aw
ard,
1998
-200
1, M
inne
sota
JOB
ZO
NE
S*
Ave
rage
Ann
ual A
war
ds 1
998-
2000
**V
acan
cies
2001
***
Sho
rtag
e/S
urpl
us19
98-2
000
Cer
tific
ate
Dip
lom
aA
ssoc
iat
eB
ache
lor'
sM
aste
r'sA
llA
war
ds
Job
Zon
e 2
-S
ome
Pre
para
tion
Nee
ded
(Hig
h S
choo
l Req
uire
d;In
clud
ed O
ccup
atio
ns R
equi
re 2
-Yr
Col
lege
)7%
32%
33%
27%
1%97
0012
720
-302
0
Job
Zon
e 3
-M
ediu
m P
repa
ratio
n N
eede
d (T
wo-
year
Col
lege
Req
uire
d; S
ome
Occ
upat
ions
Req
uire
a 4
-Yr
Deg
ree)
5%46
%23
%24
%2%
1343
113
172
259
Job
Zon
e 4
-C
onsi
dera
ble
Pre
para
tion
Nee
ded
(Usu
ally
Fou
r-Y
ear
Col
lege
Req
uire
d; S
ome
Occ
upat
ions
May
not
Nee
d4-
Yr
Deg
ree)
5%14
%21
%49
%12
%23
940
1122
012
720
Job
Zon
e 5
-E
xten
sive
Pre
para
tion
Nee
ded
(Fou
r-Y
ear
Col
lege
or
Mor
e R
equi
red)
3%8%
11%
60%
19%
1586
1751
-165
All
Job
Zon
es5%
26%
24%
38%
7%48
657
3886
397
94
*Job
Zon
es In
dica
te M
inim
um O
ccup
atio
nal E
ntry
. Sou
rce:
O *
NE
T D
atab
ase;
US
Dep
artm
ent o
f Lab
or**
Sou
rce:
Min
neso
ta S
tate
Col
lege
s an
d U
nive
rsiti
es (
MnS
CU
); U
S D
epar
tmen
t of E
duca
tion,
IPE
DS
Dat
a, A
utho
rs' E
stim
ates
***
Sou
rce:
Min
neso
ta D
epar
tmen
t of E
cono
mic
Sec
urity
, Vac
ancy
Dat
a, F
ourt
h Q
uart
er 2
001
37

Tab
le C
5: C
ompa
ring
Add
ition
al A
war
ds G
ener
ated
by
New
Pro
gram
Dev
elop
men
t To
The
Tw
o M
easu
res
of S
hort
age/
Sur
plus
by
Occ
upat
iona
l Clu
ster
199
8-20
01 M
inne
sota
Occ
upat
iona
l Clu
ster
Ave
rage
Ann
ual
Add
ition
al A
war
dsF
rom
New
Pro
gram
Dev
elop
men
t20
01*
New
Pro
gram
Ran
king
Ave
rage
Ann
ual
Sho
rtag
e/S
urpl
us19
98-2
000*
*
Long
-Ter
mN
eed
Ran
king
Sho
rtag
e/S
urpl
us19
98-2
001*
**
Sho
rt-T
erm
Nee
dR
anki
ng
Hea
lthca
re P
ract
ition
ers
and
Tec
hnic
al10
711
1296
22-9
674
Offi
ce a
nd A
dmin
istr
atio
n S
uppo
rt53
72
1033
2130
9322
Pro
tect
ive
Ser
vice
328
329
318
1121
15
Edu
catio
n, T
rain
ing,
and
Lib
rary
289
498
520
2843
21
Com
pute
r an
d M
athe
mat
ical
271
5-1
344
628
0820
Bus
ines
s an
d F
inan
cial
Ope
ratio
ns26
96
-409
975
414
Man
agem
ent
248
7-3
098
217
4719
Hea
lthca
re S
uppo
rt23
78
-335
10-1
779
1
Inst
alla
tion,
Mai
nten
ance
, and
Rep
air
187
9-1
445
549
813
Com
mun
ity a
nd S
ocia
l Ser
vice
s14
610
379
1912
2516
Sal
es a
nd R
elat
ed14
511
-293
03
3710
Arc
hite
ctur
e an
d E
ngin
eerin
g13
212
236
1716
0218
Pro
duct
ion
116
13-3
723
1-7
946
Per
sona
l Car
e an
d S
ervi
ce11
314
-157
54
-164
4Le
gal
100
15-4
614
151
11
Art
, Des
ign,
Ent
erta
inm
ent,
and
Med
ia89
1652
1613
4117
Con
stru
ctio
n an
d E
xtra
ctio
n70
17-1
2812
-52
7
Foo
d P
repa
ratio
n an
d S
ervi
ng R
elat
ed58
18-9
937
-152
43
Life
, Phy
sica
l, an
d S
ocia
l Sci
ence
5119
-100
1315
212
Tra
nspo
rtat
ion
and
Mat
eria
l Mov
ing
4420
-947
8-8
605
Bui
ldin
g, G
roun
ds C
lean
ing
and
Mai
nten
ance
621
-156
1128
9
Far
min
g, F
ishi
ng, a
nd F
ores
try
322
-20
1515
8
All
Occ
upat
iona
l Clu
ster
s45
11-1
2975
9794
* A
utho
rs' E
stim
ates
, MnS
CU
Aca
dem
ic P
rogr
am U
nit
** S
ourc
e: T
able
C2
***S
ourc
e: T
able
C4
38

Tab
le C
6: C
ompa
ring
Add
ition
al A
war
ds G
ener
ated
by
New
Pro
gram
Dev
elop
men
tT
o T
wo
Mea
sure
s of
Sho
rtag
e/S
urpl
us b
y O
ccup
atio
nal C
lust
er, 1
998-
2001
Min
neso
ta
JOB
ZO
NE
S
Ave
rage
Ann
ual
Add
ition
al A
war
dsF
rom
New
Pro
gram
Dev
elop
men
t20
01*
Ave
rage
Ann
ual
Sho
rtag
e/S
urpl
us19
98-2
000*
*
Sho
rtag
e/S
urpl
us19
98-2
001*
**
Job
Zon
e 2
-S
ome
Pre
para
tion
Nee
ded
(Hig
h S
choo
l Req
uire
d;In
clud
ed O
ccup
atio
ns R
equi
re 2
-Yr
Col
lege
)11
00-3
701
-302
0
Job
Zon
e 3
-M
ediu
m P
repa
ratio
n N
eede
d (T
wo-
year
Col
lege
Req
uire
d; S
ome
Occ
upat
ions
Req
uire
a 4
-Yr
Deg
ree)
1498
-835
325
9
Job
Zon
e 4
-C
onsi
dera
ble
Pre
para
tion
Nee
ded
(Usu
ally
Fou
r-Y
ear
Col
lege
Req
uire
d; S
ome
Occ
upat
ions
May
not
Nee
d 4-
Yr
Deg
ree)
1829
1092
1272
0
Job
Zon
e 5
-E
xten
sive
Pre
para
tion
Nee
ded
(Fou
r-Y
ear
Col
lege
or
Mor
e R
equi
red)
83-2
014
-165
All
Job
Zon
es45
11-1
2975
9794
* M
nSC
U A
cade
mic
Pro
gram
Uni
t**
Sou
rce:
Tab
le C
3**
* S
ourc
e: T
able
C5
39

U.S. Department of EducationOffice of Educational Research and Improvement (OERI)
National Library of Education (NLE)
Educational Resources Information Center (ERIC)
NOTICE
Reproduction Basis
Edueollonol Resoluta Notrivilion Center
This document is covered by a signed "Reproduction Release (Blanket)"form (on file within the ERIC system), encompassing all or classes ofdocuments from its source organization and, therefore, does not require a"Specific Document" Release form.
This document is Federally-funded, or carries its own permission toreproduce, or is otherwise in the public domain and, therefore, may bereproduced by ERIC without a signed Reproduction Release form (either"Specific Document" or "Blanket").
EFF-089 (1/2003)