REPRESENTING MOTION KINEMATICS in One Dimension “To understand motion is to understand nature.”...
67
REPRESENTING MOTION KINEMATICS in One Dimension “To understand motion is to understand nature.” Leonardo da Vinci
-
Upload
allen-ellis -
Category
Documents
-
view
234 -
download
1
Transcript of REPRESENTING MOTION KINEMATICS in One Dimension “To understand motion is to understand nature.”...

REPRESENTING MOTIONKINEMATICS in One Dimension
“To understand motion is to understand
nature.”Leonardo da Vinci

MECHANICSStudy of motion, force and energy
KinematicsHow
objects move
DynamicsWhy
objects move

Kinematics Objectives
● Represent motion through the use of words, motion diagrams, graphs, and mathematical models.
● Use the terms position, distance, displacement, and time interval in a scientific manner to describe motion.

Motion
• Motion is instinctive–Eyes will notice moving objects more readily than stationary ones
• Object changes position
• Motion can occur in many directions and paths

Representing Motion
• A description of motion relates PLACE and TIME.– Answers the questions WHERE? and WHEN?
PLACE
TIME
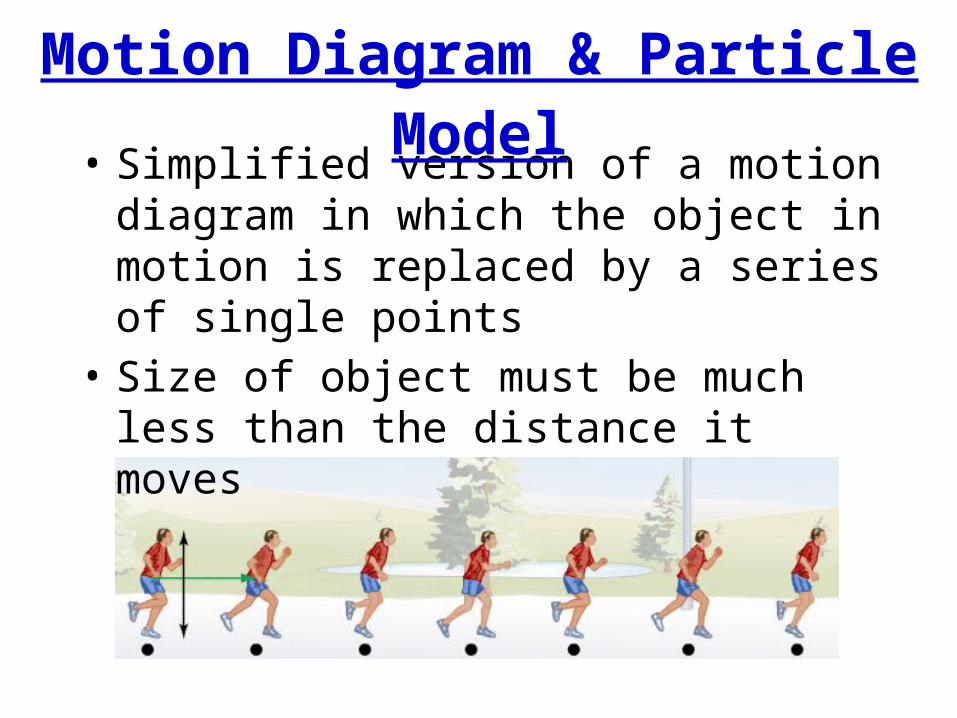
• Simplified version of a motion diagram in which the object in motion is replaced by a series of single points
• Size of object must be much less than the distance it moves
Motion Diagram & Particle Model

Describe motion of the car…
• Draw a particle model…
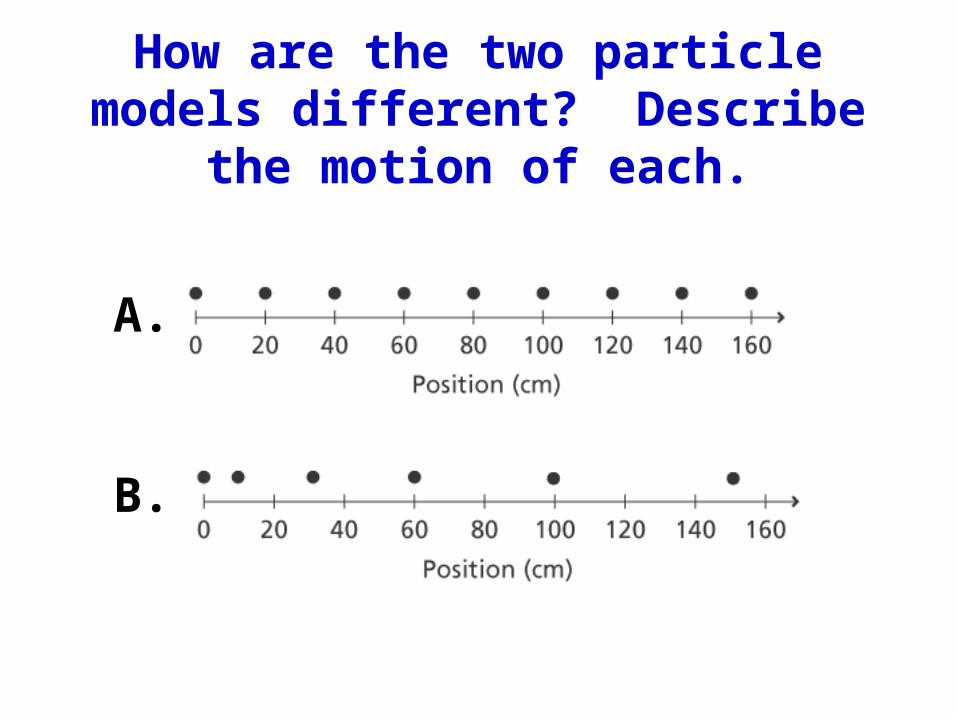
How are the two particle models different? Describe the motion
of each.
A.
B.

Reference FramesAny measurement of position, distance or speed must be made with respect to a frame of reference
80 km/h

Coordinate System
• Tells you the location of the zero point of the variable you are studying and the direction in which the values of the variable increase.
• ORIGIN– The point at which both
variables have the value zero

Distance and Displacement
Distance, d – total ground coveredDisplacement, Dx – change in position of an
object (position is measured from the origin of a chosen coordinate system)
if xxx

Example - A car travels 400 km from Livingston to Philadelphia and then back 200 km to Trenton. What is the displacement of the car? What distance did the car travel?
0 100 200 300 400 kmX =
Livingston PhiladelphiaTrenton
kmkmxxx if 2000200
kmd 600200400
displacement
distance
0
Distance and Displacement
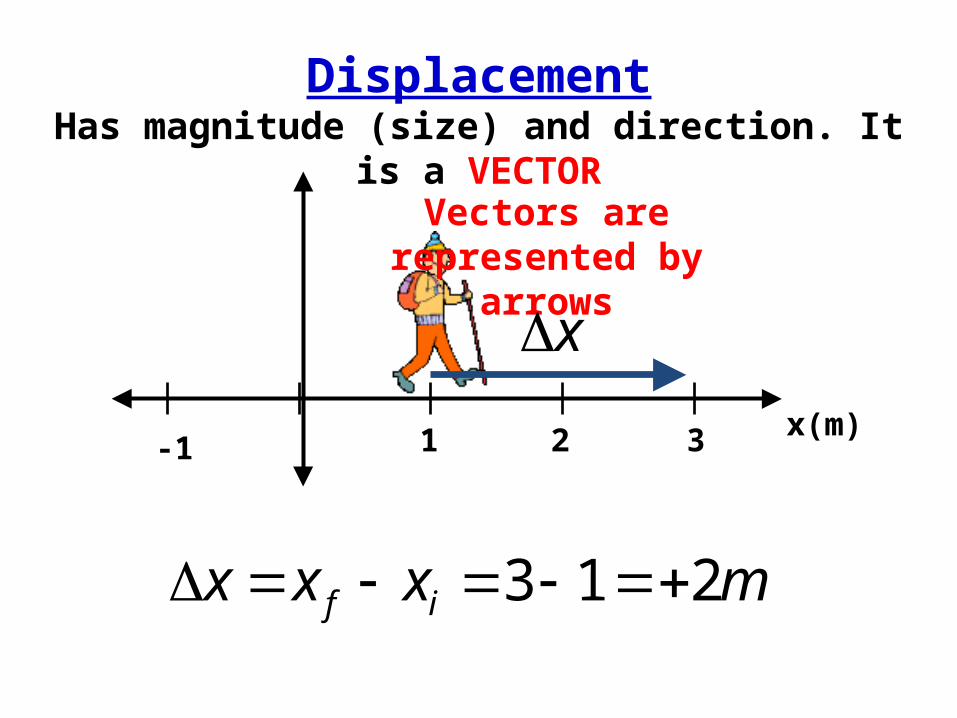
DisplacementHas magnitude (size) and direction. It is a
VECTOR
1 2 3-1x(m)
mxxx if 213
x
Vectors are represented by
arrows
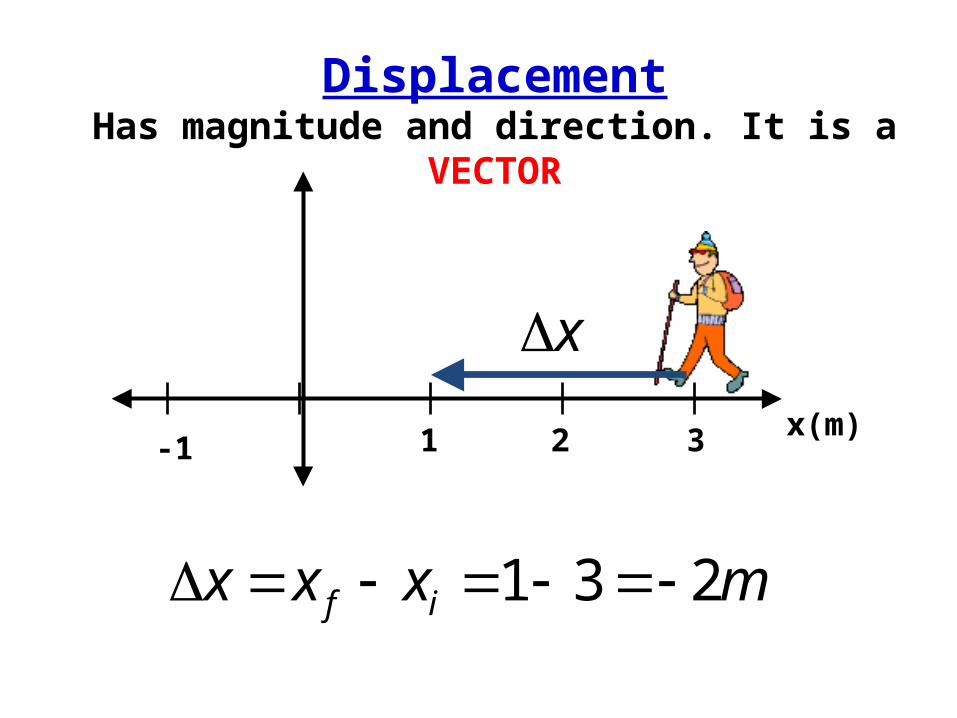
DisplacementHas magnitude and direction. It is a
VECTOR
1 2 3-1x(m)
mxxx if 231
x

Average Speed and Average Velocity
• Average speed describes how fast a particle is moving. It is calculated by:
• Average velocity describes how fast the displacement is changing with respect to time:
always positivedistanceaverage speed
elapsed time
sign gives direction in 1 Dimension
Scalar (has magnitude only)
Vector (has magnitude and direction)
Average speed and average velocity often have the same magnitude, but not always
t
xv

Example - A car travels 400 km from Philadelphia to Livingston in 2 hours and then back 200 km to Trenton in 1 hr. What is the car’s speed and velocity?
0 100 200 300 400 kmX =
Livingston PhiladelphiaTrenton
hkmt
ds /200
3
600Average
speed
Average velocity
hkmt
xv /67
3
400200
Dx

0
10
20
30
40
50
60
0 2 4 6 8 10
x (k
m)
t (hr)
Runner A
Runner B
ExampleThe position-time graph shows the progress of two runners, A and B.a) When does runner B pass runner A?b) Where does runner B pass runner A? c) What is the starting position for runner A? runner
B?d) After 10 hrs, what is the average velocity of
runner A? After 10 hrs, what is the average velocity of runner B?
e) If the finish line is at 40 km, who won the race?

Analyzing Graphs
• UNITS are the key to analyzing graphs
• When analyzing graphs always check for the following two things:– Slope: Look at the units of the slope to
see if it corresponds to a physically meaningful measurement.
– Area under the curve: look at the units for the area under the curve to see if it corresponds to a measurement.

Graphical Representation of Motion
t
xA
B
Dx
Dt
vt
x
slopeSteepness = speed
Sign = direction
Velocity = speed + direction
Position-Time Graph
slope

Average Velocity from a Graph
t
xA
B
Dx
Dtv
t
xslope
Mathematical Model
0xtvx x = positionx0 = initial positionv = average velocityt = time

v vs. t
0
1
2
3
4
0 1 2 3 4 5 6 7 8 9 10
t (s)
v (m
/s)
x vs. t
0
10
20
30
40
50
0 1 2 3 4 5 6 7 8 9 10
t (s)
x (
m)
Graphs of Motion
Mathematical Model
0xtvx x0 = 20 mv = 2 m/s
Slope
2vMathematical Model
(UNIFORM VELOCITY)
vt
x
tvx AreaArea=20m = Dx
Dx =20m
SL
OP
E
AR
EA
Dx =20m
(init and final positions unknown. ONLY KNOW DISPLACEMENT)

x vs t
-10
-5
0
5
10
15
20
25
0 1 2 3 4 5 6
t (s)
x (
m)
What is happening in this graph?
-10 -5 0 5 10 15 20 mX =
t=0 s STARTEnd t=6 s
v =
1s2s3s4s5s
205 txMathematical
Dia
gra
mm
ati
cG
rap
hic
al
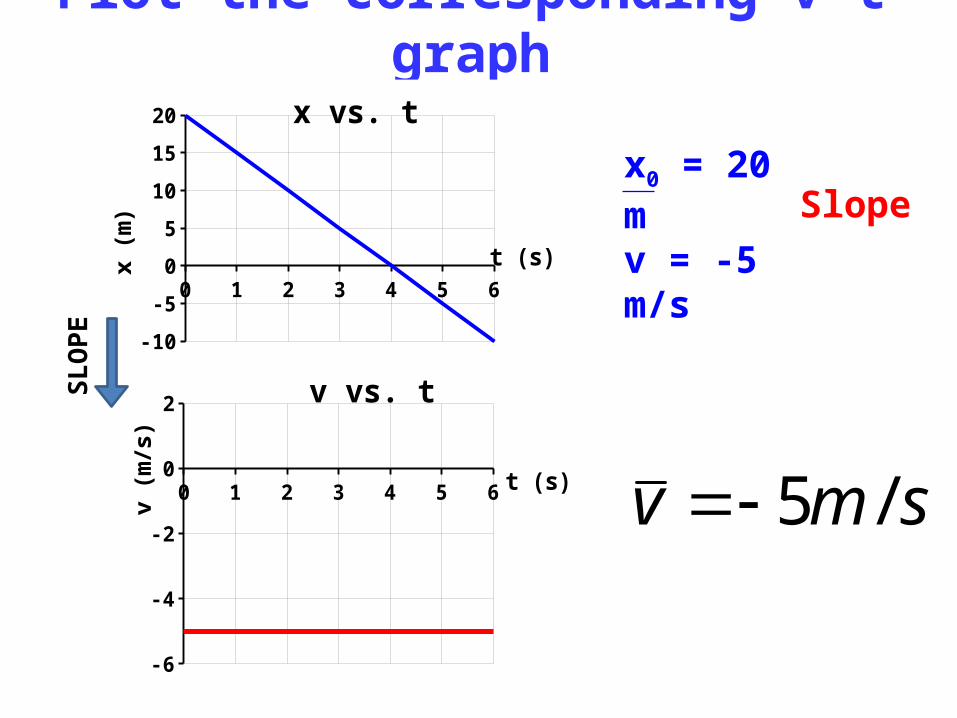
Plot the corresponding v-t graph
0 1 2 3 4 5 6
-10
-5
0
5
10
15
20 x vs. t
t (s)x (m
)
0 1 2 3 4 5 6
-6
-4
-2
0
2v vs. t
t (s)v (m
/s)
x0 = 20 mv = -5 m/s
Slope
smv /5
SL
OP
E

What is happening?
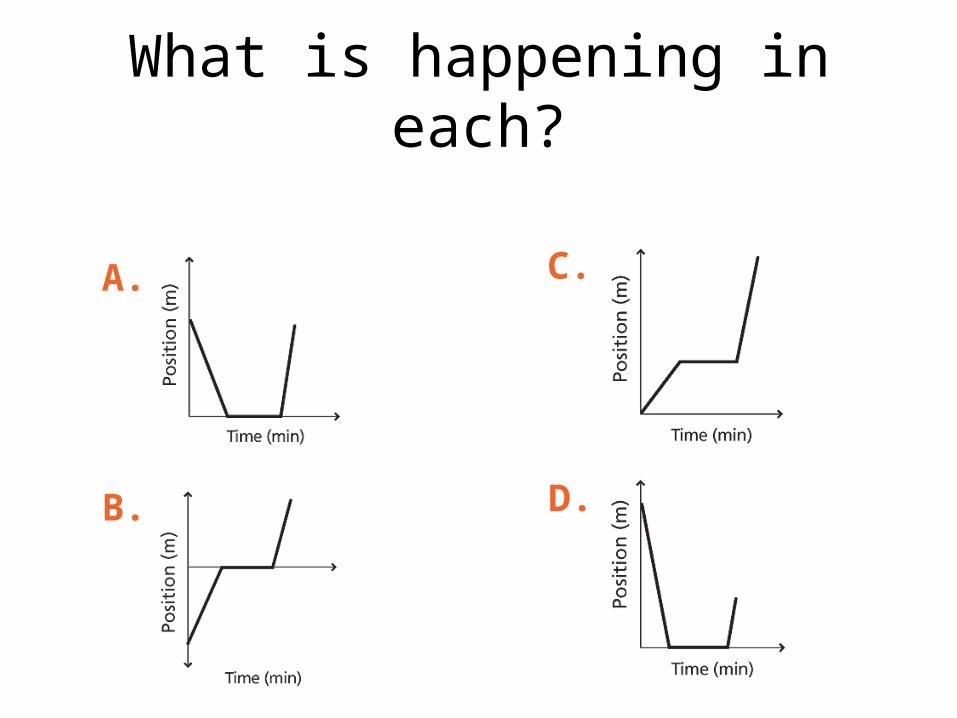
What is happening in each?
A.
B.
C.
D.

0 1 2 3 4 5 6 7 8
-8
-6
-4
-2
0
2
4
6
8
t (s)
v (m
/s)
Draw the corresponding v-t graph
0 1 2 3 4 5 6 7 8
-6
-4
-2
0
2
4
6
8
10 x - t
t (s)x (m
)
v-t S
LO
PE
?v

Which regions shows positive displacement? negative?When is the object moving in the + direction?When is the object moving in the – direction?Which region is the object moving with maximum + velocity?Rank speeds from greatest to leastWhen is the object at rest When does the object change direction?
0 1 2 3 4 5 6 7 8
-6
-4
-2
0
2
4
6
8
10
x - t
t (s)x (m
) CD
E F
AB
A,F B,D,EA,F
B,D,EF
F=D=E>A>B>CC
At 2s, at 7 s

What is the total displacement for the 8 sec? What is the average velocity for the entire 8 sec trip?What is the distance traveled in the 8 sec trip?What is the average speed for the 8 sec trip?
0 1 2 3 4 5 6 7 8
-6
-4
-2
0
2
4
6
8
10
x - t
t (s)x (m
) CD
E F
AB
0m0m/s
32m
4m/s
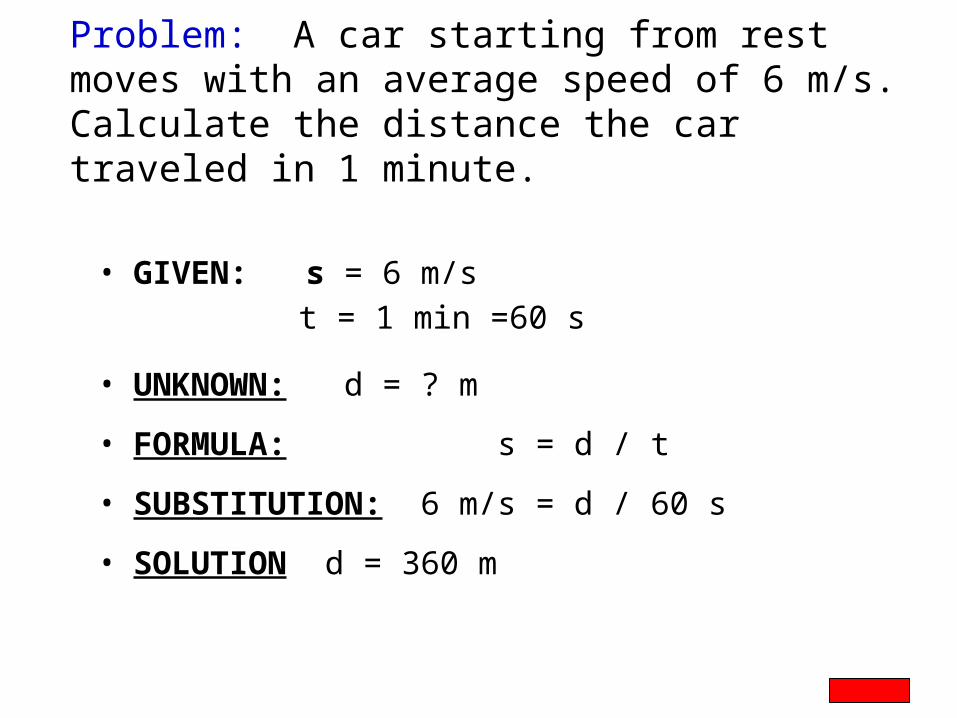
• GIVEN: s = 6 m/s t = 1 min =60 s
• UNKNOWN: d = ? m
• FORMULA: s = d / t
• SUBSTITUTION: 6 m/s = d / 60 s
• SOLUTION d = 360 m
Problem: A car starting from rest moves with an average speed of 6 m/s. Calculate the distance the car traveled in 1 minute.

• GIVEN: xo = 47m xf = 15m
t = 8 s
• UNKNOWN: Dx = ? m
• FORMULA: Dx=xf-xo
• SUBSTITUTION: Dx= 15-47
• SOLUTION Dx = -32 m
Problem: An object moves from the position +47 m to the position +15 m in 8 s. What is its total displacement? What is its average velocity?
• GIVEN: xo = 47m xf = 15m Dx = -32 m t = 8 s
• UNKNOWN: vav = ? m/s
• FORMULA:• SUBSTITUTION:• SOLUTION
sm
t
xvav
/48
32
0 1 2 3 4 5 6 7 8
-8
-6
-4
-2
0
2
4
6
8
10 x vs. t
t (s)
x (m
)
0 1 2 3 4 5 6 7 8
-8
-6
-4
-2
0
2
4
6
8
t (s)
v (m
/s)
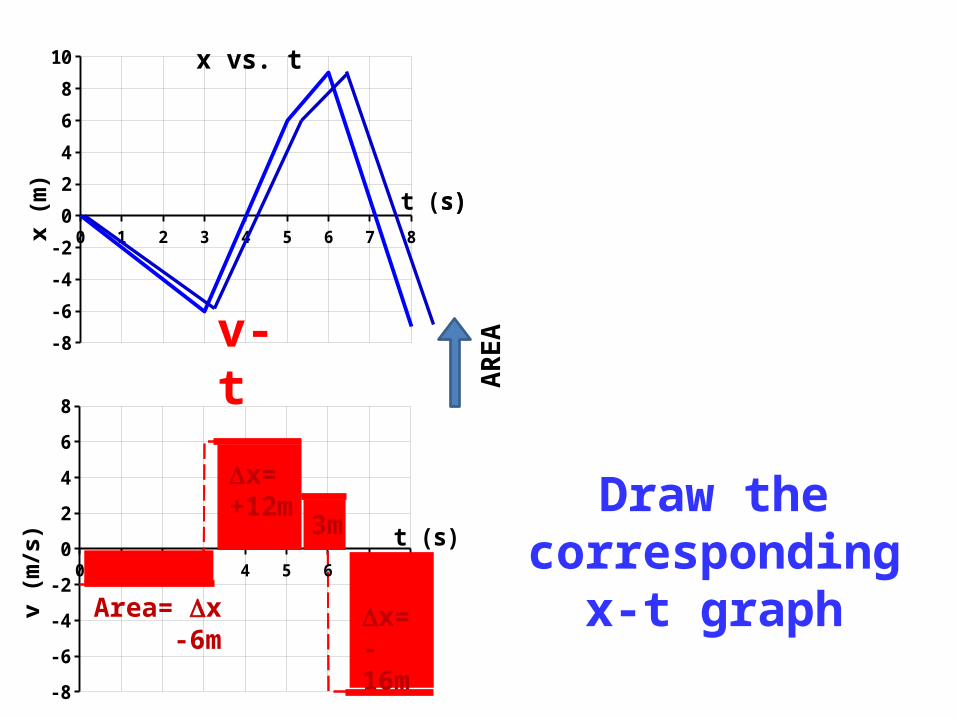
Draw the corresponding x-t graphArea= Dx
-6m
Dx=+12m 3m
Dx=-16m
0 1 2 3 4 5 6 7 8
-8
-6
-4
-2
0
2
4
6
8
10 x vs. t
t (s)
x (m
)
AR
EAv-
t

The Meaning of Shape of a Position-Time graph
Contrast a constant and changing velocity
Contrast a slow and fast moving object

Average Velocity and Instantaneous Velocity
AVERAGE VELOCITY:
-40 -20 0 20 40 60 80 kmX =
-40 -20 0 20 40 60 80 kmX =
Start t=0 End t=2 hr
Average velocity only depends on the initial and final positions. These 2 cars have the same average velocities but different velocities at each instant. When the velocity is not uniform, the instantaneous velocity is not the same as the average velocity.
hrkmxx
t
xv if /60
2
120
2

Acceleration
• Average acceleration describes how quickly or slowly the velocity changes. It is calculated by:
Vector
if
if
tt
vv
t
va
t
va
t
0
lim
• Instantaneous acceleration describes how the velocity changes over a very short time interval:
Acceleration tells us how fast the velocity changes. Velocity tells us how fast the position changes.
SI units: m/s2

Example - A car accelerates along a straight road from rest to 24 m/s in 6.0 s. What is the average acceleration?Average
acceleration
2/4/
46
024sm
s
sm
tt
vv
t
va
if
if
START
v
1s 2s 3s 4s 5s
a
x4 8 12 16
4m/s2
20m/s0
0

START
1s 2s 3s 4s 5s
x
0 1 2 3 4 5
t
x
t=0
t=5
t=4
t=3
t=2t=1
x v aPosition-Time Graph

START
v
1s 2s 3s 4s 5s
a
x
START
v
1s 2s 3s 4s 5s
a
x
Speeding up in + direction
Slowing down in + direction
a and v SAME direction
a and v OPP direction
0
0

START
v
4s 3s 2s 1s 0
a
x
Slowing up in - direction
a and v OPP direction
5s
START
v
4s 3s 2s 1s0
a
x
Speeding up in - direction
a and v SAME direction
5s

• Displacement and velocity are in the direction of motion
• When acceleration is in the SAME direction as velocity, the object is speeding up
• When acceleration is in the OPPOSITE direction to velocity, the object is slowing down

START
1s 2s 3s 4s 5s
x
0 1 2 3 4 5
t
x
t=0
t=5
t=4
t=3
t=2t=1
x v aPosition-Time Graph
Speeding up in + direction
0

START
1s 2s 3s 4s 5s
x
0 1 2 3 4 5
t
+x
t=0
t=5
t=3
t=2
t=1
t=4
x v aPosition-Time Graph
Slowing down in + direction
0

0 1 2 3 4 5t
- x
t=5
t=0t=1t=2
t=3
t=4
x v aSpeeding up in -
direction
START
4s 3s 2s 1s5s
x
0

0 1 2 3 4 5t
- x
START
4s 3s 2s 1s5s
x
t=5
t=0
t=2
t=3t=4
t=1
x v aSlowing down in -
direction
0

0 1 2 3 4 5t
- x
START
4s 3s 2s 1s5s
x
t=5
t=0
t=2
t=3t=4
t=1
x v aSlowing down in -
directionWhat is this object
doing?
0

0 1 2 3 4 5v t
Draw the corresponding
v-t and a-t graphs
x-t graph
v-t graph
0 1 2 3 4 5
x
t
a-t graph

0 1 2 3 4 5t
- x
t=5
t=0t=1t=2
t=3
t=4
x v aSpeeding up in -
direction
START
4s 3s 2s 1s5s
x
0
What is this object doing?

0 1 2 3 4 50
10
20
30 Position vs. Time
t (s)
x (
m)
0 1 2 3 4 5-5
0
5
10 Velocity vs. Time
t (s)
v (
m/s
)
0 1 2 3 4 5-4
-2
0
2Acceleration vs. Time
t (s)
a (
m/s
2)
SLOPE
SLOPE AREA
AREA
PHYSICS DEPARTMENT STORE

-6
-3
0
3
6
9
0 1 2 3 4 5
v (m
/s)
t (s)
v vs. t
0
5
10
15
0 1 2 3 4 5
x (m
)
t (s)
x vs. t
0 1 2 3 4 5
-4
-3
-2
-1
0
1a vs. t
t (s)
a (m
/s2)
AVERAGE VELOCIT
Y
SLOPE =
AREA
RUNNING TOTAL
Dv =-9
vt
x
slo
pe
AVERAGE accelerati
on
SLOPE = at
v
vta
AR
EA
AREA xtv
AREA ]][[ sm No physical meaning
slo
pe
AR
EA
SLOPE = ta /
accelerationConnect with curved line
Constant Acceleration Motion

-6
-3
0
3
6
9
0 1 2 3 4 5
v (m
/s)
t (s)
v vs. t
0
5
10
15
0 1 2 3 4 5
x (m
)
t (s)
x vs. t
0 1 2 3 4 5
-4
-3
-2
-1
0
1a vs. t
t (s)
a (m
/s2)
SLOPE =
AREADv
vt
x
slo
pe
SLOPE = at
v
vtasmssm
]/[]][/[ 2
AR
EA
AREA xtv
slo
pe
AR
EA
vv
constant acceleration aa
Velocity NOT constant
Dx

0
1
2
3
0 1 2 3 4 5
t (s)
v (m
/s)
Estimate the net displacement from 0 s to 5.0 s
Dx = 4.5 + 6 = 10.5 m
Area under v-t curve

0
2
4
6
8
10
0 1 2 3 4 5
x (m
)
t (s)0
2
4
6
8
10
0 1 2 3 4 5
x (m
)
t (s)
0
1
2
3
0 1 2 3 4 5t (s)
v (m
/s)
Construct the corresponding x-t and a-t curves
AR
EA
xtv
at
v
Curved (acceleration)
Straight (constant v)
-1
-0.5
0
0.5
1
0 1 2 3 4 5a (m
/s2 )
t (s)
-1
-0.5
0
0.5
1
0 1 2 3 4 5a (m
/s2 )
t (s)
slo
pe

-2
-1
0
1
2
0 1 2 3 4 t (s)v (m
/s)
Estimate the displacement from 0 s to 4.0 s
Dx = 2 -2 = 0 m
Area under v-t curve

0 1 2 3 4
-3
-2
-1
0
1
2
3
t (s)
a (m
/s2)
0 1 2 3 40
1
2
t (s)
x (m
)
0
1
2
0 1 2 3 4t (s)
x (m
)
AR
EA
-2
-1
0
1
2
0 1 2 3 4t (s)v
(m/s
)
Construct the corresponding x-t and a-t curves
xtv
at
v
-3
-2
-1
0
1
2
3
0 1 2 3 4t (s)
a (m
/s2)
slo
pe
All Curved (acceleration)

Construct the
corresponding x-t and a-t
curves
-6
-4
-2
0
2
4
6
0 1 2 3 4 5 6 7 8 9 10t (s)v
(m/s
)
02468
1012141618
0 1 2 3 4 5 6 7 8 9 10
t (s)
x (m
)
-6
-4
-2
0
2
4
0 1 2 3 4 5 6 7 8 9 10t (s)
a (m
/s2)
curved
curved
curved
straight
straight
at
v
slo
pe
AR
EA
xtv A
B
C
D
E
F

0 1 2 3 4 5v t
x-t graph is quadratic:
v-t graph is linear:
0 1 2 3 4 5
x
t
a-t graph
a = constant
Representations of Accelerated Motion
0vatv
t
Graphical
Mathematical
02 xBtAtx A and B have physical
meaning which we will derive

Mathematical Equations to Represent Constant Accelerated
Motionand relationship to graphs
t
xv
Definition of average velocity:
t
vv
t
vaa f 0
Definition of average acceleration:
tvx
atvv f 0
For constant acceleration:
)( 021
fvvv
constantacceleration
(Slope of x-t graph)
(Slope of v-t graph)
(Equation of v-t graph)
1
2
3
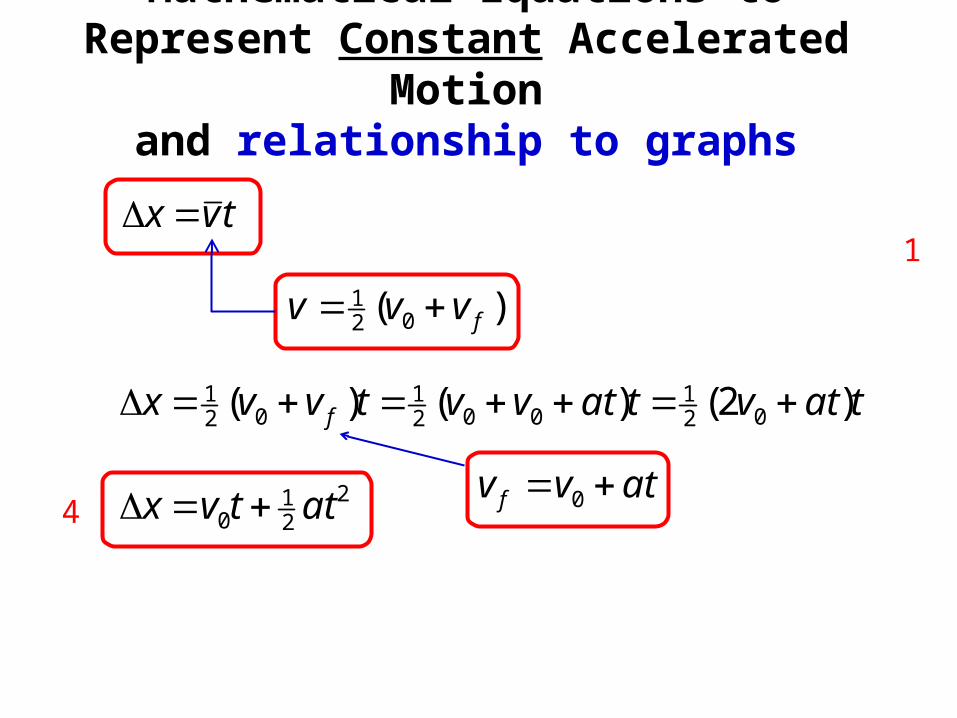
221
0
021
0021
021 )2()()(
attvx
tatvtatvvtvvx f
Mathematical Equations to Represent Constant Accelerated
Motionand relationship to graphs
tvx
atvv f 0
)( 021
fvvv
4
1

KINEMATIC EQUATIONS(Constant Acceleration)
Dx = vDt (definition of average velocity)
v v0 + vf
2=
(average velocity for constant acceleration)
Dv = aDt (definition of avr a)
Dt = (vf – v0)/a
Dx = (v0 + vf)(vf – v0)/2a
5. vf2 = v0
2 + 2aDx(time independent)

KINEMATIC EQUATIONS(Constant Acceleration)
1.
3.
4.
5.
tvx
)( 021
fvvv
atvv f 0
221
0 attvx
xavvf
222
0
2.

0 1 2 3 4 5v t
x-t graph is quadratic:
v-t graph is linear:
0 1 2 3 4 5
x
t
a-t graph
a = constant
Representations of Accelerated Motion
0vatv
t
Graphical
Mathematical
tvatxxattvx
02
21
0
221
0
x = At2 +Bt + x0
x = ½at2 +v0t + x0

Do Now (solve graphically): A car moving at 12 m/s is 36 m away from a stop sign. What acceleration will stop the car exactly at the stop sign?
a = -2 m/s2
0
70
0
v (m
/s)
t (s)tstop
AreaDx=36m
Slope=a12
v-t

Example: A car moving at 12 m/s is 36 m away from a stop sign. What acceleration will stop the car exactly at the stop sign?
v0= 12 m/svf = 0a = ? m/s2
Dx = 36 mt
a = -2 m/s2

5-Step Problem Solving
• GIVEN– Read & Draw Diagram (when needed)– List all the given information using variables and units – NO WORDS
• UNKNOWN– What variable are you looking to solve– Variable = ? units
• FORMULA– Write formula
• SUBSTITUTION– Substitute givens into formula (include units)
• SOLUTION – Box your final answer: make sure units are expressed

KINEMATICS PROBLEMS
A passenger jet lands on a runway with a velocity of 70 m/s. Once it touches down, it accelerates at a constant rate of -3 m/s2. How far does the plane travel down the runway before its velocity is decreased to 2 m/s, its taxi speed to the landing gate?vi = 70 m/s
vf = 2a = -3 m/s2
Dx = ? mt
Dx = 816 m
Dx
vi
avf
a

KINEMATICS PROBLEMS
A runner goes 12 m in 3 s at a constant acceleration of 1.5 m/s2. What is her velocity at the end of the 12 m?
vi =vf = ? m/sa = 1.5 m/s2
Dx = 12 mt = 3 s
vi = 1.75 m/svf = 6.25 m/s
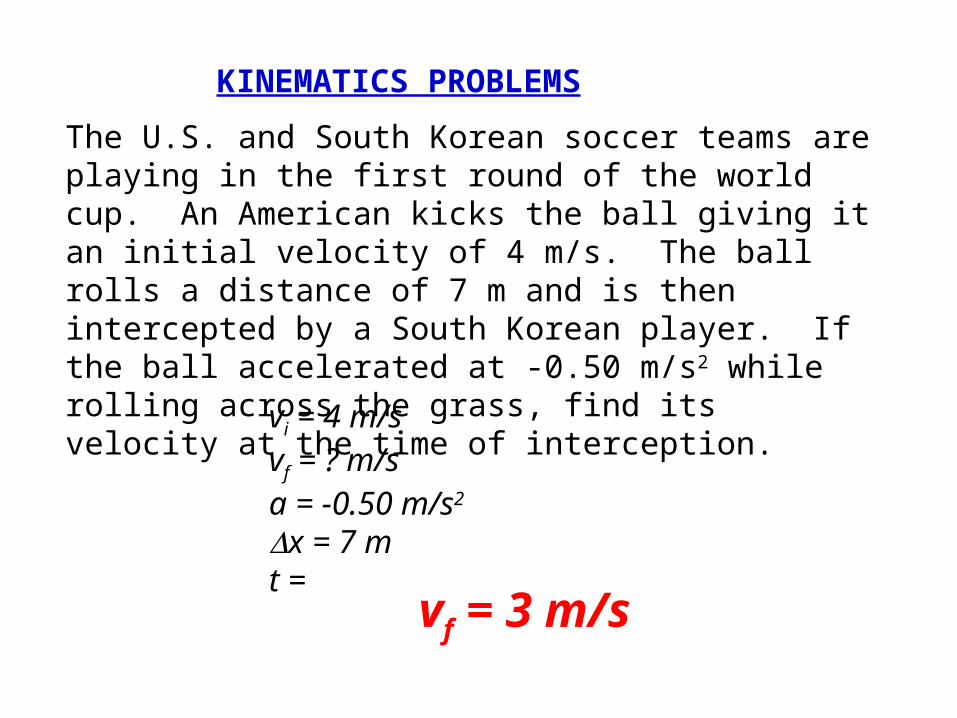
The U.S. and South Korean soccer teams are playing in the first round of the world cup. An American kicks the ball giving it an initial velocity of 4 m/s. The ball rolls a distance of 7 m and is then intercepted by a South Korean player. If the ball accelerated at -0.50 m/s2 while rolling across the grass, find its velocity at the time of interception.
KINEMATICS PROBLEMS
vi = 4 m/svf = ? m/sa = -0.50 m/s2
Dx = 7 mt =
vf = 3 m/s