Representation of the stratosphere in ECMWF operations and ERA … · 2016-02-24 · Representation...
28
Stratosphere in ECMWF operations and ERA-40 1 Representation of the stratosphere in ECMWF operations and ERA-40 • History • Time series of forecast verification statistics • Wind increments, PV and parametrized gravity-wave drag • Forecast accuracy: The Antarctic sudden warming of 2002 • Some aspects of ERA-40, and comparison with operations: - Temperature trends - Bias correction - Radiance assimilation - Moisture and ozone - QBO with acknowledgements to many at ECMWF
Transcript of Representation of the stratosphere in ECMWF operations and ERA … · 2016-02-24 · Representation...
Stratosphere in ECMWF operations and ERA-40 1
Representation of the stratospherein ECMWF operations and ERA-40
• History
• Time series of forecast verification statistics
• Wind increments, PV and parametrized gravity-wave drag
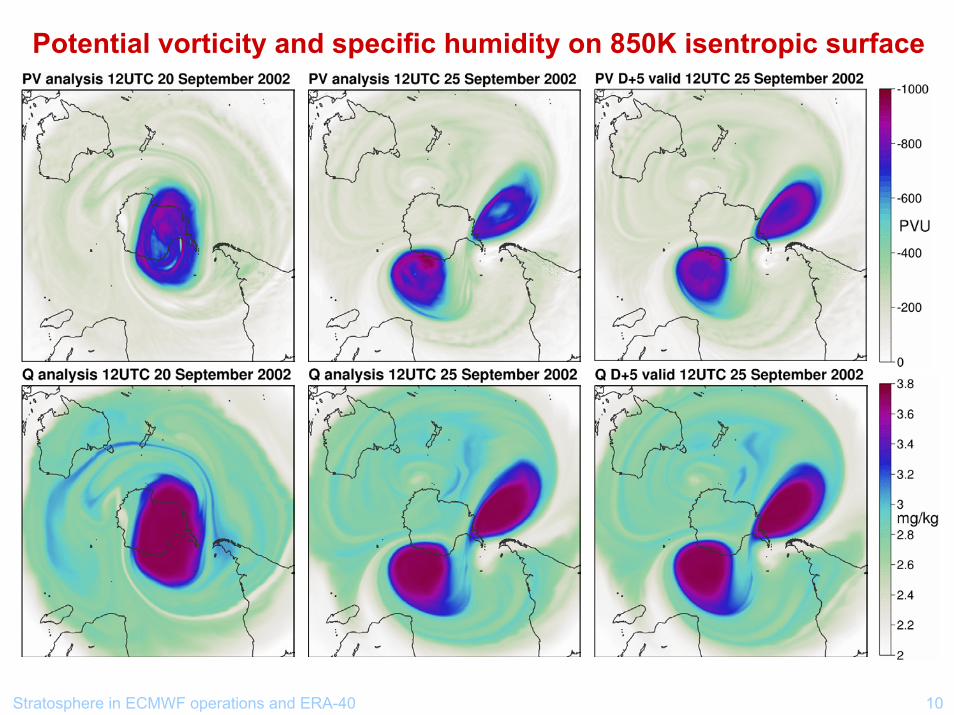
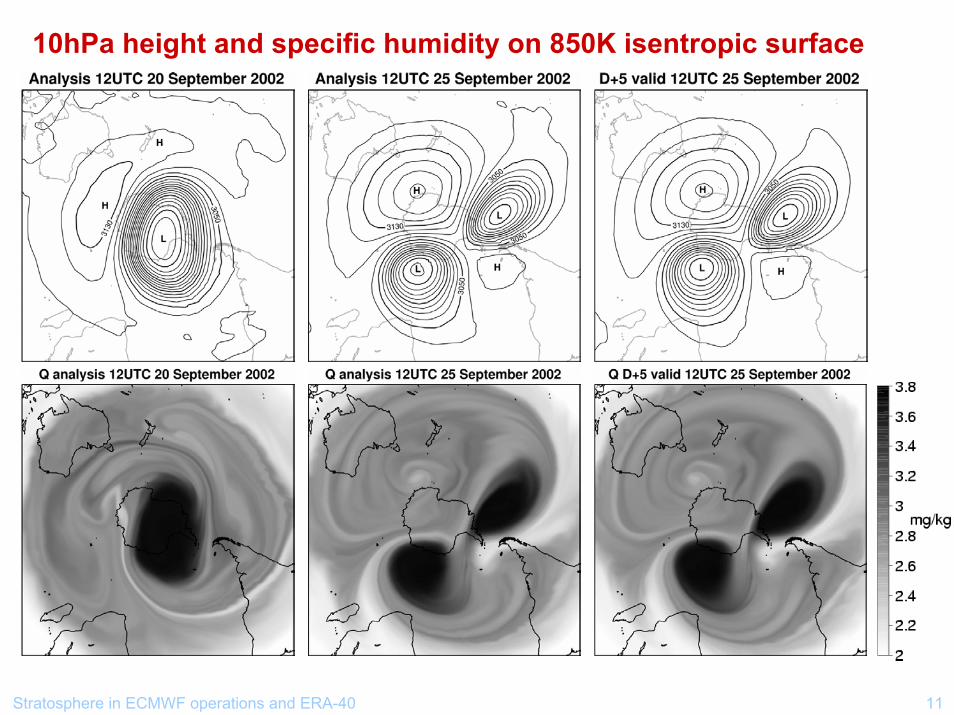
• Forecast accuracy: The Antarctic sudden warming of 2002
• Some aspects of ERA-40, and comparison with operations:- Temperature trends
- Bias correction
- Radiance assimilation
- Moisture and ozone
- QBO
with acknowledgements to many at ECMWF
Stratosphere in ECMWF operations and ERA-40 2
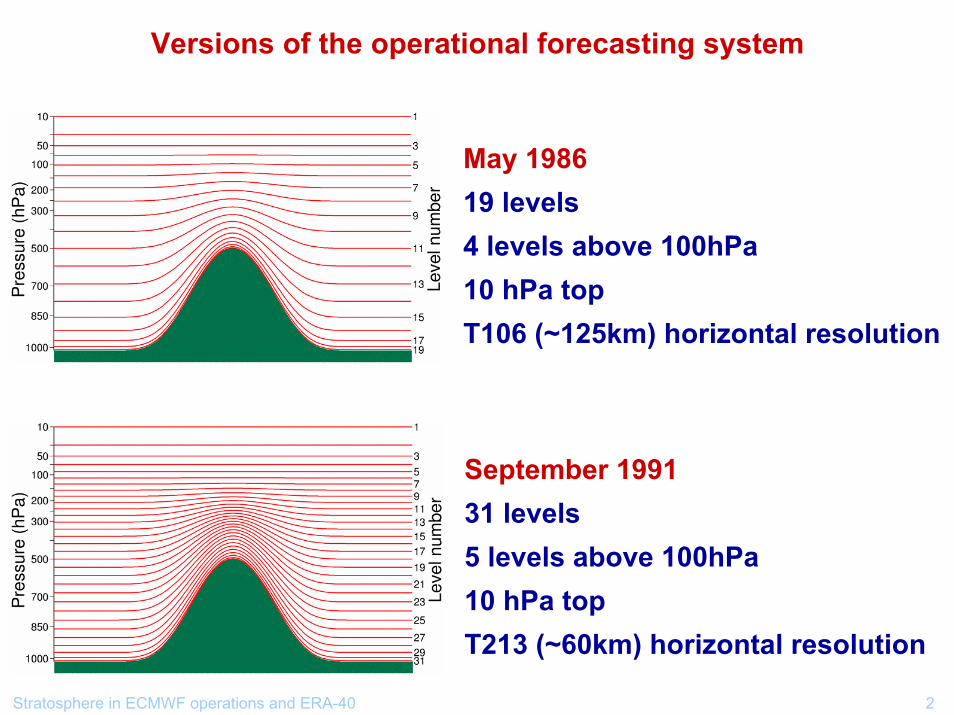
Versions of the operational forecasting system
April 1983p=A+Bps16 levels2 levels above 100hPa25hPa topT63 (~200km) horizontal resolution
May 198619 levels4 levels above 100hPa10 hPa topT106 (~125km) horizontal resolution
May 198619 levels4 levels above 100hPa10 hPa topT106 (~125km) horizontal resolution
September 199131 levels5 levels above 100hPa10 hPa topT213 (~60km) horizontal resolution
Stratosphere in ECMWF operations and ERA-40 3
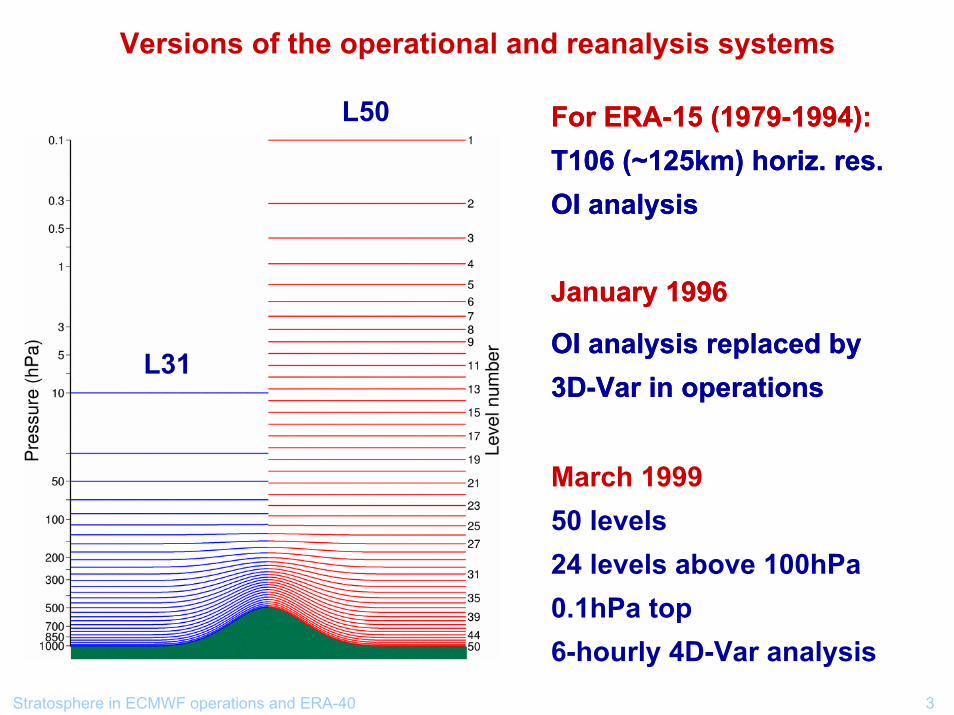
Versions of the operational and reanalysis systems
L31
L50 For ERA-15 (1979-1994):T106 (~125km) horiz. res.OI analysis
January 1996
OI analysis replaced by 3D-Var in operations
L31
L50 For ERA-15 (1979-1994):T106 (~125km) horiz. res.OI analysis
January 1996
OI analysis replaced by 3D-Var in operations
March 199950 levels24 levels above 100hPa0.1hPa top6-hourly 4D-Var analysis
Stratosphere in ECMWF operations and ERA-40 4
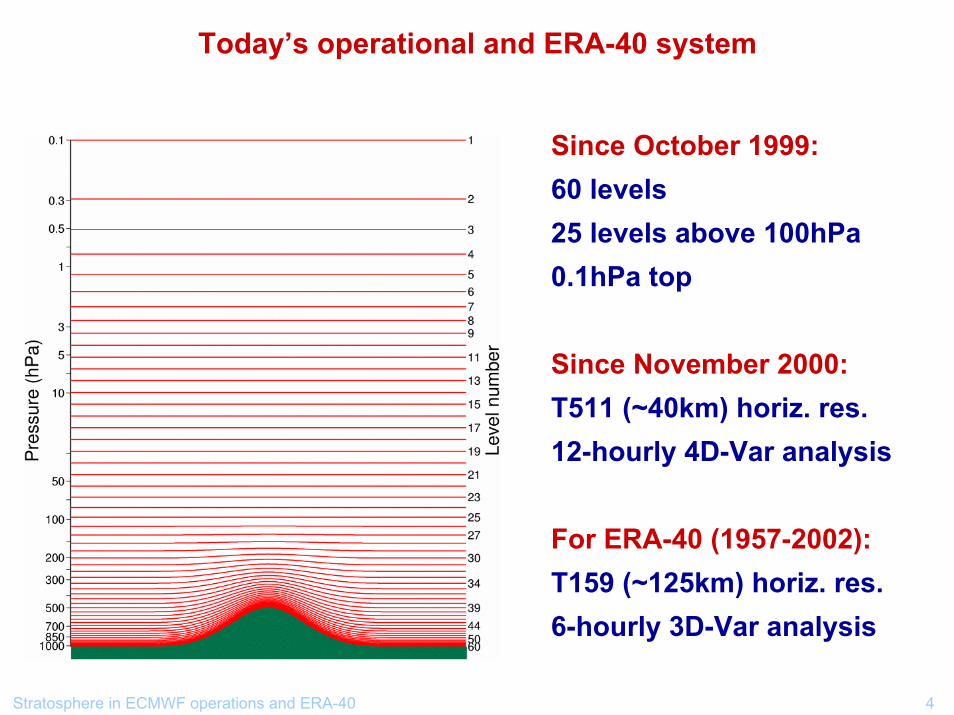
Today’s operational and ERA-40 system
Since October 1999:60 levels25 levels above 100hPa0.1hPa top
Since November 2000:T511 (~40km) horiz. res.12-hourly 4D-Var analysis
For ERA-40 (1957-2002):T159 (~125km) horiz. res.6-hourly 3D-Var analysis
Stratosphere in ECMWF operations and ERA-40 5
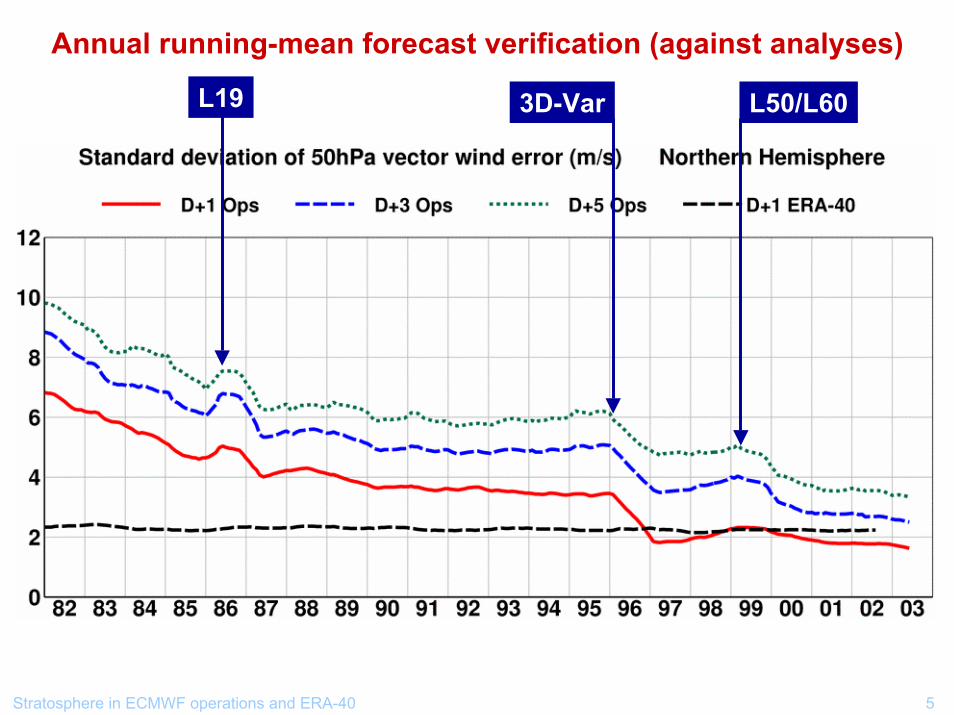
Annual running-mean forecast verification (against analyses)
L19 3D-Var L50/L60
Stratosphere in ECMWF operations and ERA-40 6
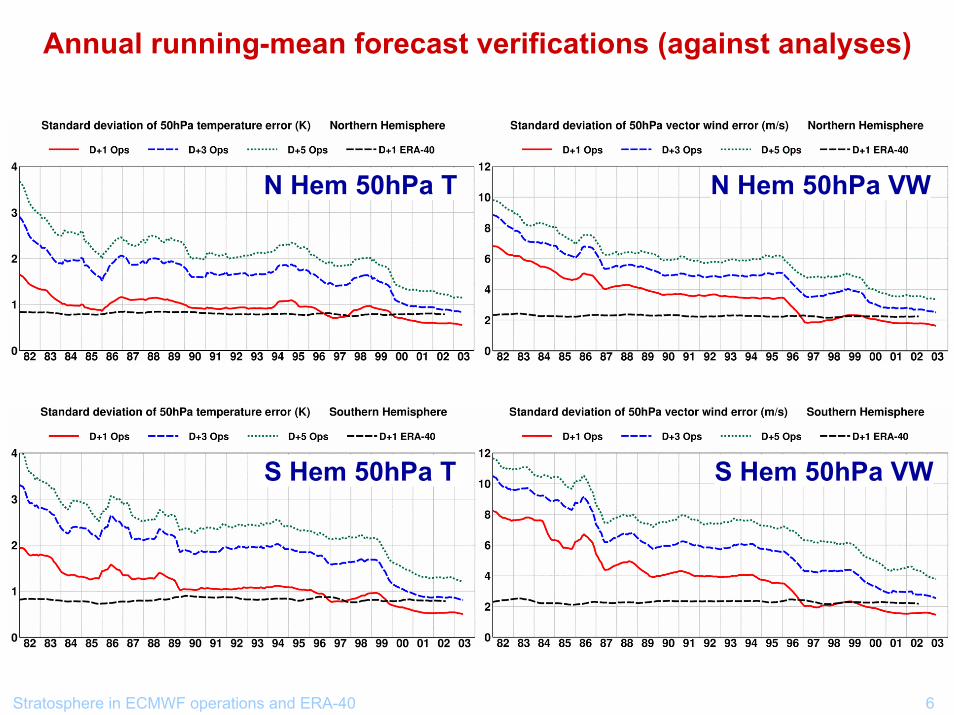
Annual running-mean forecast verifications (against analyses)
N Hem 50hPa T N Hem 50hPa VW
S Hem 50hPa VWS Hem 50hPa T
Stratosphere in ECMWF operations and ERA-40 7
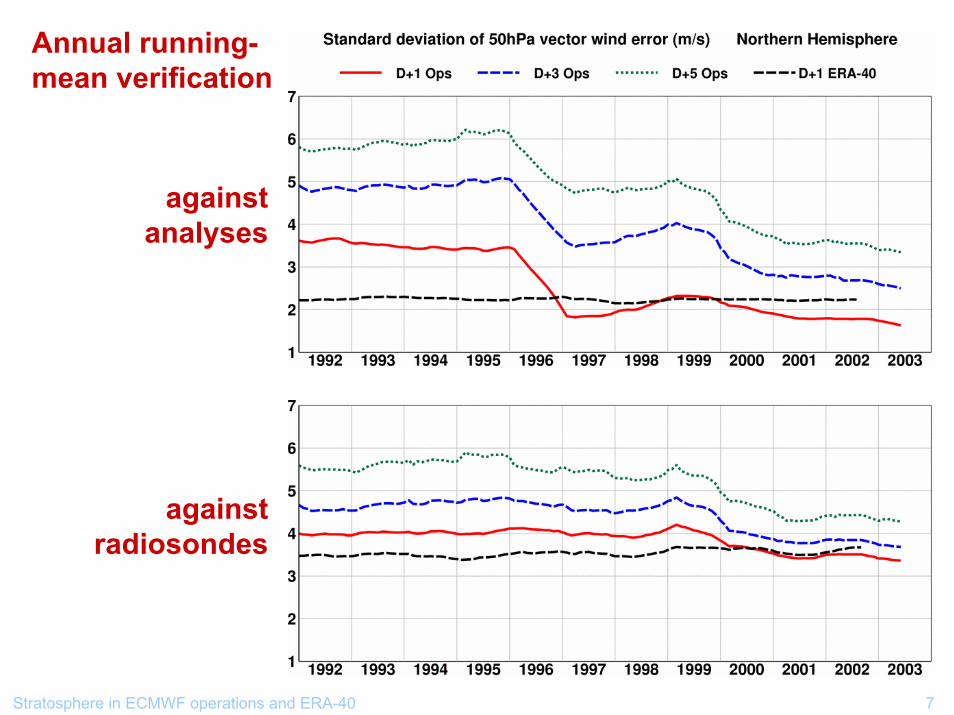
Annual running-mean verification
againstanalyses
against radiosondes
Stratosphere in ECMWF operations and ERA-40 8
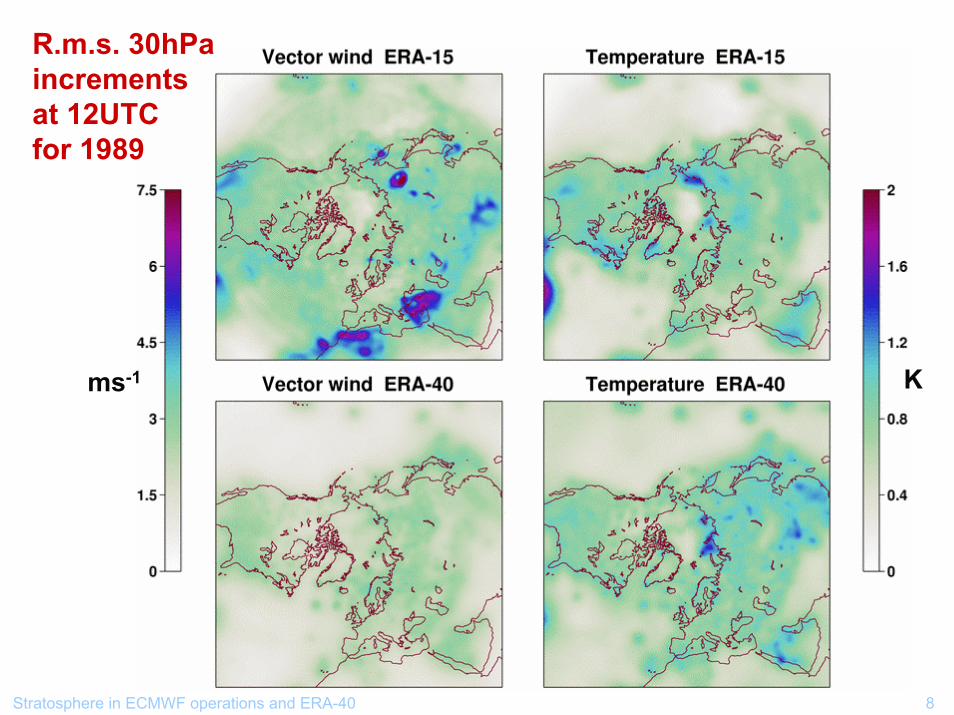
R.m.s. 30hPa incrementsat 12UTCfor 1989
ms-1 K
Stratosphere in ECMWF operations and ERA-40 9
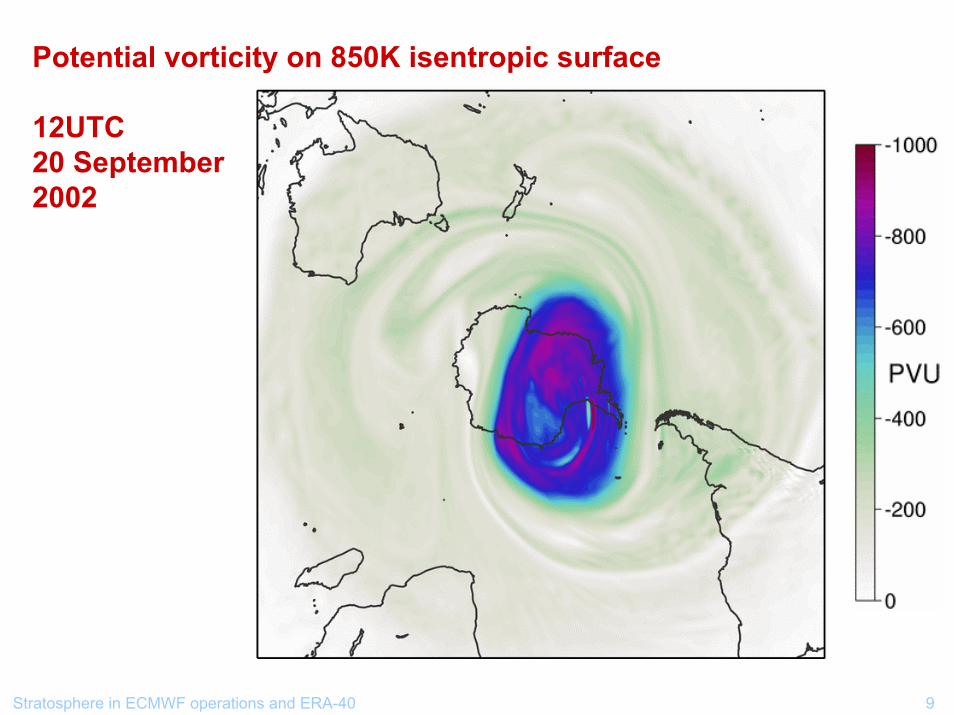
Potential vorticity on 850K isentropic surface
12UTC20 September2002
Stratosphere in ECMWF operations and ERA-40 10
Potential vorticity and specific humidity on 850K isentropic surface
Stratosphere in ECMWF operations and ERA-40 11
10hPa height and specific humidity on 850K isentropic surface
Stratosphere in ECMWF operations and ERA-40 12
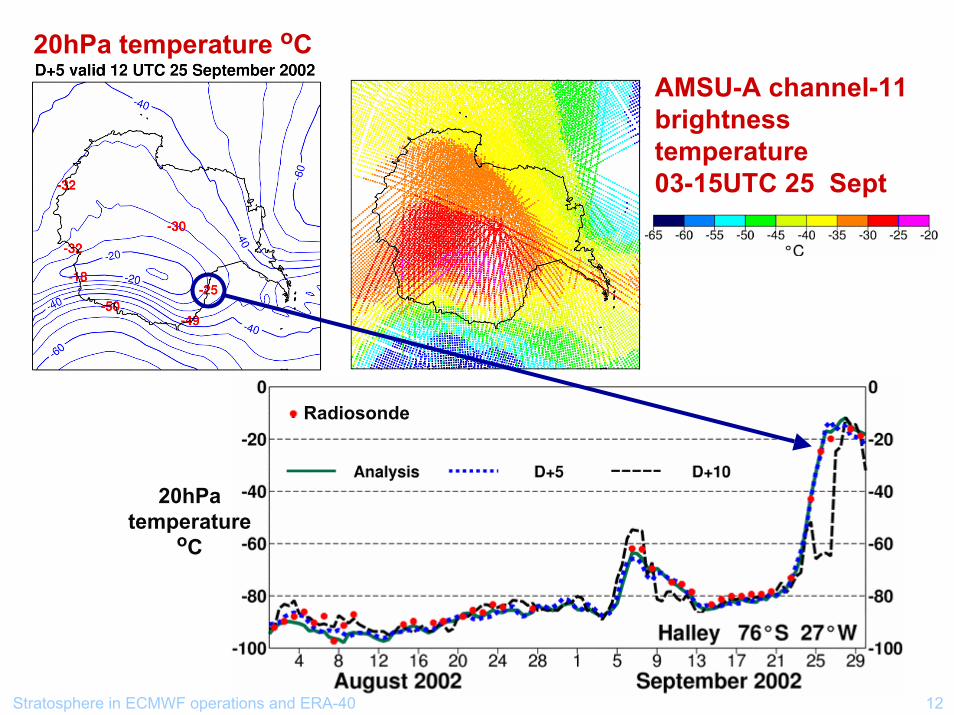
20hPatemperature
oC
Radiosonde
AMSU-A channel-11 brightness temperature03-15UTC 25 Sept
20hPa temperature oC
Stratosphere in ECMWF operations and ERA-40 13
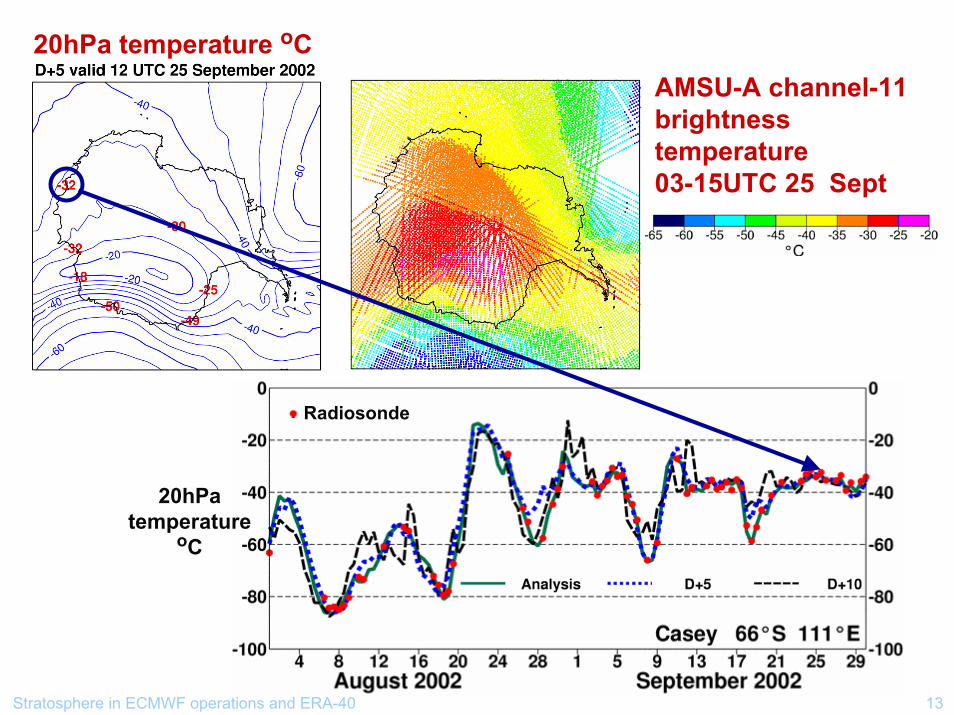
AMSU-A channel-11 brightness temperature03-15UTC 25 Sept
20hPa temperature oC
20hPatemperature
oC
Radiosonde
Stratosphere in ECMWF operations and ERA-40 14
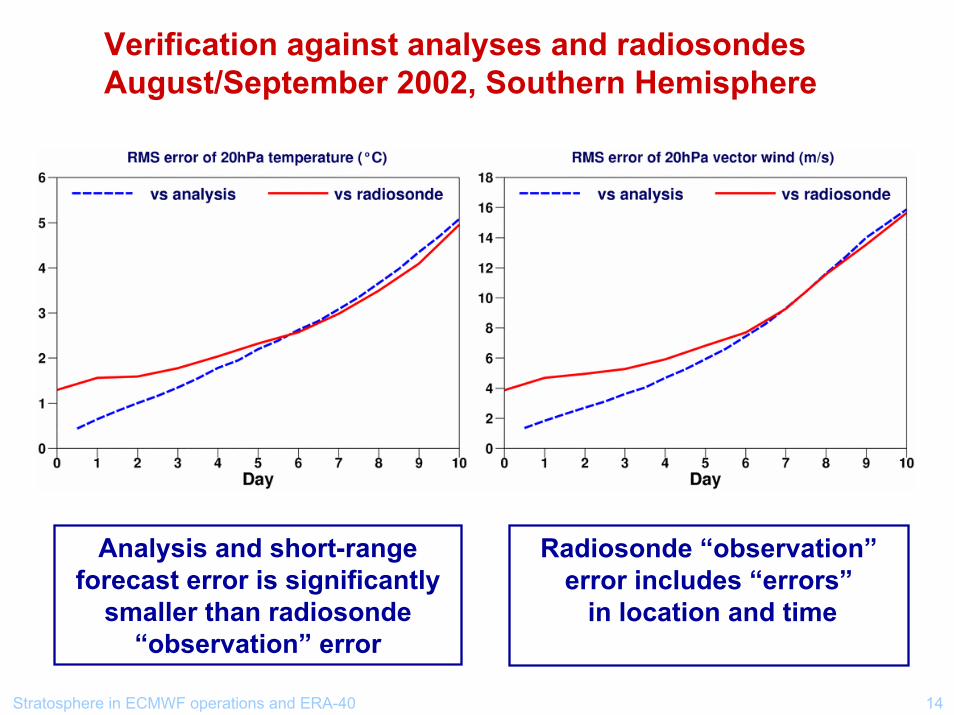
Verification against analyses and radiosondesAugust/September 2002, Southern Hemisphere
Analysis and short-rangeforecast error is significantly
smaller than radiosonde “observation” error
Radiosonde “observation”error includes “errors”
in location and time
Stratosphere in ECMWF operations and ERA-40 15
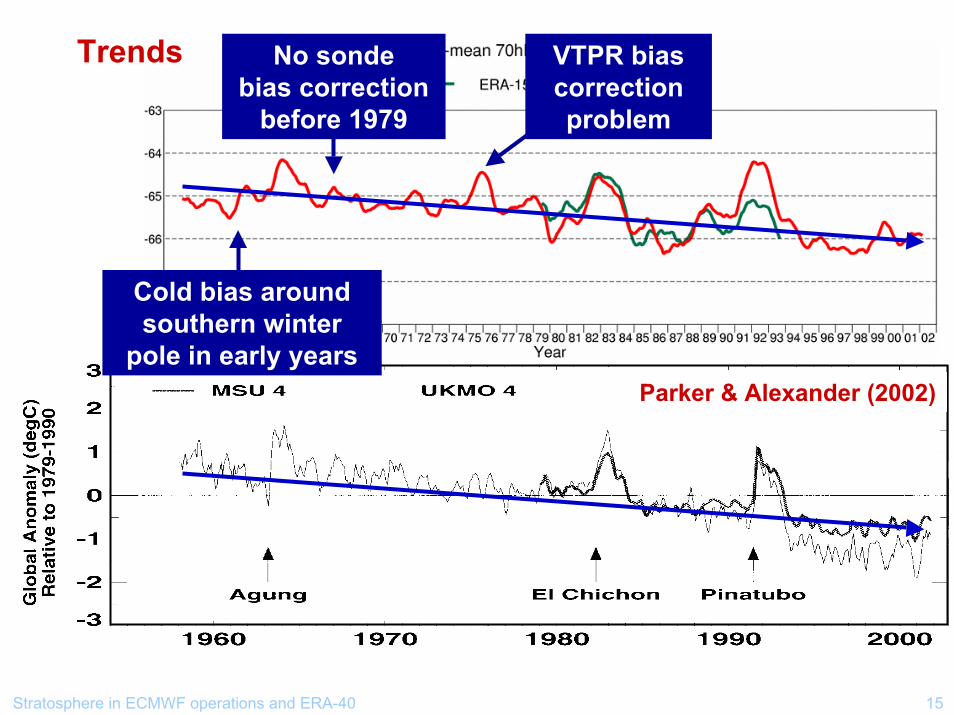
Trends
Parker & Alexander (2002)
Cold bias around southern winter
pole in early years
No sondebias correction
before 1979
VTPR bias correction problem
Stratosphere in ECMWF operations and ERA-40 16
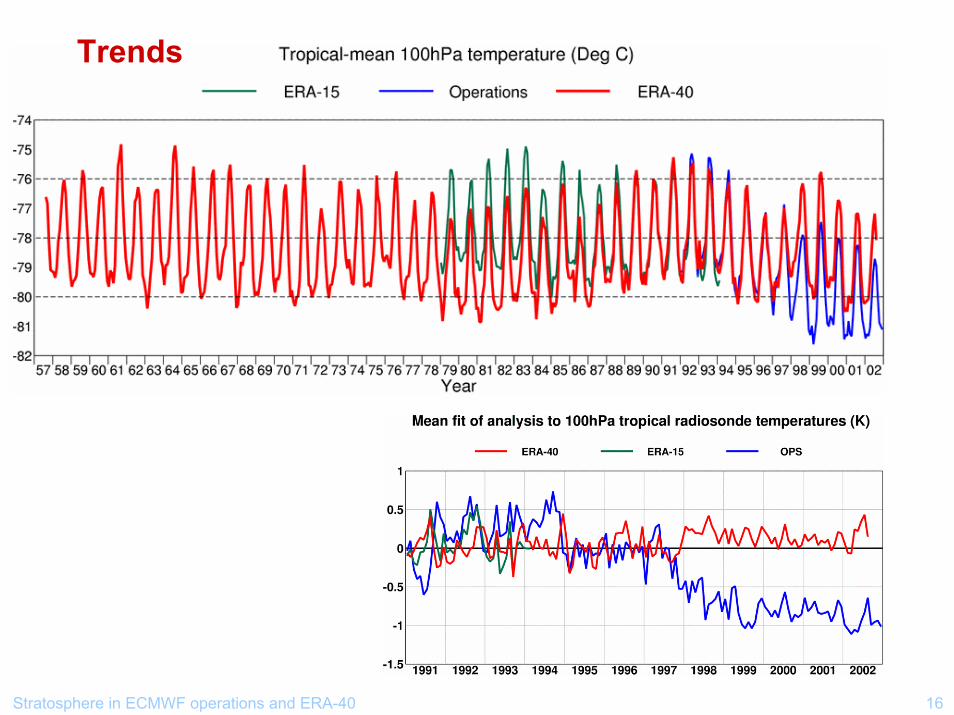
Trends
Stratosphere in ECMWF operations and ERA-40 17
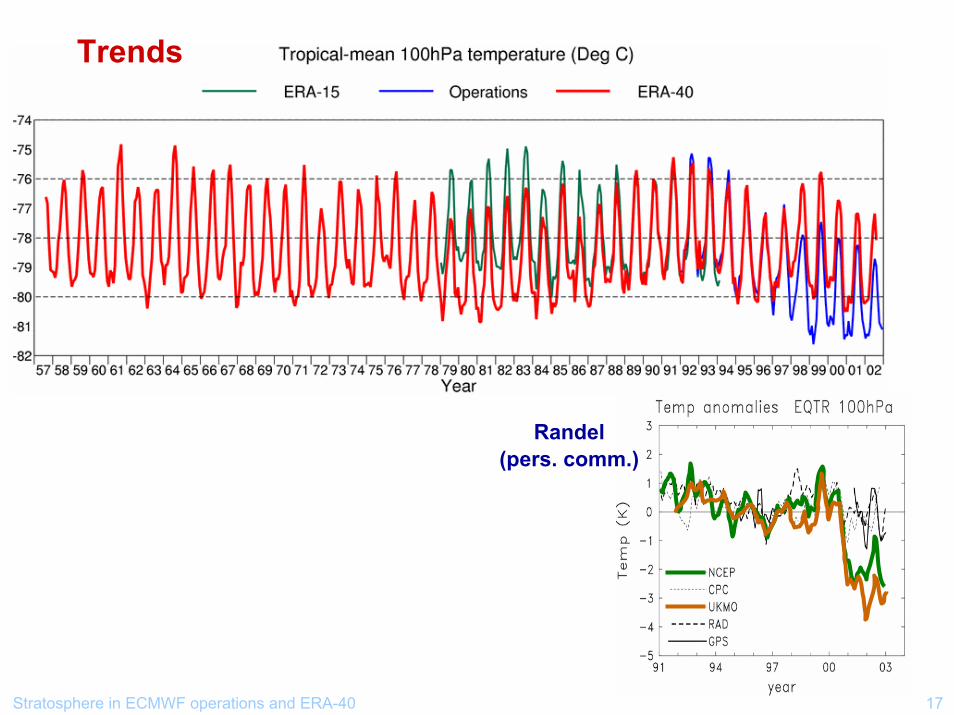
Randel(pers. comm.)
Trends
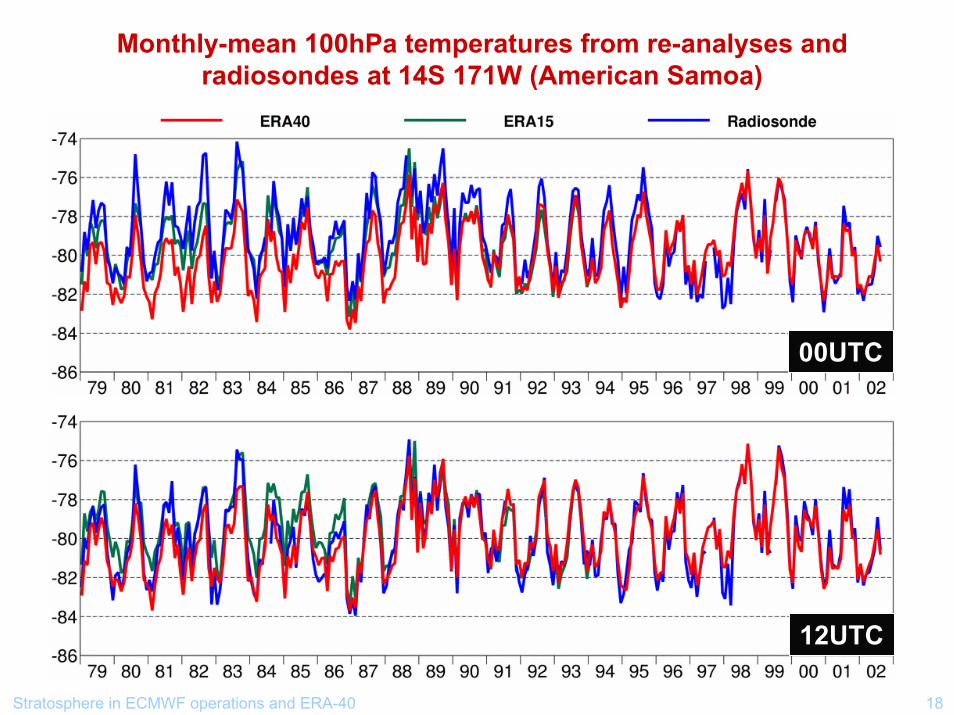
Stratosphere in ECMWF operations and ERA-40 18
Monthly-mean 100hPa temperatures from re-analyses and radiosondes at 14S 171W (American Samoa)
00UTC
12UTC
Stratosphere in ECMWF operations and ERA-40 19
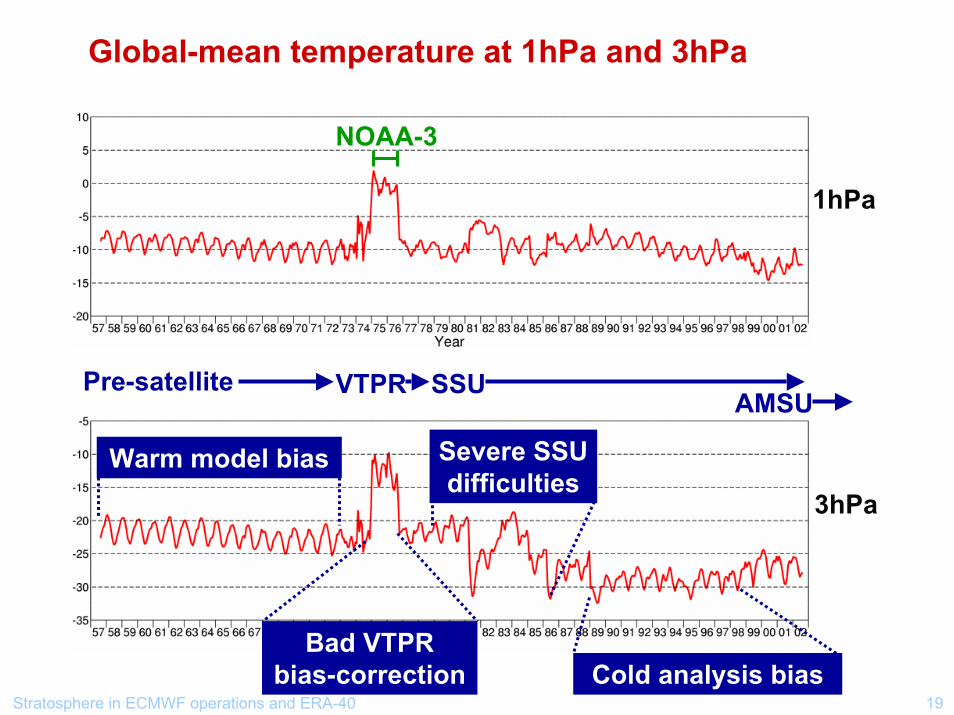
Global-mean temperature at 1hPa and 3hPa
NOAA-3
1hPa
3hPa
VTPR SSUAMSU
Warm model bias Severe SSU difficulties
Cold analysis biasBad VTPR
bias-correction
Pre-satellite
Stratosphere in ECMWF operations and ERA-40 20
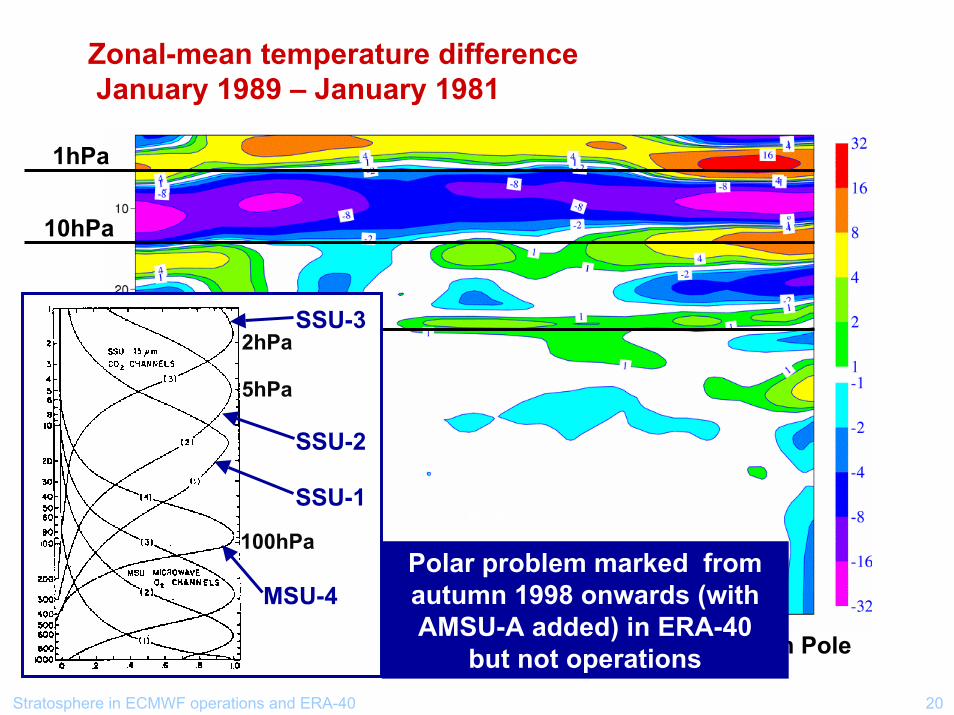
Zonal-mean temperature differenceJanuary 1989 – January 1981
Modellevel
100hPa
10hPa
1hPa
LatitudeNorth Pole South Pole
SSU-32hPa
5hPa
MSU-4
SSU-2
100hPa
SSU-1Polar
Polar problem marked from autumn 1998 onwards (with AMSU-A added) in ERA-40
but not operations
Stratosphere in ECMWF operations and ERA-40 21
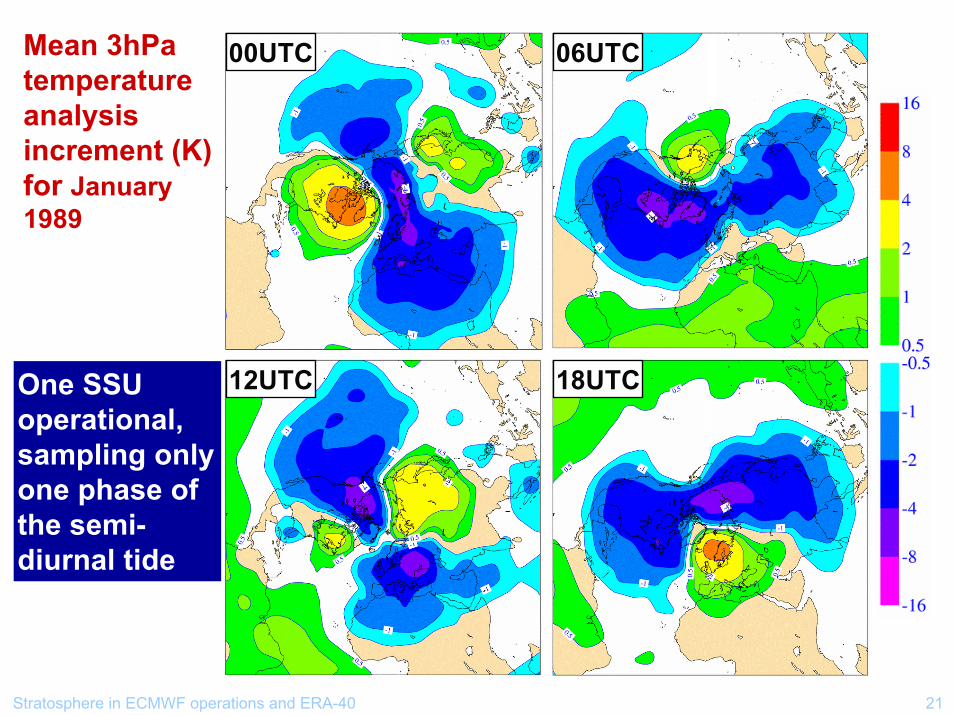
Mean 3hPa temperature analysis increment (K) for January 1989
00UTC 06UTC
12UTC 18UTCOne SSUoperational, sampling only one phase of the semi-diurnal tide
Stratosphere in ECMWF operations and ERA-40 22
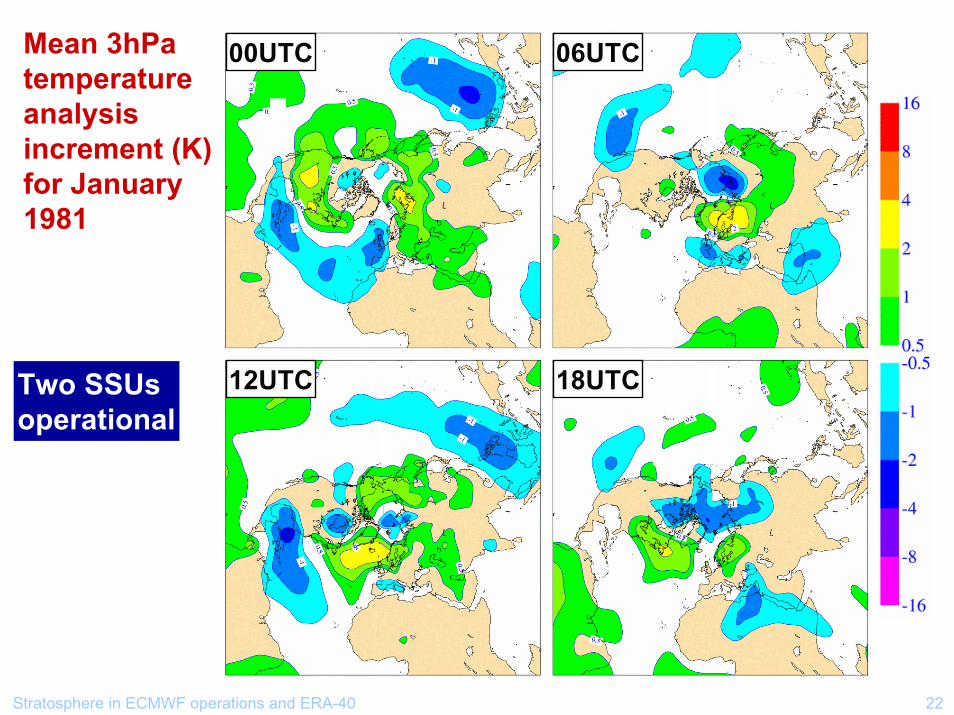
Mean 3hPa temperature analysis increment (K) for January 1981
00UTC 06UTC
12UTC 18UTCTwo SSUsoperational
Stratosphere in ECMWF operations and ERA-40 23
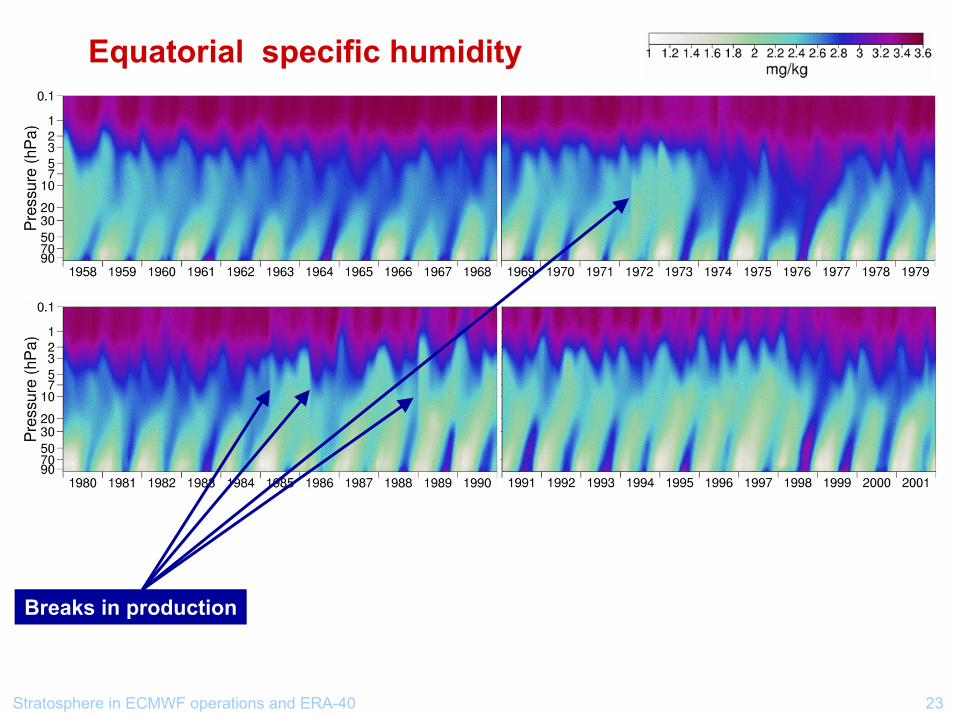
Equatorial specific humidity
Breaks in production
Stratosphere in ECMWF operations and ERA-40 24
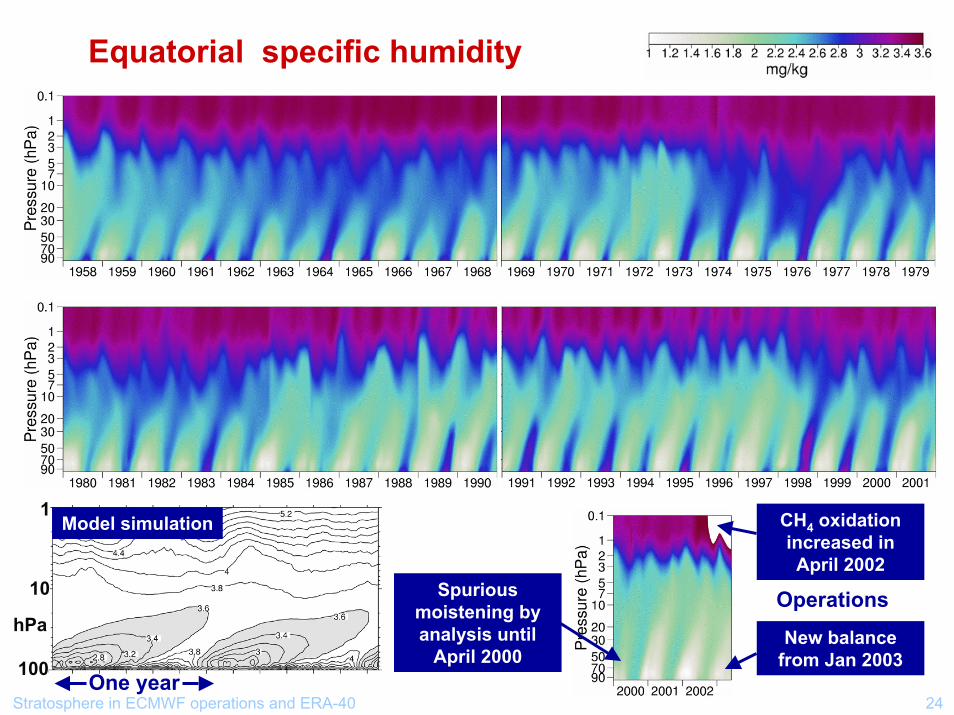
Equatorial specific humidity
Model simulation
10
100
1
hPa
One year
Operations
CH4 oxidation increased in April 2002
Spurious moistening by analysis until
April 2000New balance
from Jan 2003
Stratosphere in ECMWF operations and ERA-40 25
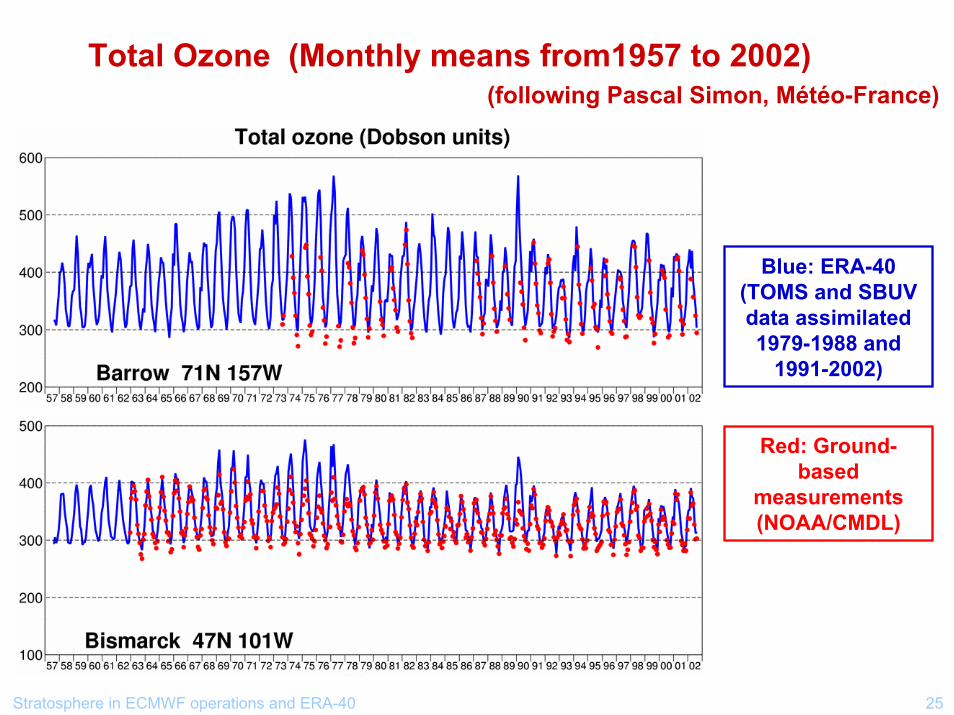
Total Ozone (Monthly means from1957 to 2002)(following Pascal Simon, Météo-France)
Blue: ERA-40 (TOMS and SBUV data assimilated 1979-1988 and
1991-2002)
Red: Ground-based
measurements (NOAA/CMDL)
Stratosphere in ECMWF operations and ERA-40 26
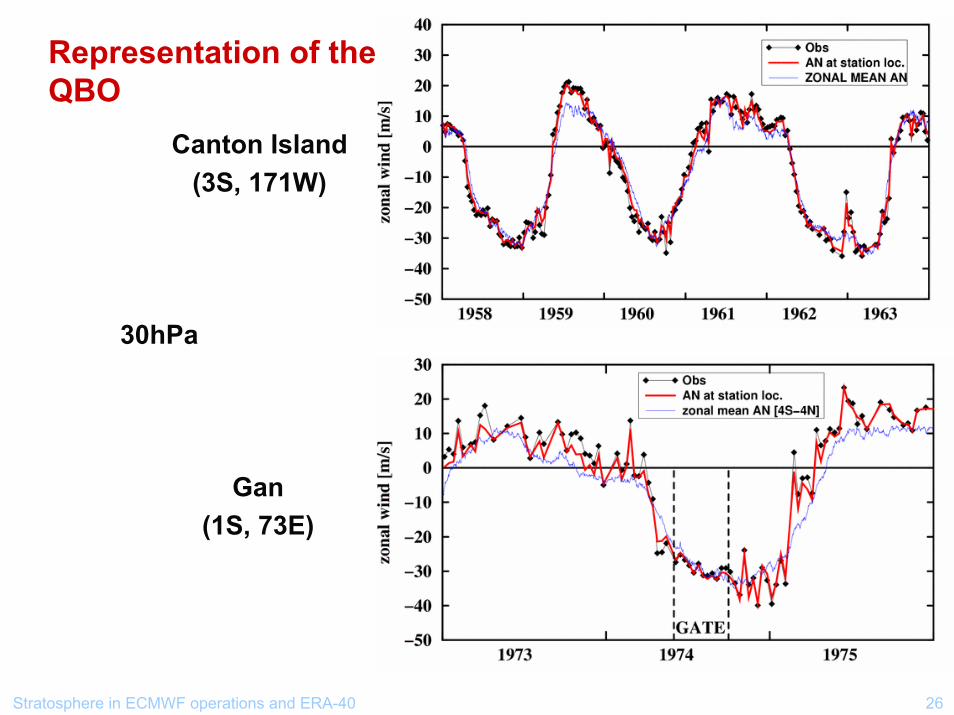
Representation of the QBO
Canton Island(3S, 171W)
Gan(1S, 73E)
30hPa
Stratosphere in ECMWF operations and ERA-40 27
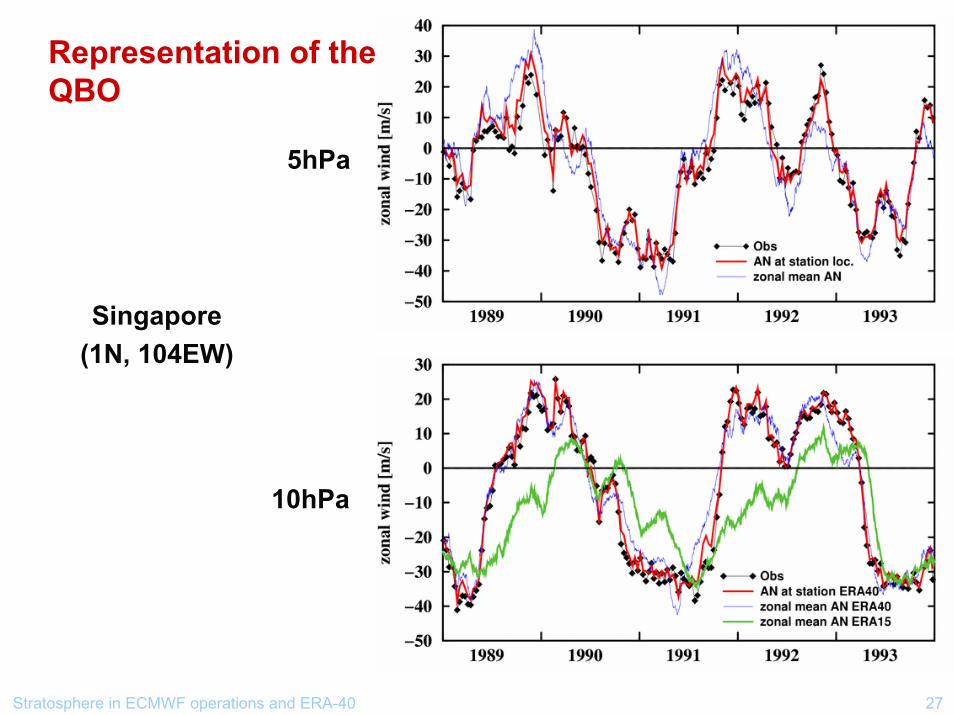
Representation of the QBO
Singapore(1N, 104EW)
5hPa
10hPa
Stratosphere in ECMWF operations and ERA-40 28
Conclusions
• Basically a success story (sudden warmings, QBO, … )
• But some problems persist, and new ones are emerging:
- Model biases (radiation, gravity-wave drag, upper boundary conditions, … )
- Observation biases (satellite radiances, radiosondes)
- Fitting of radiances in variational data assimilation
- Balance of the analysis
- Humidity
- Handling of tides
- Performance of 3D-Var compared with 4D-Var
- … and others that following speakers and the discussion groups will identify