
Reports That Can Be Produced With EPS-HDT Report Types .pdf · 1 Reports That Can Be Produced With...
6
1 Reports That Can Be Produced With EPS-HDT Economic Profile System – Human Dimensions Toolkit This fact sheet describes the types of reports that can be produced with the EPS-HDT software. A different fact sheet describes how to download, install, and run the software. EPS-HDT is a free, easy-to-use software application that produces detailed socioeconomic reports of counties, states, and regions, including custom aggregations. Why Use EPS-HDT? As the economic and demographics conditions of the country change – and as values, attitudes and opinions shift – the management of public lands becomes increasingly complex. More than ever, land managers need ready access to information, presented in a user-friendly format. EPS-HDT was developed as a support tool for public lands managers and as a tool for engaging the public to help understand changing socioeconomic trends. EPS-HDT Can Produce 14 Different Reports The software consists of an “Add-In” to Excel that can be downloaded for free from: www.headwaterseconomics.org/tools/eps-hdt. Click on the Add-Ins tab, click EPS-HDT and then Select Geographies to reveal a menu: (see the additional fact sheet for step-by-step instructions)
Transcript of Reports That Can Be Produced With EPS-HDT Report Types .pdf · 1 Reports That Can Be Produced With...

1
Reports That Can Be Produced With EPS-HDT Economic Profile System – Human Dimensions Toolkit
This fact sheet describes the types of reports that can be produced with the EPS-HDT software. A different fact sheet describes how to download, install, and run the software. EPS-HDT is a free, easy-to-use software application that produces detailed socioeconomic reports of counties, states, and regions, including custom aggregations. Why Use EPS-HDT? As the economic and demographics conditions of the country change – and as values, attitudes and opinions shift – the management of public lands becomes increasingly complex. More than ever, land managers need ready access to information, presented in a user-friendly format. EPS-HDT was developed as a support tool for public lands managers and as a tool for engaging the public to help understand changing socioeconomic trends. EPS-HDT Can Produce 14 Different Reports The software consists of an “Add-In” to Excel that can be downloaded for free from: www.headwaterseconomics.org/tools/eps-hdt. Click on the Add-Ins tab, click EPS-HDT and then Select Geographies to reveal a menu: (see the additional fact sheet for step-by-step instructions)
2
Any number of the 14 reports can be run at the same time for any geography in the U.S.
General Report √ SOCIOECONOMIC MEASURES is a report on long-term trends in population; employment; personal income; income
earned by industry; unemployment; and wages. If a number of geographies are selected (e.g., counties or states) these are aggregated into one “Region.” The selected geography can be compared to any custom benchmark geography selected by the user.
Detailed Reports
If you run a detailed report and select a number of geographies, they are compared to each other. They are also compared to the “Region,” consisting of an aggregate of the lowest level of geographies (e.g., counties are aggregated together). The Region is also benchmarked against the U.S.
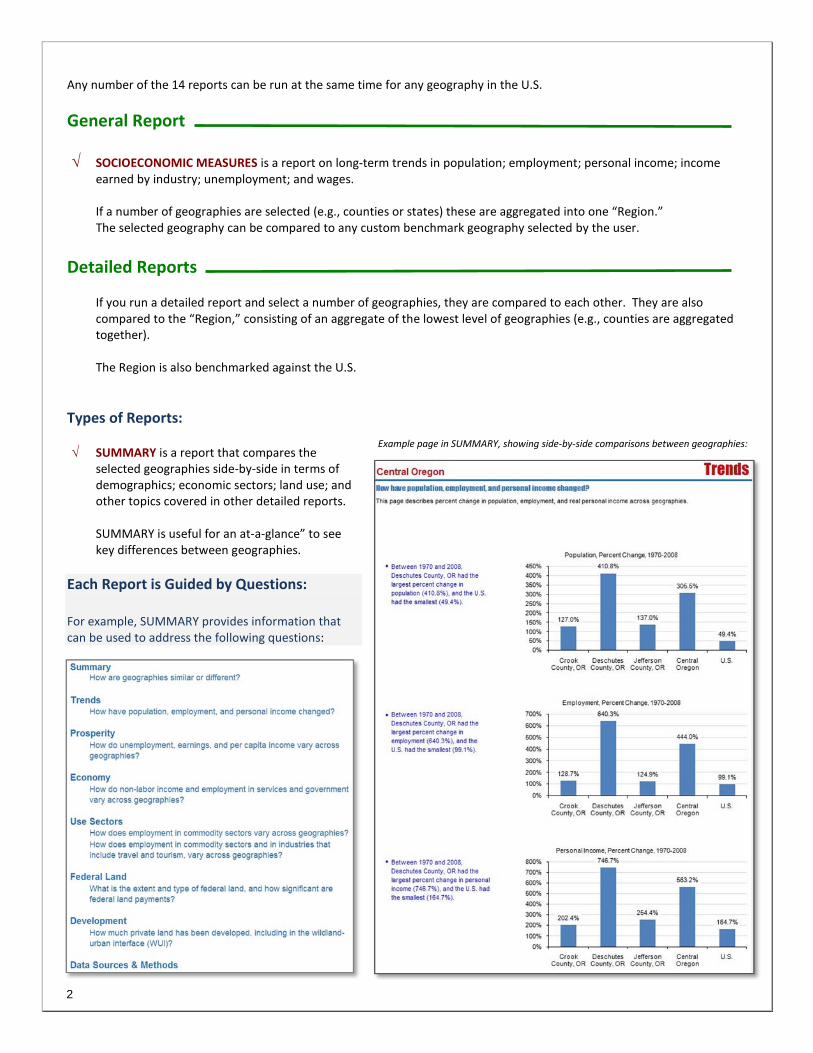
Types of Reports: √ SUMMARY is a report that compares the
selected geographies side-by-side in terms of demographics; economic sectors; land use; and other topics covered in other detailed reports.
SUMMARY is useful for an at-a-glance” to see key differences between geographies.
Each Report is Guided by Questions: For example, SUMMARY provides information that can be used to address the following questions:
Example page in SUMMARY, showing side-by-side comparisons between geographies:

3
√ DEMOGRAPHICS uses Census data to describe
the geography selected in terms of population; age distribution; race and ethnicity; poverty and income distribution; housing affordability; language; and education.
Economic Sector Reports: √ AGRICULTURE covers trends in farm and ranch
employment and personal income; wages; corporate income (including revenues and expenses); farmland by type; farms by type; and land occupied by farms and ranches. Farm employment is benchmarked against the U.S. and compared across geographies selected.
√ MINING AND ENERGY describes which
industries comprise mining (including energy development); shows how mining has changed over time; the role of the self-employed (which can be important in this sector); mining wages; and how regional trends in mining employment compare to the US. Selected geographies are also compared to each other.
√ SERVICES are the fastest growing segment of
the economy, nation-wide accounting for 99 percent of all jobs in the last three decades. Services are diverse, and include doctors, lawyers and engineers, as well as hotel maids and waiters. SERVICES describes the various components of the “services” sectors and how employment in these has changed over time; and compares wages between different service sectors. Service employment for the region is benchmarked against the U.S. and geographies selected are compared against each other.
Example page in DEMOGRAPHICS, showing poverty by county:
Example page in AGRICULTURE, showing net farm income over time:
4
√ TRAVEL AND TOURISM describes the number of jobs in industries that include travel and tourism and displays key statistics that are typical of tourism-related economies (e.g., seasonal employment and housing). Wages in travel and tourism related industries are compared to the rest of the economy. The region is benchmarked against the U.S., and geographies selected are compared to each other.
Special Note: “Travel and Tourism” consists of sectors that provide goods and services to visitors to the local economy, as well as to the local population. These industries are: retail trade; passenger transportation; arts, entertainment, and recreation; and accommodation and food. It is not known, without additional research such as surveys, what exact proportion of the jobs in these sectors is attributable to expenditures by visitors, including business and pleasure travelers, versus by local residents.
√ GOVERNMENT jobs can sometimes represent some of the highest paying occupations in many rural communities, and can serve as a source of long-term stability. GOVERNMENT reports the size and trends in employment and personal income earned in local, state and federal employment (including military); compares wages; and benchmarks the region against the U.S. Geographies selected are compared against each other.
√ NON-LABOR, such as retirement and investment income, can often represent more than a third of all income in a
county. NON-LABOR income sources include Dividends, Interest and Rent (investments) and Transfer Payments (often age and retirement-related). The role of non-labor income in the selected geographies is explained, including long-term trends and comparison to other income sources. The region is compared to the U.S., and geographies selected are compared to each other.
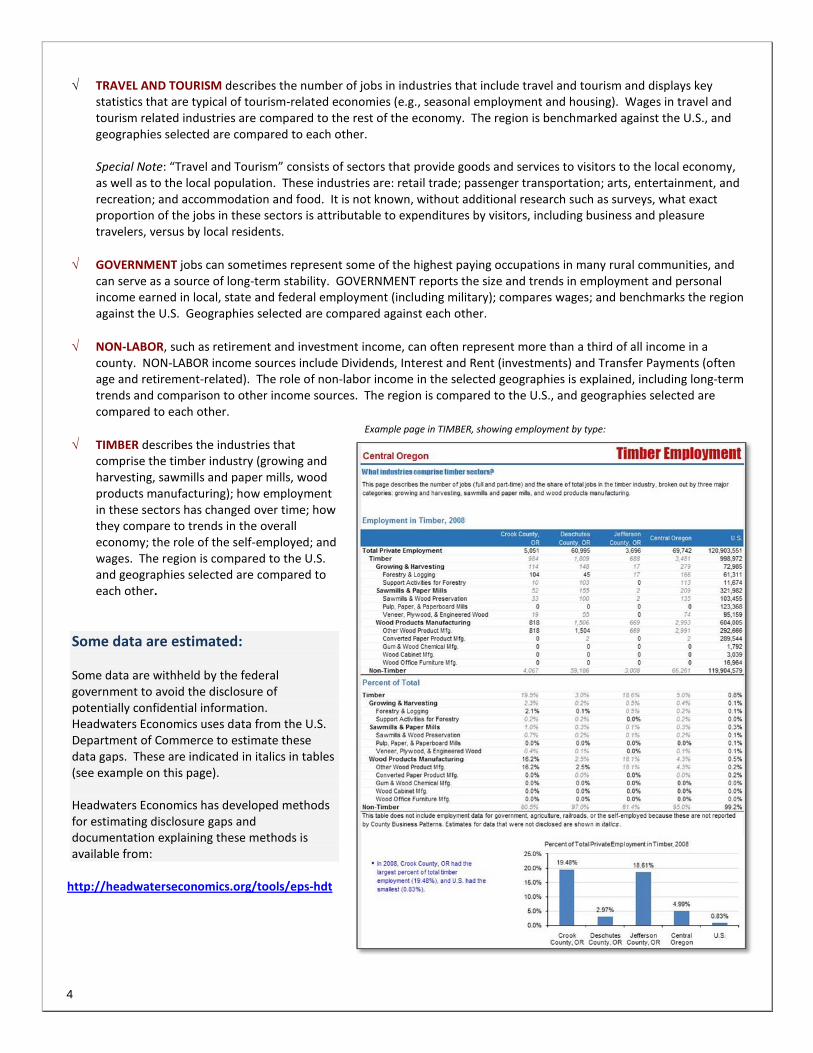
√ TIMBER describes the industries that
comprise the timber industry (growing and harvesting, sawmills and paper mills, wood products manufacturing); how employment in these sectors has changed over time; how they compare to trends in the overall economy; the role of the self-employed; and wages. The region is compared to the U.S. and geographies selected are compared to each other.
Some data are estimated: Some data are withheld by the federal government to avoid the disclosure of potentially confidential information. Headwaters Economics uses data from the U.S. Department of Commerce to estimate these data gaps. These are indicated in italics in tables (see example on this page). Headwaters Economics has developed methods for estimating disclosure gaps and documentation explaining these methods is available from:
http://headwaterseconomics.org/tools/eps-hdt
Example page in TIMBER, showing employment by type:

5
Thematic Reports:
√ LAND USE describes for each of the selected
geographies the land ownership (private, state, Forest Service, BLM, etc.); different management of federal lands (Wilderness, National Monument, etc.); land cover (forest, grassland, etc.); and residential development (change in residential acres/person, urban versus exurban development, etc.).
√ AMENITIES reports a number of indicators that
may point to the role public lands can play in providing recreational and scenic amenities that attracts and retains people and business to nearby communities. These include: acres of federal lands; types of federal lands (National Parks, Wilderness, etc.); population growth; in-migration; growth of “footloose” service sectors and non-labor income (retirement, investments, etc.); travel and tourism-related industries; and residential development. The amenity indicators for the selected geography are compared against the U.S.
√ DEVELOPMENT AND WILDFIRE describes the
development of homes on lands adjacent to fire-prone forested public lands. This report shows (for the 11 contiguous western state only) the wildland urban interface (WUI); its size within each county; and what percentage has been developed with homes.
√ PAYMENTS FROM FEDERAL LANDS can represent
a significant portion of county budgets. This report shows the payments that county government receive from federal sources, including Payment in Lieu of Taxes (PILT), the 24% Fund, and the Secure Rural Schools and community Self-Determination Act (SRS). Where available, mineral royalty payments are also reported (Headwaters Economics has been able to obtain this data only for selected states in the West). Payments are described over time; how they are distributed; whether they are restricted; and their relative importance for county and school budgets.
Example page in LAND USE, showing land ownership by county:
Example page in PAYMENTS FROM FEDERAL LANDS, showing SRS payments:

6
Methods of Benchmarking:
For GENERAL REPORT (SOCIOECONOMIC MEASURES) the geography selected can be compared to a Custom Benchmark. The image to the right shows a screen that appears if this report is run, asking the user to select a benchmark.
For DETAILED REPORTS the Region is benchmarked against the U.S. Detailed Reports also compare the Region (the aggregation of the lowest level of geographies, such as counties) to the U.S.
EPS-HDT is Approved for Agency Use. Further Information:
Ray Rasker, Ph.D. Robert Winthrop, Ph.D. Ashley Goldhor Wilcock, Ph.D. Executive Director Senior Social Scientist Human Dimensions Program Lead
Headwaters Economics Bureau of Land Management USDA Forest Service [email protected] [email protected] [email protected]
(406) 570-7044 (202) 912-7287 (202) 205-9969
The image to the right shows a screen that appears if this report is run, asking the user to select a benchmark.
The image to the right shows an example benchamrk page from the GOVERNMENT report.


![Dimensional Analysis hdt [????]](https://static.fdocuments.us/doc/165x107/61e0111627d16074d07ac3cb/dimensional-analysis-hdt-.jpg)

