Reports help guide - FFT Aspire · Contents Introduction to the KS2 school summary dashboard FFT...
9
Reports help guide School summary dashboard series KS2 - October 2014 © FFT Education Ltd 2014
Transcript of Reports help guide - FFT Aspire · Contents Introduction to the KS2 school summary dashboard FFT...

Reports help guide
School summary dashboard series KS2 - October 2014
© FFT Education Ltd 2014
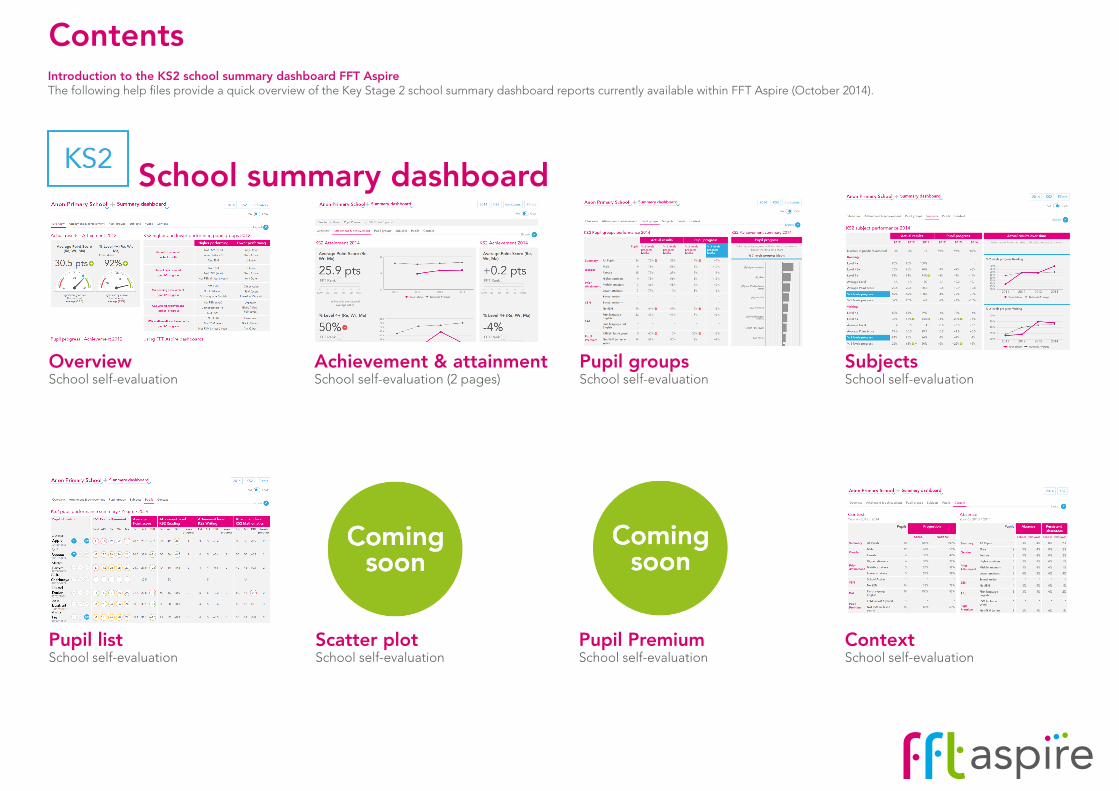
ContentsIntroduction to the KS2 school summary dashboard FFT AspireThe following help files provide a quick overview of the Key Stage 2 school summary dashboard reports currently available within FFT Aspire (October 2014).
School summary dashboard
Pupil listSchool self-evaluation
OverviewSchool self-evaluation
Scatter plotSchool self-evaluation
Achievement & attainmentSchool self-evaluation (2 pages)
SubjectsSchool self-evaluation
Pupil groupsSchool self-evaluation
ContextSchool self-evaluation
Pupil PremiumSchool self-evaluation

Navigation & report optionsUse the tabs to navigate through each area of the school summary dashboard. Click on the reporting year selector to view performance from a previous year - a 3 year reporting period is also available (e.g. 2012-2014). Select up to 2 performance indicators to be displayed in the gauges from the Indicator selector. Use the VA / CVA toggle to view the different perspectives of progress. Click on the Export icon to create a PDF of the on-screen report
Higher and lower performing pupil groupsPupil groups in comparison to the national average for attainment and VA/CVA progress for a range of key performance indicators. The group at the top of each list is the highest/lowest performing. Statistical significance is indicated
Use of FFT data· Provides questions not answers· Used as the starting point for discussions· Triangulate alongside a range of other data and professional judgement
KS2 attainment gaugeCompares attainment to the national average. Statistical significance is indicated for both the attainment gap (green = above, red = below) and for changes in attainment since the previous reporting year’s result (up = improvement, red = decline)
Statistical significanceSuggests the gap hasn’t occurred by chance. A signpost that further investigation may be required into the particular area. Small cohorts are unlikely to be significant
What does the report show?High level summary of KS2 attainment and progress (VA or CVA) for key indicators. Quickly identify the stronger and weaker pupil groups across the cohort in terms of attainment and progress. This report is the starting point for school self-evaluation
School summary dashboard: Overviewtarget-setting self-evaluation student explorer collaborate
Contextual Value Added (CVA)CVA defines ‘similar pupils’ differently to VA, and accounts for similar schools nationally too. The FFT CVA model uses prior attainment, gender and month of birth, FSM eligibility, ethnic group, SEN status, EAL and mobility as a starting for pupil comparisons. Similar schools are based on FSM eligibility rank, socio-economic rank and overall cohort prior attainment. Where values are positive, KS1-2 progress at the school is higher than for similar pupils in similar schools nationally. A negative value means the opposite
Value Added (VA)Pupil progress compared with similar pupils nationally. The FFT VA model uses prior attainment, gender and month of birth as a starting point for pupil comparisons. Where values are positive, KS1-2 progress at the school is higher than for similar pupils nationally. A negative value means the opposite
Small cohortsUse caution with small cohorts. In a pupil group size of 10 pupils, each pupil’s performance represents 10% of the group’s performance. Three-year analysis is recommended for small pupil groups
Progress (achievement) gaugeVA or CVA progress compares attainment of each individual pupil with that of similar pupils nationally. Statistical significance and trend indicated. Matched pupils only (pupils with KS1 prior attainment) are included within progress. See below for definitions of VA and CVA
School summary dashboard: Overview

Navigation & report optionsUse the tabs to navigate through each area of the school summary dashboard. Click on the reporting year selector to view performance from a previous year - a 3 year reporting period is also available (e.g. 2012-2014). Select up to 2 performance indicators to be displayed in the gauges from the Indicator selector. Filter to view performance for specific groups of pupils (e.g. FSM6 & boys). Use the VA / CVA toggle to view the different perspectives of progress. Click on the Export icon to create a PDF of the on-screen report
KS2 progress (achievement)VA or CVA progress compares attainment of each individual pupil with that of similar pupils nationally. Statistical significance and trend indicated. Matched pupils only (pupils with KS1 prior attainment) are included within
FFT RankNational percentile ranking for indicator (1 = highest, 100 = lowest). Ranks calculated for attainment and VA/CVA progress
Time series chartVisual display of school and national average attainment for the two selected indicators over the previous 4 years
KS2 attainmentAttainment values for the selected indicators. Statistical significance against the national average is displayed (green = above, red = below)
What does the report show?A visual representation of school and national average attainment over time provided alongside national percentile rankings and VA/CVA progress. Values can be re-calculated for specific pupil groups selected from the pupil group filter (filter selections appear at the top of the report)
Statistical significanceSuggests the gap hasn’t occurred by chance. It is a signpost that further investigation may be required into the particular area. Small cohorts are unlikely to be significant
Contextual Value Added (CVA)CVA defines ‘similar pupils’ differently to VA, and accounts for similar schools nationally too. The FFT CVA model uses prior attainment, gender and month of birth, FSM eligibility, ethnic group, SEN status, EAL and mobility as a starting for pupil comparisons. Similar schools are based on FSM eligibility rank, socio-economic rank and overall cohort prior attainment. Where values are positive, KS1-2 progress at the school is higher than for similar pupils in similar schools nationally. A negative value means the opposite
Value Added (VA)Pupil progress compared with similar pupils nationally. The FFT VA model uses prior attainment, gender and month of birth as a starting point for pupil comparisons. Where values are positive, KS1-2 progress at the school is higher than for similar pupils nationally. A negative value means the opposite
Small cohortsUse caution with small cohorts. In a pupil group size of 10 pupils, each pupil’s performance represents 10% of the group’s performance. Three-year analysis is recommended for small pupil groups
School summary dashboard: Attainment & Achievementtarget-setting self-evaluation student explorer collaboratetarget-setting self-evaluation student explorer collaborate
School summary dashboard: Attainment & Achievement pg.1target-setting self-evaluation student explorer collaboratetarget-setting self-evaluation student explorer collaborate
Use of FFT data· Provides questions not answers· Used as the starting point for discussions· Triangulate alongside a range of other data and professional judgement

Navigation & report optionsUse the tabs to navigate through each area of the school summary dashboard. Filter to view performance for specific groups of pupils (e.g. FSM6 & boys). Use the VA / CVA toggle to view the different perspectives of progress. Click on the Export icon to create a PDF of the on-screen report
KS2 attainment indicatorsActual results and progress are displayed for a range of key summary performance indicators. Any two of these indicators can be represented visually within the charts and rankings at the top of the reportof the report
What does the report show?Displays a three year history of attainment and progress within a range of key performance indicators. Statistical significance is indicated for attainment and progress in comparisons with the national average. Statistically significant changes from the previous year are also indicated with the direction
KS2 progress indicatorsVA or CVA progress. Compares attainment of each individual pupil with that of similar pupils nationally. Statistical significance and trend indicated. Matched pupils only (pupils with KS1 prior attainment) are included within progress
Statistical significanceSuggests the gap hasn’t occurred by chance. It is a signpost that further investigation may be required into the particular area. Small cohorts are unlikely to be significant
Contextual Value Added (CVA)Pupil progress compared with similar pupils in similar schools nationally. The FFT CVA model uses prior attainment, gender and month of birth, FSM eligibility, ethnic group, SEN status, EAL and mobility as a starting for pupil comparisons. Similar schools are based on FSM eligibility rank, socio-economic rank and overall cohort prior attainment
Value Added (VA)Pupil progress compared with similar pupils nationally. The FFT VA model uses prior attainment, gender and month of birth as a starting point for pupil comparisons. Where values are positive, KS1-2 progress at the school is higher than for similar pupils nationally. A negative value means the opposite
Small cohortsUse caution with small cohorts. In a pupil group size of 10 pupils, each pupil’s performance represents 10% of the group’s performance. Three-year analysis is recommended for small pupil groups
target-setting self-evaluation student explorer collaborate
Use of FFT data· Provides questions not answers· Used as the starting point for discussions· Triangulate alongside a range of other data and professional judgement
School summary dashboard: Attainment & Achievement pg.2

Navigation & report optionsUse the tabs to navigate through each area of the school summary dashboard. Click on the reporting year selector to view performance from a previous year - a 3 year reporting period is also available (e.g. 2012-2014). Select up to three performance indicators to be displayed in the table from the Indicator selector. The values for the first indicator selected will be displayed in the chart. Filter the report to view performance for specific groups of pupils (e.g. FSM6 boys). Use the VA / CVA toggle to view the different perspectives of progress. Click on the Export icon to create a PDF of the on-screen report
Statistical significanceSuggests the gap hasn’t occurred by chance. It is a signpost that further investigation may be required into the particular area. Small cohorts are unlikely to be significant
Pupil progressValue Added (VA) or Contextual VA (CVA) perspective of progress. Only matched pupils are included in progress (those with KS1 attainment). Statistical significance and trends indicated
Actual resultsAggregated attainment results for the selected indicators are displayed for each pupil group. Always consider the cohort size when analysing performance data
What does the report show?The interactive report allows side-by-side comparison of attainment and progress across any three summary indicators from the indicator selector. Helps illuminate variation across two the indicators overall and by pupil group
S-curve chartVisual display of pupil groups performance across the blue highlighted progress indicator. The values are ranked high to low with statistical significance indicated. Cohort size is indicated within the brackets
Contextual Value Added (CVA)CVA defines ‘similar pupils’ differently to VA, and accounts for similar schools nationally too. The FFT CVA model uses prior attainment, gender and month of birth, FSM eligibility, ethnic group, SEN status, EAL and mobility as a starting for pupil comparisons. Similar schools are based on FSM eligibility rank, socio-economic rank and overall cohort prior attainment. Where values are positive, KS1-2 progress at the school is higher than for similar pupils in similar schools nationally. A negative value means the opposite
Value Added (VA)Pupil progress compared with similar pupils nationally. The FFT VA model uses prior attainment, gender and month of birth as a starting point for pupil comparisons. Where values are positive, KS1-2 progress at the school is higher than for similar pupils nationally. A negative value means the opposite
Small cohortsUse caution with small cohorts. In a pupil group size of 10 pupils, each pupil’s performance represents 10% of the group’s performance. Three-year analysis is recommended for small pupil groups
School summary dashboard: Pupil groupstarget-setting self-evaluation student explorer collaborate
Use of FFT data· Provides questions not answers· Used as the starting point for discussions· Triangulate alongside a range of other data and professional judgement

Navigation & report optionsUse the tabs to navigate through each area of the school summary dashboard. Click on the reporting year selector to view performance from a previous year. Filter the report to view performance for specific groups of pupils (e.g. FSM6 boys). Use the VA / CVA toggle to view the different perspectives of progress. Click on the Export icon to create a PDF of the on-screen report
Pupil progressVA or CVA perspective of progress. Only matched pupils are included in progress (those with KS1 attainment). Statistical significance and trends are indicated. In the example, Writing L5+ attainment in 2013 was 55%, which was 20% above performance of similar pupils in similar schools (CVA). We can therefore derive that the estimated performance was 35%
Actual resultsAggregated attainment results for the selected indicators are displayed for each indicator
What does the report show?Detailed year-on-year range of performance indicators for each subject’s attainment and progress. Select which indicators appear in the time series charts on the right
Time series chartVisual display of the selected (blue) attainment indicators and national averages over the previous 4 years
Statistical significanceSuggests the gap hasn’t occurred by chance. It is a signpost that further investigation may be required into the particular area. Small cohorts are unlikely to be significant
Contextual Value Added (CVA)CVA defines ‘similar pupils’ differently to VA, and accounts for similar schools nationally too. The FFT CVA model uses prior attainment, gender and month of birth, FSM eligibility, ethnic group, SEN status, EAL and mobility as a starting for pupil comparisons. Similar schools are based on FSM eligibility rank, socio-economic rank and overall cohort prior attainment. Where values are positive, KS1-2 progress at the school is higher than for similar pupils in similar schools nationally. A negative value means the opposite
Value Added (VA)Pupil progress compared with similar pupils nationally. The FFT VA model uses prior attainment, gender and month of birth as a starting point for pupil comparisons. Where values are positive, KS1-2 progress at the school is higher than for similar pupils nationally. A negative value means the opposite
Small cohortsUse caution with small cohorts. In a pupil group size of 10 pupils, each pupil’s performance represents 10% of the group’s performance. Three-year analysis is recommended for small pupil groups (available on Overview, Att & ach and Pupil groups dashboards)
School summary dashboard: Subjectstarget-setting self-evaluation student explorer collaborate
Use of FFT data· Provides questions not answers· Used as the starting point for discussions· Triangulate alongside a range of other data and professional judgement

Navigation & report optionsUse the tabs to navigate through each area of the school summary dashboard. Click on the reporting year selector to view cohorts from previous years. Filter the report to view pupils with specific characteristics (e.g. FSM6 boys). Use the VA / CVA toggle to view the different perspectives of progress. Click on the Export icon to create a PDF of the on-screen report
AttainmentKey stage 2 performance information is provided for average point score (APS), reading, writing and mathematics
Key stage 1 prior attainmentAverage Point Score (APS) and teacher assessment results in reading, writing and maths displayed. Band indicates the third nationally the pupil ranked in terms of their average KS1 attainment (H = highest third, M = middle & L = lowest). Coloured circles represent attainment being below (red), inline (yellow) or above (green) the KS1 expected level. Pupils without KS1 attainment will not have estimated grades
Levels progressThe number of levels difference between attainment at key stage 1 and key stage 2 within the same subject
Pupil details and contextList of pupils within the cohort, a blue token can indicate free school meal entitlement in the last 6 years (PP), English as an additional language (EAL) or special educational needs (SEN)
What does the report show?Key stage 2 pupil level attainment, progress against similar pupils and the number of levels made between KS1 & KS2. The report helps quickly identify variation between an individual pupil’s performance across reading, writing and mathematics
Estimates, actuals and differencesThe estimate (Est) represents the sub-level which 50% or more of ‘similar pupils’ attained nationally. Estimates may change when switching between VA and CVA as the definition of ‘similar pupils’ changes. Actuals (Act) represent the pupil’s attainment in the subject. Differences (Diff) are the gaps in levels between the estimate and actual. Coloured circles indicator where actuals were above (green) or below (red) by half a level or more than the estimate - this is not statistical significance
Contextual Value Added (CVA)CVA defines ‘similar pupils’ differently to VA, and accounts for similar schools nationally too. The FFT CVA model uses prior attainment, gender and month of birth, FSM eligibility, ethnic group, SEN status, EAL and mobility as a starting for pupil comparisons. Similar schools are based on FSM eligibility rank, socio-economic rank and overall cohort prior attainment. Where values are positive, KS1-2 progress at the school is higher than for similar pupils in similar schools nationally. A negative value means the opposite
Value Added (VA)Pupil progress compared with similar pupils nationally. The FFT VA model uses prior attainment, gender and month of birth as a starting point for pupil comparisons. Where values are positive, KS1-2 progress at the school is higher than for similar pupils nationally. A negative value means the opposite
Use of FFT data· Provides questions not answers· Used as the starting point for discussions· Triangulate alongside a range of other data and professional judgement
School summary dashboard: Pupilstarget-setting self-evaluation student explorer collaborate

School absenceBreakdown of absence by pupil groups for year 6 pupils. Persistent absentees are pupils who miss 15% or more of attendance sessions. The table shows the percentage of persistent absentee pupils within each pupil group. Pupil group national averages are provided for comparison
ContextBreakdown of pupil context and characteristics numbers and percentages of the cohort. National information is provided for comparison
What does this report show?The report helps identify how the context and characteristics of the cohort compare against the national average
Use of FFT data· Provides questions not answers· Used as the starting point for discussions· Triangulate alongside a range of other data and professional judgement
Prior attainment, FSM and mobility pupil groupsPrior attainment group: each pupil is ranked nationally based on their overall Key Stage 1 teacher assessments. Attainment bands represent the third of pupils nationally where each pupil ranks in terms of attainment. Higher = top third nationally, Middle = middle third and Lower = bottom thirdFSM: pupils entitled to free school meals in the last census before the end of the key stage (also known as FSM current)FSM (in last 6 years): Pupil Premium pupils, entitled to free school meals at any point in the last 6 yearsFSM ever: pupils entitled to free school meals at any point in their educational history (pupils who are FSM ever but not FSM6 are known as the invisible groupMobility: Pupils who were in the school for half or less of the key stage, those who joined in year 5 or year 6
Small cohortsAbsence rates for small groups of pupils can be heavily influenced by a single pupil. Always consider the cohort size when interpreting aggregated data
Navigation & report optionsUse the tabs to navigate through each area of the school summary dashboard. Click on the reporting year selector to view context and absence from a previous cohort. Click on the Export icon to create a PDF of the on-screen report
School summary dashboard: Contexttarget-setting self-evaluation student explorer collaborate