REPORTS FULL-YEAR 2013-14 SALES AND EARNINGS FIGURES
12
1 UBISOFT ® REPORTS FULL-YEAR 2013-14 SALES AND EARNINGS FIGURES Annual sales: €1,007 million Non-IFRS operating loss: €66 million 2014-15 operating income target confirmed Paris, May 15, 2014 – Today, Ubisoft released its sales and earnings figures for the fiscal year ended March 31, 2014. Non-IFRS income statement and key financial data In € millions 2013-14 % 2012-13 % Sales 1,007.1 1,256.2 Gross profit 721.8 71.7% 913.5 72.7% R&D expenses (426.1) -42.3% (428.2) -34.1% Selling expenses (279.3) -27.7% (304.0) -24.2% General and administrative expenses (82.0) -8.1% (81.0) -6.4% Total SG&A expenses (361.3) -35.9% (385.0) -30.6% Non-IFRS operating income/(loss) (65.6) -6.5% 100.3 8.0% Non-IFRS net income/(loss) (49.3) -4.9% 69.2 5.5% Non-IFRS diluted earnings/(loss) per share (in €) (0.46) 0.71 Non-IFRS cash flows from operating activities (120.1) 28.4 R&D investment expenditure* 479.7 458.9 Net cash/(debt) position (12.7) 104.5 * Including royalties but excluding future commitments. Commenting on these results, Yves Guillemot, Chief Executive Officer, stated "Although Ubisoft did not reach the targets announced a year ago for 2013-14, we did see a number of significant achievements during the period. Above all, we consistently achieved high quality across our games, notably for Assassin’s Creed 4 Black Flag – the best-rated game of the Christmas season for PS4 and Xbox One – and for South Park: The Stick of Truth, which delivered a solid sales performance for Xbox360, PS3 and PC. At the same time, the digital segment is now a substantial contributor to our business, accounting for 19% of total 2013-14 sales. At the start of 2014-15, we further demonstrated the strides we have made in this growth segment, with the successful releases of two free-to-play games for smartphones and tablets – Trials Frontier, with almost 10 million downloads on iOS in one month, and CSI: Hidden Crimes."
Transcript of REPORTS FULL-YEAR 2013-14 SALES AND EARNINGS FIGURES
1
UBISOFT® REPORTS FULL-YEAR 2013-14
SALES AND EARNINGS FIGURES
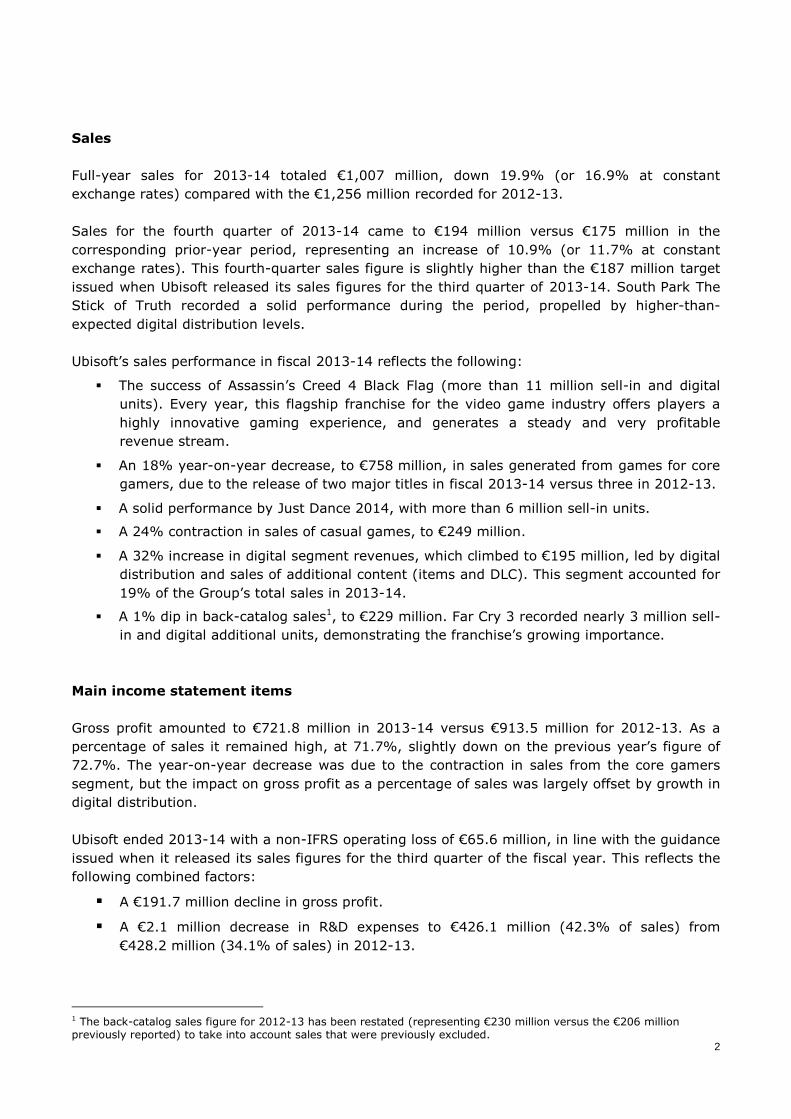
Annual sales: €1,007 million
Non-IFRS operating loss: €66 million
2014-15 operating income target confirmed
Paris, May 15, 2014 – Today, Ubisoft released its sales and earnings figures for the fiscal year
ended March 31, 2014.
Non-IFRS income statement and key financial data
In € millions 2013-14 % 2012-13 %
Sales 1,007.1 1,256.2
Gross profit 721.8 71.7% 913.5 72.7%
R&D expenses (426.1) -42.3% (428.2) -34.1%
Selling expenses (279.3) -27.7% (304.0) -24.2%
General and administrative expenses (82.0) -8.1% (81.0) -6.4%
Total SG&A expenses (361.3) -35.9% (385.0) -30.6%
Non-IFRS operating income/(loss) (65.6) -6.5% 100.3 8.0%
Non-IFRS net income/(loss) (49.3) -4.9% 69.2 5.5%
Non-IFRS diluted earnings/(loss) per share (in €) (0.46) 0.71
Non-IFRS cash flows from operating activities (120.1) 28.4
R&D investment expenditure* 479.7 458.9
Net cash/(debt) position (12.7) 104.5
* Including royalties but excluding future commitments.
Commenting on these results, Yves Guillemot, Chief Executive Officer, stated "Although Ubisoft
did not reach the targets announced a year ago for 2013-14, we did see a number of significant
achievements during the period. Above all, we consistently achieved high quality across our
games, notably for Assassin’s Creed 4 Black Flag – the best-rated game of the Christmas
season for PS4 and Xbox One – and for South Park: The Stick of Truth, which delivered a solid
sales performance for Xbox360, PS3 and PC. At the same time, the digital segment is now a
substantial contributor to our business, accounting for 19% of total 2013-14 sales. At the start
of 2014-15, we further demonstrated the strides we have made in this growth segment, with
the successful releases of two free-to-play games for smartphones and tablets – Trials Frontier,
with almost 10 million downloads on iOS in one month, and CSI: Hidden Crimes."
2
Sales
Full-year sales for 2013-14 totaled €1,007 million, down 19.9% (or 16.9% at constant
exchange rates) compared with the €1,256 million recorded for 2012-13.
Sales for the fourth quarter of 2013-14 came to €194 million versus €175 million in the
corresponding prior-year period, representing an increase of 10.9% (or 11.7% at constant
exchange rates). This fourth-quarter sales figure is slightly higher than the €187 million target
issued when Ubisoft released its sales figures for the third quarter of 2013-14. South Park The
Stick of Truth recorded a solid performance during the period, propelled by higher-than-
expected digital distribution levels.
Ubisoft’s sales performance in fiscal 2013-14 reflects the following:
The success of Assassin’s Creed 4 Black Flag (more than 11 million sell-in and digital
units). Every year, this flagship franchise for the video game industry offers players a
highly innovative gaming experience, and generates a steady and very profitable
revenue stream.
An 18% year-on-year decrease, to €758 million, in sales generated from games for core
gamers, due to the release of two major titles in fiscal 2013-14 versus three in 2012-13.
A solid performance by Just Dance 2014, with more than 6 million sell-in units.
A 24% contraction in sales of casual games, to €249 million.
A 32% increase in digital segment revenues, which climbed to €195 million, led by digital
distribution and sales of additional content (items and DLC). This segment accounted for
19% of the Group’s total sales in 2013-14.
A 1% dip in back-catalog sales1, to €229 million. Far Cry 3 recorded nearly 3 million sell-
in and digital additional units, demonstrating the franchise’s growing importance.
Main income statement items
Gross profit amounted to €721.8 million in 2013-14 versus €913.5 million for 2012-13. As a
percentage of sales it remained high, at 71.7%, slightly down on the previous year’s figure of
72.7%. The year-on-year decrease was due to the contraction in sales from the core gamers
segment, but the impact on gross profit as a percentage of sales was largely offset by growth in
digital distribution.
Ubisoft ended 2013-14 with a non-IFRS operating loss of €65.6 million, in line with the guidance
issued when it released its sales figures for the third quarter of the fiscal year. This reflects the
following combined factors:
A €191.7 million decline in gross profit.
A €2.1 million decrease in R&D expenses to €426.1 million (42.3% of sales) from
€428.2 million (34.1% of sales) in 2012-13.
1 The back-catalog sales figure for 2012-13 has been restated (representing €230 million versus the €206 million previously reported) to take into account sales that were previously excluded.

3
A €23.6 million decrease in SG&A expenses to €361.3 million (35.9% of sales) from
€385.0 million (30.6% of sales) in 2012-13:
− Variable marketing expenses represented 20.2% of sales (€204.4 million) compared
with 18.2% (€228.7 million) in 2012-13.
− Structure costs corresponded to 15.6% of sales (€157.0 million) against 12.4%
(€156.3 million) for the previous year.
Ubisoft recorded a non-IFRS net loss of €49.3 million for 2013-14, representing a non-IFRS
diluted loss per share of €0.46, versus non-IFRS net income of €69.2 million and non-IFRS
diluted earnings per share of €0.71 in 2012-13.
The IFRS net loss amounted to €65.5 million, representing an IFRS diluted loss per share of
€0.61, compared with IFRS net income of €64.8 million and IFRS diluted earnings per share of
€0.67 in 2012-13.
Main non-IFRS cash flow statement and balance sheet items
Non-IFRS cash flows from operating activities represented a net outflow of €120.1 million
compared with a €28.4 million net inflow in 2012-13. This reflects a negative €79.3 million in
non-IFRS cash flow from operations (versus a positive €58.8 million in 2012-13) and a
€40.8 million increase in non-IFRS working capital requirement (against a €30.4 million increase
in 2012-13).
As of March 31, 2014 Ubisoft had net debt of €12.7 million compared with net cash of
€104.5 million one year earlier. This negative swing was primarily attributable to:
The €120.1 million non-IFRS net cash outflow from operating activities.
€42.9 million in purchases of tangible and intangible assets.
€9.7 million in cash outflows for business acquisitions.
A €65.7 million inflow from capital increases.
€6.0 million from sales of Gameloft shares.
€16.3 million in negative translation adjustments.
Outlook
Full-year 2014-15
Yves Guillemot stated, "2014-15 should see a return to double-digit profitability as we reap the
benefits of the investments and innovations that we have implemented over the last few years.
Combined with the fast uptake of new-generation consoles and strong growth in the online
market, our ambitious games line-up should land three of our titles in the top ten best-selling
games of the year for consoles and PC, and lead us to record a sharp rise in our digital sales."
"The year’s performance will be led by five games – Assassin’s Creed Unity, Far Cry 4, Just
Dance, The Crew and Watch Dogs. Watch Dogs’ pre-orders are at record levels and it is
perfectly positioned to become the industry’s most successful new IP in history."
Yves Guillemot concluded "Drawing on the strengths of our multi-studio organizational
structure, our constant drive to innovate and our recognized expertise in creating successful
new brands, Ubisoft should outperform the industry in both 2014 and the following years."
4
Ubisoft is standing by its non-IFRS operating income target of at least €150 million for 2014-15,
and its initial annual sales target is at least €1,400 million, representing a 39% increase on
2013-14. This strong growth will be driven by:
- A steep rise in sales from games for core gamers, thanks to the release of four major
titles (compared with two in 2013-14).
- A sharp increase in digital revenues, fueled by digital distribution and revenue from free-
to-play games for mobile devices and PC.
These two trends will largely offset the expected decrease in sales for the casual segment.
Sales for the first quarter of 2014-15
The first quarter of 2014-15 will see the following main releases:
Watch DogsTM for PLAYSTATION®4, Xbox One™, PLAYSTATION®3, Xbox 360™, PC
Trials FrontierTM and CSI: Hidden CrimesTM for iOS and Androïd (Free-to-Play)
Trials FusionTM for PLAYSTATION®4, Xbox One™, Xbox 360®, PC
Child of LightTM for Xbox One™, PLAYSTATION®4, Xbox 360™, PLAYSTATION®3, PC,
Wii U™
The Group expects first-quarter 2014-15 sales to amount to approximately €310 million,
representing a very sharp increase of more than 300% compared with the first quarter of 2013-
14, due mainly to the release of Watch Dogs.
Recent significant events
Market share: In the first three months of calendar 2014, Ubisoft was the number 4 independent publisher
in the United States with 8.9% market share (compared with number 4 and 7.6% one year earlier) and
number 3 in Europe with 10.0% market share (compared with number 3 and 10.2%). (NPD, GFK)
Contact
Investor relations Jean-Benoît Roquette SVP Investor Relations + 33 1 48 18 52 39 [email protected]
Non-IFRS financial information Group Management considers that “Non-IFRS operating income/(loss)” and “Non-IFRS net income/(loss)” – which are measures that are not prepared strictly in accordance with IFRS – are relevant indicators of the Group’s operating and financial performance. Management uses them to run the Group’s business as they are the best reflection of its recurring performance and exclude the majority of non-operating and non-recurring items. “Non-IFRS operating income/(loss)”, “Non-IFRS net income/(loss)” and “Non-IFRS earnings/(loss) per share” are comparable to the following three previously-used indicators: “Current operating income/(loss) before stock-based compensation”, “Net income/(loss) before non-recurring items and stock-based compensation” and “Earnings/(loss) per share before non-recurring items and stock-based compensation”. A reconciliation between the IFRS and non-IFRS measures is provided in the appendices to this press release. Disclaimer This statement may contain estimated financial data, information on future projects and transactions and future business results/performance. Such forward-looking data are provided for estimation purposes only. They are subject to market risks and uncertainties and may vary significantly compared with the actual results that will be published. The estimated financial data have been presented to the Board of Directors and have not been audited by the Statutory Auditors. (Additional information is specified in the most recent Ubisoft Registration Document filed on June 25, 2013 with the French Financial Markets Authority (l’Autorité des Marchés Financiers)).

5
About Ubisoft Ubisoft is a leading creator, publisher and distributor of interactive entertainment and services, with a rich portfolio of world-renowned brands, including Assassin’s Creed, Just Dance, Tom Clancy’s video game series, Rayman and Far Cry. The teams throughout Ubisoft’s worldwide network of studios and business offices are committed to delivering original and memorable gaming experiences across all popular platforms, including consoles, mobile phones, tablets and PCs. For the 2013-14 fiscal year Ubisoft generated sales of €1,007 million. To learn more, please visit www.ubisoftgroup.com. © 2014 Ubisoft Entertainment. All rights Reserved. Just Dance, Watch Dogs, Assassin’s Creed, Black Flag, Far Cry, Child of Light; Valiant Hearts The Great War, Rayman Ubisoft and the Ubisoft logo are trademarks of Ubisoft Entertainment in the US and/or other countries. Trials Evolution andTrials Fusion are trademarks of Redlynx in the US and/or other countries. Redlynx is a Ubisoft Entertainment company. CSI: CRIME SCENE INVESTIGATION in USA is a trademark of CBS Broadcasting Inc. and outside USA is a trademark of Daltrey Funding LP. CBS and the CBS Eye Design TM CBS Broadcasting Inc. ©2000 - 2014 CBS Broadcasting Inc. and Daltrey Funding LP. All Rights Reserved. Software © 2014 Ubisoft Entertainment. All Rights Reserved. © 2014 South Park Digital Studios LLC. All Rights Reserved. South Park and all elements thereof © 2014 Comedy Partners. All Rights Reserved. Comedy Central, South Park and all related titles, logos, and characters are trademarks of Comedy Partners. Game software © 2014 Ubisoft Entertainment. All Rights Reserved. Developed by Obsidian Entertainment, Inc. Game Engine and other technology © 2014 Obsidian Entertainment, Inc. All Rights Reserved. Obsidian and the Obsidian Entertainment logo are trademarks and/or registered trademarks of Obsidian Entertainment, Inc.
6
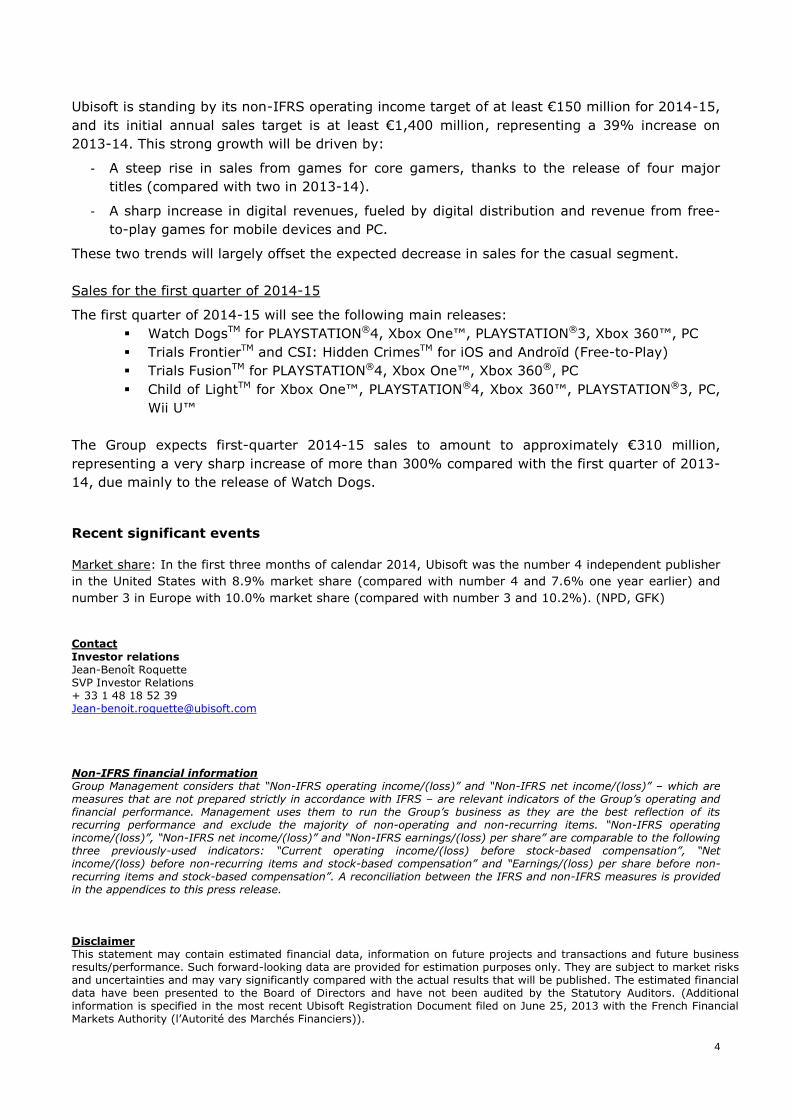
APPENDICES
Breakdown of sales by geographic region
% Sales % Sales % Sales % Sales
Q4 2013/14 Q4 2012/13
12 months
2013/14
12 months
2012/13
Europe 31% 45% 39% 39%
North America 60% 45% 52% 54%
Rest of world 9% 10% 9% 7%
TOTAL 100% 100% 100% 100%
Breakdown of sales by platform
Q4 2013/14 Q4 2012/13
12 months
2013/14
12 months
2012/13
Nintendo 3 DS™ 0% 2% 0% 1%
PC 24% 23% 15% 11%
PLAYSTATION®3 20% 34% 25% 30%
PLAYSTATION®4 13% - 9% -
PS VITA 1% 1% 1% 2%
XBOX 360™ 22% 27% 27% 34%
XBOX One™ 7% - 6% -
Wii™ 3% 13% 11% 16%
Wii U™ 2% 0% 3% 4%
Others 7% 0% 3% 2%
TOTAL 100% 100% 100% 100%
7
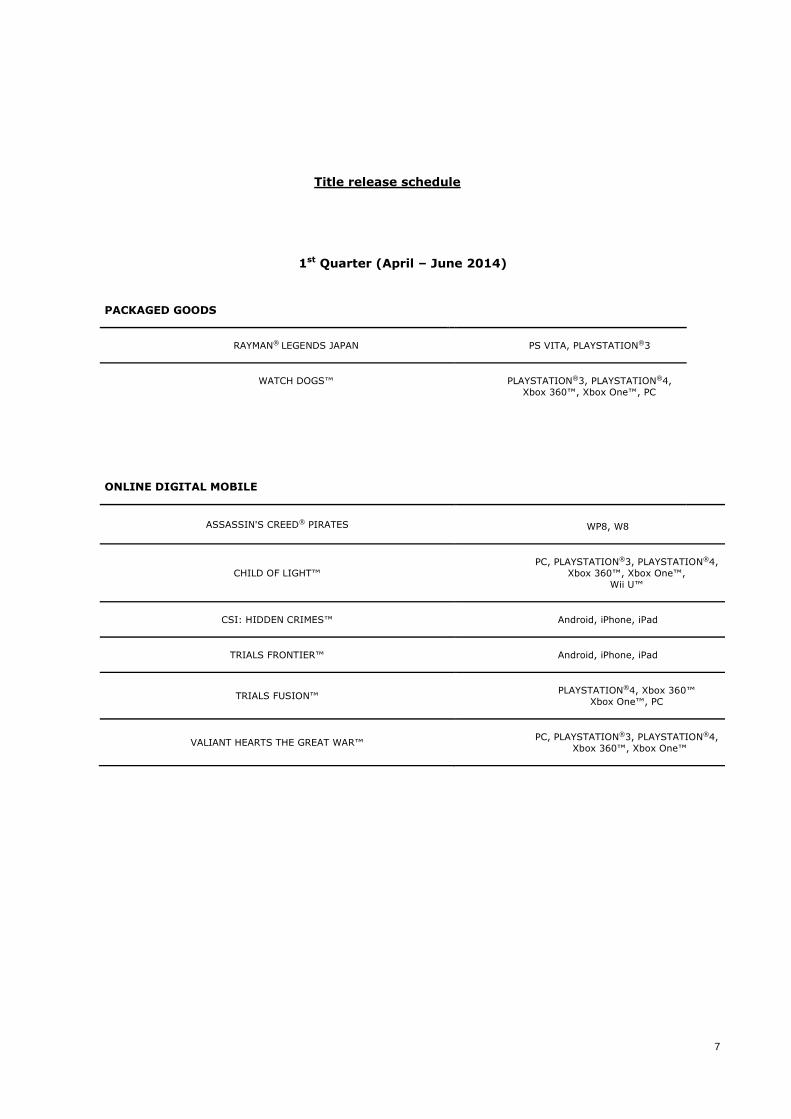
Title release schedule
1st Quarter (April – June 2014)
PACKAGED GOODS
RAYMAN® LEGENDS JAPAN
PS VITA, PLAYSTATION®3
WATCH DOGS™
PLAYSTATION®3, PLAYSTATION®4,
Xbox 360™, Xbox One™, PC
ONLINE DIGITAL MOBILE
ASSASSIN'S CREED® PIRATES
WP8, W8
CHILD OF LIGHT™
PC, PLAYSTATION®3, PLAYSTATION®4,
Xbox 360™, Xbox One™,
Wii U™
CSI: HIDDEN CRIMES™
Android, iPhone, iPad
TRIALS FRONTIER™
Android, iPhone, iPad
TRIALS FUSION™
PLAYSTATION®4, Xbox 360™
Xbox One™, PC
VALIANT HEARTS THE GREAT WAR™
PC, PLAYSTATION®3, PLAYSTATION®4,
Xbox 360™, Xbox One™
8
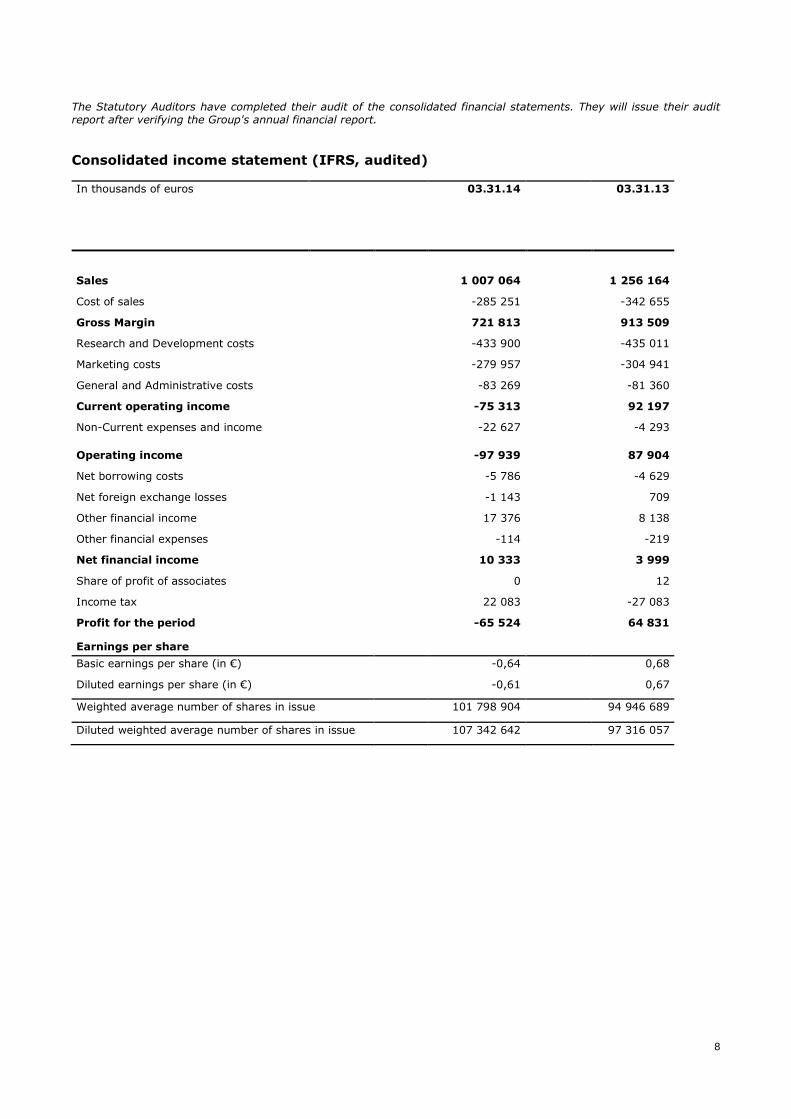
The Statutory Auditors have completed their audit of the consolidated financial statements. They will issue their audit report after verifying the Group's annual financial report.
Consolidated income statement (IFRS, audited)
In thousands of euros 03.31.14 03.31.13
Sales 1 007 064 1 256 164
Cost of sales -285 251 -342 655
Gross Margin 721 813 913 509
Research and Development costs -433 900 -435 011
Marketing costs -279 957 -304 941
General and Administrative costs -83 269 -81 360
Current operating income -75 313 92 197
Non-Current expenses and income -22 627 -4 293
Operating income -97 939 87 904
Net borrowing costs -5 786 -4 629
Net foreign exchange losses -1 143 709
Other financial income 17 376 8 138
Other financial expenses -114 -219
Net financial income 10 333 3 999
Share of profit of associates 0 12
Income tax 22 083 -27 083
Profit for the period -65 524 64 831
Earnings per share
Basic earnings per share (in €) -0,64 0,68
Diluted earnings per share (in €) -0,61 0,67
Weighted average number of shares in issue 101 798 904 94 946 689
Diluted weighted average number of shares in issue 107 342 642 97 316 057
9
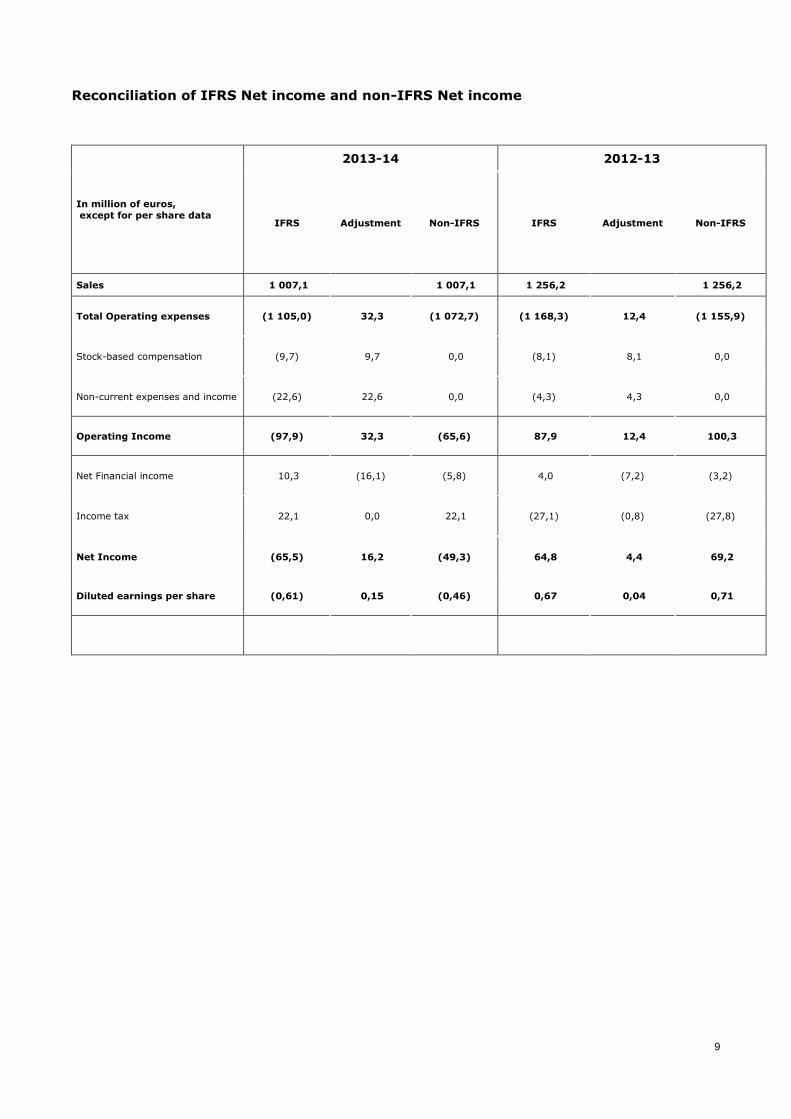
Reconciliation of IFRS Net income and non-IFRS Net income
In million of euros,
except for per share data
2013-14 2012-13
IFRS Adjustment Non-IFRS IFRS Adjustment Non-IFRS
Sales 1 007,1 1 007,1 1 256,2 1 256,2
Total Operating expenses (1 105,0) 32,3 (1 072,7) (1 168,3) 12,4 (1 155,9)
Stock-based compensation (9,7) 9,7 0,0 (8,1) 8,1 0,0
Non-current expenses and income (22,6) 22,6 0,0 (4,3) 4,3 0,0
Operating Income (97,9) 32,3 (65,6) 87,9 12,4 100,3
Net Financial income 10,3 (16,1) (5,8) 4,0 (7,2) (3,2)
Income tax 22,1 0,0 22,1 (27,1) (0,8) (27,8)
Net Income (65,5) 16,2 (49,3) 64,8 4,4 69,2
Diluted earnings per share (0,61) 0,15 (0,46) 0,67 0,04 0,71

10
Consolidated balance sheet (IFRS, audited)
ASSETS Net Net
In thousands of euros 03/31/14 03/31/13
Goodwill 138 335 145 919
Other intangible assets 598 523 547 215
Property, plant and equipment 56 740 46 489
Investments in associates 0 416
Other financial assets 3 566 3 844
Deferred tax assets 116 226 92 919
Non current assets 913 391 836 802
Inventory 21 343 17 731
Trade receivables 73 320 36 619
Other receivables 74 812 105 744
Other current financial assets 1 532 6 850
Current tax assets 16 972 15 987
Cash and cash equivalents 237 946 237 704
Current assets 425 925 420 635
Total assets 1 339 316 1 257 437
LIABILITIES AND EQUITY Net Net
In thousands of euros 03/31/14 03/31/13
Capital 8 200 7 441
Premiums 337 250 275 815
Consolidated reserves 530 123 490 140
Consolidated earnings -65 525 64 831
Total equity 810 048 838 227
Provisions 4 304 5 670
Employee benefit 3 715 2 997
Long-term borrowings 63 439 24 457
Deferred tax liabilities 40 956 49 181
Non-current liabilities 112 415 82 305
Short-term borrowings 189 323 108 759
Trade payables 93 643 75 963
Other liabilities 128 884 148 337
Current tax liabilities 5 003 3 847
Current liabilities 416 853 336 906
Total liabilities 529 268 419 211
Total liabilities and equity 1 339 316 1 257 438
11
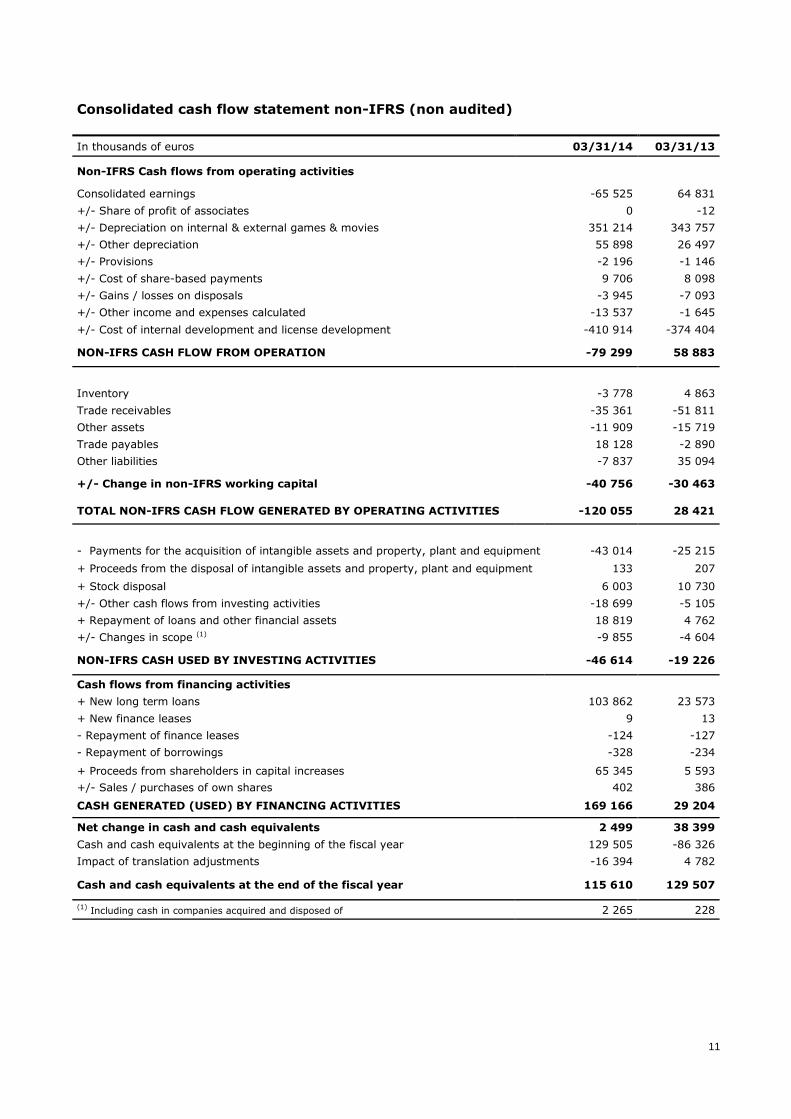
Consolidated cash flow statement non-IFRS (non audited)
In thousands of euros 03/31/14 03/31/13
Non-IFRS Cash flows from operating activities
Consolidated earnings -65 525 64 831
+/- Share of profit of associates 0 -12
+/- Depreciation on internal & external games & movies 351 214 343 757
+/- Other depreciation 55 898 26 497
+/- Provisions -2 196 -1 146
+/- Cost of share-based payments 9 706 8 098
+/- Gains / losses on disposals -3 945 -7 093
+/- Other income and expenses calculated -13 537 -1 645
+/- Cost of internal development and license development -410 914 -374 404
NON-IFRS CASH FLOW FROM OPERATION -79 299 58 883
Inventory -3 778 4 863
Trade receivables -35 361 -51 811
Other assets -11 909 -15 719
Trade payables 18 128 -2 890
Other liabilities -7 837 35 094
+/- Change in non-IFRS working capital -40 756 -30 463
TOTAL NON-IFRS CASH FLOW GENERATED BY OPERATING ACTIVITIES -120 055 28 421
- Payments for the acquisition of intangible assets and property, plant and equipment -43 014 -25 215
+ Proceeds from the disposal of intangible assets and property, plant and equipment 133 207
+ Stock disposal 6 003 10 730
+/- Other cash flows from investing activities -18 699 -5 105
+ Repayment of loans and other financial assets 18 819 4 762
+/- Changes in scope (1) -9 855 -4 604
NON-IFRS CASH USED BY INVESTING ACTIVITIES -46 614 -19 226
Cash flows from financing activities
+ New long term loans 103 862 23 573
+ New finance leases 9 13
- Repayment of finance leases -124 -127
- Repayment of borrowings -328 -234
+ Proceeds from shareholders in capital increases 65 345 5 593
+/- Sales / purchases of own shares 402 386
CASH GENERATED (USED) BY FINANCING ACTIVITIES 169 166 29 204
Net change in cash and cash equivalents 2 499 38 399
Cash and cash equivalents at the beginning of the fiscal year 129 505 -86 326
Impact of translation adjustments -16 394 4 782
Cash and cash equivalents at the end of the fiscal year 115 610 129 507
(1) Including cash in companies acquired and disposed of 2 265 228
12
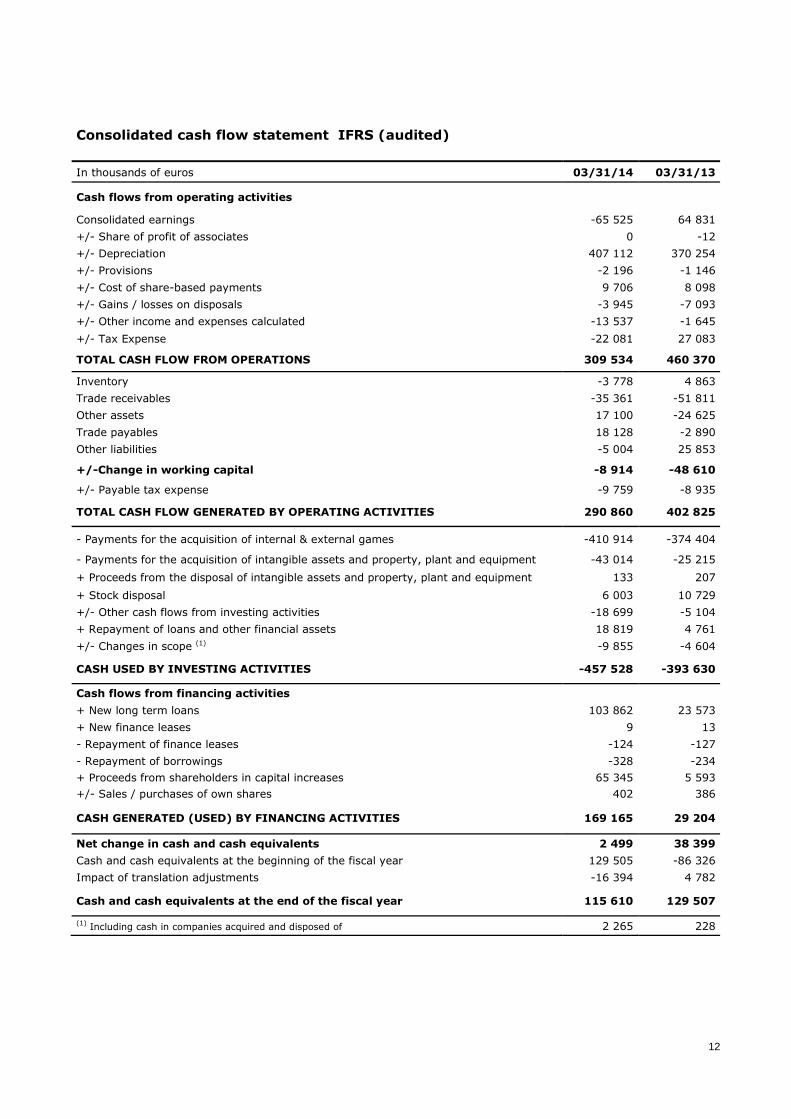
Consolidated cash flow statement IFRS (audited)
In thousands of euros 03/31/14 03/31/13
Cash flows from operating activities
Consolidated earnings -65 525 64 831
+/- Share of profit of associates 0 -12
+/- Depreciation 407 112 370 254
+/- Provisions -2 196 -1 146
+/- Cost of share-based payments 9 706 8 098
+/- Gains / losses on disposals -3 945 -7 093
+/- Other income and expenses calculated -13 537 -1 645
+/- Tax Expense -22 081 27 083
TOTAL CASH FLOW FROM OPERATIONS 309 534 460 370
Inventory -3 778 4 863
Trade receivables -35 361 -51 811
Other assets 17 100 -24 625
Trade payables 18 128 -2 890
Other liabilities -5 004 25 853
+/-Change in working capital -8 914 -48 610
+/- Payable tax expense -9 759 -8 935
TOTAL CASH FLOW GENERATED BY OPERATING ACTIVITIES 290 860 402 825
- Payments for the acquisition of internal & external games -410 914 -374 404
- Payments for the acquisition of intangible assets and property, plant and equipment -43 014 -25 215
+ Proceeds from the disposal of intangible assets and property, plant and equipment 133 207
+ Stock disposal 6 003 10 729
+/- Other cash flows from investing activities -18 699 -5 104
+ Repayment of loans and other financial assets 18 819 4 761
+/- Changes in scope (1) -9 855 -4 604
CASH USED BY INVESTING ACTIVITIES -457 528 -393 630
Cash flows from financing activities
+ New long term loans 103 862 23 573
+ New finance leases 9 13
- Repayment of finance leases -124 -127
- Repayment of borrowings -328 -234
+ Proceeds from shareholders in capital increases 65 345 5 593
+/- Sales / purchases of own shares 402 386
CASH GENERATED (USED) BY FINANCING ACTIVITIES 169 165 29 204
Net change in cash and cash equivalents 2 499 38 399
Cash and cash equivalents at the beginning of the fiscal year 129 505 -86 326
Impact of translation adjustments -16 394 4 782
Cash and cash equivalents at the end of the fiscal year 115 610 129 507
(1) Including cash in companies acquired and disposed of 2 265 228