Reporting Rates of Liquid Laundry Detergent Packet ...liquid laundry detergent packets in the mouth,...
59
24July2018 1 Reporting Rates of Liquid Laundry Detergent Packet Exposures Reported to the National Poison Data System (NPDS): Post Period Data Surveillance Kate M. Reynolds, MPH Research Projects Manager-Drug and Consumer Product Safety Rocky Mountain Poison & Drug Center, Denver Health and Hospital Authority Heather Delva-Clark, MEd Research Projects Coordinator-Drug and Consumer Product Safety Rocky Mountain Poison & Drug Center, Denver Health and Hospital Authority Rocky Mountain Poison & Drug Center 777 Bannock Street, Mail Code 0180 Denver, Colorado 80204 Report Date: 24 July 2018
Transcript of Reporting Rates of Liquid Laundry Detergent Packet ...liquid laundry detergent packets in the mouth,...

24July2018 1
Reporting Rates of Liquid Laundry Detergent Packet Exposures Reported to the National Poison Data System
(NPDS): Post Period Data Surveillance
Kate M. Reynolds, MPH Research Projects Manager-Drug and Consumer Product Safety
Rocky Mountain Poison & Drug Center, Denver Health and Hospital Authority
Heather Delva-Clark, MEd Research Projects Coordinator-Drug and Consumer Product Safety
Rocky Mountain Poison & Drug Center, Denver Health and Hospital Authority
Rocky Mountain Poison & Drug Center 777 Bannock Street, Mail Code 0180
Denver, Colorado 80204
Report Date: 24 July 2018

24July2018 3
EXECUTIVE SUMMARY
Key Findings: During the post period (01 January 2017 to 31 December 2017) of implementation of the American Society for Testing and Materials (ASTM) safety standards to reduce unintentional exposures to liquid laundry detergent packets in children, 10,796 unintentional-general exposures in children <6 years of age involving liquid laundry detergent packets were reported to the National Poison Data System (NPDS).
Most (86.4%) exposures involved children <4 years of age (32.0% in children <2 years of age, 54.4% in children 2 to <4 years of age).
Stratifications were done by level of severity to explore factors associated with clinically significant outcomes.
o 33.1% of exposures involved healthcare facility (HCF) treatment, 1.9% involved HCF admission, and 0.2% involved a severe medical outcome (major effect or death). No fatalities were reported during the post period.
The vast majority (82.3%) of exposures involved oral route of ingestion, but exposures resulting in severe medical outcomes more commonly (47.4%) reported ocular route (all exposures (21.9%)) and aspiration (with ingestion; 10.5%; all exposures 0.2%) of the liquid laundry detergent packet.
Contributing factors (scenarios) associated with exposures most commonly referred to improper storage of the liquid laundry detergent packet.
Cumulative rates and trends over time were explored using both population and sales data adjusted rates and are summarized in the following table.
Type of Exposure Rate
Cumulative Population-
Adjusted Ratea
Population-Adjusted Ratea in First and Last Quarterly Rate of the
Period
Cumulative Sales-
Adjusted Rateb
Sales-Adjusted Rateb in First and Last Four Week Interval Rate of
the Period
All Exposures
45.024
(CI 44.183, 45.882)
10.625 (CI 10.216, 11.041) to
9.516 (CI 9.130, 9.910)
2.291
(CI 2.248, 2.334)
2.029 (CI 1.884, 2.178) to
1.640 (CI 1.508, 1.777)
Healthcare Facility Treatment
14.889
(CI 14.408, 15.385)
3.517 (CI 3.283, 3.758)
to
3.072 (CI 2.854, 3.298)
0.758
(CI 0.733, 0.783)
0.695 (CI 0.611, 0.783) to
0.522 (CI 0.448, 0.600)
Healthcare Facility Admission
0.872
(CI 0.761, 0.998)
0.192 (CI 0.140, 0.251)
to
0.192 (CI 0.140, 0.251)
0.044
(CI 0.039, 0.051)
0.044 (CI 0.025, 0.069) to
0.020 (CI 0.008, 0.038)
Severe Medical Outcome
0.079
(CI 0.051, 0.124)
0.013 (CI 0.003, 0.030)
to
0.025 (CI 0.009, 0.049)
0.004
(CI 0.003, 0.006)
0.000 (CI 0.000, 0.010) to
0.009 (CI 0.002, 0.021) aRate per 100,000 US children <6 years of age and 95% Confidence Interval (CI).
bRate per 1,000,000 packets sold and 95% Confidence Interval (CI).
24July2018 4
TABLE OF CONTENTS
SIGNATURE PAGE ................................................................................................................... 2 EXECUTIVE SUMMARY ........................................................................................................... 3 TABLE OF CONTENTS ............................................................................................................. 4 BACKGROUND ......................................................................................................................... 5 OBJECTIVE ............................................................................................................................... 6 METHODS ................................................................................................................................. 6
Data Sources .......................................................................................................................... 6 Data Analysis ......................................................................................................................... 7
RESULTS .................................................................................................................................. 8 National Poison Data System (NPDS) Summary .................................................................... 8 National Poison Data System (NPDS) Fatality Summary.......................................................24 Population-Adjusted Rates Summary ....................................................................................25 Sales-Adjusted Rates Summary ............................................................................................35
SUMMARY ...............................................................................................................................49 DISCLAIMERS ..........................................................................................................................51 REFERENCES .........................................................................................................................52 APPENDICES ...........................................................................................................................53

24July2018 5
BACKGROUND
In late 2015, voluntary standards were created by the American Society for Testing and Materials (ASTM) to help reduce unintentional exposures to liquid laundry detergent packets in children. These changes included requirements for an aversive agent, opaque packaging, packaging that is difficult to open by children, warning statements about the dangers of putting liquid laundry detergent packets in the mouth, and that liquid laundry detergent packets should be kept away from children1. As with all safety interventions, it is important to measure the impact of effectiveness of such changes. An evaluation model has been proposed by comparing characteristics and rates of National Poison Data System (NPDS) exposures to liquid laundry detergent packets in the period prior to the implementation of ASTM standards (baseline) to the period after full implementation of the standards (post period). This report describes characteristics and rates of NPDS exposures reported in the post period, which represents the period after full adoption of the ASTM safety standards.

24July2018 6
OBJECTIVE
The objective of this report is to describe exposures to liquid laundry detergent packets reported to the National Poison Data System (NPDS) between 01 January 2017 and 31 December 2017 (post period) to establish a safety profile of the post period towards implementation of the voluntary ASTM standards:
1) Describe demographics, exposure characteristics, and associated outcomes of NPDS exposures to liquid laundry detergent packets.
2) Describe cumulative rates of all liquid laundry detergent packet exposures and liquid laundry detergent packet exposures associated with clinically significant outcomes.
3) Describe trends over time in rates of all liquid laundry detergent packet exposures and liquid laundry detergent packet exposures associated with clinically significant outcomes.
METHODS
Through work with the ASTM Laundry Packets Data Team, the baseline period was defined as 01 July 2012 to 30 June 2013, the transition period was defined as 01 July 2013 to 31 December 2016, and the post period was defined as 01 January 2017 to 31 December 2017. These periods were determined based on the availability of data and in relation to the period of implementation of the ASTM standards. This report will focus on the post period.
Data Sources
National Poison Data System (NPDS) The National Poison Data System (NPDS) is the data repository for the regional poison centers of the American Association of Poison Control Centers (AAPCC). AAPCC member centers offer coverage for the entire United States, providing free medical management services to both healthcare professionals and the general public. Exposure information is collected using a standardized coding system and database. These patient data are auto-uploaded in real time from the member poison centers to the NPDS. An exposure is defined as an actual or suspected contact with any substance which has been ingested, inhaled, absorbed, applied to, or injected into the body, regardless of toxicity or clinical manifestation. For the purposes of this report an exposure represents one unique case. The NPDS database consists of categorical variables, which capture patient demographics, exposure details (including exposure reason, chronicity, and products involved), medical outcome, clinical effects, therapies, and scenario information. The NPDS definitions associated with these variables are outlined in Appendix A. The NPDS was searched to identify human exposures from 01 January 2017 through 31 December 2017 to liquid laundry detergent packets. Cases that were confirmed later to be non-exposures were excluded. Exposures involving children <6 years of age with the NPDS exposure reason of unintentional-general were included. The exposure reason of unintentional-general is the reason code reserved for unintended exposures to substances not for a specific reason2. US Census Data Quarterly population counts for children <6 years of age were obtained to generate population-adjusted rates of exposures3 for the quarter corresponding to the start of the post period. The 2017 model of the US Census Bureau’s monthly postcensal resident population estimates were

24July2018 7
averaged for each quarter to generate estimates. For the cumulative population, the monthly estimates were averaged over the entire time period to generate an overall population estimate. Nielsen Sales Data Sales data reported by Nielsen through its Strategic Planner Service for the Liquid Laundry Packs category were obtained in four week intervals and used to generate sales-adjusted exposure rates. Because sales data are received in four week increments, the intervals do not align perfectly with the post period calendar dates (01 January 2017 to 31 December 2017). In order to capture the entire post period, sales-adjusted rates of exposures were calculated using exposures and sales starting with the four week interval beginning 01 January 2017 and ending with the four week interval ending 30 December 2017.
Data Analysis
National Poison Data System Summary Descriptive statistics were used to describe the variables of interest for all unintentional-general exposures in children <6 years of age. Variables described included demographics, exposure characteristics, level of healthcare facility (HCF) treatment, medical outcome, clinical effects, therapies, and scenarios (Appendix A). For this summary, related clinical effects and performed therapies were described. Additional subanalyses were performed for exposures involving clinically significant outcomes: exposures involving HCF treatment (level of HCF treatment: treated/evaluated and released, admitted to non-critical care unit, admitted to critical care unit, admitted to psychiatric care facility), exposures involving HCF admission (level of HCF treatment: admitted to non-critical care unit, admitted to critical care unit, admitted to psychiatric care facility), and exposures with severe medical outcomes (medical outcome: major effect or death). Importantly, these stratifications are not mutually exclusive as they are composite groupings of progressing levels of severity of treatment and/or medical outcome, and a single case may exist in all or just one of the stratifications. National Poison Data System Fatality Summary Fatality information for direct deaths is summarized in aggregate and on a case level. Each direct death fatality abstract was evaluated and summarized on a case-level for year, age, gender, reason for exposure, route, substances involved, relative contribution of the liquid laundry detergent packet to the fatality (Appendix B), cause rank of each substance (if applicable), autopsy results, and other relative details reported in the case record narratives.2 Cumulative and Trends Over Time Rates Summary US Census data were used to calculate population-adjusted rates of exposures per 100,000 children <6 years of age. Nielsen sales data were used to calculate reported exposure rates per 1 million units (i.e., packets) sold. Exposure rates and corresponding 95% confidence intervals were calculated utilizing a log-linear Poisson regression model. Rates were calculated both cumulatively for the entire post period and for each time point. For all rate calculations, the average of the monthly population estimates was used and the total of sales was used. For population-adjusted rates, cumulative and quarterly rates were generated corresponding to the calendar dates of the post period (01 January 2017 to 31 December 2017) in accordance with the availability of US Census data. Sales-adjusted rates were calculated cumulatively for the period of 01 January 2017 to 30 December 2017 and by four week intervals

24July2018 8
in accordance with the availability of the Nielsen sales data. All calculations and analyses were done in SAS, version 9.4 (SAS Institute, Cary, NC, USA).
RESULTS
National Poison Data System (NPDS) Summary
A total of 10,796 unintentional-general exposures involving a liquid laundry detergent packet in children <6 years of age were reported to the National Poison Data System (NPDS) from 01 January 2017 to 31 December 2017. The median age of patients was 2.0 years, with 86.4% involving a child <4 years of age. The slight majority (53.6%) of patients was male (Table 1). Stratifications were also done by the level of treatment and medical outcome involved, with 33.1% (n=3,570) of exposures involving healthcare facility (HCF) treatment, 1.9% (n=209) involving HCF admission, and 0.2% (n=19) involving a severe medical outcome (major effect or death). The median age of patients was similar regardless of level of treatment and medical outcome stratification (all exposures (2.0 years); exposures involving HCF treatment (2.0 years), exposures involving HCF admission (1.8 years); exposures with severe medical outcomes (2.0 years)). The percentage of exposures involving children <2 years of age was higher among exposures involving HCF admission (52.2%) and exposures involving severe medical outcomes (42.1%) than all exposures (32.0%) and exposures involving HCF treatment (34.8%). Exposures with severe medical outcomes were also more likely to involve male children (63.2%) compared to the other levels of treatment (all exposures (53.6%); exposures involving HCF treatment (53.2%); exposures involving HCF admission (54.1%); Table 1).

24July2018 9
Table 1. Demographics of All Unintentional-General Exposures to Liquid Laundry Detergent Packets by Level of Treatment and Severe Medical Outcomea
Characteristics All Exposuresb
(N=10,796)
Exposures Involving HCF Treatment
(N=3,570)
Exposures Involving HCF Admission
(N=209)
Exposures with Severe Medical Outcomes
(N=19)
Age
Mean (SD), years 2.3 (1.03) 2.3 (1.05) 1.9 (1.13) 2.3 (1.30)
Median, years 2.0 2.0 1.8 2.0
Age (categorical)
<2 years 3,457 (32.0%) 1,241 (34.8%) 109 (52.2%) 8 (42.1%)
2 to <4 years 5,876 (54.4%) 1,853 (51.9%) 79 (37.8%) 8 (42.1%)
4 to <6 years 1,440 (13.3%) 470 (13.2%) 21 (10.0%) 3 (15.8%)
≤5 years 23 (0.2%) 6 (0.2%) 0 (0.0%) 0 (0.0%)
Gender
Female 4,986 (46.2%) 1,666 (46.7%) 96 (45.9%) 7 (36.8%)
Male 5,783 (53.6%) 1,899 (53.2%) 113 (54.1%) 12 (63.2%)
Unknown 27 (0.3%) 5 (0.1%) 0 (0.0%) 0 (0.0%) aLevel of care and medical outcome categories are not mutually exclusive.
bAll exposures includes unintentional-general exposures in children <6 years of age.

24July2018 10
The vast majority (95.8%) of all unintentional-general exposures involving a liquid laundry detergent packet in children <6 years of age occurred at the patient’s own residence, which was similar regardless of level of treatment and medical outcome stratification (exposures involving HCF treatment (96.1%); exposures involving HCF admission (97.6%); exposures with severe medical outcomes (100.0%); Table 2). Ingestion was the most common (82.3%) route of exposure followed by ocular (21.9%) and dermal (16.7%) exposures. Exposures with severe medical outcomes were more likely to involve aspiration (with ingestion; 10.5%) than the other stratifications (all exposures (0.2%); exposures involving HCF treatment (0.4%); exposures involving HCF admission (2.4%)). A greater percentage (47.4%) of exposures involving severe medical outcomes involved an ocular route than all exposures (21.9%), exposures involving HCF treatment (33.2%), and exposures involving HCF admission (16.7%). An acute exposure of one substance was most commonly (99.8%) reported, which did not vary by level of treatment or medical outcome stratification (Table 2).

24July2018 11
Table 2. Exposure Characteristics of All Unintentional-General Exposures to Liquid Laundry Detergent Packets by Level of Treatment and Severe Medical Outcomea
Characteristics All Exposuresb
(N=10,796)
Exposures Involving HCF Treatment
(N=3,570)
Exposures Involving HCF Admission
(N=209)
Exposures with Severe Medical Outcomes
(N=19)
Exposure Site
Own Residence 10,344 (95.8%) 3,430 (96.1%) 204 (97.6%) 19 (100.0%)
Other Residence 308 (2.9%) 78 (2.2%) 4 (1.9%) 0 (0.0%)
Workplace 0 (0.0%) 0 (0.0%) 0 (0.0%) 0 (0.0%)
Health Care Facility 4 (<0.1%) 3 (0.1%) 0 (0.0%) 0 (0.0%)
School 7 (0.1%) 1 (<0.1%) 0 (0.0%) 0 (0.0%)
Other 118 (1.1%) 51 (1.4%) 1 (0.5%) 0 (0.0%)
Unknown 15 (0.1%) 7 (0.2%) 0 (0.0%) 0 (0.0%)
Route of Exposurec
Ingestion 8,881 (82.3%) 2,662 (74.6%) 189 (90.4%) 12 (63.2%)
Aspiration (with ingestion) 24 (0.2%) 15 (0.4%) 5 (2.4%) 2 (10.5%)
Inhalation/Nasal 30 (0.3%) 8 (0.2%) 1 (0.5%) 0 (0.0%)
Ocular 2,362 (21.9%) 1,186 (33.2%) 35 (16.7%) 9 (47.4%)
Dermal 1,798 (16.7%) 512 (14.3%) 23 (11.0%) 3 (15.8%)
Parenteral 0 (0.0%) 0 (0.0%) 0 (0.0%) 0 (0.0%)
Other 11 (0.1%) 6 (0.2%) 0 (0.0%) 0 (0.0%)
Unknown 6 (0.1%) 2 (0.1%) 1 (0.5%) 0 (0.0%)
Chronicity
Acute 10,770 (99.8%) 3,559 (99.7%) 208 (99.5%) 19 (100.0%)
Acute-on-chronic 18 (0.2%) 8 (0.2%) 1 (0.5%) 0 (0.0%)
Chronic 4 (<0.1%) 1 (<0.1%) 0 (0.0%) 0 (0.0%)
Unknown 4 (<0.1%) 2 (0.1%) 0 (0.0%) 0 (0.0%)
Number of Substances

24July2018 12
Characteristics All Exposuresb
(N=10,796)
Exposures Involving HCF Treatment
(N=3,570)
Exposures Involving HCF Admission
(N=209)
Exposures with Severe Medical Outcomes
(N=19)
Mean (SD) 1.0 (0.13) 1.0 (0.12) 1.0 (0.27) 1.2 (0.71)
Median 1.0 1.0 1.0 1.0 aLevel of care and medical outcome categories are not mutually exclusive.
bAll exposures includes unintentional-general exposures in children <6 years of age.
cA single exposure may involve more than one route.

24July2018 13
Slightly more than a third (37.7%) of all unintentional-general exposures involving liquid laundry detergent packets in children <6 years of age were recommended to or received HCF treatment. Of those that were recommended to or received HCF treatment (n=4,071), 82.6% were treated without being admitted, while 5.1% were admitted to a non-critical or critical care unit. No exposures involved admission to a psychiatric care facility. Of exposures that resulted in a severe medical outcome (n=19), 100.0% were recommended to or received HCF treatment and 31.6% (n=6/19) were admitted to a HCF (Table 3).

24July2018 14
Table 3. Level of Healthcare Facility (HCF) Treatment of All Unintentional-General Exposures to Liquid Laundry Detergent Packets by Level of Treatment and Severe Medical Outcomea
Characteristics All Exposuresb
(N=10,796)
Exposures Involving HCF
Treatment (N=3,570)
Exposures Involving HCF
Admission (N=209)
Exposures with Severe Medical
Outcomes (N=19)
Recommended to or Received HCF Treatment
Yes 4,071 (37.7%) 3,570 (100.0%) 209 (100.0%) 19 (100.0%)
No 6,596 (61.1%) --- --- 0 (0.0%)
Unknown 129 (1.2%) --- --- 0 (0.0%)
Level of Treatmentc
Treated/evaluated and released 3,361 (82.6%) 3,361 (94.1%) --- 13 (68.4%)
Admitted to noncritical care unit 148 (3.6%) 148 (4.1%) 148 (70.8%) 1 (5.3%)
Admitted to critical care unit 61 (1.5%) 61 (1.7%) 61 (29.2%) 5 (26.3%)
Admitted to psychiatric care facility 0 (0.0%) 0 (0.0%) 0 (0.0%) 0 (0.0%)
Patient refused referral/did not arrive at HCF 138 (3.4%) --- --- 0 (0.0%)
Patient lost to follow-up/left AMA 363 (8.9%) --- --- 0 (0.0%) aLevel of care and medical outcome categories are not mutually exclusive.
bAll exposures includes unintentional-general exposures in children <6 years of age.
cDemoninator is the number of exposures that were recommended to or received healthcare facility treatment.

24July2018 15
The majority (69.1%) of all unintentional-general exposures involving a liquid laundry detergent packet in children <6 years of age were followed to a known outcome. Forty-three percent (42.6%) of exposures involved a minor effect, followed by no or unrelated effect (21.5%), moderate effect (4.8%), and major effect (0.2%; Table 4). No deaths were reported during this period. Thirty-one percent (30.9%) of all unintentional-general exposures involving a liquid laundry detergent packet in children <6 years of age were not followed to a known outcome. Five percent (5.3%) of exposures were unable to be followed but were determined to be potentially toxic, 2.3% were not followed due to being non-toxic, and 23.3% were not followed due to minimal clinical effects expected (Table 4).

24July2018 16
Table 4. Medical Outcome of All Unintentional-General Exposures to Liquid Laundry Detergent Packets by Level of Treatment and Severe Medical Outcomea
Medical Outcome All Exposuresb
(N=10,796)
Exposures Involving HCF
Treatment (N=3,570)
Exposures Involving HCF
Admission (N=209)
Exposures with Severe Medical
Outcomes (N=19)
Followed to a Known Outcome 7,458 (69.1%) 3,277 (91.8%) 201 (96.2%) 19 (100.0%)
Death 0 (0.0%) 0 (0.0%) 0 (0.0%) 0 (0.0%)
Major Effect 19 (0.2%) 19 (0.5%) 6 (2.9%) 19 (100.0%)
Moderate Effect 515 (4.8%) 451 (12.6%) 58 (27.8%) 0 (0.0%)
Minor Effect 4,602 (42.6%) 2,315 (64.8%) 123 (58.9%) 0 (0.0%)
No Effect or Unrelated Effect 2,322 (21.5%) 492 (13.8%) 14 (6.7%) 0 (0.0%)
Not Followed to Known Outcome 3,338 (30.9%) 293 (8.2%) 8 (3.8%) 0 (0.0%)
Unable to follow, potentially toxic 568 (5.3%) 59 (1.7%) 4 (1.9%) 0 (0.0%)
Not followed, non-toxic 252 (2.3%) 7 (0.2%) 0 (0.0%) 0 (0.0%)
Not followed, minimal clinical effects expected 2,518 (23.3%) 227 (6.4%) 4 (1.9%) 0 (0.0%) aLevel of care and medical outcome categories are not mutually exclusive.
bAll exposures includes unintentional-general exposures in children <6 years of age.

24July2018 17
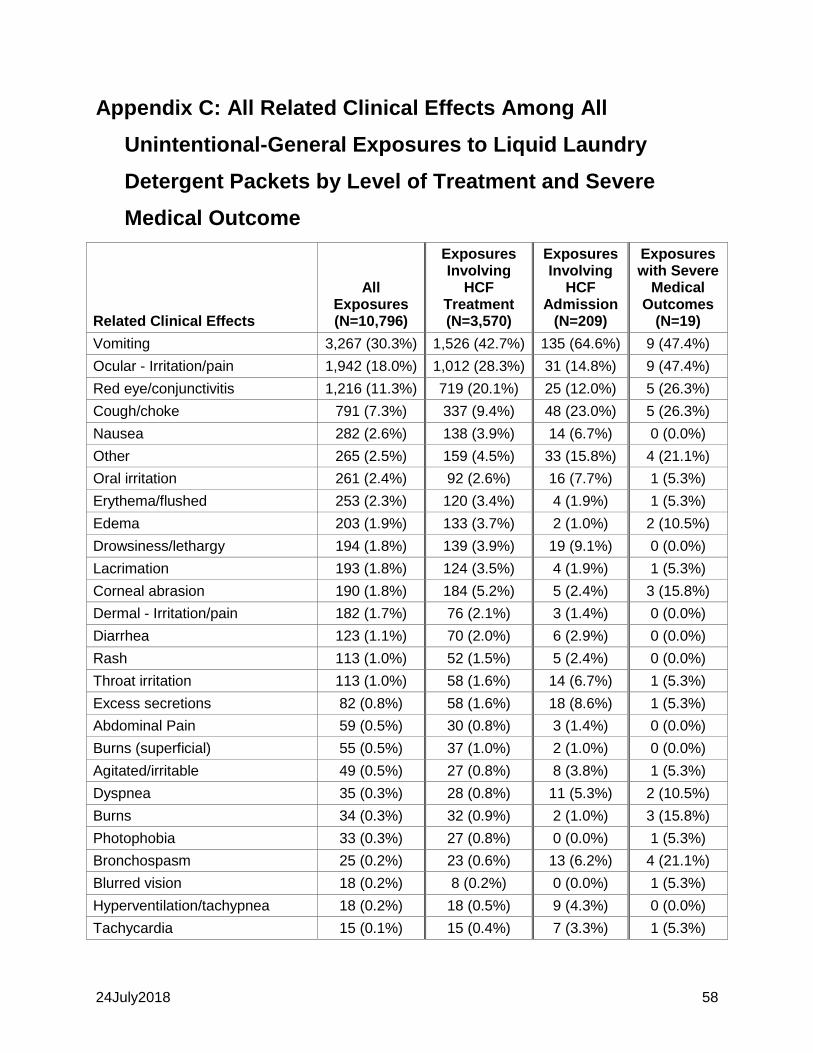
A total of 61 unique clinical effects were reported, with the 30 most common related clinical effects presented in Table 5 (full listing of related clinical effects presented in Appendix C). Vomiting was the most commonly reported clinical effect among all levels of treatment and medical outcome stratifications (all exposures (30.3%); exposures involving HCF treatment (42.7%); exposures involving HCF admission (64.6%); exposures with severe medical outcomes (47.4%)). Ocular irritation and/or pain was also commonly (47.4%) reported among exposures involving severe medical outcomes (Table 5).
24July2018 18
Table 5. Top 30 Related Clinical Effects Among All Unintentional-General Exposures to Liquid Laundry Detergent Packets by Level of Treatment and Severe Medical Outcomea
Related Clinical Effectsb All Exposuresc
(N=10,796)
Exposures Involving HCF Treatment
(N=3,570)
Exposures Involving HCF Admission
(N=209)
Exposures with Severe Medical
Outcomes
(N=19)
Vomiting 3,267 (30.3%) 1,526 (42.7%) 135 (64.6%) 9 (47.4%)
Ocular - Irritation/pain 1,942 (18.0%) 1,012 (28.3%) 31 (14.8%) 9 (47.4%)
Red eye/conjunctivitis 1,216 (11.3%) 719 (20.1%) 25 (12.0%) 5 (26.3%)
Cough/choke 791 (7.3%) 337 (9.4%) 48 (23.0%) 5 (26.3%)
Nausea 282 (2.6%) 138 (3.9%) 14 (6.7%) 0 (0.0%)
Other 265 (2.5%) 159 (4.5%) 33 (15.8%) 4 (21.1%)
Oral irritation 261 (2.4%) 92 (2.6%) 16 (7.7%) 1 (5.3%)
Erythema/flushed 253 (2.3%) 120 (3.4%) 4 (1.9%) 1 (5.3%)
Edema 203 (1.9%) 133 (3.7%) 2 (1.0%) 2 (10.5%)
Drowsiness/lethargy 194 (1.8%) 139 (3.9%) 19 (9.1%) 0 (0.0%)
Lacrimation 193 (1.8%) 124 (3.5%) 4 (1.9%) 1 (5.3%)
Corneal abrasion 190 (1.8%) 184 (5.2%) 5 (2.4%) 3 (15.8%)
Dermal - Irritation/pain 182 (1.7%) 76 (2.1%) 3 (1.4%) 0 (0.0%)
Diarrhea 123 (1.1%) 70 (2.0%) 6 (2.9%) 0 (0.0%)
Rash 113 (1.0%) 52 (1.5%) 5 (2.4%) 0 (0.0%)
Throat irritation 113 (1.0%) 58 (1.6%) 14 (6.7%) 1 (5.3%)
Excess secretions 82 (0.8%) 58 (1.6%) 18 (8.6%) 1 (5.3%)
Abdominal Pain 59 (0.5%) 30 (0.8%) 3 (1.4%) 0 (0.0%)
Burns (superficial) 55 (0.5%) 37 (1.0%) 2 (1.0%) 0 (0.0%)
Agitated/irritable 49 (0.5%) 27 (0.8%) 8 (3.8%) 1 (5.3%)
Dyspnea 35 (0.3%) 28 (0.8%) 11 (5.3%) 2 (10.5%)
Burns 34 (0.3%) 32 (0.9%) 2 (1.0%) 3 (15.8%)

24July2018 19
Related Clinical Effectsb All Exposuresc
(N=10,796)
Exposures Involving HCF Treatment
(N=3,570)
Exposures Involving HCF Admission
(N=209)
Exposures with Severe Medical
Outcomes
(N=19)
Photophobia 33 (0.3%) 27 (0.8%) 0 (0.0%) 1 (5.3%)
Bronchospasm 25 (0.2%) 23 (0.6%) 13 (6.2%) 4 (21.1%)
Blurred vision 18 (0.2%) 8 (0.2%) 0 (0.0%) 1 (5.3%)
Hyperventilation/tachypnea 18 (0.2%) 18 (0.5%) 9 (4.3%) 0 (0.0%)
Tachycardia 15 (0.1%) 15 (0.4%) 7 (3.3%) 1 (5.3%)
Burns 2 - 3 degree 14 (0.1%) 9 (0.3%) 0 (0.0%) 0 (0.0%)
X-ray findings (+) 13 (0.1%) 13 (0.4%) 7 (3.3%) 1 (5.3%)
Oral burns (including lips) 10 (0.1%) 9 (0.3%) 3 (1.4%) 0 (0.0%) aLevel of care and medical outcome categories are not mutually exclusive.
bMore than one related clinical effect can be reported per exposure.
cAll exposures included unintentional-general exposures in children <6 years of age.
24July2018 20
Dilute/irrigate/wash (78.5%) and food/snack (11.3%) were the most common therapies performed among all unintentional-general exposures involving liquid laundry detergent packets in children <6 years of age. Dilute/irrigate/wash was also the most common therapy performed in exposures involving HCF treatment (76.0%), HCF admission (66.0%), and severe medical outcomes (63.2%). Fluids, IV (20.6%) and other (unspecified; 17.7%) were also commonly performed therapies among exposures involving HCF admission. Oxygen (31.6%), sedation (other; 31.6%), intubation (31.6%), and ventilator (31.6%) were the next most commonly performed therapies following dilute/irrigate/wash among exposures resulting in severe medical outcomes (Table 6).

24July2018 21
Table 6. Therapies Performed Among All Unintentional-General Exposures to Liquid Laundry Detergent Packets by Level of Treatment and Severe Medical Outcomea
Performed Therapiesb All Exposuresc
(N=10,796)
Exposures Involving HCF Treatment
(N=3,570)
Exposures Involving HCF Admission
(N=209)
Exposures with Severe Medical Outcomes
(N=19)
Dilute/irrigate/wash 8,474 (78.5%) 2,714 (76.0%) 138 (66.0%) 12 (63.2%)
Food/snack 1,218 (11.3%) 291 (8.2%) 16 (7.7%) 0 (0.0%)
Other 447 (4.1%) 235 (6.6%) 37 (17.7%) 2 (10.5%)
Antibiotics 259 (2.4%) 243 (6.8%) 6 (2.9%) 4 (21.1%)
Other emetic 174 (1.6%) 70 (2.0%) 10 (4.8%) 0 (0.0%)
Antiemetics 86 (0.8%) 83 (2.3%) 10 (4.8%) 2 (10.5%)
Fluids, IV 68 (0.6%) 66 (1.8%) 43 (20.6%) 3 (15.8%)
Steroids 50 (0.5%) 42 (1.2%) 18 (8.6%) 5 (26.3%)
Calcium 30 (0.3%) 3 (0.1%) 0 (0.0%) 0 (0.0%)
Antihistamines 24 (0.2%) 15 (0.4%) 2 (1.0%) 1 (5.3%)
Bronchodilators 23 (0.2%) 23 (0.6%) 12 (5.7%) 1 (5.3%)
Oxygen 18 (0.2%) 18 (0.5%) 13 (6.2%) 6 (31.6%)
Sedation (other) 16 (0.1%) 15 (0.4%) 5 (2.4%) 6 (31.6%)
Benzodiazepines 11 (0.1%) 11 (0.3%) 4 (1.9%) 4 (21.1%)
Intubation 7 (0.1%) 7 (0.2%) 6 (2.9%) 6 (31.6%)
Ventilator 7 (0.1%) 7 (0.2%) 6 (2.9%) 6 (31.6%)
Atropine 4 (<0.1%) 4 (0.1%) 1 (0.5%) 1 (5.3%)
Charcoal, single dose 4 (<0.1%) 0 (0.0%) 0 (0.0%) 0 (0.0%)
Fresh air 2 (<0.1%) 1 (<0.1%) 0 (0.0%) 0 (0.0%)
Fomepizole 1 (<0.1%) 1 (<0.1%) 1 (0.5%) 0 (0.0%)
NAC, PO 1 (<0.1%) 1 (<0.1%) 0 (0.0%) 0 (0.0%)
Naloxone 1 (<0.1%) 1 (<0.1%) 1 (0.5%) 0 (0.0%) aLevel of care and medical outcome categories are not mutually exclusive.
bMore than one performed therapy can be reported per exposure.
cAll exposures included unintentional-general exposures in patients <6 years of age.

24July2018 22
Table 7 describes the scenarios, or factors that contributed to the event, among unintentional-general exposures involving liquid laundry detergent packets in children <6 years of age. Seven percent (6.7%) of all exposures reported one or more scenarios, with the majority involving stored within sight of child (40.5%), followed by other (unspecified; 25.6%), product temporarily open because it was in use (12.4%), and product stored inappropriately (8.1%). A slightly higher percentage (10.5%) of exposures involving severe medical outcomes reported one or more scenarios than the other level of treatment and medical outcome stratifications (all exposures (6.7%); exposures involving HCF treatment (7.2%); exposures involving HCF admission (8.6%); Table 7).

24July2018 23
Table 7. National Poison Data System (NPDS) Scenario of All Unintentional-General Exposures to Liquid Laundry Detergent Packets by Level of Treatment and Severe Medical Outcomea
Scenarios
All Exposuresb (N=10,796)
Exposures Involving HCF
Treatment (N=3,570)
Exposures Involving HCF
Admission (N=209)
Exposures with Severe Medical
Outcomes (N=19)
Was a Scenario Reported?
No 10,077 (93.3%) 3,312 (92.8%) 191 (91.4%) 17 (89.5%)
Yes 719 (6.7%) 258 (7.2%) 18 (8.6%) 2 (10.5%)
Scenarioc
Stored within sight of child 291 (40.5%) 74 (28.7%) 2 (11.1%) 0 (0.0%)
Other 184 (25.6%) 86 (33.3%) 3 (16.7%) 0 (0.0%)
Product temporarily open because product was in use 89 (12.4%) 24 (9.3%) 2 (11.1%) 0 (0.0%)
Product stored inappropriately (other than above) 58 (8.1%) 29 (11.2%) 4 (22.2%) 1 (50.0%)
Product always left out 36 (5.0%) 16 (6.2%) 3 (16.7%) 1 (50.0%)
Stored in unlocked, low cabinet in kitchen or bathroom 21 (2.9%) 6 (2.3%) 2 (11.1%) 0 (0.0%)
Child caused exposure (gave to sibling or pet, etc) 20 (2.8%) 11 (4.3%) 2 (11.1%) 0 (0.0%)
Patient thought product or pill was a food 12 (1.7%) 5 (1.9%) 0 (0.0%) 0 (0.0%)
Scenario unknown (not allowed with other options) 7 (1.0%) 7 (2.7%) 0 (0.0%) 0 (0.0%)
Child or pet accessed medication/product from purse 4 (0.6%) 0 (0.0%) 0 (0.0%) 0 (0.0%)
Exposure occurred during routine product use 3 (0.4%) 2 (0.8%) 0 (0.0%) 0 (0.0%)
Container transfer involved 2 (0.3%) 0 (0.0%) 0 (0.0%) 0 (0.0%)
CRC present, opened by patient 1 (0.1%) 0 (0.0%) 0 (0.0%) 0 (0.0%)
Inadvertently took/given medication twice 1 (0.1%) 1 (0.4%) 0 (0.0%) 0 (0.0%)
Other pesticide exposure 1 (0.1%) 0 (0.0%) 0 (0.0%) 0 (0.0%)
Pest control operator applied product 1 (0.1%) 0 (0.0%) 0 (0.0%) 0 (0.0%)
Unknown CRC Status 1 (0.1%) 0 (0.0%) 0 (0.0%) 0 (0.0%) aLevel of care and medical outcome categories are not mutually exclusive.
bAll exposures includes unintentional-general exposures in children <6 years of age.
cA single exposure may involve more than one scenario.

24July2018 24
National Poison Data System (NPDS) Fatality Summary
No fatalities involving an unintentional-general exposure to a liquid laundry detergent packet in a child <6 years of age were reported during the post period (01 January 2017 to 31 December 2017).

24July2018 25
Population-Adjusted Rates Summary
Cumulative Population-Adjusted Rates of All Exposures and Exposures with Clinically Significant Outcomes The population-adjusted rate of reported unintentional-general exposures involving a liquid laundry detergent packet from 01 January 2017 to 31 December 2017 was 45.024 exposures per 100,000 US children <6 years of age (CI 44.183, 45.882; Table 8). This equates to one exposure per every 2,222 US children <6 years of age.
Table 8. Cumulative Population-Adjusted Rates of All Exposures
Numerator/Denominator Count Cumulative Rate of All Exposures
per 100,000 Children <6 Years of Age (95% CI)
All Exposures 10,796 45.024 (44.183, 45.882)
Total Population 23,978,215
The population-adjusted rate of reported exposures to a liquid laundry detergent packet involving HCF treatment during the post period was 14.889 per 100,000 US children <6 years of age (CI 14.408, 15.385; Table 9). This equates to one HCF treatment per every 6,717 US children <6 years of age. The population-adjusted rate of reported exposures to a liquid laundry detergent packet involving HCF admission during the post period was 0.872 per 100,000 US children <6 years of age (CI 0.761, 0.998; Table 10). This equates to one HCF admission per every 114,679 US children <6 years of age. The population-adjusted rate of reported exposures to a liquid laundry detergent packet involving severe medical outcomes during the post period was 0.079 per 100,000 US children <6 years of age (CI 0.051, 0.124; Table 11). This equates to one severe medical outcome per every 1,265,823 US children <6 years of age.
Table 9. Cumulative Population-Adjusted Rates of Exposures Involving HCF Treatment
Numerator/Denominator Count Cumulative Rate of Exposures
Involving HCF Treatment per 100,000 Children <6 Years of Age (95% CI)
Exposures Involving HCF Treatment 3,570 14.889 (14.408, 15.385)
Total Population 23,978,215
Table 10. Cumulative Population-Adjusted Rates of Exposures Involving HCF Admission
Numerator/Denominator Count Cumulative Rate of Exposures
Involving HCF Admission per 100,000 Children <6 Years of Age (95% CI)
Exposures Involving HCF Admission 209 0.872 (0.761, 0.998)
Total Population 23,978,215

24July2018 26
Table 11. Cumulative Population-Adjusted Rates of Exposures Involving Severe Medical Outcomes
Numerator/Denominator Count
Cumulative Rate of Exposures with Severe Medical Outcomes per
100,000 Children <6 Years of Age (95% CI)
Exposures with Severe Medical Outcomes
19 0.079 (0.051, 0.124)
Total Population 23,978,215
Population-Adjusted Rates of All Exposures Over Time Consistent with the seasonality observed in previous reports, unintentional-general exposures involving a liquid laundry detergent packet in children <6 years of age during the post period were reported with decreased frequency in the fall months (4th quarter) and a peak in the summer months (2nd quarter). During the post period, the total population of US children <6 years of age remained consistent (Table 12; Figure 1). The population-adjusted rate of reported unintentional-general exposures involving a liquid laundry detergent packet in children <6 years of age increased from a rate of 10.625 exposures per 100,000 US children <6 years of age (CI 10.216, 11.041) in 1st quarter 2017 to a peak rate of 12.873 exposures per 100,000 US children <6 years of age (CI 12.423,13.331) in 2nd quarter 2017, then decreased to a low of 9.516 exposures per 100,000 US children <6 years of age (CI 9.130, 9.910) in 4th quarter 2017 (Table 12; Figure 2). Table 12. Population-Adjusted Rates of All Exposures by Quarter (01 January 2017 to 31 December 2017)
Quarter Exposure
Count
Total Population
Count
Rates of All Exposures per 100,000 Children <6 Years of
Age (95% CI)
2017Q1
(01 January 2017 to 31 March 2017) 2,547 23,972,176 10.625 (10.216, 11.041)
2017Q2
(01 April 2017 to 30 June 2017) 3,086 23,972,540 12.873 (12.423, 13.331)
2017Q3
01 July 2017 to 30 September 2017) 2,880 23,977,281 12.011 (11.577, 12.454)
2017Q4
(01 October 2017 to 31 December 2017) 2,283 23,990,865 9.516 (9.130, 9.910)

24July2018 27
Figure 1. All Exposures and Population Counts by Quarter (01 January 2017 to 31 December 2017)
2017Q1 2017Q2 2017Q3 2017Q4
Year-Quarter
0
500
1,000
1,500
2,000
2,500
3,000
3,500
4,000
Ex
po
su
res
0
5,000,000
10,000,000
15,000,000
20,000,000
25,000,000
30,000,000
Po
pu
lati
on
PopulationExposures
24July2018 28
Figure 2. Population-Adjusted Rates of All Exposures by Quarter (01 January 2017 to 31 December 2017)
2017Q1 2017Q2 2017Q3 2017Q4
Year-Quarter
0
5
10
15
Ex
po
su
re R
ate
pe
r 1
00
,00
0 C
hild
ren
<6
Ye
ars
of
Ag
e
Exposure Rate per 100,000 Children <6 Years of Age (95% CI)
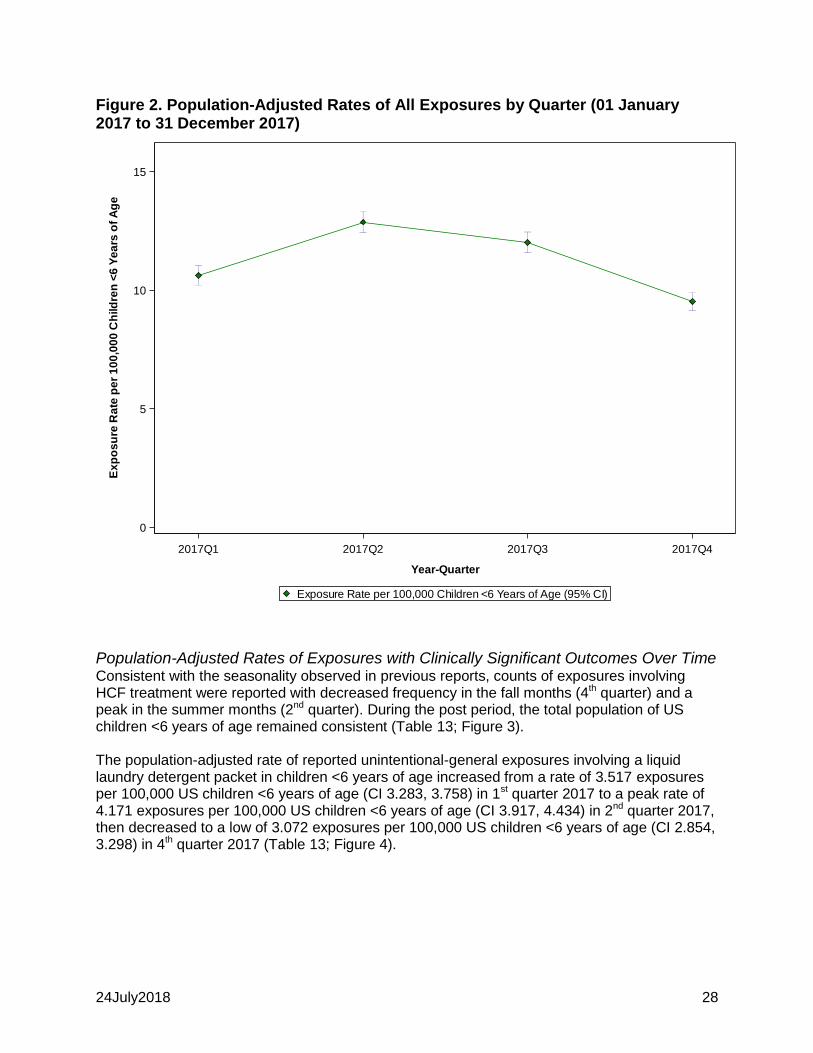
Population-Adjusted Rates of Exposures with Clinically Significant Outcomes Over Time Consistent with the seasonality observed in previous reports, counts of exposures involving HCF treatment were reported with decreased frequency in the fall months (4th quarter) and a peak in the summer months (2nd quarter). During the post period, the total population of US children <6 years of age remained consistent (Table 13; Figure 3). The population-adjusted rate of reported unintentional-general exposures involving a liquid laundry detergent packet in children <6 years of age increased from a rate of 3.517 exposures per 100,000 US children <6 years of age (CI 3.283, 3.758) in 1st quarter 2017 to a peak rate of 4.171 exposures per 100,000 US children <6 years of age (CI 3.917, 4.434) in 2nd quarter 2017, then decreased to a low of 3.072 exposures per 100,000 US children <6 years of age (CI 2.854, 3.298) in 4th quarter 2017 (Table 13; Figure 4).

24July2018 29
Table 13. Population-Adjusted Rates of Exposures Involving Healthcare Facility Treatment by Quarter (01 January 2017 to 31 December 2017)
Quarter Exposure
Count
Total Population
Count
Rates of All Exposures Involving HCF
Treatment per 100,000 Children <6 Years of
Age (95% CI)
2017Q1
(01 January 2017 to 31 March 2017) 843 23,972,176 3.517 (3.283, 3.758)
2017Q2
(01 April 2017 to 30 June 2017) 1,000 23,972,540 4.171 (3.917, 4.434)
2017Q3
01 July 2017 to 30 September 2017) 990 23,977,281 4.129 (3.876, 4.390)
2017Q4
(01 October 2017 to 31 December 2017) 737 23,990,865 3.072 (2.854, 3.298)
Figure 3. Exposures Involving Healthcare Facility Treatment and Population Counts by Quarter (01 January 2017 to 31 December 2017)
2017Q1 2017Q2 2017Q3 2017Q4
Year-Quarter
0
250
500
750
1,000
1,250
1,500
1,750
Ex
po
su
res
0
5,000,000
10,000,000
15,000,000
20,000,000
25,000,000
30,000,000
Po
pu
lati
on
PopulationExposures

24July2018 30
Figure 4. Population-Adjusted Rates of Exposures Involving Healthcare Facility Treatment by Quarter (01 January 2017 to 31 December 2017)
2017Q1 2017Q2 2017Q3 2017Q4
Year-Quarter
0
1
2
3
4
5
Ex
po
su
re R
ate
pe
r 1
00
,00
0 C
hild
ren
<6
Ye
ars
of
Ag
e
Exposure Rate per 100,000 Children <6 Years of Age (95% CI)
Consistent with the seasonality observed in previous reports, counts of exposures involving HCF admission were reported with decreased frequency in the fall months (4th quarter). During the post period, the total population of US children <6 years of age remained consistent (Table 14; Figure 5). The population-adjusted rate of reported unintentional-general exposures involving a liquid laundry detergent packet in children <6 years of age increased from a rate of 0.192 exposures per 100,000 US children <6 years of age (CI 0.140, 0.251) in 1st quarter 2017 to a peak rate of 0.254 per 100,000 US children <6 years of age (CI 0.195, 0.322) in 3rd quarter 2017, then decreased to 0.192 per 100,000 US children <6 years of age (CI 0.140, 0.251) in 4th quarter 2017 (Table 14; Figure 6).

24July2018 31
Table 14. Population-Adjusted Rates of Exposures Involving Healthcare Facility Admission by Quarter (01 January 2017 to 31 December 2017)
Quarter Exposure
Count
Total Population
Count
Rates of All Exposures Involving HCF
Admission per 100,000 Children <6 Years of
Age (95% CI)
2017Q1
(01 January 2017 to 31 March 2017) 46 23,972,176 0.192 (0.140, 0.251)
2017Q2
(01 April 2017 to 30 June 2017) 56 23,972,540 0.234 (0.176, 0.299)
2017Q3
01 July 2017 to 30 September 2017) 61 23,977,281 0.254 (0.195, 0.322)
2017Q4
(01 October 2017 to 31 December 2017) 46 23,990,865 0.192 (0.140, 0.251)
Figure 5. Exposures Involving Healthcare Facility Admission and Population Counts by Quarter (01 January 2017 to 31 December 2017)
2017Q1 2017Q2 2017Q3 2017Q4
Year-Quarter
0
50
100
150
200
Ex
po
su
res
0
5,000,000
10,000,000
15,000,000
20,000,000
25,000,000
30,000,000
Po
pu
lati
on
PopulationExposures

24July2018 32
Figure 6. Population-Adjusted Rates of Exposures Involving Healthcare Facility Admission by Quarter (01 January 2017 to 31 December 2017)
2017Q1 2017Q2 2017Q3 2017Q4
Year-Quarter
0.0
0.1
0.2
0.3
0.4
Ex
po
su
re R
ate
pe
r 1
00
,00
0 C
hild
ren
<6
Ye
ars
of
Ag
e
Exposure Rate per 100,000 Children <6 Years of Age (95% CI)
Over time, counts of exposures involving severe medical outcomes were reported infrequently (range 3 to 6 exposures) and were reported relatively consistently with no apparent seasonal trend. During the post period the total population of US children <6 years of age remained consistent (Table 15; Figure 7). The population-adjusted rate of reported unintentional-general exposures involving a liquid laundry detergent packet in children <6 years of age steadily increased from a rate of 0.013 per 100,000 US children <6 years of age (CI 0.003, 0.030) in 1st quarter 2017 to a peak rate of 0.025 per 100,000 US children <6 years of age (CI 0.009, 0.049) in 4th quarter 2017 (Table 15; Figure 8).

24July2018 33
Table 15. Population-Adjusted Exposure Rates Resulting in Severe Medical Outcomes by Quarter (01 January 2017 to 31 December 2017)
Quarter Exposure
Count
Total Population
Count
Rates of All Exposures Resulting in Severe
Medical Outcomes per 100,000 Children <6
Years of Age (95% CI)
2017Q1
(01 January 2017 to 31 March 2017) 3 23,972,176 0.013 (0.003, 0.030)
2017Q2
(01 April 2017 to 30 June 2017) 5 23,972,540 0.021 (0.007, 0.043)
2017Q3
01 July 2017 to 30 September 2017) 5 23,977,281 0.021 (0.007, 0.043)
2017Q4
(01 October 2017 to 31 December 2017) 6 23,990,865 0.025 (0.009, 0.049)
Figure 7. Exposures Resulting in Severe Medical Outcomes and Population Counts by Quarter (01 January 2017 to 31 December 2017)
2017Q1 2017Q2 2017Q3 2017Q4
Year-Quarter
0
5
10
15
20
25
30
Ex
po
su
res
0
5,000,000
10,000,000
15,000,000
20,000,000
25,000,000
30,000,000
Po
pu
lati
on
PopulationExposures

24July2018 34
Figure 8. Population-Adjusted Rates of Exposures Resulting in Severe Medical Outcomes by Quarter (01 January 2017 to 31 December 2017)
2017Q1 2017Q2 2017Q3 2017Q4
Year-Quarter
0.00
0.01
0.02
0.03
0.04
0.05
0.06
Ex
po
su
re R
ate
pe
r 1
00
,00
0 C
hild
ren
<6
Ye
ars
of
Ag
e
Exposure Rate per 100,000 Children <6 Years of Age (95% CI)

24July2018 35
Sales-Adjusted Rates Summary
Cumulative Sales-Adjusted Rates of All Exposures and Exposures with Clinically Significant Outcomes Sales-adjusted rates were calculated using the four week interval beginning 01 January 2017 to the four week interval ending 30 December 2017 based on sales data availability. The sales-adjusted rate of reported exposures involving a liquid laundry detergent packet for the post period was 2.291 per 1 million units sold (CI 2.248, 2.334; Table 16). This equates to one exposure per 0.436 million units (i.e., packets) sold.
Table 16. Cumulative Sales-Adjusted Rates of All Exposures
Numerator/Denominator Count Cumulative Rate of All Exposures
per 1,000,000 Packets Sold (95% CI)
All Exposures 10,780 2.291 (2.248, 2.334)
Total Sales 4,705,858,502
The sales-adjusted rate of reported exposures to a liquid laundry detergent packet involving HCF treatment during the post period was 0.758 per 1 million units sold (CI 0.733, 0.783; Table 17). This equates to one HCF treatment per every 1.319 million units (i.e., packets) sold. The sales-adjusted rate of reported exposures to a liquid laundry detergent packet involving HCF admission during the post period was 0.044 per 1 million units sold (CI 0.039, 0.051; Table 18). This equates to one HCF admission per 22.727 million units (i.e., packets) sold. The sales-adjusted rate of reported exposures to a liquid laundry detergent packet involving severe medical outcomes during the post period was 0.004 per 1 million units sold (CI 0.003, 0.006; Table 19). This equates to one severe medical outcome per 250.0 million units (i.e., packets) sold.
Table 17. Cumulative Sales-Adjusted Rates of Exposures Involving Healthcare Facility Treatment
Numerator/Denominator Count Cumulative Rate of Exposures Involving HCF Treatment per
1,000,000 Packets Sold (95% CI)
Exposures Involving HCF Treatment 3,565 0.758 (0.733, 0.783)
Total Sales 4,705,858,502
Table 18. Cumulative Sales-Adjusted Rates of Exposures Involving Healthcare Facility Admission
Numerator/Denominator Count Cumulative Rate of Exposures Involving HCF Admission per
1,000,000 Packets Sold (95% CI)
Exposures Involving HCF Admission 209 0.044 (0.039, 0.051)
Total Sales 4,705,858,502

24July2018 36
Table 19. Cumulative Sales-Adjusted Rates of Exposures with Severe Medical Outcomes
Numerator/Denominator Count Cumulative Rate of Exposures with
Severe Medical Outcomes per 1,000,000 Packets Sold (95% CI)
Exposures with Severe Medical Outcomes
19 0.004 (0.003, 0.006)
Total Sales 4,705,858,502
Sales-Adjusted Rates of All Exposures Over Time When examined by four week intervals corresponding to sales periods, counts of unintentional-general exposures involving a liquid laundry detergent packet in children <6 years of age increased from January 2017 through June 2017 followed by a decrease through December 2017. During the same time period the total sales fluctuated slightly, with no apparent increase or decrease over time (Table 20; Figure 9). The sales-adjusted rate of all reported unintentional-general exposures involving liquid laundry detergent packets in children <6 years of age increased gradually from a rate of 2.029 per 1 million units sold (CI 1.884, 2.178) in January 2017 to a peak of 2.739 per 1 million units sold (CI 2.573, 2.911) in June 2017, then gradually decreased to a rate of 1.640 per 1 million units sold (CI 1.508, 1.777) in December 2017 (Table 20; Figure 10).

24July2018 37
Table 20. Sales-Adjusted Rates of All Exposures by Four Week Interval (01 January 2017 to 30 December 2017)
Four Week Interval End Date Exposure
Count
Total Packets
Sales Count
Rates of All Exposures per
1,000,000 Packets Sold (95% CI)
01 January 2017 to 28 January 2017 730 359,862,022 2.029 (1.884, 2.178)
29 January 2017 to 25 February 2017 798 386,913,157 2.062 (1.922, 2.208)
26 February 2017 to 25 March 2017 821 360,794,539 2.276 (2.123, 2.434)
26 March 2017 to 22 April 2017 858 371,856,361 2.307 (2.156, 2.464)
23 April 2017 to 20 May 2017 923 351,578,519 2.625 (2.459, 2.797)
21 May 2017 to 17 June 2017 1,011 369,080,801 2.739 (2.573, 2.911)
18 June 2017 to 15 July 2017 981 365,486,827 2.684 (2.519, 2.855)
16 July 2017 to 12 August 2017 841 360,532,691 2.333 (2.178, 2.493)
13 August 2017 to 09 September 2017 880 383,751,886 2.293 (2.144, 2.447)
10 September 2017 to 07 October 2017 878 356,237,506 2.465 (2.304, 2.630)
08 October 2017 to 04 November 2017 784 347,358,978 2.257 (2.102, 2.418)
05 November 2017 to 02 December 2017 706 345,461,141 2.044 (1.896, 2.197)
03 December 2017 to 30 December 2017 569 346,944,075 1.640 (1.508, 1.777)

24July2018 38
Figure 9. All Exposures and Sales Count by Four Week Interval (01 January 2017 to 30 December 2017)
Jan Feb Mar Apr May Jun Jul Aug Sep Oct Nov Dec Jan
2017 2018
4-Week End Date
0
250
500
750
1,000
1,250
Ex
po
su
res
0
100,000,000
200,000,000
300,000,000
400,000,000
Pa
ck
et
Sa
les
Packet SalesExposures

24July2018 39
Figure 10. Sales-Adjusted Rates of All Exposures by Four Week Interval (01 January 2017 to 30 December 2017)
Jan Feb Mar Apr May Jun Jul Aug Sep Oct Nov Dec Jan
2017 2018
4-Week End Date
0
1
2
3
Ex
po
su
re R
ate
pe
r 1
,00
0,0
00
Pa
ck
ets
Exposure Rate per 1,000,000 Packets (95% CI)
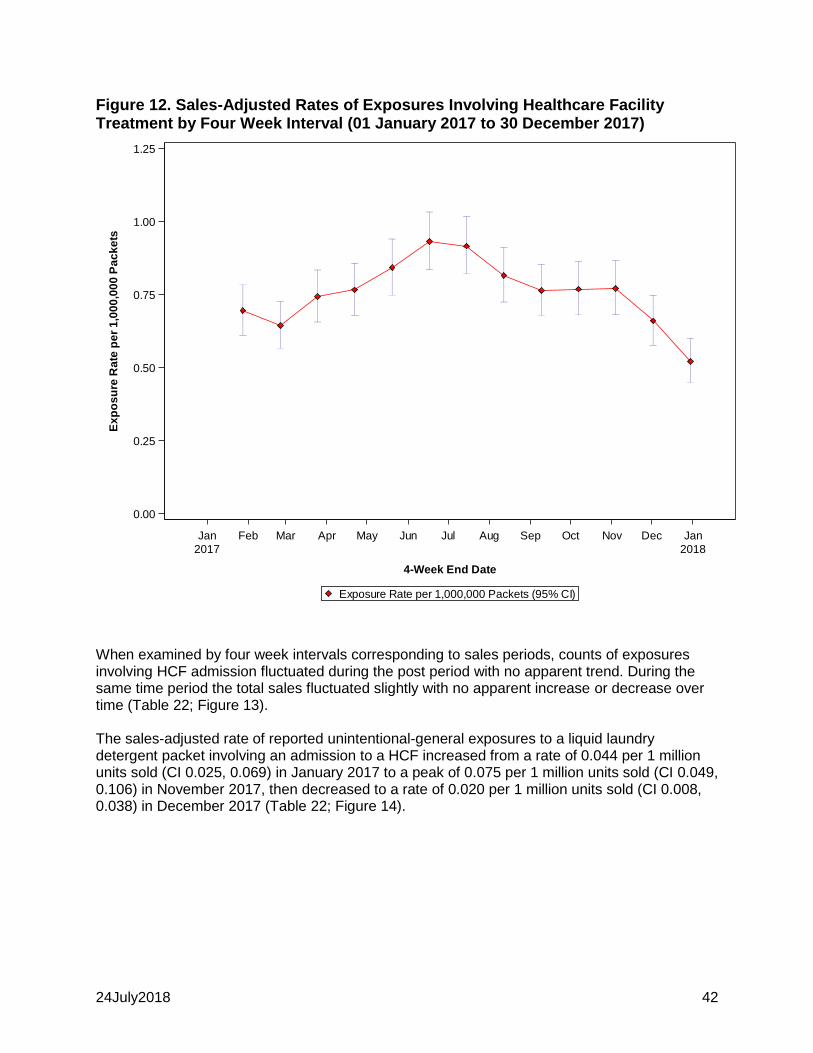
Sales-Adjusted Rates of Exposures with Clinically Significant Outcomes Over Time When examined by four week intervals corresponding to sales periods, counts of exposures involving HCF treatment followed the same pattern as all exposures with an increase from January 2017 through June 2017 followed by a decrease through December 2017. During the same time period the total sales fluctuated slightly with no apparent increase or decrease over time (Table 21; Figure 11). The sales-adjusted rate of reported unintentional-general exposures to a liquid laundry detergent packet involving treatment in a HCF increased gradually from a rate of 0.695 per 1 million units sold (CI 0.611, 0.783) in January 2017 to a peak of 0.932 per 1 million units sold (CI 0.836, 1.033) in June 2017, then gradually decreased to a rate of 0.522 per 1 million units sold (CI 0.448, 0.600) in December 2017 (Table 21; Figure 12).

24July2018 40
Table 21. Sales-Adjusted Rates of Exposures Involving Healthcare Facility Treatment by Four Week Interval (01 January 2017 to 30 December 2017)
Four Week Interval End Date Exposure
Count
Total Packets
Sales Count
Rates of All Exposures per
1,000,000 Packets
01 January 2017 to 28 January 2017 250 359,862,022 0.695 (0.611, 0.783)
29 January 2017 to 25 February 2017 249 386,913,157 0.644 (0.566, 0.726)
26 February 2017 to 25 March 2017 268 360,794,539 0.743 (0.657, 0.834)
26 March 2017 to 22 April 2017 285 371,856,361 0.766 (0.680, 0.858)
23 April 2017 to 20 May 2017 296 351,578,519 0.842 (0.749, 0.940)
21 May 2017 to 17 June 2017 344 369,080,801 0.932 (0.836, 1.033)
18 June 2017 to 15 July 2017 335 365,486,827 0.917 (0.821, 1.017)
16 July 2017 to 12 August 2017 294 360,532,691 0.815 (0.725, 0.911)
13 August 2017 to 09 September 2017 293 383,751,886 0.764 (0.679, 0.853)
10 September 2017 to 07 October 2017 274 356,237,506 0.769 (0.681, 0.863)
08 October 2017 to 04 November 2017 268 347,358,978 0.772 (0.682, 0.867)
05 November 2017 to 02 December 2017 228 345,461,141 0.660 (0.577, 0.748)
03 December 2017 to 30 December 2017 181 346,944,075 0.522 (0.448, 0.600)

24July2018 41
Figure 11. Exposures Involving Healthcare Facility Treatment and Sales Counts by Four Week Interval (01 January 2017 to 30 December 2017)
Jan Feb Mar Apr May Jun Jul Aug Sep Oct Nov Dec Jan
2017 2018
4-Week End Date
0
100
200
300
400
500
Ex
po
su
res
0
100,000,000
200,000,000
300,000,000
400,000,000
Pa
ck
et
Sa
les
Packet SalesExposures
24July2018 42
Figure 12. Sales-Adjusted Rates of Exposures Involving Healthcare Facility Treatment by Four Week Interval (01 January 2017 to 30 December 2017)
Jan Feb Mar Apr May Jun Jul Aug Sep Oct Nov Dec Jan
2017 2018
4-Week End Date
0.00
0.25
0.50
0.75
1.00
1.25
Ex
po
su
re R
ate
pe
r 1
,00
0,0
00
Pa
ck
ets
Exposure Rate per 1,000,000 Packets (95% CI)
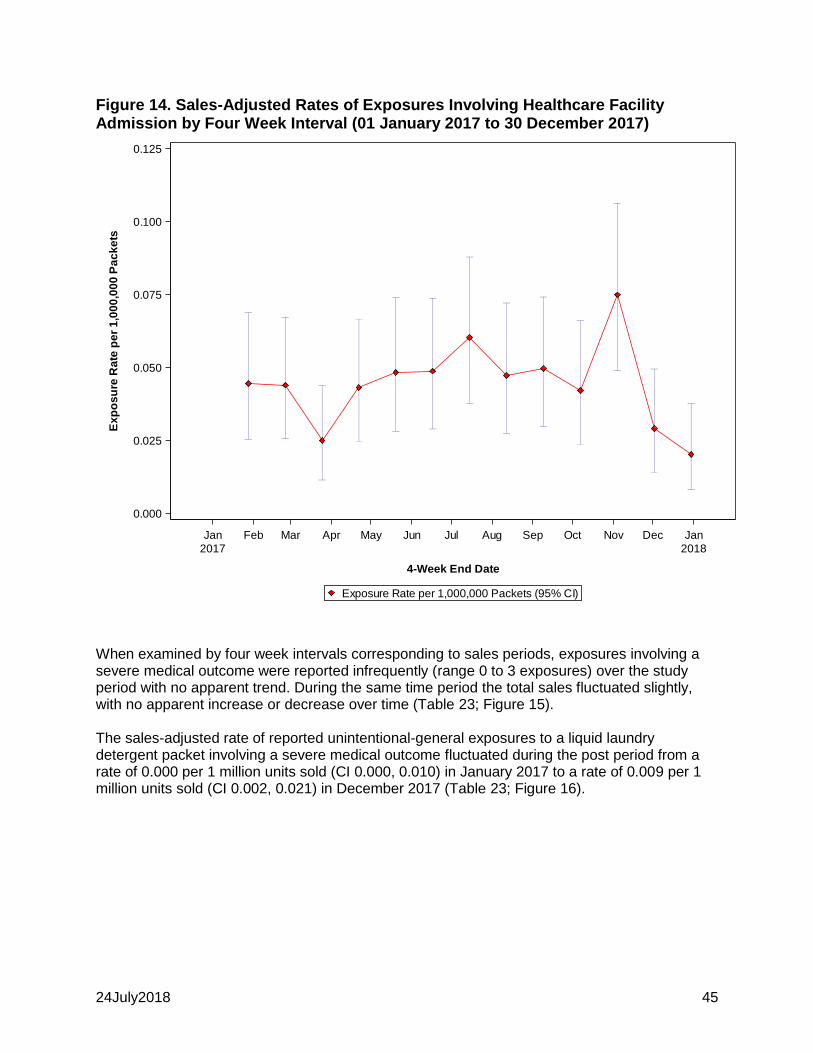
When examined by four week intervals corresponding to sales periods, counts of exposures involving HCF admission fluctuated during the post period with no apparent trend. During the same time period the total sales fluctuated slightly with no apparent increase or decrease over time (Table 22; Figure 13). The sales-adjusted rate of reported unintentional-general exposures to a liquid laundry detergent packet involving an admission to a HCF increased from a rate of 0.044 per 1 million units sold (CI 0.025, 0.069) in January 2017 to a peak of 0.075 per 1 million units sold (CI 0.049, 0.106) in November 2017, then decreased to a rate of 0.020 per 1 million units sold (CI 0.008, 0.038) in December 2017 (Table 22; Figure 14).

24July2018 43
Table 22. Sales-Adjusted Rates of Exposures Involving Healthcare Facility Admission by Four Week Interval (01 January 2017 to 30 December 2017)
Four Week Interval End Date Exposure
Count
Total Packets
Sales Count
Rates of All Exposures per
1,000,000 Packets
01 January 2017 to 28 January 2017 16 359,862,022 0.044 (0.025, 0.069)
29 January 2017 to 25 February 2017 17 386,913,157 0.044 (0.026, 0.067)
26 February 2017 to 25 March 2017 9 360,794,539 0.025 (0.011, 0.044)
26 March 2017 to 22 April 2017 16 371,856,361 0.043 (0.025, 0.067)
23 April 2017 to 20 May 2017 17 351,578,519 0.048 (0.028, 0.074)
21 May 2017 to 17 June 2017 18 369,080,801 0.049 (0.029, 0.074)
18 June 2017 to 15 July 2017 22 365,486,827 0.060 (0.038, 0.088)
16 July 2017 to 12 August 2017 17 360,532,691 0.047 (0.027, 0.072)
13 August 2017 to 09 September 2017 19 383,751,886 0.050 (0.030, 0.074)
10 September 2017 to 07 October 2017 15 356,237,506 0.042 (0.024, 0.066)
08 October 2017 to 04 November 2017 26 347,358,978 0.075 (0.049, 0.106)
05 November 2017 to 02 December 2017 10 345,461,141 0.029 (0.014, 0.049)
03 December 2017 to 30 December 2017 7 346,944,075 0.020 (0.008, 0.038)

24July2018 44
Figure 13. Exposures Involving Healthcare Facility Admission and Sales Count by Four Week Interval HCF (01 January 2017 to 30 December 2017)
Jan Feb Mar Apr May Jun Jul Aug Sep Oct Nov Dec Jan
2017 2018
4-Week End Date
0
10
20
30
40
50
60
Ex
po
su
res
0
100,000,000
200,000,000
300,000,000
400,000,000
Pa
ck
et
Sa
les
Packet SalesExposures
24July2018 45
Figure 14. Sales-Adjusted Rates of Exposures Involving Healthcare Facility Admission by Four Week Interval (01 January 2017 to 30 December 2017)
Jan Feb Mar Apr May Jun Jul Aug Sep Oct Nov Dec Jan
2017 2018
4-Week End Date
0.000
0.025
0.050
0.075
0.100
0.125
Ex
po
su
re R
ate
pe
r 1
,00
0,0
00
Pa
ck
ets
Exposure Rate per 1,000,000 Packets (95% CI)
When examined by four week intervals corresponding to sales periods, exposures involving a severe medical outcome were reported infrequently (range 0 to 3 exposures) over the study period with no apparent trend. During the same time period the total sales fluctuated slightly, with no apparent increase or decrease over time (Table 23; Figure 15). The sales-adjusted rate of reported unintentional-general exposures to a liquid laundry detergent packet involving a severe medical outcome fluctuated during the post period from a rate of 0.000 per 1 million units sold (CI 0.000, 0.010) in January 2017 to a rate of 0.009 per 1 million units sold (CI 0.002, 0.021) in December 2017 (Table 23; Figure 16).

24July2018 46
Table 23. Sales-Adjusted Rates of Exposures Resulting in Severe Medical Outcomes by Four Week Intervals (01 January 2017 to 30 December 2017)
Four Week Interval End Date Exposure
Count Packet
Sales Count
Rates of All Exposures per
1,000,000 Packets
01 January 2017 to 28 January 2017 0 359,862,022 0.000 (0.000, 0.010)
29 January 2017 to 25 February 2017 0 386,913,157 0.000 (0.000, 0.010)
26 February 2017 to 25 March 2017 1 360,794,539 0.003 (0.000, 0.010)
26 March 2017 to 22 April 2017 2 371,856,361 0.005 (0.001, 0.015)
23 April 2017 to 20 May 2017 2 351,578,519 0.006 (0.001, 0.016)
21 May 2017 to 17 June 2017 3 369,080,801 0.008 (0.002, 0.020)
18 June 2017 to 15 July 2017 1 365,486,827 0.003 (0.000, 0.010)
16 July 2017 to 12 August 2017 1 360,532,691 0.003 (0.000, 0.010)
13 August 2017 to 09 September 2017 2 383,751,886 0.005 (0.001, 0.015)
10 September 2017 to 07 October 2017 1 356,237,506 0.003 (0.000, 0.010)
08 October 2017 to 04 November 2017 2 347,358,978 0.006 (0.001, 0.016)
05 November 2017 to 02 December 2017 1 345,461,141 0.003 (0.000, 0.011)
03 December 2017 to 30 December 2017 3 346,944,075 0.009 (0.002, 0.021)

24July2018 47
Figure 15. Exposures Resulting in Severe Medical Outcomes and Sales Count by Four Week Interval (01 January 2017 to 30 December 2017)
Jan Feb Mar Apr May Jun Jul Aug Sep Oct Nov Dec Jan
2017 2018
4-Week End Date
0
2
4
6
8
10
12
Ex
po
su
res
0
100,000,000
200,000,000
300,000,000
400,000,000
Pa
ck
et
Sa
les
Packet SalesExposures

24July2018 48
Figure 16. Sales-Adjusted Rates of Exposures Resulting in Severe Medical Outcomes by Four Week Interval (01 January 2017 to 30 December 2017)
Jan Feb Mar Apr May Jun Jul Aug Sep Oct Nov Dec Jan
2017 2018
4-Week End Date
0.000
0.005
0.010
0.015
0.020
0.025
Ex
po
su
re R
ate
pe
r 1
,00
0,0
00
Pa
ck
ets
Exposure Rate per 1,000,000 Packets (95% CI)
24July2018 49
SUMMARY
This post period surveillance report describes the 10,796 unintentional-general exposures to liquid laundry detergent packets in children <6 years of age reported to the National Poison Data System (NPDS) between 01 January 2017 and 31 December 2017. Most of these exposures involved children <4 years of age. Approximately one-third of all liquid laundry detergent packet exposures involved healthcare facility (HCF) treatment, with 94% of exposures that received HCF treatment being released without admission. In total, 2% of exposures resulted in HCF admission. Most exposures were followed to a known outcome, with minor effects being reported in 43% of all exposures. Severe medical outcomes were reported in 0.2% of all exposures. Exposures involving children <2 years of age were associated with higher percentages of HCF admission and severe medical outcomes. While the most common route of exposure to a liquid laundry detergent packet was ingestion, aspiration (with ingestion) and ocular routes of exposure were associated with more severe medical outcomes. Regardless of severity of the outcome, product storage was most commonly cited as a contributing factor to the exposure. There were no fatalities reported during the post period. Rates were evaluated cumulatively and over time using the US population <6 years of age and sales data for all exposures, exposures involving HCF treatment, exposures involving HCF admission, and exposures resulting in severe medical outcomes. These rates are summarized in Table 24. Rates of exposures calculated by adjusting for the US population indicate that approximately 45 children per 100,000 US children <6 years of age were exposed to a liquid laundry detergent packet during the post period. When the rate of exposure was adjusted for product sales, approximately 2 exposures occurred for every 1,000,000 units (i.e., packets) sold. Rates of exposures resulting in severe medical outcomes (major effect or death) adjusted for the population and for product sales were approximately 8 exposures per 10 million US children <6 years of age and 4 exposures per every 1,000,000,000 packets sold. Consistent with previous reports, exposures were reported in an apparent seasonal trend with decreases in the fall months (4th quarter). As sales remained consistent over the post period, rates corresponded to trends in exposures with peak rates occurring in June or 2nd quarter and the lowest rates occurring in December or 4th quarter.

24July2018 50
Table 24. Summary of Population-Adjusted and Sales-Adjusted
Type of Exposure Rate
Cumulative Population-
Adjusted Ratea
Population-Adjusted Ratea in First and Last Quarterly Rate of the
Period
Cumulative Sales-
Adjusted Rateb
Sales-Adjusted Rateb in First and Last Four Week Interval Rate of
the Period
All Exposures
45.024
(CI 44.183, 45.882)
10.625 (CI 10.216, 11.041) to
9.516 (CI 9.130, 9.910)
2.291
(CI 2.248, 2.334)
2.029 (CI 1.884, 2.178) to
1.640 (CI 1.508, 1.777)
Healthcare Facility Treatment
14.889
(CI 14.408, 15.385)
3.517 (CI 3.283, 3.758)
to
3.072 (CI 2.854, 3.298)
0.758
(CI 0.733, 0.783)
0.695 (CI 0.611, 0.783) to
0.522 (CI 0.448, 0.600)
Healthcare Facility Admission
0.872
(CI 0.761, 0.998)
0.192 (CI 0.140, 0.251)
to
0.192 (CI 0.140, 0.251)
0.044
(CI 0.039, 0.051)
0.044 (CI 0.025, 0.069) to
0.020 (CI 0.008, 0.038)
Severe Medical Outcome
0.079
(CI 0.051, 0.124)
0.013 (CI 0.003, 0.030)
to
0.025 (CI 0.009, 0.049)
0.004
(CI 0.003, 0.006)
0.000 (CI 0.000, 0.010) to
0.009 (CI 0.002, 0.021) aRate per 100,000 US children <6 years of age and 95% Confidence Interval (CI).
bRate per 1,000,000 packets sold and 95% Confidence Interval (CI).
Interpretation of NPDS data are limited in that exposures are reported by caregivers who self-select to contact a poison center. Furthermore, as the primary purpose of poison centers is to manage exposures, exposures may be both underreported and have some variation in quality and completeness. However, though sales data are not a perfect measure of product availability, analysis of sales-adjusted rates of exposure can normalize reporting rates in the context of product availability. Population-adjusted rates provide additional context for changes in trends over time.
These analyses show that rates of exposures decreased over the post period and severe medical outcomes remained infrequent. Certain characteristics appeared to contribute to the exposure and were associated with severe medical outcomes, including exposures to children <2 years of age and aspiration of or ocular exposure to the product. As with many accidental exposures, improper product storage was identified as the primary contributor to exposure. Comparison of these characteristics along with rates of exposures and trends in outcomes during the baseline and post-ASTM standard implementation periods should be used to inform the impact of the safety standards.

24July2018 51
DISCLAIMERS
American Association of Poison Control Centers The American Association of Poison Control Centers (AAPCC; http://www.aapcc.org) maintains the national database of information logged by the country’s regional poison centers (PCs) serving all 50 United States, Puerto Rico, and the District of Columbia. Case records in this database are from self-reported calls: they reflect only information provided when the public or health care professionals report an actual or potential exposure to a substance (e.g., an ingestion, inhalation, or topical exposure), or request information/educational materials. Exposures do not necessarily represent a poisoning or overdose. The AAPCC is not able to completely verify the accuracy of every report made to member centers. Additional exposures may go unreported to PCs and data referenced from the AAPCC should not be construed to represent the complete incidence of national exposures to any substance(s). Nielsen The analyses performed in this report are based in part on data reported by Nielsen through its Strategic Planner Service for the Liquid Laundry Packs category for four week intervals from 01 January 2017 through 30 December 2017, for the Total US market for Nielsen’s Expanded All Outlets Combined channel which includes Food, Drug, Mass Merchandise, Club, Dollar, and Military/Deca. Conclusions drawn from the use of Nielsen data do not reflect the views of Nielsen.

24July2018 52
REFERENCES
1. ASTM International. Standard Safety Specification for Liquid Laundry Packets. West Conshohocken, PA: ASTM International; 2015:1-16. doi:10.1520/F3159-15E01.
2. Gummin, DD, Mowry, JB, Spyker, DA, Brooks, DE, Fraser, MO, Banner, W. 2016 Annual report of the American Association of Poison Control Centers’ National Poison Data System (NPDS): 34th Annual report. Clin. Toxicol. 2017; 55(10): 1072-1254. DOI: 10.1080/15563650.2017.1388087
3. 2010 Census Data. U.S. Census Bureau
website. https://www.census.gov/2010census/data/. Accessed May 7, 2018.

24July2018 53
APPENDICES

24July2018 54
Appendix A: National Poison Data System (NPDS) Definitions
EXPOSURE Actual or suspected contact with any substance which has been ingested, inhaled, absorbed, applied to, or injected into the body, regardless of toxicity or clinical manifestation. REASON FOR EXPOSURE Unintentional Exposure An unintentional exposure results from an unforeseen or unplanned event. Includes all subtypes: unintentional general, environmental, occupational, therapeutic error, misuse, bite/sting, food poisoning and unintentional unknown.
1) Unintentional-General: All unintended exposures that are not specifically defined below. Most unintentional exposures in children should be coded here. Never use this code if there is another code that fits the case.
2) Unintentional-Environmental: Any passive, non-occupational exposure that results from contamination of air, water, or soil. Environmental exposures are usually, but not always, caused by man-made contaminants.
3) Unintentional-Occupational: Any exposure that occurs as a direct result of the person being on the job or in the workplace.
4) Unintentional-Therapeutic Error: An unintentional deviation from a proper therapeutic regimen that results in the wrong dose, incorrect route of administration, administration to the wrong person, or administration of the wrong substance. Includes instances in which any type of substance (medications, herbals, non-pharmaceuticals, or other products) is substituted for medications. Drug interactions (or drug/food interactions) resulting from unintentional administration of drugs/foods which are known to interact are also included.
5) Unintentional-Misuse: Unintentional improper or incorrect use of a non-pharmaceutical substance. Unintentional Misuse differs from Intentional Misuse in that the exposure was unplanned or not foreseen by the patient.
6) Unintentional-Bite/Sting: All animal bites and stings, with or without envenomation. 7) Unintentional-Food Poisoning: All suspected or confirmed food poisoning regardless
of clinical manifestation. This includes ingestion of any food contaminated with microorganisms. The specific agent involved, if known, is recorded in the substance code area. This reason is used even if the patient develops no symptoms from the contaminated food.
8) Unintentional-Unknown: An exposure determined to be unintentional but the exact reason is unknown.
CHRONICITY Chronicity of the exposure.
Acute: A single, repeated or continuous exposure occurring over a period of eight hours or less.
Acute-on-Chronic: A single exposure that was preceded by a continuous, repeated, or intermittent exposure occurring over a period exceeding eight hours. Chronic: A continuous, repeated, or intermittent exposure to the same substance lasting longer than eight hours.

24July2018 55
Unknown: It is not possible to determine whether the exposure is acute, acute-on-chronic, or chronic.
HEALTHCARE FACILITY (HCF) LEVEL OF CARE
Treated/evaluated and released: The patient is observed, treated and/or evaluated then released to home, work, shelter, jail, or similar site which is not a health care facility. If the patient came from a nursing home or other long-term care facility and went back to that facility from the health care facility, this response is selected. This includes patients treated/observed in a 23-hour observation unit to avoid admission. Admitted to critical care unit: The patient is admitted to a critical or intensive care unit. Admitted to noncritical care unit: The patient is observed or treated by a physician and subsequently admitted to a medical unit. Admitted to psychiatric care facility: The patient is observed or treated by a physician and subsequently admitted primarily to receive psychiatric care or evaluation. Patient refused referral/did not arrive at healthcare facility: The patient declined to follow the referral recommendation or failed to arrive at the health care facility to which he or she was referred. Patient lost to follow-up/left AMA: The patient is lost to follow-up or the patient has left the health care facility against medical advice.
MEDICAL OUTCOME Case followed to known outcome: A response is appropriate in this area only if follow-up continues until medical outcome can be documented with reasonable certainty.
Unrelated effect: Based upon all the information available, the exposure was probably not responsible for the effect(s). No effect: The patient developed no symptoms as a result of the exposure. Follow-up is required to make this determination unless the initial poison center call occurs sufficiently long after the exposure that you are reasonably certain no effects will occur.
Minor effect: The patient exhibited some symptoms as a result of the exposure, but they were minimally bothersome to the patient. The symptoms usually resolve rapidly and usually involve skin or mucous membrane manifestations. The patient has returned to a pre-exposure state of wellbeing and has no residual disability or disfigurement. Moderate effect: The patient exhibited symptoms as a result of the exposure which are more pronounced, more prolonged or more of a systemic nature than minor symptoms. Usually some form of treatment is or would have been indicated. Symptoms were not life-threatening and the patient has returned to a pre-exposure state of well-being with no residual disability or disfigurement.
Major effect: The patient has exhibited symptoms as a result of the exposure which were life-threatening or resulted in significant residual disability or disfigurement.
24July2018 56
Death: The patient died as a result of the exposure or as a direct complication of the exposure where the complication was unlikely to have occurred had the toxic exposure not preceded the complication. Only includes deaths which are probably or undoubtedly related to the exposure. Case not followed to a known outcome: In some circumstances it is not appropriate or possible to follow a patient to a reasonably certain medical outcome.
Not followed, judged as nontoxic exposure. The patient was not followed because in the clinical judgment of the specialist in poison information, the exposure was likely to be nontoxic because:
• the agent involved was nontoxic • the amount implicated in the exposure was insignificant (nontoxic), and/or • the route of exposure was unlikely to result in a clinical effect
Not followed, minimal clinical effects possible. The patient was not followed because, in the clinical judgment of the specialist in poison information, the exposure was likely to result in only minimal toxicity of a trivial nature. This outcome is selected only when reasonably certain, in a worst case scenario, that the patient will experience no more than a minor effect. This also includes cases that refused follow-up if the exposure would possibly result in minimal clinical effects and would cause no more than a minor effect.
Unable to follow, judged as a potentially toxic exposure. The patient was lost to follow-up (or the poison center neglected to provide follow-up) and in the judgment of the specialist in poison information the exposure was significant and may have resulted in toxic manifestations with a moderate, major or fatal outcome.
Death, indirect report: A reported fatality is coded as “indirect” if no inquiry was placed to the poison center. For example, if the case was obtained from a medical examiner who sends post mortem reports to the poison center or from a newspaper article. An inquiry to the poison center after the patient died is not necessarily indirect. For example, a medical examiner calling with a question about the cause of death or a family member calling with a question about a toxicology laboratory result is not an indirect report. CLINICAL EFFECT Reported signs, symptoms and clinical findings associated with an exposure, recorded by relationship to the exposure. THERAPIES Therapies that were recommended and/or performed in relation to the exposure reported. SCENARIO A description of the events that led to the reported exposure.

24July2018 57
Appendix B: National Poison Data System (NPDS) Relative
Contributions to Fatality (RCF)
Undoubtedly responsible In the opinion of the Case Review Team (CRT) the Clinical Case Evidence establishes beyond reasonable doubt that the SUBSTANCES actually caused the death. Probably responsible In the opinion of the CRT the Clinical Case Evidence suggests that the SUBSTANCES caused the death, but some reasonable doubt remained. Contributory In the opinion of the CRT the Clinical Case Evidence establishes that the SUBSTANCES contributed to the death, but did not solely cause the death. That is, the SUBSTANCES alone would not have caused the death, but combined with other factors, were partially responsible for the death. Probably not responsible In the opinion of the CRT the Clinical Case Evidence establishes to a reasonable probability, but not conclusively, that the SUBSTANCES associated with the death did not cause the death. Clearly not responsible In the opinion of the CRT the Clinical Case Evidence established beyond a reasonable doubt that the SUBSTANCES did not cause this death. Unknown In the opinion of the CRT the Clinical Case Evidence is insufficient to impute or refute a causative relationship for the SUBSTANCES in this death.
24July2018 58
Appendix C: All Related Clinical Effects Among All
Unintentional-General Exposures to Liquid Laundry
Detergent Packets by Level of Treatment and Severe
Medical Outcome
Related Clinical Effects
All Exposures (N=10,796)
Exposures Involving
HCF Treatment (N=3,570)
Exposures Involving
HCF Admission
(N=209)
Exposures with Severe
Medical Outcomes
(N=19)
Vomiting 3,267 (30.3%) 1,526 (42.7%) 135 (64.6%) 9 (47.4%)
Ocular - Irritation/pain 1,942 (18.0%) 1,012 (28.3%) 31 (14.8%) 9 (47.4%)
Red eye/conjunctivitis 1,216 (11.3%) 719 (20.1%) 25 (12.0%) 5 (26.3%)
Cough/choke 791 (7.3%) 337 (9.4%) 48 (23.0%) 5 (26.3%)
Nausea 282 (2.6%) 138 (3.9%) 14 (6.7%) 0 (0.0%)
Other 265 (2.5%) 159 (4.5%) 33 (15.8%) 4 (21.1%)
Oral irritation 261 (2.4%) 92 (2.6%) 16 (7.7%) 1 (5.3%)
Erythema/flushed 253 (2.3%) 120 (3.4%) 4 (1.9%) 1 (5.3%)
Edema 203 (1.9%) 133 (3.7%) 2 (1.0%) 2 (10.5%)
Drowsiness/lethargy 194 (1.8%) 139 (3.9%) 19 (9.1%) 0 (0.0%)
Lacrimation 193 (1.8%) 124 (3.5%) 4 (1.9%) 1 (5.3%)
Corneal abrasion 190 (1.8%) 184 (5.2%) 5 (2.4%) 3 (15.8%)
Dermal - Irritation/pain 182 (1.7%) 76 (2.1%) 3 (1.4%) 0 (0.0%)
Diarrhea 123 (1.1%) 70 (2.0%) 6 (2.9%) 0 (0.0%)
Rash 113 (1.0%) 52 (1.5%) 5 (2.4%) 0 (0.0%)
Throat irritation 113 (1.0%) 58 (1.6%) 14 (6.7%) 1 (5.3%)
Excess secretions 82 (0.8%) 58 (1.6%) 18 (8.6%) 1 (5.3%)
Abdominal Pain 59 (0.5%) 30 (0.8%) 3 (1.4%) 0 (0.0%)
Burns (superficial) 55 (0.5%) 37 (1.0%) 2 (1.0%) 0 (0.0%)
Agitated/irritable 49 (0.5%) 27 (0.8%) 8 (3.8%) 1 (5.3%)
Dyspnea 35 (0.3%) 28 (0.8%) 11 (5.3%) 2 (10.5%)
Burns 34 (0.3%) 32 (0.9%) 2 (1.0%) 3 (15.8%)
Photophobia 33 (0.3%) 27 (0.8%) 0 (0.0%) 1 (5.3%)
Bronchospasm 25 (0.2%) 23 (0.6%) 13 (6.2%) 4 (21.1%)
Blurred vision 18 (0.2%) 8 (0.2%) 0 (0.0%) 1 (5.3%)
Hyperventilation/tachypnea 18 (0.2%) 18 (0.5%) 9 (4.3%) 0 (0.0%)
Tachycardia 15 (0.1%) 15 (0.4%) 7 (3.3%) 1 (5.3%)
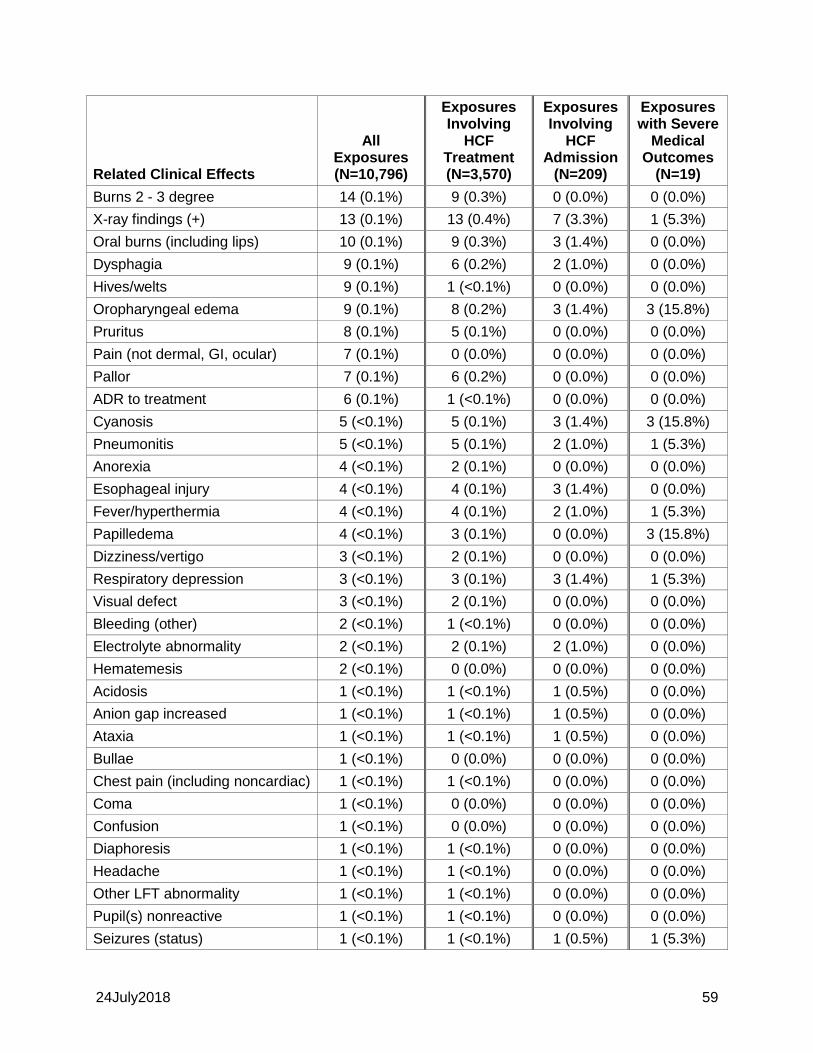
24July2018 59
Related Clinical Effects
All Exposures (N=10,796)
Exposures Involving
HCF Treatment (N=3,570)
Exposures Involving
HCF Admission
(N=209)
Exposures with Severe
Medical Outcomes
(N=19)
Burns 2 - 3 degree 14 (0.1%) 9 (0.3%) 0 (0.0%) 0 (0.0%)
X-ray findings (+) 13 (0.1%) 13 (0.4%) 7 (3.3%) 1 (5.3%)
Oral burns (including lips) 10 (0.1%) 9 (0.3%) 3 (1.4%) 0 (0.0%)
Dysphagia 9 (0.1%) 6 (0.2%) 2 (1.0%) 0 (0.0%)
Hives/welts 9 (0.1%) 1 (<0.1%) 0 (0.0%) 0 (0.0%)
Oropharyngeal edema 9 (0.1%) 8 (0.2%) 3 (1.4%) 3 (15.8%)
Pruritus 8 (0.1%) 5 (0.1%) 0 (0.0%) 0 (0.0%)
Pain (not dermal, GI, ocular) 7 (0.1%) 0 (0.0%) 0 (0.0%) 0 (0.0%)
Pallor 7 (0.1%) 6 (0.2%) 0 (0.0%) 0 (0.0%)
ADR to treatment 6 (0.1%) 1 (<0.1%) 0 (0.0%) 0 (0.0%)
Cyanosis 5 (<0.1%) 5 (0.1%) 3 (1.4%) 3 (15.8%)
Pneumonitis 5 (<0.1%) 5 (0.1%) 2 (1.0%) 1 (5.3%)
Anorexia 4 (<0.1%) 2 (0.1%) 0 (0.0%) 0 (0.0%)
Esophageal injury 4 (<0.1%) 4 (0.1%) 3 (1.4%) 0 (0.0%)
Fever/hyperthermia 4 (<0.1%) 4 (0.1%) 2 (1.0%) 1 (5.3%)
Papilledema 4 (<0.1%) 3 (0.1%) 0 (0.0%) 3 (15.8%)
Dizziness/vertigo 3 (<0.1%) 2 (0.1%) 0 (0.0%) 0 (0.0%)
Respiratory depression 3 (<0.1%) 3 (0.1%) 3 (1.4%) 1 (5.3%)
Visual defect 3 (<0.1%) 2 (0.1%) 0 (0.0%) 0 (0.0%)
Bleeding (other) 2 (<0.1%) 1 (<0.1%) 0 (0.0%) 0 (0.0%)
Electrolyte abnormality 2 (<0.1%) 2 (0.1%) 2 (1.0%) 0 (0.0%)
Hematemesis 2 (<0.1%) 0 (0.0%) 0 (0.0%) 0 (0.0%)
Acidosis 1 (<0.1%) 1 (<0.1%) 1 (0.5%) 0 (0.0%)
Anion gap increased 1 (<0.1%) 1 (<0.1%) 1 (0.5%) 0 (0.0%)
Ataxia 1 (<0.1%) 1 (<0.1%) 1 (0.5%) 0 (0.0%)
Bullae 1 (<0.1%) 0 (0.0%) 0 (0.0%) 0 (0.0%)
Chest pain (including noncardiac) 1 (<0.1%) 1 (<0.1%) 0 (0.0%) 0 (0.0%)
Coma 1 (<0.1%) 0 (0.0%) 0 (0.0%) 0 (0.0%)
Confusion 1 (<0.1%) 0 (0.0%) 0 (0.0%) 0 (0.0%)
Diaphoresis 1 (<0.1%) 1 (<0.1%) 0 (0.0%) 0 (0.0%)
Headache 1 (<0.1%) 1 (<0.1%) 0 (0.0%) 0 (0.0%)
Other LFT abnormality 1 (<0.1%) 1 (<0.1%) 0 (0.0%) 0 (0.0%)
Pupil(s) nonreactive 1 (<0.1%) 1 (<0.1%) 0 (0.0%) 0 (0.0%)
Seizures (status) 1 (<0.1%) 1 (<0.1%) 1 (0.5%) 1 (5.3%)


![[Report] Laundry detergent Vietnam market](https://static.fdocuments.us/doc/165x107/55c39bd2bb61eb992d8b45fa/report-laundry-detergent-vietnam-market.jpg)