Reporting against OLAP Data from Microsoft Analysis ... · PDF fileReporting against OLAP Data...
34
SAP COMMUNITY NETWORK SDN - sdn.sap.com | BPX - bpx.sap.com | BOC - boc.sap.com | UAC - uac.sap.com © 2012 SAP AG 1 Reporting against OLAP Data from Microsoft Analysis Services and Oracle Hyperion Essbase Applies to: SAP BusinessObjects XI 4.0 Feature Pack 3, information design tool, Web Intelligence, SAP Business Objects Mobile 4.2.0, Microsoft Analysis Services 2008 and Oracle Hyperion Essbase 11. Summary OLAP databases provide useful features for building reports based on a cube. In this paper we will describe how to define MDX objects for reporting purposes using the information design tool. We will show Web Intelligence documents on laptop, iPad and iPhone devices that address typical use cases like time comparison, custom groupings, asymmetric report and scheduled report. You can find all the examples presented in this article in the zip file attached . Author: Marc Daniau Company: SAP Created on: June 22, 2012 Author Bio Marc Daniau joined Business Objects in 1992 as project consultant in France. He moved to the product group in San Jose in 1998 to work on EPM products. He moved back to Paris in 2003 to work within the semantic layer team.
Transcript of Reporting against OLAP Data from Microsoft Analysis ... · PDF fileReporting against OLAP Data...
SAP COMMUNITY NETWORK SDN - sdn.sap.com | BPX - bpx.sap.com | BOC - boc.sap.com | UAC - uac.sap.com
© 2012 SAP AG 1
Reporting against OLAP Data from
Microsoft Analysis Services and
Oracle Hyperion Essbase
Applies to:
SAP BusinessObjects XI 4.0 Feature Pack 3, information design tool, Web Intelligence, SAP Business Objects Mobile 4.2.0, Microsoft Analysis Services 2008 and Oracle Hyperion Essbase 11.
Summary
OLAP databases provide useful features for building reports based on a cube. In this paper we will describe how to define MDX objects for reporting purposes using the information design tool. We will show Web Intelligence documents on laptop, iPad and iPhone devices that address typical use cases like time comparison, custom groupings, asymmetric report and scheduled report. You can find all the examples presented in this article in the zip file attached.
Author: Marc Daniau
Company: SAP
Created on: June 22, 2012
Author Bio
Marc Daniau joined Business Objects in 1992 as project consultant in France. He moved to the product group in San Jose in 1998 to work on EPM products. He moved back to Paris in 2003 to work within the semantic layer team.
Reporting against OLAP Data from Microsoft Analysis Services and Oracle Hyperion Essbase
SAP COMMUNITY NETWORK SDN - sdn.sap.com | BPX - bpx.sap.com | BOC - boc.sap.com | UAC - uac.sap.com
© 2012 SAP AG 2
Table of Contents
Time Comparison ............................................................................................................................................... 3
Period-To-Period ............................................................................................................................................. 3
Year-Over-Year ............................................................................................................................................... 7
Custom Layouts ................................................................................................................................................ 13
Grouping Members ....................................................................................................................................... 13
Renaming Members ...................................................................................................................................... 15
Merging Two Dimensions.............................................................................................................................. 17
Asymmetric Report ........................................................................................................................................... 18
Actual & Budget ............................................................................................................................................ 18
Rolling Months .............................................................................................................................................. 22
Scheduled Report ............................................................................................................................................. 28
Current Calendar Period ............................................................................................................................... 28
Current Fiscal Period .................................................................................................................................... 30
Latest Period ................................................................................................................................................. 31
Related Content ................................................................................................................................................ 33
Copyright........................................................................................................................................................... 34
Reporting against OLAP Data from Microsoft Analysis Services and Oracle Hyperion Essbase
SAP COMMUNITY NETWORK SDN - sdn.sap.com | BPX - bpx.sap.com | BOC - boc.sap.com | UAC - uac.sap.com
© 2012 SAP AG 3
Time Comparison
Time comparison is usually the first thing that a business user wants to do with his data. When that data sits in an OLAP database, we can take advantage of the built-in OLAP capabilities around the time dimension that Oracle Hyperion Essbase and Microsoft Analysis Services offer.
Period-To-Period
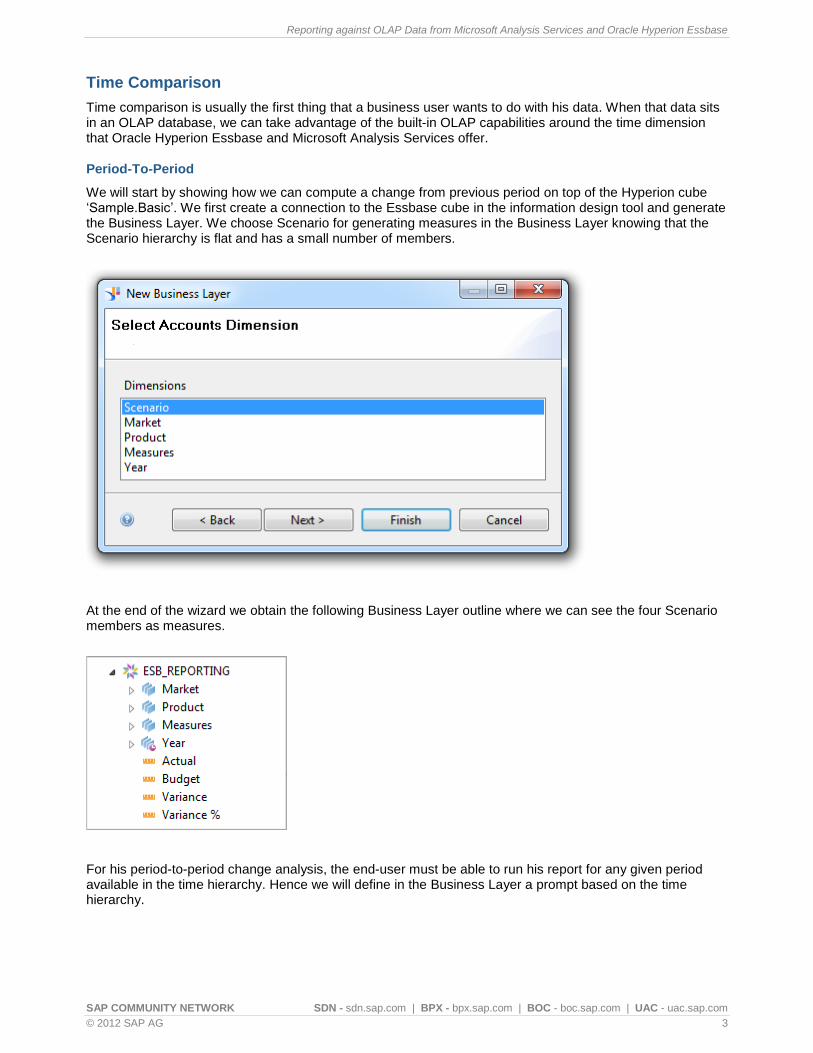
We will start by showing how we can compute a change from previous period on top of the Hyperion cube „Sample.Basic‟. We first create a connection to the Essbase cube in the information design tool and generate the Business Layer. We choose Scenario for generating measures in the Business Layer knowing that the Scenario hierarchy is flat and has a small number of members.
At the end of the wizard we obtain the following Business Layer outline where we can see the four Scenario members as measures.
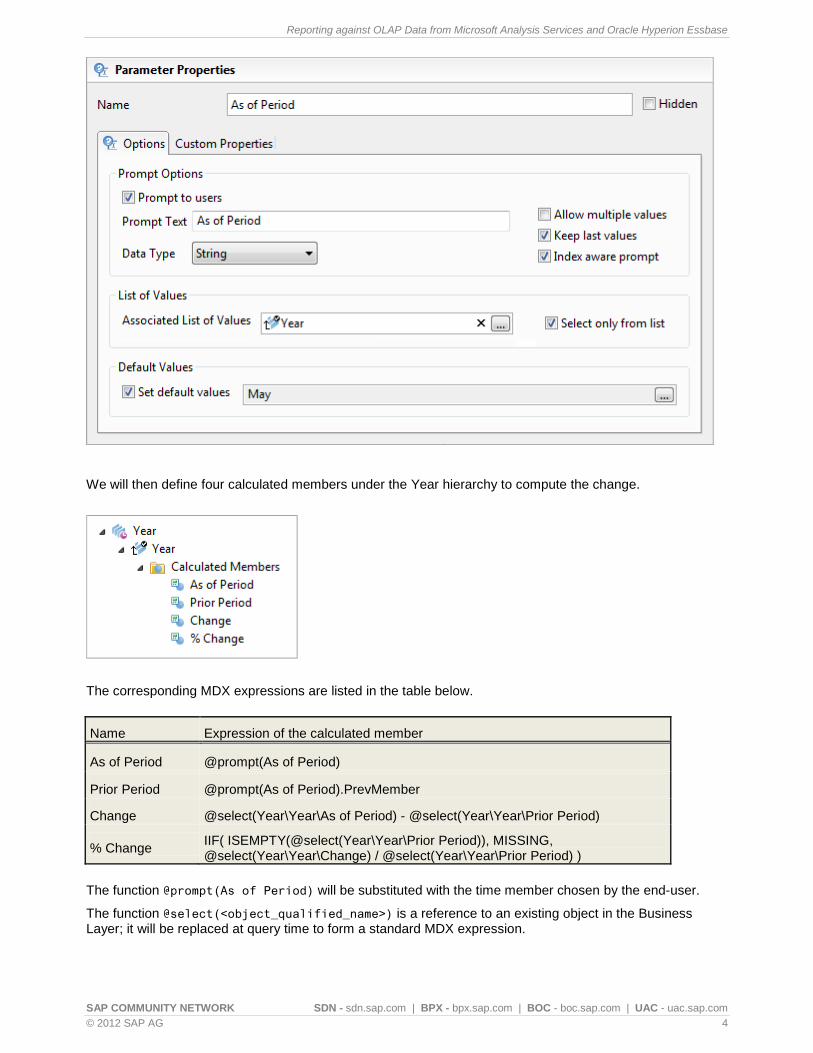
For his period-to-period change analysis, the end-user must be able to run his report for any given period available in the time hierarchy. Hence we will define in the Business Layer a prompt based on the time hierarchy.
Reporting against OLAP Data from Microsoft Analysis Services and Oracle Hyperion Essbase
SAP COMMUNITY NETWORK SDN - sdn.sap.com | BPX - bpx.sap.com | BOC - boc.sap.com | UAC - uac.sap.com
© 2012 SAP AG 4
We will then define four calculated members under the Year hierarchy to compute the change.
The corresponding MDX expressions are listed in the table below.
Name Expression of the calculated member
As of Period @prompt(As of Period)
Prior Period @prompt(As of Period).PrevMember
Change @select(Year\Year\As of Period) - @select(Year\Year\Prior Period)
% Change IIF( ISEMPTY(@select(Year\Year\Prior Period)), MISSING, @select(Year\Year\Change) / @select(Year\Year\Prior Period) )
The function @prompt(As of Period) will be substituted with the time member chosen by the end-user.
The function @select(<object_qualified_name>) is a reference to an existing object in the Business Layer; it will be replaced at query time to form a standard MDX expression.
Reporting against OLAP Data from Microsoft Analysis Services and Oracle Hyperion Essbase
SAP COMMUNITY NETWORK SDN - sdn.sap.com | BPX - bpx.sap.com | BOC - boc.sap.com | UAC - uac.sap.com
© 2012 SAP AG 5
To make the Business Layer available to the SAP Business Objects front-end tools like Web Intelligence, Crystal Report or Dashboards (Xcelsius), we must publish it as a Universe into the CMS repository.
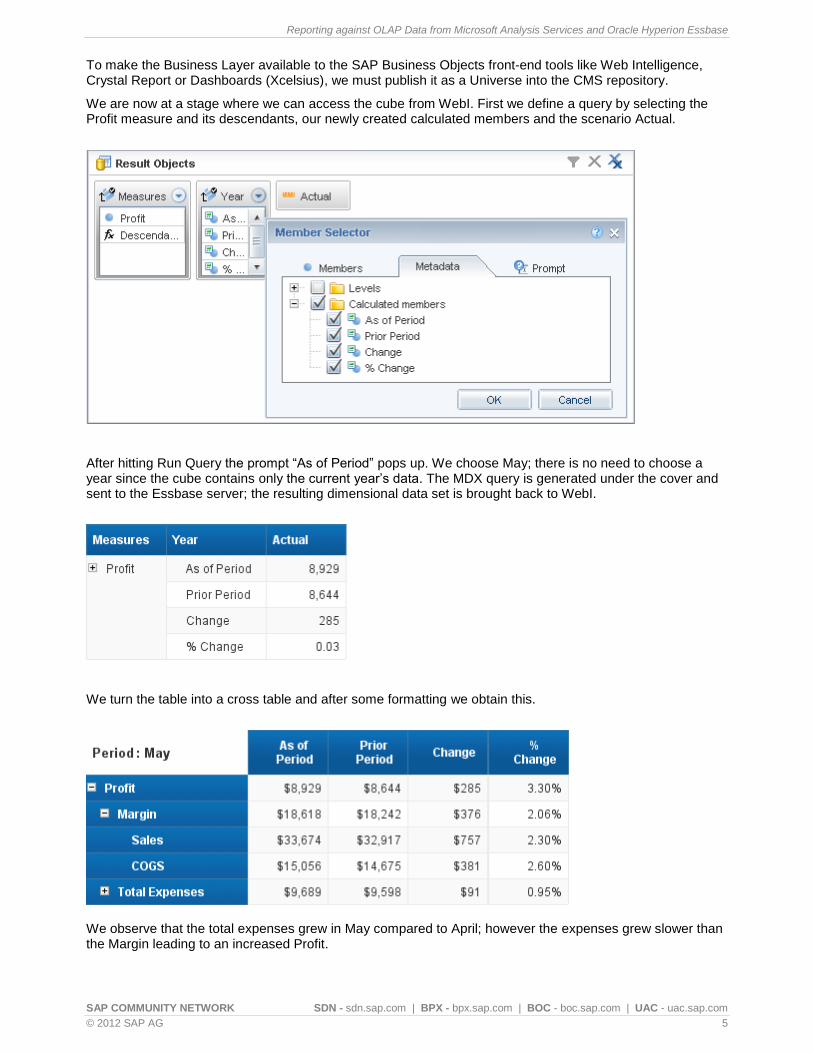
We are now at a stage where we can access the cube from WebI. First we define a query by selecting the Profit measure and its descendants, our newly created calculated members and the scenario Actual.
After hitting Run Query the prompt “As of Period” pops up. We choose May; there is no need to choose a year since the cube contains only the current year‟s data. The MDX query is generated under the cover and sent to the Essbase server; the resulting dimensional data set is brought back to WebI.
We turn the table into a cross table and after some formatting we obtain this.
We observe that the total expenses grew in May compared to April; however the expenses grew slower than the Margin leading to an increased Profit.
Reporting against OLAP Data from Microsoft Analysis Services and Oracle Hyperion Essbase
SAP COMMUNITY NETWORK SDN - sdn.sap.com | BPX - bpx.sap.com | BOC - boc.sap.com | UAC - uac.sap.com
© 2012 SAP AG 6
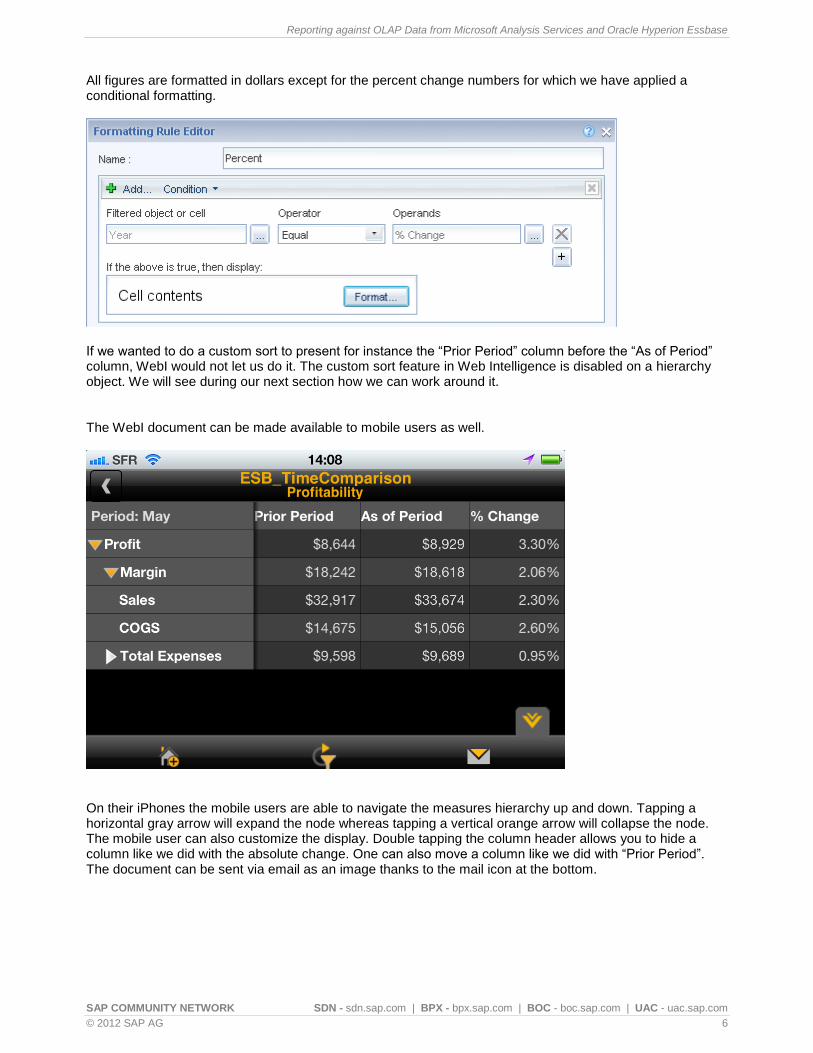
All figures are formatted in dollars except for the percent change numbers for which we have applied a conditional formatting.
If we wanted to do a custom sort to present for instance the “Prior Period” column before the “As of Period” column, WebI would not let us do it. The custom sort feature in Web Intelligence is disabled on a hierarchy object. We will see during our next section how we can work around it. The WebI document can be made available to mobile users as well.
On their iPhones the mobile users are able to navigate the measures hierarchy up and down. Tapping a horizontal gray arrow will expand the node whereas tapping a vertical orange arrow will collapse the node. The mobile user can also customize the display. Double tapping the column header allows you to hide a column like we did with the absolute change. One can also move a column like we did with “Prior Period”. The document can be sent via email as an image thanks to the mail icon at the bottom.
Reporting against OLAP Data from Microsoft Analysis Services and Oracle Hyperion Essbase
SAP COMMUNITY NETWORK SDN - sdn.sap.com | BPX - bpx.sap.com | BOC - boc.sap.com | UAC - uac.sap.com
© 2012 SAP AG 7
Year-Over-Year
Often comparing from the previous period is not sufficient especially when dealing with seasonal data. Business users need to compare their numbers with the same period last year. In this section, we will see how to implement a year-over-year comparison with a Microsoft cube.
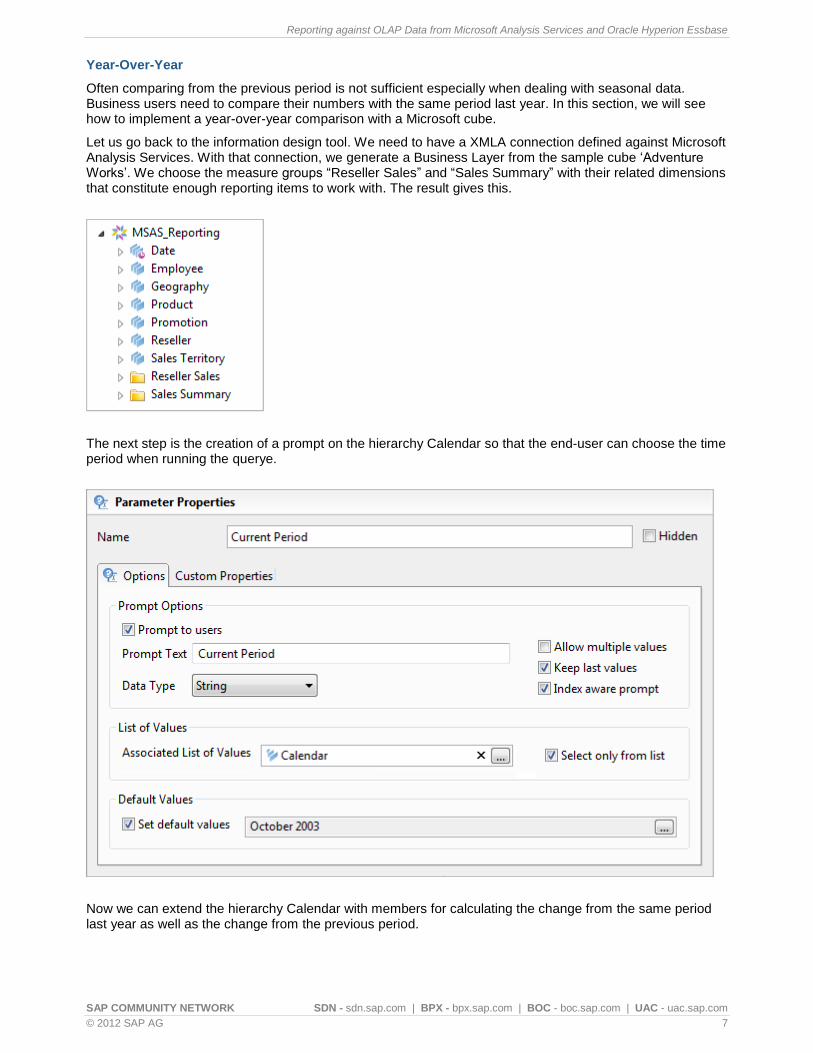
Let us go back to the information design tool. We need to have a XMLA connection defined against Microsoft Analysis Services. With that connection, we generate a Business Layer from the sample cube „Adventure Works‟. We choose the measure groups “Reseller Sales” and “Sales Summary” with their related dimensions that constitute enough reporting items to work with. The result gives this.
The next step is the creation of a prompt on the hierarchy Calendar so that the end-user can choose the time period when running the querye.
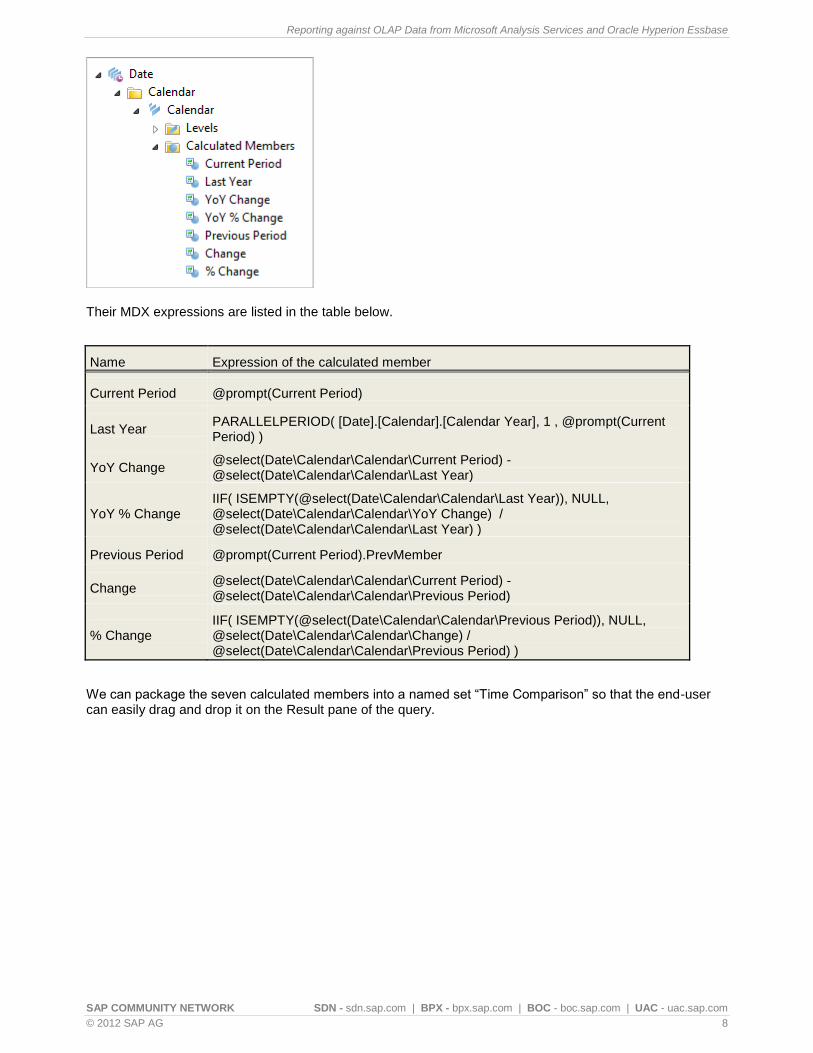
Now we can extend the hierarchy Calendar with members for calculating the change from the same period last year as well as the change from the previous period.
Reporting against OLAP Data from Microsoft Analysis Services and Oracle Hyperion Essbase
SAP COMMUNITY NETWORK SDN - sdn.sap.com | BPX - bpx.sap.com | BOC - boc.sap.com | UAC - uac.sap.com
© 2012 SAP AG 8
Their MDX expressions are listed in the table below.
Name Expression of the calculated member
Current Period @prompt(Current Period)
Last Year PARALLELPERIOD( [Date].[Calendar].[Calendar Year], 1 , @prompt(Current Period) )
YoY Change @select(Date\Calendar\Calendar\Current Period) - @select(Date\Calendar\Calendar\Last Year)
YoY % Change IIF( ISEMPTY(@select(Date\Calendar\Calendar\Last Year)), NULL, @select(Date\Calendar\Calendar\YoY Change) / @select(Date\Calendar\Calendar\Last Year) )
Previous Period @prompt(Current Period).PrevMember
Change @select(Date\Calendar\Calendar\Current Period) - @select(Date\Calendar\Calendar\Previous Period)
% Change IIF( ISEMPTY(@select(Date\Calendar\Calendar\Previous Period)), NULL, @select(Date\Calendar\Calendar\Change) / @select(Date\Calendar\Calendar\Previous Period) )
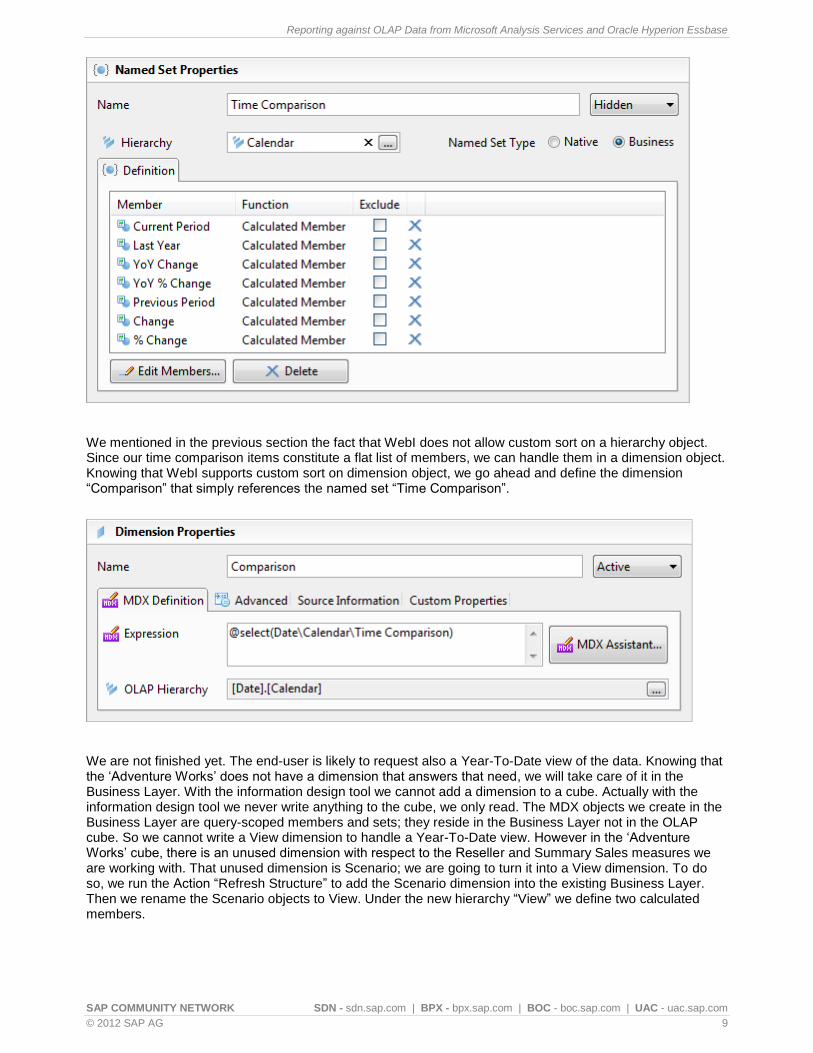
We can package the seven calculated members into a named set “Time Comparison” so that the end-user can easily drag and drop it on the Result pane of the query.
Reporting against OLAP Data from Microsoft Analysis Services and Oracle Hyperion Essbase
SAP COMMUNITY NETWORK SDN - sdn.sap.com | BPX - bpx.sap.com | BOC - boc.sap.com | UAC - uac.sap.com
© 2012 SAP AG 9
We mentioned in the previous section the fact that WebI does not allow custom sort on a hierarchy object. Since our time comparison items constitute a flat list of members, we can handle them in a dimension object. Knowing that WebI supports custom sort on dimension object, we go ahead and define the dimension “Comparison” that simply references the named set “Time Comparison”.
We are not finished yet. The end-user is likely to request also a Year-To-Date view of the data. Knowing that the „Adventure Works‟ does not have a dimension that answers that need, we will take care of it in the Business Layer. With the information design tool we cannot add a dimension to a cube. Actually with the information design tool we never write anything to the cube, we only read. The MDX objects we create in the Business Layer are query-scoped members and sets; they reside in the Business Layer not in the OLAP cube. So we cannot write a View dimension to handle a Year-To-Date view. However in the „Adventure Works‟ cube, there is an unused dimension with respect to the Reseller and Summary Sales measures we are working with. That unused dimension is Scenario; we are going to turn it into a View dimension. To do so, we run the Action “Refresh Structure” to add the Scenario dimension into the existing Business Layer. Then we rename the Scenario objects to View. Under the new hierarchy “View” we define two calculated members.
Reporting against OLAP Data from Microsoft Analysis Services and Oracle Hyperion Essbase
SAP COMMUNITY NETWORK SDN - sdn.sap.com | BPX - bpx.sap.com | BOC - boc.sap.com | UAC - uac.sap.com
© 2012 SAP AG 10
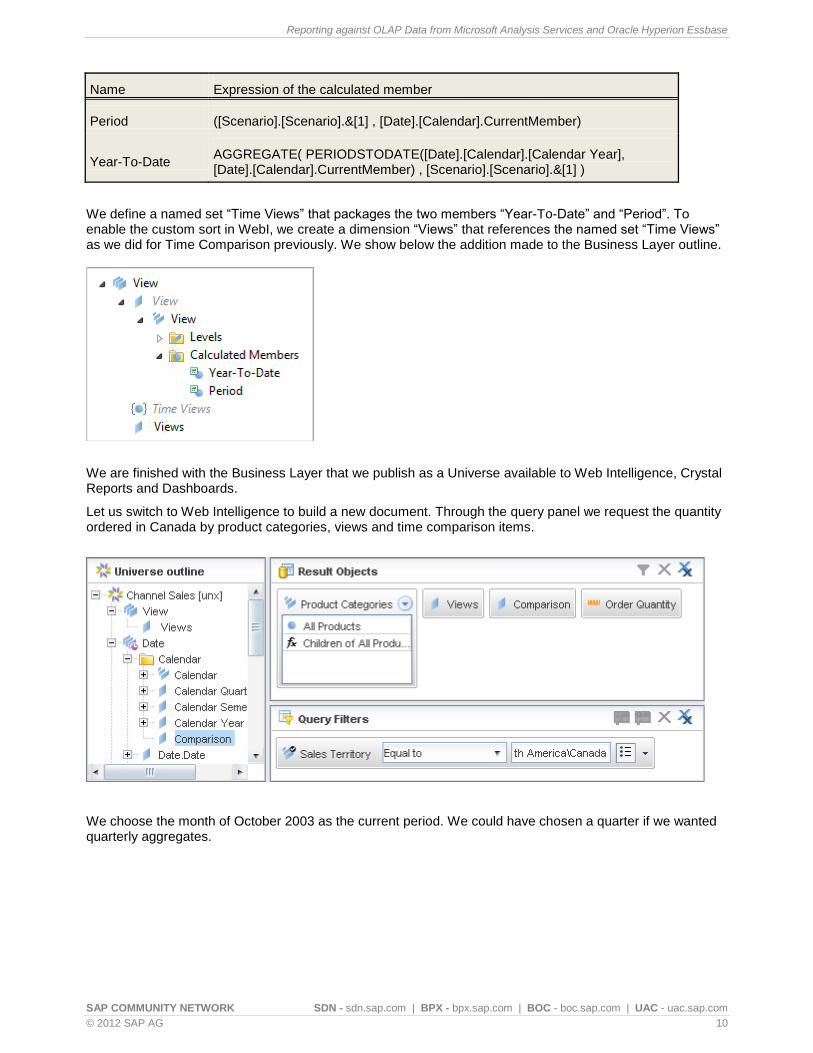
Name Expression of the calculated member
Period ([Scenario].[Scenario].&[1] , [Date].[Calendar].CurrentMember)
Year-To-Date AGGREGATE( PERIODSTODATE([Date].[Calendar].[Calendar Year], [Date].[Calendar].CurrentMember) , [Scenario].[Scenario].&[1] )
We define a named set “Time Views” that packages the two members “Year-To-Date” and “Period”. To enable the custom sort in WebI, we create a dimension “Views” that references the named set “Time Views” as we did for Time Comparison previously. We show below the addition made to the Business Layer outline.
We are finished with the Business Layer that we publish as a Universe available to Web Intelligence, Crystal Reports and Dashboards.
Let us switch to Web Intelligence to build a new document. Through the query panel we request the quantity ordered in Canada by product categories, views and time comparison items.
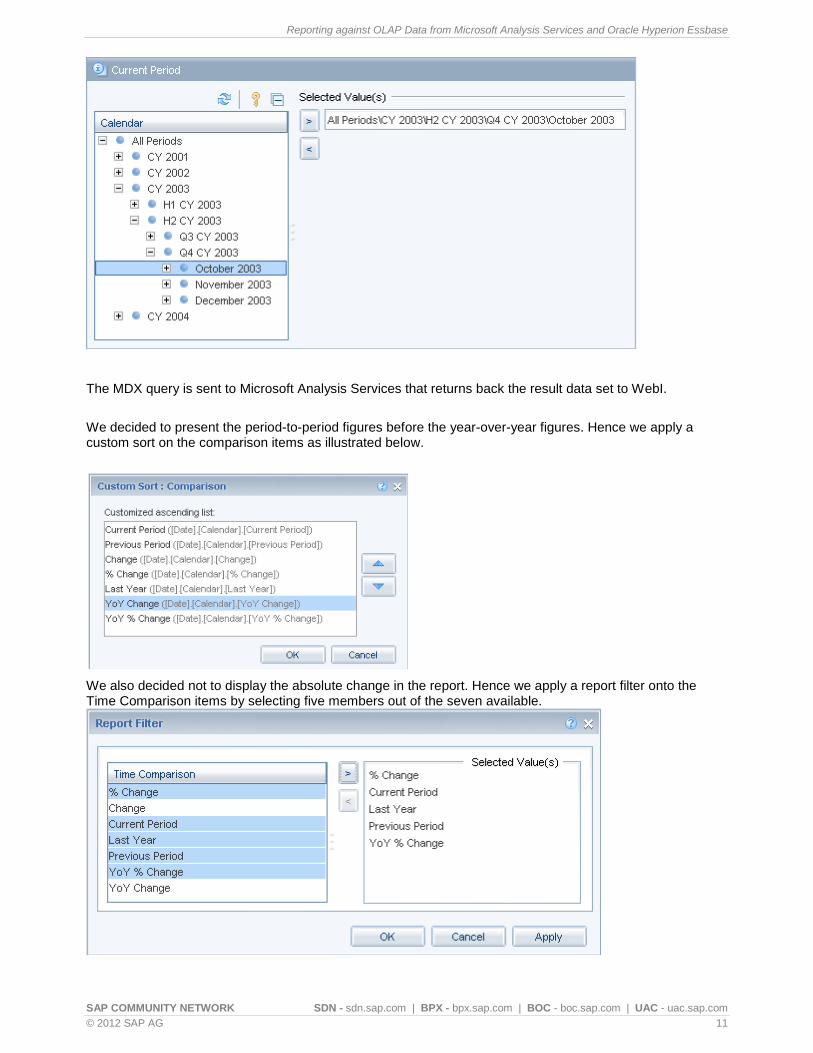
We choose the month of October 2003 as the current period. We could have chosen a quarter if we wanted quarterly aggregates.
Reporting against OLAP Data from Microsoft Analysis Services and Oracle Hyperion Essbase
SAP COMMUNITY NETWORK SDN - sdn.sap.com | BPX - bpx.sap.com | BOC - boc.sap.com | UAC - uac.sap.com
© 2012 SAP AG 11
The MDX query is sent to Microsoft Analysis Services that returns back the result data set to WebI.
We decided to present the period-to-period figures before the year-over-year figures. Hence we apply a custom sort on the comparison items as illustrated below.
We also decided not to display the absolute change in the report. Hence we apply a report filter onto the Time Comparison items by selecting five members out of the seven available.
Reporting against OLAP Data from Microsoft Analysis Services and Oracle Hyperion Essbase
SAP COMMUNITY NETWORK SDN - sdn.sap.com | BPX - bpx.sap.com | BOC - boc.sap.com | UAC - uac.sap.com
© 2012 SAP AG 12
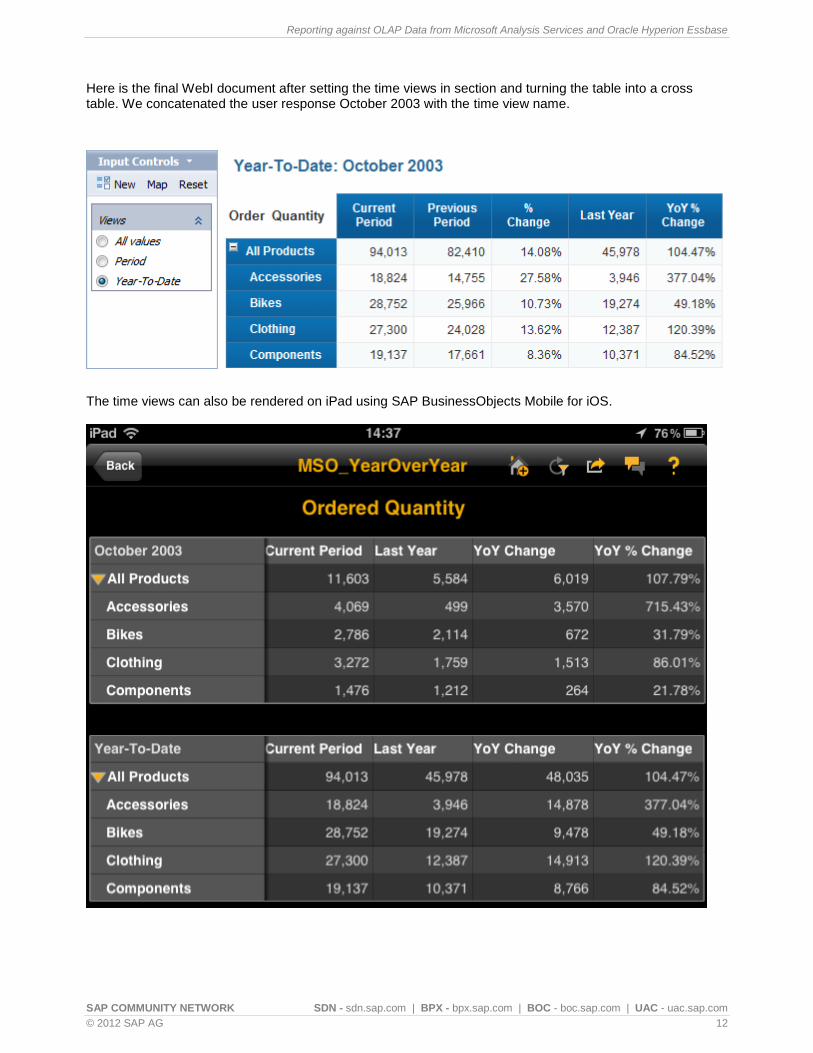
Here is the final WebI document after setting the time views in section and turning the table into a cross table. We concatenated the user response October 2003 with the time view name.
The time views can also be rendered on iPad using SAP BusinessObjects Mobile for iOS.
Reporting against OLAP Data from Microsoft Analysis Services and Oracle Hyperion Essbase
SAP COMMUNITY NETWORK SDN - sdn.sap.com | BPX - bpx.sap.com | BOC - boc.sap.com | UAC - uac.sap.com
© 2012 SAP AG 13
Custom Layouts
Some reports require presenting dimension members differently as they appear in the hierarchical structure of the OLAP cube. We will see in this chapter how we can accommodate specific layouts by extending the Business Layer with the appropriate MDX objects.
Grouping Members
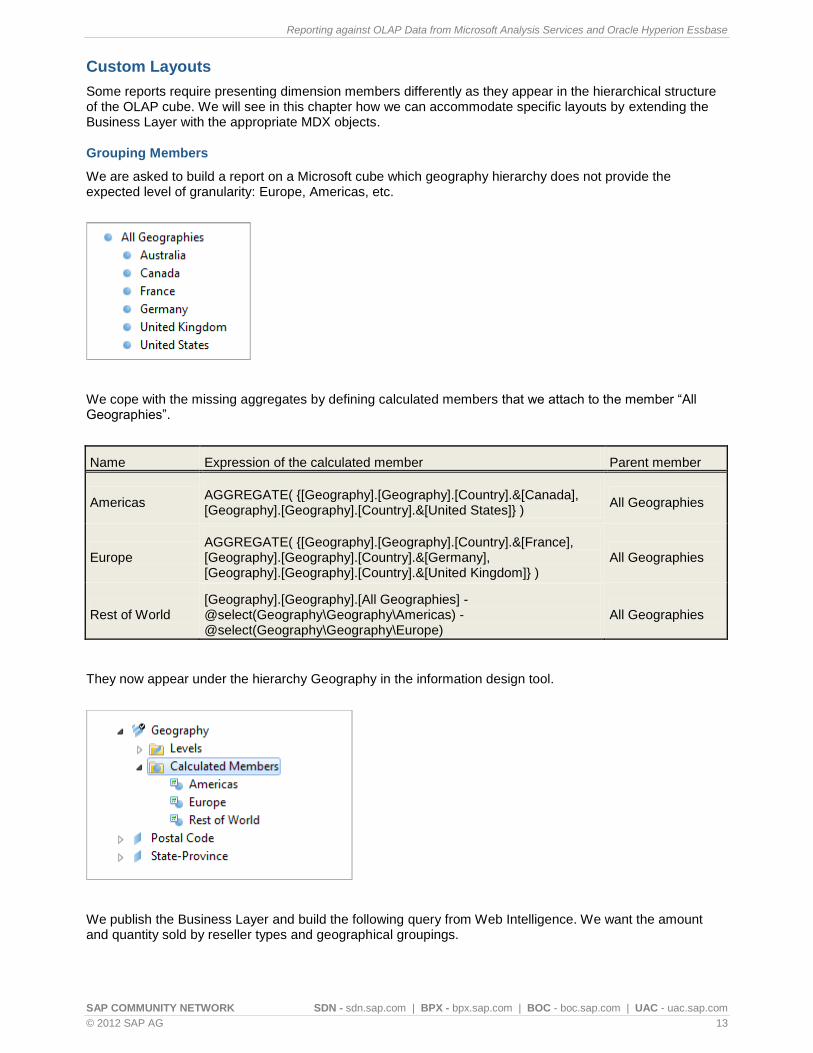
We are asked to build a report on a Microsoft cube which geography hierarchy does not provide the expected level of granularity: Europe, Americas, etc.
We cope with the missing aggregates by defining calculated members that we attach to the member “All Geographies”.
Name Expression of the calculated member Parent member
Americas AGGREGATE( {[Geography].[Geography].[Country].&[Canada], [Geography].[Geography].[Country].&[United States]} )
All Geographies
Europe AGGREGATE( {[Geography].[Geography].[Country].&[France], [Geography].[Geography].[Country].&[Germany], [Geography].[Geography].[Country].&[United Kingdom]} )
All Geographies
Rest of World [Geography].[Geography].[All Geographies] - @select(Geography\Geography\Americas) - @select(Geography\Geography\Europe)
All Geographies
They now appear under the hierarchy Geography in the information design tool.
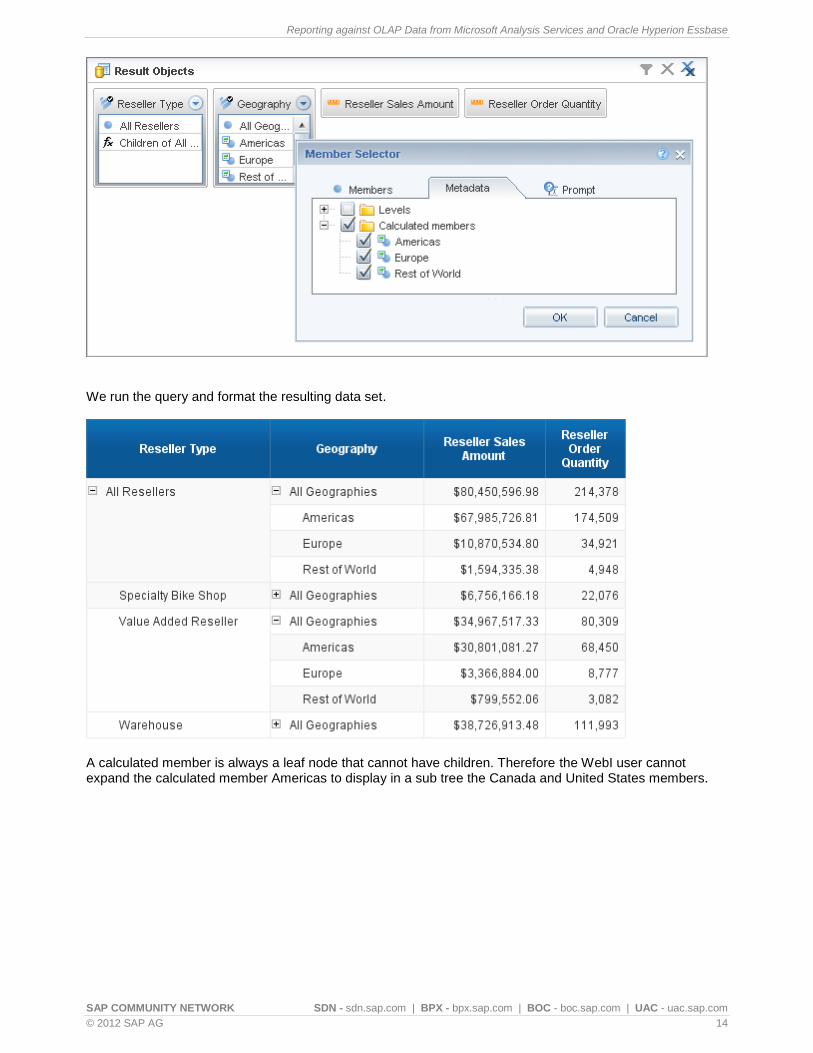
We publish the Business Layer and build the following query from Web Intelligence. We want the amount and quantity sold by reseller types and geographical groupings.
Reporting against OLAP Data from Microsoft Analysis Services and Oracle Hyperion Essbase
SAP COMMUNITY NETWORK SDN - sdn.sap.com | BPX - bpx.sap.com | BOC - boc.sap.com | UAC - uac.sap.com
© 2012 SAP AG 14
We run the query and format the resulting data set.
A calculated member is always a leaf node that cannot have children. Therefore the WebI user cannot expand the calculated member Americas to display in a sub tree the Canada and United States members.
Reporting against OLAP Data from Microsoft Analysis Services and Oracle Hyperion Essbase
SAP COMMUNITY NETWORK SDN - sdn.sap.com | BPX - bpx.sap.com | BOC - boc.sap.com | UAC - uac.sap.com
© 2012 SAP AG 15
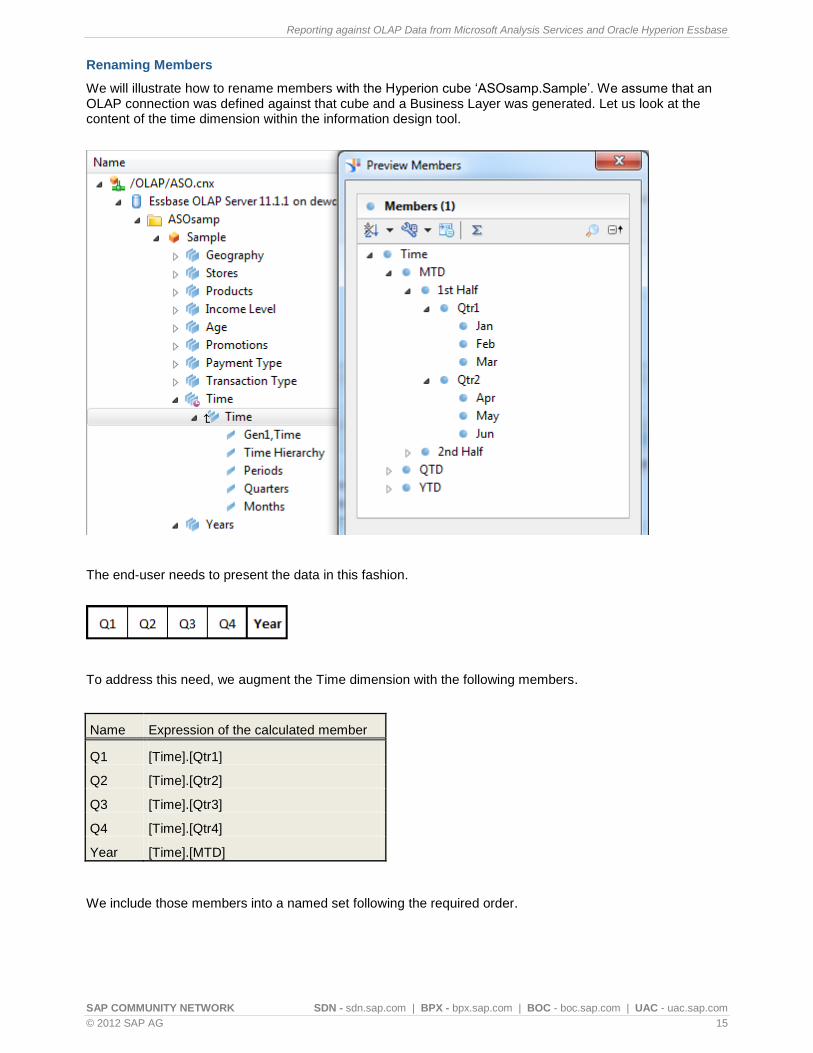
Renaming Members
We will illustrate how to rename members with the Hyperion cube „ASOsamp.Sample‟. We assume that an OLAP connection was defined against that cube and a Business Layer was generated. Let us look at the content of the time dimension within the information design tool.
The end-user needs to present the data in this fashion.
To address this need, we augment the Time dimension with the following members.
Name Expression of the calculated member
Q1 [Time].[Qtr1]
Q2 [Time].[Qtr2]
Q3 [Time].[Qtr3]
Q4 [Time].[Qtr4]
Year [Time].[MTD]
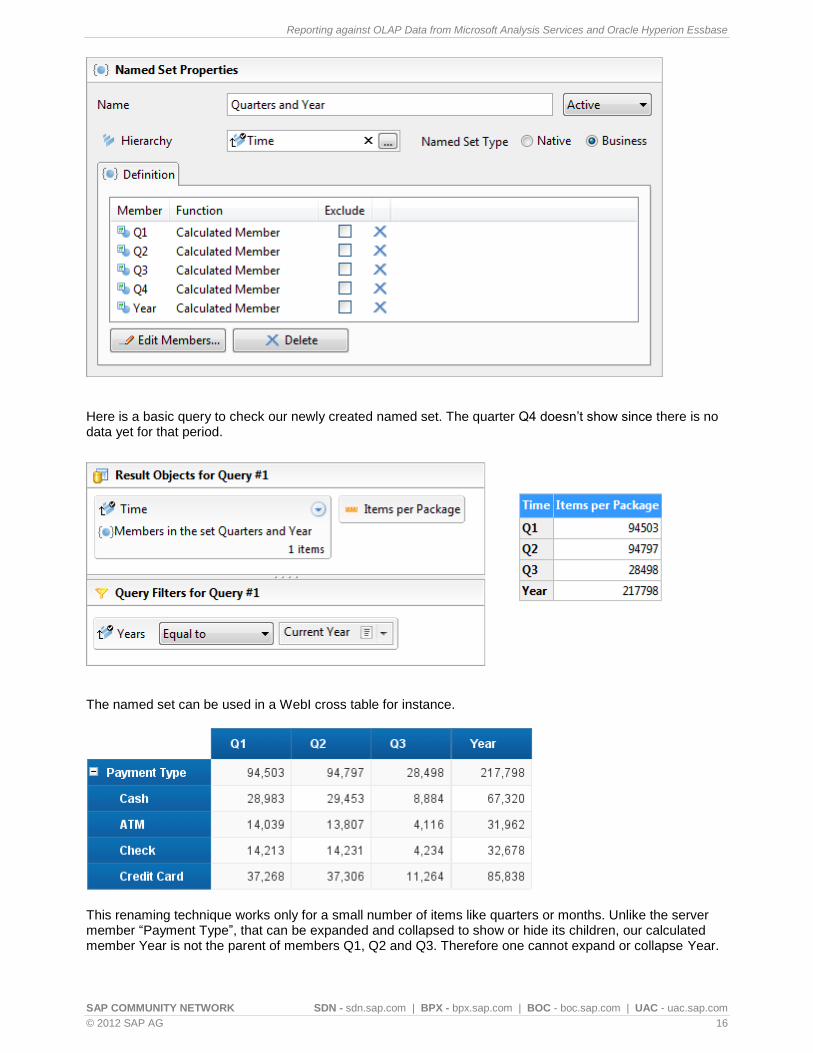
We include those members into a named set following the required order.
Reporting against OLAP Data from Microsoft Analysis Services and Oracle Hyperion Essbase
SAP COMMUNITY NETWORK SDN - sdn.sap.com | BPX - bpx.sap.com | BOC - boc.sap.com | UAC - uac.sap.com
© 2012 SAP AG 16
Here is a basic query to check our newly created named set. The quarter Q4 doesn‟t show since there is no data yet for that period.
The named set can be used in a WebI cross table for instance.
This renaming technique works only for a small number of items like quarters or months. Unlike the server member “Payment Type”, that can be expanded and collapsed to show or hide its children, our calculated member Year is not the parent of members Q1, Q2 and Q3. Therefore one cannot expand or collapse Year.
Reporting against OLAP Data from Microsoft Analysis Services and Oracle Hyperion Essbase
SAP COMMUNITY NETWORK SDN - sdn.sap.com | BPX - bpx.sap.com | BOC - boc.sap.com | UAC - uac.sap.com
© 2012 SAP AG 17
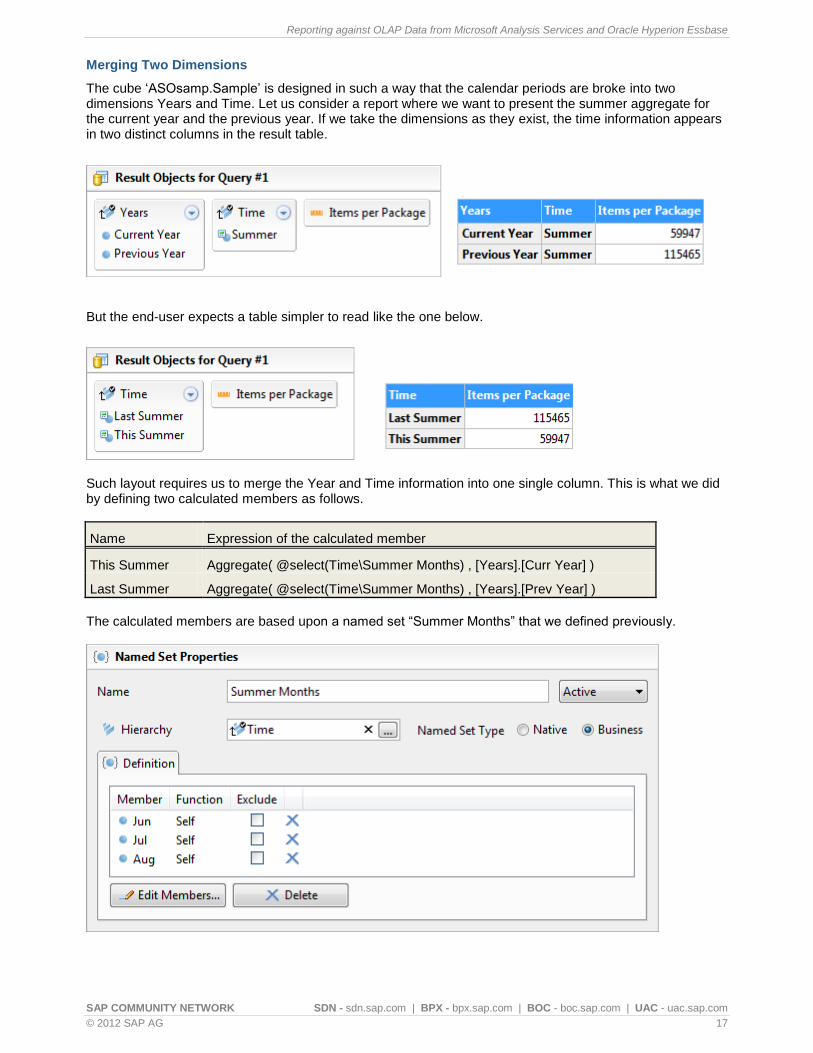
Merging Two Dimensions
The cube „ASOsamp.Sample‟ is designed in such a way that the calendar periods are broke into two dimensions Years and Time. Let us consider a report where we want to present the summer aggregate for the current year and the previous year. If we take the dimensions as they exist, the time information appears in two distinct columns in the result table.
But the end-user expects a table simpler to read like the one below.
Such layout requires us to merge the Year and Time information into one single column. This is what we did by defining two calculated members as follows.
Name Expression of the calculated member
This Summer Aggregate( @select(Time\Summer Months) , [Years].[Curr Year] )
Last Summer Aggregate( @select(Time\Summer Months) , [Years].[Prev Year] )
The calculated members are based upon a named set “Summer Months” that we defined previously.
Reporting against OLAP Data from Microsoft Analysis Services and Oracle Hyperion Essbase
SAP COMMUNITY NETWORK SDN - sdn.sap.com | BPX - bpx.sap.com | BOC - boc.sap.com | UAC - uac.sap.com
© 2012 SAP AG 18
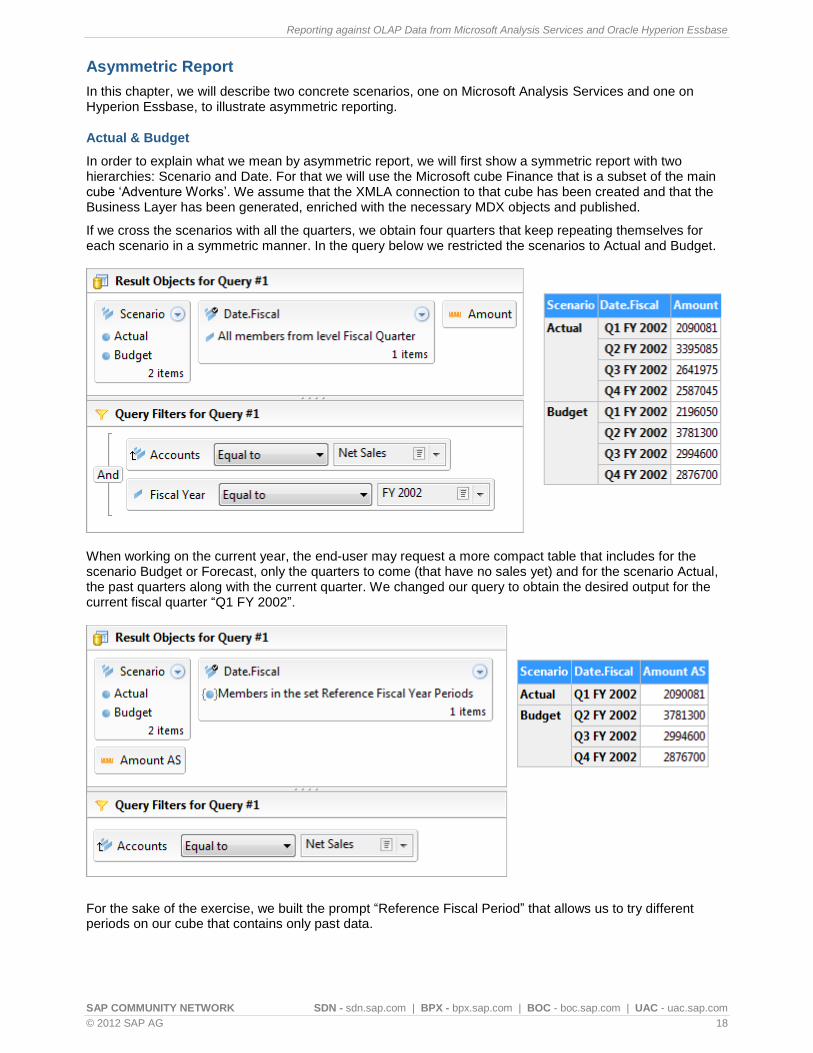
Asymmetric Report
In this chapter, we will describe two concrete scenarios, one on Microsoft Analysis Services and one on Hyperion Essbase, to illustrate asymmetric reporting.
Actual & Budget
In order to explain what we mean by asymmetric report, we will first show a symmetric report with two hierarchies: Scenario and Date. For that we will use the Microsoft cube Finance that is a subset of the main cube „Adventure Works‟. We assume that the XMLA connection to that cube has been created and that the Business Layer has been generated, enriched with the necessary MDX objects and published.
If we cross the scenarios with all the quarters, we obtain four quarters that keep repeating themselves for each scenario in a symmetric manner. In the query below we restricted the scenarios to Actual and Budget.
When working on the current year, the end-user may request a more compact table that includes for the scenario Budget or Forecast, only the quarters to come (that have no sales yet) and for the scenario Actual, the past quarters along with the current quarter. We changed our query to obtain the desired output for the current fiscal quarter “Q1 FY 2002”.
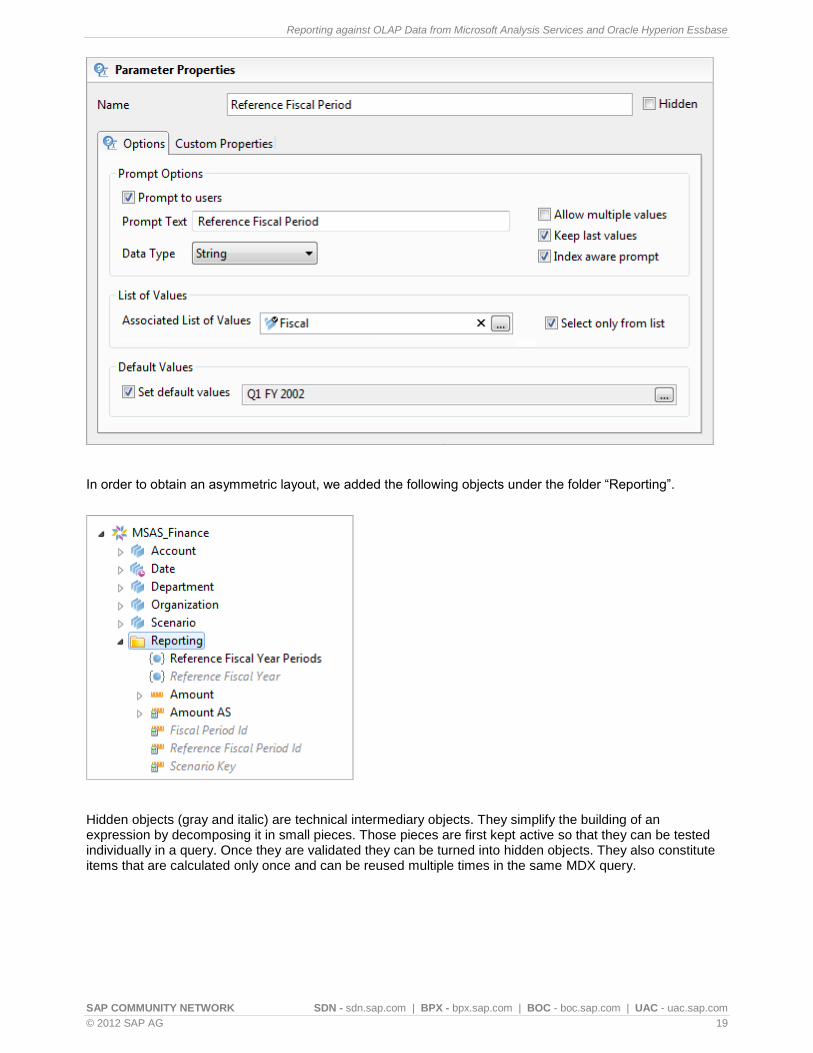
For the sake of the exercise, we built the prompt “Reference Fiscal Period” that allows us to try different periods on our cube that contains only past data.
Reporting against OLAP Data from Microsoft Analysis Services and Oracle Hyperion Essbase
SAP COMMUNITY NETWORK SDN - sdn.sap.com | BPX - bpx.sap.com | BOC - boc.sap.com | UAC - uac.sap.com
© 2012 SAP AG 19
In order to obtain an asymmetric layout, we added the following objects under the folder “Reporting”.
Hidden objects (gray and italic) are technical intermediary objects. They simplify the building of an expression by decomposing it in small pieces. Those pieces are first kept active so that they can be tested individually in a query. Once they are validated they can be turned into hidden objects. They also constitute items that are calculated only once and can be reused multiple times in the same MDX query.
Reporting against OLAP Data from Microsoft Analysis Services and Oracle Hyperion Essbase
SAP COMMUNITY NETWORK SDN - sdn.sap.com | BPX - bpx.sap.com | BOC - boc.sap.com | UAC - uac.sap.com
© 2012 SAP AG 20
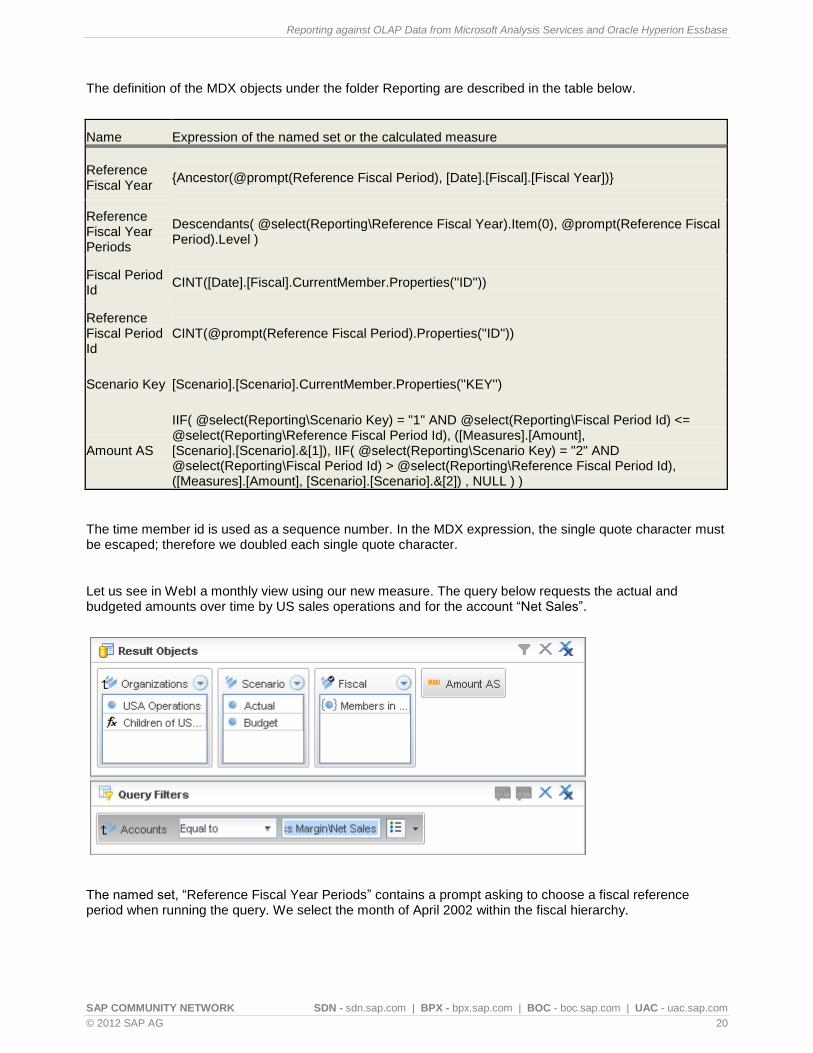
The definition of the MDX objects under the folder Reporting are described in the table below.
Name Expression of the named set or the calculated measure
Reference Fiscal Year
{Ancestor(@prompt(Reference Fiscal Period), [Date].[Fiscal].[Fiscal Year])}
Reference Fiscal Year Periods
Descendants( @select(Reporting\Reference Fiscal Year).Item(0), @prompt(Reference Fiscal Period).Level )
Fiscal Period Id
CINT([Date].[Fiscal].CurrentMember.Properties(''ID''))
Reference Fiscal Period Id
CINT(@prompt(Reference Fiscal Period).Properties(''ID''))
Scenario Key [Scenario].[Scenario].CurrentMember.Properties(''KEY'')
Amount AS
IIF( @select(Reporting\Scenario Key) = "1" AND @select(Reporting\Fiscal Period Id) <= @select(Reporting\Reference Fiscal Period Id), ([Measures].[Amount], [Scenario].[Scenario].&[1]), IIF( @select(Reporting\Scenario Key) = "2" AND @select(Reporting\Fiscal Period Id) > @select(Reporting\Reference Fiscal Period Id), ([Measures].[Amount], [Scenario].[Scenario].&[2]) , NULL ) )
The time member id is used as a sequence number. In the MDX expression, the single quote character must be escaped; therefore we doubled each single quote character.
Let us see in WebI a monthly view using our new measure. The query below requests the actual and budgeted amounts over time by US sales operations and for the account “Net Sales”.
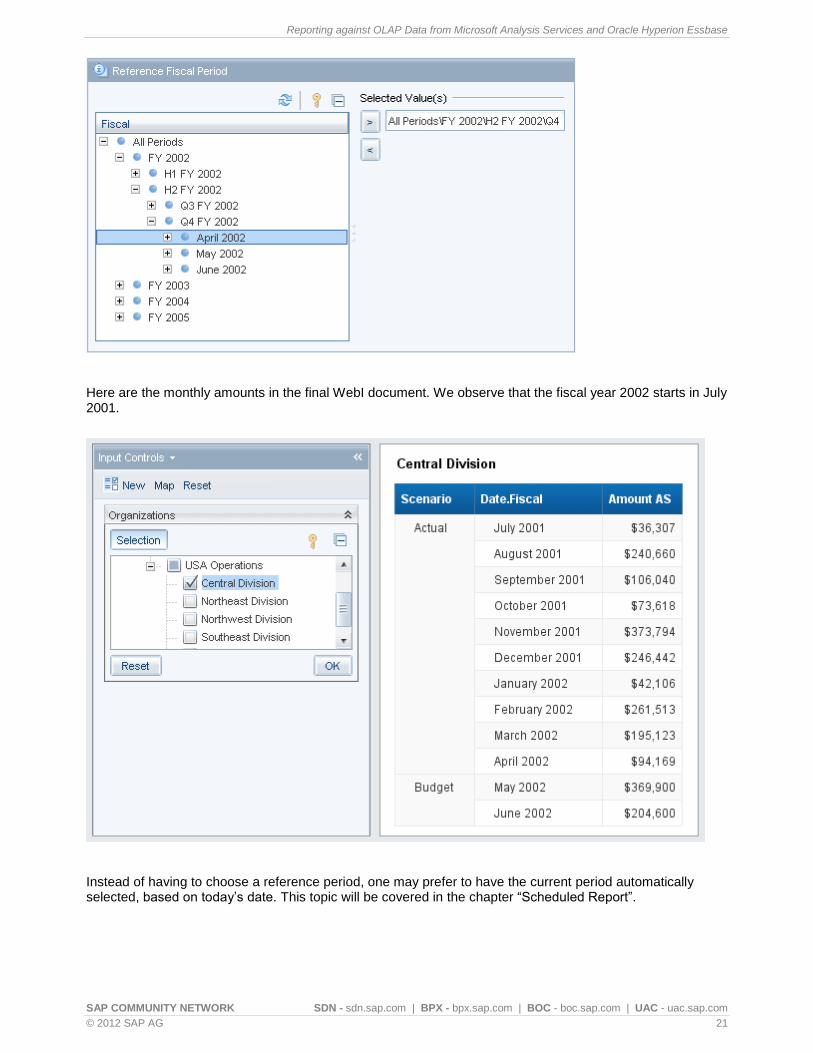
The named set, “Reference Fiscal Year Periods” contains a prompt asking to choose a fiscal reference period when running the query. We select the month of April 2002 within the fiscal hierarchy.
Reporting against OLAP Data from Microsoft Analysis Services and Oracle Hyperion Essbase
SAP COMMUNITY NETWORK SDN - sdn.sap.com | BPX - bpx.sap.com | BOC - boc.sap.com | UAC - uac.sap.com
© 2012 SAP AG 21
Here are the monthly amounts in the final WebI document. We observe that the fiscal year 2002 starts in July 2001.
Instead of having to choose a reference period, one may prefer to have the current period automatically selected, based on today‟s date. This topic will be covered in the chapter “Scheduled Report”.
Reporting against OLAP Data from Microsoft Analysis Services and Oracle Hyperion Essbase
SAP COMMUNITY NETWORK SDN - sdn.sap.com | BPX - bpx.sap.com | BOC - boc.sap.com | UAC - uac.sap.com
© 2012 SAP AG 22
Rolling Months
Our second scenario of asymmetric reporting occurs with the Hyperion cube „ASOsamp.Sample‟. In a previous example we have seen that in that particular cube the Years dimension is separated from the Time dimension.
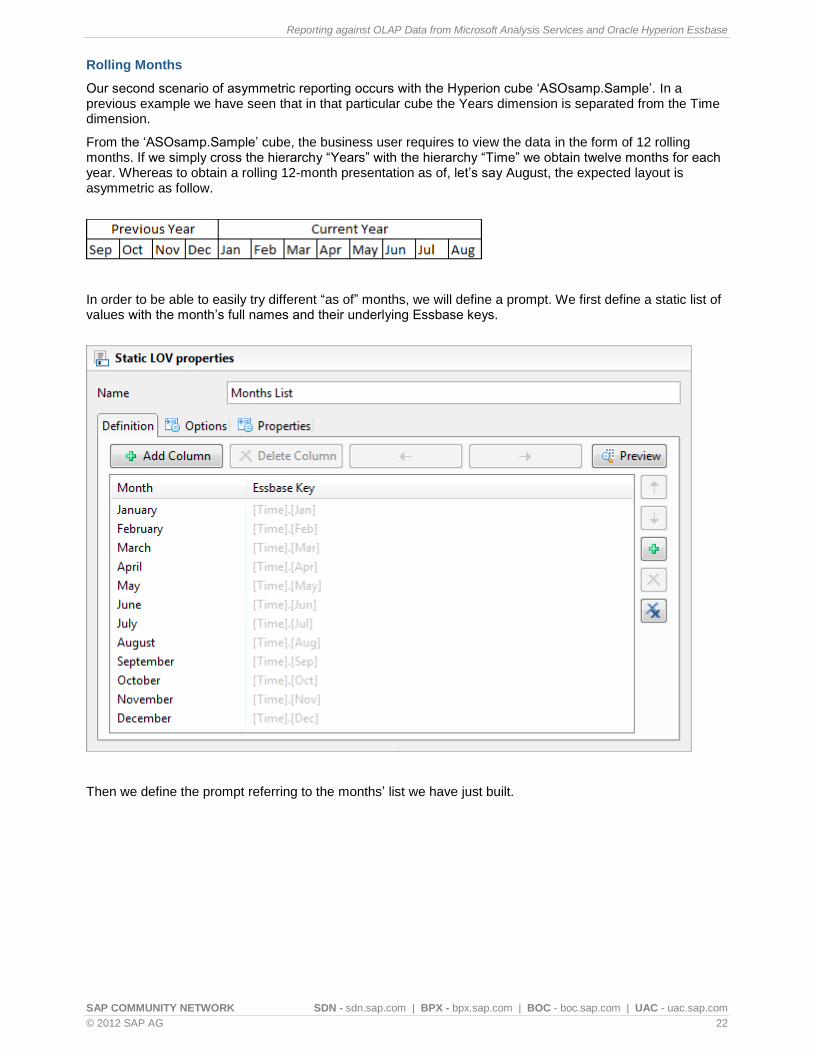
From the „ASOsamp.Sample‟ cube, the business user requires to view the data in the form of 12 rolling months. If we simply cross the hierarchy “Years” with the hierarchy “Time” we obtain twelve months for each year. Whereas to obtain a rolling 12-month presentation as of, let‟s say August, the expected layout is asymmetric as follow.
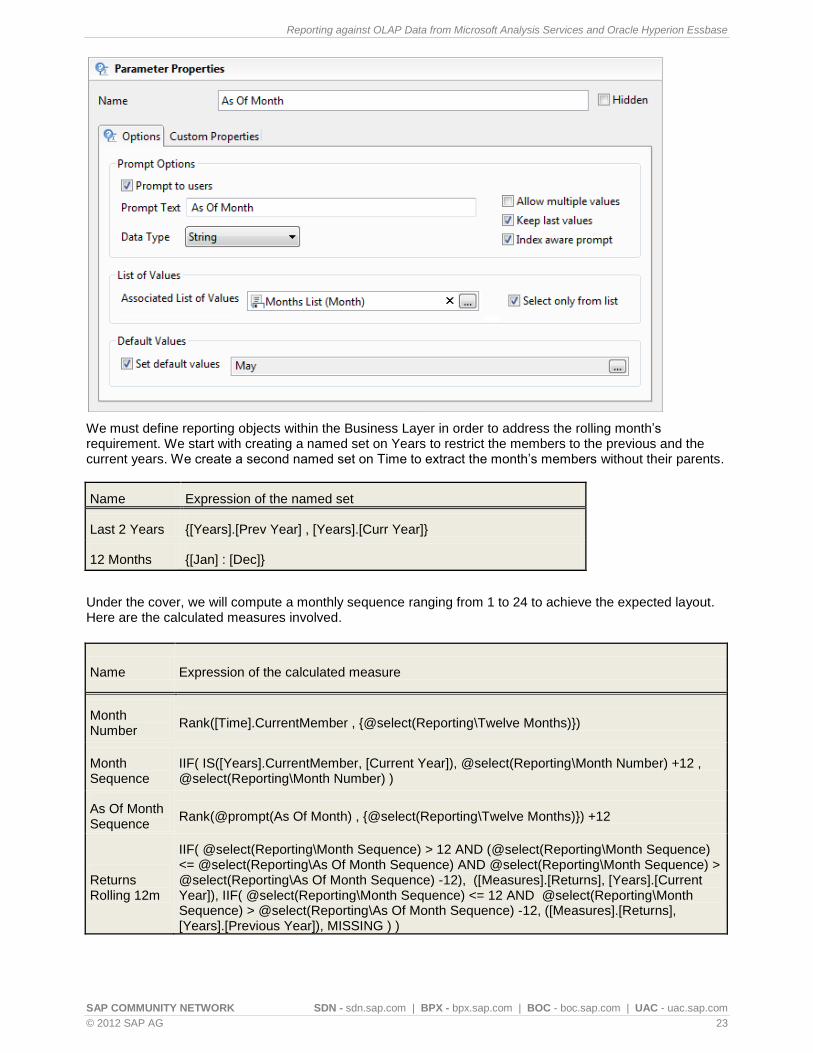
In order to be able to easily try different “as of” months, we will define a prompt. We first define a static list of values with the month‟s full names and their underlying Essbase keys.
Then we define the prompt referring to the months‟ list we have just built.
Reporting against OLAP Data from Microsoft Analysis Services and Oracle Hyperion Essbase
SAP COMMUNITY NETWORK SDN - sdn.sap.com | BPX - bpx.sap.com | BOC - boc.sap.com | UAC - uac.sap.com
© 2012 SAP AG 23
We must define reporting objects within the Business Layer in order to address the rolling month‟s requirement. We start with creating a named set on Years to restrict the members to the previous and the current years. We create a second named set on Time to extract the month‟s members without their parents.
Name Expression of the named set
Last 2 Years {[Years].[Prev Year] , [Years].[Curr Year]}
12 Months {[Jan] : [Dec]}
Under the cover, we will compute a monthly sequence ranging from 1 to 24 to achieve the expected layout. Here are the calculated measures involved.
Name Expression of the calculated measure
Month Number
Rank([Time].CurrentMember , {@select(Reporting\Twelve Months)})
Month Sequence
IIF( IS([Years].CurrentMember, [Current Year]), @select(Reporting\Month Number) +12 , @select(Reporting\Month Number) )
As Of Month Sequence
Rank(@prompt(As Of Month) , {@select(Reporting\Twelve Months)}) +12
Returns Rolling 12m
IIF( @select(Reporting\Month Sequence) > 12 AND (@select(Reporting\Month Sequence) <= @select(Reporting\As Of Month Sequence) AND @select(Reporting\Month Sequence) > @select(Reporting\As Of Month Sequence) -12), ([Measures].[Returns], [Years].[Current Year]), IIF( @select(Reporting\Month Sequence) <= 12 AND @select(Reporting\Month Sequence) > @select(Reporting\As Of Month Sequence) -12, ([Measures].[Returns], [Years].[Previous Year]), MISSING ) )
Reporting against OLAP Data from Microsoft Analysis Services and Oracle Hyperion Essbase
SAP COMMUNITY NETWORK SDN - sdn.sap.com | BPX - bpx.sap.com | BOC - boc.sap.com | UAC - uac.sap.com
© 2012 SAP AG 24
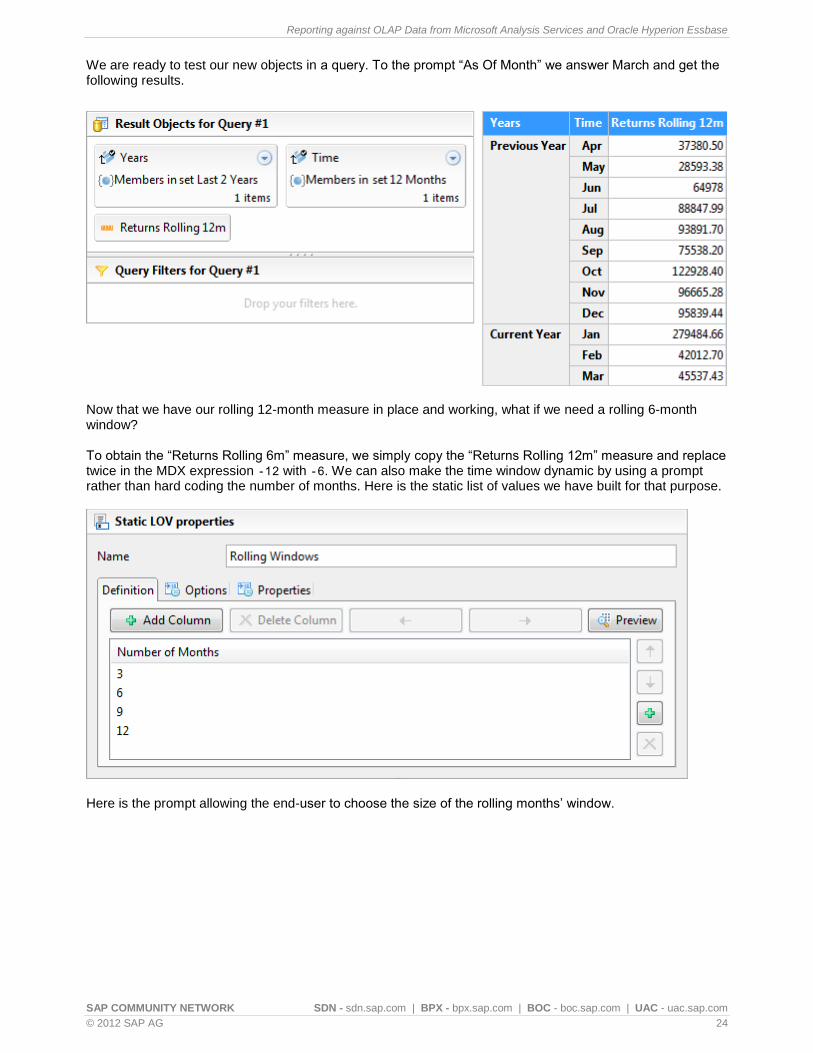
We are ready to test our new objects in a query. To the prompt “As Of Month” we answer March and get the following results.
Now that we have our rolling 12-month measure in place and working, what if we need a rolling 6-month window? To obtain the “Returns Rolling 6m” measure, we simply copy the “Returns Rolling 12m” measure and replace twice in the MDX expression -12 with -6. We can also make the time window dynamic by using a prompt rather than hard coding the number of months. Here is the static list of values we have built for that purpose.
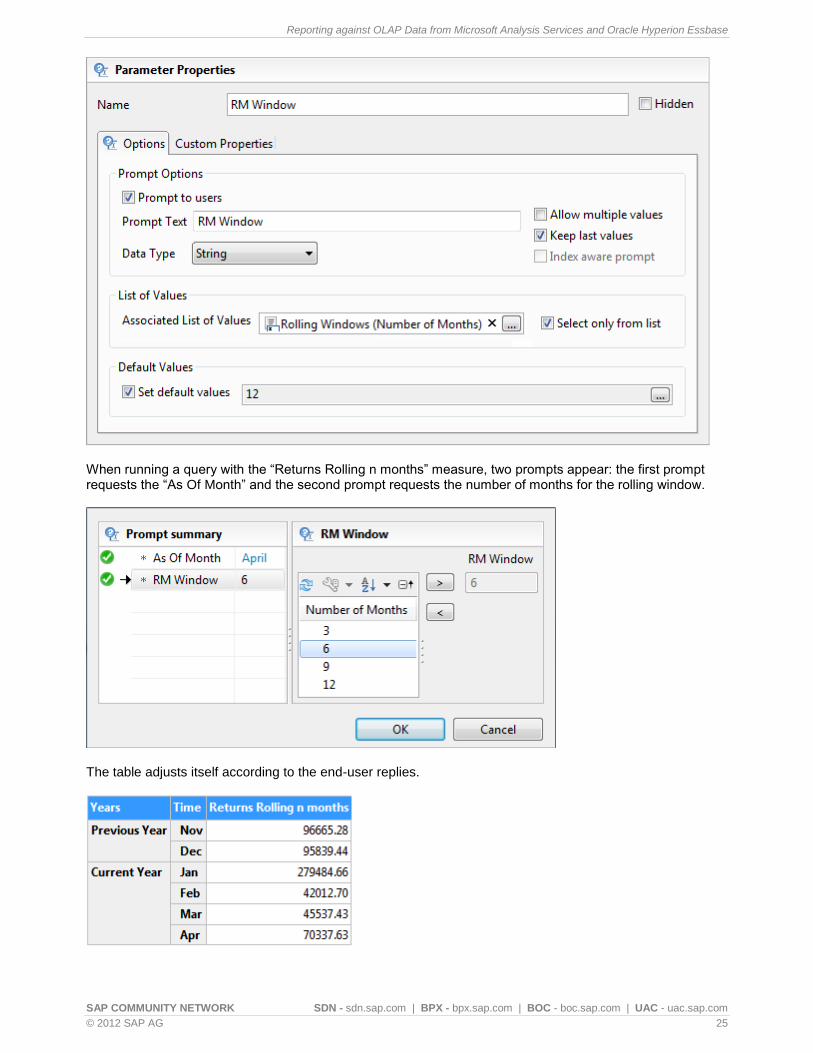
Here is the prompt allowing the end-user to choose the size of the rolling months‟ window.
Reporting against OLAP Data from Microsoft Analysis Services and Oracle Hyperion Essbase
SAP COMMUNITY NETWORK SDN - sdn.sap.com | BPX - bpx.sap.com | BOC - boc.sap.com | UAC - uac.sap.com
© 2012 SAP AG 25
When running a query with the “Returns Rolling n months” measure, two prompts appear: the first prompt requests the “As Of Month” and the second prompt requests the number of months for the rolling window.
The table adjusts itself according to the end-user replies.
Reporting against OLAP Data from Microsoft Analysis Services and Oracle Hyperion Essbase
SAP COMMUNITY NETWORK SDN - sdn.sap.com | BPX - bpx.sap.com | BOC - boc.sap.com | UAC - uac.sap.com
© 2012 SAP AG 26
One can make another step towards an even more generic query by prompting the measure. So far we have hard coded [Returns] in the measures MDX expressions. We copy the “Returns Rolling n months” measure and replace twice in the MDX expression [Measures].[Returns] with @prompt(Measure) to obtain the generic measure “Rolling n months”.
Name Expression of the calculated measure
Rolling n months
IIF( @select(Reporting\Month Sequence) > 12 AND (@select(Reporting\Month Sequence) <= @select(Reporting\As Of Month Sequence) AND @select(Reporting\Month Sequence) > @select(Reporting\As Of Month Sequence) -@prompt(RM Window)), (@prompt(Measure), [Years].[Current Year]), IIF( @select(Reporting\Month Sequence) <= 12 AND @select(Reporting\Month Sequence) > @select(Reporting\As Of Month Sequence) -@prompt(RM Window), (@prompt(Measure), [Years].[Previous Year]), MISSING ) )
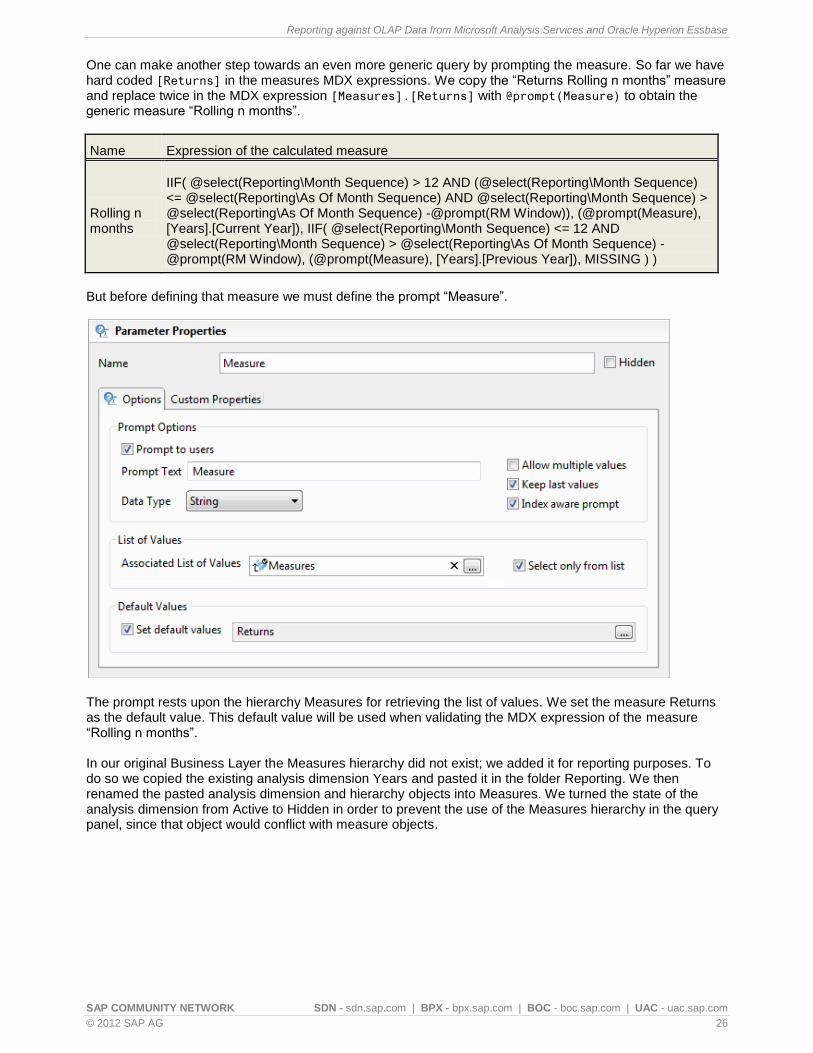
But before defining that measure we must define the prompt “Measure”.
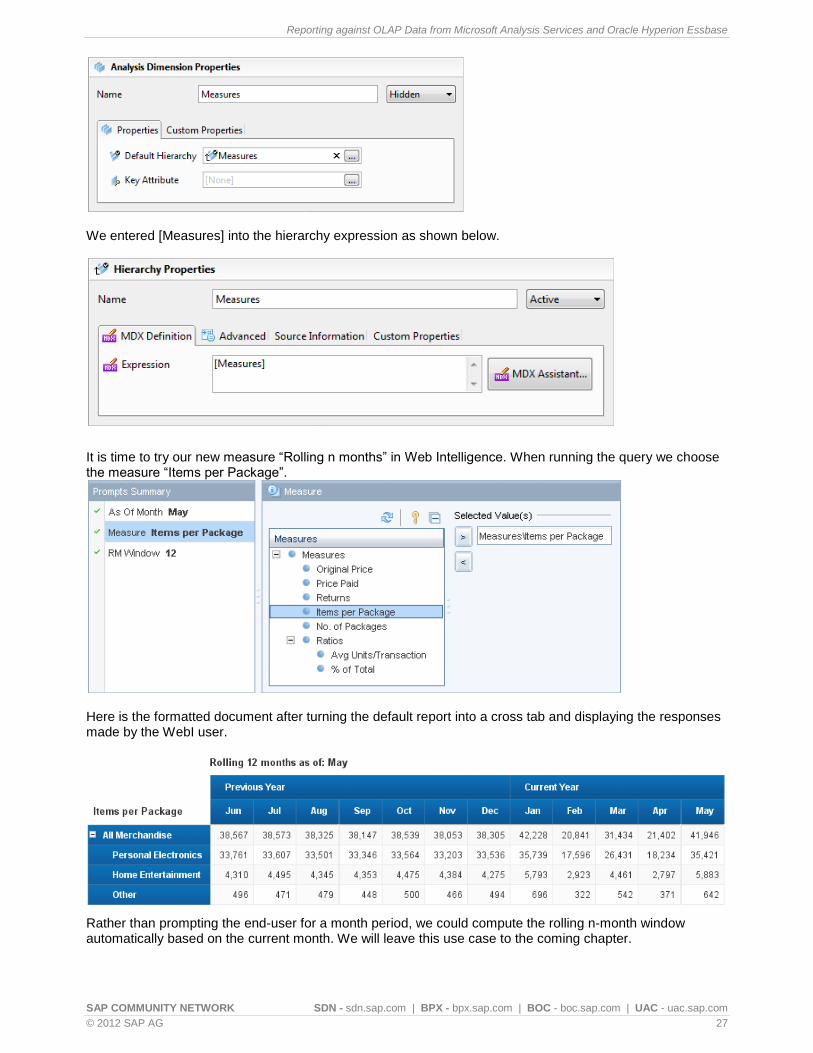
The prompt rests upon the hierarchy Measures for retrieving the list of values. We set the measure Returns as the default value. This default value will be used when validating the MDX expression of the measure “Rolling n months”. In our original Business Layer the Measures hierarchy did not exist; we added it for reporting purposes. To do so we copied the existing analysis dimension Years and pasted it in the folder Reporting. We then renamed the pasted analysis dimension and hierarchy objects into Measures. We turned the state of the analysis dimension from Active to Hidden in order to prevent the use of the Measures hierarchy in the query panel, since that object would conflict with measure objects.
Reporting against OLAP Data from Microsoft Analysis Services and Oracle Hyperion Essbase
SAP COMMUNITY NETWORK SDN - sdn.sap.com | BPX - bpx.sap.com | BOC - boc.sap.com | UAC - uac.sap.com
© 2012 SAP AG 27
We entered [Measures] into the hierarchy expression as shown below.
It is time to try our new measure “Rolling n months” in Web Intelligence. When running the query we choose the measure “Items per Package”.
Here is the formatted document after turning the default report into a cross tab and displaying the responses made by the WebI user.
Rather than prompting the end-user for a month period, we could compute the rolling n-month window automatically based on the current month. We will leave this use case to the coming chapter.

Reporting against OLAP Data from Microsoft Analysis Services and Oracle Hyperion Essbase
SAP COMMUNITY NETWORK SDN - sdn.sap.com | BPX - bpx.sap.com | BOC - boc.sap.com | UAC - uac.sap.com
© 2012 SAP AG 28
Scheduled Report
Automating the refresh of a report to bring the latest data into the document is a recurrent requirement. In this chapter we will see how to leverage MDX functions in order to retrieve current time periods without requiring human intervention.
Current Calendar Period
Let us continue with the Hyperion cube „ASOsamp.Sample‟. Today is June 5th and we need a query that
automatically selects the current month (June) or the current quarter (Q2) like this.
Here are the definitions of the two named sets.
Name Expression of the named set
Today's Month
{ StrToMbr( Left(FormatDate(Today(),"mon dd yyyy"),3) ) }
Today's Quarter
{ StrToMbr( Concat("Qtr", Left(NumToStr(DatePart(Today(),DP_QUARTER)),1)) ) }
We extract the current date from the Essbase server by using the MDX function Today(). From there, we format the required period information like month or quarter so that it matches the Time member key in the Essbase cube. Finally we convert the string into a Time member using the MDX function StrToMbr().
An alternative solution is to work with substitution variables. Substitution variable is a Hyperion Essbase feature to manage information that changes like current month or current year. Assuming the Essbase variable CurMth holds the current month, we could define a named set as detailed below.
Name Expression of the named set
Current Month { [Time].[&CurMth] }
When running the query, the &CurMth expression is replaced automatically by the Essbase engine with a string value like May or Jun for instance.
Both techniques, either using the Essbase server date or using a substitution variable, can be applied to the rolling months‟ scenario we saw earlier. Here is the measure that computes a 12-month rolling window based on the current date.
Reporting against OLAP Data from Microsoft Analysis Services and Oracle Hyperion Essbase
SAP COMMUNITY NETWORK SDN - sdn.sap.com | BPX - bpx.sap.com | BOC - boc.sap.com | UAC - uac.sap.com
© 2012 SAP AG 29
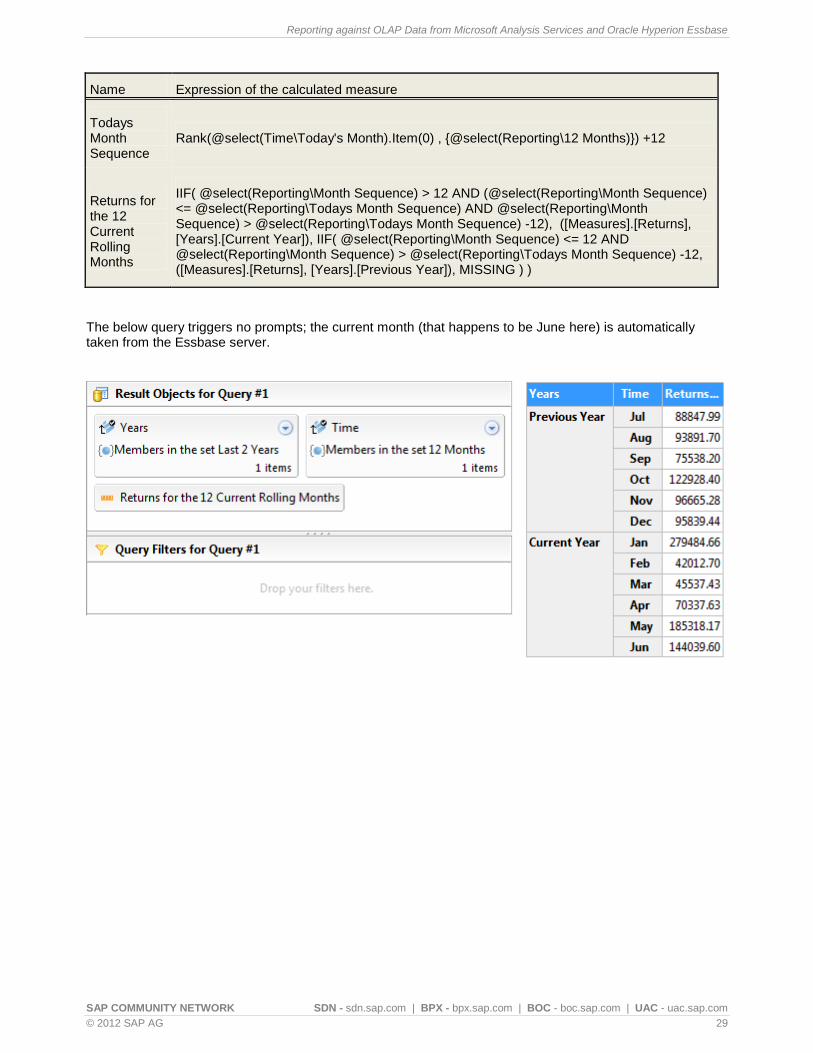
Name Expression of the calculated measure
Todays Month Sequence
Rank(@select(Time\Today's Month).Item(0) , {@select(Reporting\12 Months)}) +12
Returns for the 12 Current Rolling Months
IIF( @select(Reporting\Month Sequence) > 12 AND (@select(Reporting\Month Sequence) <= @select(Reporting\Todays Month Sequence) AND @select(Reporting\Month Sequence) > @select(Reporting\Todays Month Sequence) -12), ([Measures].[Returns], [Years].[Current Year]), IIF( @select(Reporting\Month Sequence) <= 12 AND @select(Reporting\Month Sequence) > @select(Reporting\Todays Month Sequence) -12, ([Measures].[Returns], [Years].[Previous Year]), MISSING ) )
The below query triggers no prompts; the current month (that happens to be June here) is automatically taken from the Essbase server.
Reporting against OLAP Data from Microsoft Analysis Services and Oracle Hyperion Essbase
SAP COMMUNITY NETWORK SDN - sdn.sap.com | BPX - bpx.sap.com | BOC - boc.sap.com | UAC - uac.sap.com
© 2012 SAP AG 30
Current Fiscal Period
Business users often work with fiscal periods. Our next use case consists of finding automatically the current fiscal quarter based on the database server date. For that we will go back to our Business Layer “Finance” that we built earlier on top of Microsoft Analysis Services.
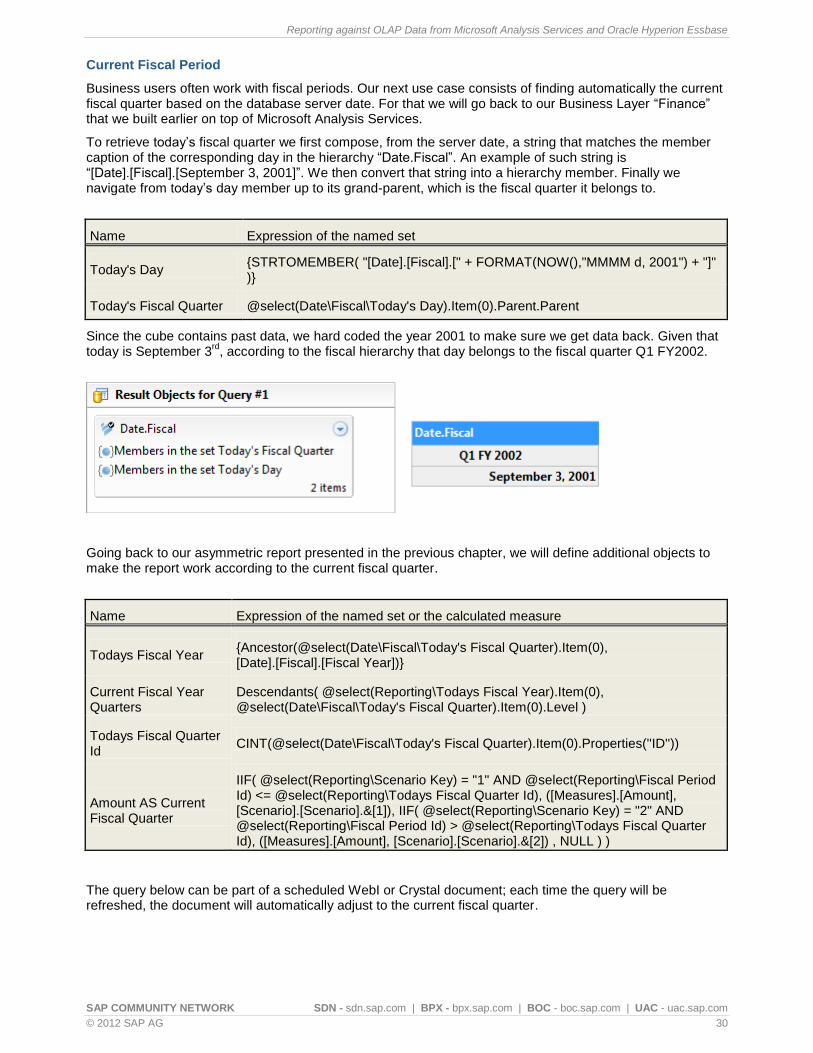
To retrieve today‟s fiscal quarter we first compose, from the server date, a string that matches the member caption of the corresponding day in the hierarchy “Date.Fiscal”. An example of such string is “[Date].[Fiscal].[September 3, 2001]”. We then convert that string into a hierarchy member. Finally we navigate from today‟s day member up to its grand-parent, which is the fiscal quarter it belongs to.
Name Expression of the named set
Today's Day {STRTOMEMBER( "[Date].[Fiscal].[" + FORMAT(NOW(),"MMMM d, 2001") + "]" )}
Today's Fiscal Quarter @select(Date\Fiscal\Today's Day).Item(0).Parent.Parent
Since the cube contains past data, we hard coded the year 2001 to make sure we get data back. Given that today is September 3
rd, according to the fiscal hierarchy that day belongs to the fiscal quarter Q1 FY2002.
Going back to our asymmetric report presented in the previous chapter, we will define additional objects to make the report work according to the current fiscal quarter.
Name Expression of the named set or the calculated measure
Todays Fiscal Year {Ancestor(@select(Date\Fiscal\Today's Fiscal Quarter).Item(0), [Date].[Fiscal].[Fiscal Year])}
Current Fiscal Year Quarters
Descendants( @select(Reporting\Todays Fiscal Year).Item(0), @select(Date\Fiscal\Today's Fiscal Quarter).Item(0).Level )
Todays Fiscal Quarter Id
CINT(@select(Date\Fiscal\Today's Fiscal Quarter).Item(0).Properties(''ID''))
Amount AS Current Fiscal Quarter
IIF( @select(Reporting\Scenario Key) = "1" AND @select(Reporting\Fiscal Period Id) <= @select(Reporting\Todays Fiscal Quarter Id), ([Measures].[Amount], [Scenario].[Scenario].&[1]), IIF( @select(Reporting\Scenario Key) = "2" AND @select(Reporting\Fiscal Period Id) > @select(Reporting\Todays Fiscal Quarter Id), ([Measures].[Amount], [Scenario].[Scenario].&[2]) , NULL ) )
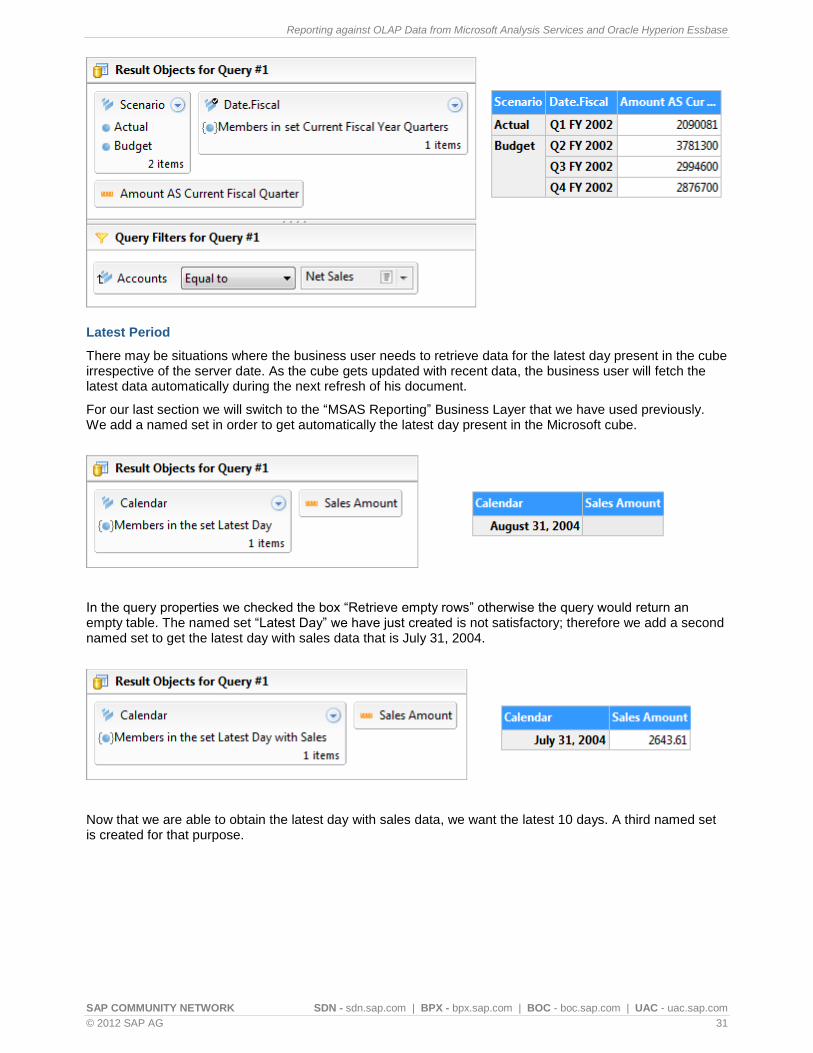
The query below can be part of a scheduled WebI or Crystal document; each time the query will be refreshed, the document will automatically adjust to the current fiscal quarter.
Reporting against OLAP Data from Microsoft Analysis Services and Oracle Hyperion Essbase
SAP COMMUNITY NETWORK SDN - sdn.sap.com | BPX - bpx.sap.com | BOC - boc.sap.com | UAC - uac.sap.com
© 2012 SAP AG 31
Latest Period
There may be situations where the business user needs to retrieve data for the latest day present in the cube irrespective of the server date. As the cube gets updated with recent data, the business user will fetch the latest data automatically during the next refresh of his document.
For our last section we will switch to the “MSAS Reporting” Business Layer that we have used previously. We add a named set in order to get automatically the latest day present in the Microsoft cube.
In the query properties we checked the box “Retrieve empty rows” otherwise the query would return an empty table. The named set “Latest Day” we have just created is not satisfactory; therefore we add a second named set to get the latest day with sales data that is July 31, 2004.
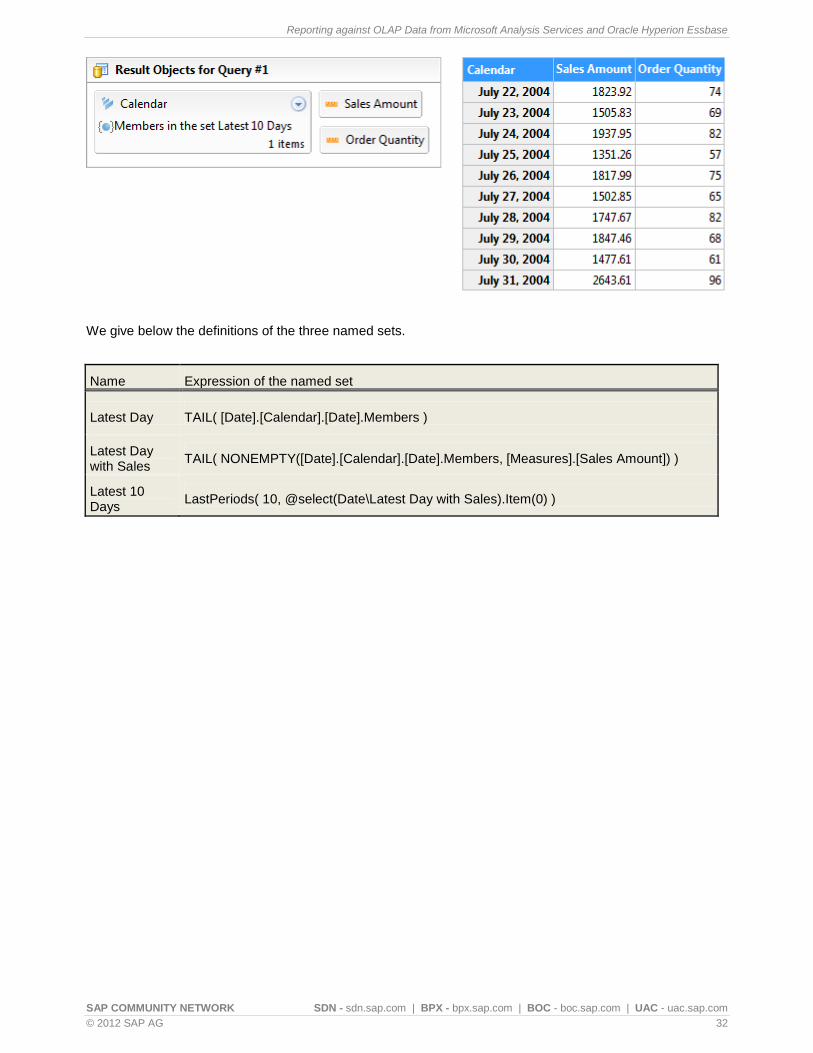
Now that we are able to obtain the latest day with sales data, we want the latest 10 days. A third named set is created for that purpose.
Reporting against OLAP Data from Microsoft Analysis Services and Oracle Hyperion Essbase
SAP COMMUNITY NETWORK SDN - sdn.sap.com | BPX - bpx.sap.com | BOC - boc.sap.com | UAC - uac.sap.com
© 2012 SAP AG 32
We give below the definitions of the three named sets.
Name Expression of the named set
Latest Day TAIL( [Date].[Calendar].[Date].Members )
Latest Day with Sales
TAIL( NONEMPTY([Date].[Calendar].[Date].Members, [Measures].[Sales Amount]) )
Latest 10 Days
LastPeriods( 10, @select(Date\Latest Day with Sales).Item(0) )
Reporting against OLAP Data from Microsoft Analysis Services and Oracle Hyperion Essbase
SAP COMMUNITY NETWORK SDN - sdn.sap.com | BPX - bpx.sap.com | BOC - boc.sap.com | UAC - uac.sap.com
© 2012 SAP AG 33
Related Content
Profiling and Bucketing dimension members on Microsoft OLAP and Hyperion Essbase
Sample Universe on Microsoft OLAP cube
Create an OLAP connection to an Oracle Essbase 11 cube
Create an OLAP connection to a Microsoft Analysis Services 2008 cube
Reporting against OLAP Data from Microsoft Analysis Services and Oracle Hyperion Essbase
SAP COMMUNITY NETWORK SDN - sdn.sap.com | BPX - bpx.sap.com | BOC - boc.sap.com | UAC - uac.sap.com
© 2012 SAP AG 34
Copyright
© Copyright 2012 SAP AG. All rights reserved.
No part of this publication may be reproduced or transmitted in any form or for any purpose without the express permission of SAP AG. The information contained herein may be changed without prior notice.
Some software products marketed by SAP AG and its distributors contain proprietary software components of other software vendors.
Microsoft, Windows, Excel, Outlook, and PowerPoint are registered trademarks of Microsoft Corporation.
IBM, DB2, DB2 Universal Database, System i, System i5, System p, System p5, System x, System z, System z10, System z9, z10, z9, iSeries, pSeries, xSeries, zSeries, eServer, z/VM, z/OS, i5/OS, S/390, OS/390, OS/400, AS/400, S/390 Parallel Enterprise Server, PowerVM, Power Architecture, POWER6+, POWER6, POWER5+, POWER5, POWER, OpenPower, PowerPC, BatchPipes, BladeCenter, System Storage, GPFS, HACMP, RETAIN, DB2 Connect, RACF, Redbooks, OS/2, Parallel Sysplex, MVS/ESA, AIX, Intelligent Miner, WebSphere, Netfinity, Tivoli and Informix are trademarks or registered trademarks of IBM Corporation.
Linux is the registered trademark of Linus Torvalds in the U.S. and other countries.
Adobe, the Adobe logo, Acrobat, PostScript, and Reader are either trademarks or registered trademarks of Adobe Systems Incorporated in the United States and/or other countries.
Oracle is a registered trademark of Oracle Corporation.
UNIX, X/Open, OSF/1, and Motif are registered trademarks of the Open Group.
Citrix, ICA, Program Neighborhood, MetaFrame, WinFrame, VideoFrame, and MultiWin are trademarks or registered trademarks of Citrix Systems, Inc.
HTML, XML, XHTML and W3C are trademarks or registered trademarks of W3C®, World Wide Web Consortium, Massachusetts Institute of Technology.
Java is a registered trademark of Sun Microsystems, Inc.
JavaScript is a registered trademark of Sun Microsystems, Inc., used under license for technology invented and implemented by Netscape.
SAP, R/3, SAP NetWeaver, Duet, PartnerEdge, ByDesign, SAP Business ByDesign, and other SAP products and services mentioned herein as well as their respective logos are trademarks or registered trademarks of SAP AG in Germany and other countries.
Business Objects and the Business Objects logo, BusinessObjects, Crystal Reports, Crystal Decisions, Web Intelligence, Xcelsius, and other Business Objects products and services mentioned herein as well as their respective logos are trademarks or registered trademarks of Business Objects S.A. in the United States and in other countries. Business Objects is an SAP company.
All other product and service names mentioned are the trademarks of their respective companies. Data contained in this document serves informational purposes only. National product specifications may vary.
These materials are subject to change without notice. These materials are provided by SAP AG and its affiliated companies ("SAP Group") for informational purposes only, without representation or warranty of any kind, and SAP Group shall not be liable for errors or omissions with respect to the materials. The only warranties for SAP Group products and services are those that are set forth in the express warranty statements accompanying such products and services, if any. Nothing herein should be construed as constituting an additional warranty.