Reporter: Haijun Tian Alex Szalay, Mark Neyrinck, Tamas Budavari arXiv:1011.2481.
28
Reporter: Haijun Tian Alex Szalay, Mark Neyrinck, Tamas Budavari arXiv:1011.2481
-
Upload
wesley-perkins -
Category
Documents
-
view
212 -
download
0
Transcript of Reporter: Haijun Tian Alex Szalay, Mark Neyrinck, Tamas Budavari arXiv:1011.2481.
Reporter: Haijun Tian Alex Szalay, Mark Neyrinck, Tamas
Budavari
arXiv:1011.2481

Background Redshift Space in Linear Theory Measurement from simulations Measurement from SDSS Quantifying the redshift space features Conclusion
Acoustic Oscillations: the competition between the photon pressure and the baryons gravitational collapse prior to the epoch of recombination
The Redshift Space Distortion: Due to the peculiar velocity Smaller Scale: dominated by nonlinear (FoG’s) Larger Scale: present as compression effect along LOS It is relative to Real Space
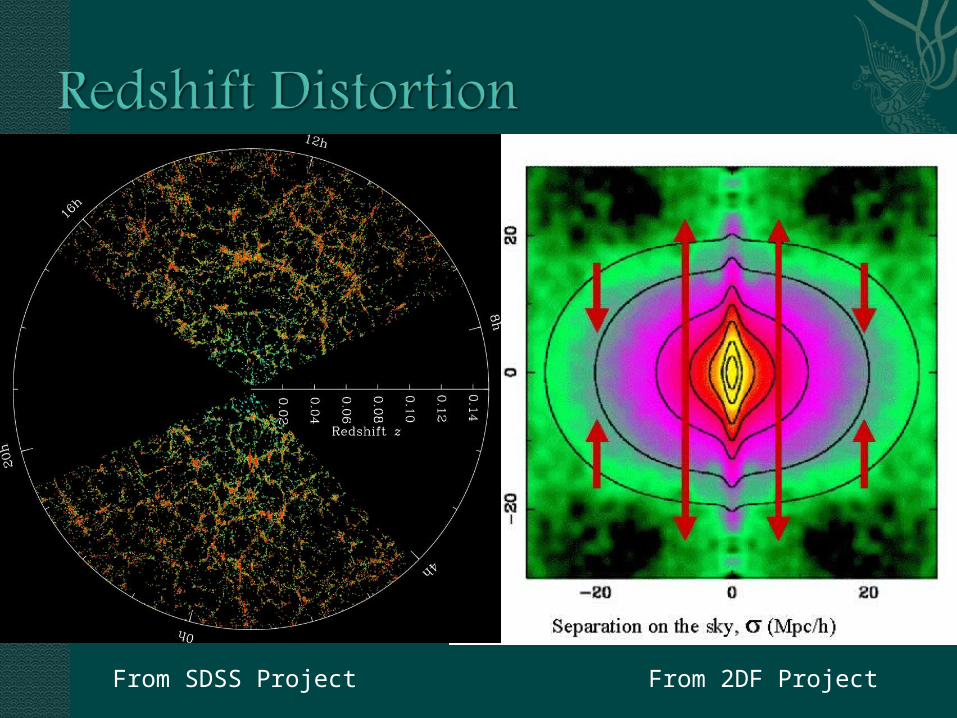
From 2DF ProjectFrom SDSS Project

Eisenstein et al (2005) – LRG
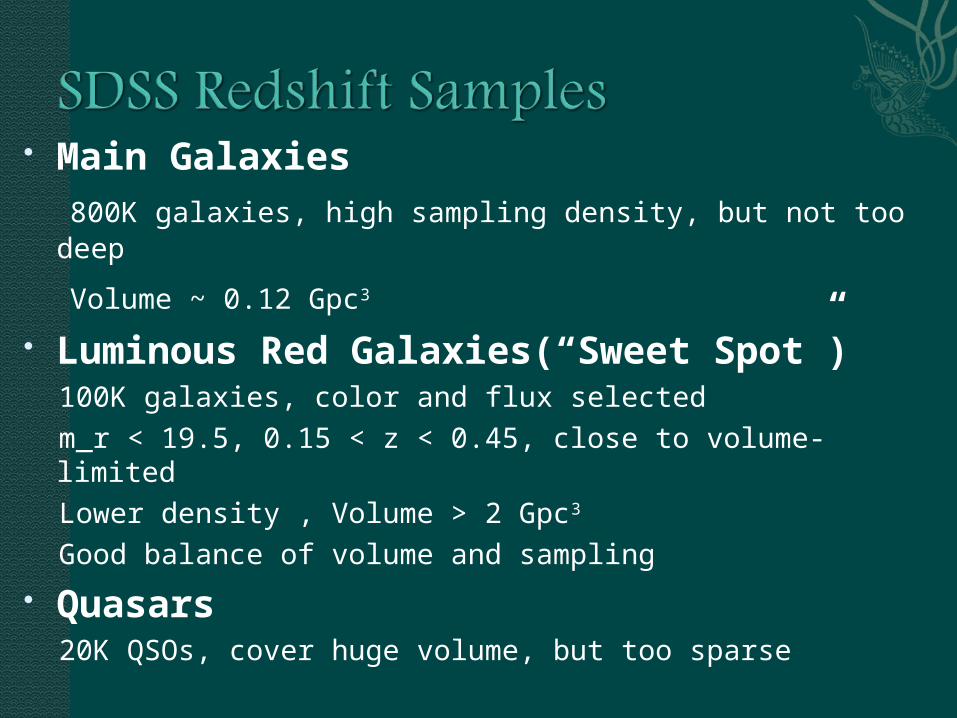
Main Galaxies 800K galaxies, high sampling density, but not too deep
Volume ~ 0.12 Gpc3
Luminous Red Galaxies(“Sweet Spot”)
100K galaxies, color and flux selected m_r < 19.5, 0.15 < z < 0.45, close to volume-limited Lower density , Volume > 2 Gpc3 Good balance of volume and sampling
Quasars 20K QSOs, cover huge volume, but too sparse
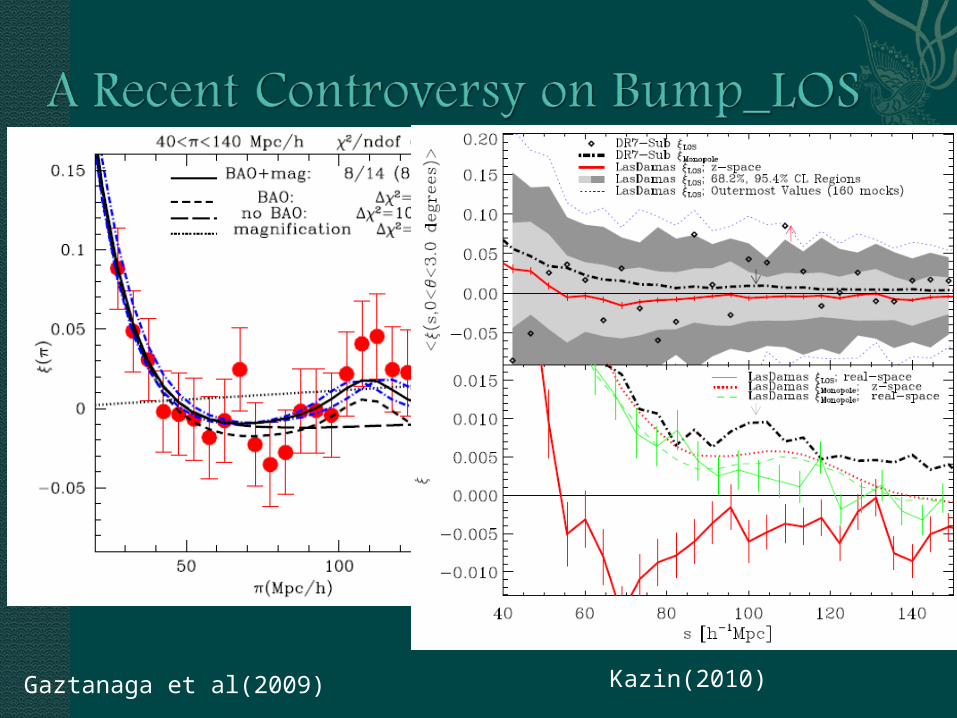
Gaztanaga et al(2009) Kazin(2010)
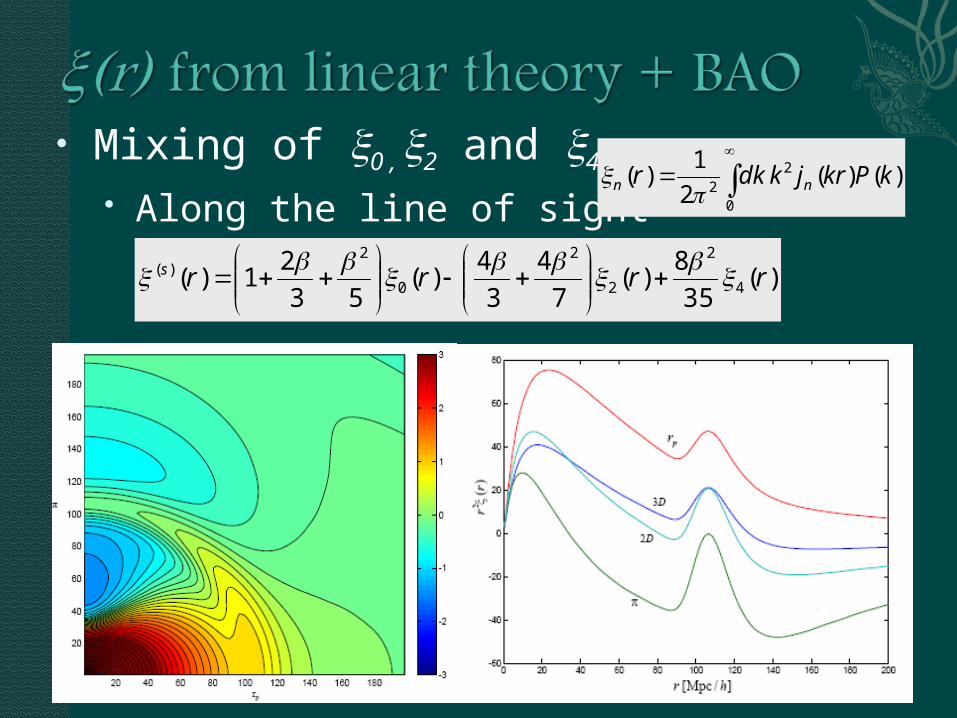
Mixing of 0 , 2 and 4
Along the line of sight)()(
2
1)(
0
22
kPkrjkdkr nn
)(35
8)(
7
4
3
4)(
53
21)( 4
2
2
2
0
2)( rrrrs
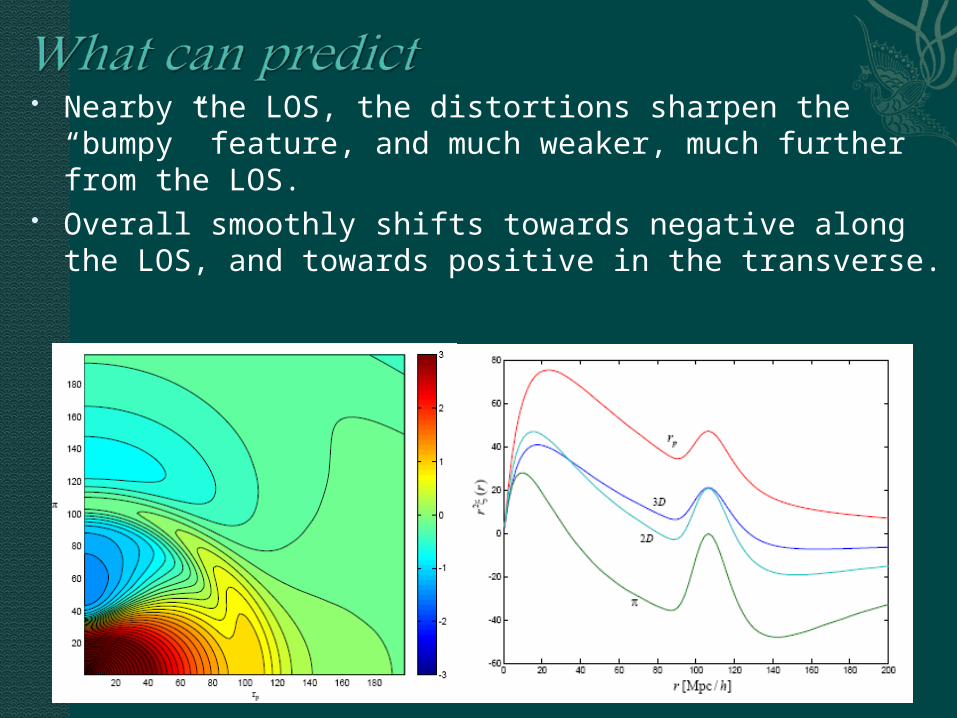
Nearby the LOS, the distortions sharpen the “bumpy” feature, and much weaker, much further from the LOS.
Overall smoothly shifts towards negative along the LOS, and towards positive in the transverse.
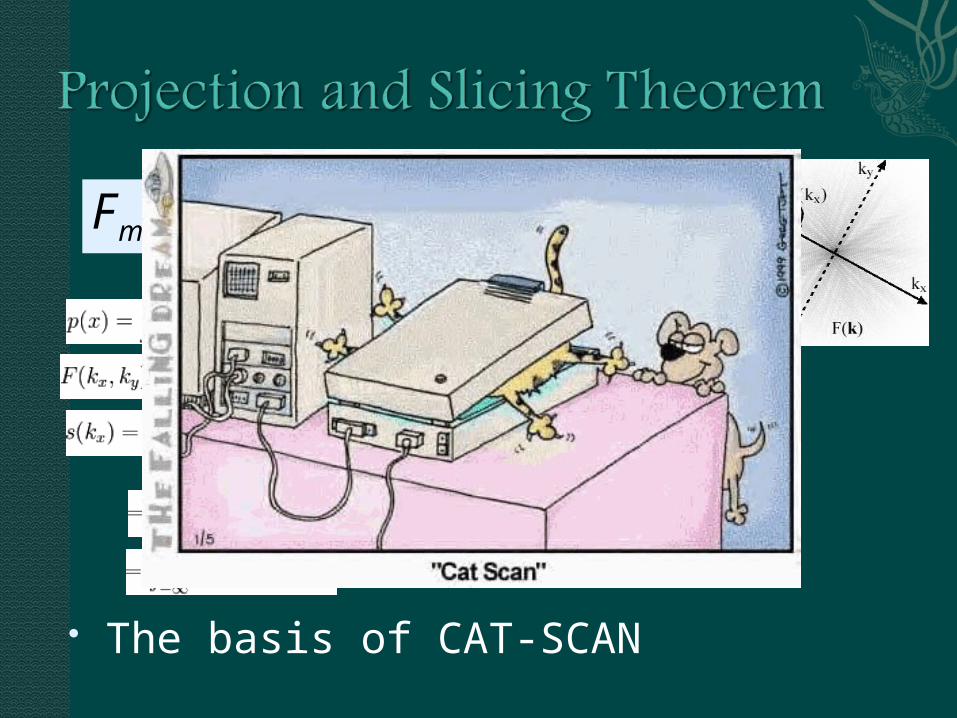
The basis of CAT-SCAN
Nmmm FSPF
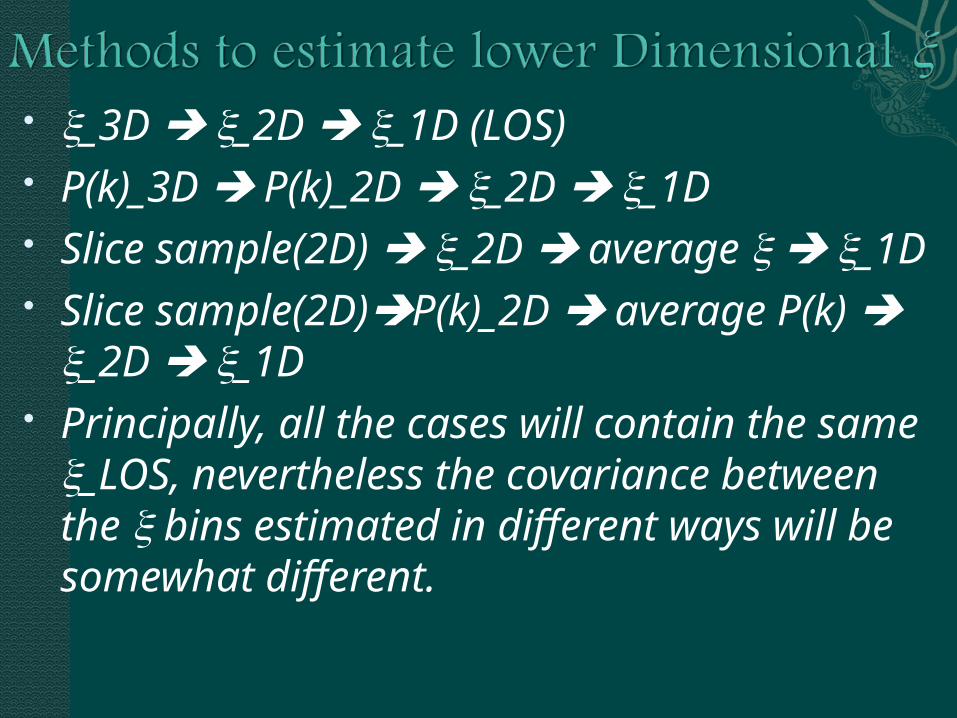
_3D _2D _1D (LOS) P(k)_3D P(k)_2D _2D _1D Slice sample(2D) _2D average
_1D Slice sample(2D)P(k)_2D average
P(k) _2D _1D Principally, all the cases will contain the
same _LOS, nevertheless the covariance between the bins estimated in different ways will be somewhat different.
Millennium Simulation(MS) Size: 500 h-1Mpc a bit small, 2563 Grid
R-mag: < -20 (absolute) Mean density: 0.02 (h-1Mpc)-3
Particle-Mesh(PM) dark-matter Simulations
Size: 1024 h-1Mpc, 100 2563 particles 1400 Gaussian Simulations Size: 768 h-1Mpc, 16 h-1Mpc thickness(at 370 h-1Mpc)
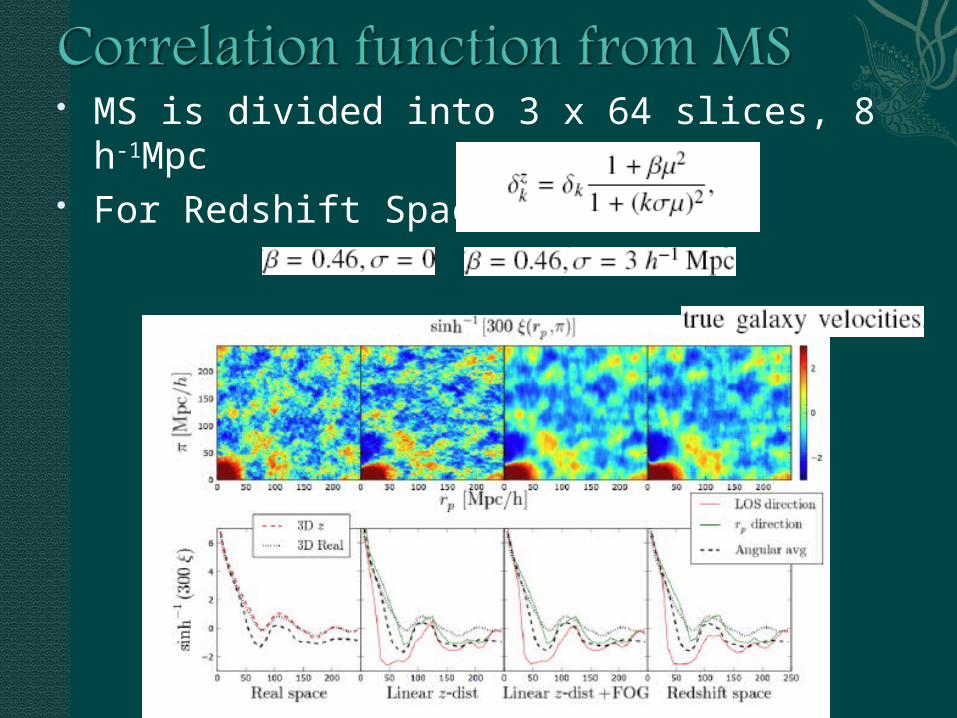
MS is divided into 3 x 64 slices, 8 h-1Mpc For Redshift Space:
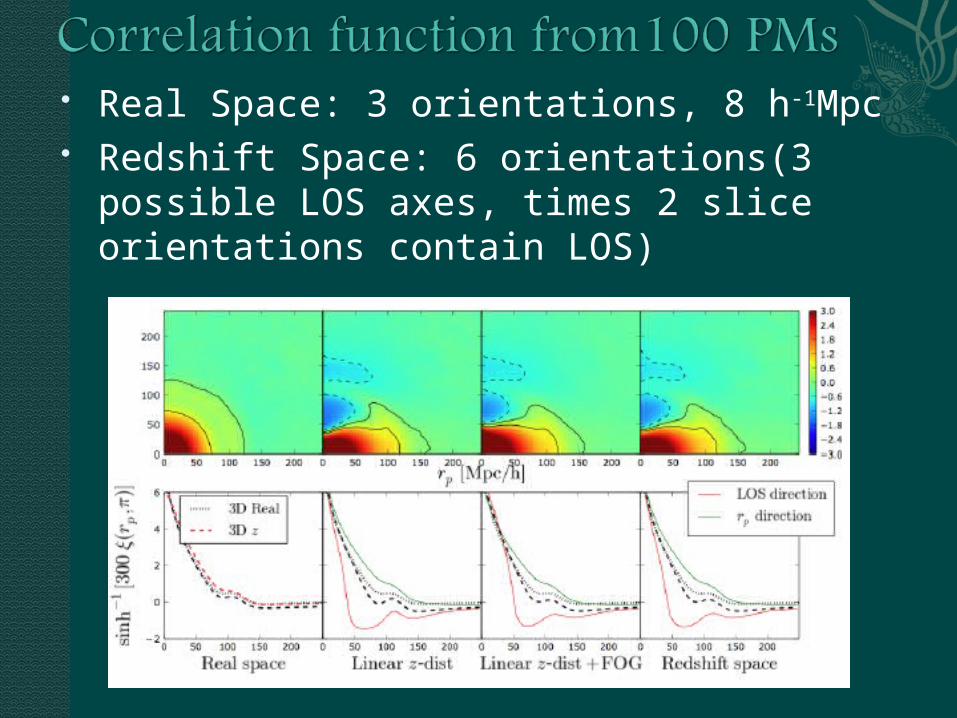
Real Space: 3 orientations, 8 h-1Mpc Redshift Space: 6 orientations(3 possible LOS
axes, times 2 slice orientations contain LOS)

Linear-theory distortions in 2D sharpen the baryon bump relative to the real space.
While fingers of god(non-linear) degrade all features, even away from LOS.
Error bars for the LOS BAO bump are slightly reduced compared with the angle-averaged bump.
Even in 3D, in redshift space have a sharper BAO bump than in 2D.
Redshift-space distortions tend to amplify the bump sharpness, especially along the LOS.
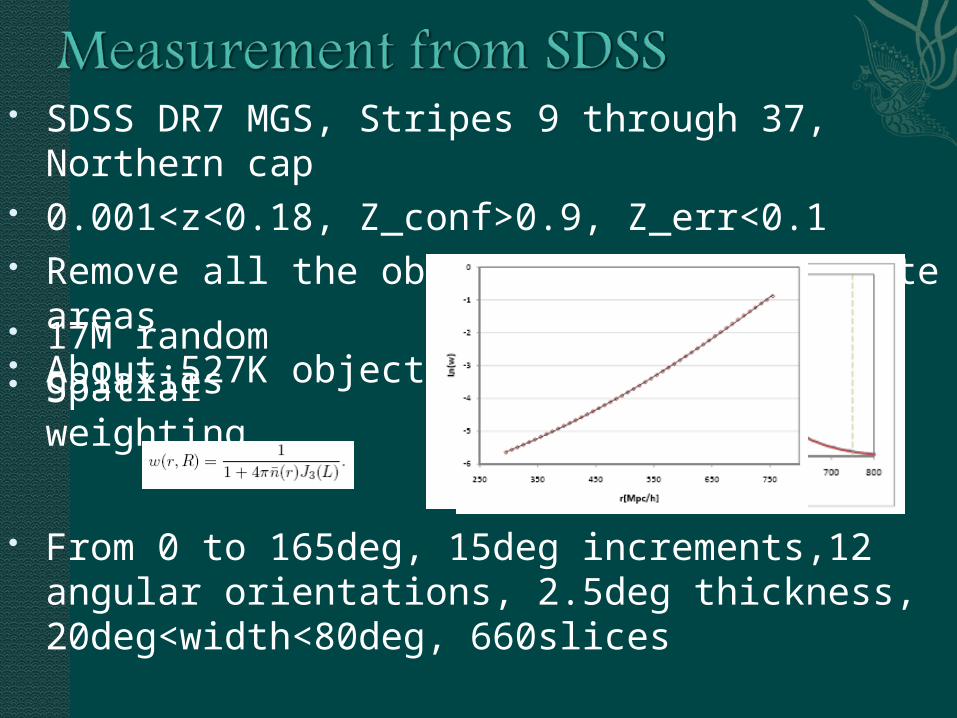
SDSS DR7 MGS, Stripes 9 through 37, Northern cap
0.001<z<0.18, Z_conf>0.9, Z_err<0.1 Remove all the objects in the incomplete areas About 527K objects.
From 0 to 165deg, 15deg increments,12 angular orientations, 2.5deg thickness, 20deg<width<80deg, 660slices
17M random galaxies Spatial weighting
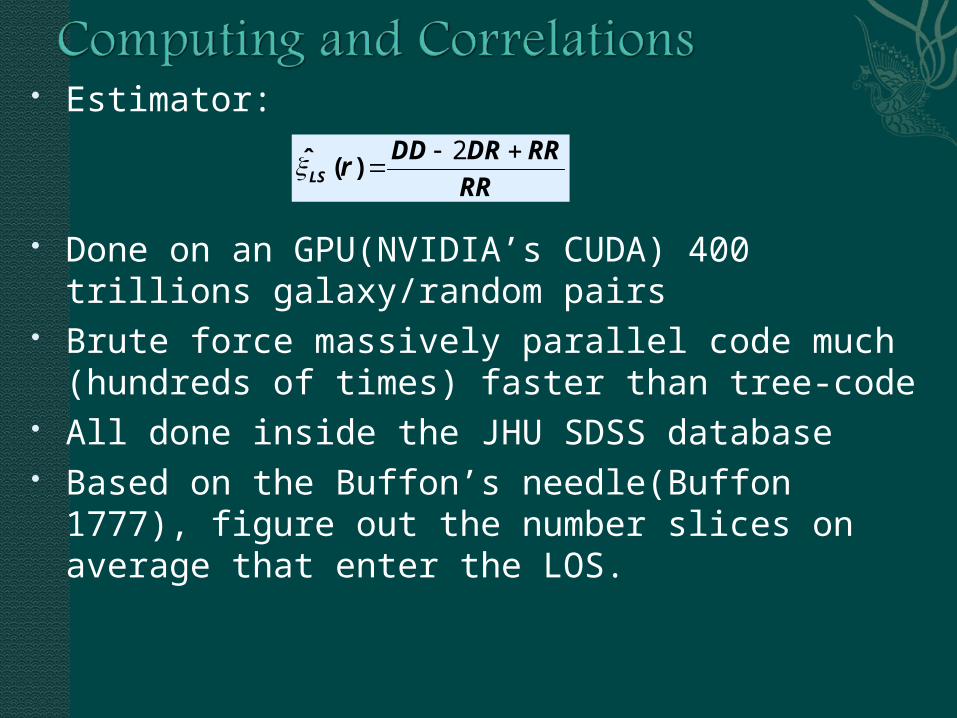
Estimator:
Done on an GPU(NVIDIA’s CUDA) 400 trillions galaxy/random pairs
Brute force massively parallel code much (hundreds of times) faster than tree-code
All done inside the JHU SDSS database Based on the Buffon’s needle(Buffon 1777),
figure out the number slices on average that enter the LOS.
RR
RRDRDDrLS
2)(̂

Average (,) of the 660 2.5deg slices of SDSS galaxies(left),and the full 3D (right)
100Mpc/h<dist<750Mpc/h
300 Mpc/h <dist<750 Mpc/h
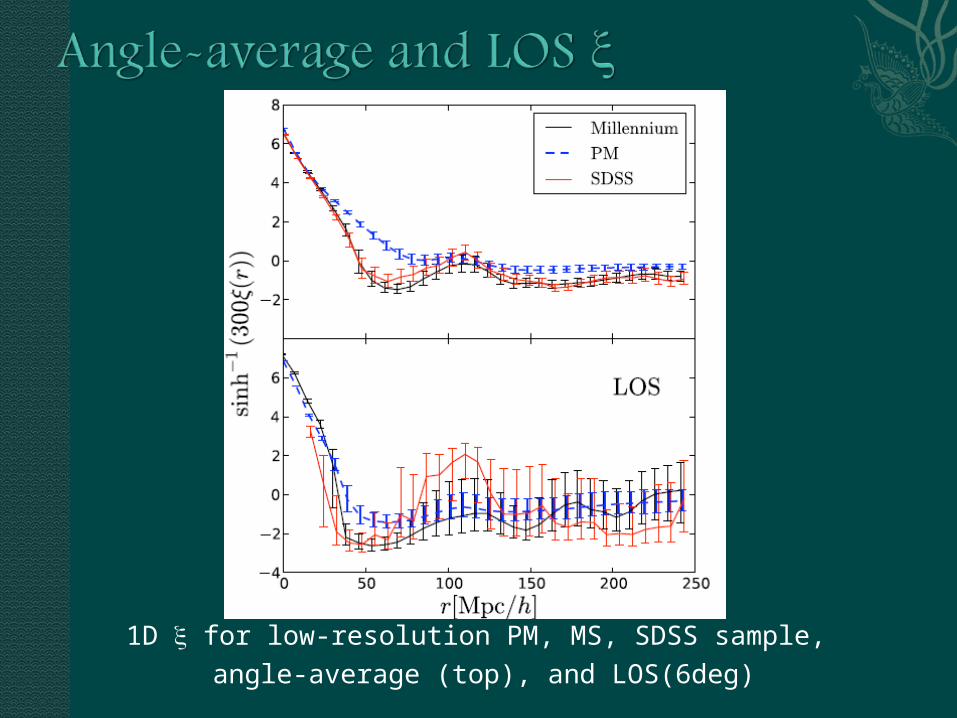
1D for low-resolution PM, MS, SDSS sample, angle-average (top), and LOS(6deg)
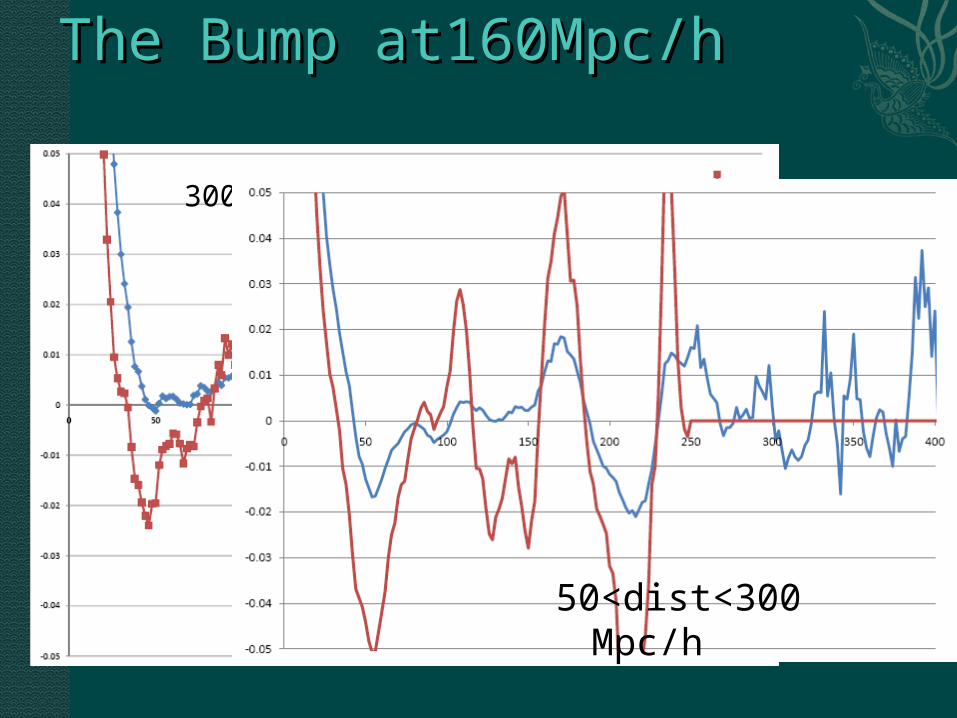
The Bump at160Mpc/hThe Bump at160Mpc/h
300 Mpc/h <dist<750 Mpc/h
50<dist<300 Mpc/h
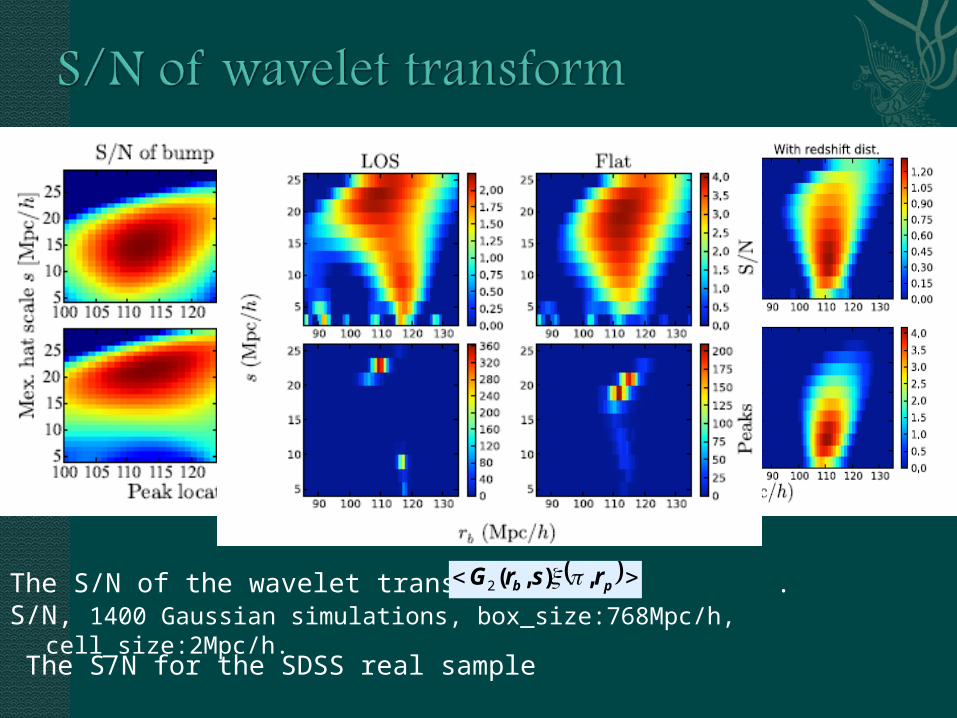
The S/N of the wavelet transform .S/N, 1400 Gaussian simulations, box_size:768Mpc/h, cell_size:2Mpc/h.
pb rsrG ,),( 2
The S/N for the SDSS real sample

[top left] The linear theory redshift space (,),
[middle] The mean MS redshift space (,),
[top right] The mean PM redshift space (,),
[bottom] The mean SDSS redshift space (,),
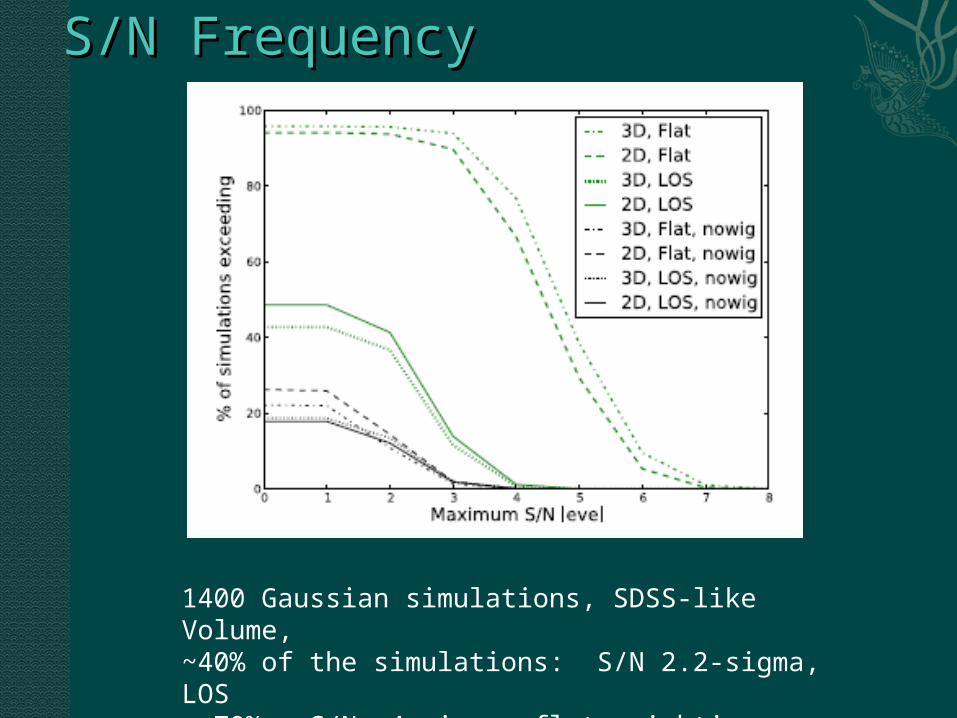
S/N FrequencyS/N Frequency
1400 Gaussian simulations, SDSS-like Volume,~40% of the simulations: S/N 2.2-sigma, LOS~ 70% , S/N 4-sigma, flat weighting.
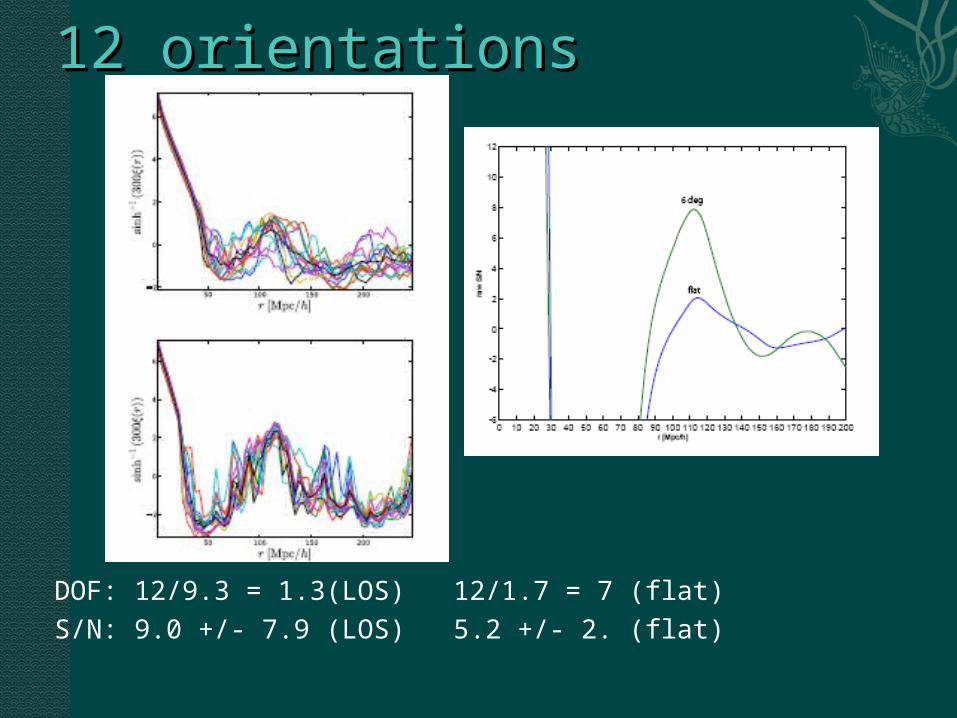
12 orientations12 orientations
DOF: 12/9.3 = 1.3(LOS) 12/1.7 = 7 (flat)S/N: 9.0 +/- 7.9 (LOS) 5.2 +/- 2. (flat)
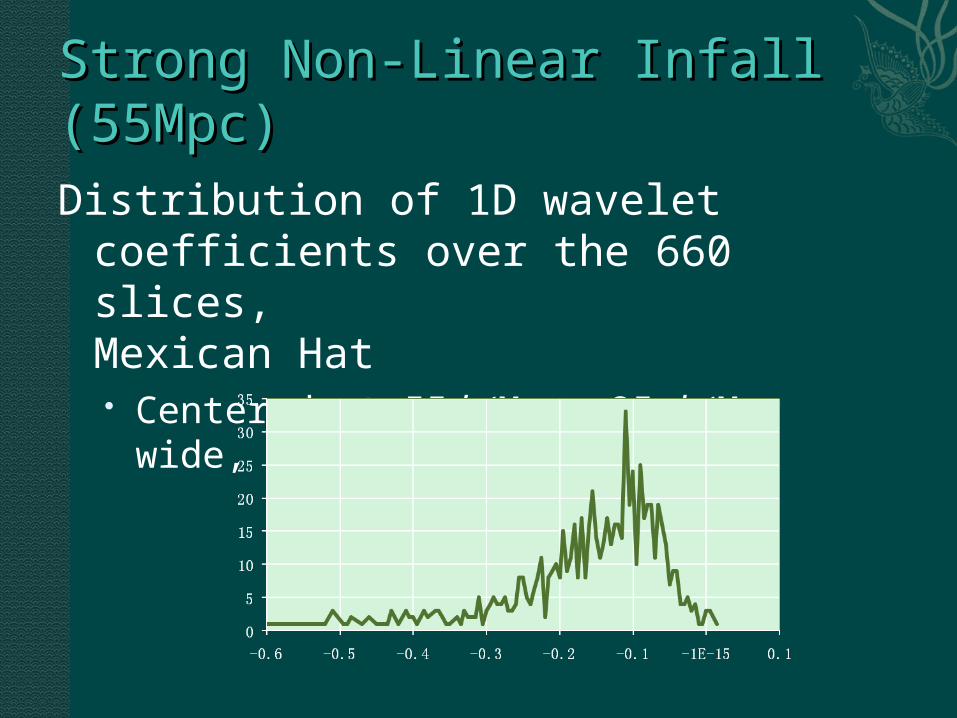
Strong Non-Linear Infall Strong Non-Linear Infall (55Mpc)(55Mpc)Distribution of 1D wavelet coefficients
over the 660 slices, Mexican Hat Centered at 55 h-1Mpc, 25 h-1Mpc wide,
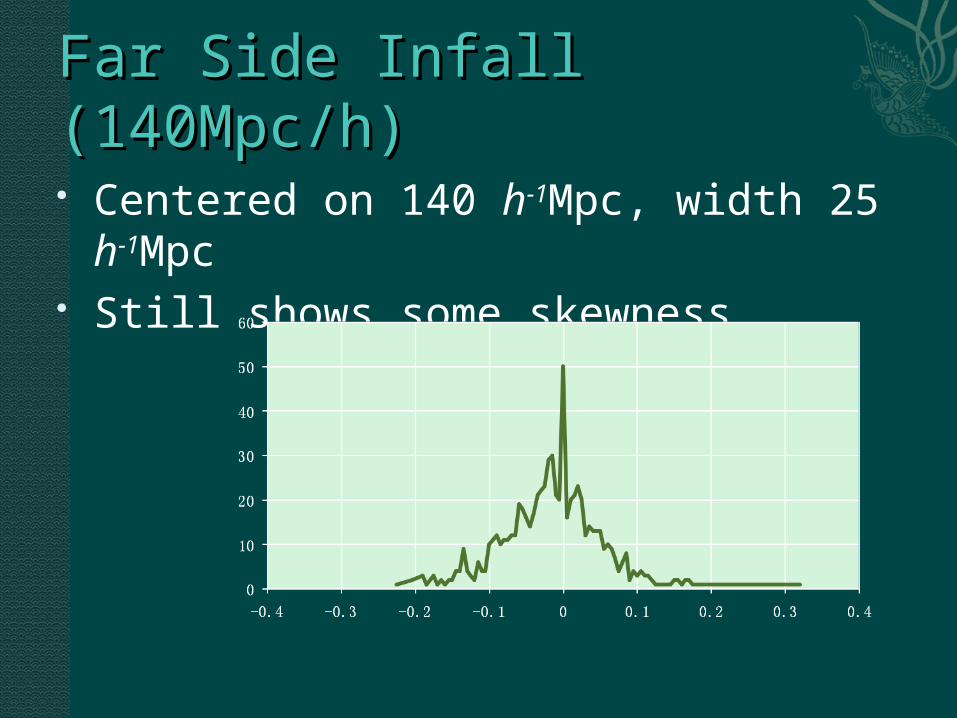
Far Side Infall (140Mpc/h)Far Side Infall (140Mpc/h)
Centered on 140 h-1Mpc, width 25 h-
1Mpc Still shows some skewness
Redshift space distortions amplify and sharpen features along the line of sight
4 detection of BAO in SDSS DR7 MGSat around 110 h-1Mpc, potentially constraining the equation of state at low z
Trough at 55 h-1Mpc indicates effects of nonlinear infall on these scales
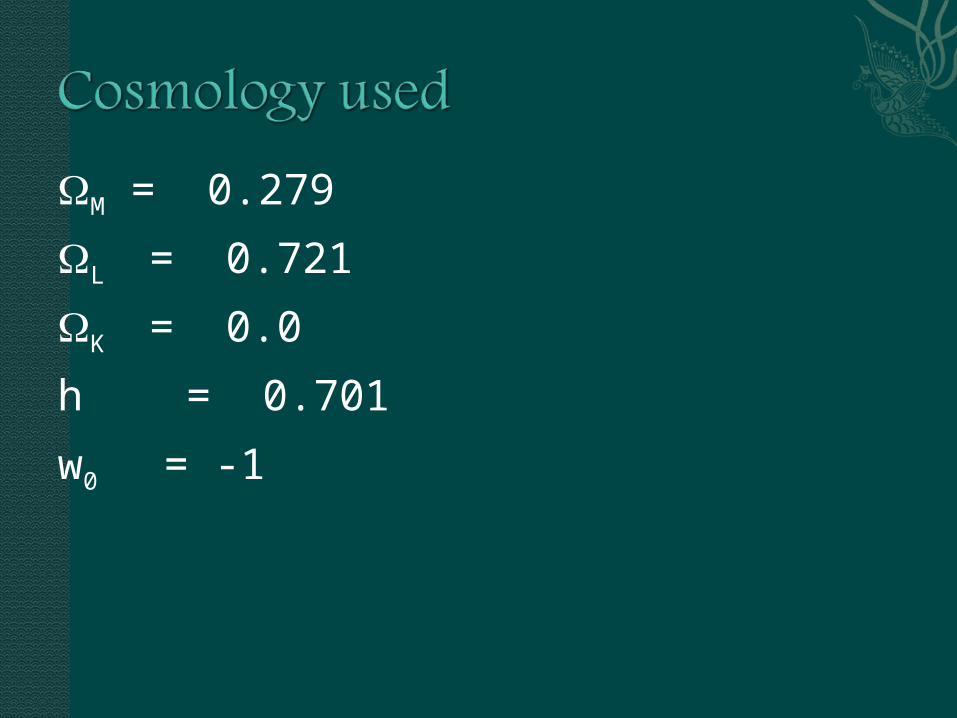
M = 0.279
L = 0.721
K = 0.0
h = 0.701
w0 = -1