
Report_1_-_Cost_es_1720592a
42
High-Speed Railway Lines in Norway Concept Evaluation, Cost Estimate and Uncertainty Analysis Report 1: Basic assumptions and methodology, and calculations for the corridor Trondheim – Oslo Report to Jernbaneverket Classification: None Revision: Report 1, Rev 2.4 Date: October 31th, 2007 Analysis lead: Paul Torgersen Co-writers: Jan Erik Eldor CONSULTING
-
Upload
novelia-prashida-muchtar -
Category
Documents
-
view
6 -
download
0
description
Railway Cost Estimation
Transcript of Report_1_-_Cost_es_1720592a

High-Speed Railway Lines in Norway
Concept Evaluation, Cost Estimate and Uncertainty Analysis Report 1: Basic assumptions and methodology, and calculations for the corridor Trondheim – Oslo
Report to Jernbaneverket
Classification: None
Revision: Report 1, Rev 2.4
Date: October 31th, 2007
Analysis lead: Paul Torgersen
Co-writers: Jan Erik Eldor
CONSULTING

Concept Evaluation, Cost Estimate and Uncertainty Analysis, Report 1
Metier AS Page 2
Executive Summary
Commission
Jernbaneverket has commenced an initiative, comprising three phases, to evaluate the strategy for high-speed railway lines in Norway. Metier AS has been asked to facilitate a concept evaluation and the establishment of an investment cost estimate including uncertainty analysis of the planned new corridors in Norway. The present report comprises the section Heimdal – Sørli of the assessed high-speed railway corridor Oslo – Trondheim. The report outlines the conclusions and recommendations derived from the analysis, in addition to the methodology and approach applied.
Conclusion
The planned high-speed railway-corridor Oslo – Trondheim is founded on the use of existing and planned high-speed railway lines between Oslo and Sørli, together with building a new high-speed railway line from Sørli to Heimdal (366 km). This report only deal with the Sørli – Heimdal line.
The whole analysis is based on information that was gathered, assessed and scrutinized in multidisciplinary workshops to obtain the most unbiased and complete picture of the project.
Operational and Technical Concept - Planning refere nce The superior operational concept – as a planning reference - is defined based on the objective of “ousting air traffic on the distance at lowest cost”. Travel time between Oslo and Trondheim will be 2.45 hours and with a hourly service in peak time. The high-speed railway line will not be used for freight traffic. Freight traffic will use existing lines. This gives the following key parameters and assumptions:
• The railway line is built as single-track lines with crossing sections.
• Maximum gradient of 30 ‰ is allowed. Freight traffic will reduce the maximum gradient (down to 12,5 ‰) and increase investment cost significantly.
• Design speed is 300 kph, exceptions on particular difficult parts.
• Three crossing sections of 12 km each is required with an additional crossing at Hamar/Stange station.
Investment Cost The present investment cost estimate includes necessary infrastructure and trains. Cost basis is 2007 Norwegian kroner. Future price escalation is not included in the present analysis according to ordinary planning guidelines for large public projects in Norway. Other general assumptions is documented in chapter 2.3.
The expected investment cost (mean value) of the project is 59.2 billion kroner. High value (p90) is 80.6 billion and low value (p10) is 40.6 billion. The standard deviation is estimated to 27 percent of the mean value. The size and the repetitive character of the project actually results in reduced uncertainty because positive and negative incidents will to some extent even out.
The three major uncertainties are:
• Level of planning: The project foundation is at prefeasibility level and is thus bond with high uncertainty in general.
• Contractors and materials market: This is mainly due to the risk of major shortages in contractor capacity. A heated world market in materials may amplify this effect.

Concept Evaluation, Cost Estimate and Uncertainty Analysis, Report 1
Metier AS Page 3
• Project ownership: This is mainly due to the risk of a non-optimal funding program, program deviations and owners indecisiveness.

Concept Evaluation, Cost Estimate and Uncertainty Analysis, Report 1
Metier AS Page 4
Table of Contents
1 INTRODUCTION...................................................................................................................... 5
1.1 COMMISSION........................................................................................................................ 5 1.2 PROJECT DESCRIPTION......................................................................................................... 5 1.3 ANALYSIS APPROACH AND METHODOLOGY ............................................................................ 6
2 OPERATIONAL AND TECHNICAL CONCEPT - PLANNING REFERE NCE........................... 7
2.1 OPERATIONAL CONCEPT....................................................................................................... 7 2.2 TECHNICAL PARAMETERS AND ASSUMPTIONS ........................................................................ 7 2.3 GENERAL ANALYSIS ASSUMPTIONS ....................................................................................... 8
3 DETERMINISTIC INVESTMENT COST ESTIMATE ................................................................ 9
4 UNCERTAINTY ANALYSIS............................... .................................................................... 10
4.1 PROJECT CHARACTERISTICS ............................................................................................... 10 4.2 COST ESTIMATE UNCERTAINTY ........................................................................................... 11
5 CONCLUSION ....................................................................................................................... 16
APPENDIX 1 STUDY APPROACH – DETAILS ........................... ............................................. 17
APPENDIX 2 DETERMINISTIC ESTIMATE.............................................................................. 18
APPENDIX 3 UNCERTAINTY ANALYSIS – BASE COST ESTIMATE.......... ........................... 19
APPENDIX 4 UNCERTAINTY ANALYSIS – UNCERTAINTY DRIVERS ......... ......................... 34
APPENDIX 5 UNCERTAINTY ANALYSIS – CORRELATIONS................ ................................ 37
APPENDIX 6 MEMO BASIS FOR COST ESTIMATES - TUNNELS ............ ............................. 38
APPENDIX 7 MEMO GEOTECHNICAL STUDY OF SELECTED AREAS .......... ...................... 42

Concept Evaluation, Cost Estimate and Uncertainty Analysis, Report 1
Metier AS Page 5
1 Introduction
1.1 Commission
Jernbaneverket has commenced an initiative, comprising three phases, to evaluate the strategy for high-speed railway lines in Norway.
• Phase 1 includes a comparison of existing European high-speed concepts and a detailed analysis of the transport market. The aim is to evaluate the potentials for high-speed railway services in Norway and to identify the corridors with the most potential in terms of cost-benefit.
• Phase 2 includes operational- and infrastructure planning for the corridors pointed out in phase 1. The result from phase 2 will be used in cost-benefit assessments, and a conclusion will be reached on the realization of high-speed railway services in Norway.
Metier AS has been asked to facilitate a concept evaluation and the establishment of an investment cost estimate including uncertainty analysis of the planned new corridors in Norway. The present report comprises the section Heimdal – Sørli of the assessed high-speed railway corridor Oslo – Trondheim. The report outlines the conclusions and recommendations derived from the analysis, in addition to the methodology and approach applied.
1.2 Project description
The planned high-speed railway-corridor Oslo – Trondheim (486 km) consist of the following sections:
• Trondheim – Heimdal (12 km): No high-speed railway required
• Heimdal – Sørli (366 km): New high-speed railway must be built (the topic of this report)
• Sørli – Eidsvoll (ca. 38 km): New high-speed railway already planned (ref. Nasjonal Transportplan 2006-2015, September 2005)
• Eidsvoll - Oslo (ca. 70 km): Already existing High-Speed line.
Document Basis:
• Feasibility Study Concerning high-speed railway lines in Norway, Report Phase 1, 2006-12-15 [ 1]
• Feasibility Study Concerning High-Speed Railway Lines in Norway, WP 300: High-Speed-Railway-Specific Conditions, 2006-12-19 [ 2]
• Map, scale 1:250.000 [ 3]

Concept Evaluation, Cost Estimate and Uncertainty Analysis, Report 1
Metier AS Page 6
1.3 Analysis Approach and Methodology
The whole analysis is based on information that was gathered, assessed and scrutinized in multidisciplinary workshops to obtain the most unbiased and complete picture of the project. The team included people from the German group of VWI with partners, Jernbaneverket, Sintef, NGI, Direktoratet for Naturforvaltning, Asplan Viak and Metier. Metier facilitated the workshops.
The Concept Evaluation and establishment of the deterministic estimate consisted of the following activities:
1. Establishment of a most likely operational concept based on the input from the Feasibility Study from the VWI with partners.
2. Establishment of key parameters and assumptions. 3. Establishment of investment cost estimate structure on pre-feasibility level including
descriptions and delimitations of cost-elements. 4. Evaluation and re-estimation of quantities. 5. Estimation of unit prices based on relevant reference-projects.
The uncertainty analysis has been performed according to standard methodology and tools for uncertainty analysis. The following main activities were performed:
1. Project characteristics and situation map. The situation map is a graphical representation of the group’s understanding of the project with respect to specific parameters.
2. Identification of uncertainties facing the concepts. 3. Grouping uncertainties into uncertainty drivers in addition to scenario descriptions of the
uncertainty drivers into a planning reference, a best-case scenario and a worst-case scenario. 4. Quantitative cost analysis, comprising distribution curves and uncertainty profiles, including
standard deviation and specific percentiles. 5. Action/activities prioritization and conclusions.
For detailed descriptions of approach and methodology, reference is given to Appendix 1.

Concept Evaluation, Cost Estimate and Uncertainty Analysis, Report 1
Metier AS Page 7
2 Operational and Technical Concept - Planning refe rence
2.1 Operational Concept
The following superior operational concept was defined based on the objective of “ousting air traffic on the distance at lowest cost”:
Passenger transport:
Travel time: 2.45 hours Oslo – Trondheim
Train service: Hourly service in peak time
Freight traffic: The high-speed railway will not be used for freight traffic. Freight traffic will use existing lines on Dovrebanen and possibly Rørosbanen.
2.2 Technical Parameters and Assumptions
The operational concept gives the following technical key parameters and assumptions (deterministic estimate):
Basic Technical Concept:
The high-speed railway between Heimdal and Sørli is planned built as single-track lines with crossings section.
Technology: Based on today’s technology
Track gradient: Maximum gradient of 30 ‰ is allowed.
Comment from the group: Freight traffic will reduce the maximum gradient (down to 12,5 ‰) and increase investment cost significantly, mainly due to increased line- and tunnel length. Trade-offs will be discussed in the next report.
Speed: 250 kph operational
300 kph design speed, exceptions on particular difficult parts
Necessary crossing sections:
12 km assuming both trains slowing down (crossing speed 160), type rhomboid. Three crossing sections required. Additional crossing at Hamar/Stange station.
Tunnel size: Size of tunnels 75 m2
Tracks: Open line: Traditional ballast tracks
Tunnels: Slabtrack in long tunnels
Signaling system: ERTMS-2 and use of GSMR and GPRS

Concept Evaluation, Cost Estimate and Uncertainty Analysis, Report 1
Metier AS Page 8
2.3 General Analysis Assumptions
The analysis is based on the following general assumptions:
Cost Basis: 2007 Norwegian kroner
Future Price Escalation (inflation):
Not included in the present analysis according to ordinary planning guidelines for large public projects in Norway.
Metier’s comment: Price escalation for construction projects has in recent years been larger than the regular inflation. This is basically due to material price and salary escalations.
Finances: Government allowances with project optimized funding and professional ownership. Finance costs (e.g. interest on building loans is not included).
Government Dues: All numbers are exclusive of VAT according to prevailing regulations for railway in Norway.
Planned Schedule for the investments:
Not detailed out on this planning level.
Removal of old lines:
Removal of old line is not included in the cost estimate. Use of existing lines is not decided at this planning level.
Market and contracts:
Balanced market (Europe) through long term market development strategies. Unit price contracts. The implementation of such a project could overheat the construction market and jeopardise normal price relations for the whole business line. It may be argued, however, that given predictable financing conditions and large, long horizon contracts, this kind of large project will create its own market much like the situation has been for the oil & gas and hydropower industries

Concept Evaluation, Cost Estimate and Uncertainty Analysis, Report 1
Metier AS Page 9
3 Deterministic Investment Cost Estimate
The table below presents the deterministic investment cost estimate prepared by the multidisciplinary group during and between workshops. Details with respect to assumptions and content are given in Appendix 2. Note that the total costs provided in the below table are deterministic values.
Main cost elements Details Total cost (MNOK)Deterministic values
Tunnel (without superstructure)
Tunnel lenght and fixed sites. Additions for service tunnel, crossing sections in tunnels, soil tunnels and longer portals. 8 520
Open line New open line sections. Additions for silt/soft soil and high/low cuts and fills. 11 765
Constructions
Wildlife crossings, road crossings including connections, reconstruction of local infrastructure and railway bridges. 2 101
SuperstructureRegular line. Additions for crossings and slabtrack. 9 994
Stations Large and small stations. 130Power supply Power supply substations. 500Special infrastructure Special support constructions. 200Facilities Service and maintenance facilities. 40Contractor Costs 33 249
Management and EngineeringContractor/client management and engineering. 8 977
Land acquisitions Land acquisitions 206Project Cost 42 433Trains and facilities Trains and maintenance facilities 3 488Total Investments 45 921
Table 1 Deterministic project cost estimate, not including uncertainty assessments. This estimate is input data to the uncertainty analysis.

Concept Evaluation, Cost Estimate and Uncertainty Analysis, Report 1
Metier AS Page 10
4 Uncertainty analysis
4.1 Project characteristics
The figure below reflects the intuitive group understanding of the main characteristics of the project, e.g. in terms of clear objectives, complexity, size and so on. Each of the individual characteristics has been assigned a value of “less” (yellow) and “more” (grey). This simple exercise contributes to the subsequent analysis in terms of comparison for consistency checks.
Figure 1 Project characteristics
The background for the project situation map is as follows:
Social/Business Objectives
It is recognized that superior political conditions and objectives will influence a project like this, and that expectations for financial profitability no longer are valid. The project will most likely be built on a strong political desire due to dimensions like environmentally friendliness, potential future benefits for the public and the industry and an increased attention to engineering and industrial development.
Organisation & Competence
Norway is considered to have well-established working methods and experience with respect to project management even for a project of this size. High speed railway is a high profile project and it is assumed to be attractive with respect to employment.
Contractor Market
The project will most probably be carried out with a contractor phase of five to ten years, and is large enough to significantly influence the contractor market in Scandinavia. The project will need a particular contract and market development strategy that will attract European contractors.

Concept Evaluation, Cost Estimate and Uncertainty Analysis, Report 1
Metier AS Page 11
Stakeholders The number of stakeholders is high and their interactions are complex. The project will attracts great political attention both regarding the interplay between air-, car- and railway transportation and the growing global environment problems. (e.g. the project may be considered a way of escaping the CO2 problems). Attention to wildlife stakeholders may be a challenge due to the fact that the corridors run through parts of sensitive areas. There might be an increased demand from local authorities related to development of local roads and infrastructure.
Size Compared to other railway and road investments in Norway, this project is considerable with respect to size. Railway investments amount to 1.5 - 2.5 billion Norwegian krones pr. year for the last 10 years. Road investments in Norway is about 20 billion pr. year including operations and maintenance, plus an additional about 30 billion pr. year for other heavy constructions (tunnels and groundwork) and power (Scandinavian market). The Heimdal – Sørli section is thus about the same size as the Norwegian construction marked produces in one year.
Complexity The project and the technology are considered proven-in-use and thus not very complex. However, the complexity will increase with use of some slabtracks.
Need for innovation – Construction
The project should invent new and improved construction methods as an intensive long term development. The size of the costs and the “environmental profile” of the project demand high innovation, and therefore extensive R&D is needed.
Need for innovation – Railway
The need for innovation with respect to railway is low. Existing technology may be used. New signalling systems (use of ERMTS, GSMR and GPRS) must be approved.
4.2 Cost Estimate Uncertainty
4.2.1 Input and assessments
The uncertainty estimation model is based on the following relation:
Total Cost = Uncertainty in Base Cost Estimate • Effect of Uncertainty Drivers
+ Effect of Correlations between Cost Elements in Base Estimate
Base Cost Estimate The base cost estimate comprises cost elements corresponding to the deterministic cost estimate (ref. 3). Each individual cost element has been assessed by the group and assigned an optimistic, most likely and pessimistic value. The triple estimates present the uncertainty related to each cost element and thus the total (aggregated) base estimate, given that the assumptions apply. The input numbers and assessments are documented in Appendix 3.
Uncertainty drivers The uncertainty drivers are those uncertainties that can affect the entire project cost situation. The uncertainty drivers are assigned descriptions and assumptions for the base estimate (planning reference), optimistic scenario, most likely scenario and pessimistic scenario. The effect of the

Concept Evaluation, Cost Estimate and Uncertainty Analysis, Report 1
Metier AS Page 12
uncertainty drivers (scenarios) is quantified using triple estimates on factors multiplied with the base cost. The following uncertainty drivers influencing the investment costs, were identified:
• U1 Technological Development
• U2 Technical requirements
• U3 Operational Concept Optimization
• U4 External Demands
• U5 Project ownership
• U6 Project Management
• U7 Contractors and materials market
• U8 Level of planning
The input numbers and assessments are documented in Appendix 4.
Correlations between cost elements Some inherent dependencies between cost elements are modeled as correlations. The input numbers and assessments are documented in Appendix 5.
Additional identified uncertainties In addition there were some uncertainties identified that are addressed directly in the Base Cost Estimate. These are ground conditions and prices, topography issues, wildlife crossings, solutions for integrity of the line, overhead power systems and power supply.
There were also some uncertainties identified that are considered part of the decision basis for the project or considered part of the key assumptions. These are: development of transportation in Scandinavia, development of the freight market, general economical development, traveling market, competitive advantage railway, speed limitation for the combined freight and passenger traffic and freight traffic or not (gradient).
4.2.2 Estimate results
The table below provides a summery of the estimate results:
Deterministic estimate (sum of most likely values): 45.9 MNOK
Expected increment: 13.3 MNOK
Expected investment cost of project (mean value) 59 .2 MNOK
The table below provides the mean values for the main cost elements, including the contribution from the uncertainty drivers.

Concept Evaluation, Cost Estimate and Uncertainty Analysis, Report 1
Metier AS Page 13
Main cost elements DetailsTotal cost (MNOK)Mean values
Tunnel (without superstructure)
Tunnel lenght and fixed sites. Additions for service tunnel, crossing sections in tunnels, soil tunnels and longer portals. 8 520
Open line
New open line sections. Additions for silt/soft soil and high/lowcuts and fills. 14 352
Constructions
Wildlife crossings, road crossings including connections, reconstructionof local infrastructure and railwaybridges. 2 282
SuperstructureRegular line. Additions for crossings and slabtrack. 9 329
Stations Large and small stations. 147Power supply Power supply substations. 500Special infrastructure Special support constructions. 286Facilities Service and maintenance facilities. 40Contractor Costs 35 456
Management and EngineeringContractor/client management and engineering. 10 604
Land acquisitions Land acquisitions 249Project Cost 46 309Trains and facilities Trains and maintenance facilities 3 270Total Investments 49 580Uncertainty Drivers 9 613Total Estimate 59 192
Table 2 Mean project cost estimate, including uncertainty assessments.
The distribution curve below presents the probability of not exceeding specific cost levels. The standard deviation of the project is 15942 MNOK, e.g. 27 % of the expected mean value. Detailed results and models are given in Appendix 3.

Concept Evaluation, Cost Estimate and Uncertainty Analysis, Report 1
Metier AS Page 14
Figure 2 Cumulative distribution curve project cost (MNOK)
The uncertainty profile, represented by the figure below, illustrates the top ten uncertainties contributing the most to the total cost estimate uncertainty. The percentages represent the contribution from each cost element to the total uncertainty (which is 100 %).

Concept Evaluation, Cost Estimate and Uncertainty Analysis, Report 1
Metier AS Page 15
Figure 3 Uncertainty profile with respect to cost

Concept Evaluation, Cost Estimate and Uncertainty Analysis, Report 1
Metier AS Page 16
5 Conclusion
The planned high-speed railway-corridor Oslo – Trondheim is founded on the use of existing and planned high-speed railway lines between Oslo and Sørli, together with building a new high-speed railway line from Sørli to Heimdal (366 km). This report only deal with the Sørli – Heimdal line.
The whole analysis is based on information that was gathered, assessed and scrutinized in multidisciplinary workshops to obtain the most unbiased and complete picture of the project.
Operational and Technical Concept - Planning refere nce The superior operational concept – as a planning reference - is defined based on the objective of “ousting air traffic on the distance at lowest cost”. Travel time between Oslo and Trondheim will be 2.45 hours and with a hourly service in peak time. The high-speed railway line will not be used for freight traffic. Freight traffic will use existing lines. This gives the following key parameters and assumptions:
• The railway line is built as single-track lines with crossing sections.
• Maximum gradient of 30 ‰ is allowed. Freight traffic will reduce the maximum gradient (down to 12,5 ‰) and increase investment cost significantly.
• Design speed is 300 kph, exceptions on particular difficult parts.
• Three crossing sections of 12 km each is required with an additional crossing at Hamar/Stange station.
Investment Cost The present investment cost estimate includes necessary infrastructure and trains. Cost basis is 2007 Norwegian kroner. Future price escalation is not included in the present analysis according to ordinary planning guidelines for large public projects in Norway. Other general assumptions is documented in chapter 2.3.
The expected investment cost (mean value) of the project is 59.2 billion kroner. High value (p90) is 80.6 billion and low value (p10) is 40.6 billion. The standard deviation is estimated to 27 percent of the mean value. The size and the repetitive character of the project actually results in reduced uncertainty because positive and negative incidents will to some extent even out.
The three major uncertainties are:
• Level of planning: The project foundation is at prefeasibility level and is thus bond with high uncertainty in general.
• Contractors and materials market: This is mainly due to the risk of major shortages in contractor capacity. A heated world market in materials may amplify this effect.
• Project ownership: This is mainly due to the risk of a non-optimal funding program, program deviations and owners indecisiveness.

Concept Evaluation, Cost Estimate and Uncertainty Analysis, Report 1
Metier AS Page 17
Appendix 1 Study approach – Details
Main approach and group meetings The input to the concept evaluation and uncertainty analysis has been gathered in workshops with different experts. The most important workshop have been:
• February 27-28.: Concept evaluation, estimation of quantities and uncertainty analysis
• March 2.: Need Energy-supply/consumtion
• March 23.: Commissioning of uncertainty analysis
The following table presents the group-sessions participants.
Workshops Name Role in study/Competance Company 27.2 28.2 2.3 23.3
Harry Dobeschinsky Project-leader consultants VWI X X X X
Peter Sautter Alignment, costs IGV X X X X
Jochen Rowas Alignment, costs LFS X X X
Finn Holom Railway alignment JBVU X
Christian Knittler High speed expert JBV X X
Per Herman Sørli Railway alignment JBVU X X X
Runar Gravdal Costs JBVU X X X
Frode Johnsen Energy-supply/consumption JBV X
Roger Olsson Geology NGI X X X
Anders Beitnes Tunnel SINTEF X X X
Terje Eidsmoen Railway JBV X X
Halstein Gåsemyr Wheel/track JBV X X
Erik Stabell Environmental impacts Direktoratet for naturforvalting X X
Randi Birgitte Svånå Projectleader Jernbaneverket Asplan Viak X X X
Paul Torgersen Facilitator Uncertainty Analysis Metier X X X X
Jan Erik Eldor Facilitator Uncertainty Analysis Metier X X X X
Table 1 Contributors to the analysis (participation on workshops)
Method for the Uncertainty Analysis The Uncertainty analysis has been performed according to Metier’s standard methodology for uncertainty analysis The Complete Risk Manager, using the software tools Risk View and Crystal Ball.
The quantitative analysis is based on a 10/90 model, meaning that the extremities in the triple estimates are quoted as the 10 %-percentile for the minimum value and the 90 %-percentile for the maximum value. All parameters are assumed triangular distributed. The mean value, standard deviation and sensitivities are found by Monte Carlo simulation.

Concept Evaluation, Cost Estimate and Uncertainty Analysis, Report 1
Metier AS Page 18
Appendix 2 Deterministic estimate
Cost elements Unit Prices Total Cost
Main ID Detailed Runningline
Basis Keyassum.
Estimatevalue
Unit Assumptions Estimate value
Unit (deterministic value)
[km] [MNOK/unit] [MNOK]1.1 Per lenght 72 60 20 % 72 km Identified 60 km tunnel. Assumed 20%
tunnel in addition. This includes soiltunnels and longer portals.
75 MNOK/km 5 400
1.2 Fixed (pr. sites) 25 Sites Assume 25 sites for all tunnels. 20 MNOK/site 500
1.3 Addition for service tunnel 60 km Includes fences and drainage, frost insulation, landscaping and minor
35 MNOK/km 2 100
1.4 Addition for crossing sections in tunnel
10 km 25 % of total running line, Outside fill areas
40 MNOK/km 400
1.5 Addition for soil tunnels and longer portals
2 km 17% of total running line 60 MNOK/km 120
Open line 2.1 New open line sections, even terrain 284 284 km 50 % of total running line. Less than 5 m, average 4 m
20 MNOK/km 5 670
2.2 Addition for silt soil 25 % 71 km 20 % of total running line. Larger than 5 m, average 10 m
15 MNOK/km 1 063
2.3 Addition for soft soil 17 % 48 km 1 per 2 km. 25 MNOK/km 1 205
2.4 Addition for low cuts/fills 50 % 142 km - 15 MNOK/km 2 126
2.5 Addition for high cuts/fills 20 % 57 km Identified 7 km, non-identified approximately 50%.
30 MNOK/km 1 701
3.1 Wildlife crossings 284 2 142 nr of const. Tunnels, bridges and open line. 3 MNOK/Con 354
3.2 Road crossings including connections
284 3 95 nr of const. 3 crossings. 3 MNOK/Con 236
3.3 Reconstruction of local infrastructure
25 nr of local sites Assume 90% of total length of tunnels. 10 MNOK/Con 250
3.4 Railway bridges 11 7 50 % 11 km Stange, 3 tracks. 120 MNOK/km 1 260
4.1 Regular line 366 366 km One substation every 60 km. Power supply system 15 kV, 16 2/3 Hz.
24 MNOK/km 8 784
4.2 Additional for crossings 36 km - 21 MNOK/km 756
4.3 Additional for slabtrack 72 90 % 65 km - 7 MNOK/km 454
5.1 Large station 1 Station 90 MNOK/station 90
5.2 Small stations 2 Stations Include detailed engineering and warranties.
20 MNOK/station 40
6.1 Power supply substations including HV-lines
5 nr of subst. Preinvestigation, studies, strategies and planning. Engineering.
100 MNOK/subst 500
6.2 New HV lines 0 km MNOK/km. Average width 50 m. - -
Special infrastructure 7.1 Special support Constructions infrastructure
2 sites 100 MNOK/site 200
Facilities 8.1 Service and maintenance facilities 2 Stations - 20 MNOK/station 40
Contractor Costs 33 249 9.1 Contractor Management and
Engineering15 % of Contractor
Cost 4 987
9.2 Client Management and Engineering 12 % of Contractor Cost
3 990
Land acquisitions 10.1 Land acquisitions 294 km 1 MNOK/km 206
Project Cost 42 433 11.1 Trains 14 trains 112 MNOK/train 1 568
11.2 Maintenance facilities 1 site 1 920 MNOK/site 1 920
Total Investments 366 km 45 921
Cost estimate (deterministic/most likely)Quantities
Stations
Power supply
Tunnel (without superstructure)
Management and Engineering
Trains and facilities
Constructions
Superstructure
Table 3 Project deterministic estimate and input data to the uncertainty analysis

Concept Evaluation, Cost Estimate and Uncertainty Analysis, Report 1
Metier AS Page 19
Appendix 3 Uncertainty analysis – Base cost estimat e
Uncertainty analysis - summary The following tables present a summary of the uncertainty analysis for the corridor Oslo - Trondheim. Note that some of the cost elements are combined, e.g. ID 1.2 in the table below comprises fixed sites, addtions for service tunnels, additions for crossing sections and additions for soil tunnels and longer portals. Detailed descriptions of the estimate uncertainty and assumptions are presented subsequent to the table below.
Total Cost
ID Description Most likely Most likely (expected value)
% Value Value Value % % Value Value Value % [MNOK]1.1 Tunnels Basis (without superstructure) 24 % 55 72 100 39 % -27 % 55 75 90 20 % 5 610
1.2 -32 % 2120 3120 3620 16 % 2 910
2.1 Open line Basis (without superstructure) 279 -25 % 15 20 30 50 % 6 167
2.2 -50 % 1134 2268 4536 100 % 2 739
2.3 -50 % 1914 3827 9568 150 % 5 446
3.1 Crossings (wild life and roads) -50 % 295,3 591 1181,3 100 % 719
3.2 Reconstruction of local infrastructure -50 % 125,0 250 500,0 100 % 303
3.3 Railway bridges 33 % 7 11 14 33 % -30 % 84 120 156 30 % 1 260 4.1 Superstructure Regular line -25 % 6588 8784 9516 8 % 8 145 4.2 Superstructure Additions for crossings -25 % 567 756 819 8 % 701 4.3 Superstructure Additional for slabtrack -29 % 324 454 648 43 % 482 5.1 -23 % 100 130 200 54 % 147
6.1 -25 % 375 500 625 25 % 500
7.1 Special support Constructions infrastructure -50 % 100 200 500 150 % 286
8.1 Service and maintenance facilities -10 % 36 40 44 10 % 40 Contractor Costs 35 456
9.1 Contractor Management and Engineering 12 % 15 % 25 % 6 362
9.2 Client Management and Engineering 8 % 12 % 16 % 4 242
10.1 Land acquisitions -50 % 103 206 412 100 % 249
Project Cost 46 309 11.1 -29 % 2488 3488 4000 15 % 3 270
Total Investments 49 580
Most likelyValue
0,92 0,98 1,00
0,98 1,02 1,10
0,98 1,01 1,05
0,99 1,00 1,05
0,90 1,00 1,20
0,88 1,00 1,12
0,90 1,00 1,25
0,85 1,00 1,25
1,19
59 192 15 942
27 %
U7 Contractors and Materials MarketU6 Project management
U3 Operational Concept optimisationU4 External DemandsU5 Project ownership
Total estimate
Value Value
Standard Deviation
Tunnels Additions (without superstructure)
Optimistic Pessimistic
Uncertainty Drivers
Stations
Power supply
Uncertainty Drivers
U1 Technological DevelopmentU2 Technical Requirements
U8 Level of planning
Base estimate
Open line Poor soil additions
Open line Cuts/fills additions
Trains and facilities
Quanties
Pessimistic
Unit Prices (MNOK)Uncertainty analysis
Optimistic
Elements
Optimistic Pessimistic
Table 4 Project estimate and input data to the uncertainty analysis

Concept Evaluation, Cost Estimate and Uncertainty Analysis, Report 1
Metier AS Page 20
Cost elements – Input and assessments The present section includes detailed descriptions of the content of the most likely estimate and assumptions in addition to agreed triple estimates derived in the group sessions.

Concept Evaluation, Cost Estimate and Uncertainty Analysis, Report 1
Metier AS Page 21
Main Cost Element Tunnels Basis (without superstructure)Content
Quantity- and Unit Price Estimate (most likely) and assumptions Element Quantity (km) Assumptions Unit Price (MNOK) Assumptions
Per lenght 72 Identified 60 km tunnel. Assumed 20% tunnel in addition. This includes soiltunnels and longer portals.
75 75 m2, D&B 250.-, transport 100.-, SRF + rock bolts 9'/m, drain & invert 10'/m, heavy RS (20%x35'): 7'/m, pregrouting (20% x 400'/ 10m): 8'/m, w&fr insulation (50%x30'): 15'/m. TBM tunnel to be chosen only if economical in comparison.
Total Cost (Quantity x Unit Price, MNOK) 5400 MNOK
Uncertainties
Units % ChangeTriple Estimate Optimistic 55 -24 % Optimistic 55 -27 %
Most likely 72 Most likely 75
Pessimistic 100 39 % Pessimistic 90 20 %
1.1 Tunnels Basis (without superstructure), detailed content according to memo: HSR Norway Basis for Cost Estimates, 2007-03-12
Unit Price (MNOK)KM % Change
Level of pregrouting, amount of heavy rock etc. Short distances the span is from 40 to 110.

Concept Evaluation, Cost Estimate and Uncertainty Analysis, Report 1
Metier AS Page 22
Main Cost Element Tunnels Additions (without superstructure)Content
Quantity- and Unit Price Estimate (most likely) and assumptions Element Quantity (km) Assumptions Unit Price (MNOK) Assumptions
Fixed (pr. sites) 25 Assume 25 sites for all tunnels.
20 Covers fixed cost independent of tunnel length. Workshop, support installation, "learning curve deficiency".
Addition for service tunnel
60 For tunnels longer than 800 m.
35 35 m2, shares resources with main tunnel when good/fair rock, assume 50% of D&B and transport, 80% of rock treatment
Addition for crossing sections in tunnel
10 Major part of crossing section in Soknedalen is in tunnel, elsewhere none. Assume 0.8 crossing sections in tunnel.
40 x 2 normal tunnel (35 + 40)
Addition for soil tunnels and longer portals
2 Cut&cover tunnels + portal structures.
60 Includes rock cut average 10 m, concrete structure, membrane, backfill & landscaping minus average rock tunnel cost.
Total Cost (Quantity x Unit Price, MNOK) 3120 MNOK
Uncertainties
Units % ChangeTriple Estimate Optimistic Optimistic 2120 -32 %
Most likely Most likely 3120Pessimistic Pessimistic 3620 16 %
Total Cost (MNOK)
1.2 Tunnel Additions, inlcuding fixed sites, service tunnels, crossing sections, soil tunnels and longer portals. Detailed content according to memo: HSR Norway Basis for Cost Estimates, 2007-03-12
Uncertainty assessed on Total Cost. Possible reductions of MNOK 1000, primarily on service tunnels. Possible increase of MNOK 500, primarily on service tunnels
KM

Concept Evaluation, Cost Estimate and Uncertainty Analysis, Report 1
Metier AS Page 23
Main Cost Element Open line Basis (without superstructure)Content
Quantity- and Unit Price Estimate (most likely) and assumptions Element Quantity (km) Assumptions Unit Price (MNOK) Assumptions
New open line sections, even terrain
284 Includes fences and drainage, frost insulation, landscaping and minor waterway crossings. Smaller wildlife crossing. Protection measures for integrity of the line.
20 Cleaning and debris treatment of 20 m wide roadbase, average 45 m3/m a 100.- (soil replacement + embankment of which 20% by rock blasting). 2 x fence a 1000*/m, drains+cable ducts: 4000*/m, creek and minor wildlife culverts, pole foundations, gravel road, landscaping, revegetation etc.
Total Cost (Quantity x Unit Price, MNOK) 5670 MNOK
Uncertainties Uncertainty assessed on Total Cost.
Units % ChangeTriple Estimate Optimistic Optimistic 15 -25 %
Most likely Most likely 20Pessimistic Pessimistic 30 50 %
2.1 Open line Basis (without superstructure), including new open line sections in even terrain.
KM Total Cost (MNOK)

Concept Evaluation, Cost Estimate and Uncertainty Analysis, Report 1
Metier AS Page 24
Main Cost Element Open lineContent
Quantity- and Unit Price Estimate (most likely) and assumptions Element Quantity (km) Assumptions Unit Price (MNOK) Assumptions
Addition for silt soil 71 25 % of total running line, Outside fill areas
15 Extensive use of "imported" roadfill, geotextile, extra frost insulation and soil exchange,
Addition for soft soil 48 17% of total running line
25 Ground improvement by use of LC piles or other measures, wider excavation, imported fill, surface erosion treatment, environmental care during groundwork.
Total Cost (Quantity x Unit Price, MNOK) 2268 MNOK
Uncertainties
Units % ChangeTriple Estimate Optimistic Optimistic 1134 -50 %
Most likely Most likely 2268Pessimistic Pessimistic 4536 100 %
KM Total Cost (MNOK)
Uncertainty assessed on Total Cost. Possible reductions of 50 %, possible increase of 100 %.
2.2 Open line poor soil additions, including silt- and soft soil

Concept Evaluation, Cost Estimate and Uncertainty Analysis, Report 1
Metier AS Page 25
Main Cost Element Open lineContent
Quantity- and Unit Price Estimate (most likely) and assumptions Element Quantity (km) Assumptions Unit Price (MNOK) Assumptions
Addition for low cuts/fills
142 50 % of total running line. Less than 5 m, average 4 m
15 Wider roadbase corridor,average 100 m3/m excavation/fill, of which 20% rock cuts average.
Addition for high cuts/fills
57 20 % of total running line. Larger than 5 m, average 10 m
30 Even wider roadbase, 250 m3/m excavation/fill, long transport, extensive road building and landscaping.
Total Cost (Quantity x Unit Price, MNOK) 3827 MNOK
Uncertainties
Units % Change
Triple Estimate Optimistic Optimistic 1914 -50 %Most likely Most likely 3827Pessimistic Pessimistic 9568 150 %
2.3 Open line cuts/fills additions
Uncertainty assessed on Total Cost. Possible reductions of 50 %, possible increase of 150 %.
KM Total Cost (MNOK)

Concept Evaluation, Cost Estimate and Uncertainty Analysis, Report 1
Metier AS Page 26
Main Cost Element ConstructionsContent
Quantity- and Unit Price Estimate (most likely) and assumptions Element Quantity (km) Assumptions Unit Price (MNOK) Assumptions
Wildlife crossings 142 1 per 2 km. 2,5 Net 20 m passing = 30 m structure, 80'/m + backfill & landscaping = 3 MNOK, but 20% combined with other structures.
Road crossings including connections
95 1 per 3 km. Assume that wildlife crossings sometimes used as road crossings
2,5 -
Total Cost (Quantity x Unit Price, MNOK) 591 MNOK
Uncertainties
Units % ChangeTriple Estimate Optimistic Optimistic 295,3 -50 %
Most likely Most likely 590,6Pessimistic Pessimistic 1181 100 %
Uncertainty assessed on Total Cost. Possible reductions of 50 % (due to lower number of crossings), possible increase of 100 % (due to higher price).
KM Total Cost (MNOK)
3.1 Crossings (wildlife and roads)

Concept Evaluation, Cost Estimate and Uncertainty Analysis, Report 1
Metier AS Page 27
Main Cost Element ConstructionsContent
Quantity- and Unit Price Estimate (most likely) and assumptions Element
Quantity (sites) Assumptions Unit Price (MNOK) Assumptions
Reconstruction of local infrastructure
25 - 10 -
Total Cost (Quantity x Unit Price, MNOK) 250 MNOK
Uncertainties
Units % ChangeTriple Estimate Optimistic Optimistic 125 -50 %
Most likely Most likely 250Pessimistic Pessimistic 500 100 %
3.2 Reconstruction of local infrastructure
Uncertainty assessed on Total Cost. Possible reductions of 50 %, possible increase of 100 %.
KM Total Cost (MNOK)
Main Cost Element ConstructionsContent
Quantity- and Unit Price Estimate (most likely) and assumptions Element Quantity (km) Assumptions Unit Price (MNOK) Assumptions
Railway bridges 11 Identified 7 km, non-identified approximately 50%.
120 -
Total Cost (Quantity x Unit Price, MNOK) 1260 MNOK
Uncertainties
Units % ChangeTriple Estimate Optimistic 7 -33 % Optimistic 84 -30 %
Most likely 11 Most likely 120Pessimistic 14 33 % Pessimistic 156 30 %
Unit Price (MNOK)KM % Change
3.3 Railway bridges

Concept Evaluation, Cost Estimate and Uncertainty Analysis, Report 1
Metier AS Page 28
Main Cost Element SuperstructureContent
Quantity- and Unit Price Estimate (most likely) and assumptions Element Quantity (km) Assumptions Unit Price (MNOK) Assumptions
Regular line 366 Tunnels, bridges and open line.
24 -
Total Cost (Quantity x Unit Price, MNOK) 8784 MNOK
Uncertainties
Units % ChangeTriple Estimate Optimistic Optimistic 6588 -25 %
Most likely Most likely 8784Pessimistic Pessimistic 9516 8 %
4.1 Superstructure Regular line
Uncertainty assessed on Total Cost. Possible reductions in total cost of 25 %, possible increase of 8 %. (Unit price ranging from 18 to 26 MNOK)
KM Total Cost (MNOK)
Main Cost Element SuperstructureContent
Quantity- and Unit Price Estimate (most likely) and assumptions Element Quantity (km) Assumptions Unit Price (MNOK) Assumptions
Additional for crossings
36 3 crossings. 21 -
Total Cost (Quantity x Unit Price, MNOK) 756 MNOK
Uncertainties
Units % ChangeTriple Estimate Optimistic Optimistic 567 -25 %
Most likely Most likely 756Pessimistic Pessimistic 819 8 %
4.2 Superstructure additions for crossings
Uncertainty assessed on Total Cost. Possible reductions in unit price of 25 %, possible increase of 8 %.
Total Cost (MNOK)KM

Concept Evaluation, Cost Estimate and Uncertainty Analysis, Report 1
Metier AS Page 29
Main Cost Element SuperstructureContent
Quantity- and Unit Price Estimate (most likely) and assumptions Element Quantity (km) Assumptions Unit Price (MNOK) Assumptions
Additional for slabtrack
65 Assume 90% of total length of tunnels.
7 -
Total Cost (Quantity x Unit Price, MNOK) 454 MNOK
Uncertainties
Units % ChangeTriple Estimate Optimistic Optimistic 324 -29 %
Most likely Most likely 453,6Pessimistic Pessimistic 648 43 %
KM Total Cost (MNOK)
4.3 Superstructure additional for slabtrack
Uncertainty assessed on Total Cost. Possible reductions in total cost of 29 %, possible increase of 43 %, due to unit price variations (ranging from MNOK 5 to 10).
Main Cost Element StationsContent
Quantity- and Unit Price Estimate (most likely) and assumptions Element
Quantity (station) Assumptions Unit Price (MNOK) Assumptions
Large station 1 Stange, 3 tracks. 90 -
Small stations 2 Koppang and Tynset. 20 -
Total Cost (Quantity x Unit Price, MNOK) 130 MNOK
Uncertainties
Units % ChangeTriple Estimate Optimistic Optimistic 100 -23 %
Most likely Most likely 130Pessimistic Pessimistic 200 54 %
5.1 Stations, including large- and small stations
Uncertainty assessed on Total Cost.
KM Total Cost (MNOK)

Concept Evaluation, Cost Estimate and Uncertainty Analysis, Report 1
Metier AS Page 30
Main Cost Element Power supplyContent
Quantity- and Unit Price Estimate (most likely) and assumptions Element
Quantity (stations) Assumptions Unit Price (MNOK) Assumptions
Power supply substations
5 One substation every 60 km. Power supply system 15 kV, 16 2/3 Hz.
100 Each station costs MNOK 80 - 100.
Total Cost (Quantity x Unit Price, MNOK) 500 MNOK
Uncertainties
Units % ChangeTriple Estimate Optimistic Optimistic 375 -25 %
Most likely Most likely 500Pessimistic Pessimistic 625 25 %
6.1 Power supply, including power supply substations
Uncertainty assessed on Total Cost.
KM Total Cost (MNOK)
Main Cost Element Special support constructions infrastructureContent
Quantity- and Unit Price Estimate (most likely) and assumptions Element
Quantity (sites) Assumptions Unit Price (MNOK) Assumptions
Special support Constructions infrastructure
2 - 100 -
Total Cost (Quantity x Unit Price, MNOK) 200 MNOK
Uncertainties
Units % ChangeTriple Estimate Optimistic Optimistic 100 -50 %
Most likely Most likely 200Pessimistic Pessimistic 500 150 %
Total Cost (MNOK)
7.1 Special support constructions infrastructure
Uncertainty assessed on Total Cost.
KM

Concept Evaluation, Cost Estimate and Uncertainty Analysis, Report 1
Metier AS Page 31
Main Cost Element Service and maintenance facilitiesContent
Quantity- and Unit Price Estimate (most likely) and assumptions Element
Quantity (sites) Assumptions Unit Price (MNOK) Assumptions
Service and maintenance facilities
2 - 20 -
Total Cost (Quantity x Unit Price, MNOK) 40 MNOK
Uncertainties
Units % ChangeTriple Estimate Optimistic Optimistic 36 -10 %
Most likely Most likely 40Pessimistic Pessimistic 44 10 %
KM Total Cost (MNOK)
8.1 Service and maintenance facilities
Uncertainty assessed on Total Cost.
Main Cost Element Infrastructure, planning and managementContent
Quantity- and Unit Price Estimate (most likely) and assumptions Element Quantity Assumptions
% of Contractor cost Assumptions
Contractor Management and Engineering
NA NA 15 % Include detailed engineering and warranties.
Uncertainties
UnitsTriple Estimate Optimistic Optimistic 12 %
Most likely Most likely 15 %Pessimistic Pessimistic 25 %
9.1 Contractor management and engineering
Uncertainty assessed on % of contractor cost
% Contractor costKM

Concept Evaluation, Cost Estimate and Uncertainty Analysis, Report 1
Metier AS Page 32
Main Cost Element Infrastructure, planning and managementContent
Quantity- and Unit Price Estimate (most likely) and assumptions Element Quantity Assumptions
% of Contractor cost Assumptions
Client Management and Engineering
NA NA 12 % Preinvestigation, studies, strategies and planning. Engineering.
Uncertainties
UnitsTriple Estimate Optimistic Optimistic 8 %
Most likely Most likely 12 %Pessimistic Pessimistic 16 %
9.2 Client management and engineering
Uncertainty assessed on % of contractor cost
% Contractor costKM

Concept Evaluation, Cost Estimate and Uncertainty Analysis, Report 1
Metier AS Page 33
Main Cost Element Land acquisitionContent
Quantity- and Unit Price Estimate (most likely) and assumptions Element Quantity (km) Assumptions Unit Price (MNOK) Assumptions
Land acquisitions 294 MNOK/km. Average width 50 m.
0,7 Property redemption 0,3 MNOK/km, land 0,2 MNOK/km and physical compensations 0,2 MNOK/km. Average is forest of semi-good quality, NOK 10/m2.
Total Cost (Quantity x Unit Price, MNOK) 206 MNOK
Uncertainties
Units % ChangeTriple Estimate Optimistic Optimistic 103 -50 %
Most likely Most likely 206Pessimistic Pessimistic 412 100 %
10.1 Land acquisition
Uncertainty assessed on Total Cost.
KM Total Cost (MNOK)
Main Cost Element Trains and facilitiesContent
Quantity- and Unit Price Estimate (most likely) and assumptions Element Quantity (km) Assumptions Unit Price (MNOK) Assumptions
Trains 14 - 112 -Maintenance facilities
1 - 1920 -
Total Cost (Quantity x Unit Price, MNOK) 3488 MNOK
Uncertainties
Units % ChangeTriple Estimate Optimistic Optimistic 2488 -29 %
Most likely Most likely 3488Pessimistic Pessimistic 4000 15 %
KM Total Cost (MNOK)
Uncertainty assessed on Total Cost.
11.1 Trains and facilities

Concept Evaluation, Cost Estimate and Uncertainty Analysis, Report 1
Metier AS Page 34
Appendix 4 Uncertainty analysis – Uncertainty drive rs
The table presents the uncertainty drivers identified, assumptions and scenarios. All values applies to the investment cost estimate.
Uncertainties Planning Reference Best Case Scenario Most Likely Scenario Worst Case Scenario U1 Technological Development Technological development Suitability of existing train technology Technical solutions not available in time Construction technology development
Based on todays technology Applies to trains and infrastructure No account taken with respect to change of solutions ETCS level 2, but with cable signalling According to TSI Non-industrialised construction methods, except TBM for some of the tunnels.
More industrialised methods for structures, like pre-cast bridges and earthworks, e.g. larger excavators supplemented by conveyers. Standardised elevated line may be used. Non-cabling signalling is a potential upside. Existing trains suitable. The following possible reductions in cost has been identified: Bridges: -50% Open line: -15% (of open line per length and additions for poor soil and cuts/fills) Tunnel: -20% (of tunnel length and additions) Superstructure, innovative power supply: -2.5 MNOK/km (of total line) Total reductions of 3445 MNOK. Value: 0.92
Some improvement, i.e. best case scenario. The project is likely to profit from 10 years of on-going technological development. In addition, the size of project is a technological driver itself. Value: 0.98
No development. Value: 1.0
U2 Technical Requirements New technical requirements during the project Maintenance concept and needs Superstructure/slab track Construction infrastructure Removal of old tracks and re-establishing the terrain Safety requirements
Based on TSI (EU standard) of today. Most parameters stable, physical parameters. TSI state that HSL shall have continuous fences, and crossings every one km, mostly comparable to Gardemobanen. Safety requirements according to TSI. Line integrity covered by TSI on a low level, e.g. must include integrity solutions not
Some cost reduction due to change of requirements, e.g. substitutes for slabtracks in tunnels (6 MNOK/KM x 0.9 x length tunnel = 389 MNOK). Value: 0.98
Some cost increase due to change of requirements, e.g. extended measures for snow and integrity of the line (+ 1000 MNOK). Value: 1.02
Major Cost increase due to change of requirements, e.g. fully lined tunnels (20 MNOK/km x length tunnel = 1440 MNOK) and extended measures integrity with respect to avalanches (1000 MNOK). Value: 1.10

Concept Evaluation, Cost Estimate and Uncertainty Analysis, Report 1
Metier AS Page 35
Uncertainties Planning Reference Best Case Scenario Most Likely Scenario Worst Case Scenario yet developed.
U3 Operational Concept optimisation Level of speed on long lines Operational concepts Built-in flexibilitiy and capacity Connection with existing railway High speed buffer above calibrating limit Railway transportation redundancy Travel time optimisation Governing performance requirements
200 to 250 kph on the new line, crossing sections 160 kph in both directions Hourly service in peak time (morning and evenings) Freight traffic by night The removal/keeping of the line Hamar Tynset is not included with respect to cost or benefits Keeping the existing line between Trondheim to Ulsberg There is a planned double track from Eidsvoll to Sørlie From Eidsvoll to Sørlie planned 200 210 kph
Some cost reduction due to investment cost optimised operational concept. Value: 0.98
Some cost increase due to e.g. Life Cycle Cost optimised concept (+ 500 MNOK) Value: 1.01
Major cost increase due to demand of all inclusive service, e.g. 30 min service; demands 4 additional crossings (7 in total), 2 additional stations (5 in total) and 7 additional trains. (4 x 21 + 2 x 20 + 7 x 112 = 908 MNOK). Value: 1.05
U4 External Demands NIMBY, social and propriatery concerns resulting in suboptimal lines Environmental and cultural heritage concerns resulting in suboptimal lines Agriculture land-use Conflicting environmental issues Demands from stakeholders Acceptance of spoil deposits
No external demands included in basic railway figures. Wildlife passings and compensating measures added as specific items. No sub-optimising of lines due to NIMBY. The law requirements with respect to noise protection, cultural heritage, and eco-system apply. Water frame directive apply. Consideration of culturally preserved objects in the planning phase. Comply with a normal year 2000 standard with respect to environmental impacts (establish a reasonable standard regarding wildlife, crossings, re-establish roads, visual aspects, business).
Some cost reduction due to generally generous attitude ( -500 MNOK) Value: 0.99
All issues covered, as is. Value: 1.0
Major cost increase due to extensive local and wildlife opposition (2500 MNOK). Value: 1.05

Concept Evaluation, Cost Estimate and Uncertainty Analysis, Report 1
Metier AS Page 36
Uncertainties Planning Reference Best Case Scenario Most Likely Scenario Worst Case Scenario U5 Project Ownership Duration of the planning process System of project funding Focus on key values, not the nice-to-haves Swedish co-operation
Professional and rational decision making from owners. Assume good focus on key values, resistance on nice-to-haves. Project optimised funding system.
Major cost reduction due to optimum stakeholder management, organisation, predictability and funding program. Value: 0.90
As planned. Value: 1.0
Non-optimal funding program, program deviations and owners indecisiveness. Value: 1.20
U6 Project Management Project organisation Project Management Overall Contract strategy
Relevant experience from other countries will be used Follow optimised project schedule Project optimised organisation and contract strategy No particular assumptions are made with respect to project management.
Optimised use of relevant experience in addition to optimised project schedule, organisation and contract strategy. Value: 0.88
As planned. Value: 1.0
Project well ahead in time, precision level in the level of planning a major uncertainty. Value: 1.12
U7 Contractors and Materials Market Shortage of materials Contractor market
The project will create its own predictable market situation. Balanced European contractors market (construction capacity is flexible). Balanced international materials marked.
Good competition due to attractive project. Value: 0.90
As planned. Value: 1.0
Major shortages in contractor capacity. Project on top of the regular investments in Scandinavia (+15%). Heated world market in materials creating hiqh price and delays (+10%). Value: 1.25
U8 Level of planning Precision level in the level of planning Use and relevance of experience from other countries Cost estimation
Prefeasibility level Ref. to document basis.
Further planning and engineering will uncover major cost reduction. Low relevance of reference projects with positive impact. Value: 0.85
As planned. Value: 1.0
Further planning and engineering will uncover major unforeseen costs. Low relevance of reference projects with large negative impact. Value: 1.25

Concept Evaluation, Cost Estimate and Uncertainty Analysis, Report 1
Metier AS Page 37
Appendix 5 Uncertainty analysis – Correlations
The following correlations are included in the quantitative model:
1. Tunnel additions: Because of dependence of tunnel length.
• Tunnel length
• Tunnels additions (without superstructure)
• Correlation coefficient 0.5
2. Superstructure addition for crossings: Because of price dependence. • Superstructure regular line
• Superstructure additions for crossings
• Correlation coefficient 0.75
3. Additions for slabtrack: Because of dependence of tunnel length • Tunnel length
• Additions for slabtrack
• Correlation coefficient 0.5

Concept Evaluation, Cost Estimate and Uncertainty Analysis, Report 1
Metier AS Page 38
Appendix 6 Memo Basis for cost estimates - tunnels
The present appendix comrises a memo prepared by Sintef on tunnels basis and assumptions with respect to the cost estimates for the new high-speed railway line Oslo – Trondheim. The report has not been modified by Metier.
MEMO
MEMO CONCERNS
HSR Norway Basis for Cost Estimates
FO
R Y
OU
R A
TT
EN
TIO
N
CO
MM
EN
TS
AR
E IN
VIT
ED
FO
R Y
OU
R IN
FO
RM
AT
ION
AS
AG
RE
ED
DISTRIBUTION
SINTEF Building and Infrastructure Address: P O Box 124 Blindern NO-0314 Oslo NORWAY Location: Forskningsveien 3b NO-0373 Oslo Telephone: +47 22 96 55 55 Fax: +47 22 69 94 38 Enterprise No.: NO 948 007 029 MVA
FILE CODE CLASSIFICATION
ELECTRONIC FILE CODE
Report JBV High Speed Railway - Report 1 Rev 2.4
PROJECT NO. DATE PERSON RESPONSIBLE / AUTHOR NUMBER OF PAGES
2007-03-12 42 Background and purpose The cost estimation comprises two phases:
1. a rational, documented and aggregated cost estimation being built upon relevant experiences and knowledge of the matter
2. a Bayesian type study of uncertainty drivers and uncertainty effects
For phase 1, when working in a group process, it is required to describe and communicate the actual items and all their content and conditions.
In this memo, some of the basic cost elements are suggested for content and governing conditions.
Tunnel (without superstructure) pos. 2.2.: Quote: 75 m2, D&B 250.-, trasport 100.-, SRF+rock bolts 9'/m, drain&invert 10'/m, heavy RS (20%x35'): 7'/m, pregrouting (20%x400'/10m): 8'/m, w&fr insulation (50%x30'): 15'/m. TBM tunnel to be chosen only if economical in comparison.
Cost details:
Concept Evaluation, Cost Estimate and Uncertainty Analysis, Report 1
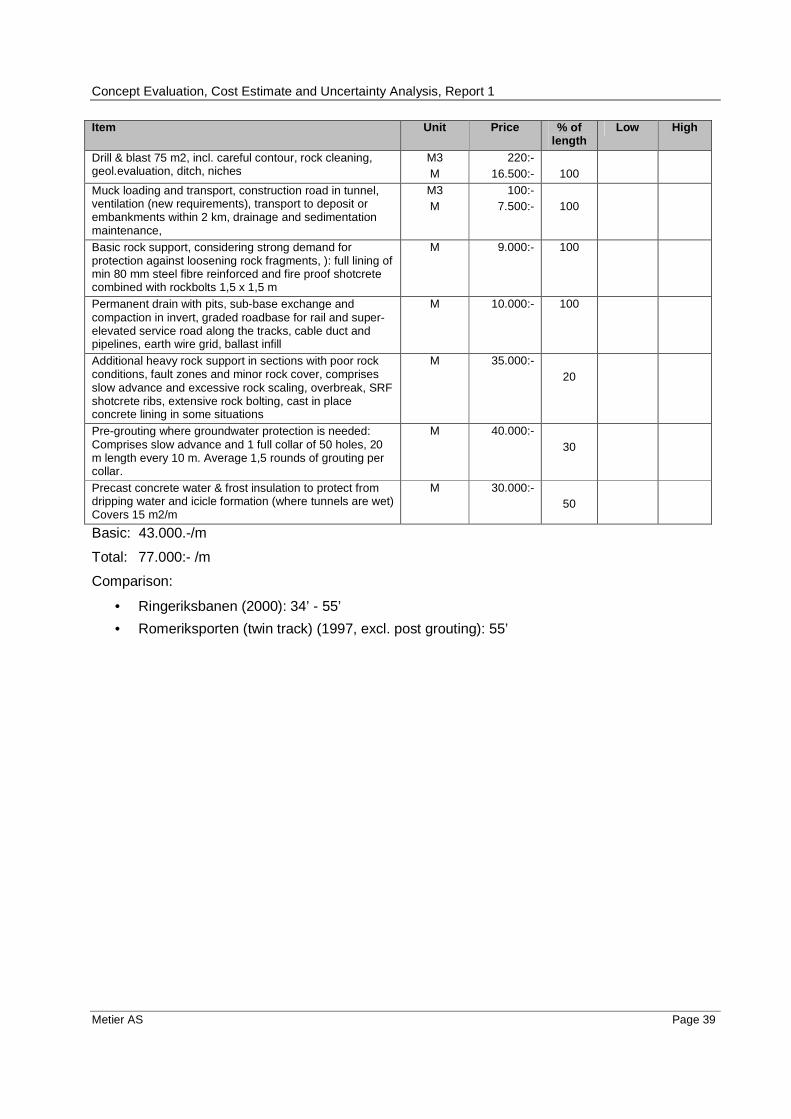
Metier AS Page 39
Item Unit Price % of length
Low High
Drill & blast 75 m2, incl. careful contour, rock cleaning, geol.evaluation, ditch, niches
M3 M
220:- 16.500:-
100
Muck loading and transport, construction road in tunnel, ventilation (new requirements), transport to deposit or embankments within 2 km, drainage and sedimentation maintenance,
M3 M
100:- 7.500:-
100
Basic rock support, considering strong demand for protection against loosening rock fragments, ): full lining of min 80 mm steel fibre reinforced and fire proof shotcrete combined with rockbolts 1,5 x 1,5 m
M 9.000:- 100
Permanent drain with pits, sub-base exchange and compaction in invert, graded roadbase for rail and super-elevated service road along the tracks, cable duct and pipelines, earth wire grid, ballast infill
M 10.000:- 100
Additional heavy rock support in sections with poor rock conditions, fault zones and minor rock cover, comprises slow advance and excessive rock scaling, overbreak, SRF shotcrete ribs, extensive rock bolting, cast in place concrete lining in some situations
M 35.000:- 20
Pre-grouting where groundwater protection is needed: Comprises slow advance and 1 full collar of 50 holes, 20 m length every 10 m. Average 1,5 rounds of grouting per collar.
M 40.000:- 30
Precast concrete water & frost insulation to protect from dripping water and icicle formation (where tunnels are wet) Covers 15 m2/m
M 30.000:- 50
Basic: 43.000.-/m
Total: 77.000:- /m
Comparison:
• Ringeriksbanen (2000): 34’ - 55’
• Romeriksporten (twin track) (1997, excl. post grouting): 55’

Concept Evaluation, Cost Estimate and Uncertainty Analysis, Report 1
Metier AS Page 40
8,5 – 9 m
Open void outside UIC section to reduce air friction
Gross: 75 m2 Drill&BlastExchanged sub-base: graded, compactedrock
Grouted rock mass where groundwater protection is needed: assume 20%. Comprises 1 full collar of 50 holes, 20 m length every 10 m.
Rock support Basic: 100% 8 cm SRF shotcrete + rock bolts 1,5 x 1,5 m. Additional rock support in poor rock: assume 20% (10/20/30) of total length, comprising slow advance, shotcrete ribs& extensive bolting or full CCL.
(dotted) W&F insulation: assume 50%
Cable duct 600 mm
Road base for rail & service road, 600 + 400 mm
Drainage: permeable sub-base + duct and pits
8,5 – 9 m8,5 – 9 m
Open void outside UIC section to reduce air friction
Gross: 75 m2 Drill&BlastExchanged sub-base: graded, compactedrock
Grouted rock mass where groundwater protection is needed: assume 20%. Comprises 1 full collar of 50 holes, 20 m length every 10 m.
Rock support Basic: 100% 8 cm SRF shotcrete + rock bolts 1,5 x 1,5 m. Additional rock support in poor rock: assume 20% (10/20/30) of total length, comprising slow advance, shotcrete ribs& extensive bolting or full CCL.
(dotted) W&F insulation: assume 50%
Cable duct 600 mm
Road base for rail & service road, 600 + 400 mm
Drainage: permeable sub-base + duct and pits
Additional cost for service tunnel; Pos 2.3 Quote: 35 m2, shares resources with main tunnel when good/fair rock, assume 50% of D&B and transp, 80% of rock treatment
Principle:
• Tunnel < 800 m. no service tunnel nor rescue access.
• Tunnel 800 – 1,5 km: One or two adit tunnels from exterior, used as access during construction.
• Tunnel > 1,5 km: Parallel service tunnel between adit tunnel positions, cross adit c/c 500 m.
Given the conditions of stiff alignment, it will often be more convenient to utilise the separate adits for construction access, as the portal areas of the main tunnel might consist of extensive earthwork and long structures.

Concept Evaluation, Cost Estimate and Uncertainty Analysis, Report 1
Metier AS Page 41
Additional service tunnel may be approximately 35 m2 (allowing 2 trucks to pass everywhere). D&B + rock support may be 50 % of main tunnel through same rock mass. Resources per m3 are higher, volume is 50%, production conditions are favourable due to dual tunnel. Invert costs: 50%
Pre-grouting for groundwater control may be of size order 80%, as close to an equal additional amount of rock mass requires the same treatment. W&F insulation is negligible.
I.e.: Basic cost: 50% of 43’ = 21.500:-
Heavy rock support & pre-grouting: = 13.000:-
Total: 34.500:-/m
Length of adits from exterior is included in costs per tunnel site.
New open line sections, even terrain, Pos 3.2 Quote: Cleaning and debris treatment of 20 m wide roadbase, average 45 m3/m a 100.- (soil replacement + embankment of which 20% by rock blasting). 2 x fence a 1000*/m, drains+cable ducts: 4000*/m, creek and minor wildlife culverts, pole foundations, gravel road, landscaping, revegetation etc.
Cost details:
Item Unit Price % of length
Low High
Drill & blast rock outcrops in line, average 15 m3/m, incl. ditch
M3 M
100:- 1.500:-
20
Cleaning of vegetation, removal and treatment of debris M 2.000.- 70 Average 45 m3/m excavation of and infill of graded sub-base for rail and service road, loading and transport, construction roadworks, transport to deposit or embankments within 5 km
M3 M
100:- 4.500:-
100
Compaction in invert, graded roadbase for rail and service road along the tracks,
M 5.000:- 100
Landscaping, care of creeks and minor wildlife, re-vegetations
M 3.000:- 100
Fences M 2.000:- 100
Permanent drain with pits, cable duct and pipelines, earth wire grid, pole foundations ballast infill
M 4.000:- 100
Total: 20.000:-/m
Addition for soft soil; Pos 3.4 Quote: Ground improvement by use of LC piles or other measures, wider excavation, imported fill, surface erosion treatment, environmental care during groundwork
Addition for high cuts/fills; Pos 3.6 Quote: Even wider roadbase, 250 m3/m excavation/fill, long transport, extensive road building and landscaping

Concept Evaluation, Cost Estimate and Uncertainty Analysis, Report 1
Metier AS Page 42
Appendix 7 Memo Geotechnical study of selected area s


