Report to Congress on Medicaid Disproportionate Share ... · Medicaid Disproportionate Share...
118
Report to Congress on Medicaid Disproportionate Share Hospital Payments FEBRUARY 2016 Medicaid and CHIP Payment and Access Commission
Transcript of Report to Congress on Medicaid Disproportionate Share ... · Medicaid Disproportionate Share...

Report to Congress on Medicaid Disproportionate Share Hospital Payments
FEBRUARY 2016
Medicaid and CHIP Payment and Access Commission

About MACPAC The Medicaid and CHIP Payment and Access Commission (MACPAC) is a non-partisan legislative branch agency that provides policy and data analysis and makes recommendations to Congress, the Secretary of the U.S. Department of Health and Human Services, and the states on a wide array of issues affecting Medicaid and the State Children’s Health Insurance Program (CHIP). The U.S. Comptroller General appoints MACPAC’s 17 commissioners, who come from diverse regions across the United States and bring broad expertise and a wide range of perspectives on Medicaid and CHIP.
MACPAC serves as an independent source of information on Medicaid and CHIP, publishing issue briefs and data reports throughout the year to support policy analysis and program accountability. The Commission’s authorizing statute, 42 USC 1396, outlines a number of areas for analysis, including:
• payment;• eligibility; • enrollment and retention;• coverage;• access to care;• quality of care; and• the programs’ interaction with Medicare and the health care system generally.
MACPAC’s authorizing statute also requires the Commission to submit reports to Congress by March 15 and June 15 of each year. In carrying out its work, the Commission holds public meetings and regularly consults with state officials, congressional and executive branch staff, beneficiaries, health care providers, researchers, and policy experts.

FEBRUARY 2016
Report to Congress on Medicaid Disproportionate Share Hospital Payments
Medicaid and CHIP Payment and Access Commission


Commissioners
Sara Rosenbaum, JD, ChairMarsha Gold, ScD, Vice ChairBrian BurwellSharon Carte, MHSAndrea Cohen, JDGustavo Cruz, DMD, MPHToby Douglas, MPP, MPHLeanna GeorgeChristopher Gorton, MD, MHSAHerman Gray, MD, MBAStacey Lampkin, FSA, MAAA, MPANorma Martínez Rogers, PhD, RN,
FAANCharles Milligan, JD, MPHSheldon Retchin, MD, MSPHPeter Szilagyi, MD, MPHPenny Thompson, MPAAlan Weil, JD, MPP
Anne L. Schwartz, PhD, Executive Director
February 1, 2016
The Honorable Joseph R. Biden, Jr. President of the Senate U.S. Capitol Washington, DC 20510
The Honorable Paul Ryan Speaker of the House U.S. House of Representatives Washington, DC 20515
Dear Mr. Vice President and Mr. Speaker:
On behalf of the Medicaid and CHIP Payment and Access Commission (MACPAC), I am pleased to submit our initial Report to Congress on Medicaid Disproportionate Share Hospital Payments. The Protecting Access to Medicare Act of 2014 required MACPAC to produce annual reports on Medicaid disproportionate share hospital (DSH) payments. This report complies with the requirement that the Commission submit its first report by February 1, 2016.
Medicaid DSH payments provide substantial support to safety-net hospitals by helping to offset uncompensated care costs for Medicaid and uninsured patients. In 2014, Medicaid made a total of $18 billion in DSH payments ($8 billion in state funds and $10 billion in federal funds). About half of all U.S. hospitals receive such payments, with most going to hospitals that serve a particularly high share of Medicaid and other low-income patients, known as deemed DSH hospitals. But more than one-third of DSH payments are made to hospitals that do not meet this standard.
The statutory directive to the Commission requires that it analyze the relationship of state DSH allotments to data relating to changes in the number of uninsured individuals, data relating to the amount and sources of hospitals’ uncompensated care costs, and data identifying hospitals with high levels of uncompensated care that also provide access to essential community services for low-income, uninsured, and vulnerable populations. Our analysis finds little meaningful relationship between DSH allotments and these measures. Moreover, much of the current variation in state DSH allotments, which reflect patterns of state DSH spending first recorded nearly a quarter-century ago, is projected to persist even after DSH allotment reductions begin to take effect in fiscal year (FY) 2018 as required under current law.
Further, while the Patient Protection and Affordable Care Act (ACA, P.L. 111-148, as amended) has led to a reduction in the number of people without health insurance, its effects on hospital uncompensated care are not fully known. Early reports suggest a decline in unpaid costs of care for
Medicaid and CHIP Paymentand Access Commission
1800 M Street NWSuite 650 South Washington, DC 20036
www.macpac.gov 202-350-2000202-273-2452
Advising Congress onMedicaid and CHIP Policy
uninsured patients, particularly in states that have expanded Medicaid. But Medicaid shortfall (that is, the difference between Medicaid payments and the costs of providing services to Medicaid patients) may be increasing with greater Medicaid enrollment.
In the Commission’s view, DSH allotments and payments should be better targeted toward states and hospitals that serve a disproportionate share of Medicaid and low-income patients and that have higher levels of uncompensated care, consistent with the original statutory intent. The scheduled cuts in DSH allotments make such targeting particularly important.
In order to better analyze current policy and new approaches to target DSH payments, more complete and reliable data on Medicaid payments to hospitals are needed. Greater transparency in how hospitals are being paid is also important to understanding states’ use of Medicaid funds and the extent to which these are consistent with federal requirements. To fill these data gaps, the Commission recommends that the Secretary of the U.S. Department of Health and Human Services collect and report hospital-specific data on all types of Medicaid payments for all hospitals that receive them. In addition, the Secretary should collect and report data on the sources of non-federal share necessary to determine net Medicaid payment at the provider level.
The report is presented in three chapters. Chapter 1 discusses the role that Medicaid DSH payments have played since 1981 in supporting the viability of safety-net hospitals. Chapter 2 compares the relationship of current and projected DSH allotments to the three factors laid out in our statutory directive to study DSH payment and examines how the ACA is affecting DSH hospitals. Chapter 3 discusses limitations of current data sources that affect our ability to analyze how to improve targeting of DSH payments. This chapter also explains the rationale behind our recommendation.
The Commission will continue analyzing policy approaches to improve the targeting of Medicaid DSH payments in future reports. Among other issues, we plan to take an in-depth look at options such as modifying the criteria for DSH payment eligibility, redefining uncompensated care for Medicaid DSH purposes, and rebasing states’ DSH allotments.
MACPAC is committed to providing in-depth, non-partisan analyses of all aspects of Medicaid and CHIP. We hope this opening analysis of Medicaid DSH payment will prove useful to Congress as it considers policies to ensure access to care and promote efficient and equitable payment of providers.
Sincerely,
Sara Rosenbaum, JD Chair
Medicaid and CHIP Paymentand Access Commissionwww.macpac.gov

Report to Congress on Medicaid Disproportionate Share Hospital Payments vii
Commission Members and Terms
Commission Members and TermsSara Rosenbaum, JD, Chair Washington, DC
Marsha Gold, ScD, Vice Chair Washington, DC
Term Expires December 2016
Sharon Carte, MHS South Charleston, WV
Andrea Cohen, JD New York, NY
Herman Gray, MD, MBA Detroit, MI
Norma Martínez Rogers, PhD, RN, FAAN San Antonio, TX
Sara Rosenbaum, JD Washington, DC
Term Expires December 2017Gustavo Cruz, DMD, MPH New York, NY
Leanna George Benson, NC
Marsha Gold, ScD Washington, DC
Charles Milligan, JD, MPH Albuquerque, NM
Sheldon Retchin, MD, MSPH Columbus, OH
Peter Szilagyi, MD, MPH Los Angeles, CA
Term Expires December 2018Brian Burwell Cambridge, MA
Toby Douglas, MPP, MPH Davis, CA
Christopher Gorton, MD, MHSA Watertown, MA
Stacey Lampkin, FSA, MAAA, MPA Tallahassee, FL
Penny Thompson, MPA Ellicott City, MD
Alan Weil, JD, MPP Bethesda, MD

February 2016viii
Commission StaffAnne L. Schwartz, PhD, Executive Director
Office of the Executive DirectorAnnie Andrianasolo, MBA, Executive Assistant to the Executive Director
Kathryn Ceja, Director of Communications
Laura Beth Pelner, Communications/Graphic Design Specialist
Policy DirectorsAmy Bernstein, ScD, MHSA Policy Director and Contracting Officer
Moira Forbes, MBA, Policy Director
Mary Ellen Stahlman, MHSA, Policy and Congressional Affairs Director
Principal AnalystsMartha Heberlein, MA
Joanne Jee, MPH
Chris Park, MS
Chris Peterson, MPP
Anna Sommers, PhD, MS, MPAff
Kristal Vardaman, MSPH
Senior AnalystsVeronica Daher, JD
Benjamin Finder, MPH
Sarah Melecki, MPAff
Robert Nelb, MPH
Katie Weider, MPH
AnalystsKacey Buderi, MPA Kayla Holgash, MPH
Operations and FinanceRicardo Villeta, MBA, Deputy Director of Operations, Finance, and Management
James Boissonnault, MA, Chief Information Officer
Benjamin Granata, Finance/Budget Specialist
Allissa Jones, Administrative Assistant
Ken Pezzella, Chief Financial Officer
Eileen Wilkie, Administrative Officer
Commission Staff

Report to Congress on Medicaid Disproportionate Share Hospital Payments ix
Acknowledgements
AcknowledgementsThis inaugural Report to Congress on Medicaid Disproportionate Share Hospital Payments was completed under the direction of MACPAC’s founding chair, Diane Rowland, and was approved by the Commission in the fall of 2015. In addition to Chair Rowland, other commissioners contributing to the report whose terms ended at the close of 2015 were Donna Checkett, Patricia Gabow, Mark Hoyt, Patricia Riley, and Steven Waldren.
The Commission gratefully acknowledges the following health policy experts, federal and state officials, and colleagues, whose contributions of expertise, perspective, and time were essential in preparing this report:
Greg Berger, Tom Betlach, Theresa Coughlin, Richard Cuno, Chris Czvornyek, Joan DaVanzo, Al Dobson, Audrey El-Gamil, Beth Feldpush, Richard Goldstein, Debbie Gough, Stuart Guterman, Steven Heath, Douglas Henkel, Rory Howe, Lane Koenig, Kevin Londeen, Andrea Maresca, John McCarthy, Pam McDonald, Dave Mosley, Jack Needleman, Molly Collins Offner, Erin O’Malley, Josh Saavoss, Samuel Soltoff, Jeff Stensland, and Vikki Wachino.
We would like to thank Paula Gordon for her indispensable copy editing and Kevin Kempske and his talented team at GKV for their assistance in publishing this report.
Finally, we would like to thank Jim Teisl, who led the staff team for this report but left MACPAC as this publication was in the final stages of production.

February 2016x
Table of Contents
Table of ContentsCommission Members and Terms .................................................................................................................... vii
Commission Staff ............................................................................................................................................. viii
Acknowledgements ............................................................................................................................................ ix
Executive Summary .......................................................................................................................................... xiv
Chapter 1: Overview of Medicaid Policy on Disproportionate Share Hospital Payments ............................. 1
The History of Medicaid DSH Payment Policy ...................................................................................... 3
Current State DSH Allotments and Spending ........................................................................................ 7
Medicaid DSH Payments in Relation to Other Sources of Hospital Financing ................................... 8
Deemed DSH Hospital Characteristics ................................................................................................ 13
Medicaid DSH Allotment Reductions ................................................................................................... 14
Endnotes ................................................................................................................................................ 15
References ............................................................................................................................................. 15
Chapter 2: Analysis of Current and Future Disproportionate Share Hospital Allotments ........................... 17
Changes in the Number of Uninsured Individuals ............................................................................... 20
Changes in the Amount of Hospital Uncompensated Care ................................................................ 21
Hospitals with High Levels of Uncompensated Care That Also Provide Essential Community Services ............................................................................................................................. 26
DSH Allotment Projections ................................................................................................................... 28
Potential State Responses to Allotment Reductions .......................................................................... 33
Conclusion ............................................................................................................................................. 36
Endnotes ................................................................................................................................................ 36
References ............................................................................................................................................. 36
Chapter 3: Improving Data as the First Step to a More Targeted Disproportionate Share Hospital Policy ... 39
Data Limitations .................................................................................................................................... 42
Commission Recommendation ............................................................................................................ 45
Next Steps ............................................................................................................................................. 48
References ............................................................................................................................................. 51

Report to Congress on Medicaid Disproportionate Share Hospital Payments xi
Table of Contents
Appendix A: History of Key Legislation .................................................................................................... 53
References ............................................................................................................................................. 57
Appendix B: State-Level Data .................................................................................................................. 59
Appendix C: Methodology and Data Limitations ...................................................................................... 75
Primary Data Sources ........................................................................................................................... 77
Working Definition of Essential Community Services ......................................................................... 78
Projections of DSH Allotments and DSH Spending ............................................................................ 79
Preliminary Analysis of 2014 Medicare Cost Report Data .................................................................. 81
References ............................................................................................................................................. 81
Appendix D ............................................................................................................................................. 83
Authorizing Language from the Social Security Act (42 USC 1396) .................................................. 85
Commission Vote on Recommendation .............................................................................................. 92
Biographies of Commissioners ............................................................................................................ 93
Biographies of Staff .............................................................................................................................. 97

February 2016xii
Table of Contents
List of BoxesBOX 1-1. Glossary of Key Medicaid Disproportionate Share Hospital (DSH) Terminology ...................... 4
BOX 1-2. Disproportionate Share Hospital (DSH) Payments to Institutions for Mental Diseases .......... 6
BOX 2-1. Definitions and Data Sources for Uncompensated Care Costs ............................................... 21
BOX 2-2. Identifying Hospitals with High Levels of Uncompensated Care That Provide Essential Community Services for Low-Income, Uninsured, and Other Vulnerable Populations ........... 27
BOX 2-3. Factors Used in Disproportionate Share Hospital (DSH) Health Reform Reduction Methodology ............................................................................................................................... 30
BOX 3-1. Prior Federal Reports on Medicaid Disproportionate Share Hospital (DSH) Policy ............... 50
List of FiguresFIGURE 1-1. State DSH Spending as a Share of Total Medicaid Medical Assistance Expenditures, FY 2014 .......................................................................................................................................... 8
FIGURE 1-2. Share of Hospitals Receiving DSH Payments by State, SPRY 2011 ........................................ 10
FIGURE 1-3. Distribution of DSH Spending on Hospitals by Decile of Medicaid and Low-Income Utilization, 2011 .......................................................................................................................... 11
FIGURE 2-1. Uncompensated Care as a Share of Hospital Operating Costs by State, 2013 ...................... 22
FIGURE 2-2. Uncompensated Care as a Percentage of Hospital Operating Costs, 2011–2014 ................. 25
FIGURE 2-3. Unreduced DSH Allotments as a Share of State Medicaid Benefit Spending, FY 2018 ......... 29
FIGURE 2-4. Projected Percentage Decrease in State DSH Allotments, FY 2018 ........................................ 31
FIGURE 2-5. Distribution of FY 2018 State DSH Allotments (Unreduced and Reduced) per Uninsured Individual, 2014 ......................................................................................................... 32
FIGURE 2-6. Distribution of FY 2018 State DSH Allotments (Unreduced and Reduced) as a Percentage of 2013 Hospital Uncompensated Care ................................................................. 32
FIGURE 2-7. Distribution of FY 2018 State DSH Allotments (Unreduced and Reduced) per Deemed DSH Hospital Providing at Least One Essential Community Service (millions) ...................... 34
FIGURE 3-1. Medicaid Payments to DSH Hospitals as a Percentage of Medicaid Costs, SPRY 2011 ....... 43
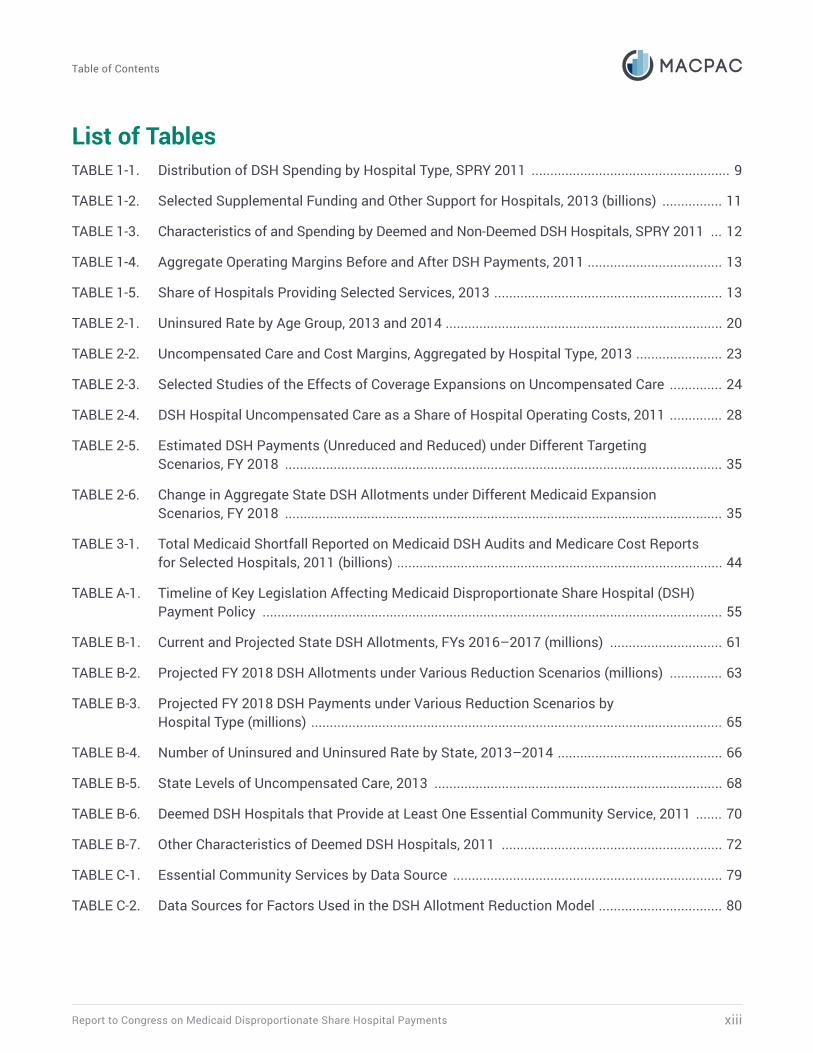
Report to Congress on Medicaid Disproportionate Share Hospital Payments xiii
Table of Contents
List of TablesTABLE 1-1. Distribution of DSH Spending by Hospital Type, SPRY 2011 ..................................................... 9
TABLE 1-2. Selected Supplemental Funding and Other Support for Hospitals, 2013 (billions) ................ 11
TABLE 1-3. Characteristics of and Spending by Deemed and Non-Deemed DSH Hospitals, SPRY 2011 ... 12
TABLE 1-4. Aggregate Operating Margins Before and After DSH Payments, 2011 .................................... 13
TABLE 1-5. Share of Hospitals Providing Selected Services, 2013 ............................................................. 13
TABLE 2-1. Uninsured Rate by Age Group, 2013 and 2014 .......................................................................... 20
TABLE 2-2. Uncompensated Care and Cost Margins, Aggregated by Hospital Type, 2013 ....................... 23
TABLE 2-3. Selected Studies of the Effects of Coverage Expansions on Uncompensated Care .............. 24
TABLE 2-4. DSH Hospital Uncompensated Care as a Share of Hospital Operating Costs, 2011 .............. 28
TABLE 2-5. Estimated DSH Payments (Unreduced and Reduced) under Different Targeting Scenarios, FY 2018 ..................................................................................................................... 35
TABLE 2-6. Change in Aggregate State DSH Allotments under Different Medicaid Expansion Scenarios, FY 2018 ..................................................................................................................... 35
TABLE 3-1. Total Medicaid Shortfall Reported on Medicaid DSH Audits and Medicare Cost Reports for Selected Hospitals, 2011 (billions) ....................................................................................... 44
TABLE A-1. Timeline of Key Legislation Affecting Medicaid Disproportionate Share Hospital (DSH) Payment Policy ........................................................................................................................... 55
TABLE B-1. Current and Projected State DSH Allotments, FYs 2016–2017 (millions) .............................. 61
TABLE B-2. Projected FY 2018 DSH Allotments under Various Reduction Scenarios (millions) .............. 63
TABLE B-3. Projected FY 2018 DSH Payments under Various Reduction Scenarios by Hospital Type (millions) .............................................................................................................. 65
TABLE B-4. Number of Uninsured and Uninsured Rate by State, 2013–2014 ............................................ 66
TABLE B-5. State Levels of Uncompensated Care, 2013 ............................................................................. 68
TABLE B-6. Deemed DSH Hospitals that Provide at Least One Essential Community Service, 2011 ....... 70
TABLE B-7. Other Characteristics of Deemed DSH Hospitals, 2011 ........................................................... 72
TABLE C-1. Essential Community Services by Data Source ........................................................................ 79
TABLE C-2. Data Sources for Factors Used in the DSH Allotment Reduction Model ................................. 80

February 2016xiv
Executive Summary: The Evolving Role of Medicaid Disproportionate Share Hospital Payments Medicaid disproportionate share hospital (DSH) payments are statutorily required Medicaid payments that states make to hospitals that serve a high proportion of Medicaid and other low-income patients (sometimes referred to as safety-net hospitals). DSH payments supplement regular Medicaid payments for hospital services and are intended to improve the financial stability of safety-net hospitals by offsetting uncompensated care costs for Medicaid and uninsured patients. In 2014, Medicaid made $18 billion in Medicaid DSH payments ($8 billion in state funds and $10 billion in federal funds).
DSH payments are limited by annual federal DSH allotments to each state. These allotments vary widely and are based on states’ historical DSH spending prior to the establishment of federal limits in 1993. In anticipation of decreased uncompensated care costs due to the coverage expansions under the Patient Protection and Affordable Care Act (ACA, P.L. 111-148, as amended), the ACA established a series of Medicaid DSH allotment reductions that were initially scheduled to begin in fiscal year (FY) 2014. These reductions have been delayed multiple times and are currently scheduled to begin in FY 2018.
The ACA is reducing the number of uninsured people across the country, but the effects of the ACA on hospital uncompensated care are not fully known. Early reports suggest that unpaid costs of care for the uninsured are declining, particularly in states that have expanded Medicaid, but the shortfall (if any) between Medicaid payments and the costs of providing services to Medicaid patients may be increasing with greater Medicaid enrollment. In addition, it is not yet clear whether
all hospitals, including those serving the highest share of low-income patients, are experiencing these changes equally.
In the Protecting Access to Medicare Act of 2014 (P.L. 113-93), Congress directed the Medicaid and CHIP Payment and Access Commission (MACPAC) to report annually on DSH payments and projected DSH allotments, and to provide state-specific analyses of the following data elements:
• changes in the number of uninsured individuals;
• the amount and sources of hospitals’ uncompensated care costs; and,
• the number of hospitals with high levels of uncompensated care that also provide access to essential community services for low-income, uninsured, and vulnerable populations.
In this first MACPAC DSH report, the Commission finds that there is little meaningful relationship between state DSH allotments and any of the factors that Congress required us to consider, even under a reduction scenario. Further, while the majority of DSH payments are made to deemed DSH hospitals, which are statutorily required to receive DSH payments based on their high rates of Medicaid or low-income utilization, more than one-third of DSH payments are made to hospitals that do not meet this standard. In the Commission’s view, DSH allotments and payments should be better targeted toward the states and hospitals that serve a disproportionate share of Medicaid and low-income patients and that have disproportionate levels of uncompensated care.
The Commission intends to analyze federal policy approaches that can improve the targeting of Medicaid DSH payments, but the analysis of current policy and the development of more targeted policies in the future requires greater transparency in hospital payment. Complete and reliable data about all Medicaid payments
Executive Summary

Report to Congress on Medicaid Disproportionate Share Hospital Payments xv
Executive Summary
to hospitals and the sources of the non-federal share of such payments are important for accurate analyses of the extent to which DSH payments are being targeted now as well as the potential effects of policies to improve targeting. In particular, payment data are needed to calculate Medicaid shortfall, one of the components of uncompensated care that Medicaid DSH covers. The Commission’s analysis in this report suggests that Medicaid payments do not necessarily result in a shortfall for all institutions in all states, pointing to the need for better data that can be used to design DSH policy in the future.
The Commission recommends that the Secretary of the U.S. Department of Health and Human Services collect and report hospital-specific data on all types of Medicaid payments for all hospitals that receive them. In addition, the Secretary should collect and report data on the sources of non-federal share necessary to determine net Medicaid payment at the provider level. This recommendation is consistent with MACPAC’s previous recommendation that provider-level data be collected for non-DSH supplemental payments. DSH policy cannot be improved by considering DSH payments in isolation. Rather, a full accounting of all Medicaid payments that individual hospitals receive will be needed to ensure that states are paying these institutions consistent with statutory principles of economy, efficiency, quality, and access.
The chapters that follow present the Commission’s analysis of available data on the past, present, and future role of DSH payments, including the relationship of state allotments to the three factors specified in statute. Since this report is an annual requirement for MACPAC, this first report provides context and discusses the historic role of Medicaid DSH payments in Chapter 1. Chapter 2 compares current and future DSH allotments to the factors identified by Congress and examines early reports of the effect of the ACA on DSH hospitals. Chapter 3 presents the Commission’s assessment of the limitations of current data sources that affect our
ability to analyze how best to improve targeting of DSH payments and the rationale for our recommendation.
Three appendices provide additional information on the legislative history of DSH; state-level data tables on uninsured rates, uncompensated care, and DSH allotments; and a description of our methodology and data limitations.

CHAPTER 1
Overview of Medicaid Policy on Disproportionate Share Hospital Payments

February 20162
Chapter 1: Overview of Medicaid Policy on Disproportionate Share Hospital Payments
Overview of Medicaid Policy on Disproportionate Share Hospital Payments
Key Points• State Medicaid programs are statutorily required to make disproportionate share hospital
(DSH) payments to hospitals that serve a high proportion of Medicaid and other low-income patients.
• States began making DSH payments in 1981, when Medicaid payments to hospitals were de-linked from Medicare payments. Congress first established federal limits on DSH spending in 1991, following a period of rapid growth in DSH spending.
• Under current law, DSH payments to individual hospitals cannot exceed each hospital’s uncompensated care, which includes the shortfall (if any) between Medicaid payments and the cost of providing services to Medicaid patients as well as the unpaid costs of care for the uninsured.
• State DSH spending is also limited by federal allotments, which vary by state, ranging from less than $10 million to more than $1 billion. The current variation in state DSH allotments stems from the variation that existed in state DSH spending in 1992.
• In 2014, Medicaid made a total of $18 billion ($8 billion in state funds and $10 billion in federal funds) in DSH payments to hospitals.
• About half of all U.S. hospitals receive DSH payments. Some states make DSH payments to almost all of the hospitals in the state, and other states make DSH payments to only one or two hospitals.
• In 2011, about one-third of DSH hospitals qualified as deemed DSH hospitals, meaning that they were required to receive DSH payments because they served a particularly high share of low-income patients. These deemed DSH hospitals received about two-thirds of all DSH payments nationally, but reported negative operating margins even after DSH payments.
• Under the Patient Protection and Affordable Care Act (ACA, P.L. 111-148, as amended), Congress established a schedule for reducing federal DSH allotments to account for an anticipated decrease in uncompensated care as a result of an increase in the number of people with insurance. Originally set to go into effect beginning in fiscal year (FY) 2014, the reductions are now scheduled to begin in FY 2018 at $2 billion and increase to $8 billion by FY 2025.
Report to Congress on Medicaid Disproportionate Share Hospital Payments 3
Chapter 1: Overview of Medicaid Policy on Disproportionate Share Hospital Payments
CHAPTER 1: Overview of Medicaid Policy on Disproportionate Share Hospital Payments State Medicaid programs are statutorily required to make disproportionate share hospital (DSH) payments to hospitals that serve a high proportion of Medicaid and other low-income patients. State DSH payments are limited by annual federal DSH allotments, which vary widely by state. DSH payments to hospitals are also limited by the total amount of uncompensated care that hospitals provide to Medicaid patients and the uninsured. The Patient Protection and Affordable Care Act (ACA, P.L. 111-148, as amended) includes reductions to federal DSH allotments under the assumption that increased health care coverage would lead to reductions in hospital uncompensated care. With the onset of these reductions currently scheduled for fiscal year (FY) 2018, Congress has instructed the Commission to report annually on Medicaid DSH policy issues.
We begin this report with a description of the history of and context for Medicaid DSH payments. First we outline the evolution of DSH payment policy, including the enactment of state- and hospital-specific limits. Then we discuss variation in DSH allotments and spending among states and describe the types of hospitals that receive DSH payments. We end with an overview of the reductions in DSH allotments enacted under the ACA.
The History of Medicaid DSH Payment PolicyStates began making Medicaid DSH payments in 1981, when Medicaid hospital payments were de-linked from Medicare payment levels. Beginning with Medicaid’s enactment in 1965, states were required to mirror Medicare’s hospital payment policies in order to pay hospitals’ reasonable costs for Medicaid services. In 1981, states were given broader discretion over hospital payment when Congress amended the Social Security Act (the Act) to remove the requirement to pay hospitals according to Medicare cost principles. Because of concerns that state flexibility to reduce hospital payments might threaten hospitals serving large numbers of Medicaid and uninsured patients, Congress also directed state Medicaid agencies to “take into account the situation of hospitals which serve a disproportionate number of low-income patients with special needs” (§ 1902(a)(13)(A)(iv) of the Act).
States were initially slow to make DSH payments. As a result, Congress clarified in the Omnibus Budget Reconciliation Act of 1986 (P.L. 99-509) that Medicaid’s hospital payment limitations did not apply to DSH payments. Then, in 1987, Congress required states to make DSH payments to certain hospitals that serve the highest share of low-income patients, which were referred to as deemed DSH hospitals (§ 1923(b) of the Act).
Prior to these congressional actions, a 1985 federal regulation permitted states to use both public and private donations as sources of non-federal Medicaid financing. In 1987, policy guidance from the federal government indicated that taxes that were imposed only on Medicaid providers could also be used to finance Medicaid (Matherlee 2002). The combination of the lack of limits on DSH payments and the flexibility in raising the non-federal share of payments was soon followed by substantial growth in DSH spending. The total amount of DSH payments increased from $1.3 billion in 1990 to $17.7 billion in 1992 (Holahan et al. 1998).

February 20164
Chapter 1: Overview of Medicaid Policy on Disproportionate Share Hospital Payments
As DSH spending increased, federal policymakers grew concerned over both the level of DSH spending and the possibility that some states were misusing DSH funds by making large DSH payments to hospitals operated by state or local governments that were then transferred back to the state and used for other purposes. Congress acted to address these concerns: In 1991, it enacted national and state-specific caps on the amount of federal funds that could be used to make DSH
payments, and in 1993 it created hospital-specific DSH payment limits equal to the actual cost of uncompensated care for hospital services provided to Medicaid and uninsured patients.
State allotmentsThe caps on the federal DSH funds that are available to each state are referred to as allotments, and the amount of each state’s allotment is calculated
BOX 1-1. Glossary of Key Medicaid Disproportionate Share Hospital (DSH) Terminology
• State DSH allotment—The total amount of federal funds available to a state for Medicaid DSH payments. If a state does not spend the full amount of its allotment in a given year, the unspent portion is not paid to the state and does not carry over to future years. Allotments are determined annually and are generally equal to the lower of the prior year’s allotment adjusted for inflation or 12 percent of the state’s total Medicaid benefit spending (§ 1923(f) of the Social Security Act (the Act)).
• Low-DSH state—A state with fiscal year (FY) 2000 DSH expenditures that were less than 3 percent of total state Medicaid medical assistance expenditures for FY 2000, including a special exception to include Hawaii (§ 1923(f)(5) and § 1923(f)(6) of the Act).
• DSH hospital—A hospital that receives DSH payments and meets the minimum statutory requirements to be eligible for DSH payments: a Medicaid inpatient utilization rate of at least 1 percent and at least two obstetricians with staff privileges that treat Medicaid enrollees (with certain exceptions).
• Deemed DSH hospital—A DSH hospital with a Medicaid inpatient utilization rate of at least one standard deviation above the mean for hospitals in the state that receive Medicaid payments, or a low-income utilization rate that exceeds 25 percent. Deemed DSH hospitals are required to receive Medicaid DSH payments (§ 1923(b) of the Act).
• Medicaid DSH audit—A statutorily required audit of a hospital’s uncompensated care costs to ensure that Medicaid DSH payments do not exceed the hospital-specific DSH limit.
• Hospital-specific DSH limit—The total amount of uncompensated care for which a hospital may receive Medicaid DSH payment, equal to the sum of Medicaid shortfall and unpaid costs of care for the uninsured for allowable inpatient and outpatient costs.
• Medicaid shortfall—The difference between a hospital’s costs of serving Medicaid patients and the total amount of Medicaid payment received for those services (under both fee for service and managed care, excluding DSH payments).
• Unpaid costs of care for the uninsured—The difference between a hospital’s costs to serve individuals without health coverage and the total amount of payment received for those services.

Report to Congress on Medicaid Disproportionate Share Hospital Payments 5
Chapter 1: Overview of Medicaid Policy on Disproportionate Share Hospital Payments
according to statutory requirements and published annually in the Federal Register. Allotments were initially established for FY 1993 and were generally based on each state’s 1992 DSH spending (P.L. 102-234).
Congress has acted on several occasions to make incremental adjustments to state DSH allotments, but the 1992 DSH spending amounts still serve as the basis for most state allotments today, meaning the states that spent the most in 1992 now have the largest allotments and the states that spent the least in 1992 now have the smallest allotments.
At first, the original legislation implementing caps on federal DSH funds allowed the allotments for the lowest spending states to grow annually while holding allotments for the highest spending states unchanged. The Balanced Budget Act of 1997 (P.L. 105-33) temporarily replaced the calculated allotments with fixed allotments, specified in statute, which reduced total DSH allotments by about half. The fixed allotments were in place from FY 1998 through FY 2000. Following this period of fixed allotments, state allotments were again calculated based on the prior year’s allotment, starting from the FY 2000 allotment as the baseline.1 Beginning in 2000, recognizing that some states still had much lower DSH allotments than others, Congress enacted special rules allowing the allotments for so-called low-DSH states to grow more quickly through FY 2008.
Congress has also provided several temporary increases in state DSH allotments in response to state fiscal pressures, most recently in 2009 during the recession. Since then, the only other changes in state DSH allotments have been adjustments for inflation.2 (See Appendix A for a timeline of key legislation affecting Medicaid DSH payment policy.)
Hospital-specific limitsIn 1993, shortly after establishing the state DSH allotments, Congress also established hospital-specific limits for DSH payments (P.L. 103-166).
These limits were based on a hospital’s overall uncompensated care for low-income patients, defined as the sum of Medicaid shortfall and unpaid costs of care for the uninsured for DSH-allowable services.3 Specifically, states cannot pay a hospital more than the hospital’s cost of inpatient and outpatient services to Medicaid and uninsured patients minus payments received by or on behalf of Medicaid (including supplemental payments) and from uninsured individuals.4 Costs associated with physician services and hospital-based clinics do not count toward the hospital-specific limit.5
DSH reporting and audits In 2003, Congress added statutory requirements for states to submit annual reports and, separately, to submit for each hospital an annual independent certified audit of DSH payments (P.L. 108-173). The annual reports for each DSH hospital must include the following: the hospital-specific DSH limit, the Medicaid inpatient utilization rate, the low-income utilization rate, the state-defined DSH qualification criteria, and all Medicaid payments (including fee-for-service, managed care, and non-DSH supplemental payments) (§ 1923(j) of the Act and 42 CFR 447.299). The annual independent audits must certify that each DSH hospital qualifies for payment, that DSH payments do not exceed allowable uncompensated care costs, and that the hospital accurately reported payments, spending, and utilization.
The Centers for Medicare & Medicaid Services (CMS) finalized DSH audit regulations in 2008, and the first set of DSH audit reports were submitted in 2010 for state plan rate years (SPRYs) 2005–2007.6 SPRYs 2005–2010 were designated transition years to allow CMS, states, hospitals, and auditors time to develop and refine their procedures without financial penalties. Beginning with the reports for SPRY 2011, which were due to CMS by December 31, 2014, DSH payments that exceed hospital-specific limits will be considered overpayments and states will be required either to return the federal share or, if specified in the state plan, to redistribute it to other hospitals that are below their limits (CMS 2008). CMS regulations permit states to
February 20166
Chapter 1: Overview of Medicaid Policy on Disproportionate Share Hospital Payments
submit DSH audits approximately three years after a state plan rate year ends so that all claims can be included and audits can be completed. CMS posts DSH audit data on its website after its review, typically about five years after a state plan rate year ends.
State distribution of DSH paymentsAs mentioned previously, federal statute specifies that hospitals must receive DSH payments if they meet the minimum requirements for DSH hospitals and also meet one of the following criteria for deemed DSH hospitals:7
• they have a Medicaid inpatient utilization rate of at least one standard deviation above the mean for hospitals in the state that receive Medicaid payments; or
• they have a low-income utilization rate in excess of 25 percent.
However, states may also make DSH payments to other hospitals as long as they have a Medicaid inpatient utilization rate of at least 1 percent and, with certain exceptions, at least two obstetricians with staff privileges that treat Medicaid enrollees.
This flexibility results in a wide variety of hospitals being designated as DSH hospitals.
State DSH payment methodologies are specified within their Medicaid state plans, which are reviewed and approved by CMS. Federal statute requires that payments to DSH hospitals must be determined using one of the following methodologies:
• the Medicare DSH adjustment methodology;
• a methodology that increases DSH payments in proportion to the extent that a hospital’s Medicaid inpatient utilization exceeds one standard deviation above the mean; or,
• a methodology that varies by hospital type (such as teaching hospitals, children’s hospitals, etc.) and that applies equally to all hospitals of each type and is reasonably related to Medicaid and low-income utilization.
DSH payments are subject to hospital-specific limits based on a hospital’s overall uncompensated care costs for low-income patients. Federal statute also limits the amount of DSH payments that each state can make to institutions for mental diseases or other mental health facilities (Box 1-2).
BOX 1-2. Disproportionate Share Hospital (DSH) Payments to Institutions for Mental Diseases
States may make DSH payments to institutions for mental diseases (IMDs), which are defined by the Social Security Act (the Act) as hospitals, nursing facilities, or other institutions of more than 16 beds that primarily serve individuals with mental diseases (§ 1905(i) of the Act). Because IMDs cannot receive Medicaid payment for individuals age 21–64 (§ 1905(a)(B) of the Act), IMD services provided to Medicaid enrollees in this age range are classified as unpaid costs of care for the uninsured, a type of uncompensated care that is eligible for DSH funding.
The amount of a state’s federal DSH funds available for IMDs is limited. Each state’s IMD limit is the lesser amount of either the DSH allotment the state paid to IMDs and other mental health facilities in fiscal year (FY) 1995 or 33 percent of the state’s FY 1995 DSH allotment.
In 2011, IMDs accounted for 6 percent of DSH hospitals but received 18 percent of DSH payments ($3 billion). Delaware and Maine made DSH payments exclusively to IMDs in 2011, and six states made more than half of their DSH payments to IMDs.

Report to Congress on Medicaid Disproportionate Share Hospital Payments 7
Chapter 1: Overview of Medicaid Policy on Disproportionate Share Hospital Payments
However, states have broad flexibility within these requirements in determining the amount of DSH payments that are made to each provider. There is no minimum DSH payment that must be made to DSH hospitals (including deemed DSH hospitals).
Current State DSH Allotments and Spending
State DSH allotmentsA total of $11.7 billion in federal funds ($20.7 billion in state and federal funds combined) was allotted to states for DSH payments in FY 2014 (CMS 2014). Large disparities in allotments persist today despite past legislation intended to reduce them. State allotments in FY 2014 ranged from about $10 million or less in four states (Wyoming, Delaware, North Dakota, and Hawaii) to over $1 billion in three states (California, New York, and Texas) (CMS 2014). In 2014, 17 states were classified as low-DSH states and had average DSH allotments of $30 million, while the remaining 34 states had average DSH allotments of $337 million. (State allotments are given in Table B-1 in Appendix B.)
DSH spending by stateIn FY 2014, states spent a total of $10.2 billion in federal funds on DSH payments ($18.1 billion in state and federal funds combined). The amount of DSH expenditures and the percentage of Medicaid spending that DSH payments account for vary widely among states. DSH spending as a percentage of Medicaid service spending ranged from less than 1 percent to 16 percent (Figure 1-1). Ten states account for more than two-thirds of total DSH spending. Seven of these ten (California, Texas, Michigan, New Jersey, New York, Ohio, and Pennsylvania) are also among the top ten in total Medicaid service spending. The other three (Missouri, Louisiana, and South Carolina), rank 19th, 23rd, and 27th respectively in Medicaid service spending. Nationally, DSH spending
accounted for 3.9 percent of total Medicaid service spending in FY 2014.
Historically, some states do not spend their full DSH allotments. As of November 2015, $1.2 billion in federal DSH allotments for FY 2012 were unspent ($2.1 billion in state and federal funds combined). Four states accounted for half of unspent DSH allotments in FY 2012.8 Because states must provide state matching funds to draw down DSH payments at the same matching rate as other Medicaid service expenditures, some states may choose to apply their state funding to other types of Medicaid payments. Although other Medicaid payments are not limited by federal allotments, regular Medicaid hospital payments are subject to different rules that may limit the ability of states to make the same amount of Medicaid payments to hospitals without using DSH funding.9
DSH spending by hospital typeAbout half of all U.S. hospitals received DSH payments in 2011. The majority of DSH payments were made to short-term acute care hospitals and public hospitals (Table 1-1). However, all hospital types received at least some DSH payments in 2011.
The share of hospitals that receive DSH payments varies widely from state to state (Figure 1-2). For example, in 2011, 10 states provided DSH payments to less than 20 percent of hospitals, while 11 states provided DSH payments to more than 80 percent of hospitals in their state. In general, states with larger DSH allotments make DSH payments to a greater proportion of hospitals, but there are exceptions. In 2011, the 17 low-DSH states made DSH payments to an average of 32 percent of the hospitals in their respective states, but Minnesota, Montana, and Utah made DSH payments to more than 60 percent of their hospitals. Those states not classified as low-DSH states (33 states and the District of Columbia) made DSH payments to an average of 49 percent of the hospitals in their respective states, but California, Maine, and

February 20168
Chapter 1: Overview of Medicaid Policy on Disproportionate Share Hospital Payments
Massachusetts made DSH payments to fewer than 20 percent of their hospitals.
In 2011, about 40 percent of DSH spending went to hospitals that were in the highest decile of Medicaid or low-income utilization (Figure 1-3). During the same period, about 17 percent of DSH payments went to hospitals with Medicaid inpatient utilization that was at or below the 50th percentile, and about 27 percent of DSH payments went to hospitals with low-income utilization rates at or below the 50th percentile.
Medicaid DSH Payments in Relation to Other Sources of Hospital FinancingIn addition to Medicaid DSH payments, many hospitals receive other types of federal funding that offset operating costs (Table 1-2). Because we lack hospital-specific data, we were not able to measure the extent to which Medicaid DSH hospitals receive these other sources of funding.
FIGURE 1-1. State DSH Spending as a Share of Total Medicaid Medical Assistance Expenditures, FY 2014
16%
1.5%
1.5%
1.7%
0.7%
2.8%
2.9%
0.0%23.4%
NH: 8.3%
MA: 0.0%
VT: 2.5%
4.1%
2.4%
CT: 2.2%NJ: 9.7%
DE: 0.8%MD: 1.1%
RI: 5.7%
0.0%
1.6%
9.3%
4.6%
4.9%
1.7%
9.2%4.6%
0.1%1.1%
2.3%
0.2%
1.7%
8.3%
0.9%
DC: 2.3%
1.6%
3.6%
0.4%0.2%
3.3%
0.5%
3.4%
3.9%
4.2%
3.5%
6.5%
2.7%
2.2%
0.1%
2.8%
0.8%
Less than 1% 1%–1.9% Greater than 8% 4%–7.9%2%–3.9%
Notes: DSH is disproportionate share hospital. FY is fiscal year. FMR is Financial Management Report.1 Massachusetts does not make DSH payments because its Section 1115 demonstration allows the state to use DSH funding for the state’s safety-net care pool instead. 2 Tennessee did not have a DSH allotment for FY 2014 but has a DSH allotment for subsequent fiscal years.
Source: MACPAC 2015 analysis of CMS-64 FMR net expenditure data as of February 25, 2015.

Report to Congress on Medicaid Disproportionate Share Hospital Payments 9
Chapter 1: Overview of Medicaid Policy on Disproportionate Share Hospital Payments
Relationship of Medicaid DSH payments to other Medicaid paymentsWithin the Medicaid program, states can make non-DSH supplemental payments to hospitals, and do so primarily through the upper payment limit (UPL) rules for fee-for-service Medicaid.10 In 2013, total spending (state and federal funds combined) on hospital non-DSH supplemental payments totaled $20.6 billion (MACPAC 2014). In 2011, more than two-thirds of DSH hospitals received other Medicaid supplemental payments; we do not know how many non-DSH hospitals receive these payments because states do not report that information.
Under current Medicaid payment rules, states can increase Medicaid payment to hospitals through fee-for-service rate increases, either applying increases for all providers or by establishing different rates for a targeted subset of providers,
such as DSH hospitals. States also have options to increase payment rates through managed care by requiring managed care plans to pay according to minimum fee schedules, flexibility that CMS has proposed to codify in its proposed managed care rule (CMS 2015b).
A key difference between DSH payments and Medicaid payments for services is that DSH payments are intended to offset hospitals’ uncompensated care costs, including its costs for serving individuals without insurance. DSH payments are not subject to the UPL rules that apply to fee-for-service Medicaid payments and can be made outside of managed care arrangements. Compared to regular Medicaid payments for services, which are based on Medicaid utilization, DSH payments can be targeted based on uncompensated care costs, which include care for the uninsured.
TABLE 1-1. Distribution of DSH Spending by Hospital Type, SPRY 2011
Hospital characteristics
Number of hospitals
Total DSH spending (millions)DSH hospitals All hospitals
DSH hospitals as percent of all hospitals
Hospital type
Short-term acute care hospitals 1,891 3,426 55% $ 13,143.0
Critical access hospitals 558 1,321 42 291.9
Psychiatric hospitals 174 494 35 2,848.2
Long-term hospitals 34 443 8 62.0
Rehabilitation hospitals 35 228 15 10.6
Children's hospitals 51 88 58 291.9
Hospital ownership
For-profit 447 1,683 27 682.7
Non-profit 1,521 2,973 51 5,253.8
Public 775 1,344 58 10,711.1
Total 2,743 6,000 46% $ 16,647.6
Notes: DSH is disproportionate share hospital. SPRY is state plan rate year. Total DSH spending includes state and federal funds. Excludes 90 DSH hospitals that did not submit 2011 Medicare cost reports.
Source: MACPAC 2015 analysis of 2011 Medicare cost reports and 2011 as-filed Medicaid DSH audits.

February 201610
Chapter 1: Overview of Medicaid Policy on Disproportionate Share Hospital Payments
Relationship of Medicaid DSH payments to Medicare DSH paymentsMany Medicaid DSH hospitals also receive Medicare DSH payments, which totaled approximately $12.1 billion in 2013 (CMS 2015a). Unlike Medicaid DSH payments, which vary by state, Medicare DSH payments are based on a standard national formula. Historically, Medicare DSH payments were based solely on a hospital’s Medicaid and Supplemental Security Income (SSI) patient utilization, but beginning in 2014, the ACA required that most Medicare DSH payments be
based on a hospital’s uncompensated care relative to other Medicare DSH hospitals. In addition, the ACA linked the total amount of funding for Medicare DSH payments to the uninsured rate. As a result, Medicare DSH payments are projected to decrease to $9.8 billion in 2016 (CMS 2015a).
Medicare also makes other types of payment adjustments to hospitals; although these adjustments are not directly related to uncompensated care, they still affect a hospital’s overall financial viability. For example, in 2013, Medicare made $5.8 billion in indirect medical
FIGURE 1-2. Share of Hospitals Receiving DSH Payments by State, SPRY 2011
41%
45%
74%
84%
7%
35%
10%
55%39%
NH: 90%
MA: 0%1
VT: 87%
88%
28%
CT: 81%NJ: 81%
DE: 8%MD: 34%
RI: 93%
46%
19%
78%
79%
31%
29%
75%44%
40%4%
30%
28%
2%
74%
42%
DC: 62%
40%
64%
66%39%
77%
13%
40%
10%
70%
82%
88%
90%
87%
29%
23%
2%
Less than 20% 20%–39% Greater than 80% 60%–79%40%–59%
Notes: DSH is disproportionate share hospital. SPRY is state plan rate year.1 Massachusetts does not make DSH payments because its Section 1115 demonstration allows the state to use DSH funding for the state’s safety-net care pool instead.
Source: MACPAC 2015 analysis of 2011 Medicare cost reports and 2011 as-filed Medicaid DSH audits.

Report to Congress on Medicaid Disproportionate Share Hospital Payments 11
Chapter 1: Overview of Medicaid Policy on Disproportionate Share Hospital Payments
FIGURE 1-3. Distribution of DSH Spending on Hospitals by Decile of Medicaid and Low-Income Utilization, 2011
0%
5%
10%
15%
20%
25%
30%
35%
40%
45%
Lowestdecile
2nd
DSH spending, by Medicaid inpatient utilization decile
DSH spending, by low-income utilization decile
1% 2% 2%5%
3rd
4% 5%
4th
5%7%
5th
5%8%
6th
8% 7%
7th
9%6%
8th
9%10%
9th
16%
10%
Highestdecile
41%40%
Notes: DSH is disproportionate share hospital. Excludes psychiatric hospitals. Medicaid inpatient utilization rates in this analysis exclude services provided to dually eligible and other Medicaid enrollees for which Medicaid was not the primary payer, which are part of the definition of Medicaid inpatient utilization used for Medicaid DSH purposes. Low-income utilization includes services provided to Medicaid and uninsured patients (as measured by charity care charges).
Source: MACPAC 2015 analysis of 2011 Medicare cost reports and 2011 as-filed Medicaid DSH audits.
TABLE 1-2. Selected Supplemental Funding and Other Support for Hospitals, 2013 (billions)
Type of supportFederal
spendingState
spendingOther
support
Proportion of U.S. hospitals receiving funding (estimate)
MedicaidMedicaid DSH payments $ 9.3 $ 7.1 – 48%Non-DSH supplemental payments1 12.0 8.6 – –2
MedicareMedicare DSH payments3 12.1 – – 44Other supportNon-profit tax exemptions4 (federal, state, and local) – – 24.6 49
Total $ 33.4 $ 15.7 $ 24.6 –
Notes: DSH is disproportionate share hospital. 1 Medicaid non-DSH supplemental payments include upper payment limit payments, Section 1115 waiver supplemental payments, and graduate medical education payments.2 In 2010, two-thirds of DSH hospitals received a total of $9.4 billion in non-DSH supplemental payments. Data are not available for 2013.3 Beginning in 2014, Medicare DSH payments were reduced based on the expectation of a decline in the uninsured rate. In 2016, Medicare DSH payments are expected to total $9.8 billion.4 Data on non-profit tax exemptions are from 2011.
– Dash means data not available or not applicable.
Sources: MACPAC 2014, CMS 2015a, Rosenbaum et al. 2015.
February 201612
Chapter 1: Overview of Medicaid Policy on Disproportionate Share Hospital Payments
education payments to offset the higher costs of care of teaching hospitals. In addition, critical access hospitals, which are not eligible for Medicare DSH payments, receive higher base Medicare payment rates to offset their operating costs (MedPAC 2015).11 Medicare also includes adjustments related to hospital uncompensated care in its pricing for Medicare Advantage plans, and there is some evidence to suggest that Medicare Advantage plans may pass these higher rates on to hospitals (Berenson et al. 2015).
Other types of support for hospitalsIn addition to direct supplemental payments, some hospitals also receive other types of support, such as special payment rates or tax breaks. In 2013, eligible entities that qualified for the 340b
drug discount program (entities which include but are not limited to non-profit and government hospitals that serve a high proportion of Medicaid and low-income Medicare patients) received an estimated $3.8 billion in discounts from drug manufacturers (MedPAC 2015). In 2011, non-profit hospitals received indirect tax benefits estimated at $24.6 billion (Rosenbaum et al. 2015). Non-profit hospitals are required to report community benefit spending to the Internal Revenue Service in order to maintain their non-profit status, but there is no required level of community benefit spending. Government-owned public hospitals are also exempt from many federal, state, and local taxes, but we do not have data on the amount of indirect tax benefits that they receive.
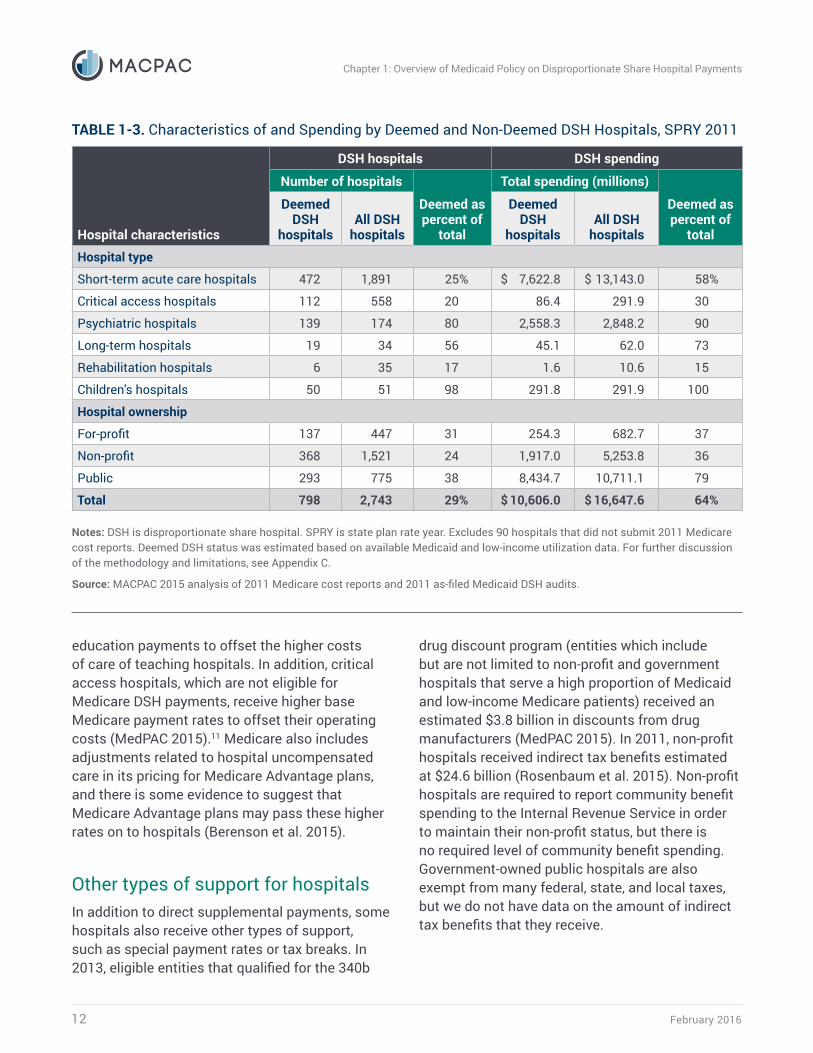
TABLE 1-3. Characteristics of and Spending by Deemed and Non-Deemed DSH Hospitals, SPRY 2011
Hospital characteristics
DSH hospitals DSH spending
Number of hospitals
Deemed as percent of
total
Total spending (millions)
Deemed as percent of
total
Deemed DSH
hospitalsAll DSH
hospitals
Deemed DSH
hospitalsAll DSH
hospitalsHospital type
Short-term acute care hospitals 472 1,891 25% $ 7,622.8 $ 13,143.0 58%
Critical access hospitals 112 558 20 86.4 291.9 30
Psychiatric hospitals 139 174 80 2,558.3 2,848.2 90
Long-term hospitals 19 34 56 45.1 62.0 73
Rehabilitation hospitals 6 35 17 1.6 10.6 15
Children's hospitals 50 51 98 291.8 291.9 100
Hospital ownership
For-profit 137 447 31 254.3 682.7 37
Non-profit 368 1,521 24 1,917.0 5,253.8 36
Public 293 775 38 8,434.7 10,711.1 79
Total 798 2,743 29% $ 10,606.0 $ 16,647.6 64%
Notes: DSH is disproportionate share hospital. SPRY is state plan rate year. Excludes 90 hospitals that did not submit 2011 Medicare cost reports. Deemed DSH status was estimated based on available Medicaid and low-income utilization data. For further discussion of the methodology and limitations, see Appendix C.
Source: MACPAC 2015 analysis of 2011 Medicare cost reports and 2011 as-filed Medicaid DSH audits.

Report to Congress on Medicaid Disproportionate Share Hospital Payments 13
Chapter 1: Overview of Medicaid Policy on Disproportionate Share Hospital Payments
Deemed DSH Hospital CharacteristicsIn 2011, about 29 percent of DSH hospitals were deemed DSH hospitals, meaning that they were statutorily required to receive DSH payments. The amount of DSH funding that deemed DSH hospitals receive is not specified in statute, but deemed DSH hospitals received the majority of DSH payments in 2011 (Table 1-3). Based on our analysis, deemed DSH hospitals accounted for nearly one-third of DSH hospitals, and most of the psychiatric, long-term, and children’s hospitals that received DSH payments in 2011 qualified as deemed DSH hospitals. Although non-deemed DSH hospitals meet the minimum statutory requirements to qualify for receiving DSH payments, they are not statutorily required to receive them. In 2011, 36 percent of DSH payments were made to non-deemed DSH hospitals.
Deemed DSH hospitals are particularly reliant on DSH payments (Table 1-4). Although non-deemed DSH hospitals report positive operating margins after DSH payments, deemed DSH hospitals report aggregate negative operating margins of 5.3 percent after DSH payments. According to our analysis, DSH payments accounted for about 2 percent of total revenue for all DSH hospitals and 6 percent of total revenue for deemed DSH hospitals in 2011.
In addition to serving high volumes of low-income patients, deemed DSH hospitals are also more likely than other categories of hospitals to provide a wide array of services to patients of all income levels (Table 1-5). We examined a subset of community services identifiable through Medicare cost reports and the American Hospital Association annual survey. This list of services is part of a working definition that we developed to identify hospitals with high levels of uncompensated care that also provide essential community services, as required by statute. (For more information about the Commission’s analyses of these hospitals, see Chapter 2).
TABLE 1-4. Aggregate Operating Margins Before and After DSH Payments, 2011
Before DSH
paymentsAfter DSH payments
Deemed DSH hospitals -11.7% -5.3%
DSH hospitals, not deemed -0.4 1.4
Non-DSH hospitals 2.5 2.5
Total (aggregate) -1.1% 0.7%
Notes: DSH is disproportionate share hospital. Operating margins do not include non-DSH state or local subsidies to hospitals, which accounted for 0.7 percent of total revenue to all hospitals in 2011. Analysis excludes outlier values and hospitals with missing data. Deemed DSH status was estimated based on available Medicaid and low-income utilization data. For more information about the methodology, see Appendix C.
Source: MACPAC 2015 analysis of 2011 Medicare cost reports and 2011 as-filed Medicaid DSH audits.
TABLE 1-5. Share of Hospitals Providing Selected Services, 2013
Service type
Deemed DSH
hospitalsAll
hospitalsBurn services 2.9% 0.8%
Dental services 32.7 19.9
Graduate medical education 30.1 17.3
HIV/AIDS care 35.2 22.6
Inpatient psychiatric services (through a psychiatric subunit or stand-alone psychiatric hospital)
15.9 12.4
Neonatal intensive care units 35.0 21.3
Obstetrics and gynecology services 61.4 54.0
Substance use disorder services 18.5 13.7
Trauma services 49.0 37.1
Notes: DSH is disproportionate share hospital. Analysis excludes hospitals with missing data. Deemed DSH status was estimated based on available Medicaid and low-income utilization data. For more information about the methodology, see Appendix C.
Source: MACPAC 2015 analysis of 2013 and 2011 Medicare cost reports, 2011 as-filed Medicaid DSH audits, and the 2013 American Hospital Association annual survey.
February 201614
Chapter 1: Overview of Medicaid Policy on Disproportionate Share Hospital Payments
Medicaid DSH Allotment Reductions Under the ACA, Congress established a schedule for reducing federal DSH allotments to account for an anticipated decrease in uncompensated care expected to occur as a result of the increased number of people with insurance due to Medicaid expansions and the availability of subsidized exchanged coverage. These reductions have since been delayed five times. Originally set to take effect beginning in FY 2014, the reductions are now scheduled to begin in FY 2018 in the following annual amounts:
• $2.0 billion in FY 2018;
• $3.0 billion in FY 2019;
• $4.0 billion in FY 2020;
• $5.0 billion in FY 2021;
• $6.0 billion in FY 2022;
• $7.0 billion in FY 2023;
• $8.0 billion in FY 2024; and
• $8.0 billion in FY 2025.
Congress directed CMS to develop a reduction methodology in such a way as to encourage better targeting of DSH payments across states. Specifically, CMS is required to apply greater DSH reductions to states that have historically high DSH payments and lower percentages of uninsured individuals. In addition, the reduction methodology is intended to reward states that target DSH payments towards hospitals with high levels of uncompensated care and hospitals that serve high volumes of Medicaid patients.
Before the implementation of DSH allotment reductions was delayed, CMS developed a reduction methodology for FYs 2014 and 2015, which we describe and model in Chapter 2. CMS has not yet proposed a reduction methodology
for FY 2018, but CMS has noted that it will be evaluating the implications of state decisions to expand Medicaid coverage and will consider options to account for state coverage decisions in its methodology (CMS 2013).

Report to Congress on Medicaid Disproportionate Share Hospital Payments 15
Chapter 1: Overview of Medicaid Policy on Disproportionate Share Hospital Payments
Endnotes1 Fixed allotments were intended to continue through FY 2002, but the Medicare, Medicaid, and SCHIP Benefits Improvement and Protection Act of 2000 (P.L. 106-554) ended them after FY 2000.
2 The methodology described here applies to most states, although there are some exceptions. Hawaii and Tennessee each have specific methodologies outlined in the Medicaid statute. In addition, each state’s federal DSH allotment can be no more than 12 percent of its total Medicaid medical assistance expenditures (state and federal funds combined) during the fiscal year (§ 1923(f)(3)(B) of the Act).
3 Total annual uncompensated care costs are defined in federal regulation as “the total cost of care for furnishing inpatient hospital and outpatient hospital services to Medicaid eligible individuals and to individuals with no source of third party coverage for the hospital services they receive less the sum of regular Medicaid FFS [fee-for-service] rate payments, Medicaid managed care organization payments, supplemental or enhanced Medicaid payments, uninsured revenues, and Section 1011 payments for inpatient and outpatient hospital services” (42 CFR 447.299).
4 For California public hospitals, the limit is 175 percent of uncompensated costs.
5 In a 1994 letter to state Medicaid directors, the Centers for Medicare & Medicaid Services (then the Health Care Financing Administration) instructed states that the cost of “hospital services” includes both inpatient and outpatient hospital costs (HCFA 1994). However, physician services provided by a hospital and hospital-based clinic services are not included in the calculation of the hospital-specific limit (CMS 2008).
6 Medicaid state plan rate year means the 12-month period defined by a state’s approved Medicaid state plan in which the state estimates eligible uncompensated care costs and determines corresponding DSH payments as well as all other Medicaid payment rates. The period usually corresponds to the state’s fiscal year or the federal fiscal year but it does not have to; it can correspond to any 12-month period defined by the state (42 CFR 455.301).
7 Deemed DSH hospitals must meet the minimum requirements for DSH hospitals: a Medicaid inpatient utilization rate of at least 1 percent and (with limited exceptions) at least two obstetricians with staff privileges that treat Medicaid enrollees (§ 1923(d) of the Act).
8 Two of the four states with the largest unspent DSH allotments use their DSH allotments for coverage expansions through a Section 1115 demonstration. In the other two states, DSH allotments appear to exceed the total amount of uncompensated care for low-income patients in the state, which may explain why amounts are not spent.
9 For example, aggregate Medicaid fee-for-service payments to hospitals cannot exceed what Medicare would have paid for these services; this is referred to as the upper payment limit (UPL).
10 Non-DSH supplemental payments also include graduate medical education (GME) payments and supplemental payments authorized through Section 1115 waiver expenditure authority. In FY 2014, 49 percent of non-DSH supplemental payments were made through UPL payments, 44 percent were made through Section 1115 expenditure authority, and 7 percent were made through GME (MACPAC 2015). More background information on Medicaid supplemental payments can be found in Chapter 6 of MACPAC’s March 2014 report to Congress.
11 Specifically, Medicare pays critical access hospitals 101 percent of reasonable costs for most inpatient and outpatient services.
ReferencesBerenson, R., J. Sunshine, D. Helms, and E. Lawton. 2015. Why Medicare Advantage plans pay hospitals traditional Medicare prices. Health Affairs 34, no. 8: 1289–1295. http://content.healthaffairs.org/content/34/8/1289.abstract.
Centers for Medicare & Medicaid Services (CMS), U.S. Department of Health and Human Services. 2015a. Medicare program: Hospital inpatient prospective payment systems for acute care hospitals and the long-term care hospital prospective payment system policy changes and fiscal year 2016 rates; revisions of quality reporting requirements for specific providers, including

February 201616
Chapter 1: Overview of Medicaid Policy on Disproportionate Share Hospital Payments
changes related to the electronic health record incentive program; extensions of the Medicare-dependent, small rural hospital program and the low-volume payment adjustment for hospitals. Final rule. Federal Register 80, no. 158 (August 17): 49325–49886. https://federalregister.gov/a/2015-19049.
Centers for Medicare & Medicaid Services (CMS), U.S. Department of Health and Human Services. 2015b. Medicaid and Children’s Health Insurance Program (CHIP) programs: Medicaid managed care, CHIP delivered in managed care, Medicaid and CHIP comprehensive quality strategies, and revisions related to third party liability. Proposed rule. Federal Register 80, no. 104 (June 1): 31097–31297. https://federalregister.gov/a/2015-12965.
Centers for Medicare & Medicaid Services (CMS), U.S. Department of Health and Human Services. 2014. Medicaid program: Preliminary disproportionate share hospital allotments (DSH) for fiscal year (FY) 2014 and the preliminary institutions for mental diseases disproportionate share hospital limits for FY 2014. Notice. Federal Register 79, no. 40 (February 28): 11436–11445. https://federalregister.gov/a/2014-04032.
Centers for Medicare & Medicaid Services (CMS), U.S. Department of Health and Human Services. 2013. Medicaid program: State disproportionate share hospital allotment reductions. Final rule. Federal Register 78, no. 181 (September 18): 57293–57313. https://federalregister.gov/a/2013-22686.
Centers for Medicare & Medicaid Services (CMS), U.S. Department of Health and Human Services. 2008. Medicaid program: Disproportionate share hospital payments. Final rule. Federal Register 73, no. 245 (December 19): 77904–77952. https://federalregister.gov/a/E8-30000.
Health Care Financing Administration (HCFA), U.S. Department of Health and Human Services. 1994. Letter from Sally K. Richardson to state Medicaid directors regarding “Summary of OBRA 93 DSH limit requirements.” August 17, 1994. http://downloads.cms.gov/cmsgov/archived-downloads/SMDL/downloads/SMD081794.pdf.
Holahan, J., B.K. Bruen, and D. Liska. 1998. The decline in Medicaid spending growth in 1996: Why did it happen? Washington, DC: The Urban Institute. http://webarchive.urban.org/UploadedPDF/410365.pdf.
Matherlee, K. 2002. The federal-state struggle over Medicaid matching funds: An update. Washington, DC: National Health Policy Forum. http://www.nhpf.org/library/background-papers/BP_UPL_5-02.pdf.
Medicaid and CHIP Payment and Access Commission (MACPAC). 2015. MACPAC analysis of CMS-64 FMR net expenditure data as of February 25, 2015, and CMS-64 Schedule C waiver report data as of August 18, 2015.
Medicaid and CHIP Payment and Access Commission (MACPAC). 2014. Report to the Congress on Medicaid and CHIP. March 2014. Washington, DC: MACPAC. https://www.macpac.gov/publication/report-to-the-congress-on-medicaid-and-chip-314.
Medicare Payment Advisory Commission (MedPAC). 2015. Report to the Congress: Overview of the 340B drug pricing program. Washington, DC: MedPAC. http://www.medpac.gov/documents/reports/may-2015-report-to-the-congress-overview-of-the-340b-drug-pricing-program.pdf.
Rosenbaum, S., D. Kindig, J. Bao, et al. 2015. The value of the nonprofit hospital tax exemption was $24.6 billion in 2011. Health Affairs 34, no. 7 (published online June 17): 1225–1223. http://content.healthaffairs.org/content/early/2015/06/18/hlthaff.2014.1424.

CHAPTER 2
Analysis of Current and Future Disproportionate Share Hospital Allotments

February 201618
Chapter 2: Analysis of Current and Future Disproportionate Share Hospital Allotments
Analysis of Current and Future Disproportionate Share Hospital Allotments
Key Points• The Commission finds little meaningful relationship between states’ disproportionate share
hospital (DSH) allotments and the three factors that Congress asked the Commission to study:
– the number of uninsured individuals;
– the amount and sources of hospitals’ uncompensated care costs; and
– the number of hospitals with high levels of uncompensated care that also provide access to essential community services for low-income, uninsured, and vulnerable populations.
• Early reports suggest that the coverage expansions under the Patient Protection and Affordable Care Act (ACA, P.L. 111-148, as amended) are improving hospital finances in general, but the ACA’s effects on hospitals that are particularly reliant on Medicaid DSH payments are not yet clear.
• The number of uninsured people declined in all states in 2014, with the largest declines in states that expanded Medicaid.
• Early reports also suggest that unpaid costs of care for the uninsured are declining in states that have expanded Medicaid. It is difficult to interpret these findings, however, because they do not include complete and timely data on hospital costs for Medicaid shortfall, which may increase with Medicaid expansion.
• Deemed DSH hospitals, which serve a higher share of low-income patients, are more likely to provide a range of primary and quaternary care services that are often not available at other hospitals. These hospitals also report more uncompensated care as a share of operating expenses than other DSH hospitals.
• Although DSH allotment reductions are required to account for state uninsured rates and factors related to state targeting of DSH payments to hospitals with high levels of uncompensated care, much of the current variation in state DSH allotments is projected to persist after DSH allotment reductions take effect in fiscal year (FY) 2018.

Report to Congress on Medicaid Disproportionate Share Hospital Payments 19
Chapter 2: Analysis of Current and Future Disproportionate Share Hospital Allotments
CHAPTER 2: Analysis of Current and Future Disproportionate Share Hospital Allotments Pending reductions to state disproportionate share hospital (DSH) allotments are premised in part on the assumption that increased hospital revenues from coverage expansions under the Patient Protection and Affordable Care Act (ACA, P.L. 111-148, as amended) will reduce uncompensated care and thus reduce the need for DSH payments to safety-net hospitals. Early reports suggest that the coverage expansions are improving hospital finances in general, but it is not yet clear how hospitals that are particularly reliant on Medicaid DSH payments are being affected. In addition, because post-2014 data on all sources of hospital uncompensated care (particularly Medicaid shortfall) are not yet available, it is too early to evaluate whether the size of pending DSH allotment reductions is appropriate.
In the Protecting Access to Medicare Act of 2014 (P.L. 113-93), Congress required MACPAC to report annually on Medicaid DSH allotments to better understand the effects of the ACA on hospitals and the relationship between state DSH allotments and several potential indicators of their need for DSH funds. This chapter provides the specific data and analyses that Congress requested and that we have been able to obtain including:
• changes in the number of uninsured individuals;
• the amount and sources of hospitals’ uncompensated care costs;
• the number of hospitals with high levels of uncompensated care that also provide
access to essential community services for low-income, uninsured, and vulnerable populations; and,
• the relationship between state DSH allotments and each of these factors.
The first three sections of the chapter describe what we know about the indicators that Congress specified. First we provide data on the number of uninsured individuals and the extent to which uninsured rates are declining under the ACA. We then describe the types and amounts of hospital uncompensated care, preliminary evidence on how these numbers are changing, and limits in our ability to draw conclusions. We also describe our initial approach to identifying hospitals with high levels of uncompensated care that also provide essential community services.
In the fourth section, we discuss current and projected state DSH allotments and the relationship of these allotments to the indicators above. Because states’ allotments are based primarily on historical spending, rather than an objective measure of their need for DSH payments, we do not find any meaningful relationships.
We close with a discussion of the effects that DSH allotment reductions may have on DSH payments to hospitals as well as policy changes that states may consider in response. We also project DSH allotments and payments to hospitals under a scenario in which all states would expand Medicaid to non-elderly adults at or below 138 percent of the federal poverty level (FPL), because state decisions about whether to expand Medicaid coverage will have important implications for the number of uninsured individuals and state levels of uncompensated care.1

February 201620
Chapter 2: Analysis of Current and Future Disproportionate Share Hospital Allotments
Changes in the Number of Uninsured IndividualsMedicaid DSH payments are intended to offset the uncompensated care costs of hospitals that serve a high proportion of low-income patients, including those without health insurance. Thus, a state’s uninsured rate may be a useful indicator of its need for DSH funds. The number of uninsured persons declined in all states in 2014, but the levels of decline varied, in part due to state decisions about whether to expand Medicaid coverage to low-income adults under the ACA.
The national uninsured rate declined by about 3 percentage points in 2014, reflected by increases in both private and government coverage, and likely due to the availability of new coverage options under the ACA. According to the Current Population Survey, 33.0 million people (10.4 percent of the U.S. population) were uninsured for the entire calendar year in 2014, compared to 41.8 million (13.3 percent of the population) in 2013. Private coverage (including individual insurance purchased through a health insurance exchange) increased 1.8 percentage points in 2014 to 66.0 percent of the U.S. population, and government coverage (including Medicaid) increased 2.0 percentage points to 36.5 percent of the U.S. population (Smith and Medalia 2015).2
The uninsured rate declined for all age groups, but was largest for working-age adults age 19–64, who were the primary beneficiaries of ACA coverage expansions (Table 2-1). The uninsured rate for these adults fell 4.2 percentage points, and the largest declines were in the subgroups of working-age adults without children (5.8 percentage points), part-time workers (6.3 percentage points), and those without a high school diploma (7.6 percentage points) (Smith and Medalia 2015).
The uninsured rate also declined for children by 1.3 percentage points, driven primarily by an increase in public coverage (Smith and Medalia
2015). Although few states increased Medicaid or State Children’s Health Insurance Program (CHIP) eligibility for children during this time period, the change has been attributed to the so-called welcome mat or woodwork effect of coverage expansions for adults, increasing enrollment among children who were already eligible for Medicaid or CHIP but not enrolled (Kenney et al. 2014).
While the uninsured rate declined in all states, states that expanded their Medicaid programs under the ACA had declines that were about twice as large as those that did not. This is true despite the fact that expansion states already had lower uninsured rates in 2013. Expansion states also had larger declines in the uninsured rate for adults at all income levels, including those above the poverty threshold (Smith and Medalia 2015).
Even with the coverage expansions under the ACA, however, there are still about 32 million people who remain uninsured, including individuals in every state. It is estimated that about half of these uninsured individuals are eligible for Medicaid, CHIP, or subsidized exchange coverage, but are not enrolled. About 15 percent of the remaining uninsured are undocumented immigrants that are not eligible for ACA coverage, and about 10 percent are those below the poverty level in states that have not expanded Medicaid under the ACA (Garfield 2015).
TABLE 2-1. Uninsured Rate by Age Group, 2013 and 2014
Age
Percent uninsured Percentage point
change2013 20140–18 7.5% 6.2% -1.3%
19–64 18.5 14.3 -4.2
65 and over 1.5 1.4 -0.1
All 13.3% 10.4% -2.9%
Source: Smith and Medalia 2015

Report to Congress on Medicaid Disproportionate Share Hospital Payments 21
Chapter 2: Analysis of Current and Future Disproportionate Share Hospital Allotments
Changes in the Amount of Hospital Uncompensated CareA potential indicator of a state’s need for Medicaid DSH funds is the uncompensated care that its hospitals provide. As with uninsured rates, the sources and amounts of hospital uncompensated care are changing. As discussed below, early reports suggest that uncompensated care is
declining, a trend consistent with the fact that more people have health coverage. However, lack of timely institution-specific data, especially data on the amount of Medicaid shortfall, limits our ability to fully understand how individual hospitals are being affected. As well, definitions of uncompensated care vary among data sources, complicating comparisons (Box 2-1).
BOX 2-1. Definitions and Data Sources for Uncompensated Care Costs• American Hospital Association (AHA) annual survey—An annual survey of hospital finances
that provides aggregated national estimates of uncompensated care for community hospitals.
• Medicare cost report—An annual report on hospital finances that must be submitted by all hospitals that receive Medicare payments (that is, most U.S. hospitals). Medicare cost reports define hospital uncompensated care as bad debt and charity care.
• Medicaid disproportionate share hospital (DSH) audit—A statutorily required audit of a DSH hospital’s uncompensated care to ensure that Medicaid DSH payments do not exceed the hospital-specific DSH limit, which is equal to the sum of Medicaid shortfall and the unpaid costs of care for the uninsured for allowable inpatient and outpatient costs. About half of U.S. hospitals were included on DSH audits in 2011, the latest year for which data are available.
Medicare cost report components of uncompensated care
• Charity care—Health care services for which a hospital determines the patient does not have the capacity to pay and either does not charge the patient at all or charges the patient a discounted rate below the hospital’s cost of delivering the care. The amount of charity care is the difference between a hospital’s cost of delivering the care and the amount initially charged to the patient.
• Bad debt—Expected payment amounts that a hospital is not able to collect from patients who, according to the hospital’s determination, have the financial capacity to pay.
Medicaid DSH audit components of uncompensated care
• Medicaid shortfall—The difference between a hospital’s costs of serving Medicaid patients and the total amount of Medicaid payment received for those services (under both fee-for-service and managed care, excluding DSH payments).
• Unpaid costs of care for the uninsured—The difference between a hospital’s costs of serving individuals without health coverage and the total amount of payment received for those services. This generally includes charity care and bad debt for individuals without health coverage and excludes charity care and bad debt for individuals with health coverage.
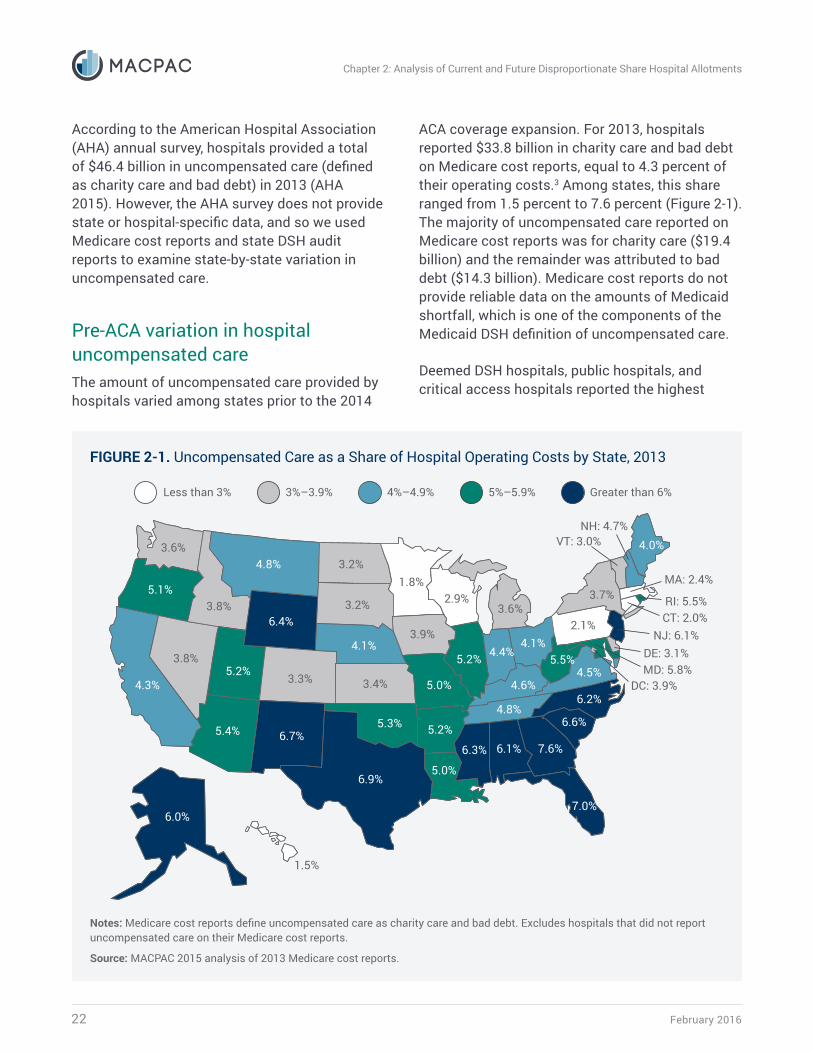
February 201622
Chapter 2: Analysis of Current and Future Disproportionate Share Hospital Allotments
According to the American Hospital Association (AHA) annual survey, hospitals provided a total of $46.4 billion in uncompensated care (defined as charity care and bad debt) in 2013 (AHA 2015). However, the AHA survey does not provide state or hospital-specific data, and so we used Medicare cost reports and state DSH audit reports to examine state-by-state variation in uncompensated care.
Pre-ACA variation in hospital uncompensated careThe amount of uncompensated care provided by hospitals varied among states prior to the 2014
ACA coverage expansion. For 2013, hospitals reported $33.8 billion in charity care and bad debt on Medicare cost reports, equal to 4.3 percent of their operating costs.3 Among states, this share ranged from 1.5 percent to 7.6 percent (Figure 2-1). The majority of uncompensated care reported on Medicare cost reports was for charity care ($19.4 billion) and the remainder was attributed to bad debt ($14.3 billion). Medicare cost reports do not provide reliable data on the amounts of Medicaid shortfall, which is one of the components of the Medicaid DSH definition of uncompensated care.
Deemed DSH hospitals, public hospitals, and critical access hospitals reported the highest
FIGURE 2-1. Uncompensated Care as a Share of Hospital Operating Costs by State, 2013
5.0%
3.8%
5.2%
4.8%
2.9%
3.4%
4.4%
4.8%6.2%
NH: 4.7%
MA: 2.4%
VT: 3.0%
2.1%
4.5%
CT: 2.0%NJ: 6.1%
DE: 3.1%MD: 5.8%
RI: 5.5%
1.5%
6.0%
6.6%
7.6%
6.9%
7.0%
6.1%6.3%
6.4%3.9%
4.1%
3.2%
4.0%
5.0%
5.3%
DC: 3.9%
5.4%
3.6%
1.8%3.2%
3.3%
5.1%
3.8%
4.3%
3.6%
4.1%
3.7%
4.6%
5.5%
6.7%
5.2%
5.2%
Less than 3% 3%–3.9% Greater than 6% 5%–5.9%4%–4.9%
Notes: Medicare cost reports define uncompensated care as charity care and bad debt. Excludes hospitals that did not report uncompensated care on their Medicare cost reports.
Source: MACPAC 2015 analysis of 2013 Medicare cost reports.

Report to Congress on Medicaid Disproportionate Share Hospital Payments 23
Chapter 2: Analysis of Current and Future Disproportionate Share Hospital Allotments
levels of uncompensated care as a share of operating expenses in 2013, and these hospitals also reported negative operating margins during this time period (Table 2-2). However, many individual hospitals—of all types—reported positive operating margins despite their uncompensated care costs, indicating that revenue from other hospital operations can fully offset hospital uncompensated care costs in some cases. When revenue that is not directly related to patient care is taken into account, all hospital types reported positive total margins in the aggregate.
On as-filed Medicaid DSH audits from 2011, the most recent year for which data are available, DSH hospitals reported a total of $31.5 billion in uncompensated care (of which $6.7 billion was Medicaid shortfall and $24.8 billion was unpaid costs of care for the uninsured). However, because DSH audits are submitted for only about half of U.S. hospitals, they provide limited insight into the variation in types and amounts of uncompensated care at the state level. We also lack data on shortfall amounts attributable to other payers.
TABLE 2-2. Uncompensated Care and Cost Margins, Aggregated by Hospital Type, 2013
Hospital characteristics
Uncompensated care as a share of operating costs Operating margin Total margin
Hospital type
Short-term acute care hospitals 4.6% 0.9% 7.6%
Critical access hospitals 5.2 -4.1 4.3
Psychiatric hospitals – -0.4 4.0
Long-term hospitals – 3.0 4.5
Rehabilitation hospitals – 6.5 11.5
Children’s hospitals – -4.2 12.3
Hospital ownership
For-profit 3.4 8.1 10.6
Non-profit 3.8 0.3 7.6
Public 7.7 -5.8 5.1
DSH status
Non-DSH hospitals 3.5 3.1 8.7
DSH hospitals, not deemed 4.0 -0.1 6.9
Deemed DSH hospitals 7.0 -3.4 7.1
All 4.3% 0.6% 7.7%
Notes: DSH is disproportionate share hospital. For the purposes of Medicare cost reports, uncompensated care is defined as charity care and bad debt. DSH payments are included in operating margins and total margins. Total margins include revenue that is not directly related to patient care, such as investment income, parking receipts, non-DSH state or local subsidies to hospitals, and investment income. Data exclude outlier hospitals reporting operating margins greater than 75 percent or less than negative 75 percent. Deemed DSH status was estimated based on available Medicaid and low-income utilization data. For further discussion of the methodology and limitations, see Appendix C.
– Dash means data not available; fewer than 60 percent of hospitals of this type reported uncompensated care data.
Source: MACPAC 2015 analysis of 2013 Medicare cost report data.

February 201624
Chapter 2: Analysis of Current and Future Disproportionate Share Hospital Allotments
Expected changes to hospital uncompensated care under the ACAComprehensive, state-specific data on the effects of the ACA on hospitals’ uncompensated care are not yet available, but early reports suggest that ACA coverage expansions are reducing charity care and bad debt, particularly in states that have expanded Medicaid. Our analysis of changes in charity care and bad debt for a subset of hospitals that have submitted Medicare cost reports for 2014 is generally consistent with these early reports. On the other hand, Medicaid shortfall, for which we do not have sufficient data, is likely to increase because of increased Medicaid enrollment. It is not yet clear, however, how the increase in Medicaid shortfall relates to the decrease in other types of uncompensated care.
Several studies of prior health care expansions and early reports of the effect of ACA coverage expansions have found that declines in the uninsured rate were associated with declines in charity care and bad debt in Medicaid expansion states (Table 2-3). The magnitude of these reductions ranged from 5 percent to 40 percent. These studies have also found that declines in the number of uninsured are not always associated with corresponding declines in uncompensated care. One study of selected hospital systems in the second quarter of 2014 found that in states that did not expand Medicaid, bad debt and charity care increased even though admissions of uninsured patients decreased (ASPE 2014).
Most studies find that increases in Medicaid shortfall are associated with increases in coverage.
TABLE 2-3. Selected Studies of the Effects of Coverage Expansions on Uncompensated Care
Study Study scopeStudy period
Change in uninsuredChange in charity care
and bad debtChange in Medicaid
shortfall
Expansion states
Non-expansion
statesExpansion
states
Non-expansion
statesExpansion
states
Non-expansion
states
Arietta 2013 Massachusetts (early expansion)
2004–2005 compared to 2006–2009
55% reduction – 26% decrease – – –
Nikpay et al. 2015
Connecticut (early expansion) 2007–2013 9%
reduction –33% lower
than without expansion
–
7%–8% increase in Medicaid
share of revenue
–
CHA 2014 435 hospitals across 30 states
Q1 2013– Q1 2014
34% reduction in self-pay share
of chargesNo change 34%
decrease No change23% increase in Medicaid
share of chargesNo change
ASPE 2015 4 large hospital systems
Q2 2013– Q2 2014
48%–72% reduction in uninsured
admissions
0%–14% reduction
5%–19% decrease
4%–10% increase
17%–32% increase in Medicaid
admissions
3% increase
Cunningham et al. 2015
Ascension Health System
(hospitals in 16 states)
Q2 2014– Q4 2014
32% reduction in uninsured
admissions and discharges
4% reduction
40% decrease
6% decrease
22% increase
36% increase
Notes: Q1, Q2, and Q4 refer to calendar quarters. Expansion states are those that expanded Medicaid coverage to non-elderly adults at or below 138 percent of the federal poverty level (FPL) at the time of the study.
– Dash indicates that the study did not examine the particular issue.
Source: MACPAC 2015 analysis of Cunningham et al. 2015, Nikpay et al. 2015, ASPE 2015, CHA 2014, and Arietta 2013.

Report to Congress on Medicaid Disproportionate Share Hospital Payments 25
Chapter 2: Analysis of Current and Future Disproportionate Share Hospital Allotments
One pre-ACA projection of public hospital costs in California suggested that if existing hospital payment levels persisted, then the hospitals with high Medicaid volume studied could face more uncompensated care costs after the Medicaid expansion because the increase in Medicaid shortfall was not projected to be offset by reductions in the unpaid costs of care for the uninsured (Neuhausen et al. 2014). However, a post-ACA study of hospitals in a multistate non-profit system found that hospitals in expansion states saw reductions in charity care that were greater than their increase in Medicaid shortfall, resulting in an overall decrease in uncompensated care costs for these hospitals (Cunningham et al. 2015). Differences in Medicaid utilization rates between the hospitals studied may help explain the differences in projected changes to Medicaid shortfall.
Preliminary analysis of Medicare cost reports for 2014 also shows a decrease in uncompensated care among expansion states. For the subset of hospitals that have submitted 2014 Medicare cost reports, uncompensated care declined by about 31 percent in states that expanded Medicaid (from 3.6 percent of hospital operating costs to 2.4 percent of hospital operating costs) and declined by 2 percent in states that did not expand Medicaid (from 5.1 percent of hospital operating costs to 5.0 percent of hospital operating costs) (Figure 2-2). The decline for Medicaid expansion states was statistically significant, but hospitals in Medicaid expansion states also had significantly lower uncompensated care than non-expansion states before 2014.
FIGURE 2-2. Uncompensated Care as a Percentage of Hospital Operating Costs, 2011–2014
Expansion state
4.8%
2011 2012 2013 2014
3.6%
5.1%
3.6%
5.1%
3.5%
5.0%
2.4%
Non-expansion state
Calendar year
0%
1%
2%
3%
4%
5%
6%
Notes: Analysis is based on 1,371 hospitals that submitted a full year of uncompensated care data beginning January 1, 2014, and that reported data continuously from 2011 to 2014. Medicare cost reports define uncompensated care as charity care and bad debt. Expansion states are states that expanded Medicaid to non-elderly adults at or below 138 percent of the federal poverty level (FPL) before December 31, 2014.
Source: MACPAC 2015 analysis of 2011–2014 Medicare cost report data.

February 201626
Chapter 2: Analysis of Current and Future Disproportionate Share Hospital Allotments
We limited this analysis to 1,371 hospitals that had submitted a full year of uncompensated care data beginning January 1, 2014, to better isolate the effects of the ACA coverage expansion. The subset of hospitals that we used in this analysis includes a variety of hospitals from all states, including 624 DSH hospitals from 40 states. (For more information about our methods, see Appendix C.)
Based on our analysis, DSH hospitals experienced declines in uncompensated care similar to non-DSH hospitals, and bad debt and charity care both declined at similar rates. However, we do not yet have sufficient data to understand how deemed DSH hospitals in particular are being affected. Moreover, our ability to understand the full effects of the ACA on hospitals that serve high volumes of Medicaid patients is particularly limited because we do not have reliable data on Medicaid shortfall from Medicare cost reports.
Hospitals with High Levels of Uncompensated Care That Also Provide Essential Community ServicesThe third indicator to be considered when analyzing a state’s need for Medicaid DSH funds is the extent to which hospitals in the state with high levels of uncompensated care also provide access to what the Protecting Access to Medicare Act of 2014 (the statute calling for MACPAC’s study) calls essential community services. Although the statute does not provide a specific list of services falling into this category, it describes them as services that are important to low-income and other vulnerable communities that are not available at most hospitals. The concept of essential community services is not defined elsewhere in Medicaid statute or regulation.
Lacking clear direction for identifying such hospitals, MACPAC developed a working definition based on the types of services suggested in the study requirement and the limits of available data (Box 2-2). This working definition builds on the statutory definition of deemed DSH hospitals, because as discussed in Chapter 1, deemed DSH hospitals are more likely to provide a range of additional primary and quaternary care services that are not often available at other hospitals. DSH payments are an important source of revenue for these hospitals and may allow them to maintain access to these services that their patients may not be able to obtain elsewhere.
Among the 798 deemed DSH hospitals identified, 702 provided at least one of the included services, with 303 providing two of these services and 171 providing three or more of these services. In order to be as inclusive as possible in this first report, we considered provision of just one of these services to be sufficient for inclusion as a hospital that provides essential community services. More restrictive criteria may be applied in future reports.
The 702 hospitals that provided at least one essential community service represent about 11 percent of U.S. hospitals but about 37 percent of the uncompensated care reported on Medicare cost reports for all hospitals. The number of hospitals that were identified in each state is generally proportional to the size of each state’s population. Large states, including California, Texas, and New York, had more than 30 deemed DSH hospitals that provided at least one included service, while smaller states had only a few hospitals that met the criteria.
Using DSH audits, which all deemed DSH hospitals must submit, we can examine uncompensated care according to the Medicaid DSH definition, which includes Medicaid shortfall. The amount of uncompensated care as a share of hospital operating costs reported on Medicaid DSH audits by the hospitals that we identified as providing

Report to Congress on Medicaid Disproportionate Share Hospital Payments 27
Chapter 2: Analysis of Current and Future Disproportionate Share Hospital Allotments
BOX 2-2. Identifying Hospitals with High Levels of Uncompensated Care That Provide Essential Community Services for Low-Income, Uninsured, and Other Vulnerable Populations
The statute requires that MACPAC provide data identifying hospitals with high levels of uncompensated care that also provide access to essential community services for low-income, uninsured, and vulnerable populations, such as graduate medical education, and the continuum of primary through quaternary care, including the provision of trauma care and public health services.
In developing a working definition of such hospitals for this first report on Medicaid disproportionate share hospital (DSH) payments, the Commission began with the existing statutory definition of deemed DSH hospitals, which is based on high utilization by Medicaid patients, low-income patients, or both. In addition to serving more low-income patients, these hospitals also provide higher levels of uncompensated care than are provided at non-deemed DSH hospitals.
The essential community services included were based on those explicitly identified by statute (e.g., graduate medical education and trauma), as well as related services that could be identified through Medicare cost reports or the American Hospital Association (AHA) annual survey. Ultimately, the following services were included:
• burn services
• dental services
• graduate medical education
• HIV/AIDS care
• inpatient psychiatric services (through a psychiatric subunit or stand-alone psychiatric hospital)
• neonatal intensive care units
• obstetrics and gynecology services
• substance use disorder services
• trauma services
In this first report, deemed DSH hospitals providing at least one of these services were included in our analysis. We also included certain hospital types if they were the only hospital in their geographic area to provide certain types of services. Critical access hospitals were included because they are often the only hospital within a 25-mile radius. In addition, we included children’s hospitals that were the only hospital within a 15-mile radius (measured by driving distance).
The ability to include certain services, however, was based on the availability of data. For example, it was not possible to identify hospitals that provide public health services, one of the statutory examples, based on known data sources. In addition, it was not possible to separately identify primary care as a unique service for this analysis. For future reports the Commission intends to continue to discuss and potentially refine the methodology based on the identification of new services and data sources.

February 201628
Chapter 2: Analysis of Current and Future Disproportionate Share Hospital Allotments
essential community services was about twice that reported by the average DSH hospital (Table 2-4). The deemed DSH hospitals that provided at least one included service also provided more uncompensated care than the average deemed DSH hospital. Overall, deemed DSH hospitals reported higher uncompensated care costs but lower Medicaid shortfall than all DSH hospitals, which may be due to the effect of other Medicaid supplemental payments to these hospitals; deemed DSH hospitals report three times as much revenue in non-DSH supplemental payments as other DSH hospitals, which helps to reduce their Medicaid shortfall.
DSH Allotment ProjectionsBelow we describe current and projected DSH allotments and compare them to state uninsured rates, hospital uncompensated care, and the number of hospitals with high levels of uncompensated care that also provide essential community services. We find that there is little meaningful relationship between DSH allotments and any of these factors, even when DSH allotment reductions take effect in FY 2018.
In the analyses below, we focus on FY 2018 allotments (unreduced and reduced) rather than FY 2016 and 2017 allotments for two reasons. First, because allotments generally grow uniformly based on the Consumer Price Index for All Urban Consumers (CPI-U), their relationship to each other is not expected to change. Second, with allotment reductions scheduled to take effect in FY 2018, we can project scenarios with and without reductions and demonstrate the effect of these reductions on the three factors Congress required us to consider. We provide complete state-by-state estimates of DSH allotments for FYs 2016–2018 in Appendix B.
Unreduced DSH allotmentsStates’ unreduced DSH allotments vary widely among states and are largely based on historic spending levels. For example, projected unreduced DSH allotments for FY 2018 range from less than $15 million in six states (Delaware, Hawaii, Montana, North Dakota, South Dakota, and Wyoming) to more than $1 billion in three states (California, New York, and Texas). As a percentage of state Medicaid spending, unreduced FY 2018 DSH allotments range from 0.1 percent in Wyoming to more than 10 percent in Louisiana
TABLE 2-4. DSH Hospital Uncompensated Care as a Share of Hospital Operating Costs, 2011
Type of uncompensated care
Deemed DSH hospitals that provide least one essential
community service1
(n = 702)
Deemed DSH hospitals(n = 798)
All DSHhospitals
(n = 2,743)Medicaid shortfall 0.8% 0.8% 1.4%
Unpaid costs of care for the uninsured 9.3 9.2 5.2
Total DSH audit uncompensated care 10.1% 10.0% 6.6%
Notes: DSH is disproportionate share hospital. Medicaid DSH audits define uncompensated care as Medicaid shortfall and unpaid costs of care for the uninsured. Deemed DSH status was estimated based on available Medicaid and low-income utilization data. For further discussion of the methodology and limitations, see Appendix C.1 Our working definition of essential community services includes the following services: burn services, dental services, graduate medical education, HIV/AIDS care, inpatient psychiatric services (through a psychiatric subunit or stand-alone psychiatric hospital), neonatal intensive care units, obstetrics and gynecology services, substance use disorder services, and trauma services.
Source: MACPAC 2015 analysis of 2011 as-filed Medicaid DSH audits, 2011 and 2013 Medicare cost report data, and the 2013 American Hospital Association annual survey.

Report to Congress on Medicaid Disproportionate Share Hospital Payments 29
Chapter 2: Analysis of Current and Future Disproportionate Share Hospital Allotments
and New Hampshire (Figure 2-3). Before DSH allotment reductions, the variation in the projected DSH allotments is similar to the variation observed in prior years’ DSH allotments, which is based on state historical DSH spending before federal limits were established in 1993.4
Reduced DSH allotmentsTo estimate reduced DSH allotments for FY 2018, we modeled the DSH Health Reform Methodology (DHRM) that was developed by the Centers for Medicare & Medicaid Services (CMS) to implement
allotment reductions for FYs 2014 and 2015 (before the reductions in DSH allotments were delayed). This methodology uses five factors to implement the statutory requirements to apply greater DSH reductions to states with lower uninsured rates and states that do not target their DSH payments to high-need hospitals, among other criteria (Box 2-3). Although CMS may modify this reduction methodology in future years, the DHRM incorporates all of the statutory requirements for DSH allotment reductions and is thus a reasonable starting point for estimating future DSH allotment reductions.
FIGURE 2-3. Unreduced DSH Allotments as a Share of State Medicaid Benefit Spending, FY 2018
13.1%
1.2%
1.1%
1.5%
1.9%
2.4%
3.4%
0.7%3.4%
NH: 21.5%
MA: 4.0%
VT: 2.4%
4.4%
2.1%
CT: 5.3%NJ: 10.4%
DE: 0.9%MD: 1.7%
RI: 5.7%
1.0%
2.6%
8.3%
3.8%
5.1%
1.5%
7.4%3.7%
0.1%1.7%
2.6%
1.6%
5.0%
7.1%
1.1%
DC: 3.2%
1.5%
4.0%
1.4%2.1%
3.1%
1.2%
3.3%
3.0%
2.8%
3.3%
5.2%
3.0%
2.7%
0.7%
2.3%
1.3%
Less than 1% 1%–1.9% Greater than 10% 5%–9.9%2%–4.9%
Notes: DSH is disproportionate share hospital. FY is fiscal year. FY 2018 spending was estimated using FY 2014 actual spending and national spending projections from the CMS Office of the Actuary. State and federal funds are included.
Source: Dobson DaVanzo & Associates and KNG Health 2015 analysis for MACPAC of preliminary FY 2016 DSH allotments, Congressional Budget Office projections of the Consumer Price Index for All Urban Consumers (CPI-U), and CMS-64 FMR net expenditure data as of February 25, 2015.
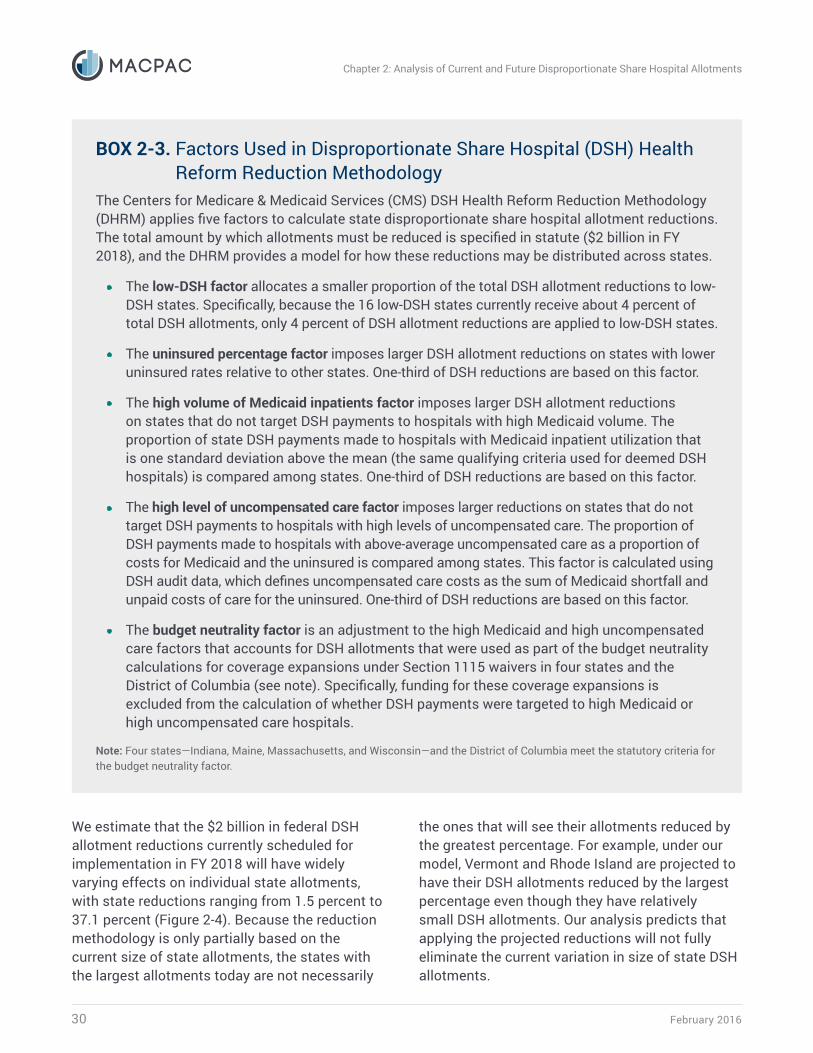
February 201630
Chapter 2: Analysis of Current and Future Disproportionate Share Hospital Allotments
We estimate that the $2 billion in federal DSH allotment reductions currently scheduled for implementation in FY 2018 will have widely varying effects on individual state allotments, with state reductions ranging from 1.5 percent to 37.1 percent (Figure 2-4). Because the reduction methodology is only partially based on the current size of state allotments, the states with the largest allotments today are not necessarily
the ones that will see their allotments reduced by the greatest percentage. For example, under our model, Vermont and Rhode Island are projected to have their DSH allotments reduced by the largest percentage even though they have relatively small DSH allotments. Our analysis predicts that applying the projected reductions will not fully eliminate the current variation in size of state DSH allotments.
BOX 2-3. Factors Used in Disproportionate Share Hospital (DSH) Health Reform Reduction Methodology
The Centers for Medicare & Medicaid Services (CMS) DSH Health Reform Reduction Methodology (DHRM) applies five factors to calculate state disproportionate share hospital allotment reductions. The total amount by which allotments must be reduced is specified in statute ($2 billion in FY 2018), and the DHRM provides a model for how these reductions may be distributed across states.
• The low-DSH factor allocates a smaller proportion of the total DSH allotment reductions to low-DSH states. Specifically, because the 16 low-DSH states currently receive about 4 percent of total DSH allotments, only 4 percent of DSH allotment reductions are applied to low-DSH states.
• The uninsured percentage factor imposes larger DSH allotment reductions on states with lower uninsured rates relative to other states. One-third of DSH reductions are based on this factor.
• The high volume of Medicaid inpatients factor imposes larger DSH allotment reductions on states that do not target DSH payments to hospitals with high Medicaid volume. The proportion of state DSH payments made to hospitals with Medicaid inpatient utilization that is one standard deviation above the mean (the same qualifying criteria used for deemed DSH hospitals) is compared among states. One-third of DSH reductions are based on this factor.
• The high level of uncompensated care factor imposes larger reductions on states that do not target DSH payments to hospitals with high levels of uncompensated care. The proportion of DSH payments made to hospitals with above-average uncompensated care as a proportion of costs for Medicaid and the uninsured is compared among states. This factor is calculated using DSH audit data, which defines uncompensated care costs as the sum of Medicaid shortfall and unpaid costs of care for the uninsured. One-third of DSH reductions are based on this factor.
• The budget neutrality factor is an adjustment to the high Medicaid and high uncompensated care factors that accounts for DSH allotments that were used as part of the budget neutrality calculations for coverage expansions under Section 1115 waivers in four states and the District of Columbia (see note). Specifically, funding for these coverage expansions is excluded from the calculation of whether DSH payments were targeted to high Medicaid or high uncompensated care hospitals.
Note: Four states—Indiana, Maine, Massachusetts, and Wisconsin—and the District of Columbia meet the statutory criteria for the budget neutrality factor.

Report to Congress on Medicaid Disproportionate Share Hospital Payments 31
Chapter 2: Analysis of Current and Future Disproportionate Share Hospital Allotments
Relating DSH allotments to the statutorily required factorsWe find little meaningful relationship between state DSH allotments and the number of uninsured individuals in a state, the amount of uncompensated care, or the number of hospitals with high uncompensated care that provide at least one essential community service. This is true for both unreduced allotment levels and under the reduction scheduled for FY 2018.
Relationship between DSH allotments and the number of uninsured individuals. In FY 2018, states’ unreduced federal DSH allotments
are expected to average out to approximately $337 per uninsured individual. However, these DSH allotments, compared on a per-uninsured individual basis, are highly dispersed among states, from $4 per uninsured individual to more than $2,000 per uninsured individual (Figure 2-5). After reductions are applied, these allotments are projected to average out to approximately $283 per uninsured individual and to continue to vary widely among states (from $4 to more than $1,500). These estimates are based on state uninsured data from 2014, the most recent year available. While uninsured rates are expected to change over the next several years, the most significant changes are likely to be the result of
FIGURE 2-4. Projected Percentage Decrease in State DSH Allotments, FY 2018
8.7%
3.2%
8.7%
6.5%
1.9%
21.6%
4.8%
16.7%18.4%
NH: 7.9%
MA: 19.0%
VT: 33.3%
22.0%
18.4%
CT: 24.7%NJ: 24.9%
DE: 4.8%MD: 21.5%
RI: 37.1%
9.3%
4.4%
20.7%
22.3%
3.9%
17.2%
17.0%13.9%
5.0%5.0%
4.9%
1.6%
8.5%
19.6%
5.4%
DC: 22.4%
13.1%
20.3%
4.1%2.2%
22.8%
8.9%
4.6%
13.0%
27.7%
25.1%
18.5%
2.7%
17.4%
1.5%
8.9%
9.0%
0 – 4.9% 5%–9.9% Greater than 25% 15%–19.9% 20%–24.9%10%–14.9%
Notes: DSH is disproportionate share hospital. FY is fiscal year.
Source: Dobson DaVanzo & Associates and KNG Health 2015 analysis for MACPAC of 2011 Medicare cost reports, 2011 as-filed Medicaid DSH audits, and the U.S. Census Bureau 2014 American Community Survey.

February 201632
Chapter 2: Analysis of Current and Future Disproportionate Share Hospital Allotments
FIGURE 2-5. Distribution of FY 2018 State DSH Allotments (Unreduced and Reduced) per Uninsured Individual, 2014
02468
1012141618
< $100
$100–$199
$200–$299
$300–$399
$400–$499
$500–$599
$600–$699
$700–$799
$800–$899
$900–$999
≥ $1,000
Unreduced DSH allotments
Reduced DSH allotments
89
6
9
3 34 4
2 2
54
2
0
2
01
223
1615
DSH allotment per uninsured individual
Num
ber o
f sta
tes
Notes: FY is fiscal year. DSH is disproportionate share hospital. DSH allotments include federal funds only.
Source: Dobson DaVanzo & Associates and KNG Health 2015 analysis for MACPAC of 2011 Medicare cost reports, 2011 as-filed Medicaid DSH audits, and the U.S. Census Bureau 2014 American Community Survey.
FIGURE 2-6. Distribution of FY 2018 State DSH Allotments (Unreduced and Reduced) as a Percentage of 2013 Hospital Uncompensated Care
0
2
4
6
810
12
14
16
< 10%
10%–19%
20%–29%
30%–39%
40%–49%
50%–59%
60%–69%
70%–79%
80%–89%
90%–99%≥ 100%
Unreduced DSH allotments
Reduced DSH allotments
6
8
1112
8
31 1 1
23
221
2
0
5
2
0
5
12
15
DSH allotment as a percentage of hospital uncompensated care in the state
Num
ber o
f sta
tes
Notes: FY is fiscal year. DSH is disproportionate share hospital. DSH allotments include federal funds only. To project uncompensated care costs for FY 2018, uncompensated care costs from 2013 were adjusted for inflation using the Consumer Price Index for All Urban Consumers (CPI-U). Uncompensated care is based on Medicare cost reports, which define uncompensated care as charity care and bad debt.
Source: Dobson DaVanzo & Associates and KNG Health 2015 analysis for MACPAC of 2011 Medicare cost reports, 2011 as-filed Medicaid DSH audits, and the U.S. Census Bureau 2014 American Community Survey.

Report to Congress on Medicaid Disproportionate Share Hospital Payments 33
Chapter 2: Analysis of Current and Future Disproportionate Share Hospital Allotments
state decisions regarding Medicaid expansion, which we cannot reliably predict.
Relationship between DSH allotments and hospital uncompensated care. Before DSH allotment reductions, FY 2018 federal DSH allotments are equal to 37 percent of 2013 hospital charity care and bad debt (in the aggregate and adjusted for inflation). However, the share of DSH allotments as a percentage of uncompensated care varies widely by state, ranging from less than 10 percent in six states to more than 100 percent in three states. After DSH allotment reductions, FY 2018 federal DSH allotments are equal to 31 percent of 2013 uncompensated care in the aggregate, but the wide variation between states remains (Figure 2-6).
Data limitations hamper our efforts to compare projected DSH allotments to state uncompensated care levels. The most recent uncompensated care data available from Medicare cost reports is from 2013, and it does not reflect the ACA coverage expansions that began in 2014. While we know that amounts and types of uncompensated care have changed, our data is not sufficiently reliable to take these changes into account when developing estimates of 2018 uncompensated care. In addition, we cannot reliably calculate Medicaid shortfall using Medicare cost report data.
Based on the preliminary reports and analyses described earlier (Table 2-3 and Figure 2-2), we expect that future changes in uncompensated care will be greatest in states that have expanded their Medicaid programs. State Medicaid expansion decisions will not affect the disparity in current state DSH allotments, but these decisions may have important implications for the ability of future DSH allotments, particularly reduced allotments, to cover uncompensated care costs. We plan to examine this issue more closely as future data allow.
Relationship between DSH allotments and hospitals with high levels of uncompensated care that also provide essential community services. At the national level, the average federal DSH
allotment (unreduced) per deemed DSH hospital that provides at least one essential community service is projected to be about $17.6 million in FY 2018. At the state level, the average DSH allotment (unreduced) for these hospitals varies widely, ranging from less than $5 million to more than $50 million (Figure 2-7). Our models show that DSH allotment reductions reduce DSH payments to these hospitals slightly, but that the variation among states remains. To take different sizes of hospitals into account, we also adjusted for the number of beds per hospital, but we still find no meaningful relationship between state DSH allotments and the number of hospitals with high uncompensated care that provide at least one essential community service.
Potential State Responses to Allotment ReductionsState decisions regarding DSH payment policies could have a substantial effect on DSH payments to specific hospitals and on individual states’ DSH allotments under the DHRM reduction methodology. However, our preliminary modeling of DSH allotment reductions for FY 2018 does not take into account changes in state behavior that might be prompted by the incentives underlying the DHRM. Below we explore how state responses to the targeting of DSH payments could affect individual hospitals and how state decisions to expand Medicaid might affect overall state allotments. More information about our methods for each of these analyses is included in Appendix C.
Strategic targeting of DSH payments to particular hospitalsDSH allotment reductions do not require states to change their targeting of DSH payments, but the methodology that CMS uses to implement them will likely create incentives for states to target DSH allotments to hospitals with high Medicaid

February 201634
Chapter 2: Analysis of Current and Future Disproportionate Share Hospital Allotments
utilization and high levels of uncompensated care. As a result, we modeled the effects on DSH payments under two targeting scenarios:
• DSH payments if states pass along a proportional reduction to each hospital; and
• DSH payments if states redistribute DSH payments strategically to minimize future reductions.
Overall, we find that deemed DSH hospitals would benefit if states responded strategically to the DSH targeting incentives included in the DHRM (Table 2-5). The incentives created by the reduction methodology appear to encourage a more targeted distribution of DSH payments, but it remains to be seen whether these incentives are powerful
enough to overcome the state-level factors that currently drive DSH payment decisions, such as local politics and considerations about the sources of non-federal funding for DSH payments. Additional data on the effects of the strategic targeting model on particular hospital types are provided in Appendix B, and limitations of this model are discussed in Appendix C.
In our modeling of the hospital-level effects of DSH allotment reductions, we assume that some states will not spend their full DSH allotment. As discussed in Chapter 1, $1.2 billion in federal DSH allotments went unspent in 2012. In our FY 2018 model of unreduced DSH allotments, approximately $1.4 billion in federal DSH allotments would remain unspent. To draw down
FIGURE 2-7. Distribution of FY 2018 State DSH Allotments (Unreduced and Reduced) per Deemed DSH Hospital Providing at Least One Essential Community Service1 (millions)
0
2
4
6
8
10
12
14
< $5$5–$9
$10–$14
$15–$19
$20–$24
$25–$29
$30–$34
$35–$39
$40–$44
$45–$49≥ $50
Unreduced DSH allotments
Reduced DSH allotments
1112
9
6
4 4 45
0
3 3
12
0
21
21
3 3
9
13
DSH allotment per deemed DSH hospitalthat provides at least one essential community service (millions)
Num
ber o
f sta
tes
Notes: FY is fiscal year. DSH is disproportionate share hospital. DSH allotments include federal funds only. Excludes two states without hospitals that meet our definition for inclusion. 1 Deemed DSH status was estimated based on available Medicaid and low-income utilization data. Our working definition of essential community services includes the following services: burn services, dental services, graduate medical education, HIV/AIDS care, inpatient psychiatric services (through a psychiatric subunit or stand-alone psychiatric hospital), neonatal intensive care units, obstetrics and gynecology services, substance use disorder services, and trauma services. For further discussion of the methodology and limitations, see Appendix C.
Source: Dobson DaVanzo and KNG Health 2015 analysis for MACPAC of 2011 and 2013 Medicare cost reports, 2011 as-filed Medicaid DSH audits, the U.S. Census Bureau 2014 American Community Survey, and the 2013 American Hospital Association annual survey.

Report to Congress on Medicaid Disproportionate Share Hospital Payments 35
Chapter 2: Analysis of Current and Future Disproportionate Share Hospital Allotments
these unspent DSH allotments, states would have to provide additional state matching funds.
Our preliminary analysis of 2011 DSH audits and survey data from the U.S. Government Accountability Office suggests that state sources of non-federal funding may affect the distribution of DSH payments. In 2011, states that financed DSH payments with above-average levels of health care-related taxes distributed DSH payments to about twice as many hospitals (as a share of all hospitals in the state). States that financed DSH with above-average levels of intergovernmental transfers and certified public expenditures distributed about twice as much DSH funding to public hospitals (as a share of all DSH spending in the state).
Effects of Medicaid expansion on allotment reductionsOur analysis shows that under a scenario in which every state expands its Medicaid program to cover non-elderly adults at or below 138 percent FPL, aggregate DSH allotment reduction amounts in FY 2018 are not much different from amounts projected based on the status quo scenario (Table 2-6). This may be because the uninsured
percentage factor in the DHRM is based on states’ relative uninsured rates, and decreases in the number of uninsured persons in all states as a result of Medicaid expansion may not have a large effect on the relative rate of the states’ uninsured population. We did not model the effects of
TABLE 2-5. Estimated DSH Payments (Unreduced and Reduced) under Different Targeting Scenarios, FY 2018
Deemed DSH statusNumber of hospitals
Unreduced DSH
payments
Proportional reduction Strategic reduction
DSH payments (millions)
Percent change
DSH payments (millions)
Percent change
Deemed DSH hospitals 798 $ 12,293 $ 10,441 -15% $ 13,027 6%
DSH hospitals, not deemed 1,945 6,492 5,538 -15 2,843 -56
All DSH hospitals 2,743 $ 18,784 $ 15,979 -15% $ 15,870 -16%
Notes: DSH is disproportionate share hospital. FY is fiscal year. DSH payments include state and federal funds. Numbers do not sum due to rounding. Excludes 90 DSH hospitals that did not submit a Medicare cost report. Deemed DSH status was estimated by MACPAC based on available Medicaid and low-income utilization data. For further discussion of the methodology and limitations, see Appendix C.
Source: Dobson DaVanzo & Associates and KNG Health 2015 analysis for MACPAC of 2011 Medicare cost reports, 2011 as-filed Medicaid DSH audits, and the U.S. Census Bureau 2014 American Community Survey.
TABLE 2-6. Change in Aggregate State DSH Allotments under Different Medicaid Expansion Scenarios, FY 2018
Expansion status as of December 31, 2014 Status quo
All states expanded Medicaid coverage
Medicaid expansion states -18.0% -17.7%
Non-Medicaid expansion states -11.6 -12.1
All states -16.2% -16.2%
Notes: DSH is disproportionate share hospital. FY is fiscal year. Status quo projection is based on 2014 uninsured data; as a result, only states that expanded Medicaid to non-elderly adults at or below 138 percent of the federal poverty level by December 31, 2014, are classified as Medicaid expansion states in this analysis.
Sources: Dobson DaVanzo & Associates and KNG Health 2015 analysis for MACPAC of 2011 Medicare cost reports, 2011 as-filed Medicaid DSH audits, the U.S. Census Bureau 2014 American Community Survey, and Holahan et al. 2013.

February 201636
Chapter 2: Analysis of Current and Future Disproportionate Share Hospital Allotments
Medicaid expansion on other factors of the DHRM, but we do not expect large changes to these factors as a result of Medicaid expansion.5
ConclusionThe ACA is changing the number of uninsured patients and the amount of hospital uncompensated care, but state DSH allotments are unlikely to bear any meaningful relationship to these factors, even under pending DSH allotment reductions. The incentives included in CMS’s initial methodology for reducing DSH allotments would encourage states to target more DSH payments to deemed DSH hospitals; at the same time, it appears that they would not discourage states from expanding Medicaid coverage. However, because comprehensive state- and hospital-specific data are not yet available, we cannot make projections based on the full effects of the ACA.
The following chapter explores our data limitations in detail, including the Commission’s recommendations for data improvements that are necessary to fully understand the effects of DSH allotment reductions.
Endnotes1 The ACA set a single income eligibility disregard equal to 5 percentage points of the federal poverty level (FPL). For this reason, eligibility is often referred to at its effective level of 138 percent FPL, even though the federal statute specifies 133 percent FPL.
2 In the Current Population Survey, a monthly survey of households conducted by the U.S. Census Bureau for the U.S. Bureau of Labor Statistics, estimates of health insurance coverage are not mutually exclusive. People can be covered by more than one type of health insurance during the year.
3 Only 74 percent of all hospitals reported uncompensated care on Medicare cost reports in 2013. In light of questions about the reliability of Medicare cost report data, the Centers for Medicare & Medicaid Services (CMS) is working with hospitals to improve the accuracy and completeness of uncompensated care reporting (CMS 2015).
4 Before DSH allotment reductions take effect in FY 2018, DSH allotments are scheduled to increase according to the Consumer Price Index for All Urban Consumers.
5 Although overall Medicaid utilization and uncompensated care are expected to change in states that expand Medicaid, such changes are not expected to have a substantial effect on the high volume of Medicaid inpatients factor or the high level of uncompensated care factor used in the CMS DSH Health Reform Reduction Methodology, since these factors are calculated based on relative Medicaid utilization and relative uncompensated care within a state.
ReferencesAmerican Hospital Association (AHA). 2015. Uncompensated hospital care cost fact sheet. http://www.aha.org/research/policy/finfactsheets.shtml.
Arietta, A. 2013. The impact of the Massachusetts health care reform on unpaid medical bills. Inquiry: Journal of Health Care Organization, Provision, and Financing 50, no. 3: 165–176. http://inq.sagepub.com/content/50/3/165.full.pdf.

Report to Congress on Medicaid Disproportionate Share Hospital Payments 37
Chapter 2: Analysis of Current and Future Disproportionate Share Hospital Allotments
Assistant Secretary for Planning and Evaluation (ASPE), U.S. Department of Health and Human Services. 2014. Impact of insurance expansion on hospital uncompensated care costs in 2014. Washington, DC: ASPE. https://aspe.hhs.gov/report/impact-insurance-expansion-hospital-uncompensated-care-costs-2014.
Centers for Medicare & Medicaid Services (CMS), U.S. Department of Health and Human Services. 2015. Medicare program: Hospital inpatient prospective payment systems for acute care hospitals and the long-term care hospital prospective payment system policy changes and fiscal year 2016 rates; revisions of quality reporting requirements for specific providers, including changes related to the electronic health record incentive program; extensions of the Medicare-dependent, small rural hospital program and the low-volume payment adjustment for hospitals. Final rule. Federal Register 80, no. 158 (August 17): 49325–49886. https://federalregister.gov/a/2015-19049.
Colorado Hospital Association (CHA). 2014. Impact of Medicaid expansion on hospitals: Updated for second-quarter 2014. Greenwood Village, CO: CHA Center for Health Information and Data Analytics. http://www.cha.com/Documents/CHA-Study/FINAL-CHA-Medicaid-Expansion-Study-Q2-Sept-2014.aspx.
Cunningham, P., R. Garfield, and R. Rudowitz. 2015. How are hospitals faring under the Affordable Care Act? Early experiences from Ascension Health. Washington, DC: Kaiser Commission on Medicaid and the Uninsured, Kaiser Family Foundation. http://kff.org/health-reform/issue-brief/how-are-hospitals-faring-under-the-affordable-care-act-early-experiences-from-ascension-health/.
Garfield, R., A. Damico, C. Cox, et al. 2015. New estimates of eligibility for ACA coverage among the uninsured. Washington, DC: Kaiser Family Foundation. http://kff.org/health-reform/issue-brief/new-estimates-of-eligibility-for-aca-coverage-among-the-uninsured/.
Holahan, J., M. Buettgens, and S. Dorn. 2013. The cost of not expanding Medicaid. Washington, DC: Kaiser Commission on Medicaid and the Uninsured, Kaiser Family Foundation. http://kff.org/medicaid/report/the-cost-of-not-expanding-medicaid/.
Kenney, G.M., J. Alker, N. Anderson, et al. 2014. A first look at children’s health insurance coverage under the ACA in 2014. Washington, DC: Urban Institute Health Policy Center and Georgetown University Center for Children and Families. http://hrms.urban.org/briefs/Childrens-Health-Insurance-Coverage-under-the-ACA-in-2014.html.
Neuhausen, K., A.C. Davis, J. Needleman, et al. 2014. Disproportionate-share hospital payment reductions may threaten the financial stability of safety-net hospitals. Health Affairs 33, no. 6: 988–996. http://content.healthaffairs.org/content/33/6/988.abstract.
Nikpay, S., T. Buchmueller, and H. Levy. 2015. Early Medicaid expansion in Connecticut stemmed the growth in hospital uncompensated care. Health Affairs 34, no. 7: 1170–1179. http://content.healthaffairs.org/content/34/7/1170.full.html.
Smith, J., and C. Medalia. 2015. Health insurance coverage in the United States: 2014. Current Population Reports, P60-253. Washington, DC: U.S. Census Bureau. https://www.census.gov/content/dam/Census/library/publications/2015/demo/p60-253.pdf.


CHAPTER 3
Improving Data as the First Step to a More Targeted Disproportionate Share Hospital Policy

February 201640
Chapter 3: Improving Data as the First Step to a More Targeted Disproportionate Share Hospital Policy
Improving Data as the First Step to a More Targeted Disproportionate Share Hospital Policy
Recommendation• The Secretary of the U.S. Department of Health and Human Services should collect and report
hospital-specific data on all types of Medicaid payments for all hospitals that receive them. In addition, the Secretary should collect and report data on the sources of non-federal share necessary to determine net Medicaid payment at the provider level.
Key Points• In the Commission’s view, Medicaid disproportionate share hospital (DSH) payments should
be better targeted to the hospitals that serve a disproportionate share of Medicaid and low-income patients and have higher levels of uncompensated care, consistent with the original statutory intent.
• The scheduled reduction of Medicaid DSH allotments of 16 percent in fiscal year (FY) 2018 and up to 55 percent in FY 2025 makes such targeting particularly important.
• Lack of complete and timely data on Medicaid shortfall creates substantial challenges in considering how to better target payments in the future.
– DSH audits suggest that some hospitals receive Medicaid payments that exceed their costs, but these audits do not include information about provider contributions to the state’s Medicaid share, which could be considered an additional cost, thus reducing net payments.
– Existing data sources do not include complete provider-level data on non-DSH supplemental payments, which are a substantial source of Medicaid revenue for many hospitals.
• In future reports, the Commission will continue to monitor the effects of the Patient Protection and Affordable Care Act (ACA, P.L. 111-148, as amended) on hospitals receiving DSH payments.
• The Commission will also more fully explore potential policy approaches to improving the targeting of federal Medicaid DSH funding, including:
– modifying the criteria for DSH payment eligibility;
– redefining uncompensated care for Medicaid DSH purposes; and
– rebasing states’ DSH allotments.

Report to Congress on Medicaid Disproportionate Share Hospital Payments 41
Chapter 3: Improving Data as the First Step to a More Targeted Disproportionate Share Hospital Policy
CHAPTER 3: Improving Data as the First Step to a More Targeted Disproportionate Share Hospital Policy MACPAC’s analyses find wide variation in the level and distribution of current state DSH allotments, which have little meaningful relationship to measures meant to identify those safety net institutions most in need. In the Commission’s view, Medicaid DSH payments should be better targeted toward the hospitals that serve a disproportionate share of Medicaid and low-income patients and have higher levels of uncompensated care, consistent with the original statutory intent. The scheduled reduction of Medicaid DSH allotments of 16 percent in fiscal year (FY) 2018 and up to 55 percent in FY 2025 makes such targeting particularly important. It also creates an opportunity to do so, as states will need to review their DSH spending in response to the allotment reductions.
The Commission will continue analyzing federal policy approaches to improve the targeting of Medicaid DSH payments in future reports. To this end, we plan to examine several key questions, including:
• Are there better measures to identify states and hospitals that should be targeted for DSH funding?
• To what extent do DSH hospitals receive other supplemental payments from Medicaid, Medicare, and other sources, which may affect their amount of uncompensated care regardless of their low-income utilization?
• To what extent should the source of non-federal share affect the distribution of DSH payments?
• How do DSH payments relate to community benefit expenditures for non-profit hospitals?
• How should DSH payments relate to the adequacy of regular Medicaid payments to hospitals?
• What policy approaches would strike the right balance between providing flexibility to states in designing payment and financing methods and ensuring that limited federal DSH dollars are distributed appropriately?
• What policy approaches would best align with the statutory principles for Medicaid payment policy: efficiency, economy, quality, and access?
Our ability to answer these questions will be affected by the availability of timely and reliable data at the institutional level. Existing data sources have substantial limitations for identifying hospitals with the highest levels of uncompensated care, and particularly their amounts of Medicaid shortfall. Available data are also insufficient for assessing the amount of total Medicaid payments (including all supplemental payments) an institution receives and the extent to which the institution contributes to the state’s Medicaid share.
Because of the importance of these data for developing DSH policy and improving payment transparency and accountability, the Commission recommends that the Secretary of the U.S. Department of Health and Human Services should collect and report hospital-specific data on all types of Medicaid payments for all hospitals that receive them. In addition, the Secretary should collect and report data on the sources of non-federal share necessary to determine net Medicaid payment at the provider level.
February 201642
Chapter 3: Improving Data as the First Step to a More Targeted Disproportionate Share Hospital Policy
We begin this chapter by describing the limitations of current data sources for purposes of analyzing and improving DSH payment policy. We then present the Commission’s rationale for recommending improved federal collection of provider-level Medicaid payment data. We conclude by outlining some topics for future analysis and broad approaches to improving the targeting of Medicaid DSH payments; we intend to develop these ideas in future reports.
Data LimitationsAnalyses of approaches to improve the targeting of Medicaid DSH payments require complete and timely hospital-level financial data, including costs attributable to different patient populations and sources of revenue (e.g., Medicaid, private pay, and other government subsidies). Currently, there are only two national data sources that provide this information. Although they have helped us begin to understand current Medicaid DSH policy and potential policy options for further exploration, it is important to keep in mind the limitations described below to avoid drawing conclusions that may not be fully supported.
Medicaid DSH audit reports States are required to submit to the Centers for Medicare & Medicaid Services (CMS) audited financial reports of all hospitals that receive Medicaid DSH payments. These reports include information about Medicaid patient revenue, supplemental payments, and the costs of care for Medicaid and uninsured patients. Primary limitations include the following:
• Timely data are not available. Data are published about five years after payments are made, and thus may not reflect current DSH payment policies and levels of uncompensated care (e.g., there are no current data from the period following Medicaid expansion in 2014).
• Comparable data are not available for about half of U.S. hospitals. Because DSH audits are limited to hospitals that receive DSH payments, these data are not sufficient to determine the full amount of a state’s uncompensated care or how well a state targets its DSH payments to high-need hospitals.
Medicare cost reports All hospitals that receive Medicare payments (that is, virtually all U.S. hospitals with the exception of some children’s hospitals) are required to submit annual reports on hospital finances, including data on uncompensated care. Primary limitations include the following:
• These data do not describe Medicaid payments in adequate detail. For example, Medicaid DSH payments are not distinguished from other Medicaid revenue, meaning that Medicaid shortfall cannot be determined reliably.
• The definition of uncompensated care in the Medicare cost reports differs from that used for Medicaid DSH payments. Medicare cost reports provide data on charity care and bad debt only, a scope that differs from the uncompensated care measures on Medicaid DSH audits. Further, there are questions about the current reliability of the Medicare cost report uncompensated care data due to outliers and missing data (CMS 2015).
Additionally, neither the Medicare cost report nor the Medicaid DSH audit fully account for the non-federal share of Medicaid payments that is contributed by hospitals themselves, resulting in a potential overstatement of the net amount of Medicaid payments that hospitals receive. Although hospital provider taxes are included in calculations of Medicaid costs, intergovernmental transfers (IGTs) and certified public expenditures (CPEs) are not. The amount of money represented by this absence is significant: in 2012, about two-thirds of DSH payments were financed by non-state

Report to Congress on Medicaid Disproportionate Share Hospital Payments 43
Chapter 3: Improving Data as the First Step to a More Targeted Disproportionate Share Hospital Policy
sources of funding and eight states used non-state funds to finance more than 90 percent of their DSH payments (GAO 2014).
Medicaid shortfallThe most substantial limitation to our ability to analyze Medicaid DSH payments is the lack of complete and timely data on Medicaid shortfall. Because Medicaid shortfall is one of the components of uncompensated care for DSH purposes and because Medicaid shortfall is expected to increase under the Patient Protection and Affordable Care Act (ACA, P.L. 111-148, as amended), the lack of complete and reliable data on Medicaid shortfall is particularly problematic.
Medicaid DSH audit reports, despite their limitations, currently provide the most detailed data on Medicaid shortfall for DSH hospitals. Our
preliminary analysis of 2011 DSH audits found that before DSH payments, DSH hospitals were paid an average of 93 percent of total Medicaid costs, and that after DSH payments, most DSH hospitals received more in total Medicaid payment than their costs (Figure 3-1). This analysis does not account for provider contributions toward the non-federal share, contributions that may reduce net payments. After DSH payments, the Medicaid payment-to-cost ratio for DSH hospitals ranged from 81 percent to 130 percent (in the aggregate, by state). In comparison, the Medicare Payment Advisory Committee (MedPAC) reports that Medicare’s payment-to-cost ratio was 94.6 percent in 2011 after DSH payments (MedPAC 2015). Using a different methodology, the American Hospital Association reports a lower hospital payment-to-cost ratio after DSH payments for both Medicaid (94.7 percent) and Medicare (91.4 percent) in 2011 (AHA 2015).
FIGURE 3-1. Medicaid Payments to DSH Hospitals as a Percentage of Medicaid Costs, SPRY 2011
Lowest paying state:81% of costs
National average:107% of costs
100% of hospitalMedicaid costs
Hightest paying state:130% of costs
Standard Medicaid payments
Non-DSH supplemental payments
DSH payments
69%
7%5%
82%
11%
99%
28%
4%
14%
Notes: DSH is disproportionate share hospital. SPRY is state plan rate year, which often coincides with state fiscal year and may not align with the federal fiscal year. This analysis excludes institutions for mental diseases. Payment levels shown do not account for provider contributions to the non-federal share, contributions that may reduce net payments. Numbers do not sum due to rounding.
Source: MACPAC 2015 analysis of 2011 as-filed Medicaid DSH audit data.

February 201644
Chapter 3: Improving Data as the First Step to a More Targeted Disproportionate Share Hospital Policy
The Commission has previously noted that costs are an imperfect measure of payment adequacy and that cost-based payments may not promote efficiency. Nevertheless, cost is one of the few benchmarks generally available for certain provider types, including hospitals. It is important, however, that cost data be defined consistently across hospitals and available in a standardized format if they are to be useful for payment analyses and future policymaking.
When we compare DSH audit data with Medicare cost report data from the same hospitals (from among a subset of hospitals with complete data from both sources), we find several discrepancies in both Medicaid costs and Medicaid payments (Table 3-1). Both data sources show in the aggregate that DSH hospitals received total Medicaid payments (including DSH payments) that exceeded their costs, resulting in a surplus instead of a shortfall. However, the total amounts of Medicaid costs and Medicaid payments vary widely between the two data sources. Further, neither data source includes information on provider contributions towards the non-federal share, which are necessary to calculate net Medicaid payments. Below, we examine possible explanations for these discrepancies and describe other known limitations in our data with respect to Medicaid shortfall.
Definition of Medicaid costs. As noted above, the definition of Medicaid costs differs between Medicare cost reports and Medicaid DSH audits. Medicare cost reports only include costs for Medicaid-covered services. DSH audits also include unpaid costs for services provided to Medicaid patients when Medicaid was not the primary payer—for example, costs for Medicare-funded services provided to people dually eligible for both Medicaid and Medicare. The inclusion of these as Medicaid costs on DSH audits may help explain why Medicaid costs are higher on DSH audits than on Medicare cost reports.
Reporting of Medicaid payments. Differences in the reporting of Medicaid supplemental payments likely account for the discrepancies in Medicaid payment amounts between the two data sources. In the sample of hospitals with complete data from both forms, regular Medicaid payments reported on DSH audits are 5 percent higher than those reported on Medicare cost reports, but supplemental payments (including DSH) are more than 100 percent higher on DSH audits than on Medicare cost reports. Hospitals are instructed to report Medicaid DSH payments on Medicare cost reports, but these payments are not separately reported from other Medicaid hospital payments. In addition, we know that some
TABLE 3-1. Total Medicaid Shortfall Reported on Medicaid DSH Audits and Medicare Cost Reports for Selected Hospitals, 2011 (billions)
Medicaid DSH audit
Medicare cost report data
Percent difference (cost report data
compared to DSH audit data)
Total Medicaid costs $89.5 $61.8 -31%
Total Medicaid payments, including DSH payments 96.7 80.0 -17
Total Medicaid shortfall after DSH payments (surplus) ($7.2) ($18.2) -153%
Notes: DSH is disproportionate share hospital. Calculations were made based on data from 2,200 hospitals that submitted complete Medicaid DSH audits as well as complete Medicare cost reports, allowing the data for each hospital to be compared across reports (80 percent of DSH hospitals).
Source: MACPAC 2015 analysis of 2011 as-filed Medicaid DSH audits and 2011 Medicare cost reports.

Report to Congress on Medicaid Disproportionate Share Hospital Payments 45
Chapter 3: Improving Data as the First Step to a More Targeted Disproportionate Share Hospital Policy
Medicaid supplemental payments are not reported on DSH audits. These unreported payments include incentive payments to hospitals that are not directly related to services provided, such as Delivery System Reform Incentive Payments (DSRIP), which totaled $6.7 billion in FY 2015 (for more background about DSRIP, see the Commission’s June 2014 report to Congress).
Recently, the U.S. Government Accountability Office (GAO) reviewed Medicaid hospital payments in three states and concluded that limited data and unclear policy on supplemental payments restricted its ability analyze payments to individual hospitals (GAO 2015). In one state analysis, GAO identified $750 million in supplemental payments to three DSH hospitals that were not reported on DSH audits. In another, GAO found that a multihospital system received large non-DSH supplemental payments at one hospital facility and large DSH payments at other hospital facilities. In both cases, they found that DSH payments to these hospitals would have been lower if all Medicaid supplemental payments had been taken into account when determining uncompensated care.
Accounting for sources of non-federal share. Neither Medicaid DSH audits nor Medicare cost reports account for the cost to some hospitals of supplying the non-federal share of DSH payments through IGTs or CPEs. These provider contributions can be substantial and they may reduce the net amount of Medicaid payments that these hospitals receive. In 2012, IGTs and CPEs accounted for 44.6 percent of the non-federal share of DSH payments nationally (GAO 2014). Costs for health care-related taxes also need to be identified. Taxes paid by providers are often included in calculations of Medicaid costs, but they are not separately identified in a way that enables analysis. In 2012, provider taxes accounted for 18.5 percent of the non-federal share of DSH payments nationally (GAO 2014).
Commission Recommendation
Recommendation 3.1The Secretary of the U.S. Department of Health and Human Services should collect and report hospital-specific data on all types of Medicaid payments for all hospitals that receive them. In addition, the Secretary should collect and report data on the sources of non-federal share necessary to determine net Medicaid payment at the provider level.
RationaleThe policy of making special Medicaid payments to hospitals serving a disproportionate share of Medicaid beneficiaries and other low-income patients has been a feature of the Medicaid program since 1981. As the analysis in this report illustrates, DSH allotments are largely based on state spending in 1992, and they have little meaningful relationship with potential measures of need for DSH payments today. Further, apart from the requirement that deemed DSH hospitals receive DSH payments, states are generally not required to target DSH payments in a particular manner. Some states provide DSH payments to virtually all hospitals in their state, while others make DSH payments to just one or two hospitals.
In light of the congressional directive to the Commission to study the relationship of current and future DSH allotments to measures of need, greater transparency in how hospitals are being paid is important to understanding states’ use of Medicaid funds and the extent to which state policies are consistent with federal requirements. Specifically, complete and reliable data regarding all Medicaid payments to hospitals and the sources of the non-federal share of such payments are important for analyzing current policy and for developing more targeted strategies in the future. Given the historical variation in state payment policy and the differences in how states distribute payments

February 201646
Chapter 3: Improving Data as the First Step to a More Targeted Disproportionate Share Hospital Policy
today, provider-level data is needed to understand how different policy approaches would affect not only states but also individual institutions.
Complete data on net Medicaid payments for all providers are important for accurate analyses of the extent to which DSH payments are targeted to providers that serve a disproportionate share of Medicaid and low-income patients and have disproportionate levels of uncompensated care. These data are also important to project the potential effects of policies to improve the targeting of DSH payments. In particular, payment data are needed to calculate Medicaid shortfall, one of the components of uncompensated care that Medicaid DSH covers. Our analysis in this report suggests that Medicaid payments do not necessarily result in a shortfall for all institutions in all states, pointing to the need for better data that can be used to design DSH policy in the future.
This recommendation builds on the Commission’s March 2014 recommendation that the Secretary collect and report non-DSH supplemental payment data. Although CMS has begun collecting some provider-specific data on these payments, these data are not publicly available in a format that enables analysis. Moreover, states are increasingly making other types of supplemental payments to providers through Section 1115 expenditure authority (such as DSRIP and uncompensated care pools), and data about these payments are not being systematically collected.
The Commission recommends the collection of all types of Medicaid payments to capture all direct payments for Medicaid services, under both fee-for-service and managed care, and all supplemental payments that are not directly related to services, including upper payment limit (UPL) and Section 1115 supplemental payments. Such data are needed to provide a complete picture of Medicaid’s current role in supporting safety-net hospitals, a task that is now not possible given substantial variation in state payment policies and methods. Improvements in DSH policy cannot be achieved by considering DSH
payments in isolation. Rather, a full accounting of all Medicaid payments individual hospitals receive is needed to ensure that states are paying these institutions consistent with statutory principles of economy, efficiency, quality, and access.
The Commission has also previously noted that a lack of data on the source of non-federal share for Medicaid payments complicates Medicaid payment analyses. In 47 states and the District of Columbia, some of the non-federal share of Medicaid spending was contributed by local governments and providers in 2012. Such contributions, which are specifically permitted by statute, are particularly important for financing DSH payments. About two-thirds of DSH payments were financed by providers and local governments, and eight states used these funds to finance more than 90 percent of their DSH payments (GAO 2014). Understanding the sources of these funds is important to an overall understanding of Medicaid shortfall because in cases where providers contribute non-federal share, their net payment may be lower than payment data alone indicate. Future policy development must also consider the extent to which the distribution of DSH payments is related to the sources of non-federal share.
This recommendation is consistent with the work of others studying Medicaid payments. Specifically, GAO has also recommended that CMS collect provider-level Medicaid payment data (GAO 2012), as well as provider-level data on the sources of funds used to finance the non-federal share of payments (GAO 2014). GAO’s recommended strategies for collecting non-federal share data included, in the short-term, adding these data to CMS’s current UPL compliance efforts and, in the longer term, collecting them through the Transformed Medicaid Statistical Information System (T-MSIS). In written comments to GAO, CMS agreed with the importance of collecting information on non-DSH supplemental payments, but disagreed with the need to collect facility-level data on non-federal share as well as the recommendation that such data be collected through T-MSIS.

Report to Congress on Medicaid Disproportionate Share Hospital Payments 47
Chapter 3: Improving Data as the First Step to a More Targeted Disproportionate Share Hospital Policy
Considerations for data collectionThe Commission has not recommended specific methods for data collection, recognizing that the need for data must be balanced with the burden of collecting them. However, it makes sense to build upon existing data collection efforts to the extent possible. Further, the Commission recognizes that some payment data (e.g., managed care payments) might be challenging to obtain. If the Secretary does not have the authority to collect certain data, legislation may be needed.
Claims data alone (including data obtained through T-MSIS) may not provide all of the information that the Commission has recommended collecting, particularly the source of non-federal share. Still, collecting complete payment data though T-MSIS could be considered, along with supplementing these data with a separate collection of data to identify sources of non-federal share.
Another option would be to expand DSH audits to include all hospitals that receive Medicaid payments. However, the burden on states and hospitals of conducting full audits and the resulting data lag could be considerable. Further, because the legislation that requires DSH audits and reporting is specific to DSH hospitals, the Secretary may not have statutory authority to extend auditing to other hospitals, perhaps requiring congressional action. Nevertheless, DSH audit reporting could serve as a model for broader payment data collection.
Besides DSH audit data, CMS also collects some non-DSH supplemental payment data through annual reports submitted by states to demonstrate their compliance with the UPL regulations. These reports also include the names of entities providing IGTs or CPEs and the amounts (CMS 2013a). However, these reports are not required to be submitted in a standardized format and, thus far, are not available for analysis outside of CMS. They also do not include data related to Medicaid managed care enrollees because managed care payments are not subject to the UPL.
In January 2014, CMS issued a solicitation seeking assistance in oversight and analysis of DSH payments and state UPL submissions (CMS 2014). Although the solicitation does not indicate plans for making data publicly available, specific tasks include compiling a database of DSH and non-DSH supplemental payment data, analyzing payments at state and provider-specific levels, and assessing the utility of T-MSIS data. We will monitor the status of this effort and its potential to address the issues that we have raised in this report and others.
The Commission is concerned about the lack of both the timeliness of data and the ability to link data with other sources. Given the rapid evolution of the U.S. health care system and frequent changes in state Medicaid payment policy, analyses of Medicaid payment should reflect current conditions to the greatest extent possible. Although it may be difficult to reduce the time lag in DSH audit data because of the amount of time needed to ensure accurate accounting for all costs and associated revenues, there may be ways to make other types of Medicaid payment data (e.g., UPL demonstrations) available in a more timely fashion, especially data that are submitted quarterly or annually.
The ability to link different sources of data for the same providers is useful, especially for analyses of payments, such as DSH payments, that offset uncompensated care costs for Medicaid and uninsured patients. CMS recently required that Medicaid DSH audit data include Medicare provider identification numbers, which help link these data to Medicare cost reports. We are also interested in the ability to link Medicaid data with other sources, such as the community benefit report provided to the Internal Revenue Service (IRS).
Implications of the Commission’s RecommendationFederal spending. In 2014, the Congressional Budget Office estimated that the collection of
February 201648
Chapter 3: Improving Data as the First Step to a More Targeted Disproportionate Share Hospital Policy
non-DSH supplemental payment data would not affect federal Medicaid spending, and we assume that their cost estimates would be similar for this recommendation. Depending on the method of collection, it could result in increased administrative effort in developing reporting standards, making required changes to information technology systems, and making the data publicly available, but these activities are not expected to result in increased spending.
States. Reporting of provider-specific Medicaid payments and non-federal share contributions would likely require some increased administrative effort by states to the extent that payment information may need to be compiled from different data systems. Although most of these data should be available in state systems due to existing federal requirements, previous GAO reports about efforts to compile state data on hospital payments noted the challenge of matching records at the provider level (GAO 2015). Moreover, while states that already collect DSH audit data for most hospitals in their state are experienced in reporting hospital-level Medicaid payment data, those with smaller DSH programs would likely face more administrative burdens.
Providers and enrollees. State reporting of provider-level payment and non-federal share data would not have a direct effect on Medicaid payments to providers. Over time, however, increased transparency could lead to modifications in state payment methodologies including state DSH payments.
Next StepsThis is the first of the Commission’s annual reports on Medicaid DSH policy. (Future reports will be included within our annual March report to Congress.) In future reports, the Commission will not only continue to monitor the distribution of DSH payments across states and hospitals, but will also work to understand how changes
brought about by the ACA are affecting safety-net institutions. In addition, notwithstanding the limitations of currently available Medicaid payment data, the Commission will explore additional work that can be done using current data sources to better understand the role of DSH payments and other sources of financial support to hospitals. The Commission will also more fully explore potential policy approaches to improving the targeting of federal Medicaid DSH funding.
Data explorationThe Commission will explore opportunities to link the hospital-specific data from Medicaid DSH audits and Medicare cost reports with other available sources of hospital data. Reconciling Medicaid DSH data with other data sources will help us better understand whether uncompensated care costs are being reported consistently and whether hospitals are receiving other types of payments for uncompensated care that are not being captured on Medicaid DSH audits.
Community benefit reporting. While only about half of DSH hospitals are non-profit hospitals, community benefit spending data can be linked to DSH audit data to better understand uncompensated care for these hospitals. The IRS requires non-profit hospitals to report their community benefit spending to maintain their non-profit status, and these data are publicly available. These reports include information on Medicaid shortfall and hospital charity care policies (IRS 2014). In 2011, Medicaid shortfall was the single largest category of community benefit expenditures that non-profit hospitals reported (IRS 2015).
Other sources of direct and indirect support for uncompensated care. Medicare cost reports provide hospital-specific information about Medicare DSH payments and other additional Medicare payments that hospitals receive, and MACPAC will use these data to better understand the relationship between Medicare and Medicaid DSH payments. As discussed in

Report to Congress on Medicaid Disproportionate Share Hospital Payments 49
Chapter 3: Improving Data as the First Step to a More Targeted Disproportionate Share Hospital Policy
Chapter 1, Medicare DSH payments are one of the largest direct federal payments for hospital uncompensated care, totaling approximately $12.1 billion in 2013.
The Commission is still exploring the availability of hospital-specific data on 340b funding, which is a large indirect source of support for hospitals. The 340b drug program is overseen by the Health Resources and Services Administration (HRSA) but the drug rebates are administered by drug manufacturers, so it is difficult to obtain data on drug rebates at the hospital level. However, HRSA does provide information about which hospitals are eligible for 340b funding, which can potentially be combined with claims data on drug spending at these hospitals to estimate the amount of drug rebates that hospitals receive.
Costs and utilization for dually eligible beneficiaries. The Commission also plans to examine available data about individuals dually eligible for Medicaid and Medicare to better understand the effect of these individuals on our estimates of Medicaid utilization and costs. Accurate data on Medicaid inpatient utilization are particularly important because it is one of the qualifying criteria for deemed DSH hospitals. In 2014, CMS began requiring states to report state-level Medicaid inpatient utilization rates according to Medicaid DSH definitions, but with the delay in implementing DSH allotment reductions, few states have begun reporting these data (CMS 2013b).
As discussed earlier in this chapter, Medicare cost reports and Medicaid DSH audits differ in their treatment of costs and utilization for Medicaid enrollees when Medicaid is not the primary payer. This difference affects reporting of costs and revenue related to services provided to dually eligible beneficiaries, who accounted for 15 percent of Medicaid enrollment and 34 percent of Medicaid spending in 2010 (MACPAC and MedPAC 2015). Medicaid DSH audits include all services provided to Medicaid enrollees, including inpatient services for dually eligible beneficiaries that are
paid for by Medicare, but Medicare cost reports classify costs and utilization based on the primary payer for the service.
Essential community services. The Commission will continue to explore available data to identify hospitals that provide access to essential community services. As discussed in Chapter 2, there is no statutory definition of essential community services and there are few data sources that provide national data on the specific services that hospitals provide. For example, in preparing this report, we were unable to identify hospitals that provide primary care or public health services because these services were not separately identifiable on Medicare cost reports or the American Hospital Association annual survey. MACPAC is exploring the use of Medicaid claims and encounter data to gain insight into the types of services—particularly primary care and public health services—that enrollees use at DSH hospitals.
Policy design explorationExisting federal parameters for defining state allotments and making DSH payments provide a starting point for thinking about federal approaches to improve the targeting of DSH payments. Potential changes to federal statute that the Commission intends to consider include modifying the criteria for DSH payment eligibility, redefining uncompensated care for Medicaid DSH payment purposes, and rebasing state DSH allotments. The Commission is also reviewing other past proposals to improve Medicaid DSH policy (Box 3-1).
Modifying provider eligibility standards. By statute, the minimum qualifying criteria for hospitals receiving DSH payments is a Medicaid inpatient utilization rate of 1 percent, a standard that nearly all U.S. hospitals currently meet. This eligibility threshold could be increased to better target DSH payments to hospitals that serve more Medicaid or low-income patients. Examples of other thresholds to consider include basing eligibility on the average Medicaid inpatient utilization of all providers in

February 201650
Chapter 3: Improving Data as the First Step to a More Targeted Disproportionate Share Hospital Policy
a state or on one standard deviation above the average (which is the current threshold used to determine deemed DSH hospitals which must receive DSH payments). In addition, low-income utilization rates, which also account for care for the uninsured, could be factored into the determination of provider eligibility for DSH payments.
Raising the provider eligibility threshold would primarily affect hospitals with lower levels of
Medicaid or low-income utilization that currently receive DSH payments. In 2011, about 17 percent of DSH payments went to hospitals with Medicaid inpatient utilization rates at or below the 50th percentile, and about 27 percent of DSH payments were made to hospitals with low-income utilization rates at or below the 50th percentile.
Redefining eligible uncompensated care costs. Under current law, DSH payments to hospitals
BOX 3-1. Prior Federal Reports on Medicaid Disproportionate Share Hospital (DSH) Policy
On at least two occasions, federal policy advisors have published reports on Medicaid disproportionate share hospital (DSH) policy, highlighting many of the same issues that we raise here.
In the early 1990s, when Medicaid DSH allotments were first established, Congress required the Prospective Payment Assessment Commission (ProPAC), one of the precursor commissions to the Medicare Payment Advisory Commission (MedPAC), to review the criteria used in designating Medicaid DSH hospitals (P.L. 102-234). ProPAC’s report, issued in 1994, examined state DSH spending and the role of Medicaid DSH payments on hospital financial status, and it raised many of the same issues we raise in this report (ProPAC 1994). The report recommended that DSH payments should not exceed 12 percent of state Medicaid spending (which is now current law) and also made four recommendations that have not been implemented:
• establish a uniform designation of Medicaid DSH hospitals based on the proportion of care that hospitals provide to Medicaid enrollees and other persons unable to pay for their care;
• set minimum and maximum DSH payment adjustments related to a hospital’s uncompensated care;
• apply separate criteria for different hospital types (e.g., teaching, psychiatric, or children’s hospitals); and
• set aside 10 percent of DSH spending for primary care services that could promote access for Medicaid enrollees and the uninsured.
In 2002, the U.S. Department of Health and Human Services Assistant Secretary for Planning and Evaluation contracted with researchers from RAND and the Urban Institute to analyze the distribution of DSH payments in both Medicaid and Medicare (Wynn et al. 2002). This report did not make any recommendations, but it analyzed several alternative DSH allocation policies, including joint distribution of Medicare and Medicaid DSH payments and distribution policies based on low-income volume or uncompensated care. The report also suggested that a national database with data on each hospital’s uncompensated care and shortfalls from Medicaid and local indigent care programs would be needed to understand the potential effects of alternative allocation policies. It also highlighted the need for data on sources of non-federal share.

Report to Congress on Medicaid Disproportionate Share Hospital Payments 51
Chapter 3: Improving Data as the First Step to a More Targeted Disproportionate Share Hospital Policy
cannot exceed their uncompensated care costs, which are defined for Medicaid DSH purposes as the sum of Medicaid shortfall and unpaid costs of care for the uninsured. This definition could be narrowed by excluding particular components, such as Medicaid shortfall, or it could be expanded by adding additional components, such as bad debt for insured individuals or physician services that hospitals provide.
Changing the definition of uncompensated care for Medicaid DSH purposes would change the maximum amount of DSH funding that a hospital could receive, and thus would primarily affect hospitals that are already at their hospital-specific DSH limit. In 2011, 6 percent of DSH hospitals received DSH payments that were equal to 90 percent or more of their hospital-specific limit.
Rebasing state DSH allotments. Current DSH allotments, based on historical spending from 1992, vary widely by state and bear little relationship to objective measures of need. To smooth this state-by-state variation, Congress could rebase DSH allotments according to objective criteria, such as the number of uninsured people or the levels of uncompensated care of high-need hospitals in a state.
For an incremental approach, Congress could incorporate rebased DSH allotments into the formula for pending DSH allotment reductions. However, the current schedule of DSH allotment reductions reduces DSH allotments by more than half by FY 2025, so before taking this approach, the size of pending DSH allotment reductions should be considered.
ReferencesAmerican Hospital Association (AHA). 2015. Chapter 4: Trends in hospital financing. In Trends affecting hospitals and health systems. Washington, DC: AHA. http://www.aha.org/research/reports/tw/chartbook/ch4.shtml.
Centers for Medicare & Medicaid Services (CMS), U.S. Department of Health and Human Services. 2015. Medicare program; Hospital inpatient prospective payment systems for acute care hospitals and the long-term care hospital prospective payment system policy changes and fiscal year 2016 rates; revisions of quality reporting requirements for specific providers, including changes related to the electronic health record incentive program; extensions of the Medicare-dependent, small rural hospital program and the low-volume payment adjustment for hospitals. Final rule. Federal Register 80, no. 158 (August 17): 49325–49886. https://federalregister.gov/a/2015-19049.
Centers for Medicare & Medicaid Services (CMS), U.S. Department of Health and Human Services. 2014. Solicitation no. APP140426 regarding “Medicaid upper payment limit and disproportionate share hospital demonstration.” January 23, 2014.
Centers for Medicare & Medicaid Services (CMS), U.S. Department of Health and Human Services. 2013a. Letter from Cindy Mann to state Medicaid directors regarding “Federal and state oversight of Medicaid expenditures.” March 18, 2013. http://www.medicaid.gov/Federal-Policy-Guidance/Downloads/SMD-13-003-02.pdf.
Centers for Medicare & Medicaid Services (CMS), U.S. Department of Health and Human Services. 2013b. Medicaid program: State disproportionate share hospital allotment reductions. Final rule. Federal Register 78, no. 181 (September 18): 57293–57313. https://federalregister.gov/a/2013-22686.
Medicaid and CHIP Payment and Access Commission (MACPAC) and Medicare Payment Advisory Commission (MedPAC). 2015. Databook: Beneficiaries dually eligible for Medicare and Medicaid. January 2015. Washington, DC: MACPAC and MedPAC. http://www.medpac.gov/documents/data-book/january-2015-medpac-and-macpac-data-book-beneficiaries-dually-eligible-for-medicare-and-medicaid.pdf?sfvrsn=2.

February 201652
Chapter 3: Improving Data as the First Step to a More Targeted Disproportionate Share Hospital Policy
Medicare Payment Advisory Commission (MedPAC). 2015. Databook: Health care spending and the Medicare program. June 2015. Washington, DC: MedPAC. http://www.medpac.gov/documents/data-book/june-2015-databook-health-care-spending-and-the-medicare-program.pdf.
Prospective Payment Assessment Commission (ProPAC). 1994. Analysis of Medicaid disproportionate share payment adjustments. Congressional Report C-94-01.
U.S. Government Accountability Office (GAO). 2015. CMS oversight of provider payments is hampered by limited data and unclear policy. Report no. GAO-15-322. Washington, DC: GAO. http://www.gao.gov/products/GAO-15-322.
U.S. Government Accountability Office (GAO). 2014. States’ increased reliance on funds from health care providers and local governments warrants improved CMS data collection. Report no. GAO-14-627. Washington, DC: GAO. http://www.gao.gov/products/GAO-14-627.
U.S. Government Accountability Office (GAO). 2012. More transparency of and accountability for supplemental payments are needed. Report no. GAO-13-48. Washington, DC: GAO. http://www.gao.gov/products/GAO-13-48.
U.S. Internal Revenue Service (IRS), U.S. Department of the Treasury. 2015. Report to Congress on private tax-exempt, taxable, and government-owned hospitals. Washington, DC: IRS.
U.S. Internal Revenue Service (IRS), U.S. Department of the Treasury. 2014. Instructions for Schedule H (Form 990). https://www.irs.gov/pub/irs-pdf/i990sh.pdf.
Wynn, B, T. Coughlin, S. Bondarenko, and B. Bruen. 2002. Analysis of the joint distribution of disproportionate share hospital payments. Project memorandum PM-1387-ASPE to the Assistant Secretary of Planning and Evaluation, U.S. Department of Health and Human Services. September 20, 2002. Washington, DC: RAND. http://aspe.hhs.gov/health/Reports/02/DSH/index.htm.

APPENDIX A
History of Key Legislation


Report to Congress on Medicaid Disproportionate Share Hospital Payments 55
APPENDIX A: History of Key Legislation
APPENDIX A: History of Key LegislationTABLE A-1. Timeline of Key Legislation Affecting Medicaid Disproportionate Share Hospital (DSH)
Payment Policy
Year Key legislation and highlights
1980
The Omnibus Budget Reconciliation Act of 1980 (P.L. 96-499):• removes the requirement to pay nursing facilities according to Medicare cost principles; and• requires payments to be reasonable and adequate to meet the costs of efficiently and economically
operated facilities.The Medicaid payment provisions of this law are commonly referred to as the Boren amendment.
1981
The Omnibus Budget Reconciliation Act of 1981 (P.L. 97-35): • expands the Boren Amendment to hospitals, removing the requirement to pay them according to
Medicare cost principles; • removes the reasonable charges limitation from Section 1902(A)(30)(A) of the Social Security Act
(the Act);• requires states to take into account the situation of hospitals that serve a disproportionate share of
low-income patients with special needs when setting Medicaid provider payment rates for inpatient services; and
• adds Section 1923 to the Act.
1985
The Consolidated Omnibus Budget Reconciliation Act of 1985 (P.L. 99-272):• requires the Secretary of the U.S. Department of Health and Human Services (the Secretary) to
submit a report to Congress that describes the methodology states use for making DSH payments, identifies the hospitals that receive DSH payments, and specifies the number of inpatient days attributable to low-income and Medicaid-enrolled patients at those hospitals.
1986
The Omnibus Budget Reconciliation Act of 1986 (P.L. 99-509):• clarifies that the upper payment limit on Medicaid inpatient hospital payments cannot be applied to
DSH payments; and• provides explicit permission for unlimited Medicaid DSH payments.
1987
The Omnibus Budget Reconciliation Act of 1987 (P.L. 100-203):• requires states to submit state plan amendments authorizing Medicaid DSH payments; • permits two methods for distributing DSH payments: the Medicare DSH methodology or a
proportional adjustment based on a hospital’s Medicaid inpatient utilization rate; • establishes minimum obstetrics requirements for hospitals that receive DSH patients; and • requires states to make DSH payments to hospitals that have a low-income utilization rate of at least
25 percent or a Medicaid inpatient utilization rate of at least one standard deviation above the mean (so called deemed DSH hospitals).
1990
The Omnibus Budget Reconciliation Act of 1990 (P.L. 101-508):• provides two additional methods for states to use to target DSH payments: proportionational
adjustments based on a hospital’s low-income utilization rate or separate, state-defined payment methodologies for different types of hospitals; and
• prohibits the Centers for Medicare & Medicaid Services (CMS) from imposing additional limits on Medicaid payments financed by voluntary contributions and provider-specific taxes.

February 201656
APPENDIX A: History of Key Legislation
Year Key legislation and highlights
1991
The Medicaid Voluntary Contribution and Provider-Specific Tax Amendments of 1991 (P.L. 102-234):• places restrictions on providers’ voluntary contributions and health care-related taxes; and • enacts a national and state-specific Medicaid DSH payment ceiling at 12 percent of each state’s
Medicaid expenditures, and freezes the dollar amounts for states whose Medicaid DSH spending is greater than 12 percent.
1993
The Omnibus Budget Reconciliation Act of 1993 (P.L. 103-66): • imposes hospital-specific limits on Medicaid DSH payments equal to the actual cost of uncompensated
care for hospital services provided to Medicaid enrollees and uninsured individuals; and • requires hospitals to have at least a 1 percent Medicaid inpatient utilization rate in order to receive
DSH payments.
1997
The Balanced Budget Act of 1997 (P.L. 105-33):• requires states to report the names of all hospitals receiving Medicaid DSH payments and the
amount they receive; • decreases Medicaid DSH allotments for fiscal year (FY) 1998 to FY 2002 and limits increases in future
allotments to the percent change in the Consumer Price Index for All Urban Consumers (CPI-U); • limits Medicaid DSH payments made to institutions for mental diseases and other mental health facilities; • requires that Medicaid DSH payments be made directly to hospitals, meaning that they cannot be
included in managed care capitation rates; and • permits California to make Medicaid DSH payments up to 175 percent of its public hospitals’
uncompensated care costs.
1999
The Consolidated Appropriations Act of 1999 (P.L. 106-113):• increases Medicaid DSH allotments for FYs 2000–2002 for Washington, DC, Minnesota, New Mexico,
and Wyoming; and• clarifies that the enhanced federal matching rate for the State Children’s Health Insurance Program
(CHIP) does not apply to Medicaid DSH payments.
2000
The Medicare, Medicaid, and SCHIP Benefits Improvement and Protection Act of 2000 (P.L. 106-554): • eliminates Medicaid DSH reductions in the BBA for FY 2001 and FY 2002 for all states, continuing
allotments at the FY 2000 level;• increases Medicaid DSH allotments for FY 2001, FY 2002, and future years by the percent change in
the CPI-U, provided that these allotments do not exceed the 12 percent threshold; • brings the allotments of so-called extremely-low-DSH states up to 1 percent of their Medicaid
medical assistance expenditures for FY 2001, and increases allotments by the percent change in the CPI-U for FY 2002, with subsequent increases on the same basis for future years;
• permits all states to make Medicaid DSH payments of up to 175 percent of their public hospitals’ uncompensated care for FYs 2002–2003; and
• includes Medicaid managed care days in the Medicaid inpatient utilization rate and Medicaid managed care payments in the low-income utilization rate.
2003
The Medicare Prescription Drug, Improvement, and Modernization Act of 2003 (P.L. 108-173):• exempts FY 2002 DSH allotments from the 12 percent rule; • provides a 16 percent increase in Medicaid DSH allotments for high-DSH states for FY 2004 and
limits subsequent allotments to the greater of the 2004 allotment or the prior year allotment plus the percentage growth in CPI-U;
• provides a 16 percent annual increase in Medicaid DSH allotments for low-DSH states for FYs 2004–2008; and
• requires states to annually report each facility that received a Medicaid DSH payment and obtain an independent certified audit of their DSH programs to verify that they satisfy the hospital-specific limits.
TABLE A-1. (continued)

Report to Congress on Medicaid Disproportionate Share Hospital Payments 57
APPENDIX A: History of Key Legislation
Year Key legislation and highlights
2005
The Deficit Reduction Act of 2005 (P.L. 109-171):• increases fixed DSH allotments for the District of Columbia for FYs 2000–2002 from $32 million to
$49 million for the purposes of raising its allotment for FY 2006; and • has the practical impact of raising the District of Columbia’s FY 2006 allotment to $57.5 million (a
$20 million increase over what the allotment would have been without the law).
2006 The Tax Relief and Health Care Act of 2006 (P.L. 109-432):• establishes Medicaid DSH allotments for Tennessee and Hawaii.
2009 The Children’s Health Insurance Program Reauthorization Act of 2009 (P.L. 111-3):• extends the Tennessee and Hawaii Medicaid DSH allotments through December 2012.
2009
The American Recovery and Reinvestment Act of 2009 (P.L. 111-5):• increases Medicaid DSH allotments for FY 2009 to 102.5 percent of what they would have been
without the law; and • increases allotments for FY 2010 to 102.5 percent of the FY 2009 allotments.
2010The Patient Protection and Affordable Care Act (ACA, P.L. 111-148, as amended):
• requires the Secretary to make aggregate reductions in Medicaid DSH allotments from FY 2014 to FY 2020.
2012 The Middle Class Tax Relief and Job Creation Act of 2012 (P.L. 112-96):• extends reductions to FY 2021.
2013 The American Taxpayer Relief Act of 2012 (P.L. 112-240):• extends reductions to FY 2022.
2014
The Bipartisan Budget Act of 2013 (P.L. 113-67):• delays the onset of reductions until 2016 by eliminating the 2014 reduction and adding the 2015
reduction to the 2016 reduction; and • extends reductions to FY 2023.
2014
The Protecting Access to Medicare Act of 2014 (P.L. 113-93):• eliminates the FY 2016 reduction, delaying the reductions until FY 2017; • adjusts the amount of the reductions and extends them to FY 2024; and• requires MACPAC to submit an annual report to Congress on Medicaid DSH allotments.
2015The Medicare Access and CHIP Reauthorization Act of 2015 (P.L. 114-10):
• eliminates the FY 2017 reduction, delaying the reductions until FY 2018; and • adjusts the amount of the reductions and extends them to FY 2025.
Sources: Mitchell 2012, Frizerra 2009, ProPAC 1994.
ReferencesFrizzera, J., Health Management Associates. 2009. History of the Medicaid Disproportionate Share Hospital (DSH) Program 1981–2009. June 19, 2009. http://www.nhpf.org/library/handouts/Frizzera.slides_06-19-09.pdf.
Mitchell, A. 2012. Medicaid disproportionate share hospital payments. Report no. R42865. Washington DC: Congressional Research Service. http://www.fas.org/sgp/crs/misc/R42865.pdf.
Prospective Payment Assessment Commission (ProPAC). 1994. Analysis of Medicaid disproportionate share payment adjustments. Washington, DC: Congressional report C-94-01.
TABLE A-1. (continued)


APPENDIX B
State-Level Data


Report to Congress on Medicaid Disproportionate Share Hospital Payments 61
Appendix B: State-Level Data
APPENDIX B: State-Level DataTABLE B-1. Current and Projected State DSH Allotments, FYs 2016–2017 (millions)
StateFiscal year 2016 Fiscal year 2017
Total Federal State Total Federal StateTotal $ 21,186.9 $ 11,909.9 $ 9,277.1 $ 21,520 $ 12,096.1 $ 9,423.8Alabama 478.3 334.2 144.1 486.4 339.9 146.6Alaska 44.3 22.1 22.1 45.0 22.5 22.5Arizona 159.7 110.0 49.6 162.4 111.9 50.5Arkansas 67.0 46.9 20.1 68.1 47.7 20.4California 2,382.8 1,191.4 1,191.4 2,423.3 1,211.6 1,211.6Colorado 198.2 100.5 97.7 201.6 102.2 99.3Connecticut 434.7 217.4 217.4 442.1 221.1 221.1Delaware 17.9 9.8 8.1 18.2 10.0 8.2District of Columbia 95.1 66.6 28.5 96.7 67.7 29.0Florida 358.3 217.4 140.9 364.4 221.1 143.3Georgia 432.4 292.1 140.3 439.7 297.0 142.7Hawaii 19.6 10.6 9.0 20.0 10.8 9.2Idaho 25.1 17.9 7.2 25.5 18.2 7.3Illinois 459.1 233.7 225.5 467.0 237.6 229.3Indiana 348.8 232.3 116.5 354.7 236.2 118.5Iowa 77.9 42.8 35.1 79.3 43.5 35.7Kansas 80.1 44.8 35.3 81.5 45.6 35.9Kentucky 224.1 157.6 66.5 227.9 160.3 67.6Louisiana 1,176.6 732.0 444.6 1,176.6 732.0 444.6Maine 182.1 114.1 68.0 185.2 116.1 69.1Maryland 165.7 82.9 82.9 168.6 84.3 84.3Massachusetts 662.9 331.5 331.5 674.2 337.1 337.1Michigan 439.0 288.0 151.0 446.5 292.9 153.6Minnesota 162.3 81.2 81.2 165.1 82.6 82.6Mississippi 223.5 165.7 57.7 227.3 168.6 58.7Missouri 813.6 514.9 298.8 827.5 523.6 303.8Montana 18.9 12.3 6.6 19.2 12.5 6.7Nebraska 60.1 30.8 29.4 61.1 31.3 29.9Nevada 77.4 50.3 27.1 78.7 51.1 27.6New Hampshire 341.5 170.7 170.7 341.5 170.7 170.7New Jersey 1,399.2 699.6 699.6 1,423.0 711.5 711.5New Mexico 31.5 22.1 9.3 32.0 22.5 9.5New York 3,491.3 1,745.6 1,745.6 3,550.6 1,775.3 1,775.3North Carolina 484.0 320.6 163.4 492.2 326.1 166.2North Dakota 20.8 10.4 10.4 21.1 10.6 10.6

February 201662
Appendix B: State-Level Data
StateFiscal year 2016 Fiscal year 2017
Total Federal State Total Federal StateOhio $ 706.7 $ 441.5 $ 265.2 $ 718.8 $ 449.0 $ 269.8Oklahoma 64.5 39.4 25.2 65.6 40.0 25.6Oregon 76.4 49.2 27.2 77.7 50.0 27.7Pennsylvania 1,172.8 610.0 562.8 1192.7 620.3 572.4Rhode Island 140.1 70.6 69.5 142.5 71.8 70.6South Carolina 500.7 355.9 144.8 509.2 362.0 147.3South Dakota 23.3 12.0 11.3 23.7 12.2 11.4Tennessee 81.6 53.1 28.5 81.6 53.1 28.5Texas 1,819.1 1,039.2 779.8 1,850.0 1,056.9 793.1Utah 30.4 21.3 9.0 30.9 21.7 9.2Vermont 45.4 24.5 20.9 46.1 24.9 21.3Virginia 190.4 95.2 95.2 193.7 96.8 96.8Washington 402.1 201.1 201.1 408.9 204.5 204.5West Virginia 102.7 73.4 29.4 104.5 74.6 29.9Wisconsin 176.4 102.7 73.7 179.4 104.5 74.9Wyoming 0.5 0.2 0.2 0.5 0.3 0.3
Notes: DSH is disproportionate share hospital. FY is fiscal year.
Source: Dobson DaVanzo & Associates and KNG Health 2015 analysis for MACPAC of preliminary FY 2016 DSH allotments and Congressional Budget Office projections of the Consumer Price Index for All Urban Consumers (CPI-U).
TABLE B-1. (continued)

Report to Congress on Medicaid Disproportionate Share Hospital Payments 63
Appendix B: State-Level DataTA
BLE
B-2.
Pro
ject
ed F
Y 20
18 D
SH A
llotm
ents
und
er V
ario
us R
educ
tion
Scen
ario
s (m
illio
ns)
Stat
e
Unr
educ
ed a
llotm
ent
Redu
ced
allo
tmen
t (s
tatu
s qu
o)Re
duce
d al
lotm
ent
(Med
icai
d ex
pans
ion
scen
ario
)
Tota
lFe
dera
lSt
ate
Tota
lFe
dera
lSt
ate
Perc
ent
chan
geTo
tal
Fede
ral
Stat
ePe
rcen
t ch
ange
Tota
l$ 2
2,00
5.2
$ 12,
369.
2$
9,63
6$ 1
8,42
9.6
$ 10,
369.
2$
8,06
0.4
-16.
2%$ 1
8,45
5.3
$ 10,
369.
2$
8,08
6.1
-16.
1%Al
abam
a49
7.6
347.
714
9.9
413.
028
8.6
124.
4-1
739
7.4
277.
711
9.7
-20
Alas
ka46
.123
.023
.044
.122
.022
.0-4
44.0
22.0
22.0
-5Ar
izon
a16
6.1
114.
551
.614
4.3
99.4
44.8
-13
146.
110
0.7
45.4
-12
Arka
nsas
69.7
48.8
20.9
63.4
44.4
19.0
-963
.344
.319
.0-9
Calif
orni
a2,
479.
01,
239.
51,
239.
52,
157.
81,
078.
91,
078.
9-1
32,
186.
01,
093.
01,
093.
0-1
2Co
lora
do20
6.2
104.
610
1.6
159.
180
.778
.4-2
316
0.8
81.6
79.2
-22
Conn
ectic
ut45
2.3
226.
122
6.1
340.
417
0.2
170.
2-2
534
4.0
172.
017
2.0
-24
Dela
war
e18
.710
.28.
417
.89.
78.
0-5
17.8
9.7
8.0
-5Di
stric
t of C
olum
bia
98.9
69.3
29.7
76.7
53.7
23.0
-22
77.7
54.4
23.3
-21
Flor
ida
372.
722
6.1
146.
630
8.7
187.
312
1.4
-17
307.
418
6.5
120.
9-1
8G
eorg
ia44
9.8
303.
914
6.0
349.
423
6.0
113.
4-2
234
6.8
234.
311
2.6
-23
Haw
aii
20.4
11.0
9.4
18.5
10.0
8.5
-918
.510
.08.
5-9
Idah
o26
.118
.67.
525
.318
.07.
3-3
25.2
18.0
7.3
-3Ill
inoi
s47
7.7
243.
123
4.6
435.
222
1.5
213.
7-9
436.
122
1.9
214.
2-9
Indi
ana
362.
924
1.7
121.
234
5.5
230.
111
5.4
-534
1.2
227.
311
4.0
-6Io
wa
81.1
44.5
36.6
77.0
42.3
34.7
-577
.642
.635
.0-4
Kans
as83
.346
.636
.765
.336
.528
.8-2
265
.236
.528
.7-2
2Ke
ntuc
ky23
3.1
163.
969
.218
3.6
129.
154
.5-2
118
5.2
130.
355
.0-2
1Lo
uisi
ana
1,20
3.7
748.
845
4.9
1,09
9.3
683.
841
5.4
-91,
079.
167
1.3
407.
8-1
0M
aine
189.
411
8.7
70.7
173.
410
8.7
64.7
-817
0.1
106.
663
.5-1
0M
aryl
and
172.
486
.286
.213
5.3
67.7
67.7
-22
137.
068
.568
.5-2
1M
assa
chus
etts
689.
734
4.9
344.
955
8.7
279.
427
9.4
-19
597.
329
8.7
298.
7-1
3M
ichi
gan
456.
829
9.6
157.
133
0.3
216.
711
3.6
-28
333.
021
8.5
114.
6-2
7M
inne
sota
168.
984
.484
.416
2.0
81.0
81.0
-416
2.8
81.4
81.4
-4M
issi
ssip
pi23
2.5
172.
460
.020
0.1
148.
451
.7-1
419
7.1
146.
250
.9-1
5M
isso
uri
846.
553
5.7
310.
868
0.5
430.
624
9.9
-20
661.
841
8.8
243.
0-2
2M
onta
na19
.712
.86.
818
.412
.06.
4-6
18.4
12.0
6.4
-7N
ebra
ska
62.5
32.0
30.5
59.5
30.4
29.0
-559
.330
.429
.0-5

February 201664
Appendix B: State-Level Data
Stat
e
Unr
educ
ed a
llotm
ent
Redu
ced
allo
tmen
t (s
tatu
s qu
o)Re
duce
d al
lotm
ent
(Med
icai
d ex
pans
ion
scen
ario
)
Tota
lFe
dera
lSt
ate
Tota
lFe
dera
lSt
ate
Perc
ent
chan
geTo
tal
Fede
ral
Stat
ePe
rcen
t ch
ange
Nev
ada
$ 80
.5$
52.3
$ 28
.2$
76.8
$ 49
.9$
26.9
-5%
$ 77
.4$
50.2
$ 27
.1-4
%N
ew H
amps
hire
341.
517
0.7
170.
731
4.4
157.
215
7.2
-831
3.0
156.
515
6.5
-8N
ew J
erse
y1,
455.
872
7.9
727.
91,
093.
354
6.6
546.
6-2
51,
095.
754
7.9
547.
9-2
5N
ew M
exic
o32
.723
.09.
732
.222
.79.
6-1
32.2
22.7
9.5
-2N
ew Y
ork
3,63
2.3
1,81
6.2
1,81
6.2
2,96
0.5
1,48
0.3
1,48
0.3
-18
3,00
0.9
1,50
0.4
1,50
0.4
-17
Nor
th C
arol
ina
503.
533
3.6
170.
041
0.7
272.
113
8.7
-18
410.
827
2.1
138.
7-1
8N
orth
Dak
ota
21.6
10.8
10.8
21.1
10.6
10.6
-221
.110
.610
.6-2
Ohi
o73
5.3
459.
327
6.0
550.
634
4.0
206.
6-2
553
9.5
337.
020
2.5
-27
Okl
ahom
a67
.140
.926
.263
.538
.724
.8-5
63.4
38.6
24.7
-6O
rego
n79
.551
.228
.372
.446
.625
.8-9
72.5
46.7
25.8
-9Pe
nnsy
lvan
ia1,
220.
163
4.6
585.
595
1.7
495.
045
6.7
-22
936.
648
7.1
449.
5-2
3Rh
ode
Isla
nd14
5.8
73.5
72.3
91.7
46.3
45.5
-37
94.3
47.5
46.8
-35
Sout
h Ca
rolin
a52
1.0
370.
315
0.7
413.
429
3.8
119.
5-2
140
8.6
290.
411
8.2
-22
Sout
h Da
kota
24.2
12.5
11.7
23.8
12.3
11.5
-223
.712
.311
.5-2
Tenn
esse
e81
.653
.128
.568
.044
.323
.8-1
766
.943
.523
.4-1
8Te
xas
1,89
2.5
1,08
1.2
811.
31,
818.
61,
039.
077
9.6
-41,
810.
41,
034.
377
6.1
-4U
tah
31.6
22.2
9.4
28.8
20.3
8.6
-928
.720
.28.
6-9
Verm
ont
47.2
25.4
21.8
31.5
17.0
14.5
-33
32.7
17.6
15.1
-31
Virg
inia
198.
199
.199
.116
1.7
80.8
80.8
-18
159.
979
.979
.9-1
9W
ashi
ngto
n41
8.4
209.
220
9.2
333.
516
6.7
166.
7-2
034
3.9
172.
017
2.0
-18
Wes
t Virg
inia
106.
976
.330
.588
.263
.025
.2-1
786
.962
.024
.8-1
9W
isco
nsin
183.
610
6.9
76.7
180.
010
4.8
75.2
-217
9.5
104.
575
.0-2
Wyo
min
g0.
50.
30.
30.
50.
20.
2-5
0.5
0.2
0.2
-5
Not
es: F
Y is
fisc
al y
ear.
DSH
is d
ispr
opor
tiona
te s
hare
hos
pita
l. U
nred
uced
allo
tmen
ts fo
r 201
8 ar
e pr
ojec
ted
from
pre
limin
ary
2016
allo
tmen
ts p
rovi
ded
by th
e Ce
nter
s fo
r M
edic
are
& M
edic
aid
Serv
ices
(CM
S) a
nd u
sing
fisc
al y
ear C
onsu
mer
Pric
e In
dex
for A
ll U
rban
Con
sum
ers
(CPI
-U) p
roje
ctio
ns fr
om th
e Co
ngre
ssio
nal B
udge
t Offi
ce (C
BO)
Augu
st e
cono
mic
bas
elin
e. R
educ
ed a
llotm
ents
are
cal
cula
ted
base
d on
the
DSH
Hea
lth R
efor
m M
etho
dolo
gy th
at C
MS
initi
ally
dev
elop
ed to
app
ly D
SH re
duct
ions
to F
Y 20
14.
Und
er th
e st
atus
quo
sce
nario
, we
assu
me
that
the
only
sta
tes
that
will
exp
and
thei
r Med
icai
d pr
ogra
ms
to 1
38 p
erce
nt o
f the
fede
ral p
over
ty le
vel a
re th
ose
that
had
exp
ande
d by
Dec
embe
r 31,
201
4. U
nder
the
Med
icai
d ex
pans
ion
scen
ario
, we
assu
me
that
all
stat
es w
ill e
xpan
d th
eir M
edic
aid
prog
ram
s.
Sour
ce: D
obso
n Da
Vanz
o &
Asso
ciat
es a
nd K
NG
Hea
lth 2
015
anal
ysis
for M
ACPA
C of
pre
limin
ary
FY 2
016
DSH
allo
tmen
ts, C
ongr
essi
onal
Bud
get O
ffice
pro
ject
ions
of
the
Cons
umer
Pric
e In
dex
for A
ll U
rban
Con
sum
ers
(CPI
-U),
2011
as-
filed
Med
icai
d DS
H a
udits
, 201
1 M
edic
are
cost
repo
rts,
and
the
U.S
. Cen
sus
Bure
au 2
014
Amer
ican
Co
mm
unity
Sur
vey.
TABL
E B-
2. (c
ontin
ued)

Report to Congress on Medicaid Disproportionate Share Hospital Payments 65
Appendix B: State-Level DataTA
BLE
B-3.
Pro
ject
ed F
Y 20
18 D
SH P
aym
ents
und
er V
ario
us R
educ
tion
Scen
ario
s by
Hos
pita
l Typ
e (m
illio
ns)
Stat
eN
umbe
r of
DSH
hos
pita
lsU
nred
uced
DS
H p
aym
ents
Prop
ortio
nal r
educ
tion
Stra
tegi
c re
duct
ion
Redu
ced
paym
ents
Perc
ent
chan
geRe
duce
d pa
ymen
tsPe
rcen
t ch
ange
Tota
l2,
743
$ 18,
784
$ 15,
979
-15%
$ 15,
870
-16%
Deem
ed D
SH s
tatu
s D
eem
ed D
SH h
ospi
tals
798
12,2
9310
,441
-15
13,0
276
DSH
Hos
pita
ls, n
ot d
eem
ed1,
945
6,49
25,
538
-15
2,84
3-5
6Ty
pe o
f hos
pita
l S
hort
-term
acu
te c
are
hosp
itals
1,89
114
,941
12,6
93-1
513
,293
-11
Crit
ical
acc
ess
hosp
itals
558
354
280
-21
195
-45
Psy
chia
tric
hos
pita
ls17
43,
097
2,67
9-1
31,
647
-47
Lon
g-te
rm h
ospi
tals
3468
57-1
747
-30
Reh
abili
tatio
n ho
spita
ls35
1311
-11
10-1
8 C
hild
ren'
s ho
spita
ls51
311
258
-17
677
118
Type
of o
wne
rshi
p F
or-p
rofit
447
835
677
-19
897
7 N
on-p
rofit
1,52
15,
439
4,70
8-1
34,
804
-12
Pub
lic77
512
,510
10,5
93-1
510
,169
-19
Urb
an/r
ural
sta
tus
Urb
an1,
615
17,0
0914
,545
-14
14,7
89-1
3 R
ural
1,12
81,
775
1,43
4-1
91,
081
-39
Teac
hing
sta
tus
Non
-teac
hing
2,01
35,
687
4,74
4-1
73,
659
-36
Few
er th
an 1
00 re
side
nts
493
4,36
53,
612
-17
3,66
8-1
6 1
00 o
r mor
e re
side
nts
237
8,73
17,
623
-13
8,54
3-2
Inst
itutio
ns fo
r men
tal d
isea
ses
(IMD)
sta
tus
IMD
166
3,09
52,
677
-14
1,64
3-4
7 N
on-IM
D2,
577
15,6
8913
,302
-15
14,2
27-9
Not
es: F
Y is
fisc
al y
ear.
DSH
is d
ispr
opor
tiona
te s
hare
hos
pita
l. DS
H p
aym
ents
incl
ude
stat
e an
d fe
dera
l fun
ds. D
olla
r am
ount
s m
ay n
ot s
um u
p to
tota
l due
to ro
undi
ng.
Excl
udes
DSH
hos
pita
ls th
at d
id n
ot s
ubm
it a
Med
icar
e co
st re
port
(n =
90)
. Pro
port
iona
l red
uctio
n m
odel
ass
umes
that
DSH
pay
men
ts a
re re
duce
d pr
opor
tiona
lly a
cros
s al
l hos
pita
ls in
a s
tate
. Str
ateg
ic re
duct
ion
mod
el a
ssum
es th
at s
tate
s ch
ange
thei
r tar
getin
g of
DSH
pay
men
ts in
resp
onse
to th
e in
cent
ives
cre
ated
by
the
DSH
allo
tmen
t re
duct
ion
met
hodo
logy
but
do
not c
hang
e th
e to
tal a
mou
nt o
f DSH
spe
ndin
g th
at th
ey m
ake.
Dee
med
DSH
sta
tus
was
est
imat
ed b
ased
on
avai
labl
e M
edic
aid
and
low
-inco
me
utili
zatio
n da
ta. F
or fu
rthe
r dis
cuss
ion
of th
e m
etho
dolo
gy a
nd li
mita
tions
, see
App
endi
x C.
Sour
ces:
Dob
son
DaVa
nzo
& As
soci
ates
and
KN
G H
ealth
201
5 an
alys
is fo
r MAC
PAC
of D
SH a
udit
data
, Med
icar
e co
st re
port
s, th
e U
.S. C
ensu
s Bu
reau
Am
eric
an C
omm
unity
Su
rvey
; and
Hol
ahan
, J.,
M. B
uett
gens
, and
S. D
orn,
201
3, T
he c
ost o
f not
exp
andi
ng M
edic
aid,
Was
hing
ton,
DC:
Kai
ser F
amily
Fou
ndat
ion,
htt
p://
kff.o
rg/m
edic
aid/
repo
rt/t
he-
cost
-of-n
ot-e
xpan
ding
-med
icai
d/.

February 201666
Appendix B: State-Level Data
TABLE B-4. Number of Uninsured and Uninsured Rate by State, 2013–2014
State
2013 2014Difference
(2014 less 2013)
Number (millions)
Percent of state
populationNumber
(millions)
Percent of state
populationNumber
(millions)Percentage
point
Total 45,181 14.5% 36,670 11.7% -8,510 -2.8%
Alabama 645 13.6 579 12.1 -66 -1.4
Alaska 132 18.5 122 17.2 -10 -1.3
Arizona 1118 17.1 903 13.6 -215 -3.5
Arkansas 465 16.0 343 11.8 -122 -4.2
California 6,500 17.2 4,767 12.4 -1,733 -4.7
Colorado 729 14.1 543 10.3 -187 -3.8
Connecticut 333 9.4 245 6.9 -87 -2.5
Delaware 83 9.1 72 7.8 -12 -1.4
District of Columbia 42 6.7 34 5.3 -8 -1.4
Florida 3,853 20.0 3,245 16.6 -608 -3.4
Georgia 1,846 18.8 1,568 15.8 -278 -3.0
Hawaii 91 6.7 72 5.3 -19 -1.5
Idaho 257 16.2 219 13.6 -39 -2.6
Illinois 1,618 12.7 1,238 9.7 -380 -3.0
Indiana 903 14.0 776 11.9 -127 -2.0
Iowa 248 8.1 189 6.2 -59 -2.0
Kansas 348 12.3 291 10.2 -57 -2.0
Kentucky 616 14.3 366 8.5 -250 -5.8
Louisiana 751 16.6 672 14.8 -80 -1.8
Maine 147 11.2 134 10.1 -13 -1.0
Maryland 593 10.2 463 7.9 -130 -2.3
Massachusetts 247 3.7 219 3.3 -28 -0.4
Michigan 1,072 11.0 837 8.5 -235 -2.4
Minnesota 440 8.2 317 5.9 -123 -2.3
Mississippi 500 17.1 424 14.5 -76 -2.6
Missouri 773 13.0 694 11.7 -79 -1.4
Montana 165 16.5 143 14.2 -21 -2.2
Nebraska 209 11.3 179 9.7 -29 -1.7
Nevada 570 20.7 427 15.2 -143 -5.5
New Hampshire 140 10.7 120 9.2 -20 -1.5
New Jersey 1,160 13.2 965 10.9 -195 -2.3
New Mexico 382 18.6 298 14.5 -85 -4.1

Report to Congress on Medicaid Disproportionate Share Hospital Payments 67
Appendix B: State-Level Data
State
2013 2014Difference
(2014 less 2013)
Number (millions)
Percent of state
populationNumber
(millions)
Percent of state
populationNumber
(millions)Percentage
point
New York 2,070 10.7% 1,697 8.7% -373 -2.0%
North Carolina 1,509 15.6 1,276 13.1 -233 -2.6
North Dakota 73 10.4 57 7.9 -16 -2.5
Ohio 1,258 11.0 955 8.4 -302 -2.7
Oklahoma 666 17.7 584 15.4 -82 -2.3
Oregon 571 14.7 383 9.7 -188 -4.9
Pennsylvania 1,222 9.7 1,065 8.5 -158 -1.3
Rhode Island 120 11.6 77 7.4 -43 -4.2
South Carolina 739 15.8 642 13.6 -97 -2.2
South Dakota 93 11.3 82 9.8 -11 -1.5
Tennessee 887 13.9 776 12.0 -110 -1.8
Texas 5,748 22.1 5,047 19.1 -701 -3.1
Utah 402 14.0 366 12.5 -37 -1.5
Vermont 45 7.2 31 5.0 -14 -2.3
Virginia 991 12.3 884 10.9 -107 -1.4
Washington 960 14.0 643 9.2 -317 -4.7
West Virginia 255 14.0 156 8.6 -99 -5.4
Wisconsin 518 9.1 418 7.3 -100 -1.8
Wyoming 77 13.4 69 12.0 -8 -1.5
Notes: In 2013, there were a series of changes in how these data were collected that could affect some estimates. These changes include the addition of the Internet as a mode of data collection, the end of the content portion of Failed Edit Follow-Up interviewing and the loss of one monthly panel due to the federal government shut down in October 2013. For more information, see http://census.gov/programs-surveys/acs/technical-documentation/user-notes.html.
Source: Smith, J., and C. Medalia, 2015, Health insurance coverage in the United States: 2014, Current Population Reports, P60-253. Washington, DC: U.S. Census Bureau. https://www.census.gov/content/dam/Census/library/publications/2015/demo/p60-253.pdf.
TABLE B-4. (continued)

February 201668
Appendix B: State-Level Data
TABLE B-5. State Levels of Uncompensated Care, 2013
State Total uncompensated care (millions)Uncompensated care as a share of
hospital operating costs
Total $ 33,599 4.6%
Alabama 527 6.1
Alaska 102 6.0
Arizona 708 5.4
Arkansas 234 5.2
California 3,506 4.3
Colorado 405 3.3
Connecticut 154 2.0
Delaware 76 3.1
District of Columbia 67 2.0
Florida 2,400 7.0
Georgia 1,350 7.6
Hawaii 39 1.5
Idaho 141 3.8
Illinois 1,579 5.2
Indiana 857 4.4
Iowa 300 3.9
Kansas 232 3.4
Kentucky 519 4.6
Louisiana 565 5.0
Maine 179 4.0
Maryland 738 5.8
Massachusetts 509 2.4
Michigan 917 3.6
Minnesota 279 1.8
Mississippi 451 6.3
Missouri 761 5.0
Montana 146 4.8
Nebraska 198 4.1
Nevada 159 3.8
New Hampshire 187 4.7
New Jersey 1,007 6.1
New Mexico 277 6.7

Report to Congress on Medicaid Disproportionate Share Hospital Payments 69
Appendix B: State-Level Data
State Total uncompensated care (millions)Uncompensated care as a share of
hospital operating costs
New York $ 1,953 3.7%
North Carolina 1,395 6.2
North Dakota 101 3.2
Ohio 1,264 4.1
Oklahoma 446 5.3
Oregon 416 5.1
Pennsylvania 734 2.1
Rhode Island 156 5.5
South Carolina 593 6.6
South Dakota 101 3.2
Tennessee 415 4.8
Texas 3,852 6.9
Utah 293 5.2
Vermont 33 3.0
Virginia 882 4.5
Washington 586 3.6
West Virginia 257 5.5
Wisconsin 475 2.9
Wyoming 76 6.4
Notes: Medicare cost reports define uncompensated care as charity care and bad debt. Excludes hospitals without uncompensated care reported on their Medicare cost reports.
Source: MACPAC 2015 analysis of 2013 Medicare cost reports.
TABLE B-5. (continued)

February 201670
Appendix B: State-Level Data
TABLE B-6. Deemed DSH Hospitals That Provide at Least One Essential Community Service, 2011
State
Number of hospitals
(all)
DSH hospitals Deemed DSH hospitals
Deemed DSH hospitals that provide at
least one essential community service
Number Percent Number Percent Number Percent
Total 6,000 2,743 46% 798 13% 702 12%
Alabama 125 94 75 9 7 7 6
Alaska 21 4 19 1 5 1 5
Arizona 102 41 40 40 39 32 31
Arkansas 100 2 2 1 1 1 1
California 415 43 10 40 10 35 8
Colorado 95 73 77 15 16 15 16
Connecticut 42 34 81 4 10 3 7
Delaware 12 1 8 1 8 1 8
District of Columbia 13 8 62 8 62 6 46
Florida 242 71 29 36 15 28 12
Georgia 174 137 79 23 13 14 8
Hawaii 26 12 46 4 15 3 12
Idaho 49 22 45 6 12 5 10
Illinois 208 48 23 41 20 36 17
Indiana 164 16 10 16 10 16 10
Iowa 122 5 4 3 2 3 2
Kansas 153 54 35 13 8 13 8
Kentucky 115 104 90 35 30 29 25
Louisiana 220 91 41 38 17 29 13
Maine 41 1 2 0 0 0 0
Maryland 61 21 34 14 23 11 18
Massachusetts1 108 0 0 0 0 0 0
Michigan 169 118 70 11 7 10 6
Minnesota 143 94 66 13 9 12 8
Mississippi 112 49 44 9 8 9 8
Missouri 146 108 74 34 23 27 18
Montana 62 52 84 10 16 10 16
Nebraska 96 29 30 12 13 9 9
Nevada 52 21 40 5 10 5 10
New Hampshire 30 27 90 6 20 6 20
New Jersey 98 79 81 24 24 24 24
New Mexico 45 13 29 7 16 6 13

Report to Congress on Medicaid Disproportionate Share Hospital Payments 71
Appendix B: State-Level Data
State
Number of hospitals
(all)
DSH hospitals Deemed DSH hospitals
Deemed DSH hospitals that provide at
least one essential community service
Number Percent Number Percent Number Percent
New York 217 191 88% 36 17% 34 16%
North Carolina 131 51 39 15 11 15 11
North Dakota 49 4 8 1 2 1 2
Ohio 223 183 82 17 8 13 6
Oklahoma 145 61 42 13 9 13 9
Oregon 63 8 13 5 8 5 8
Pennsylvania 234 205 88 62 26 55 24
Rhode Island 15 14 93 2 13 1 7
South Carolina 82 64 78 13 16 11 13
South Dakota 60 17 28 11 18 11 18
Tennessee 144 79 55 23 16 20 14
Texas 563 172 31 74 13 74 13
Utah 54 40 74 4 7 4 7
Vermont 15 13 87 3 20 3 20
Virginia 112 31 28 9 8 7 6
Washington 98 63 64 14 14 13 13
West Virginia 61 53 87 9 15 9 15
Wisconsin 143 10 7 6 4 5 3
Wyoming 30 12 40 2 7 2 7
Notes: DSH is disproportionate share hospital. Excludes DSH hospitals that did not submit a Medicare cost report (n = 90). Deemed DSH status was estimated based on available Medicaid and low-income utilization data. Our working definition of essential community services includes the following services: burn services, dental services, graduate medical education, HIV/AIDS care, inpatient psychiatric services (through psychiatric subunit or stand-alone psychiatric hospital), neonatal intensive care units, obstetrics and gynecology services, substance use disorder services, and trauma services. For further discussion of the methodology and limitations, see Appendix C.1 Massachusetts does not make DSH payments because its Section 1115 demonstration allows the state to use DSH funding for the state’s safety-net care pool instead.
Source: MACPAC 2015 analysis of 2011 as-filed Medicaid DSH audits, 2011 and 2013 Medicare cost report data, and the American Hospital Association annual survey.
TABLE B-6. (continued)

February 201672
Appendix B: State-Level DataTA
BLE
B-7.
Oth
er C
hara
cter
istic
s of
Dee
med
DSH
Hos
pita
ls, 2
011
Stat
e
Num
ber o
f hos
pita
l bed
sN
umbe
r of M
edic
aid
days
(tho
usan
ds)
All
hosp
itals
DSH
hos
pita
lsDe
emed
DSH
hos
pita
lsAl
l ho
spita
lsDS
H h
ospi
tals
Deem
ed D
SH h
ospi
tals
Num
ber
Perc
ent
Num
ber
Perc
ent
Num
ber
Perc
ent
Num
ber
Perc
ent
Tota
l67
6,87
738
6,21
157
%12
0,81
518
%24
,287
15,3
1663
%8,
044
33%
Alab
ama
13,8
0812
,032
871,
256
963
961
596
177
28Al
aska
1,09
250
746
807
7938
482
3Ar
izon
a12
,469
6,69
554
6,50
152
631
480
7646
974
Arka
nsas
8,13
154
37
313
424
028
1223
10Ca
lifor
nia
60,3
537,
003
125,
994
102,
952
724
2564
222
Colo
rado
8,16
06,
575
812,
053
2534
232
996
182
53Co
nnec
ticut
7,38
06,
787
9291
012
304
232
7662
20De
law
are
2,02
111
56
115
685
–
––
–Di
stric
t of C
olum
bia
2,61
41,
185
451,
185
4517
811
565
115
65Fl
orid
a46
,346
18,9
0341
9,04
420
1,86
41,
198
6476
041
Geo
rgia
18,6
6816
,048
863,
336
1857
055
397
213
37H
awai
i2,
075
1,61
578
451
2240
3382
1128
Idah
o2,
574
1,67
265
702
2710
883
7744
40Ill
inoi
s27
,161
8,73
532
6,77
725
1,55
173
147
591
38In
dian
a14
,925
799
579
95
369
4512
4512
Iow
a7,
242
1,09
315
617
927
710
939
8029
Kans
as7,
543
3,59
248
2,01
827
178
140
7911
565
Kent
ucky
12,3
8911
,872
963,
805
3135
834
897
150
42Lo
uisi
ana
15,6
497,
975
513,
122
2066
838
357
188
28M
aine
3,02
292
30
014
51
00
0M
aryl
and
11,8
763,
766
323,
105
2640
515
538
135
33M
assa
chus
etts
117
,205
00
00
852
00
00
Mic
higa
n21
,465
17,9
2584
1,65
88
429
366
8595
22M
inne
sota
9,81
78,
563
871,
285
1336
333
091
135
37M
issi
ssip
pi10
,033
5,47
855
1,18
312
432
252
5811
426
Mis
sour
i15
,815
12,2
6478
3,44
222
559
433
7819
435
Mon
tana
2,42
72,
090
8644
018
7474
100
2331
Neb
rask
a4,
835
2,80
958
1,47
230
155
135
8797
63

Report to Congress on Medicaid Disproportionate Share Hospital Payments 73
Appendix B: State-Level Data
Stat
e
Num
ber o
f hos
pita
l bed
sN
umbe
r of M
edic
aid
days
(tho
usan
ds)
All
hosp
itals
DSH
hos
pita
lsDe
emed
DSH
hos
pita
lsAl
l ho
spita
lsDS
H h
ospi
tals
Deem
ed D
SH h
ospi
tals
Num
ber
Perc
ent
Num
ber
Perc
ent
Num
ber
Perc
ent
Num
ber
Perc
ent
Nev
ada
5,10
62,
982
58%
899
18%
173
145
84%
7745
%N
ew H
amps
hire
2,35
22,
286
9744
419
5959
9919
32N
ew J
erse
y20
,082
18,6
1493
5,30
226
373
335
9013
737
New
Mex
ico
3,59
51,
647
4674
221
6845
6529
42N
ew Y
ork
43,9
4140
,557
927,
442
171,
892
1,64
587
501
26N
orth
Car
olin
a18
,776
10,6
5357
3,96
721
1,02
363
762
311
30N
orth
Dak
ota
2,16
444
621
241
7311
140
0O
hio
27,0
3524
,938
922,
571
1056
051
993
144
26O
klah
oma
9,93
36,
343
641,
744
1854
541
075
213
39O
rego
n5,
399
901
1739
57
205
5125
2211
Penn
sylv
ania
33,3
9531
,954
969,
371
2867
667
399
335
50Rh
ode
Isla
nd2,
615
2,53
397
642
2558
5710
024
42So
uth
Caro
lina
10,3
429,
346
902,
355
2324
624
499
114
46So
uth
Dako
ta2,
586
1,15
245
473
1890
5460
2528
Tenn
esse
e16
,205
11,8
7873
3,29
920
458
390
8522
649
Texa
s57
,584
27,3
3147
12,6
7122
1,24
495
577
726
58U
tah
4,25
13,
661
8621
75
199
193
9726
13Ve
rmon
t89
178
788
9010
3939
100
512
Virg
inia
14,8
516,
789
462,
320
1648
332
066
205
43W
ashi
ngto
n9,
880
7,25
473
1,78
218
478
360
7511
724
Wes
t Virg
inia
5,80
35,
444
941,
582
2717
517
510
085
48W
isco
nsin
11,6
891,
269
1174
16
292
5318
4114
Wyo
min
g1,
307
713
5579
632
1650
26
Not
es: D
SH is
dis
prop
ortio
nate
sha
re h
ospi
tal.
Excl
udes
DSH
hos
pita
ls th
at d
id n
ot s
ubm
it a
Med
icar
e co
st re
port
(n =
90)
. Dee
med
DSH
sta
tus
was
est
imat
ed b
ased
on
avai
labl
e M
edic
aid
and
low
-inco
me
utili
zatio
n da
ta. F
or fu
rthe
r dis
cuss
ion
of th
e m
etho
dolo
gy a
nd li
mita
tions
, see
App
endi
x C.
1 M
assa
chus
etts
doe
s no
t mak
e DS
H p
aym
ents
bec
ause
its
Sect
ion
1115
dem
onst
ratio
n al
low
s th
e st
ate
to u
se D
SH fu
ndin
g fo
r the
sta
te’s
saf
ety-
net c
are
pool
inst
ead.
– D
ash
mea
ns d
ata
wer
e no
t ava
ilabl
e.
Sour
ce: M
ACPA
C 20
15 a
naly
sis
of 2
011
as-fi
led
Med
icai
d DS
H a
udits
, 201
1 an
d 20
13 M
edic
are
cost
repo
rt d
ata,
and
the
Amer
ican
Hos
pita
l Ass
ocia
tion
annu
al s
urve
y.
TABL
E B-
7. (c
ontin
ued)


APPENDIX C
Methodology and Data Limitations


Report to Congress on Medicaid Disproportionate Share Hospital Payments 77
Appendix C: Methodology and Data Limitations
Appendix C: Methodology and Data LimitationsMACPAC used data from several different sources to analyze and describe Medicaid disproportionate share hospital (DSH) payments and their relationship to factors such as uninsured rates, uncompensated care, and DSH hospitals with high levels of uncompensated care that provide access to essential services. We also modeled DSH allotment reductions and simulated DSH payments under a variety of scenarios. Below we describe the data sources used in this analysis and the limitations associated with each one, and we review the modeling assumptions we made for our projections of DSH allotments and payments.
Primary Data Sources
DSH audit dataWe used 2011 DSH audit reports to examine historic DSH spending and the distribution of DSH spending among a variety of hospital types. These data were provided by the Centers for Medicare & Medicaid Services (CMS) on an as-filed basis and may be subject to change as CMS completes its internal review of state DSH audit reports.
Because 2011 DSH audit data were not available for Minnesota, 2010 DSH audit data were used instead. Minnesota’s 2010 DSH audit data were adjusted to 2011 values using the Consumer Price Index for All Urban Consumers (CPI-U). DSH audit data were also not available for Massachusetts, which is exempt from DSH requirements under the terms of the state’s Section 1115 demonstration waiver.
Overall, 2,743 hospitals receiving DSH payments are represented in our analysis. Some states
provided DSH audit data for hospitals that did not receive DSH payments, and some hospitals received DSH payments from multiple states. We removed 59 non-DSH hospitals from our analysis and combined the data for 33 pairs of duplicate hospitals so that each hospital would only appear once in the dataset.
Medicare cost reportsWe used Medicare cost report data to examine uncompensated care for all hospitals in each state. A hospital that receives Medicare payments must file an annual Medicare cost report, which includes a range of financial and non-financial data about hospital performance and services provided. We excluded religious non-medical health care institutions and hospitals participating in special Medicare demonstration projects (28 hospitals were excluded under these criteria). These facilities submit Medicare cost reports but do not receive Medicare DSH payments.
We linked DSH audit data and Medicare cost report data to create descriptive analyses of DSH hospitals and to identify deemed DSH hospitals. We were unable to identify the Medicare cost reports for 90 DSH hospitals, and so we excluded those 90 hospitals from this analysis.
When using Medicare cost reports to analyze hospital operating margins, we excluded hospitals with operating margins that had an absolute value of greater than 75 percent (976 hospitals were excluded under this criterion). This approach is consistent with other published studies of hospital margins using Medicare cost report data (Wynn et al. 2002). Operating margins are calculated by subtracting operating expenses (OE) from net patient revenue (NPR) and dividing the result by net patient revenue: (NPR–OE)/NPR. Total margins, in contrast, include additional types of hospital revenue, such as state or local subsidies and revenue from other facets of hospital operations (e.g., parking lot receipts).

February 201678
Appendix C: Methodology and Data Limitations
Working Definition of Essential Community ServicesThe statute requires that MACPAC’s analysis include data identifying hospitals with high levels of uncompensated care that also provide access to essential community services for low-income, uninsured, and vulnerable populations, such as graduate medical education, and the continuums of primary through quaternary care, including the provision of trauma care and public health services.
Our working definition to identify such hospitals in our first report is based on a two part test:
• Is the hospital a deemed DSH hospital?
• Does the hospital provide at least one essential service?
Deemed DSH hospital statusHospitals must meet one of two criteria to qualify as a deemed DSH hospital: (1) a Medicaid inpatient utilization rate greater than one standard deviation above the mean for hospitals in the state or (2) a low-income utilization rate greater than 25 percent (§ 1923(b)(1) of the Social Security Act). Because deemed DSH hospitals are statutorily required to receive DSH payments, we excluded from our analysis hospitals that did not receive DSH payments in 2011.
Calculation of the Medicaid inpatient utilization rate threshold for each state requires data from all hospitals in that state, and we relied on Medicare cost reports to make those calculations and to determine which hospitals exceeded this threshold. A major limitation of this approach is that Medicaid inpatient utilization reported on Medicare cost reports does not include services provided to Medicaid enrollees that were not paid for by Medicaid (e.g., Medicare-funded services for individuals who are dually eligible for Medicare and Medicaid). However, the Medicaid DSH definition
of Medicaid inpatient utilization includes services provided to anyone that is eligible for Medicaid, even if Medicaid is not the primary payer. Thus, our identification of deemed DSH hospitals may omit some hospitals with high utilization by dually eligible beneficiaries and overstate the extent to which hospitals with low utilization by dually eligible beneficiaries (e.g., children’s hospitals) exceed the threshold.
The low-income utilization rate threshold for deemed DSH hospitals is the same for all states (25 percent), so we were able to use Medicaid DSH audit data to determine whether hospitals met this criterion. However, about one-quarter of DSH hospitals did not provide data on the rate of low-income utilization on their DSH audits, and these omissions limited our ability to identify all deemed DSH hospitals.
Provision of essential community servicesBecause the term essential community services is not otherwise defined in statute or regulation, MACPAC convened a technical advisory panel in April 2015 to discuss potential data sources and criteria that could be used to identify such services. The panel included representatives of state Medicaid programs, CMS, and hospital associations as well as researchers and state consultants on DSH policy. Feedback from the technical advisory panel was further discussed at the Commission’s May 2015 public meeting.
We identified a number of services that could be considered essential community services using available data from 2013 Medicare cost reports and the 2013 American Hospital Association (AHA) annual survey (Table C-1). Services were selected for inclusion if they were directly mentioned in the statute requiring this report or if they were related services mentioned in the cost reports or the AHA annual survey.

Report to Congress on Medicaid Disproportionate Share Hospital Payments 79
Appendix C: Methodology and Data Limitations
For this first report, for the sake of inclusiveness, any deemed DSH hospital providing at least one essential community service was included in our analysis. We also included certain hospital types if they were the only hospital in their geographic area to provide certain types of services. These included critical access hospitals because they are often the only hospital within a 25-mile radius. In addition, we included children’s hospitals that were the only hospital within a 15-mile radius (measured by driving distance).
Projections of DSH Allotments and DSH Spending
Unreduced DSH allotmentsPreliminary DSH allotments for fiscal year (FY) 2016 were provided by CMS, and DSH allotments for subsequent years were estimated based on CPI-U projections in the Congressional Budget Office’s August economic baseline (CBO 2015). Because the federal share of DSH allotments is limited to 12 percent of state Medicaid benefit spending, we also adjusted the projected DSH allotments for states whose unreduced DSH
allotment might exceed this limit. To perform this calculation, we estimated state benefit spending for future years using actual FY 2014 spending and estimates of national growth rates from the CMS Office of the Actuary (CMS 2014).
DSH allotment reductionsMACPAC contracted with Dobson DaVanzo & Associates and KNG Health to develop a model for estimating DSH allotment reductions. The model uses the DSH Health Reform Methodology that CMS initially developed to apply DSH reductions to FY 2014 (CMS 2013). Although CMS may apply a different reduction methodology for future year DSH reductions, the methodology developed for this report reflects the current statutory requirements and is therefore a reasonable starting point for estimating FY 2018 DSH allotment reductions.
We used a variety of data sources to estimate the factors used in CMS’s methodology (Table C-2). Our current estimates of DSH allotment reductions do not fully represent the effects of the Patient Protection and Affordable Care Act (ACA, P.L. 111-148, as amended) because current data are not available for every factor. Specifically, we used
TABLE C-1. Essential Community Services by Data Source
Service type Data source
Burn services Medicare cost reports
Dental services American Hospital Association annual survey
Graduate medical education Medicare cost reports
HIV/AIDS care American Hospital Association annual survey
Inpatient psychiatric services (through psychiatric subunit or stand-alone psychiatric hospital) Medicare cost reports
Neonatal intensive care units American Hospital Association annual survey
Obstetrics and gynecology services American Hospital Association annual survey
Substance use disorder services American Hospital Association annual survey
Trauma services American Hospital Association annual survey

February 201680
Appendix C: Methodology and Data Limitations
2011 data for the Medicaid inpatient factor and the uncompensated care factor. We expect these factors to change as a result of ACA coverage expansions, but we do not yet have 2014 data for them.
To estimate DSH allotment reductions under a scenario in which all states would expand Medicaid to the new group of low-income adults under age 65, we used uninsured rates projected by the Urban Institute (Holahan et al. 2013). To ensure consistent comparisons, we used the Urban Institute projections for states that expanded Medicaid in 2014 even though U.S. Census Bureau American Community Survey data were available.
Hospital-level effectsFor our projections of unreduced DSH payments to hospitals in FY 2018, we assumed that DSH payments to individual hospitals would increase at the same rate as the state’s overall DSH spending. We used CMS-64 net expenditure data for FY 2011 through FY 2015 to calculate the growth rate in state DSH spending and used the growth in projected state DSH allotments from FY 2016 through FY 2018 to estimate the growth rate in state DSH spending. This growth rate was applied to hospital-specific DSH spending reported on 2011 DSH audits in order to estimate FY 2018 DSH spending by hospital.
For our projections of reduced DSH payments under the proportional reduction model, we reduced DSH payments to each hospital by the change in a state’s DSH allotment after taking into account the portion of a state’s DSH allotment that was projected to be unspent in FY 2018.
Under the strategic reduction model, we assumed that states would prioritize payments to hospitals that met both the high volume of Medicaid inpatients factor and the high level of uncompensated care factor of the CMS’s DSH reduction methodology. We also assumed that after states maximized payments to these hospitals, they would give second priority to hospitals that met only the Medicaid inpatients factor and then give third priority to hospitals that met only the uncompensated care factor. We prioritized the Medicaid inpatients factor over the uncompensated care factor in this model because these hospitals are deemed DSH hospitals, but we note that the CMS DSH reduction methodology does not specifically incentivize DSH payments for one factor over another. A limitation of this model is that it relies on projections of hospital uncompensated care, which then determine the maximum amount of DSH funding a hospital could receive. Given the absence of complete data that reflect the effects of the ACA on hospital uncompensated care, our projections were based on FY 2011 data; hospital-specific limits in FY 2011 were increased to projected FY 2018 levels based
TABLE C-2. Data Sources for Factors Used in the DSH Allotment Reduction Model
DSH allotment reduction factor Data source (year)
Low DSH Specified in statute (N/A)
Uninsured percentage American Community Survey (2014)
High volume of Medicaid inpatients Medicare cost reports (2011)
High level of uncompensated care DSH audits (2011)
Budget neutrality Financial Management Group, CMS (2014)
Notes: DSH is disproportionate share hospital. N/A is not applicable. CMS is the Centers for Medicare & Medicaid Services.

Report to Congress on Medicaid Disproportionate Share Hospital Payments 81
Appendix C: Methodology and Data Limitations
on CMS national health expenditure projections for hospitals.
Preliminary Analysis of 2014 Medicare Cost Report DataTo explore the effects of the ACA on hospital uncompensated care, we examined data from 1,371 hospitals that submitted a full year of uncompensated care data beginning January 1, 2014 (comprising about 23 percent of all U.S. hospitals). We excluded from our analysis hospitals that had not submitted complete uncompensated care data for 2011–2013. DSH hospitals from 40 states accounted for about half of the hospitals in this analysis, which is similar to their share of all U.S. hospitals. All hospital types were included, but children’s hospitals, long-term care facilities, and psychiatric hospitals were underrepresented (in the aggregate accounting for less than 10 percent of the total) because of a lack of complete uncompensated care data on Medicare cost reports. Categorized by ownership status, our preliminary analysis included approximately 25 percent of all U.S. non-profit hospitals, 23 percent of all U.S. for-profit hospitals, and 17 percent of all U.S. public hospitals.
ReferencesCenters for Medicare & Medicaid Services (CMS), U.S. Department of Health and Human Services. 2013. Medicaid program: State disproportionate share hospital allotment reductions. Final rule. Federal Register 78, no. 181 (September 18): 57293–57313. https://federalregister.gov/a/2013-22686.
Congressional Budget Office (CBO). 2015. An update to the budget and economic outlook: 2015 to 2025. August 25. Washington, DC: CBO. https://www.cbo.gov/publication/50724.
Holahan, J., M. Buettgens, and S. Dorn. 2013. The cost of not expanding Medicaid. Washington, DC: Kaiser Commission on Medicaid and the Uninsured, Kaiser Family Foundation. http://kff.org/medicaid/report/the-cost-of-not-expanding-medicaid/.
Wynn, B, T. Coughlin, S. Bondarenko, and B. Bruen. 2002. Analysis of the joint distribution of disproportionate share hospital payments. Project memorandum PM-1387-ASPE to the Assistant Secretary of Planning and Evaluation, U.S. Department of Health and Human Services. September 20, 2002. Washington, DC: RAND. http://aspe.hhs.gov/health/Reports/02/DSH/index.htm.


Appendix D


Report to Congress on Medicaid Disproportionate Share Hospital Payments 85
Appendix D
Appendix D
Authorizing Language from the Social Security Act (42 USC 1396)
Medicaid and CHIP Payment and Access Commission(a) ESTABLISHMENT.—There is hereby established the Medicaid and CHIP Payment and Access
Commission (in this section referred to as ‘‘MACPAC’’).
(b) DUTIES.—
(1) REVIEW OF ACCESS POLICIES FOR ALL STATES AND ANNUAL REPORTS.—MACPAC shall—
(A) review policies of the Medicaid program established under this title (in this section referred to as ‘‘Medicaid’’) and the State Children’s Health Insurance Program established under title XXI (in this section referred to as ‘‘CHIP’’) affecting access to covered items and services, including topics described in paragraph (2);
(B) make recommendations to Congress, the Secretary, and States concerning such access policies;
(C) by not later than March 15 of each year (beginning with 2010), submit a report to Congress containing the results of such reviews and MACPAC’s recommendations concerning such policies; and
(D) by not later than June 15 of each year (beginning with 2010), submit a report to Congress containing an examination of issues affecting Medicaid and CHIP, including the implications of changes in health care delivery in the United States and in the market for health care services on such programs.
(2) SPECIFIC TOPICS TO BE REVIEWED.—Specifically, MACPAC shall review and assess the following:
(A) MEDICAID AND CHIP PAYMENT POLICIES.—Payment policies under Medicaid and CHIP, including—
(i) the factors affecting expenditures for the efficient provision of items and services in different sectors, including the process for updating payments to medical, dental, and health professionals, hospitals, residential and long-term care providers, providers of home and community based services, Federally-qualified health centers and rural health clinics, managed care entities, and providers of other covered items and services;
(ii) payment methodologies; and
(iii) the relationship of such factors and methodologies to access and quality of care for Medicaid and CHIP beneficiaries (including how such factors and methodologies enable such beneficiaries to obtain the services for which they are eligible, affect provider supply, and affect providers that serve a disproportionate share of low-income and other vulnerable populations).

February 201686
Appendix D
(B) ELIGIBILITY POLICIES.—Medicaid and CHIP eligibility policies, including a determination of the degree to which Federal and State policies provide health care coverage to needy populations.
(C) ENROLLMENT AND RETENTION PROCESSES.—Medicaid and CHIP enrollment and retention processes, including a determination of the degree to which Federal and State policies encourage the enrollment of individuals who are eligible for such programs and screen out individuals who are ineligible, while minimizing the share of program expenses devoted to such processes.
(D) COVERAGE POLICIES.—Medicaid and CHIP benefit and coverage policies, including a determination of the degree to which Federal and State policies provide access to the services enrollees require to improve and maintain their health and functional status.
(E) QUALITY OF CARE.—Medicaid and CHIP policies as they relate to the quality of care provided under those programs, including a determination of the degree to which Federal and State policies achieve their stated goals and interact with similar goals established by other purchasers of health care services.
(F) INTERACTION OF MEDICAID AND CHIP PAYMENT POLICIES WITH HEALTH CARE DELIVERY GENERALLY.—The effect of Medicaid and CHIP payment policies on access to items and services for children and other Medicaid and CHIP populations other than under this title or title XXI and the implications of changes in health care delivery in the United States and in the general market for health care items and services on Medicaid and CHIP.
(G) INTERACTIONS WITH MEDICARE AND MEDICAID.—Consistent with paragraph (11), the interaction of policies under Medicaid and the Medicare program under title XVIII, including with respect to how such interactions affect access to services, payments, and dually eligible individuals.
(H) OTHER ACCESS POLICIES.—The effect of other Medicaid and CHIP policies on access to covered items and services, including policies relating to transportation and language barriers and preventive, acute, and long-term services and supports.
(3) RECOMMENDATIONS AND REPORTS OF STATE-SPECIFIC DATA.—MACPAC shall—
(A) review national and State-specific Medicaid and CHIP data; and
(B) submit reports and recommendations to Congress, the Secretary, and States based on such reviews.
(4) CREATION OF EARLY-WARNING SYSTEM.—MACPAC shall create an early-warning system to identify provider shortage areas, as well as other factors that adversely affect, or have the potential to adversely affect, access to care by, or the health care status of, Medicaid and CHIP beneficiaries. MACPAC shall include in the annual report required under paragraph (1)(D) a description of all such areas or problems identified with respect to the period addressed in the report.
(5) COMMENTS ON CERTAIN SECRETARIAL REPORTS AND REGULATIONS.—
(A) CERTAIN SECRETARIAL REPORTS.—If the Secretary submits to Congress (or a committee of Congress) a report that is required by law and that relates to access policies, including with respect to payment policies, under Medicaid or CHIP, the Secretary shall transmit a copy of the report to MACPAC. MACPAC shall review the report and, not later than 6 months after the date

Report to Congress on Medicaid Disproportionate Share Hospital Payments 87
Appendix D
of submittal of the Secretary’s report to Congress, shall submit to the appropriate committees of Congress and the Secretary written comments on such report. Such comments may include such recommendations as MACPAC deems appropriate.
(B) REGULATIONS.—MACPAC shall review Medicaid and CHIP regulations and may comment through submission of a report to the appropriate committees of Congress and the Secretary, on any such regulations that affect access, quality, or efficiency of health care.
(6) AGENDA AND ADDITIONAL REVIEWS.—
(A) IN GENERAL.—MACPAC shall consult periodically with the chairmen and ranking minority members of the appropriate committees of Congress regarding MACPAC’s agenda and progress towards achieving the agenda. MACPAC may conduct additional reviews, and submit additional reports to the appropriate committees of Congress, from time to time on such topics relating to the program under this title or title XXI as may be requested by such chairmen and members and as MACPAC deems appropriate.
(B) REVIEW AND REPORTS REGARDING MEDICAID DSH.—
(i) IN GENERAL.—MACPAC shall review and submit an annual report to Congress on disproportionate share hospital payments under section 1923. Each report shall include the information specified in clause (ii).
(ii) REQUIRED REPORT INFORMATION.—Each report required under this subparagraph shall include the following:
(I) Data relating to changes in the number of uninsured individuals.
(II) Data relating to the amount and sources of hospitals’ uncompensated care costs, including the amount of such costs that are the result of providing unreimbursed or under-reimbursed services, charity care, or bad debt.
(III) Data identifying hospitals with high levels of uncompensated care that also provide access to essential community services for low-income, uninsured, and vulnerable populations, such as graduate medical education, and the continuum of primary through quarternary care, including the provision of trauma care and public health services.
(IV) State-specific analyses regarding the relationship between the most recent State DSH allotment and the projected State DSH allotment for the succeeding year and the data reported under subclauses (I), (II), and (III) for the State.
(iii) DATA.—Notwithstanding any other provision of law, the Secretary regularly shall provide MACPAC with the most recent State reports and most recent independent certified audits submitted under section 1923(j), cost reports submitted under title XVIII, and such other data as MACPAC may request for purposes of conducting the reviews and preparing and submitting the annual reports required under this subparagraph.
(iv) SUBMISSION DEADLINES.—The first report required under this subparagraph shall be submitted to Congress not later than February 1, 2016. Subsequent reports shall be submitted as part of, or with, each annual report required under paragraph (1)(C) during the period of fiscal years 2017 through 2024.

February 201688
Appendix D
(7) AVAILABILITY OF REPORTS.—MACPAC shall transmit to the Secretary a copy of each report submitted under this subsection and shall make such reports available to the public.
(8) APPROPRIATE COMMITTEE OF CONGRESS.—For purposes of this section, the term ‘‘appropriate committees of Congress’’ means the Committee on Energy and Commerce of the House of Representatives and the Committee on Finance of the Senate.
(9) VOTING AND REPORTING REQUIREMENTS.—With respect to each recommendation contained in a report submitted under paragraph (1), each member of MACPAC shall vote on the recommendation, and MACPAC shall include, by member, the results of that vote in the report containing the recommendation.
(10) EXAMINATION OF BUDGET CONSEQUENCES.—Before making any recommendations, MACPAC shall examine the budget consequences of such recommendations, directly or through consultation with appropriate expert entities, and shall submit with any recommendations, a report on the Federal and State-specific budget consequences of the recommendations.
(11) CONSULTATION AND COORDINATION WITH MEDPAC.—
(A) IN GENERAL.—MACPAC shall consult with the Medicare Payment Advisory Commission (in this paragraph referred to as ‘‘MedPAC’’) established under section 1805 in carrying out its duties under this section, as appropriate and particularly with respect to the issues specified in paragraph (2) as they relate to those Medicaid beneficiaries who are dually eligible for Medicaid and the Medicare program under title XVIII, adult Medicaid beneficiaries (who are not dually eligible for Medicare), and beneficiaries under Medicare. Responsibility for analysis of and recommendations to change Medicare policy regarding Medicare beneficiaries, including Medicare beneficiaries who are dually eligible for Medicare and Medicaid, shall rest with MedPAC.
(B) INFORMATION SHARING.—MACPAC and MedPAC shall have access to deliberations and records of the other such entity, respectively, upon the request of the other such entity.
(12) CONSULTATION WITH STATES.—MACPAC shall regularly consult with States in carrying out its duties under this section, including with respect to developing processes for carrying out such duties, and shall ensure that input from States is taken into account and represented in MACPAC’s recommendations and reports.
(13) COORDINATE AND CONSULT WITH THE FEDERAL COORDINATED HEALTH CARE OFFICE.—MACPAC shall coordinate and consult with the Federal Coordinated Health Care Office established under section 2081 of the Patient Protection and Affordable Care Act before making any recommendations regarding dually eligible individuals.
(14) PROGRAMMATIC OVERSIGHT VESTED IN THE SECRETARY.— MACPAC’s authority to make recommendations in accordance with this section shall not affect, or be considered to duplicate, the Secretary’s authority to carry out Federal responsibilities with respect to Medicaid and CHIP.
(c) MEMBERSHIP.—
(1) NUMBER AND APPOINTMENT.—MACPAC shall be composed of 17 members appointed by the Comptroller General of the United States.
Report to Congress on Medicaid Disproportionate Share Hospital Payments 89
Appendix D
(2) QUALIFICATIONS.—
(A) IN GENERAL.—The membership of MACPAC shall include individuals who have had direct experience as enrollees or parents or caregivers of enrollees in Medicaid or CHIP and individuals with national recognition for their expertise in Federal safety net health programs, health finance and economics, actuarial science, health plans and integrated delivery systems, reimbursement for health care, health information technology, and other providers of health services, public health, and other related fields, who provide a mix of different professions, broad geographic representation, and a balance between urban and rural representation.
(B) INCLUSION.—The membership of MACPAC shall include (but not be limited to) physicians, dentists, and other health professionals, employers, third-party payers, and individuals with expertise in the delivery of health services. Such membership shall also include representatives of children, pregnant women, the elderly, individuals with disabilities, caregivers, and dually eligible individuals, current or former representatives of State agencies responsible for administering Medicaid, and current or former representatives of State agencies responsible for administering CHIP.
(C) MAJORITY NONPROVIDERS.—Individuals who are directly involved in the provision, or management of the delivery, of items and services covered under Medicaid or CHIP shall not constitute a majority of the membership of MACPAC.
(D) ETHICAL DISCLOSURE.—The Comptroller General of the United States shall establish a system for public disclosure by members of MACPAC of financial and other potential conflicts of interest relating to such members. Members of MACPAC shall be treated as employees of Congress for purposes of applying title I of the Ethics in Government Act of 1978 (Public Law 95–521).
(3) TERMS.—
(A) IN GENERAL.—The terms of members of MACPAC shall be for 3 years except that the Comptroller General of the United States shall designate staggered terms for the members first appointed.
(B) VACANCIES.—Any member appointed to fill a vacancy occurring before the expiration of the term for which the member’s predecessor was appointed shall be appointed only for the remainder of that term. A member may serve after the expiration of that member’s term until a successor has taken office. A vacancy in MACPAC shall be filled in the manner in which the original appointment was made.
(4) COMPENSATION.—While serving on the business of MACPAC (including travel time), a member of MACPAC shall be entitled to compensation at the per diem equivalent of the rate provided for level IV of the Executive Schedule under section 5315 of title 5, United States Code; and while so serving away from home and the member’s regular place of business, a member may be allowed travel expenses, as authorized by the Chairman of MACPAC. Physicians serving as personnel of MACPAC may be provided a physician comparability allowance by MACPAC in the same manner as Government physicians may be provided such an allowance by an agency under section 5948 of title 5, United States Code, and for such purpose subsection (i) of such section shall apply to MACPAC in the same manner as it applies to the Tennessee Valley Authority. For purposes of pay (other than pay of members of MACPAC) and employment benefits, rights, and privileges, all personnel of MACPAC shall be treated as if they were employees of the United States Senate.
February 201690
Appendix D
(5) CHAIRMAN; VICE CHAIRMAN.—The Comptroller General of the United States shall designate a member of MACPAC, at the time of appointment of the member as Chairman and a member as Vice Chairman for that term of appointment, except that in the case of vacancy of the Chairmanship or Vice Chairmanship, the Comptroller General of the United States may designate another member for the remainder of that member’s term.
(6) MEETINGS.—MACPAC shall meet at the call of the Chairman.
(d) DIRECTOR AND STAFF; EXPERTS AND CONSULTANTS.—Subject to such review as the Comptroller General of the United States deems necessary to assure the efficient administration of MACPAC, MACPAC may—
(1) employ and fix the compensation of an Executive Director (subject to the approval of the Comptroller General of the United States) and such other personnel as may be necessary to carry out its duties (without regard to the provisions of title 5, United States Code, governing appointments in the competitive service);
(2) seek such assistance and support as may be required in the performance of its duties from appropriate Federal and State departments and agencies;
(3) enter into contracts or make other arrangements, as may be necessary for the conduct of the work of MACPAC (without regard to section 3709 of the Revised Statutes (41 USC 5));
(4) make advance, progress, and other payments which relate to the work of MACPAC;
(5) provide transportation and subsistence for persons serving without compensation; and
(6) prescribe such rules and regulations as it deems necessary with respect to the internal organization and operation of MACPAC.
(e) POWERS.—
(1) OBTAINING OFFICIAL DATA.—MACPAC may secure directly from any department or agency of the United States and, as a condition for receiving payments under sections 1903(a) and 2105(a), from any State agency responsible for administering Medicaid or CHIP, information necessary to enable it to carry out this section. Upon request of the Chairman, the head of that department or agency shall furnish that information to MACPAC on an agreed upon schedule.
(2) DATA COLLECTION.—In order to carry out its functions, MACPAC shall—
(A) utilize existing information, both published and unpublished, where possible, collected and assessed either by its own staff or under other arrangements made in accordance with this section;
(B) carry out, or award grants or contracts for, original research and experimentation, where existing information is inadequate; and
(C) adopt procedures allowing any interested party to submit information for MACPAC’s use in making reports and recommendations.
Report to Congress on Medicaid Disproportionate Share Hospital Payments 91
Appendix D
(3) ACCESS OF GAO TO INFORMATION.—The Comptroller General of the United States shall have unrestricted access to all deliberations, records, and nonproprietary data of MACPAC, immediately upon request.
(4) PERIODIC AUDIT.—MACPAC shall be subject to periodic audit by the Comptroller General of the United States.
(f) FUNDING.—
(1) REQUEST FOR APPROPRIATIONS.—MACPAC shall submit requests for appropriations (other than for fiscal year 2010) in the same manner as the Comptroller General of the United States submits requests for appropriations, but amounts appropriated for MACPAC shall be separate from amounts appropriated for the Comptroller General of the United States.
(2) AUTHORIZATION.—There are authorized to be appropriated such sums as may be necessary to carry out the provisions of this section.
(3) FUNDING FOR FISCAL YEAR 2010.—
(A) IN GENERAL.—Out of any funds in the Treasury not otherwise appropriated, there is appropriated to MACPAC to carry out the provisions of this section for fiscal year 2010, $9,000,000.
(B) TRANSFER OF FUNDS.—Notwithstanding section 2104(a)(13), from the amounts appropriated in such section for fiscal year 2010, $2,000,000 is hereby transferred and made available in such fiscal year to MACPAC to carry out the provisions of this section.
(4) AVAILABILITY.—Amounts made available under paragraphs (2) and (3) to MACPAC to carry out the provisions of this section shall remain available until expended.

February 201692
Commission Vote on RecommendationIn its authorizing language in the Social Security Act (42 USC 1396), Congress required MACPAC to review Medicaid and CHIP policies and to make recommendations related to those policies to Congress, the Secretary of the U.S. Department of Health and Human Services, and the states in its reports to Congress. Each Commissioner must vote on each recommendation, and the votes for each recommendation must be published in the reports. The recommendation included in this report, and the corresponding voting record below, fulfills this mandate.
The vote was taken in a public meeting on October 29, 2015, and reflects the roster of Commissioners at that time.
Improving Data as the First Step to a More Targeted Disproportionate Share Hospital Policy3.1 The Secretary of the U.S. Department of Health and Human Services
14 Yes
0 No
2 Not Present
should collect and report hospital-specific data on all types of Medicaid payments for all hospitals that receive them. In addition, the Secretary should collect and report data on the sources of non-federal share necessary to determine net Medicaid payment at the provider level.
Yes: Carte, Checkett, Cohen, Cruz, Gabow, Gold, Hoyt, Martínez Rogers, Milligan, Retchin, Riley, Rowland, Szilagyi, Waldren
No: None
Not present:* Gray, Rosenbaum
*Commissioners Gray and Rosenbaum each expressed support for the recommendation in an email message to the Chair.
Appendix D
Report to Congress on Medicaid Disproportionate Share Hospital Payments 93
Appendix D
Biographies of Commissioners
Sara Rosenbaum, JD (Chair), is founding chair of the Department of Health Policy and the Harold and Jane Hirsh Professor of Health Law and Policy at The George Washington University Milken Institute School of Public Health. She also serves on the faculties of The George Washington Schools of Law and Medicine. Professor Rosenbaum’s research has focused on how the law intersects with the nation’s health care and public health systems, with a particular emphasis on insurance coverage, managed care, the health care safety net, health care quality, and civil rights. She is a member of the National Academy of Medicine (formerly the Institute of Medicine), and has served on the boards of numerous national organizations, including AcademyHealth. Professor Rosenbaum is a past member of the Centers for Disease Control and Prevention’s (CDC) Advisory Committee on Immunization Practices and also serves on the CDC Director’s Advisory Committee. She has advised Congress and presidential administrations since 1977 and served on the staff of the White House Domestic Policy Council during the Clinton administration. Professor Rosenbaum is the lead author of Law and the American Health Care System, published by Foundation Press (2012). She received her law degree from Boston University School of Law.
Marsha Gold, ScD (Vice Chair), is a senior fellow emeritus at Mathematica Policy Research, where she previously served as a lead investigator and project director on research in the areas of Medicare, Medicaid, managed care design, and delivery system reform in both public and private health insurance, and access to care. Other prior positions include director of research and analysis at the Group Health Association of America, assistant professor with the Department of Health Policy and Administration at The University of North Carolina, and director of policy analysis and program evaluation at the Maryland Department of Health and Mental Hygiene. Dr. Gold is on the
editorial board of Health Affairs and Health Services Research. She received her doctorate of science in health services and evaluation research from Harvard School of Public Health.
Brian Burwell is vice president, community living systems at Truven Health Analytics in Cambridge, Massachusetts. Mr. Burwell conducts research, provides consulting services, policy analysis, and technical assistance in financing and delivery of long-term services and supports, and data analysis related to integrated care models for dually eligible beneficiaries and managed long-term services and supports. He has been with Truven Health Analytics and its predecessor companies for 30 years. Mr. Burwell received his bachelor of arts degree from Dartmouth College.
Sharon Carte, MHS, has served as executive director of the West Virginia Children’s Health Insurance Program since 2001. From 1992 to 1998, Ms. Carte was deputy commissioner for the Bureau for Medical Services, overseeing West Virginia’s Medicaid program. Previously, she was an administrator of skilled and intermediate-care nursing facilities and a coordinator of human resources development in the West Virginia Department of Health. Ms. Carte’s experience includes work with senior centers and aging programs throughout West Virginia as well as with policy issues related to behavioral health and long-term services and supports for children. She received her master of health science from the Johns Hopkins University School of Hygiene and Public Health.
Andrea Cohen, JD, is senior vice president for program at the United Hospital Fund, a non-profit health services research and philanthropic organization with the mission to shape positive change in health care for New Yorkers. She directs the Fund’s program work and oversees grant making and conference activities. From 2009 to 2014, she served as director of health services in the New York City Office of the Mayor, where she coordinated and developed strategies to

February 201694
Appendix D
improve public health and health services. Prior professional positions include counsel with Manatt, Phelps & Phillips, LLP; senior policy counsel at the Medicare Rights Center; health and oversight counsel for the U.S. Senate Committee on Finance; and trial attorney with the U.S. Department of Justice. She received her law degree from Columbia University School of Law.
Gustavo Cruz, DMD, MPH, is an oral health policy consultant and senior advisor to Health Equity Initiative, a professional membership organization in New York City that brings together community leaders and professionals in diverse fields to promote innovations in health equity. He also serves as resident advisor to the dental public health residency at Lutheran Medical Center and as adjunct associate professor in the Department of Epidemiology and Health Promotion at New York University College of Dentistry (NYUCD). Dr. Cruz was a Robert Wood Johnson Foundation Health Policy Fellow in 2009–2010, working in the office of the Secretary of the U.S. Department of Health and Human Services. Subsequently, he served as chief of the Oral Health Branch, Bureau of Health Professions, at the Health Resources and Services Administration. He previously served as director of public health and health promotion at NYUCD and as governing faculty of New York University’s master’s degree program in global public health. Dr. Cruz has conducted numerous research studies on the oral health of U.S. immigrants, oral health disparities, oral and pharyngeal cancers, and access to oral health care among underserved populations, as well as on the effects of race, ethnicity, acculturation, and culturally influenced behaviors on oral health outcomes and health services utilization. He received his degree in dentistry from the University of Puerto Rico and his master of public health from Columbia University’s School of Public Health. He is a diplomate of the American Board of Dental Public Health.
Toby Douglas, MPP, MPH, is an independent consultant and senior advisor for Sellers Dorsey, assisting organizations involved with Medicaid,
health insurance exchanges, and Medicare. Previously, he served as the director of the California Department of Health Care Services as well as Medicaid director, during which time he also served as a board member of the National Association of Medicaid Directors. Prior to working for the state of California, Mr. Douglas worked for the San Mateo County Health Department in California and was a consultant with Kaiser Permanente Consulting on pharmacy utilization. He received his master of public policy and master of public health from the University of California, Berkeley.
Leanna George is the parent of a 13-year-old with a disability who is covered under Medicaid and a 9-year-old covered under the State Children’s Health Insurance Program (CHIP). A resident of Benson, North Carolina, Ms. George serves on the Johnston County Consumer and Family Advisory Committee, which advises the Board of the County Mental Health Center. She also serves on the Alliance Innovations Stakeholders Group, which advises a Medicaid managed care organization and the state of North Carolina about services and coverage for developmentally disabled enrollees, and on the Client Rights Committee of the Autism Society of North Carolina, a Medicaid provider agency.
Christopher Gorton, MD, MHSA, is the president of public plans at Tufts Health Plan, a non-profit health plan in Massachusetts, Rhode Island, and New Hampshire. Previously, Dr. Gorton was chief executive officer of a regional health plan that was acquired by the Inova Health System of Falls Church, Virginia. Other positions have included vice president for medical management and worldwide health care strategy for Hewlett Packard Enterprise Services and president and chief medical officer for APS Healthcare, a behavioral health plan and care management organization based in Silver Spring, Maryland. After beginning his career as a practicing pediatrician in federally qualified health centers in Pennsylvania and Missouri, Dr. Gorton served as chief medical officer in the Pennsylvania Department of Public Welfare. Dr. Gorton received his degree in medicine from Columbia University’s

Report to Congress on Medicaid Disproportionate Share Hospital Payments 95
Appendix D
College of Physicians and Surgeons and his master of health systems administration from the College of Saint Francis in Joliet, Illinois.
Herman Gray, MD, MBA, is president and CEO of United Way for Southeastern Michigan. Prior to assuming this post in September 2015, he served as executive vice president for pediatric health services for the Detroit Medical Center, a position he accepted after eight years as CEO/president of the Detroit Medical Center Children’s Hospital of Michigan. At Children’s Hospital of Michigan, Dr. Gray also served as chief operating officer, chief of staff, and vice chief of education in the department of pediatrics. He also served as vice president for graduate medical education (GME) at the Detroit Medical Center and associate dean for GME at Wayne State University School of Medicine. Dr. Gray has served as the chief medical consultant at the Michigan Department of Public Health, Children’s Special Health Care Services, as well as vice president/medical director of clinical affairs at Blue Care Network, a subsidiary of Blue Cross Blue Shield of Michigan. He has received the Michigan Hospital Association Health Care Leadership Award and Modern Healthcare’s Top 25 Minority Executives in Healthcare Award and is a member of the board of trustees for the Skillman Foundation. He received his medical degree from the University of Michigan, a master of business administration from the University of Tennessee, and completed his pediatrics training at the Children’s Hospital of Michigan/Wayne State University.
Stacey Lampkin, FSA, MAAA, MPA, is an actuary and principal with Mercer Government Human Services Consulting where she leads actuarial work for several state Medicaid programs. She previously served as actuary and assistant deputy secretary for Medicaid finance and analytics at Florida’s Agency for Health Care Administration, and as an actuary at Milliman. She has also served as a member of the Federal Health Committee of the American Academy of Actuaries (AAA), as vice chairperson of AAA’s Uninsured Work Group, and as a member of the Society of Actuaries project
oversight group for research on evaluating medical management interventions. Ms. Lampkin is a fellow in the Society of Actuaries and a member of the AAA. She received her master of public administration from Florida State University.
Charles Milligan, JD, MPH, is CEO of United Healthcare Community Plan of New Mexico, a Medicaid managed care organization with enrolled members in all Medicaid eligibility categories (including dually eligible beneficiaries and adults in Medicaid expansion programs) that provides somatic, behavioral, and managed long-term services and supports. Mr. Milligan is a former state Medicaid and CHIP director in New Mexico and Maryland. He also served as executive director of the Hilltop Institute, a health services research center at the University of Maryland at Baltimore County, and as vice president at The Lewin Group. Mr. Milligan directed the 2005–2006 Commission on Medicaid and has conducted Medicaid-related research projects in numerous states. He received his master of public health from the University of California, Berkeley, and his law degree from Harvard Law School.
Sheldon Retchin, MD, MSPH, is executive vice president for health sciences and chief executive officer of The Ohio State University Wexner Medical Center in Columbus. Dr. Retchin’s research and publications have addressed costs, quality, and outcomes of health care as well as workforce issues. From 2003 until his appointment at Ohio State in 2015, he served as senior vice president for health sciences at Virginia Commonwealth University (VCU) and as CEO of the VCU Health System, in Richmond, Virginia. Dr. Retchin also led a Medicaid health maintenance organization with approximately 200,000 covered lives through which, for 15 years, he and his colleagues helped manage care for 30,000 uninsured individuals in the Virginia Coordinated Care program. Dr. Retchin received his medical degree from The University of North Carolina School of Medicine and his master of science in public health from The University of North Carolina School of Public Health.
February 201696
Appendix D
Norma Martínez Rogers, PhD, RN, FAAN, is a professor of family nursing at The University of Texas (UT) Health Science Center at San Antonio. She has held clinical and administrative positions in psychiatric nursing and at psychiatric hospitals, including the William Beaumont Army Medical Center in Fort Bliss during Operation Desert Storm. She is dedicated to working with those who face health disparities in the health care system, and is the founder and president of the National Latino Nurse Faculty Association. She has initiated a number of programs at the UT Health Science Center, including a mentorship program for retention of minorities in nursing education. She was a founding board member of a non-profit organization, Martínez Street Women’s Center, designed to provide support and educational services to women and teenage girls. Dr. Martínez Rogers is a fellow of the American Academy of Nursing and a past president of the National Association of Hispanic Nurses. She received her master of science in psychiatric nursing from the UT Health Science Center at San Antonio and her doctorate in cultural foundations in education from The University of Texas at Austin.
Peter Szilagyi, MD, MPH, was recently named vice chair for clinical research in the Department of Pediatrics at the University of California, Los Angeles. Until that appointment, he served as chief of the division of general pediatrics and professor of pediatrics at the University of Rochester and as associate director of the Center for Community Health within the University of Rochester’s Clinical Translational Research Institute. His research has addressed CHIP and child health insurance, access to care, quality of care, and health outcomes, including the delivery of primary care with a focus on immunization delivery, health care financing, and children with chronic disease. For the past 18 years, he was chairman of the board of the Monroe Plan for Medical Care, a large Medicaid and CHIP managed care plan in upstate New York. He is editor in chief of Academic Pediatrics and has served as the president of the Academic Pediatric Association.
Dr. Szilagyi received his medical and public health degrees from the University of Rochester.
Penny Thompson, MPA, is principal of Penny Thompson Consulting, LLC, and provides consulting services in the areas of health care delivery and payment, information technology development, and program integrity. Previously, she served as deputy director of the Center for Medicaid and CHIP Services at the Centers for Medicare & Medicaid Services (CMS). Ms. Thompson has held senior positions in management consulting at information technology companies, and was director of health care strategy and planning for Hewlett Packard’s health care business unit. In addition, she previously served as CMS’s director of program integrity and as chief of the health care branch within the Office of Inspector General at the U.S. Department of Health and Human Services. Ms. Thompson received her master of public administration from The George Washington University.
Alan Weil, JD, MPP, is editor-in-chief of Health Affairs, a multidisciplinary peer-reviewed health policy journal, in Bethesda, Maryland. He is an elected member of the National Academy of Medicine and served six years on its Board on Health Care Services. He is a trustee of the Consumer Health Foundation and a member of the Kaiser Commission on Medicaid and the Uninsured. He previously served as executive director of the National Academy for State Health Policy, director of the Urban Institute’s Assessing the New Federalism Project, executive director of the Colorado Department of Health Care Policy and Financing, and assistant general counsel in the Massachusetts Department of Medical Security. He received a master’s degree from Harvard University’s John F. Kennedy School of Government and a law degree from Harvard Law School.
Report to Congress on Medicaid Disproportionate Share Hospital Payments 97
Appendix D
Biographies of StaffAnnie Andrianasolo, MBA, is executive assistant. She previously held the position of special assistant for global health at the Public Health Institute and was a program assistant for the World Bank. Ms. Andrianasolo has a bachelor of science in economics and a master of business administration from Johns Hopkins Carey Business School.
Amy Bernstein, ScD, MHSA, is a policy director and contracting officer. She manages and provides oversight and guidance for all MACPAC research, data, and analysis projects, including statements of work, research plans, and all deliverables and products. She also directs and conducts policy analyses. Her previous positions have included director of the Analytic Studies Branch at the U.S. Centers for Disease Control and Prevention’s (CDC) National Center for Health Statistics and senior analyst positions at the Alpha Center, the Prospective Payment Assessment Commission, the National Cancer Institute, and the Agency for Healthcare Research and Quality (AHRQ). Dr. Bernstein earned a master of health services administration from the University of Michigan School of Public Health and a doctor of science from the School of Hygiene and Public Health at Johns Hopkins University.
James Boissonnault, MA, is chief information officer. Prior to joining MACPAC, he was the information technology (IT) director and security officer for OnPoint Consulting. At OnPoint, he also worked on several federal government projects, including those for the Missile Defense Agency, the U.S. Department of the Treasury, and the U.S. Department of Agriculture. He has nearly two decades of IT and communications experience. Mr. Boissonnault holds a master of arts in Slavic languages and literatures from The University of North Carolina and a bachelor of arts in Russian from the University of Massachusetts.
Kacey Buderi, MPA, is an analyst. Prior to joining MACPAC, she worked in the Center
for Congressional and Presidential Studies at American University and completed internships in the office of U.S. Senator Ed Markey and at the U.S. Department of Health and Human Services (HHS). Ms. Buderi holds a master of public administration and a bachelor of arts in political science, both from American University.
Kathryn Ceja is director of communications. Previously, she served as lead spokesperson for Medicare issues in the Centers for Medicare & Medicaid Services (CMS) press office. Prior to her tenure in the press office, Ms. Ceja was a speechwriter for the Secretary of HHS as well as the speechwriter for a series of CMS administrators. Ms. Ceja holds a bachelor of arts in international studies from American University.
Veronica Daher, JD, is a senior analyst. Previously, she was a health policy analyst for the Health Safety Net program at the Massachusetts Executive Office of Health and Human Services, where she focused on developing policy in response to the Patient Protection and Affordable Care Act (ACA, P.L. 111-148, as amended). Her work now focuses on how the ACA will affect Medicaid and the State Children’s Health Insurance Program (CHIP). Ms. Daher received her law degree from the University of Richmond and a bachelor of arts from the University of Virginia.
Benjamin Finder, MPH, is a senior analyst. His work focuses on benefits and payment policy. Prior to joining MACPAC, he served as an associate director in the Health Care Policy and Research Administration at the District of Columbia Department of Health Care Finance, and as an analyst at the Henry J. Kaiser Family Foundation. Mr. Finder holds a master of public health from The George Washington University, where he concentrated in health policy and health economics.
Moira Forbes, MBA, is a policy director, focusing on payment policy. Previously, she served as director of the division of health and social service programs in the Office of Executive Program Information at HHS

February 201698
Appendix D
and as a vice president in the Medicaid practice at The Lewin Group. At Lewin, Ms. Forbes worked with every state Medicaid and CHIP program on issues relating to program integrity and eligibility quality control. She has extensive experience with federal and state policy analysis, Medicaid program operations, and delivery system design. Ms. Forbes has a master of business administration from The George Washington University and a bachelor’s degree in Russian and political science from Bryn Mawr College.
Benjamin Granata is finance and budget specialist. He reviews financial documents to ensure completeness and accuracy for processing and recording in the financial systems. Mr. Granata graduated from Towson University with a bachelor’s degree in business administration, specializing in project management.
Martha Heberlein, MA, is a principal analyst. Prior to joining MACPAC, she was the research manager at the Georgetown University Center for Children and Families, where she oversaw a national survey on Medicaid and CHIP eligibility, enrollment, and renewal procedures. Ms. Heberlein received a master of arts in public policy with a concentration in philosophy and social policy from The George Washington University and a bachelor of science in psychology from James Madison University.
Kayla Holgash, MPH, is an analyst focusing on payment policy. Prior to joining MACPAC, Ms. Holgash worked as a senior research assistant in the Department of Health Policy and Management at The George Washington University and as a health policy legislative intern for U.S. Senator Charles Grassley. Before that, she served as the executive manager of the Health and Wellness Network for the Homewood Children’s Village, a non-profit organization in Pittsburgh, Pennsylvania. Ms. Holgash holds a master of public health from The George Washington University and a bachelor of science in public and community health from the University of Maryland.
Joanne Jee, MPH, is a principal analyst focusing on CHIP and children’s coverage. Prior to joining MACPAC, she was a program director at the National Academy for State Health Policy, where she focused on children’s coverage issues. Ms. Jee also has been a senior analyst at the U.S. Government Accountability Office (GAO), a program manager at The Lewin Group, and a legislative analyst in the HHS Office of Legislation. Ms. Jee has a master of public health from the University of California, Los Angeles, and bachelor of science in human development from the University of California, Davis.
Allissa Jones is administrative assistant. Prior to joining MACPAC, she worked as an intern for Kaiser Permanente, where she helped coordinate health and wellness events in the Washington, DC area. Ms. Jones holds a bachelor of science with a concentration in health management from Howard University.
Sarah Melecki, MPAff, is a senior analyst focusing on a variety of issues, including Medicaid expansion, behavioral health services, the integration of Medicaid and other social programs, and dental coverage. Prior to joining MACPAC, she worked on ACA implementation and health care cost drivers at Consumers Union. Ms. Melecki also has served as district director to Texas state representative Jessica Farrar, and as a research assistant at the University of Nebraska Public Policy Center. She holds a master of public affairs from the LBJ School of Public Affairs at The University of Texas at Austin and a bachelor of arts in political science from the University of Nebraska at Lincoln.
Robert Nelb, MPH, is a senior analyst focusing on issues related to Medicaid payment and delivery system reform. Prior to joining MACPAC, he served as a health insurance specialist at CMS, leading projects related to CHIP and Medicaid Section 1115 demonstrations. Mr. Nelb has a master of public health and a bachelor’s degree in ethics, politics, and economics from Yale University.

Report to Congress on Medicaid Disproportionate Share Hospital Payments 99
Appendix D
Chris Park, MS, is a principal analyst. He focuses on issues related to managed care payment and Medicaid drug policy and has lead responsibility for MACStats. Prior to joining MACPAC, he was a senior consultant at The Lewin Group, where he provided quantitative analysis and technical assistance on Medicaid policy issues, including managed care capitation rate setting and pharmacy reimbursement and cost containment initiatives. Mr. Park holds a master of science in health policy and management from the Harvard School of Public Health and a bachelor of science in chemistry from the University of Virginia.
Laura Beth Pelner is communications and graphic design specialist. Prior to coming to MACPAC, Ms. Pelner worked in the Washington, DC, non-profit sector in the fields of communications and design. She also worked on the creative team of a New York City advertising agency. Ms. Pelner is a former Peace Corps Volunteer who served in Ghana, West Africa, where she taught IT at the college level. She holds a bachelor of fine arts in advertising from Syracuse University.
Chris Peterson, MPP, is a principal analyst. Prior to joining MACPAC, he was a specialist in health care financing at the Congressional Research Service, where he worked on major health legislation. Prior to that, he worked for AHRQ and the National Bipartisan Commission on the Future of Medicare. Mr. Peterson has a master of public policy from Georgetown University and a bachelor of science in mathematics from Missouri Western State University.
Ken Pezzella is chief financial officer. He has more than 10 years of federal financial management and accounting experience in both the public and private sectors. Mr. Pezzella also has broad operations and business experience, and is a veteran of the U.S. Coast Guard. He holds a bachelor of science in accounting from Strayer University.
Anne L. Schwartz, PhD, is executive director. She previously served as deputy editor at Health Affairs; vice president at Grantmakers In Health, a national organization providing strategic advice and educational programs for foundations and corporate giving programs working on health issues; and special assistant to the executive director and senior analyst at the Physician Payment Review Commission, a precursor to the Medicare Payment Advisory Commission (MedPAC). Earlier, she held positions on committee and personal staff for the U.S. House of Representatives. Dr. Schwartz earned a doctorate in health policy from the School of Hygiene and Public Health at Johns Hopkins University.
Anna Sommers, PhD, MS, MPAff, is a principal analyst. Previously, she held research positions at the Center for Studying Health System Change (HSC), the Hilltop Institute, University of Maryland, and the Urban Institute. At HSC, she published Medicaid briefs on high-cost use, specialty care access, and physician workforce, and led design of the Autoworkers Health Care Survey. At Hilltop, she led an evaluation of New Mexico’s CHIP program and served as senior consultant on a range of analyses for Maryland’s Medicaid program and the Maryland Health Services and Cost Review Commission. Dr. Sommers has a doctorate and a master of science in health services research, policy, and administration from the University of Minnesota School of Public Health, and a master of public affairs from its Hubert H. Humphrey Institute of Public Affairs.
Mary Ellen Stahlman, MHSA, is a policy and congressional affairs director. Previously, she held positions at the National Health Policy Forum, focusing on Medicare issues including private plans and the Medicare drug benefit. She served at CMS and its predecessor agency, the Health Care Financing Administration, for 18 years, including as deputy director of policy. Ms. Stahlman received a master of health services administration from The George Washington University and a bachelor of arts from Bates College.

February 2016100
Appendix D
Kristal Vardaman, MSPH, is a principal analyst focused on long-term services and supports and on high-cost, high-need populations. Previously, she was a senior analyst at the GAO and a consultant at Avalere Health. Ms. Vardaman holds a master of science in public health from The University of North Carolina at Chapel Hill and a bachelor of science from the University of Michigan. She currently is pursuing a doctorate in public policy from The George Washington University.
Ricardo Villeta, MBA, is deputy director for operations, finance, and management with overall responsibility for operations related to financial management and budget, procurement, human resources, and IT. Previously, he was the senior vice president and chief management officer for the Academy for Educational Development, a private non-profit educational organization that provided training, education and technical assistance throughout the United States and in more than 50 countries. Mr. Villeta holds a master of business administration from The George Washington University and a bachelor of science from Georgetown University.
Katie Weider, MPH, is a senior analyst. She focuses on issues related to individuals who are eligible for both Medicaid and Medicare. Prior to joining MACPAC, she served as a senior research assistant at The George Washington University and as a health policy intern for U.S. Senator Charles Grassley. Ms. Weider received a master of public health from The George Washington University and a bachelor’s degree in health science and public health from Boston University.
Eileen Wilkie is administrative officer and is responsible for coordinating human resources, office maintenance, travel, and Commission meetings. Previously, she held similar roles at National Public Radio and the National Endowment for Democracy. Ms. Wilkie has a bachelor’s degree in political science from the University of Notre Dame.


Printed on recycled material
1800 M Street NWSuite 650 South Washington, DC 20036
www.macpac.gov 202-350-2000202-273-2452
Advising Congress on Medicaid and CHIP Policy