Report Task 3546 - vliz.be fileDevelopment of an integrated approach for the removal of tributyltin...
48
LIFE02 ENV/B/000341 Development of an integrated approach for the removal of tributyltin (TBT) from waterways and harbors: Prevention, treatment and reuse of TBT contaminated sediments Task 3546 Sediment characterization Kris Pynaert and Lode Speleers Hekkestraat 51, Hofstade-Aalst B-9308, Belgium
Transcript of Report Task 3546 - vliz.be fileDevelopment of an integrated approach for the removal of tributyltin...

LIFE02 ENV/B/000341
Development of an integrated approach for the
removal of tributyltin (TBT) from waterways and harbors:
Prevention, treatment and reuse of TBT contaminated sediments
Task 3546 Sediment characterization
Kris Pynaert and Lode Speleers
Hekkestraat 51, Hofstade-Aalst
B-9308, Belgium

Task 3546: Sediment characterization TBT-CLEAN
2
TABLE OF CONTENTS EXECUTIVE SUMMARY......................................................................................................... 5 1. GENERAL INTRODUCTION............................................................................................. 6
1.1. Organotin chemicals: structure.............................................................................. 6 1.2. Commercial applications of organotins and possible alternatives ........................ 6 1.2.1. Mono- and diorganotin chemicals.................................................... 6 1.2.2. Triorganotin chemicals..................................................................... 8 1.3. Tributyltin more in detail ...................................................................................... 12 1.3.1. Chemical structure............................................................................ 12 1.3.2. Aquatic chemistry of tributyltin ....................................................... 12 1.3.3. Chemical features of TBT released in the environment................... 13 1.3.4. Ecotoxicology of TBT...................................................................... 19
2. TASK OBJECTIVES AND EXPERIMENTAL WORK ..................................................... 21 2.1. Task objectives...................................................................................................... 21
2.2. Experimental work ................................................................................................ 21 2.2.1. Analytical principle of contaminant measurements ......................... 21 2.2.2. First sediment sampling and contaminant screening........................ 23 2.2.3. Second sediment sample collection.................................................. 27 2.2.4. Sediment characterization ................................................................ 30
3. CONCLUSIONS AND FURTHER RESEARCH PERSPECTIVES................................... 43
4. RECOMMENDATIONS (BY DEC AND ENVISAN) TOWARDS POSSIBLE REMEDIATION OF THE SEDIMENT, BASED ON SEDIMENT CHARACTERIZATION RESULTS................................................................................................................................. 44
4.1. Sediment sample quality ....................................................................................... 44 4.2. Remediation techniques ........................................................................................ 44 4.2.1. Physical-chemical separation ........................................................... 44 4.2.2. Thermal treatment ............................................................................ 45 4.2.3. Electrochemical treatment................................................................ 45 4.2.4. Bioremediation ................................................................................. 45 4.2.5. Phytoremediation ............................................................................. 45
5. REFERENCE LIST............................................................................................................... 46

Task 3546: Sediment characterization TBT-CLEAN
3
LIST OF FIGURES Figure 1. Chemical structure of the four organotin classes; Sn = central tin atom (4+), R = alkyl- or arylgroup and X = chloride, fluoride, oxide, hydroxide, acetate, carboxylate or thioglycolate. Figure 2. Chemical structure of bis(tributyltin)oxide, the active ingredient of some antifouling paints (Bu = C4H9
-). Figure 3. Photograph of a Van Veen grab used for sediment sampling Figure 4. Location of 16 sediment samples taken for the screening of TBT and other contamination in the Port of Antwerp Figure 5. Sample locations of the second sediment sampling action (indicated as 2.1 to 2.10, see Table 5). Photograph shows an enlargement of the area of Antwerp ship repair within the Antwerp harbour (GIS-map Gemeentelijk Havenbedrijf Antwerpen). Figure 6. Photograph of the harbour with indication of the nine selected sample locations that were used for further characterization (GIS-map Gemeentelijk Havenbedrijf Antwerpen). Figure 7. Histogram of the grain size distribution of the heavily TBT-contaminated sediment samples Figure 8. Histogram of the grain size distribution of the moderately TBT-contaminated sediment samples Figure 9. Histogram of the grain size distribution of the relatively low-contaminated sediment samples. Figure 10. Average and standard deviation (n = 9) of the dry weight and volatile solids distribution in the selected sediment samples. Figure 11. TBT+ distribution in the fractions of the high-contaminated sediment samples Figure 12. TBT+ distribution in the fractions of the medium-contaminated sediment samples Figure 13. TBT+ distribution in the fractions of the relatively low-contaminated sediment samples. Figure 14. TBT+ distribution in the fractions of sample 1, taken in the immediate proximity of a dry dock wastewater disposal point. Figure 15. Ratio of TBT+ to TOC in fractions of all nine selected samples. S1 to S3 are highly TBT-contaminated, S4 to S6 medium-contaminated and S7 to S9 are relatively low-contaminated. Figure 16. Distribution of heavy metals and PAHs in the heavily TBT-contaminated samples. Figure 17. Distribution of heavy metals and PAHs in the moderately TBT-contaminated samples. Figure 18. Distribution of heavy metals and PAHs in the relatively low TBT-contaminated samples.

Task 3546: Sediment characterization TBT-CLEAN
4
LIST OF TABLES Table 1. Reported particle-water partition coefficients for TBT (from Harris et al. (20)) Table 2. Ecotoxicological effects of TBT at different concentrations (in seawater) Table 3. Analytical determination of important contaminants in 16 samples taken at various locations in the Port of Antwerp. Sample locations are indicated in Fig. 4 (analyses by PIH) Table 4. Correlation matrix of several important contaminants in 16 samples from different locations in the Antwerp Port (based on data obtained from analyses by PIH) Table 5. Screening for organotin compounds (TBT+ = tributyltin; DBT2+ = dibutyltin; MBT3+ = monobutyltin; TPhT+ = triphenyltin; DPhT2+ = diphenyltin; MPhT3+ = monophenyltin) in samples in the proximity of Antwerp ship repair. Exact sample locations are shown in Fig. 5. Table 6. Overview of butyl- and phenyltin compounds in 9 selected sediment samples close to (first 5) and at a distance (last 4) of the ship repair yard. The sampling points are indicated on the photograph of the harbour in Fig. 6. Table 7. Some important grain size distribution characteristics (expressed in µm) Table 8. Averages and standard deviation (n = 9) of local sediment grain size distribution characteristics (expressed in µm) Table 9. Average correlation and standard deviation (n=9) between different contaminants in the four sample fractions that were examined.

Task 3546: Sediment characterization TBT-CLEAN
5
EXECUTIVE SUMMARY Organotin compounds are man-made chemicals, synthesized for specific applications such as in PVC stabilization and agrochemical industry, chemical catalysis and as biocides. For decades, tributyltin (TBT) has been used as the active component in antifouling paints for ship hull protection, and is by some considered to be the most toxic compound ever deliberately introduced in the marine environment. Due to its chemical nature, both showing metal ion and hydrophobic material characteristics, literature data show that TBT has a strong tendency to partition out of the water phase to the sediment once it is released from the paint. Many sediments at busy shipping sites, like harbors and marinas, were shown to be enriched in TBT, and could as such serve as a secondary source of TBT and be of environmental concern. In this task of the project, we aimed at characterizing the Antwerp Port sediment in order to obtain data on organotin and other contaminant concentrations, their distribution and possible correlation in the different sediment fractions, … During two sample collections, using a Van Veen grab which samples the top sediment layer, sediments samples were obtained with varying levels of TBT contamination. In most of the harbor sampling sites, relatively low TBT concentrations were measured (≤ 100 µg/kg DW), the Antwerp Shipping repair site however proved to be a black spot, with concentrations up to more than 40 mg/kg DW. Other contaminants, like PAHs, EOX, heavy metals, … , are significantly present (not correlated), but most sediment samples have a hygienic quality which complies with the regulation for reuse on land as building material (according to VLAREA). Samples of different TBT contamination levels were characterized more in detail, and the top layer of the sediment phase was shown to mainly consist of clay and small silt particles [D(v;50) ≅ 12 µm]. Sieving of the samples (63, 125 and 250 µm sieves) confirmed the grain size distribution results, with only 10 to 30 mass% >63 µm. Unusually high TBT concentrations (>90 mg/kg) were measured in the >250 µm fraction of the highly contaminated samples, possibly indicating the presence of TBT paint flakes (needs to be microscopically confirmed). However, no clean fractions could be determined, which is most-likely a restriction for the physical-chemical remediation techniques like separation by hydrocycloning. TBT did show a correlation with other contaminants like TOC, heavy metals and mineral oil in the different fractions of the samples. This could be useful in remediation techniques like density-separation (also separating paint particles) and/or flotation. The results presented in this report can serve as the basis for decisions on possible pilot-scale remediation technologies to be used in the near future, but should however be compared with characteristics of other important European ports in order to be able to propose a general remediation technology for TBT-contaminated sediment. In an addendum to this report, the remaining questions on this topic will be handled.

Task 3546: Sediment characterization TBT-CLEAN
6
1. GENERAL INTRODUCTION 1.1. Organotin chemicals: structure Organotin chemicals are those compounds containing at least one bond between tin and carbon. The central tin (Sn4+) can bind to one (mono-), two (di-), three (tri-) or four (tetrasubstituted) carbon groups and the group of organotin chemicals is thus quite extensive and diverse. A representation of the chemical formulas for these four groups of organotin compounds is shown in Fig. 1.
Sn Sn Sn Sn
R R R R
R
R R
R R
RXX X X X
X
RSnX3Mono-organotin
R2SnX2Di-organotin
R3SnXTri-organotin
R4SnTetra-organotin
Sn Sn Sn Sn
R R R R
R
R R
R R
RXX X X X
X
SnSn SnSn SnSn SnSn
R R R R
R
R R
R R
RXX X X X
X
RSnX3Mono-organotin
R2SnX2Di-organotin
R3SnXTri-organotin
R4SnTetra-organotin
Figure 1. Chemical structure of the four organotin classes; Sn = central tin atom (4+), R = alkyl- or arylgroup and X = chloride, fluoride, oxide, hydroxide, acetate, carboxylate or
thioglycolate.
1.2. Commercial applications of organotins and possible alternatives Organotin compounds do not occur as natural chemicals and are produced by man for several applications. The commercially important compounds mainly belong to the alkyltins (methyl-, butyl- and octyltins) but phenyltins and cyclohexyltins have also been frequently used. The majority of organotin uses are comprised of five major commercial applications: PVC heat stabilizers, catalysts, glass coatings, agrochemicals and biocides. 1.2.1. Mono- and diorganotin chemicals 1.2.1.1. PVC heat stabilizers Organotins were used as heat stabilizers for the first time in the late 1940’s. Mono- and especially diorganotins were/are used extensively as stabilizers for processing polyvinyl chloride (PVC).

Task 3546: Sediment characterization TBT-CLEAN
7
The primary purpose of these tin stabilizers is to reduce the polymer backbone degradation of the PVC. They do this by scavenging the HCl lost during processing at high temperatures and stabilizing the unstable chloride sites in the PVC molecule. Diorganotin concentrations of 0,5 to 2% on polymer weight basis are sufficient for stabilisation (6). Tin acts as a base, and reacts with the HCl initially released during PVC processing. The strength of the base is critical, so it will not extract HCl from the PVC, but only react with the HCl that is already released. Mono- and diorganotins are two of the few bases with the right balance of reactivity to allow this. One of the most effective PVC stabilizers is tin mercaptide, containing both tin and sulphur. The high molecular weight and ester function in the mercaptan ligands (the chemical group attached to the tin atom) also promote solubility of the stabilizer in PVC and provide lubrication during polymer processing. There are three major types of tin stabilizers, which can be distinguished by their respective alkyl groups: octyl, butyl, and methyl. Octyltin stabilizers have the lowest tin content and are somewhat less efficient. However, they are approved for food contact applications by most regulatory authorities worldwide. Butyltin stabilizers have been the dominant types used until methyltins were introduced. The latter have a higher tin content and lower raw material cost compared to the other two types. Some formulations (mercaptides) have also been approved for food contact applications. The main applications for tin stabilizers are building products, such as pipes and fittings, and siding and profiles (windows, etc.), packaging, and flexible PVC. The substitutes for tin stabilizers are manufactured from lead or mixed metals such as calcium/zinc. Lead stabilizers have the benefit of low cost but are declining in use due to environmental concerns. Tin and mixed metal stabilizers are in fact replacing them, but the latter technology is more expensive than tin, and less effective in stabilisation. It is estimated that 12 to 13 Ktons of tin are used annually in tin stabilizers worldwide and the market is expected to grow 4% annually. 1.2.1.2. Catalysts Catalysts are used to speed up chemical reactions, especially polymerisation. The most common applications for mono- and diorganotin catalysts are in chemical synthesis and the curing of coatings. In chemical synthesis, the organotins are used for the esterification and transesterification of mono- and polyesters. These products are then used for plasticizers, synthetic lubricant manufacturing, and polyester polyol production, as well as some coating applications. As curing catalysts, one of the largest uses of organotins is in electrocoat (E-coat) coatings. These electrocoating products are sold into a wide range of applications, with the largest being automotive, where they provide excellent rust resistance. The catalysts are also used
Task 3546: Sediment characterization TBT-CLEAN
8
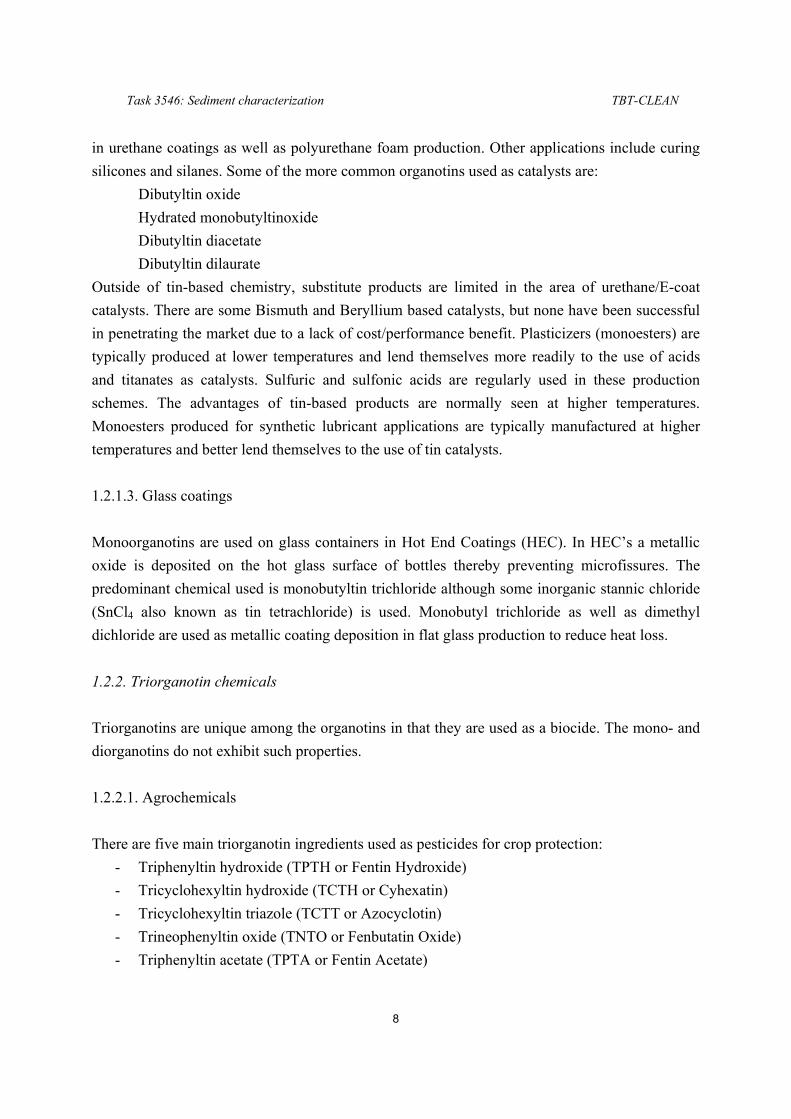
in urethane coatings as well as polyurethane foam production. Other applications include curing silicones and silanes. Some of the more common organotins used as catalysts are: Dibutyltin oxide Hydrated monobutyltinoxide Dibutyltin diacetate Dibutyltin dilaurate Outside of tin-based chemistry, substitute products are limited in the area of urethane/E-coat catalysts. There are some Bismuth and Beryllium based catalysts, but none have been successful in penetrating the market due to a lack of cost/performance benefit. Plasticizers (monoesters) are typically produced at lower temperatures and lend themselves more readily to the use of acids and titanates as catalysts. Sulfuric and sulfonic acids are regularly used in these production schemes. The advantages of tin-based products are normally seen at higher temperatures. Monoesters produced for synthetic lubricant applications are typically manufactured at higher temperatures and better lend themselves to the use of tin catalysts. 1.2.1.3. Glass coatings Monoorganotins are used on glass containers in Hot End Coatings (HEC). In HEC’s a metallic oxide is deposited on the hot glass surface of bottles thereby preventing microfissures. The predominant chemical used is monobutyltin trichloride although some inorganic stannic chloride (SnCl4 also known as tin tetrachloride) is used. Monobutyl trichloride as well as dimethyl dichloride are used as metallic coating deposition in flat glass production to reduce heat loss. 1.2.2. Triorganotin chemicals Triorganotins are unique among the organotins in that they are used as a biocide. The mono- and diorganotins do not exhibit such properties. 1.2.2.1. Agrochemicals There are five main triorganotin ingredients used as pesticides for crop protection:
- Triphenyltin hydroxide (TPTH or Fentin Hydroxide) - Tricyclohexyltin hydroxide (TCTH or Cyhexatin) - Tricyclohexyltin triazole (TCTT or Azocyclotin) - Trineophenyltin oxide (TNTO or Fenbutatin Oxide) - Triphenyltin acetate (TPTA or Fentin Acetate)

Task 3546: Sediment characterization TBT-CLEAN
9
These products are primarily used as fungicides (pesticides to kill or inhibit the growth of fungi) and acaracides (to kill mites and ticks). For high value crops like potatoes and sugar beets, use of the fungicides TPTH and TPTA is justified when the possibility of disease is very high. As acaracides, the efficiency of TCTH, TCTT and TNTO is excellent. They are also not considered susceptible to resistance development. They are used on citrus, top fruit; vines, vegetables and hops. There are substitute products available, depending on the market segment. For example on potatoes, a substitute for TPTH is propamocarb hydrochloride/chlorothalonil and dimethomorph/mancozeb. On sugar beets, tetraconazole can be used. Substitutes for TCTH include dicofol, hexythiazox, propargite, pyribaden, and tebufenpyrad. The organotin products typically have a cost advantage for growers when one considers the rate at which the product is applied, the cost of the product itself, and the number of days between sprayings. However, a single treatment method is not normally used. Growers typically rotate two or three treatment types in order to avoid the buildup of resistance to any one fungicide. 1.2.2.2. Use as biocide in underwater surface protection - Fouling of underwater surfaces Water contains a large variety of living organisms. Estimations indicate that 1 millilitre of water contains up to between 1000 and 10000 living bacterial, algal, … cells. Their adhesion to submerged surfaces is a well-known phenomenon, both in fresh and marine environments. Factors like temperature, light penetration depth and turbidity, nutrient availability (estuaries and marinas), surface roughness, salinity, presence of contaminants and competitors, current strength, … play an important role in this adhesion. Macro-organisms like mussels, oysters, barnacles, … can attach to the ship hull after formation of an initial slime layer by microorganisms, because the latter is a physical adhesion substrate and can protect the macro-organisms from the toxic compounds with which the hull was coated. Fouling can be prevented in a number of ways, many of which have been tried in practice. Electrical methods, use of vibration and ultrasonic waves, UV radiation, controlled release of chlorine and toxic or tension-active compounds, mechanical cleaning with hard brushes and antifouling paints are examples of these treatment methods.

Task 3546: Sediment characterization TBT-CLEAN
10
- Marine antifouling (MAF) paints After the use of copper and lead surfaces as protection to fouling, antifouling paints based on lead, copper, arsenic and mercury were introduced. As a consequence of the high toxicity of arsenic, lead and mercury to humans and the corrosion problems associated with the use of copper (as copperoxide), triorganotin-based antifouling paints were introduced 30 to 40 years ago (11). In the marine antifoulant paint market, mainly tributyltin (TBT) is used as a biocide in paint formulations, although triphenyltins also have biocidal properties. Originally, tributyltinoxide (TBTO) was freely dispersed in what were called Free Association Paints (FAP). These paints had uncontrolled, rapid biocide leaching rates which were shown to exceed the necessary rate for successful antifouling in a number of cases (37). In response to the negative performance and environmental effects of these FAP’s, tributyltin methacrylate copolymer systems were developed which had a self-polishing behaviour. These revolutionary new systems, called Self-Polishing Copolymers (SPC) had controlled, uniform leaching rates of the biocide by incorporating the TBT biocide into the polymeric binding system of the paint formulation. The polymer was hydrophobic and consequently, no water penetrated the paint matrix. At the outside layer, the carboxyl-TBT bond of the TBT-methacrylate is cleaved due to reaction with seawater, and the active biocide is released. This process softens the outside of the paint, thereby smoothening the ship’s hull and lowering fuel consumption. Throughout the 1980’s many countries worldwide began restricting the use of TBT paints due to their environmental impact resulting from the misuse of the product in pleasure craft and other small coastal vessels. In the late 1980’s regulations were set to restrict the use of TBT to vessels larger than 25 m in length. In some cases, regulations also specified the allowable leach rates of MAF paints, as well as restrictions on applications and waste disposal. From the 1st of January 2003, the International Maritime Organization (IMO) intended to ban the application of TBT to vessels, and a total ban on its presence on vessel hulls will be implied on January 1, 2008. Intensive research and development for replacement products for TBT paint has resulted in MAF paints based on binder systems made from copper acrylates, silylacrylates, and zinc acrylates. However, these SPC systems require the addition of co-biocides and booster biocides. These systems are reportedly inferior to the TBT systems and continue to undergo further development in order to match the five to seven year performance of TBT. Questions are also beginning to surface surrounding the environmental impact of the replacement biocides. Second generation replacement products are in the early stages of development. These products, based on silicones and fluoropolymers, are called non-stick or foul release coatings and contain
Task 3546: Sediment characterization TBT-CLEAN
11
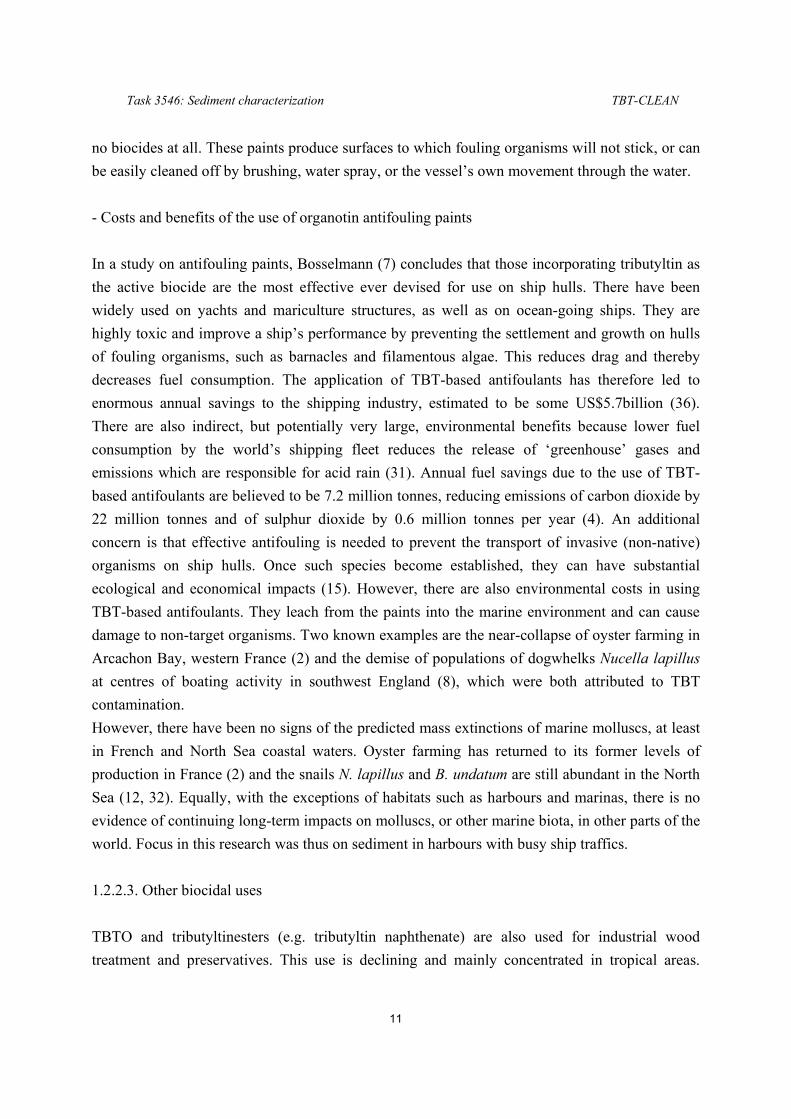
no biocides at all. These paints produce surfaces to which fouling organisms will not stick, or can be easily cleaned off by brushing, water spray, or the vessel’s own movement through the water. - Costs and benefits of the use of organotin antifouling paints In a study on antifouling paints, Bosselmann (7) concludes that those incorporating tributyltin as the active biocide are the most effective ever devised for use on ship hulls. There have been widely used on yachts and mariculture structures, as well as on ocean-going ships. They are highly toxic and improve a ship’s performance by preventing the settlement and growth on hulls of fouling organisms, such as barnacles and filamentous algae. This reduces drag and thereby decreases fuel consumption. The application of TBT-based antifoulants has therefore led to enormous annual savings to the shipping industry, estimated to be some US$5.7billion (36). There are also indirect, but potentially very large, environmental benefits because lower fuel consumption by the world’s shipping fleet reduces the release of ‘greenhouse’ gases and emissions which are responsible for acid rain (31). Annual fuel savings due to the use of TBT-based antifoulants are believed to be 7.2 million tonnes, reducing emissions of carbon dioxide by 22 million tonnes and of sulphur dioxide by 0.6 million tonnes per year (4). An additional concern is that effective antifouling is needed to prevent the transport of invasive (non-native) organisms on ship hulls. Once such species become established, they can have substantial ecological and economical impacts (15). However, there are also environmental costs in using TBT-based antifoulants. They leach from the paints into the marine environment and can cause damage to non-target organisms. Two known examples are the near-collapse of oyster farming in Arcachon Bay, western France (2) and the demise of populations of dogwhelks Nucella lapillus at centres of boating activity in southwest England (8), which were both attributed to TBT contamination. However, there have been no signs of the predicted mass extinctions of marine molluscs, at least in French and North Sea coastal waters. Oyster farming has returned to its former levels of production in France (2) and the snails N. lapillus and B. undatum are still abundant in the North Sea (12, 32). Equally, with the exceptions of habitats such as harbours and marinas, there is no evidence of continuing long-term impacts on molluscs, or other marine biota, in other parts of the world. Focus in this research was thus on sediment in harbours with busy ship traffics. 1.2.2.3. Other biocidal uses TBTO and tributyltinesters (e.g. tributyltin naphthenate) are also used for industrial wood treatment and preservatives. This use is declining and mainly concentrated in tropical areas.

Task 3546: Sediment characterization TBT-CLEAN
12
Wood protection is obtained by submersion, painting or impregnation under vacuum with a 1% TBT solution. 1.3. Tributyltin more in detail 1.3.1. Chemical structure Tributyltin (TBT) is by some authors considered to be the most toxic compound ever deliberately introduced in the marine environment by mankind. It consists of a tin (Sn) atom covalently bonded to three butyl (C4H9
-) moieties and an associated anion. An active compound used as biocide is TBTO, for which the chemical structure is presented in Fig. 2.
Sn OBu
Bu
Bu
Bu
Bu
Bu
SnSn OBu
Bu
Bu
Bu
Bu
Bu
Sn
Figure 2. Chemical structure of bis(tributyltin)oxide, the active ingredient of some antifouling paints (Bu = C4H9
-). 1.3.2. Aquatic chemistry of tributyltin The behaviour of tri-n-butyltin biocides (Bu3SnX), where X is the anion (e.g. oxide, sulfide, acetate, fluoride), may be described by the following equation for the undissociated (neutral) compound and for the dissociated (positively charged) cation upon reaction with water: Bu3SnX + H2O → Bu3Sn(H2O)+ + X- Toxicity of TBT is attributed to the cation, and not to the anion associated with the biocide in the neutral compound. In aquatic systems, the distribution of TBT species is dependent on pH and salinity. In seawater, the hydrated TBT cation, tributyltin chloride, bis(tributyltin) carbonate, and tributyltin hydroxide are in equilibrium. At pH 8, the normal pH of seawater, the major species are tributyltin hydroxide and tributyltin carbonate. There are two principal pathways by which butyltin compounds associated with antifouling paints can enter the aquatic environment. The first is the release of butyltin compounds from the

Task 3546: Sediment characterization TBT-CLEAN
13
underwater hull of the vessel, which represents a continuous source of the biocide when the coated vessels are in a harbor or estuary. The second is the intermittent release of butyltin compounds from boat and shipyard activities associated with hull painting, cleaning, and paint-removal activities. Field studies have generally found that the highest TBT concentrations have occurred in yacht harbors and marinas (2, 3, 16, 35, 38, 40, 42). 1.3.3. Chemical features of TBT released in the environment Much of the behaviour of a compound in the environment can be predicted by following its behaviour in the different environmental compartments. The partition coefficients indicate the occurrence of the substance in the various environmental compartments under equilibrium conditions. Although the main cause for concern has been the effect of TBT on marine and freshwater life, TBT is relatively insoluble in water (26) and readily partitions out of it. This is reflected in a number of partition coefficients, as described below. 1.3.3.1. The sediment/water distribution coefficient, Kd Kd = (chemical in the sediment phase) [µg/kg]/(chemical in the aqueous phase) [µg/L] This value varies for TBT in function of the sediment type, but is typically > 100 L/kg at around neutral conditions. The compound is considered not very mobile and will thus concentrate in soil sediment (39). 1.3.3.2. The organic carbon binding coefficient Another way of predicting mobility is to determine its binding to organic material. Koc is an indicator for the tendency to associate with organic material (humus), which is usually common in dredged material from maintenance dredging. Koc = Kd / % organic carbon in sample Mobile chemicals would have Koc values < 0,5. TBT has Koc values typically >> 1. Koc values for silt of 25 l g-1 are not uncommon. Koc is much more representative for the behaviour of complex organic compounds than Kd.

Task 3546: Sediment characterization TBT-CLEAN
14
1.3.3.3. The octanol-water partitioning coefficient The potential of a substance to concentrate up the food chain is indicated by the Hansch coefficient Pow(or the octanol-water partitioning coefficient): log Pow = log10 [X]octanol / [X]water The coefficient gives an indication whether a preference exists for the substance to concentrate in cell lipids (body fat). A Hansch coefficient > 3 indicates a high probability that the substance concentrates in body fat. The value for TBT is around 3,8 (25); TBT is thus likely to concentrate in cell lipids of the (marine) fauna and may be a candidate for bioaccumulation. 1.3.3.4. Factors influencing the particle-water partitioning of TBT An understanding of the partitioning of TBT between dissolved and particle-sorbed states provides the initial key to elucidating the occurrence and importance of TBT in sediments. The particle-water partition coefficient (Kd) of TBT has been determined a number of times under a variety of conditions, both in the laboratory and under natural circumstances. Values obtained are generally of the order of 1 l g-1, but may vary between 0,1 and 70 l g-1. In Table 1, an overview is given of some reported particle-water coefficients for TBT. Such wide variation, over nearly three orders of magnitude, is clearly significant in any general calculation of the environmental uptake of TBT on particles. The disparate conditions under which partitions were observed give ample scope for a range of sources for this variation; particle concentration and organic carbon content, salinity, and pH have all been considered (19, 21, 22, 33, 39, 41). - The effect of particle concentration It has been remarked (41) that this partition coefficient appears to be inversely dependent on particle concentration, and this is also apparent in Table 1. It is not clear whether this appearance indeed reflects an inherent relation or if it is due to some additional factor with which the concentration of particulate material is confounded. Where vessel maintenance occurs, it has been suggested that extremely high partition coefficients observed in the field may simply reflect the presence of particles of antifouling paint within the particulate phase (43). The presence of paint particles, however, cannot explain the high partition coefficients reported in the relatively low turbidity mesocosm studied by Adelman et al. (1). One suggested explanation for partition coefficients that decline as particle concentrations increase has been the presence of dissolved or

Task 3546: Sediment characterization TBT-CLEAN
15
colloidal organic material in concentrations proportional to those of the particles, which compete with them for the contaminant. Table 1. Reported particle-water partition coefficients for TBT (from Harris et al. (20))
Kd (l kg-1) Salinity (g l-1)
Particle concentration
(mg l-1) Organic
carbon (%) Circumstances Reference
60 ± 30 ×103 Seawater -a - Mesocosm (1) 71000 Seawater 0,68 - Mesocosm
39352 Seawater 1,6 - In situ (43) 38919 Seawater 3,0 - In situ 4608 Seawater 8,6 - In situ
3278 Seawater 5,8 - In situ (41) 3918 Seawater 6,7 - In situ 929 Seawater 14 - In situ 340 Seawater 50 - In situ
400 0 60 - Laboratory (18) 140 32 60 - Laboratory 200 0 60 - Laboratory 100 32 60 - Laboratory
2180 ± 350 41b 10000 2,4 Laboratory (29)
800 0 3000-30000 4,2 Laboratory (39) 130 24 3000-30000 2,9 Laboratory 600 24 3000-30000 0,34 Laboratory 110 35 3000-30000 0,90 Laboratory
a Indicates no information availlable b Calculated from reported ionic strength Alternatively, or in addition, the high partition coefficient between green algae and water (~30 l g-1, (30)) suggests the possibility that the higher partition coefficients associated with low particle concentrations, visible in Table 1, may reflect (in part at least) a higher proportion of planctonic algae or other organic material among the particles at lower overall particle concentrations. Other
Task 3546: Sediment characterization TBT-CLEAN
16
studies conclude that it seems very unlikely that TBT partitioning will be significantly affected by variations in suspended solids load, under normal estuarine conditions (24). - The effect of organic content It is to be expected that the partitioning of a relatively hydrophobic material such as TBT will depend upon the organic content of the particles concerned. In general this appears to be so, and this relation may be sufficient to account for the high observed uptake of TBT in the biota. Based on data obtained from Maguire and Tkacz (29) and Harris and Cleary (18), an increased Kd value could be observed at increased organic carbon content. However, considerable variation remains unaccounted for by the organic carbon content of the particles concerned. Langston and Pope (24) found that the partitioning coefficient is positively correlated with total organic material, as well as with humic substances, Mn, and a high silt content. Their conclusion was that sediments are a major reservoir for TBT, particularly in organic-rich silts in sheltered areas. However, Unger et al. (39) cautioned that organic carbon content alone was not a good predictor of TBT sorption. - The effect of salinity Wide variation in the values reported in Table 1 could also be due to the wide range of salinities of the water under observation. Salinity has a marked influence on the solubility of organotins such as TBT, the latter being less soluble with increasing salinity (23). Salinity is also known to affect particle-water partitioning of both hydrophobic materials and metal ions and has been reported to have a marked effect on the partitioning of TBT (19, 39). Although the relations to salinity reported for TBT partitioning onto natural particulate material are strong, they are inconsistent between the two studies concerned, TBT adsorption being reported to both increase and decrease with elevated salinity: Harris and Cleary (19) find the increased particle adsorption with increased salinity typical of hydrophobic materials; Unger et al. (39) show a decline in adsorption similar to that found among metallic cations. TBT is clearly hydrophobic, but in solution appreciable proportions of the free cation may occur. The particle-water partition coefficients exhibited by TBT are consistent with its hydrophobic nature, but these coefficients are unfortunately also comparable to those found for trace metals. It is difficult then to eliminate either electrostatic or hydrophobic interactions a priori as the key to the interactions of particles with TBT. To obviate the problems of incomplete recovery that are typical for studies of this kind, the original experiments of Harris and Cleary (19) incorporated analysis of both water and particulate phases for tin. The major difference between the two studies described above, is the

Task 3546: Sediment characterization TBT-CLEAN
17
sediment concentration used. The declining relation of Kd to salinity was observed with sediment concentrations two or three orders of magnitude higher than concentrations yielding the increasing relation (Table 1). Noting this, Unger et al. (39) suggest that the difference may reflect the limited availability of charged binding sites, which become saturated at the lower particle concentrations. Indeed, although they do not remark it, the results they show indicate an increasing Kd at lower TBT concentrations (39). Since the experiments reported in both studies resulted in TBT concentrations on particles reaching a maximum of <10-3‰ (by weight), this would imply an extremely low availability for charged sites. - The effect of pH TBT-species (TBTO, TBTCl) and TPhT-species (TPhTCl, TPhTO) have a maximum solubility at around a pH of 5 in distilled water. Lowest solubility was measured at around pH 7-8 (23), however this was less significant in seawater, most probably due to interaction of ions. Several other reports mention the highest Kd-value at a near neutral pH, while this value decreases (TBT more soluble) for both a decreasing as an increasing pH (24). This again reflects the metal ion and hydrophobic materials characteristics of TBT. - The role of the sediment as a sink and/or secondary source for TBT The interaction between the hydrophobic organic moiety of TBT and its charge characteristics dictate that its environmental chemistry is highly dependent on its local chemical environment. As a result, its partitioning between dissolved and particle-adsorbed states depends on a wide range of factors: particle concentration and organic carbon content, salinity and pH, as well as the concentration of TBT itself. This relatively complex environmental chemistry has resulted in observed Kd values that vary over nearly three orders of magnitude. The breakdown of TBT to its less harmful constituents is apparently similarly variable. Dependent, for instance, on the state of sediment anoxia, half-lives that vary from days to months have been reported (27). These variations, combined with the varied processes of mixing and transport that occur in nature, mean that the significance of the sediments as a sink for TBT will vary considerably from place to place. In relatively well-mixed estuarine systems TBT may be expected to dissipate fairly rapidly from the sediments once other inputs to the water cease, and in the process give water concentrations that are small compared with those resulting directly from the original inputs. However, the re-release of TBT from contaminated sediments can be of major importance as an indirect source of lasting TBT contamination to the water phase. Also, TBT present in paint chippings has a completely different behaviour. Overall, it is thus very important to characterize

Task 3546: Sediment characterization TBT-CLEAN
18
the sediment of a harbour before deciding what kind of action that needs to be taken to remediate it. - Experimental study on TBT distribution in TBT-paint contaminated dredged material (34) The regulatory authority for sea disposal of dredged material in England and Wales (DEFRA) has funded CEFAS to investigate the distribution of TBT as sediment-entrained paint particles. The aim of this study was to remediate sediment in such a way that it could be conventionally disposed. Three types of TBT contamination were identified: large paint flakes, small paint particles derived from high pressure hosing of copolymer formulations and TBT adsorbed to sediment. It was shown that size and density fractionation could be used to separate a heavily contaminated component of the sediment leading to a significant reduction in the volume of grossly contaminated material. It was possible to identify paint particles in the large/light samples (250-500 µm). The results generally showed that the highest TBT concentrations were associated with the light fractions. Elevated TBT levels within the light fraction were mainly confined to the >63 µm size fraction. However, results from a TBT-spiked sediment experiment suggested that the remediation of sediments containing particles <63 µm shows the reverse contamination pattern. No ‘clean’ fractions were identified, but the concentration in some fractions was allowed for sea disposal. 1.3.3.5. Some sediment TBT concentrations reported in literature There are several reports available of TBT concentrations in sediments all over the world. Grovhou et al. (17) mention values ranging from 1,7 to 1100 µg/kg DW in the San Diego Bay (California, USA) area, with higher values in yacht harbors adjacent to to vessel repair and maintenance facilities. These high values did not show a decreasing trend following the regulation on the use of TBT in the late 1980’s and early 1990’s. The latter prohibited the use of TBT-containing paints on vessels smaller than 25m in length and restricted the paints to those releasing <5 µg cm-2 d-1. In a study for TBT contamination in Canadian waters, Maguire (28) found that 30% of the samples from across Canada contained TBT. In general the pattern of occurrence of TBT in sediment was similar to its pattern of occurrence in water (i.e. mainly in harbors, marinas, and shipping channels). The highest concentrations were found in the Vancouver Harbor, Canada’s busiest harbor, with values up to 10,8 mg Sn/kg DW. It is possible that the sediment in harbors was contaminated by paint chips <850 µm in size. A study conducted by Waite et al. (45) in Wales and England showed comparable concentrations, and four categories were defined: 1) the lightly contaminated, with TBT concentrations in the

Task 3546: Sediment characterization TBT-CLEAN
19
range <0,01-0,05 mg/kg DW, were typical for areas within estuaries with large numbers of boats but remote from boat moorings themselves; 2) these showing medium levels of contamination, in the range 0,06 to 0,2 mg/kg DW, closer to moorings; 3) highly contaminated areas, from 0,3 to 1 mg TBT/kg DW, found within high-density mooring areas or marinas; 4) those containing paint particles at concentrations >1 mg TBT/kg DW. The separate category is important because the bioavailability of TBT in such sediments may be different from that adsorbed onto sediment particles. In Hong Kong, widely distributed concentrations of 2,4-2837 µg TBT/kg DW are reported (9). The highest concentration was again found in the proximity of the shipyards involved in the stripping of TBT-painted vessels. In the Western Mediterranean Sea, TBT concentrations of on average 5,0 mg/kg DW were detected in commercial harbors associated with inputs from large vessels; while values of around 1 mg/kg were detected in fishing and recreational boating areas (10). 1.3.4. Ecotoxicology of TBT Due to the relatively high log POW value for TBT (≈ 3,8), this chemical has a tendency to bio-accumulate in tissue of living organisms. However, all depends on the bio-availability, which is the result of the partitioning of TBT in the environment: only dissolved organotin compounds are available for uptake by most aquatic organisms, unless sediment loaded with TBT is taken in. Table 2. Ecotoxicological effects of TBT at different concentrations in seawater) [from (14)] TBT conc. (µg L-1) Effect < 0,01 - 0,1 - Imposex phenomena in dog whelks and mollusks; - Growth inhibition in algae; - Growth effects in oysters; - Deformed limb regeneration in brittle stars. 0,1 – 1,0 - Reduced growth in fathead minnow; - Growth effect in trout. Treshold acute: 0,7 - Acute toxicity in marine algae, oysters, copepods, mussels, and
mysids 1,0 – 10,0 - Acute toxicity in shrimp, Daphnia, sole larvae, trout and salmon - Acute toxicity in ragworms Fent (13, 14) has critically reviewed several aspects of the ecotoxicological effects of organotin compounds, showing adverse effects of especially triorganotins (TBT and TPhT) on reproduction, respiratory, enzyme, … systems of mollusks, fish, mammals, …. In another study,
Task 3546: Sediment characterization TBT-CLEAN
20
focused on marine sediments, a toxicity-identification-evaluation methodology was developed which was tested for TBT (44), and which could partially identify TBT as the cause for toxicological effects. In Table 2, the toxicological effects of TBT are summarized.

Task 3546: Sediment characterization TBT-CLEAN
21
2. TASK OBJECTIVES AND EXPERIMENTAL WORK 2.1. Task objectives
The task objective was to characterize the level and possible correlation of organotin and other chemical contamination at different sites in the port of Antwerp. Two specific actions were outlined: sediment sampling and analytical determination of the contaminants. 2.2. Experimental work 2.2.1. Analytical principle of contaminant measurements 2.2.1.1. Dry weight, ash content and pH Dry weight of the samples was determined after drying the sediment samples overnight at 105°C. Afterwards, these samples were heated to 550°C to remove volatile components in the sediment, and the ash content was calculated as the difference between the weight of the sample + recipient after heating and the net weight of the recipient. pH is determined potentiometrically (Metrohm 730). 2.2.1.2. Heavy metals Samples were homogenized and dried as a thin layer at 40°C. Dried material was again homogenized and destroyed in a closed microwave system (CEM Mars 5). 0,25 g of sample is weighed in a Teflon destruction recipient and 3 mL MQ-water, 3 mL HCl, 1 ml HNO3, 1 mL HF and internal standards are added. Destruction proceeds by means of a fixed destruction programme and the destruct is quantitatively transferred to a teflon 50-mL recipient. Heavy metals (except mercury) are measured by an axial ICP-AES system (Vista, Varian) and mercury by CV-AAS (FIMS, Perkin-Elmer). 2.2.1.3. Extractable organic halogens (EOX) Organically bound halogens are extracted from a 40°C dried and homogenized sample (10 g) by adding a 1/1 mixture of hexane/acetone and performing an accelerated solvent extraction (ASE) (ASE 200, Dionex). The extract (100 µL), after drying on Na2SO4, is burned at 850 °C in an

Task 3546: Sediment characterization TBT-CLEAN
22
oxygen-argon atmosphere and the formed hydrogenhalogenide is titrated coulometrically (Euroglas ECS 3000). 2.2.1.4. Total organic carbon The total carbon (TC) is determined by measuring the carbon dioxide (CO2) released by combustion of the undried waste sample. The total carbon present in the waste sample is converted to CO2 in an oxygen-containing gas flow free of CO2. To ensure complete combustion, catalysts and/or modifiers can be used in the reaction furnace. The released amount of CO2 is measured by infrared spectrometry. The total inorganic carbon (TIC) is determined separately from another sub-sample by means of acidification and purging of the released CO2. The total organic carbon (TOC) is calculated as the difference of TC and TIC (SSM 5000/TOC-V CPH, Shimadzu). 2.2.1.5. Organotins Organotins are ‘leached’ out (extraction) of approx. 0,5 g wet sediment sample by using a small amount of acetic acid and ethanol (solvent). After sonication, an acetate buffer is added until a pH of 5,3 is obtained. The extract is subsequently derivatized with Na-tetraethylborate, and organotin compounds analysed with SPME (solid phase micro-extraction) (SPME fiber assembly, 100 µm PDMS, Supelco) on a GC-MS. The organotins are first vapourized (80°C) and sorbed on the SPME sorbent material, and afterwards they are desorbed and measured in the GC-MS (6890N GC, 5973 MS quadropool, Agilent). 2.2.1.6. Polycyclic aromatic hydrocarbons (PAHs) (16 of EPA) and mineral oil Pre-dried (40°C) or chemically dried sediment samples are, after addition of deuterium-marked PAHs, subjected to an accelerated solvent extraction (ASE) (Dionex, ASE 200) with a 1/1 acetone/hexane mixture. After purification over silica, the extract is concentrated using a Kuderna Danish set-up, and analyzed with GC-MS (Trace GC/ Trace MS plus quadropool mass spectrometer, Thermoquest-Interscience). For mineral oil, the sediment samples undergo the same extraction procedure as for PAHs. The extract is dried on Na2SO4 and purified with florisil for the removal of polar compounds. The purified extract is analyzed with GC-FID (Trace GC/FID, Thermoquest-Interscience). The result is calculated for the fraction between decane (C10) and tetracontane (C40).

Task 3546: Sediment characterization TBT-CLEAN
23
2.2.2. First sediment sampling and contaminant screening In the framework of a survey of sediment quality by the Port of Antwerp authorities, samples at about 50 different locations were taken in the period end November – beginning of December 2002. Samples were taken with a Van Veen grab, which is frequently used for the taking of undisturbed samples from the bottom of seas, lakes, rivers, etc. The mode of operation of all Van Veen grabs is the same. At the surface the jaws are pushed open and kept in that position by a hook. To keep the hook in the right position the Van Veen grab should be sunk at a steady, not too high, pace. Both jaws are fitted with holes to allow air to escape during sinking. As soon as the jaws touch the bottom, the hook loosens its grip, so that, when hoisting the rope again the jaws will shut tight because of the leverage by the rods. A photograph of the Van Veen grab is shown in Fig. 3.
Figure 3. Photograph of a Van Veen grab used for sediment sampling
At each sample location, 5 different subsamples were taken, manually homogenized and divided over 6-liter, completely filled polyethylene recipients. The latter were stored at 4°C prior to analysis. The analysis consisted of determination of numerous important chemical contaminants, as shown in Table 3. TBT concentration was determined in sixteen of the collected samples. The result of the contaminant screening in these samples is shown in Table 3, while the sample location is shown on a map of the harbour in Fig. 4. Table 3 indicates that most of the samples are heavily contaminated, either with heavy metals like chromium, zinc, copper and lead, or with PAHs and mineral oil. There are significant differences between the samples; this is most likely due to the location of the sampling points and the industrial activity at these locations. In most samples, TBT+ concentration was relatively low (order of 0,1 mg/kg DW), except for those taken closer to the Antwerp ship repair site (sample 1.5 and 1.6).

Task 3546: Sediment characterization TBT-CLEAN
24
Figure 4. Location of 16 sediment samples taken for the screening of
TBT and other contamination in the Port of Antwerp
1.1
1.10 1.9
1.8
1.11
1.7
1.6 1.5
1.4
1.3
1.2
1.14
1.15
1.13
1.12
1.16

Task 3546: Sediment characterization TBT-CLEAN
25
Table 3. Analytical determination of important contaminants in 16 samples taken at various locations in the Port of Antwerp. Sample locations are indicated in Fig. 4 (analyses by PIH; N.D. = not determined)
Parameter Sample number
1.1 1.2 1.3 1.4 1.5 1.6 1.7 1.8 1.9 1.10 1.11 1.12 1.13 1.14 1.15 1.16
Dry weight (%) 33,7 45,1 36,7 45,1 48,3 35,4 38,8 31,1 36,4 32,1 41,8 49,6 49,2 29,1 46,0 68,8
Ash (% on DW) 88,2 87,9 88,2 88,9 92,0 85,9 88,2 85,7 86,0 85,4 88,2 91,0 90,4 84,3 89,5 97,0
TOC (%) 8,0 7,2 7,0 8,8 5,7 9,4 9,8 9,0 10,1 9,3 10,8 8,1 5,9 9,8 7,5 2,3
Lutum (% on DW) 22,7 17,4 18,3 21,2 12,6 20,4 20,3 24,4 19,1 24,4 21,5 11,2 14,3 26,2 59,6 1,7
Metals (mg/kg DW)
Arsenic 57 37 44 43 31 46 50 60 51 46 60 41 39 54 43 <14
Cadmium 17,2 7,2 8,3 7,7 3,4 8,2 12,2 11,3 9,5 11,9 18,2 6,3 7,4 4,7 8,0 <0,5
Chromium 177 119 129 132 97 153 167 186 158 168 123 112 148 126 141 <30
Copper 170 75 196 87 63 155 122 136 104 112 163 65 88 62 88 <14
Mercury 2,01 1,12 0,96 1,20 0,64 1,48 1,63 2,05 1,61 1,82 1,06 1,04 1,41 1,07 1,65 <0,50
Lead 572 176 189 149 111 223 248 277 149 201 811 139 126 161 122 <35
Nickel 31 19 46 24 15 29 32 38 33 33 81 20 34 25 29 <7
Zinc 1200 478 680 520 342 767 895 1120 611 792 3730 562 539 625 517 60
EOX (mg org.Cl/kg DW) 8,7 5,6 <2,0 4,1 5,2 13,4 3,7 14,7 <2,0 <2,0 <2,0 <2,0 <2,0 <2,0 4,7 <2,0
Trichlorobenzene (mg/kg) <0,03 <0,03 0,06 <0,03 0,08 <0,03 <0,03 <0,03 <0,03 <0,03 0,06 0,02 0,04 0,01 0,02 <0,03
Org.chloropesticides (mg/kg) 0,02 0,009 0,011 N.D. 0,018 N.D. N.D. N.D. N.D. 0,005 N.D. N.D. 0,006 0,006 0,007 N.D.
Benzene <0,2 <0,2 <0,2 <0,2 <0,2 <0,2 <0,2 <0,2 <0,2 <0,2 <0,2 <0,2 <0,2 <0,2 <0,2 <0,2
Ethylbenzene <0,2 <0,2 <0,2 <0,2 <0,2 <0,2 <0,2 <0,2 <0,2 <0,2 <0,2 <0,2 <0,2 <0,2 <0,2 <0,2
Toluene <0,2 <0,2 <0,2 <0,2 <0,2 <0,2 <0,2 <0,2 <0,2 <0,2 <0,2 <0,2 <0,2 <0,2 <0,2 <0,2
Xylene <0,4 <0,4 <0,4 <0,4 <0,4 <0,4 <0,4 <0,4 <0,4 <0,4 <0,4 <0,4 <0,4 <0,4 <0,4 <0,4

Task 3546: Sediment characterization TBT-CLEAN
26
PAHs (mg/kg DW)
Naphtalene 0,47 0,49 0,34 0,32 0,23 0,40 0,27 0,37 0,25 0,29 0,29 0,23 0,21 0,23 0,17 0,02
Acenaphtylene 0,07 0,04 0,03 0,03 0,02 0,03 0,04 0,04 0,04 0,03 0,04 0,03 0,51 0,03 0,04 <0,01
Acenaphthene 0,18 0,20 0,10 0,09 0,07 0,12 0,09 0,12 0,09 0,11 0,10 0,07 0,08 0,09 0,06 <0,01
Fluorene 0,25 0,20 0,14 0,14 0,09 0,18 0,15 0,17 0,13 0,16 0,15 0,12 0,15 0,13 0,09 <0,01
Phenantrene 0,77 0,69 0,44 0,44 0,31 0,60 0,40 0,49 0,42 0,53 0,69 0,37 0,31 0,36 0,25 0,03
Anthracene 0,27 0,20 0,14 0,14 0,11 0,17 0,15 0,18 0,16 0,17 0,16 0,14 0,20 0,13 0,12 0,01
Fluoranthene 2,1 1,3 0,96 0,72 0,51 0,89 0,74 0,94 0,88 0,86 1,1 0,57 0,65 0,50 0,70 0,06
Pyrene 1,8 1,1 0,87 0,71 0,51 0,88 0,81 1,0 0,89 0,79 1,2 0,53 0,73 0,52 0,75 0,05
Benzo(a)anthracene 0,99 0,57 0,48 0,38 0,26 0,47 0,40 0,47 0,44 0,42 0,52 0,30 0,46 0,28 0,34 0,04
Chrysene 1,4 0,87 0,70 0,50 0,38 0,61 0,56 0,67 0,58 0,55 0,67 0,39 0,58 0,38 0,43 0,04
Benzo(b)fluoranthene 2,5 1,4 0,94 0,77 0,65 0,97 0,90 1,1 1,0 0,83 1,1 0,60 0,79 0,85 0,83 0,07
Benzo(k)fluoranthene 0,77 0,43 0,34 0,24 0,20 0,31 0,28 0,34 0,33 0,26 0,36 0,19 0,25 0,27 0,25 0,02
Benzo(a)pyrene 1,4 0,76 0,56 0,43 0,36 0,53 0,47 0,57 0,54 0,45 0,58 0,34 0,51 0,46 0,46 0,04
Dibenzo(a,h)anthracene 0,30 0,15 0,12 0,08 0,07 0,10 0,09 0,11 0,09 0,07 0,09 0,06 0,11 0,10 0,05 <0,01
Benzo(g,h,i)perylene 0,85 0,39 0,41 0,25 0,23 0,30 0,26 0,21 0,25 0,20 0,27 0,18 0,23 0,26 0,11 0,02
Indeno(1,2,3,c,d)pyrene 1,1 0,52 0,51 0,29 0,29 0,37 0,34 0,40 0,33 0,25 0,34 0,21 0,28 0,35 0,14 0,04
Total PAHs 15,22 9,31 7,08 5,53 4,29 6,83 5,95 7,18 6,42 5,97 7,66 4,33 2,17 4,94 4,79 <0,48
Total PCBs (mg/kg DW) 0,299 0,136 0,151 0,105 0,146 0,131 0,121 0,214 0,139 0,109 0,136 0,096 0,103 0,108 0,115 0,004
Mineral oil (mg/kg DW) 480 1000 1100 910 680 1100 930 770 220 830 230 460 900 470 950 <50
Hexane (mgkg DW) <0,5 <0,5 <0,5 <0,5 <0,5 <0,5 <0,5 <0,5 <0,5 <0,5 <0,5 <0,5 <0,5 <0,5 <0,5 <0,5
Heptane (mg/kg DW) <0,5 <0,5 <0,5 <0,5 <0,5 <0,5 <0,5 <0,5 <0,5 <0,5 <0,5 <0,5 <0,5 <0,5 <0,5 <0,5
Octane (mg/kg DW) <0,5 <0,5 <0,5 <0,5 <0,5 <0,5 <0,5 <0,5 <0,5 <0,5 <0,5 <0,5 <0,5 <0,5 <0,5 <0,5
TBT (mg/kg DW) 0,037 0,017 0,115 0,152 1,063 1,075 0,200 0,310 0,068 0,122 0,078 0,071 0,056 0,117 0,015 0,017

Task 3546: Sediment characterization TBT-CLEAN
27
In order to determine whether there was a correlation between TBT+ and other parameters, like TOC, EOX, PAHs, mineral oil and clay content (lutum), a correlation matrix was calculated. The results are shown in Table 4.
Table 4. Correlation matrix of several important contaminants in 16 samples from different locations in the Antwerp Port (based on data obtained from analyses by PIH)
TOC Lutum Heavy metals PAHs EOX Mineral oil TBT+
TOC 1 Lutum 0,10 1
Heavy metals 0,52 0,00 1 PAHs 0,17 0,00 0,38 1 EOX 0,05 0,08 0,03 0,39 1
Mineral oil -0,41 0,16 -0,43 -0,14 0,31 1 TBT+ -0,15 -0,24 -0,16 -0,16 0,49 0,23 1
No apparent correlation was observed. A possible explanation can be the diversity of industrial activities in the port area, thus creating diverse sediment contamination patterns. This correlation table also confirms that TOC alone is not a good predictor of TBT contamination, as was also stated in literature (39). However, whether TBT and TOC were correlated in one single sediment sample remained to be determined (see sediment fractionation). 2.2.3. Second sediment sample collection Despite the fact that the TBT+ concentrations in some samples were environmentally significant (in the range of 1 mg/kg DW), it was decided to perform a second sample collection. This was carried out on February 17th 2003. The latter was aimed at sampling possible ‘black spots’, locations where high to extremely high TBT+ contamination could be expected. Based on several literature reports (see introduction), the Antwerp ship repair site was selected, because the ship’s antifouling paint layers are removed here and the cleaning water, possibly loaded with TBT+, is discharged in the harbour. Here it was also likely that we could find sediment samples containing TBT-rich paint flakes, yielding very typical sediment characteristics. Furthermore, personal communication with the local dredging authority pointed out that there has not been any dredging activity in that area for the last 10 years, so high contamination was likely. Ten sample locations in the proximity of the wet and dry docks of Antwerp ship repair were selected, shown in Fig. 5. These samples were screened for organotin compounds, more in particular butyl- and phenyltin species. The results of that screening are shown in Table 5.

Task 3546: Sediment characterization TBT-CLEAN
28
Figure 5. Sample locations of the second sediment sampling action (indicated as 2.1 to
2.10, see Table 5). Photograph shows an enlargement of the area of Antwerp ship repair within the Antwerp harbour (GIS-map Gemeentelijk Havenbedrijf Antwerpen).
Results in Table 5 confirm the assumption of high TBT-contamination in and around the dry and wet docks of the ship repair yard. Besides TBT+, some samples also contained high TPhT+ concentrations (TBT and TPhT were however not correlated, correlation coefficient -0,13), possibly indicating the use and accumulation of this other biocide in the harbour. However, it should be mentioned that di- and monobutyltin species were also measured in relatively high concentrations (> 1mg/kg DW), either indicative of direct input of these chemicals (as described in the introduction) or indicative of degradation of TBT by stepwise debutylation as described in literature (5). These results were satisfying from a point of sediment characterization purposes, because the very high concentrations measured in for example sample 2.1 indicated the possible presence of paint flakes. Out of the 26 samples analyzed for organotin compounds (sampling periods 1 and 2), we selected nine samples for further characterization, three for each class of TBT contamination: highly TBT-contaminated (samples 2.1, 2.3 and 2.8), medium-contaminated (sample 2.4, 1.6 and 1.5) and relatively low-contaminated (sample 1.8, 1.7 and 1.4). These
2.12.10
2.9
2.82.7 2.6
2.5
2.4
2.3
2.2
Antwerp ship
repair

Task 3546: Sediment characterization TBT-CLEAN
29
samples are indicated on a map of the harbour in Fig. 6 and the organotin concentrations are summarized in Table 6.
Table 5. Screening for organotin compounds (TBT+ = tributyltin; DBT2+ = dibutyltin; MBT3+ = monobutyltin; TPhT+ = triphenyltin; DPhT2+ = diphenyltin; MPhT3+ =
monophenyltin) in samples in the proximity of Antwerp ship repair. Exact sample locations are shown in Fig. 5.
Organotin compounds (mg/kg DW) Sample TBT+ DBT2+ MBT3+ TPhT+ DPhT2+ MPhT3+
2.1 43,013 1,371 0,870 0,027 0,031 0,181 2.2 7,890 0,872 0,711 0,037 0,050 0,295 2.3 18,098 1,151 0,553 0,021 0,021 0,295 2.4 6,404 1,251 0,444 0,042 0,087 0,339 2.5 6,144 0,879 0,456 0,029 0,031 0,179 2.6 8,717 0,646 0,371 0,047 0,076 0,399 2.7 7,424 0,763 0,432 0,057 0,092 0,263 2.8 13,444 1,978 1,148 0,351 0,278 0,285 2.9 10,921 0,986 0,525 1,053 0,842 0,567 2.10 6,515 0,817 0,559 0,365 0,736 0,917
Table 6. Overview of butyl- and phenyltin compounds in 9 selected sediment samples close to (first 5) and at a distance (last 4) of the ship repair yard. The sampling points
are indicated on the photograph of the harbour in Fig. 6. Organotin compounds (mg/kg DW)
Sample TBT+ DBT2+ MBT3+ TPhT+ DPhT2+ MPhT3+
2.1 43,014 1,372 0,870 0,027 0,031 0,181 2.3 18,098 1,151 0,553 0,021 0,021 0,296 2.8 13,444 1,978 1,148 0,351 0,278 0,285 2.4 6,404 1,251 0,444 0,042 0,087 0,339 1.6 11,561 0,761 0,508 0,022 0,058 0,266 1.5 1,584 0,251 0,220 <0,001 0,020 0,234 1.8 0,541 0,259 0,297 <0,001 0,026 0,304 1.7 0,607 0,263 0,274 0,009 0,028 0,216 1.4 0,393 0,161 0,144 0,011 0,014 0,131

Task 3546: Sediment characterization TBT-CLEAN
30
Figure 6. Photograph of the harbour with indication of the nine selected sample locations that were used for further characterization (GIS-map
Gemeentelijk Havenbedrijf Antwerpen). 2.2.4. Sediment characterization 2.2.4.1. Grain size distribution Each of the nine sediment samples was examined using laser diffraction (type Malvern mastersizer) to determine the grain size distribution. No sample pretreatment was carried out, and results are shown in Fig. 7 to 9 for each of the three classes specified, as histograms of different grain size classes. Each of the samples showed a clear peak at around 10 µm, some of them however having a second peak at a larger grain size (e.g. sample 6). Some important statistical parameters of the grain size distribution are summarized in Table 7, while in Table 8 the averages and standard deviations of these parameters were calculated. The latter can be taken as a representative set of values for the Antwerp sediment in the area of the sampling points.
2.1
2.3
2.8
2.4
1.6
1.5
1.7
1.4
1.8

Task 3546: Sediment characterization TBT-CLEAN
31
Particle Diameter (µm.)
Volume (%)
0
10
0
10
20
30
40
50
60
70
80
90
100
0.01 0.1 1.0 10.0 100.0 1000.0
Particle Diameter (µm.)
Volume (%)
0
10
0
10
20
30
40
50
60
70
80
90
100
0.01 0.1 1.0 10.0 100.0 1000.0
Particle Diameter (µm.)
Volume (%)
0
10
0
10
20
30
40
50
60
70
80
90
100
0.01 0.1 1.0 10.0 100.0 1000.0
Figure 7. Histogram of the grain size distribution of the heavily
TBT-contaminated sediment samples
Particle Diameter (µm.)
Volume (%)
0
10
0
10
20
30
40
50
60
70
80
90
100
0.01 0.1 1.0 10.0 100.0 1000.0
Particle Diameter (µm.)
Volume (%)
0
10
0
10
20
30
40
50
60
70
80
90
100
0.01 0.1 1.0 10.0 100.0 1000.0
Particle Diameter (µm.)
Volume (%)
0
10
0
10
20
30
40
50
60
70
80
90
100
0.01 0.1 1.0 10.0 100.0 1000.0
Figure 8. Histogram of the grain size distribution of the
moderately TBT-contaminated sediment samples
6
4 5
2
3
1

Task 3546: Sediment characterization TBT-CLEAN
32
Particle Diameter (µm.)
Volume (%)
0
10
0
10
20
30
40
50
60
70
80
90
100
0.01 0.1 1.0 10.0 100.0 1000.0
Particle Diameter (µm.)
Volume (%)
0
10
0
10
20
30
40
50
60
70
80
90
100
0.01 0.1 1.0 10.0 100.0 1000.0
Particle Diameter (µm.)
Volume (%)
0
10
0
10
20
30
40
50
60
70
80
90
100
0.01 0.1 1.0 10.0 100.0 1000.0
Figure 9. Histogram of the grain size distribution of the relatively
low-contaminated sediment samples. The grain size distributions clearly show a similar pattern in most samples. The Antwerp port sediment samples under examination (the top layer, as sampled by the Van Veen grab) seem to be enriched in fine silt particles, and an absolutely minor to negligible part consists of sand. The clay content (as was also shown in Table 3: lutum) was generally high.
Table 7. Some important grain size distribution characteristics (expressed in µm) Sample number 2.1 2.3 2.8 2.4 1.6 1.5 1.8 1.7 1.4
D(v;1) 0,20 0,21 0,19 0,20 0,19 0,18 0,19 0,19 0,19 D(v;10) 1,6 1,7 1,4 1,6 1,5 1,4 1,3 1,7 1,4 D(v;50) 11,3 11,6 10,8 11,1 10,8 11,8 10,0 14,2 15,3 D(v;90) 110,4 76,4 73,6 71,4 85,4 167,2 76,8 133,0 151,9 D(v;99) 246,4 240,7 229,4 236,6 260,7 291,2 243,6 296,3 286,8
D43 34,2 29,2 27,7 27,8 31,1 49,1 28,4 42,5 47,7 D32 2,8 3,0 2,6 2,8 2,7 2,5 2,5 2,9 2,6 D10 0,16 0,17 0,16 0,16 0,16 0,14 0,16 0,15 0,14
9
7 8

Task 3546: Sediment characterization TBT-CLEAN
33
The statistical parameter D(v;x) represents the diameter (µm) of a sphere which has a volume that exceeds the estimated volume of x % of the measured grains in the sample. D43, D32 and D10 are the volume, surface and number weight mean diameters respectively.
Table 8. Averages and standard deviation (n = 9) of local sediment grain size distribution characteristics (expressed in µm)
D(v;1) 0,19 ± 0,01 D(v;10) 1,5 ± 0,2 D(v;50) 11,9 ± 1,7 D(v;90) 105,1 ± 37,1 D(v;99) 259,1 ± 25,8
D43 35,2 ± 8,7 D32 2,7 ± 0,2 D10 0,16 ± 0,01
Table 8 summarizes the results obtained for the grain size distributions. An average sediment sample contains 50% particles with a diameter less than 11,9 µm, with a relatively small standard deviation. The standard deviation around 100 µm (the 90% percentile), is relatively higher due to differences in particle content of around that size in the different samples, as shown in Fig. 7 to 9. 2.2.4.2. Sediment sample fractionation In order to determine the distribution of and a possible correlation between contaminants, the sediment samples were fractionated and contaminant concentration in the different fractions measured. As important parameters, organotins, TOC, EOX, mineral oil, heavy metals and PAHs were determined. We opted for a practically relevant fractionation, which composed of a wet sieving on sieves of 250, 125 and 63 µm pore size. The wet sieving was performed manually with harbour water (4 L was used per sample), collected during the second sediment sampling, on the nine previously selected sediment samples. The initial pH of the samples was on average 7,86 ± 0.18. At this pH, organotins are relatively strongly sorbed on the sediment particles (24), so that release of TBT to the water phase during wet sieving could be minimized. - Dry weight and volatile solids distribution 500 g wet weight was used for the fractionation. Total dry weight and dry weight of the separated fractions was determined, as well as the total and fractional volatile solids (VS) (as

Task 3546: Sediment characterization TBT-CLEAN
34
a reflection of the organic matter content). Results, based on all nine samples, are shown in Fig. 10. The dry weight distribution strongly resembles the grain size distribution, as expected.
0
10
20
30
40
50
60
70
80
90
100
<63 µm 63-125 µm 125-250 µm >250 µm
% o
f dry
wei
ght a
nd v
olat
ile s
olid
s
Dry weight
Volatile Solids
Figure 10. Average and standard deviation (n = 9) of the dry weight and volatile solids
distribution in the selected sediment samples. On average 68% of the dry weight consists of particles with a grain size diameter of less than 63 µm, while this is only 7, 20 and 5% for the classes 63-125 µm, 125-250 µm and >250 µm respectively. Moreover, the values reported in Table 8 and in Fig. 7-9 indicate that the largest fraction has a diameter of around 10 µm (50% percentile is 11,9 µm, expressing that half of the grains has a diameter less than 11,9 µm). It must be stressed that these measurements concern samples taken at a relatively small area in the harbor, of the top 10 cm layer of the sediment. As such, these are only local observations and no general conclusion can be drawn on the total sediment layer of the whole harbor. The volatile solids distribution has a comparable pattern, with on average respectively 87,5, 3, 5 and 4,5% in the <63, 63-125, 125-250 and >250 µm classes. We can thus conclude that the organic matter is finely dispersed in the sediment. To link organic matter more directly to other contaminants, the TOC concentration was measured as a reflection of organic matter. - TBT+ distribution in the different fractions The nine selected samples were fractionated, and TBT+ concentration and dry weight of these fractions was measured. The results, calculated as averages of samples within a group, are

Task 3546: Sediment characterization TBT-CLEAN
35
shown in Fig 11 to 13. The TBT+ concentration in the fraction >250 µm was the highest of all fractions, and this was more pronounced in the group of highly contaminated samples. As an example of this, the sediment sample taken at the wastewater disposal point of a dry dock in Antwerp ship repair is shown in more detail in Fig. 14. In this sample, an extremely high concentration of TBT+ was measured (94,839 mg/kg DW) in the fraction >250 µm. The assumption is that paint particles are present in this fraction. This hypothesis should however be confirmed by microscopic investigation and/or physical separation techniques where these paint particles are removed from the rest of the fraction. This will be carried out on the >250 µm fraction of sample 2.1 and results will be supplied in an addendum to this report. Due to the dry weight distribution, the largest absolute amount of TBT is present in the smallest diameter fraction. This is illustrated in Fig. 11 to 14; between 58 and 89% of all TBT is fractionated in the <63 µm class. This information is of special importance for a possible treatment technology, because it shows that there is no ‘clean fraction’ that can be separated. It should however be stressed that TBT concentrations as measured for sample 1 are very local (so-called black spots), and that most sediment samples are in the relatively low-contaminated class.
0
10
20
30
40
50
60
70
80
90
mg TBT+/kg 10,575 10,196 3,742 45,510
% DW 70,1 7,3 18,0 4,6
% TBT+ 57,9 10,7 8,4 23,0
<63 µm 63-125 µm 125-250 µm >250 µm
Figure 11. TBT+ distribution in the fractions of the high-contaminated sediment
samples

Task 3546: Sediment characterization TBT-CLEAN
36
0
10
20
30
40
50
60
70
80
90
mg TBT+/kg 7,019 4,276 1,778 9,804% DW 67,9 7,9 19,0 5,3% TBT+ 89,0 4,1 3,3 3,6
<63 µm 63-125 µm 125-250 µm >250 µm
Figure 12. TBT+ distribution in the fractions of the medium-contaminated sediment samples.
0
10
20
30
40
50
60
70
80
90
mg TBT+/kg 0,653 0,202 0,171 3,722
% DW 65,3 6,7 22,8 5,3
% TBT+ 69,9 1,9 4,1 24,1
<63 µm 63-125 µm 125-250 µm >250 µm
Figure 13. TBT+ distribution in the fractions of the relatively low-contaminated sediment samples.

Task 3546: Sediment characterization TBT-CLEAN
37
0
10
20
30
40
50
60
70
80
90
100
[TBT+] (mg/kg) 25,833 8,748 5,339 94,839% DW 59,9 12,6 24,8 2,7% TBT+ 75,8 5,4 6,5 12,3
<63 µm 63-125 µm 125-250 µm >250 µm
Figure 14. TBT+ distribution in the fractions of sample 1, taken in the immediate
proximity of a dry dock wastewater disposal point. - Correlation TBT and TOC in the sediment fractions? Besides the TBT+ concentration, the TOC in all fractions of the nine selected samples was measured. Due to the physical-chemical nature of TBT, having a high Koc value, it is stated in some literature reports that TBT links to organic matter (see introduction). This was checked by calculating the ratio of TBT/TOC in all fractions, which is shown in Fig. 15. The latter indicates that the TBT/TOC ratio in the different fractions of a sample are relatively constant, except for the fraction >250 µm, where this ratio is much higher. This could indicate that TBT is indeed for a large part linked to the organic matter, but paint particles (highly enriched in TBT) are possibly disturbing this ratio in the >250 µm fraction. These results confirm the need to further characterize this fraction on presence of paint particles. The latter can possibly be removed easily using physical separation techniques, which could significantly lower the amount of TBT+ released from the sediment because the paint flakes constantly set free an amount of bio-available TBT+ (this will be examined and discussed in task 3545). Consequently, removal of TBT-rich paint flakes could also decrease the ecotoxicological risks of this sediment (34).

Task 3546: Sediment characterization TBT-CLEAN
38
0
500
1000
1500
2000
2500
3000
S 1 S 2 S 3 S 4 S 5 S 6 S 7 S 8 S 9
mg
TBT+ /k
g TO
C<63 µm63-125 µm125-250 µm>250 µm
Figure 15. Ratio of TBT+ to TOC in fractions of all nine selected samples. S1 to S3 are highly TBT-contaminated, S4 to S6 medium-contaminated and S7 to S9 are relatively
low-contaminated. - Other contaminants distribution in the fractions + their correlation with TBT Of each of the three groups of samples, one sample was completely analysed for other contaminants such as EOX, mineral oil, PAHs and heavy metals. In Fig. 16 to 18, the distributions of heavy metals and PAHs are shown. For the heavily contaminated samples, the distribution of heavy metals and PAHs strongly resembles that of the TBT distribution (Fig. 11), with the largest amount of the contaminant present in the small-diameter fraction but with a heavily contaminated >250 fraction. This trend is less obvious in the other samples presented in Fig. 17 and 18. The conclusion of this contaminant measurement in different fractions of the sediment is also similar as that for TBT: contaminants are present in all fractions of the sediment and their presence must be kept in mind when treating separated fractions of the sediment or the sediment as a whole. For final characterization purposes, correlation matrices for these three samples were calculated for the different contaminants present in the different fractions.

Task 3546: Sediment characterization TBT-CLEAN
39
0
20
40
60
80
100
Conc. (x 100) (mg/kg) 20,32 8,90 5,10 19,16DW (%) 59,93 12,58 24,84 2,65% of heavy metals 80,79 7,43 8,41 3,37
<63 µm 63-125 125-250 >250 µm
0
20
40
60
80
100
Conc. (mg/kg) 8,07 8,23 6,39 52,13DW (%) 59,93 12,58 24,84 2,65% of PAHS 54,71 11,71 17,95 15,63
<63 µm 63-125 125-250 >250 µm
Figure 16. Distribution of heavy metals and PAHs in the heavily TBT-contaminated
samples.

Task 3546: Sediment characterization TBT-CLEAN
40
0
20
40
60
80
100
Conc. (x100) (mg/kg) 16,93 4,34 2,00 3,17DW (%) 44,29 10,93 33,83 10,95% of heavy metals 83,35 5,27 7,52 3,86
<63 µm 63-125 125-250 >250 µm
0
20
40
60
80
100
Conc. (mg/kg) 5,78 3,30 8,64 3,12DW (%) 44,29 10,93 33,83 10,95% of PAHS 41,39 5,83 47,26 5,52
<63 µm 63-125 125-250 >250 µm
Figure 17. Distribution of heavy metals and PAHs in the moderately TBT-contaminated
samples.

Task 3546: Sediment characterization TBT-CLEAN
41
0
20
40
60
80
100
Conc. (x100) (mg/kg) 22,30 6,60 2,11 6,63% DW 65,15 5,93 22,45 6,46% of heavy metals 91,82 2,47 3,00 2,71
<63 µm 63-125 125-250 >250 µm
0
20
40
60
80
100
Conc. (mg/kg) 6,30 5,40 1,20 2,60% DW 65,15 5,93 22,45 6,46% of PAHS 84,42 6,59 5,54 3,46
<63 µm 63-125 125-250 >250 µm
Figure 18. Distribution of heavy metals and PAHs in the relatively low TBT-
contaminated samples.

Task 3546: Sediment characterization TBT-CLEAN
42
The correlation matrix is presented in Table 9, which shows the average correlations and standard deviations of all three samples. Table 9. Average correlation and standard deviation (n=9) between different contaminants in the four sample fractions that were examined.
TOC Metals PAHs Mineral oil EOX TBT+
TOC 1 Metals 0,97 ± 0,03 1 PAHs 0,38 ± 0,26 0,45 ± 0,39 1
Mineral oil 0,86 ± 0,02 0,84 ± 0,10 0,16 ± 0,40 1 EOX 0,43 ± 0,44 0,63 ± 0,38 0,26 ± 0,65 0,00 ± 0,53 1 TBT+ 0,81 ± 0,20 0,88 ± 0,17 0,59 ± 0,51 0,67 ± 0,48 0,44 ± 0,81 1
This Table clearly indicates that some contaminants are indeed highly linked. Both TBT+, heavy metals and mineral oil are strongly correlated with the TOC distribution. This confirms literature reports that state the link between organic material and TBT+, but can also be theoretically explained by the properties of TBT. Its adsorption characteristics both show similarities with metal ions (explaining the correlation with metals) and with apolar compounds (due to the butyl groups), similar to mineral oil compounds. It is therefore likely that a large part of the TBT+ is chemically bounded to negatively charged sites on clay particles and humic acids. A possible treatment technology can make use of this observation, because removal of the organic fraction is likely to eliminate large amounts of contaminants.

Task 3546: Sediment characterization TBT-CLEAN
43
3. CONCLUSIONS AND FURTHER RESEARCH PERSPECTIVES Sediment samples of the port of Antwerp are in most cases contaminated with TBT concentrations that are of the order 0,1 mg TBT+/kg DW. However, closer to the ship repair yard, higher concentrations (>40 mg/kg DW) are measured, and other organotin compounds like phenyltins are also present (but not correlated with TBT) at elevated concentrations in some samples. Besides the organotins, other contaminants like PAHs, heavy metals, mineral oil and EOX are present in concentrations that are relevant to consider carefully in a possible remediation procedure. The sampled top layer of the sediment (±10 cm) is rich in clay and fine silt particles [D(v;50) ≅ 12 µm] and only has a small fraction with a diameter >250 µm. The latter fraction is however shown to be highly enriched in TBT+ in the samples close to Antwerp ship repair. This was most likely due to the presence of TBT paint-flakes, but this has to be confirmed in a microscopical examination of the >250 µm fraction, which will be carried out in the following weeks. Despite the fact that no correlation was observed between different contaminants when total samples were considered, a strong correlation between TBT+, TOC, heavy metals and mineral oil could be observed within the different fractions when individual samples were fractionated. This correlation analysis confirmed literature reports that TBT+ both has characteristics similar to heavy metal ions (due to the central Sn4+) and similar to hydrophobic compounds (due to the butyl groups) in its partitioning behavior. However, no ‘clean’ fractions could be distinguished so that possible remediation techniques probably have to focus on the total sediment treatment. Perhaps the elimination of the organic matter fraction can substantially reduce the contaminant load, as suggested by the high correlation of TBT+ with TOC, but this also needs further attention for confirmation. In order to be able to compare sediment characteristics and evaluate whether remediation techniques for the Antwerp port sediment will also work for sediments from other European ports, a questionnaire on sediment characteristics has been sent to several European port authorities, and results will be outlined in an addendum to this report together with the paint flakes examination results.

Task 3546: Sediment characterization TBT-CLEAN
44
4. RECOMMENDATIONS (BY DEC AND ENVISAN) TOWARDS POSSIBLE REMEDIATION
OF THE SEDIMENT, BASED ON SEDIMENT CHARACTERIZATION RESULTS
4.1. Sediment sample quality
Towards possible sediment reuse on land, the hygienic quality as described in Table 3 complies with regulations ( = VLAREA regulation for unshaped building materials) for heavy metals, except sample 1.11. A metal extraction procedure was not tested; this would however only be useful after treatment (e.g. thermal) because the latter will modify the metal extraction characteristics of the sediment (e.g. by removing possible metal adhesion sites like clay particles and organic matter). Some EOX values exceed the VLAREA limit (3 mg/kg). However, more detailed analysis should be performed to unravel the type of EOX contamination before conclusions can be drawn on the environmental risks. The PAHs values do not pose a problem for reuse purposes on land, and despite some mineral oil values exceeding 1000 mg/k, this also does not seem to pose a problem, because mineral oil can easily be lowered through bioremediation.
4.2. Remediation techniques
4.2.1. Physical-chemical separation
A classical separation of the >63 µm fraction does not seem meaningful, because this only comprises 10 to 30 mass % of the sediment and is also contaminated with high TBT+ concentration (and thus needs to be cleaned afterwards). However, to be absolutely certain that this technique can not be used, samples should be taken at different depths in the sediment layer, because the grain size distribution there could differ from that of the top layer. A fine fraction separation (e.g. use of cyclones) on 10 µm would separate about 50 mass %, which could potentially be remediated by physical-chemical techniques such as density separation (organic matter, paint particles, …) or flotation. For the <10 µm fraction, bioremediation and/or (electro)oxidation have to be considered. The TOC content of the samples is relatively high, and separation techniques will yield sediment residues with even higher TOC concentrations, which can no longer be deposited on a Class 1 landfill nor can be treated by thermal desorption.
4.2.2. Thermal treatment
The high water content of the sediment samples (more than 50 mass %, see Table 2) makes it both economically as technically necessary to pre-dewater (lagooning) and (thermal) dry the sediment. This will seriously affect the overall treatment cost and has to be calculated.

Task 3546: Sediment characterization TBT-CLEAN
45
The sediment will likely have a too high caloric value due to the high measured weight losses when heated to 550°C. For soil remediation, only a few percent weight loss is generally accepted (order of 1,5 MJ/kg DW caloric value). The high lutum content will cause a serious dust problem in the waste gas purification step. This also needs careful attention. 4.1.3. Electrochemical treatment This has to be carried out on a sediment slurry, and will necessitate a good dewatering afterwards. The high organic matter content will increase the costs, due to interference in the oxidation process. 4.1.4. Bioremediation As a pretreatment, lagooning can be easily performed, principally in the same field. Next to TBT, mineral oil needs careful attention. 4.1.5. Phytoremediation It has to be examined whether TBT-rich paint particles negatively affect the successfulness of this treatment method.

Task 3546: Sediment characterization TBT-CLEAN
46
5. REFERENCE LIST 1. Adelman, D., K. R. Hinga, and M. E. Q. Pilson. 1990. Biogeochemistry of Butyltins
in an Enclosed Marine Ecosystem. Environmental Science & Technology 24:1027-1032.
2. Alzieu, C. 1991. Environmental problems caused by TBT in France: assessment, regulations, prospects. Marine Environmental Research 32:7-17.
3. Alzieu, C., P. Michel, I. Tolosa, E. Bacci, L. D. Mee, and J. W. Readman. 1991. Organotin compounds in the Mediterranean: a continuing cause for concern. Marine Environmental Research 32:261-270.
4. Bennett, R. F. 1996. Industrial manufacture and applications of tributyltin compounds. In S. J. De Mora (ed.), Tributyltin: Case study of an environmental contaminant. Cambridge University Press, Cambridge.
5. Blunden, S. J., and A. H. Chapman. 1982. The Environmental Degradation of Organotin Compounds - a Review. Environmental Technology Letters 3:267-272.
6. Blunden, S. J., L. A. Hobbs, and P. J. Smith. 1984. The environmental chemistry of organotin compounds. The royal society of chemistry, London.
7. Bosselmann, K. 1996. Environmental law and tributyltin in the environment., p. 237-263. In S. J. De Mora (ed.), Tributyltin: Case study of an environmental contaminant. Cambridge University Press, Cambridge.
8. Bryan, G. W., P. E. Gibbs, G. R. Burt, and L. G. Hummerstone. 1986. The decline of the gastropod Nucella lapillus around southwest England: evidence for the effects of tributyltin from antifouling paints. Journal Marine Biology Association UK 66:611-640.
9. Cheung, K. C., M. H. Wong, and Y. K. Yung. 2003. Toxicity assessment of sediments containing tributyltin around Hong Kong harbour. Toxicology Letters 137:121-131.
10. Diez, S., M. Abalos, and J. M. Bayona. 2002. Organotin contamination in sediments from the Western Mediterranean enclosures following 10 years of TBT regulation. Water Research 36:905-918.
11. Evans, C. J., and P. J. Smith. 1975. Organotin-based antifoulant systems. J. Oil Col. Chem. Assoc. 58:160-168.
12. Evans, S. M., P. M. Evans, and T. Leksono. 1996. Widespread recovery of dogwhelks, Nucella lapillus (L.), from tributyltin contamination in the North Sea and Clyde Sea. Mar Pollut Bull 32:263-269.
13. Fent, K. 2003. Ecotoxicological problems associated with contaminated sites. Toxicology Letters In Press, Corrected Proof.
14. Fent, K. 1996. Ecotoxicology of organotin compounds. Critical Reviews in Toxicology 26:1-117.
15. Grosholz, E. D., and G. M. Ruiz. 1996. Predicting the impact of intriduced marine species: lessons from the multiple invasions of the European green crab Carcinus maenas. Biol. Conserv. 78:59-66.
16. Grovhoug, J., P. F. Seligman, G. Vafa, and R. L. Fransham. 1986. Presented at the Oceans '86 Organotin Symposium, Washington DC.
17. Grovhoug, J. G., R. L. Fransham, A. O. Valkirs, and B. M. Davidson. 1996. Tributyltin concentrations in water, sediment, and bivalve tissues from San Diego bay and Hawaiian harbors, p. 503-533. In M. A. Champ and P. F. Seligman (ed.), Organotin: Environmental Fate and Effects.
18. Harris, J. R. W., and J. J. Cleary. 1987. Presented at the International Oceans '87 Organotin Symposium, Halifax, Nova Scotia.

Task 3546: Sediment characterization TBT-CLEAN
47
19. Harris, J. R. W., and J. J. Cleary. 1987. Presented at the Oceans '87 International Organotin Symposium, New York, 28 September - 1 October.
20. Harris, J. R. W., J. J. Cleary, and A. O. Valkirs. 1996. Particle-water partitioning and the role of sediments as a sink and secondary source of TBT, p. 459-473. In M. A. Champ and P. F. Seligman (ed.), Organotin: Environmental Fate and Effects.
21. Harris, J. R. W., C. C. Hamlin, and A. R. D. Stebbing. 1991. A Simulation Study of the Effectiveness of Legislation and Improved Dockyard Practice in Reducing Tbt Concentrations in the Tamar Estuary. Marine Environmental Research 32:279-292.
22. Huggett, R. J., M. A. Unger, P. F. Seligman, and A. O. Valkirs. 1992. The marine biocide tributyltin. Environ Sci Technol 26:232-237.
23. Inaba, K., H. Shiraishi, and Y. Soma. 1995. Effects of salinity, pH and temperature on aqueous solubility of four organotin compounds. Water Research 29:1415-1417.
24. Langston, W. J., and N. D. Pope. 1995. Determinants of TBT Adsorption and Desorption in Estuarine Sediments. Marine Pollution Bulletin 31:32-43.
25. Laughlin, R. B., H. E. Guard, and W. M. Coleman. 1986. Tributyltin in seawater: speciation and octanol-water partition coefficient. Environ Sci Technol 20:201-204.
26. Maguire, R. J. 1991. Aquatic environmental aspects of non-pesticidal organotin compounds. Water Pollut. Res. J. Can. 26:243-360.
27. Maguire, R. J. 1987. Environmentyal aspects of tributyltin. Applied Organometallic Chemistry 1:475-498.
28. Maguire, R. J. 1996. Tributyltin in Canadian waters, p. 535-551. In M. A. Champ and P. F. Seligman (ed.), Organotin: Environmental Fate and Effects.
29. Maguire, R. J., and R. J. Tkacz. 1985. Degradation of the tri-n-butyltin species in water and sediment from Toronto Harbor. J. Agr. Food Chem. 33:947-953.
30. Maguire, R. J., P. T. S. Wong, and J. S. Rhamey. 1984. Accumulation and metabolism of tri-n-butyltin cation by a green alga; Ankistrodesmus falcatus. Can. J. Fish. Aquat. Sci. 41:537-540.
31. Milne, A. 1996. The costs and benefits of tributyltin and alternative antifoulants., p. 17-27, The present status of TBT-copolymer antifouling paints. Organotin Environmental Programme Association (ORTEP), The Hague, Netherlands.
32. Nicholson, G. J., and S. M. Evans. 1997. Anthropogenic impacts on the stocks of the common whelk Buccinum undatum (L.). Marine Environmental Research 44:305-314.
33. Randall, L., and J. H. Weber. 1986. Adsorptive behavior of butyltin compounds under simulated estuarine conditions. Sci Total Environ 57:191-203.
34. Reed, J., M. J. Waldock, B. Jones, S. Blake, P. Roberts, G. Jones, C. Elverson, S. Hall, and L. Murray. 2002. Remediation techniques applied to reduce paint-derived tributyltin (TBT) in dredged material. Physical -Chemical Remediation:331-338.
35. Ritsema, R., R. W. P. M. Laane, and O. F. X. Donard. 1991. Butyltins in marine waters of the Netherlands in 1988 and 1989. Mar Pollut Bull 32:243-260.
36. Rouhi, A. M. 1998. The squeeze of tributyltins. Chemical & Engineering News 27:41-42.
37. Schatzberg, P. 1996. Measurement and significance of the release rate for tributyltin, p. 383-403. In M. A. Champ and P. F. Seligman (ed.), Organotin: Environmental Fate and Effects.
38. Seligman, P. F., J. Grovhoug, and K. E. Richter. 1986. Presented at the Oceans '86 Organotin Symposium, Washington DC.
39. Unger, M. A., W. G. Macintyre, and R. J. Huggett. 1988. Sorption Behavior of Tributyltin on Estuarine and Fresh-Water Sediments. Environmental Toxicology and Chemistry 7:907-915.

Task 3546: Sediment characterization TBT-CLEAN
48
40. Valkirs, A. O., B. Davidson, L. L. Kear, R. L. Fransham, J. G. Grovhoug, and P. F. Seligman. 1991. Long-term monitoring of tributyltin in San Diego Bay, California. Marine Environmental Research 32:151-168.
41. Valkirs, A. O., P. F. Seligman, and R. F. Lee. 1986. Presented at the Oceans '86 Organotin Symposium, New York, 23-25 September.
42. Valkirs, A. O., P. F. Seligman, P. M. Stang, V. Homer, S. H. Lieberman, G. Vafa, and C. A. Dooley. 1986. Measurement of butyltin compounds in San Diego Bay. Mar Pollut Bull 32:319-324.
43. Valkirs, A. O., M. O. Stallard, and P. F. Seligman. 1987. Presented at the Oceans '87 International Organotin Symposium, New York, 28 September - 1 October.
44. Vangheluwe, M., P. Van Sprang, L. Speleers, and C. Janssen. 2000. Development of a toxicity-identification-evaluation methodology for marine sediments: Case study 2: tributyltin contamination.
45. Waite, M. E., J. E. Thain, M. J. Waldock, J. J. Cleary, A. R. D. Stebbing, and R. Abel. 1996. Changes in concentrations of organotins in water and sediment in England and Wales following legislation, p. 553-580. In M. A. Champ and P. F. Seligman (ed.), Organotin: Environmental Fate and Effects.