Report - SINTEF - Forskning, teknologi og innovasjon...SINTEF Technology and Society Health Research...
108
SINTEF Technology and Society Health Research 2016‐09‐01 SINTEF A27196 ‐ Unrestricted Report Living conditions among people with disability in Botswana Editor(s) Arne H. Eide & Tlamelo Mmatli Photo: Shutterstock
Transcript of Report - SINTEF - Forskning, teknologi og innovasjon...SINTEF Technology and Society Health Research...
SINTEF Technology and Society
Health Research 2016‐09‐01
SINTEF A27196 ‐ Unrestricted
Report
Living conditions among people with disability in Botswana
Editor(s) Arne H. Eide & Tlamelo Mmatli
Photo: Shutterstock

1 of 106
SINTEF Teknologi og samfunn SINTEF Technology and Society
Address: Postboks 4760 Sluppen NO‐7465 Trondheim NORWAY
Telephone:+47 73593000 Telefax:+47 93270500
[email protected] www.sintef.no Enterprise /VAT No: NO 948 007 029 MVA
Report
Living conditions among people with disability in Botswana
KEYWORDS:
Keywords VERSION
Version
DATE
2016‐09‐01
AUTHOR(S)
Arne H. Eide
Tlamelo Mmatli
CLIENT(S)
Norwegian Federation of Organizations for Disabled People
CLIENT’S REF.
Client’s reference
PROJECT NO.
102001060
NUMBER OF PAGES/APPENDICES:
100 + Appendices
ABSTRACT
Abstract heading This is a report from a National, representative household survey carried out in Botswana in 2012 – 2014. The study was carried out on behalf of the Norwegian Federation of Organisations of Disabled Persons (FFO), Southern Africa Federation of the Disabled (SASFOD) and Botswana Federation of Disabled People (BOFOD). The study was led by Professor Tlamelo Mmatli of the University of Botswana, in collaboration with SINTEF Technology and Society. The study would not have been possible without a strong commitment from the Office of the President of Botswana and support from the Central Statistical Office.
The study presents a broad picture of the situation among individuals with disability and households with disabled members in Botswana. It offers comparison with individuals without disability and households without disabled members, between provinces and between genders and locations (urban/rural). The study reveals that households with disabled members and individuals with disability score lower on a range on indicators on level of living.
PREPARED BY
Arne H. Eide, Chief Scientist
SIGNATURE
CHECKED BY
Karl‐Gerhard Hem, Research Manager
SIGNATURE
APPROVED BY
Randi E. Reinertsen, Research Director
SIGNATURE
REPORT NO.
SINTEF A27196
ISBN
978‐82‐14‐05977‐9
CLASSIFICATION
Unrestricted
CLASSIFICATION THIS PAGE
Unrestricted
PROJECT NO. 102001060
REPORT NO. SINTEF A27196
VERSION Version 2 of 106
Document history
VERSION DATE VERSION DESCRIPTION
Version No. 1 2015‐10‐01 "[Version description.Use TAB for new line]"
PROJECT NO. 102001060
REPORT NO. SINTEF A27196
VERSION Version 3 of 106
Table of contents
ACKNOWLEDGEMENTS (A. H. Eide) ........................................................................................................... 5
SUMMARY (A. H. EIDE) .............................................................................................................................. 7
PREFACE 1 (Mussa Chiwaula) ......................................................................... Error! Bookmark not defined.
PREFACE 2 (Office of the President) ......................................................................................................... 14
THE CONTEXT OF BOTSWANA (A. H. Eide) ............................................................................................... 16
CONCEPTUAL UNDERSTANDING (A. H. Eide & T. Mmatli) ........................................................................ 18
Disability ................................................................................................................................................. 18
International Classification of Functioning, Disability and Health (ICF) ................................................. 18
Application of ICF in the current study .................................................................................................. 19
Living conditions ..................................................................................................................................... 20
Disability and living conditions ............................................................................................................... 20
Combining two traditions and ICF .......................................................................................................... 21
METHODOLOGY AND STUDY DESIGN ...................................................................................................... 22
RESULTS (A. H. Eide, T. Mmatli & K G Hem) ............................................................................................. 29
DISABLED AND NON‐DISABLED INDIVIDUALS .......................................................................................... 41
Activity limitations .................................................................................................................................. 41
Burden of disease ................................................................................................................................... 43
Education and literacy ............................................................................................................................ 43
Employment/economic activity ............................................................................................................. 46
Income and expenses ............................................................................................................................. 49
Mortality ................................................................................................................................................. 57
INDIVIDUAL CASE AND CONTROL ............................................................................................................ 59
Activity limitations .................................................................................................................................. 60
Environmental barriers .......................................................................................................................... 61
Marital status ......................................................................................................................................... 63
Health ..................................................................................................................................................... 64
Causes of disability ................................................................................................................................. 65
Violence and discrimination ................................................................................................................... 68
Service gaps ............................................................................................................................................ 70
Education (15 years and older) .............................................................................................................. 72
PROJECT NO. 102001060
REPORT NO. SINTEF A27196
VERSION Version 4 of 106
Employment and income ....................................................................................................................... 75
Medication ............................................................................................................................................. 77
Assistive devices ..................................................................................................................................... 78
How do you feel and how do you think about being a person with disability ....................................... 82
Social support ......................................................................................................................................... 83
Involvement in family and social life ...................................................................................................... 85
Health and well‐being ............................................................................................................................ 86
Knowledge and understanding of some common diseases ................................................................... 89
DISCUSSION ............................................................................................................................................ 93
CONCLUSION .......................................................................................................................................... 99
REFERENCES .......................................................................................................................................... 100
APPENDICES .......................................................................................................................................... 102
PROJECT NO. 102001060
REPORT NO. SINTEF A27196
VERSION Version 5 of 106
ACKNOWLEDGEMENTS (A. H. Eide)
This is a report from a National, representative household survey carried out in Botswana in 2012 - 2014. Several actors have been involved in the comprehensive study and thus made this research study possible. First of all, this is a credit to Southern Africa Federation of the Disabled for their coordinating role in the implementation of this study in Botswana as well as to previous similar studies in other countries in the region. It is also a credit to Botswana Federation of Disabled People (BOFOD) being involved as a key actor in the Steering Committee for the study and taking active part in the data collection. All activities related to producing the data that is analysed in this report was led by Professor Tlamelo Mmatli of University of Botswana. This included recruitment of research assistants, training, data collection, data entry and finalization of the data file. He had very qualified support in doing this from Mr. Phinda Khame of the Office of the President. All research assistants doing the groundwork in the field have done a tremendous job and should be thanked for their exemplary execution of a highly demanding exercise.
The Steering Committee for the survey comprised in its first meeting of Mr. Thomas Motingwa (Office of the President), chair, Mr. Steven Sekhobo (BOFOD), Mr. Modise Ramaretlwa (Statistics Botswana), Mr. Morena Mmopelwa (Office of the President), Dr. Tlamelo Mmatli (University of Botswana), Mr. Hamilton Mogatusi (Ministry of Health), Mrs.T Butau (Southern Africa Federation of the Disabled), Ms.Thando Ziga (MIST), Mr. Wilson Thupeng (University of Botswana), and Mrs. Phetogo Zambezi (Statistics Botswana). They should all be thanked for their support and ability to overcome obstacles and set the right course for the study. Their efforts have laid the groundwork for a baseline dataset that will be a useful tool for disability policy, service delivery and thus for people with disabilities in Botswana in the years to come. We want in particular to recognize the role of the Office of the President that took great interest in the study and stepped in as a major partner from the early phases of the study. The role of Mr. Thomas Motingwa, Disability Advisor at the Office of the President and chair of the Steering Committee, replaced by Mr. Hamilton Mogatusi during the study, has been of great importance for a successful study implementation. Statistics Botswana has offered institutional support as well as having representatives at different levels in the project, including the Steering Committee.
Persons with disability have contributed in different roles, both as representatives for the disability movement and as individuals taking part directly in the training and data collection. SAFOD, with its current Executive Director Mr. Mussa Chiwaula, has through a long-term leading role in establishing base line data sets of living conditions among people with disabilities in southern Africa, initiated, coordinated and taken the lead role in this important endeavor. The role of Mrs. Tecla Butau of SAFOD in coordinating the study and following up a number of issues during the long process must also be mentioned as particularly valuable. In all, this has proven the capabilities of disabled people and their representatives in different roles. This report and the Living Conditions Study in Botswana had not been possible without their enthusiastic participation.
All mentioned, and some not mentioned, have contributed tremendously, not least to change the role of disabled people from objectives for research to actors and decision makers in research. This
PROJECT NO. 102001060
REPORT NO. SINTEF A27196
VERSION Version 6 of 106
is a remarkable achievement, given the difficult situation for many individuals with disabilities in Botswana and in the region. With such a broad support for this project, it has been a pleasure being involved in this and we congratulate all stakeholders in this field with the establishment of new knowledge about the situation for disabled in Botswana.
Oslo/Gaborone, 1st October 2015
Arne H. Eide
PROJECT NO. 102001060
REPORT NO. SINTEF A27196
VERSION Version 7 of 106
SUMMARY (A. H. EIDE)
This study on living conditions among persons with disability in Botswana was carried out in 2013 - 2014. It follows similar studies in seven other countries in the southern Africa Region, together forming a regional data base that can be utilized for international (regional) comparison. The Norwegian Federation of Organizations for Disabled People (FFO), Southern Africa Federation of the Disabled (SAFOD) and SINTEF have partnered in all studies, with funding from the Atlas Alliance/Norwegian Agency for Development Cooperation (NORAD). In each country, the national affiliate of SAFOD has been a major partner, with other key partners being Central Statistical Offices, Universities and relevant Government ministries. In Botswana, the study was carried out in a partnership between SAFOD, FFO, SINTEF, University of Botswana, Botswana Federation of Disabled People (BOFOD), Office of the President, and supported by Statistics Botswana. The study in Botswana was carried out as a household survey with two-stage stratified sampling, including a screening/listing procedure using the Washington Group on Disability Statistics 6 questions, one Household questionnaire administered to households with (Case HHs) and without (Control HHs) , one Individual Case questionnaire administered to individuals who were found to qualify as being disabled in the screening (Case individuals), and an Individual Control questionnaire administered to matched non-disabled individuals in the Control HHs (Control individuals). The questionnaires cover a range of indicators on level of living, such as socio-economic indicators, economic activity, income, ownership and infrastructure, health (including reproductive health), access to health information, access to services, education, access to information, social participation, and exposure to discrimination and abuse. The study has generally demonstrated that households with at least one person with disability as member score lower on most indicators on level of living than Control HHs. This is the case for the indicator comprising possessions in the household (possession or asset scale), dietary diversity, access to information as well as dependency ratio. It adds to this difference that Case HHs have a higher mean number of members. With regards to infra- structure (housing facilities, type of houses, access to water, toilet facilities) and ownership of houses, there are however marginal differences within locations. There are, on the other hand, substantial differences between locations, with poorer standard in rural areas as compared to cities and urban villages. At the individual level, persons with disability have generally more health problems, a higher proportion with poor physical and mental health, lower well-being, and less access to health information as compared to Control individuals. Fewer Case individuals access the formal education system, those who access the education system tend to spend shorter time in the education system, and there is a tendency that persons without disability achieve higher levels of education. This results in lower level of literacy among Case individuals. Unemployment is higher among persons with disability, and fewer have paid work and thus tend to depend more on others in their households. There are on the other hand small differences between
PROJECT NO. 102001060
REPORT NO. SINTEF A27196
VERSION Version 8 of 106
the two groups with regards to skills and skills training. Among those who reported a regular income, control individuals earn significantly more than case individuals. Individuals with disability experience quite substantial gaps in services. The largest gaps in services in percentage points were found for welfare services, counselling for persons with disabilities, and counselling for parent/family. In relative terms (percentage of received services by needed services), the largest gaps were found for legal advice, followed by vocational training, counselling and welfare services. The smallest gaps were found for health services, health information, and traditional healer. A relatively (compared to other similar studies) large proportion of individuals with disability in this study stated that they used an assistive device. While the results indicate that the Government may play a more central role in distribution of assistive devices than in most other countries in the region, the same problems were found with regards to fragmentation of assistive device service delivery, indicated by substantial gaps in information/training and maintenance. Persons with disability are less involved in family and social life as compared to their non-disabled counterparts. The largest differences were found with regards to help from the family in daily activities, voting, and whether the person is involved in household decisions. Around one third of the respondents with a disability confirmed that they did not vote because of their disability. The study has revealed some important gender differences, with regards to health, access to services, and employment. Most of the indicators that were analyzed point towards somewhat less favorable results for females as compared to males. Many of these differences were however relatively small. Both functional and social conditions contribute to a difference in reproductive life courses among females with and without disability, with further consequences for social participation/inclusion. The study distinguishes between three types of localities, i.e. city/town, urban villages and rural areas. Urban villages are close to cities, share some of the infrastructure with their urban neighbors, and may be seen as suburbs and peri-urban areas. The three main SES indicators all indicate that the living standard is lowest in rural areas. For many indicators there are relatively small differences between cities/towns and urban villages. On some indicators urban villages/individuals living in urban villages are better off than cities/ individuals living in cities, while for other indicators it is the opposite. The case/control difference is however found also within the three location categories. The study thus confirms that households without disabled members are better off than case households. Although the differences largely are statistically significant, they are however mostly on the low side. It does add to the difference however that case households are larger than controls (higher mean number of members) and that all indicators point in the same direction. Generally, the study reveals consistent differences between case/control households and case/control individuals. Level of living, measured by means of a range of different indicators, is higher among controls than among cases at both levels (household and individual). All together the study thus provides evidence for differences in level of living that should be reduced and limited completely. This requires an active stand from the side of public authorities and a multi-sector strategy that deals with these differences. Measures to achieve this will be both general and sector specific and a thorough analysis of what can be done to reduce the documented differences and to address service gaps and inadequacy in assistive device services, etc.

PROJECT NO. 102001060
REPORT NO. SINTEF A27196
VERSION Version 9 of 106
Having established evidence for differences between disabled and non‐disabled is an important step in the promotion of human rights and improved level of living among individuals with disability. The study offers an opportunity for boosting advocacy, for setting priorities, for assessing impact and developing policies, for monitoring the situation, and for increased knowledge among disabled and the public in general. SUMMARY OF CASE/CONTROL COMPARISONS Indicator Household study Individual study Case Control Case Control N 989 8905 942 989 Mean age 32.2 years 29.1 years 40.3 years 38.1 years Percentage males 53.9% 44.2% 46.3% 60.7% Dependency ratio 0.85 0.76 SES scale (0‐22) 8.22 9.92 Dietary diversity (0‐12) 8.28 9.11 Access to information scale (5‐10)
7.6 7.2
Individuals in Household study Chronically ill last 12 months
21.7% 8% 22.2% 12.2%
School attendance (=> 15 years)
59.5% 88.3% 60.2% 83.6%
Studied as far as planned (males)
10.9% 14.3%
Mean years of education
7.8 years 9.7 years 8.0 years 9.6 years
Literacy (5 years +) 52.6% 90.0% 53.6% 86.8 Paid work (males)2 6.6% 23.1% 7.4% 19.3% Unemployed (males) 72.7% 41.3% 70.0% 43.6% Have a skill (males) (=> 15 years)
25.7% 23.4% 27.1% 30.6%
Environmental barriers (10 ‐ 40)
16.63 12.62
Mean income 1727 BWP 2813 BWP Voted in last election 60.1% 69.2% Wellbeing scale (12‐52)1
23.65 20.24
Poor/very poor physical health
35.8% 12.3%
Poor/very poor mental health
29.7% 6.2%
1 Higher scale values = lower wellbeing
PROJECT NO. 102001060
REPORT NO. SINTEF A27196
VERSION Version 10 of 106
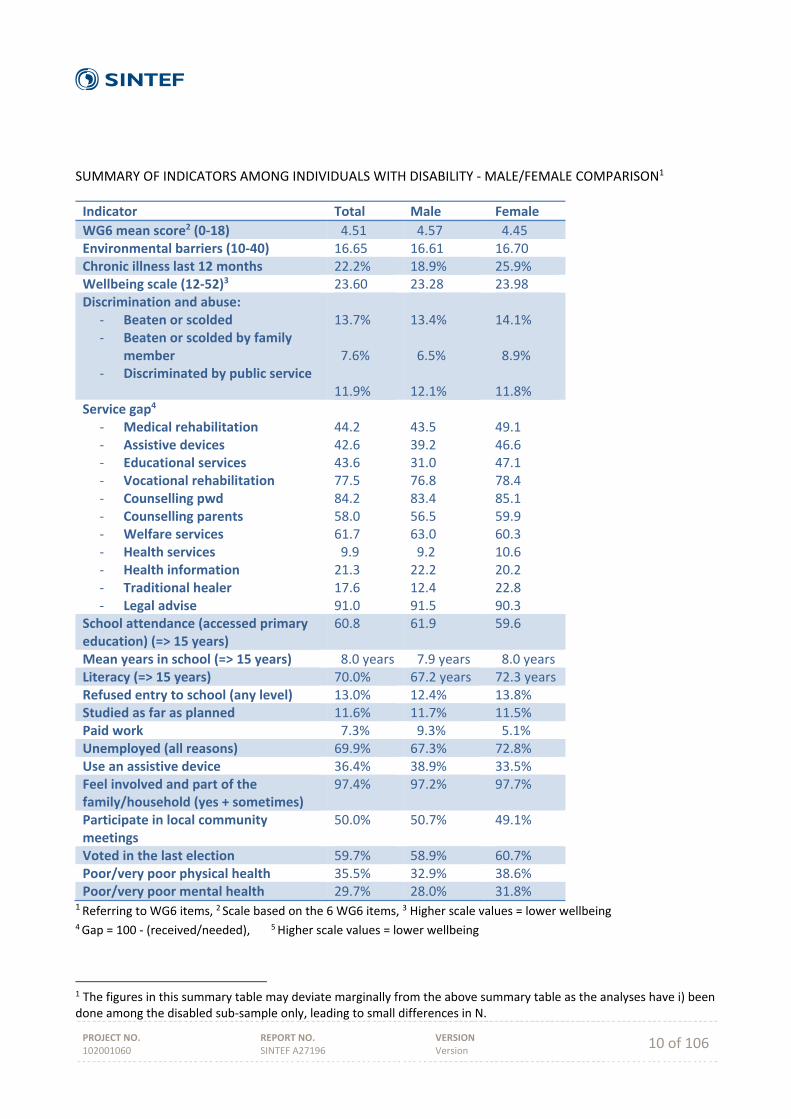
SUMMARY OF INDICATORS AMONG INDIVIDUALS WITH DISABILITY ‐ MALE/FEMALE COMPARISON1
Indicator Total Male Female
WG6 mean score2 (0‐18) 4.51 4.57 4.45 Environmental barriers (10‐40) 16.65 16.61 16.70 Chronic illness last 12 months 22.2% 18.9% 25.9% Wellbeing scale (12‐52)3 23.60 23.28 23.98 Discrimination and abuse:
‐ Beaten or scolded ‐ Beaten or scolded by family
member ‐ Discriminated by public service
13.7% 7.6% 11.9%
13.4% 6.5% 12.1%
14.1% 8.9% 11.8%
Service gap4
‐ Medical rehabilitation ‐ Assistive devices ‐ Educational services ‐ Vocational rehabilitation ‐ Counselling pwd ‐ Counselling parents ‐ Welfare services ‐ Health services ‐ Health information ‐ Traditional healer ‐ Legal advise
44.2 42.6 43.6 77.5 84.2 58.0 61.7 9.9 21.3 17.6 91.0
43.5 39.2 31.0 76.8 83.4 56.5 63.0 9.2 22.2 12.4 91.5
49.1 46.6 47.1 78.4 85.1 59.9 60.3 10.6 20.2 22.8 90.3
School attendance (accessed primary education) (=> 15 years)
60.8 61.9 59.6
Mean years in school (=> 15 years) 8.0 years 7.9 years 8.0 years Literacy (=> 15 years) 70.0% 67.2 years 72.3 years Refused entry to school (any level) 13.0% 12.4% 13.8% Studied as far as planned 11.6% 11.7% 11.5% Paid work 7.3% 9.3% 5.1% Unemployed (all reasons) 69.9% 67.3% 72.8% Use an assistive device 36.4% 38.9% 33.5% Feel involved and part of the family/household (yes + sometimes)
97.4% 97.2% 97.7%
Participate in local community meetings
50.0% 50.7% 49.1%
Voted in the last election 59.7% 58.9% 60.7% Poor/very poor physical health 35.5% 32.9% 38.6% Poor/very poor mental health 29.7% 28.0% 31.8%
1 Referring to WG6 items, 2 Scale based on the 6 WG6 items, 3 Higher scale values = lower wellbeing 4 Gap = 100 ‐ (received/needed), 5 Higher scale values = lower wellbeing
1 The figures in this summary table may deviate marginally from the above summary table as the analyses have i) been done among the disabled sub‐sample only, leading to small differences in N.
PROJECT NO. 102001060
REPORT NO. SINTEF A27196
VERSION Version 11 of 106
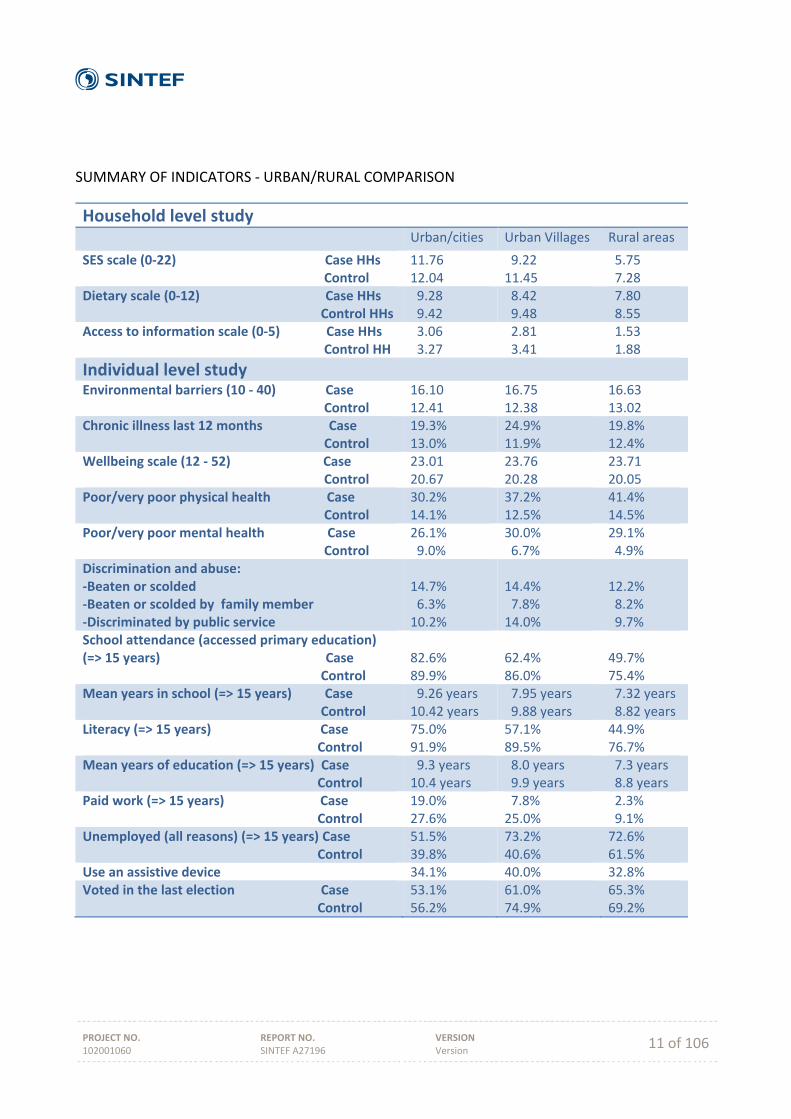
SUMMARY OF INDICATORS ‐ URBAN/RURAL COMPARISON
Household level study
Urban/cities Urban Villages Rural areas
SES scale (0‐22) Case HHs Control
11.76 12.04
9.22 11.45
5.75 7.28
Dietary scale (0‐12) Case HHs Control HHs
9.28 9.42
8.42 9.48
7.80 8.55
Access to information scale (0‐5) Case HHs Control HH
3.06 3.27
2.81 3.41
1.53 1.88
Individual level study Environmental barriers (10 ‐ 40) Case Control
16.10 12.41
16.75 12.38
16.63 13.02
Chronic illness last 12 months Case Control
19.3% 13.0%
24.9% 11.9%
19.8% 12.4%
Wellbeing scale (12 ‐ 52) Case Control
23.01 20.67
23.76 20.28
23.71 20.05
Poor/very poor physical health Case Control
30.2% 14.1%
37.2% 12.5%
41.4% 14.5%
Poor/very poor mental health Case Control
26.1% 9.0%
30.0% 6.7%
29.1% 4.9%
Discrimination and abuse: ‐Beaten or scolded ‐Beaten or scolded by family member ‐Discriminated by public service
14.7% 6.3% 10.2%
14.4% 7.8% 14.0%
12.2% 8.2% 9.7%
School attendance (accessed primary education) (=> 15 years) Case Control
82.6% 89.9%
62.4% 86.0%
49.7% 75.4%
Mean years in school (=> 15 years) Case Control
9.26 years 10.42 years
7.95 years 9.88 years
7.32 years 8.82 years
Literacy (=> 15 years) Case Control
75.0% 91.9%
57.1% 89.5%
44.9% 76.7%
Mean years of education (=> 15 years) Case Control
9.3 years 10.4 years
8.0 years 9.9 years
7.3 years 8.8 years
Paid work (=> 15 years) Case Control
19.0% 27.6%
7.8% 25.0%
2.3% 9.1%
Unemployed (all reasons) (=> 15 years) Case Control
51.5% 39.8%
73.2% 40.6%
72.6% 61.5%
Use an assistive device 34.1% 40.0% 32.8% Voted in the last election Case Control
53.1% 56.2%
61.0% 74.9%
65.3% 69.2%
PROJECT NO. 102001060
REPORT NO. SINTEF A27196
VERSION Version 12 of 106
PREFACE On behalf of the Southern Africa Federation of the Disabled (SAFOD), we are grateful that, once again, we are presenting to the world yet another report on Living Conditions among Persons with Disabilities specifically for Botswana after presenting similar reports over the last 15 years or so from various other countries in the Southern Africa region, namely Namibia, Zimbabwe, Malawi, Zambia, Mozambique, Swaziland, and Lesotho. As SAFOD we see this report as one of the many triumphs in our disability work in Botswana, something that provides us with a strong basis for programmatic, policy and legislative advocacy not only on our part as SAFOD but also - and most critically - our National Affiliate, the Botswana Federation of the Disabled (BOFOD) as well as its members. Indeed, when working on disability rights in most developing countries, Botswana, included one of the major obstacles is the lack of statistics and data of Persons with Disabilities. It is for this reason that a series of studies on Living Conditions of Persons with Disabilities were initiated by the Norwegian Federation of Organizations of Disabled People (FFO) and Southern Africa Federation of the Disabled (SAFOD) in 1998. For SAFOD, we view this report, in particular, coming at the very crucial period when the voices of Disabled Peoples Organisations (DPOs) and other stakeholders are lobbying for the enactment of a disability law and the ratification of the UN Convention on the Rights of Persons with Disabilities (UNCRPD). It is our hope that the current efforts by the Botswana Government to put in place a national disability policy are expedited as this will greatly assist in putting in place a robust legislative framework which in turn creates a conducive environment for the promotion and protection of the rights of Persons with Disabilities in Botswana. As you will get to learn from this report, this report brings to the fore quite a substantial number of findings. For example, the report found that there are significantly higher unemployment levels among Persons with Disabilities as compared to those without disabilities. On education, it was found that there was a large difference between individuals with and without disability when it comes to school attendance, as 88.3 percent of non-disabled individuals had ever attended school, yet the corresponding figure for individuals with disability was 59.5 percent. And the report further found that there were significantly fewer individuals with disability than non-disabled who were able to read or write (52.6 percent and 89.9 percent respectively). So like just in the other countries where this similar research has been carried out, it was clear that most of the challenges that Persons with Disabilities in Botswana face are in many ways strikingly the same as what their counterparts confront elsewhere; ranging from increased unemployment to poverty; from increased lack of access to social services to increased lack of access to education; among many others. This only sums up the daunting nature of the work that the DPOs in Botswana have to fulfil in advocating for inclusive Government programming on one hand, and creation of an improved legislative environment to support some of the interventions that it is already implementing. As an organisation, SAFOD seeks to strengthen DPOs in SAFOD member countries through training, research, coordination, information sharing, and promotion of human rights and adoption of appropriate strategies for stimulating Persons with Disabilities to enhance their economic, political and social development. But it will always be a tall order for SAFOD to successfully fulfil this mandate without baseline data on the ground on which to premise our evidence-based advocacy.
PROJECT NO. 102001060
REPORT NO. SINTEF A27196
VERSION Version 13 of 106
It is, therefore, in this context, that the findings from this report will further reinforce not only DPOs efforts but also their resolve in mobilizing Government and other stakeholders’ commitments at all levels within the country with a view to promoting the rights and wellbeing of persons with disabilities. We thank our partner FFO for their continued support in making these research studies possible in all the countries including this one in Botswana. We also appreciate the important role SINTEF Health and others have played, without whose expertise, the study would not have been possible. We also applaud the Government of Botswana for the great support and also in enabling the study to be done in Botswana. Mussa Chiwaula SAFOD DIRECTOR GENERAL
PROJECT NO. 102001060
REPORT NO. SINTEF A27196
VERSION Version 14 of 106
PREFACE 2 (Office of the President)
Disability is a human right issue which of late has taken centre stage as a priority in development agenda warranting urgent intervention. The United Nations General Assembly has alluded to the assertation that it is impossible to achieve the internationally agreed development goals, without the inclusion and integration of the rights, well-being and perspectives of persons with disabilities in development efforts at both the national, regional and international levels. After the adoption of the Millennium Development goal in 2000, it became evident that the thematic areas to guide the development discourse was inadequate since it has left out indicators specific for people with disabilities. These developments culminated in intense and successfully lobby for the inclusion of disability inclusion by the disability movement worldwide. African Disability Movement, especially Southern African Federation for People with Disabilities (SAFOD) which is a regional coordinating entity in Southern Africa, took it a mile further by engaging its Norwegian partner (FFO) to initiate a consortium responsible for improving the quality of life of people with disabilities. Amongst the tasks the consortium was to carry out was to strengthen the capacity of Disabled Peoples Organization (DPOs) and further undertake studies on the living conditions among People with Disabilities. The result of these studies will be a data bank or repository that will create awareness on disability issues, and thereby informing public policy.
Disability affects everyone directly and indirectly and can happen to anyone at any time in their lifetime. Both the medical, environmental and of course socio economic factors account for the current disability we are experiencing in the country. This development has seriously challenged our resources, especially as we continuously endeavor to cope with the ever increasing unique issues of people with disabilities. However, we continuously strive to achieve inclusivity, through provision of equitable resources to our citizens but unfortunately we fall short of our expectations and aspirations simply because we lack the data to influence the much needed transformation for the betterment of quality of life our people with disabilities. To achieve an impressive impact and further target the desired value transforming programmes, it is critical to develop a significant evidence based evaluation so as to be well informed to competently address the pressing needs of people with disabilities. The living Condition study sponsored by FFO administered through the office of the President together with SAFOD and BOFOD is a critical milestone in influencing positive development towards informed programming for people with disabilities The 2011 Population and Housing Census indicates that there are about 59, 103 people with disabilities in Botswana which is 2.92% of the total population of 2,024,904. The highest proportion of disabled persons is found in Gantsi (4.4%), followed by Southern (3.7%), Kgalagadi (3.7%) and North-West district with 3.6%. All other districts have disability prevalence rate of between 1.3% and 3.5%. However it is pleasing to note that without surveys like the above mentioned population and housing census are inadequate to inform specific issues of interest in this regard disability.
PROJECT NO. 102001060
REPORT NO. SINTEF A27196
VERSION Version 15 of 106
It is of paramount importance to note that though the Population Census embraces disability there is still acute paucity of data in specific areas of interest. This revelation has led to inadequate resource allocation at planning and programming level culminating in less targeted initiatives for people with disabilities. More often than not, disability data has been a responsibility of fewer sectors irrespective of the fact that it is a cross cutting issue that needs to be reflected in almost all the programmes. Collection of disability data is a prerequisite to successful disability mainstreaming and it requires the involvement of all stakeholders. The provision of data by all enhances and strengthens processes for inclusion of people with disabilities thereby facilitating effective planning and programming. Botswana developed the Policy on Care of People with Disabilities in 1996 as a comprehensive document for guiding service delivery to people with disabilities at National level. The policy is currently being reviewed mainly to address coordination and alignment to the appropriate service providers. The placement of a coordination role for disability in the Ministry of Health was misunderstood to suggest that disability was a health issue, hence the belief that the medical model of rehabilitation was the right approach to follow and that Ministry of Health had the sole role and mandate for disability. The coordination role has since been transferred to the Office of the President to accord disability the impetus it deserves as a cross cutting issue. The reviewed policy aims to embrace the principles of Conventions on the Rights of People with Disabilities Adopted by The United Nations In 2006. The policy is to be enacted before the end of the financial year 2015/16. Gaborone, 1st October 2015 Office of the President
PROJECT NO. 102001060
REPORT NO. SINTEF A27196
VERSION Version 16 of 106
THE CONTEXT OF BOTSWANA (A. H. Eide)
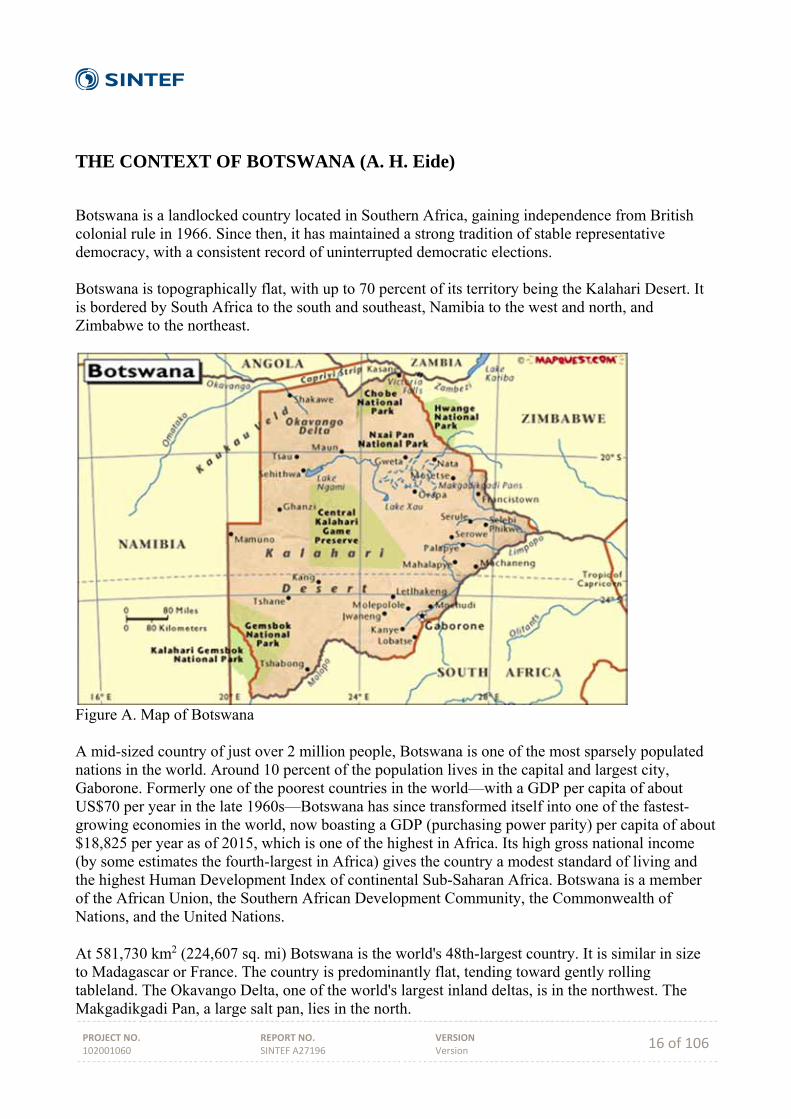
Botswana is a landlocked country located in Southern Africa, gaining independence from British colonial rule in 1966. Since then, it has maintained a strong tradition of stable representative democracy, with a consistent record of uninterrupted democratic elections. Botswana is topographically flat, with up to 70 percent of its territory being the Kalahari Desert. It is bordered by South Africa to the south and southeast, Namibia to the west and north, and Zimbabwe to the northeast.
Figure A. Map of Botswana A mid-sized country of just over 2 million people, Botswana is one of the most sparsely populated nations in the world. Around 10 percent of the population lives in the capital and largest city, Gaborone. Formerly one of the poorest countries in the world—with a GDP per capita of about US$70 per year in the late 1960s—Botswana has since transformed itself into one of the fastest-growing economies in the world, now boasting a GDP (purchasing power parity) per capita of about $18,825 per year as of 2015, which is one of the highest in Africa. Its high gross national income (by some estimates the fourth-largest in Africa) gives the country a modest standard of living and the highest Human Development Index of continental Sub-Saharan Africa. Botswana is a member of the African Union, the Southern African Development Community, the Commonwealth of Nations, and the United Nations.
At 581,730 km2 (224,607 sq. mi) Botswana is the world's 48th-largest country. It is similar in size to Madagascar or France. The country is predominantly flat, tending toward gently rolling tableland. The Okavango Delta, one of the world's largest inland deltas, is in the northwest. The Makgadikgadi Pan, a large salt pan, lies in the north.
PROJECT NO. 102001060
REPORT NO. SINTEF A27196
VERSION Version 17 of 106
The Tswana are the majority ethnic group in Botswana, making up 79% of the population. The largest minority ethnic groups are the BaKalanga, San or AbaThwa also known as Basarwa. Other tribes are Bayei, Bambukushu, Basubia, Baherero and Bakgalagadi. In addition, there are small numbers of whites and Indians, both groups being roughly equally small in number.
PROJECT NO. 102001060
REPORT NO. SINTEF A27196
VERSION Version 18 of 106
CONCEPTUAL UNDERSTANDING (A. H. Eide & T. Mmatli)
Disability and living conditions are core concepts to the study presented in this report. Both concepts are open to interpretation and can be perceived in different ways. While the International Classification on Functioning, Disability and Health (ICF) (WHO 2001) seems to gain ground as the main model on disability, it is important to be aware that the understanding of disability will vary from one socio‐cultural context to another (Whyte & Ingstad, 1998). Some clarification of the conceptual understanding inherent in the current study is necessary for the interpretation and utilization of the results.
Disability During the 1970s there was a strong reaction among representatives of organisations of persons with disabilities and professionals in the field of disability against the then current terminology. The new emerging concept of disability was more focused on the interaction between the individual and his/her environment, and on the close connection between the limitations experienced by individuals with disabilities, the design and structure of their environments and the attitudes and practice of the general population. Recent development has seen a shift in terminology and an increasing tendency towards viewing the disability complex as a process (the disablement process), involving a number of different elements on individual, societal and contextual levels. The traditionally dominant medical model of disability was challenged by the social model (Finkelstein & French, 1993; Shakespeare, 2014), leading further to development of an interactional model on disability (WHO, 2001).
The recently adopted UN Convention on Rights of People with Disabilities (CRPD) (UN 2006) defines disability as:
"Persons with disabilities include those who have long‐term physical, mental, intellectual or sensory impairments which in interaction with various barriers may hinder their full and effective participation in society on an equal basis with others" (Article 1)
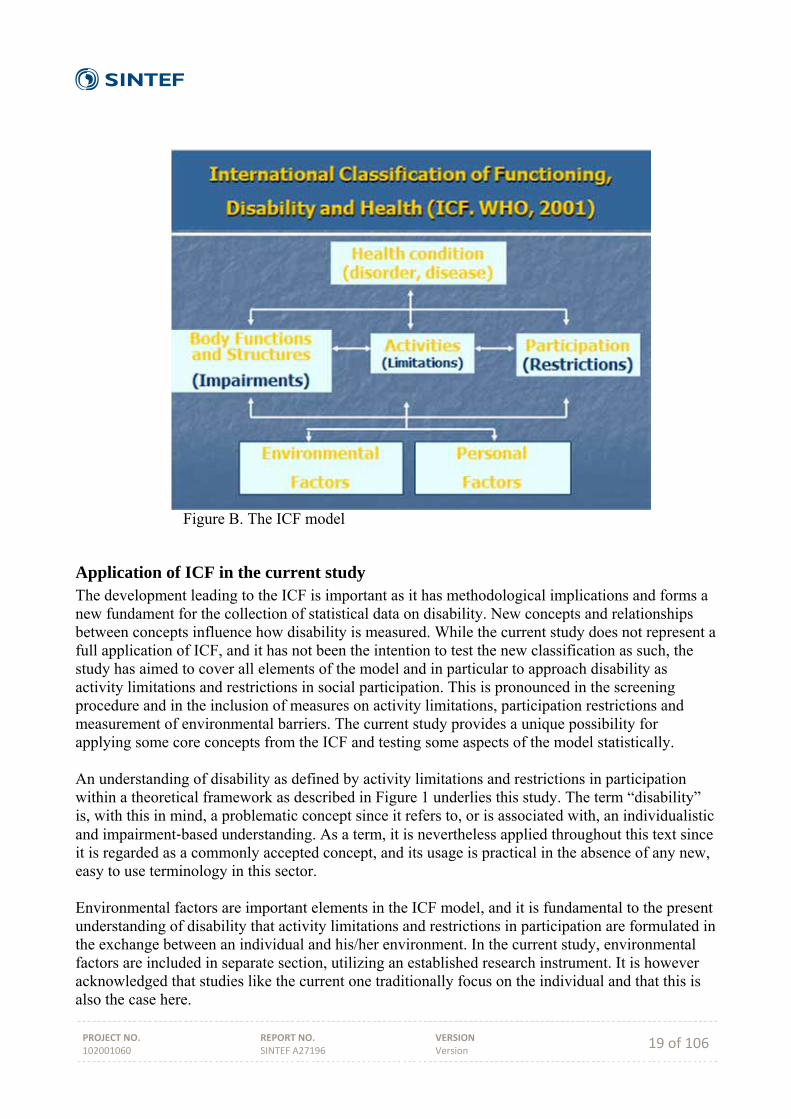
International Classification of Functioning, Disability and Health (ICF) The adoption of the World Health Organization's International Classification of Functioning, Disability and Health (WHO, 2001) represents a milestone in the development of the disability concept. From 1980 and the first classification (The International Classification of Impairments, Disabilities and Handicaps (ICIDH) (WHO, 1980)), a process over two decades resulted in a shift in the WHO conceptual framework from a medical model (impairment based) to a new scheme that focuses on limitations in activities and social participation. Although not representing a shift from a strictly medical to a strictly social model, the development culminating with ICF may be understood as a merge of the social and the medical model into an interaction model that implies a much wider understanding of disability and the disablement process.
PROJECT NO. 102001060
REPORT NO. SINTEF A27196
VERSION Version 19 of 106
Figure B. The ICF model
Application of ICF in the current study The development leading to the ICF is important as it has methodological implications and forms a new fundament for the collection of statistical data on disability. New concepts and relationships between concepts influence how disability is measured. While the current study does not represent a full application of ICF, and it has not been the intention to test the new classification as such, the study has aimed to cover all elements of the model and in particular to approach disability as activity limitations and restrictions in social participation. This is pronounced in the screening procedure and in the inclusion of measures on activity limitations, participation restrictions and measurement of environmental barriers. The current study provides a unique possibility for applying some core concepts from the ICF and testing some aspects of the model statistically. An understanding of disability as defined by activity limitations and restrictions in participation within a theoretical framework as described in Figure 1 underlies this study. The term “disability” is, with this in mind, a problematic concept since it refers to, or is associated with, an individualistic and impairment‐based understanding. As a term, it is nevertheless applied throughout this text since it is regarded as a commonly accepted concept, and its usage is practical in the absence of any new, easy to use terminology in this sector.
Environmental factors are important elements in the ICF model, and it is fundamental to the present understanding of disability that activity limitations and restrictions in participation are formulated in the exchange between an individual and his/her environment. In the current study, environmental factors are included in separate section, utilizing an established research instrument. It is however acknowledged that studies like the current one traditionally focus on the individual and that this is also the case here.
PROJECT NO. 102001060
REPORT NO. SINTEF A27196
VERSION Version 20 of 106
Living conditions The concepts of “level of living” or “living conditions” have developed from a relatively narrow economic and material definition to a current concern with human capabilities and how individuals utilise their capabilities (Heiberg & Øvensen, 1993). Although economic and material indicators play an important role in the tradition of level of living surveys in the industrialised countries, an individual’s level of living is currently defined not so much by his or her economic possessions, but by the ability to exercise choice and to affect the course of his or her own life. Level of living studies have been more and more concerned with such questions and are currently attempting to examine the degree to which people can participate in social, political and economic decision‐making and can work creatively and productively to shape their own future (UNDP, 1997).
A number of core items can be regarded as vital to any level of living study: demographics, health, education, housing, work and income. Other indicators may comprise use of time, social contact, sense of influence, sense of well‐being, perceptions of social conflict, access to political resources, access to services, social participation, privacy and protection, etc. The choice of which indicators to include will vary according to the specific requirements of each study and the circumstances under which the studies are undertaken.
Disability and living conditions Research on living conditions is comparative by nature. Comparison between groups or monitoring development over time within groups and populations are often the very reasons for carrying out such studies. The purpose is thus often to identify population groups with certain characteristics and to study whether there are systematic differences in living conditions between groups - or to study changes in living conditions within groups over time and to compare development over time between groups. Population sub‐groups of interest in such studies are often defined by geography, gender, age - or the focus of the current research, i.e. people with disabilities vs. non‐disabled. Research in high‐income countries has demonstrated that people with disabilities are worse off along the whole specter of indicators concerning living conditions, and that this gap has also remained during times with steady improvement of conditions for all (Hem & Eide, 1998). This research‐based information has been very useful for advocacy purposes, for education and attitude change in the population, as well as for planning and resource allocation purposes. These same patterns of systematic differences are also at work in low‐income countries, as has been documented in our studies in other countries in the region (op. cit.). When the stated purpose of the research is to study living conditions among people with disabilities, it is essential, at the onset, to decide upon a working definition of disability in order to identify who is disabled and who is not. This is a more complex issue than choosing between a “medical model” on one side and a “social model” on the other. How this is understood and carried out has major impact on the results of research, and consequently on the application of results (refer to chapter 3.1 on the disability concept).
The ICF may to some extent be viewed as an attempt to combine a broad range of factors that influence the “disability phenomena”. The authors behind this research report support the idea that disability or the disablement process is manifested in the exchange between the individual and his/her environment. Disability is thus present if an individual is (severely) restricted in his/her daily life activities due to a mismatch between functional abilities and demands of society. The role
PROJECT NO. 102001060
REPORT NO. SINTEF A27196
VERSION Version 21 of 106
of the physical and social environment in disabling individuals has been very much in focus during the last 10 - 20 years with the adoption of the Standard Rules, the World Programme of Action, ICF, and lately the UN Convention (CRPD). It is logical that this development is followed by research on the mechanisms that produce disability in the meeting between the individual and his/her environment. It is true that studies of living conditions among people with disabilities in high‐income countries have been criticised for not evolving from an individualistic perspective. Data are collected about individuals and functional limitations are still in focus. It is a dilemma that this research tradition has not yet been able to reflect the relational and relative view on disability that most researchers in this field would support today. While we agree to such viewpoints, we nevertheless argue that a “traditional” study is needed in low-income countries to allow for a description of the situation as well as comparing between groups and over time. In high‐income countries such studies have shown themselves to be powerful tools in the continuous struggle for the improvement of living conditions among people with disabilities. In spite of an individualistic bias in the design of these studies, the results can still be applied in a critical perspective on contextual and relational aspects that represents important mechanisms in the disablement process.
Combining two traditions and ICF The design that has been developed and tested here aims at combining two research traditions: studies on living conditions and disability studies. Pre‐existing and validated questionnaires that had been used in Namibia (on general living conditions - NPC, 2000) and in South Africa (on disability - Schneider et. al., 1999) were combined and adapted for use in the surveys. A third element, on activities and participation, was included to incorporate the conceptual developments that have taken place in connection with development of ICF. By combining the two traditions, a broader set of variables that can describe the situation for people with disabilities are included as compared to traditional disability statistics. A possibility is established for a broad comparison of the conditions of disabled people (and households with disabled people) with non‐disabled (and households without any disabled members). This comparative aspect is rather rare in disability statistics. In the current study comparison is made possible between case/control households and individuals. Further, the study is part of a long-term research activity with similar studies in all SADCC countries, creating a unique data base for comparison also across countries in the region.

PROJECT NO. 102001060
REPORT NO. SINTEF A27196
VERSION Version 22 of 106
METHODOLOGY AND STUDY DESIGN
Introduction [A.H. Eide] The national, representative study on living conditions among persons with disability in Botswana is aimed at establishing a broad mapping of the situation for persons with disability and to compare with non-disabled. The intention is that this information can be used by the disability movement in their advocacy work and to inform the formulation and implementation of policies and programmes that are inclusive of persons with disability. A survey like this is an effective way of generating a picture of the situation at the time of data collection and can serve as a baseline for future studies and monitoring of the development. As such, repeated studies can enable a monitoring of the situation and provide evidence for success or failure of policies and measures to contribute to a more inclusive society. The study may therefore be a potential important tool for monitoring the implementation of the Convention on the Rights of Persons with Disability in Botswana. This chapter provides a description of the methodological approach adopted in undertaking the study. Sampling Design [Kebotsamang & Mmatli]
It is widely accepted that sample surveys whose design and methodologies are well developed and executed can, as closely as possible, reproduce the characteristics of interest in a population. Hence, this study adopted a survey methodology to address the key research objectives. The target population for sampling was all private households in Botswana excluding institutionalized and homeless people. The households were selected using a two-stage stratified sampling design.
The first stage involved the selection of enumeration areas (EAs) as primary sampling units using probability proportional to size (PPS) sampling technique. The enumeration areas were stratified by locality (city/town, urban and rural areas) and Botswana’s 16 administrative districts. The districts are Gaborone, Francistown, Lobatse, Jwaneng, Selibe Phikwe, Sowa Town, Orapa, Southern, South-East, Kweneng, Kgatleng, Central, North-East, North-West, Ghantsi and Kgalagadi. The sample of the EAs was drawn from the master sampling frame developed by Statistics Botswana after the 2011 Population and Housing Census.
At the second stage, up to a maximum of 20 households were systematically selected from each sampled EAs. In general, the number of households selected in a certain EA was dependent on the total number of households with people with disabilities in that particular EA. However, the maximum number of households with people with disabilities that could be selected was 10. Accordingly, the same number of households without people with disabilities was also selected using systematic sampling technique for matching purposes.
Sample Size Determination [Kebotsamang & Mmatli]
The size of the sample is one of the most important aspects of any sample design because it affects the precision, cost, and duration of a survey more than any other factor. Therefore, sample size must be considered bearing in mind the available budget for the survey, the precision requirements of the estimates obtainable from the survey and margin of error acceptable among other factors.
PROJECT NO. 102001060
REPORT NO. SINTEF A27196
VERSION Version 23 of 106
This study adopted the approach appropriate for estimating the disability prevalence rate. However, it should be noted that the main objective of the study was not to estimate disability prevalence rate but, rather, to investigate the living conditions among people with disabilities. Hence, the approach was only a guide to finding a suitable or appropriate sample size required for this study. The required sample size (n) for a given sub-population for survey round is given by the formula
∝ 1
where
n = estimated sample size.
∝= value of Z which provides α/2 in each tail of the normal curve. The quantity α specifies the
probability of declaring a difference to be statistically significant when no real difference exists in
the population and was taken to be 0.05.
p = was the predicted or anticipated prevalence rate of disability in Botswana
e = was the margin of error or allowable error to be tolerated (taken as 5 percentage points).
D = is the design effect. The design effect D is the ratio of the expected sampling variance of an
estimate from the sampling design used to the sampling variance of the very same estimate if simple
random sample design of the same size could have been used instead. It is a measure of how much
more unreliable the present survey is compared to a simple random sample.
g = percentage points necessary to raise the sample size to compensate for non-response.
Using the above formula, a sample size of 2480 households was required to produce reliable estimates. Based on the initial plan of sampling a maximum of 20 households, this would require a total of 124 enumeration areas to be sampled across Botswana. However, during the pilot research conducted in respect of this study, it was realised that 124 EAs would not be enough to achieve a sample of 2480 households. This was so because in all enumeration areas selected for pilot survey, enumerators found an average of five to six households that had people with disabilities. Mmatli, Kebotsamang & Lesetedi (2014) made a similar observation as they reported a disability prevalence rate of about three per cent (3%) from their analysis of the Botswana’s 2011 Housing and Population Census data. This implies that the pilot survey results were not abnormal. Consequently, a further 68 enumeration areas were sampled to augment the initially sampled EAs. Thus a total of 192 EAs were finally sampled.
Selecting Enumeration Areas [Kebotsamang & Mmatli]
As discussed in section 3.2, this survey study adopted a stratified two-stage sampling design with enumeration areas taken as primary sampling units. The EAs were stratified by locality and districts and each stratum was allocated a total number of sampling units proportional to its size. The size of measure of a stratum was the total number of households found in that stratum. The enumeration areas within each stratum were selected using PPS sampling technique as elaborated below:
PROJECT NO. 102001060
REPORT NO. SINTEF A27196
VERSION Version 24 of 106
1. Sampling interval of a stratum was calculated using the formula / ,
where is the total number of households within a specified stratum, and is the number of EAs
required in the stratum
2. Sampling number , was calculated for each stratum. was a random number between 0
and 100 and differed from one stratum to another.
3. The sampling number was compared to the size of cumulative household numbers in each
stratum.
4. The first EA selected was the one whose cumulative household count was greater or equal to the
sampling number .
5. The subsequent EAs were selected by adding the interval to the cumulative sampling numbers
until the required number of EAs was selected in each stratum.
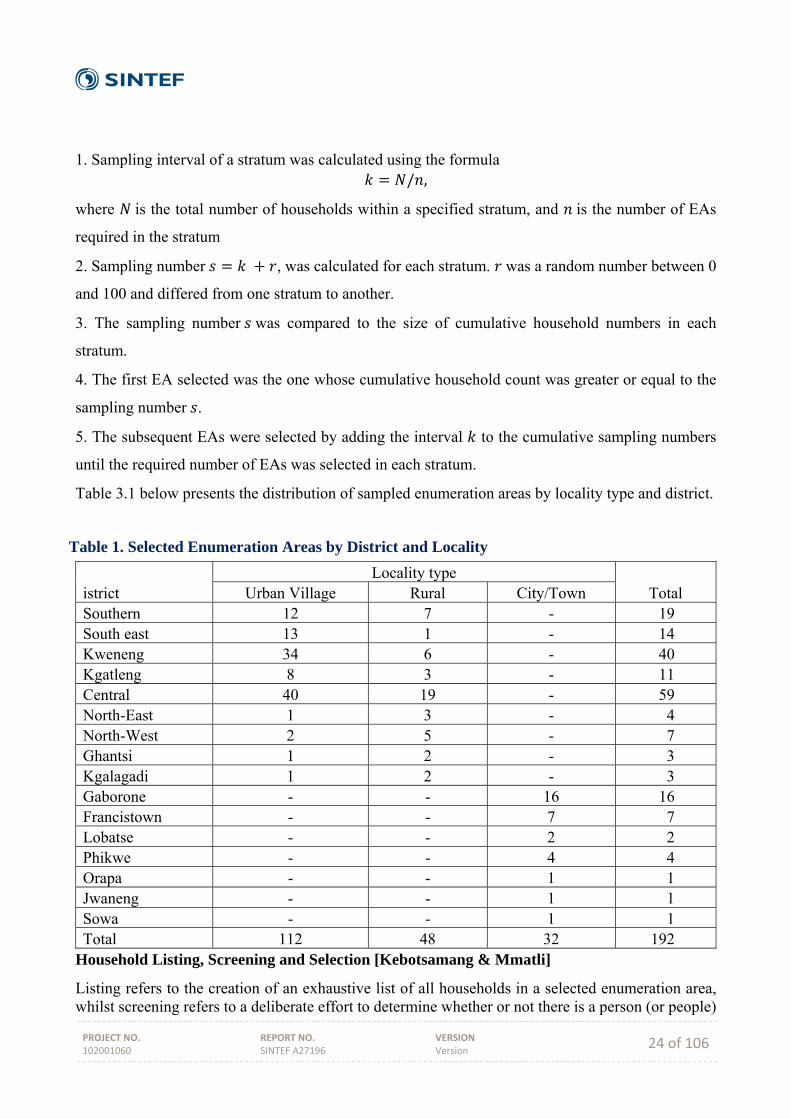
Table 3.1 below presents the distribution of sampled enumeration areas by locality type and district.
Household Listing, Screening and Selection [Kebotsamang & Mmatli]
Listing refers to the creation of an exhaustive list of all households in a selected enumeration area, whilst screening refers to a deliberate effort to determine whether or not there is a person (or people)
Table 1. Selected Enumeration Areas by District and Locality
istrict Locality type
Total Urban Village Rural City/Town Southern 12 7 - 19 South east 13 1 - 14 Kweneng 34 6 - 40 Kgatleng 8 3 - 11 Central 40 19 - 59 North-East 1 3 - 4 North-West 2 5 - 7 Ghantsi 1 2 - 3 Kgalagadi 1 2 - 3 Gaborone - - 16 16 Francistown - - 7 7 Lobatse - - 2 2 Phikwe - - 4 4 Orapa - - 1 1 Jwaneng - - 1 1 Sowa - - 1 1 Total 112 48 32 192
PROJECT NO. 102001060
REPORT NO. SINTEF A27196
VERSION Version 25 of 106
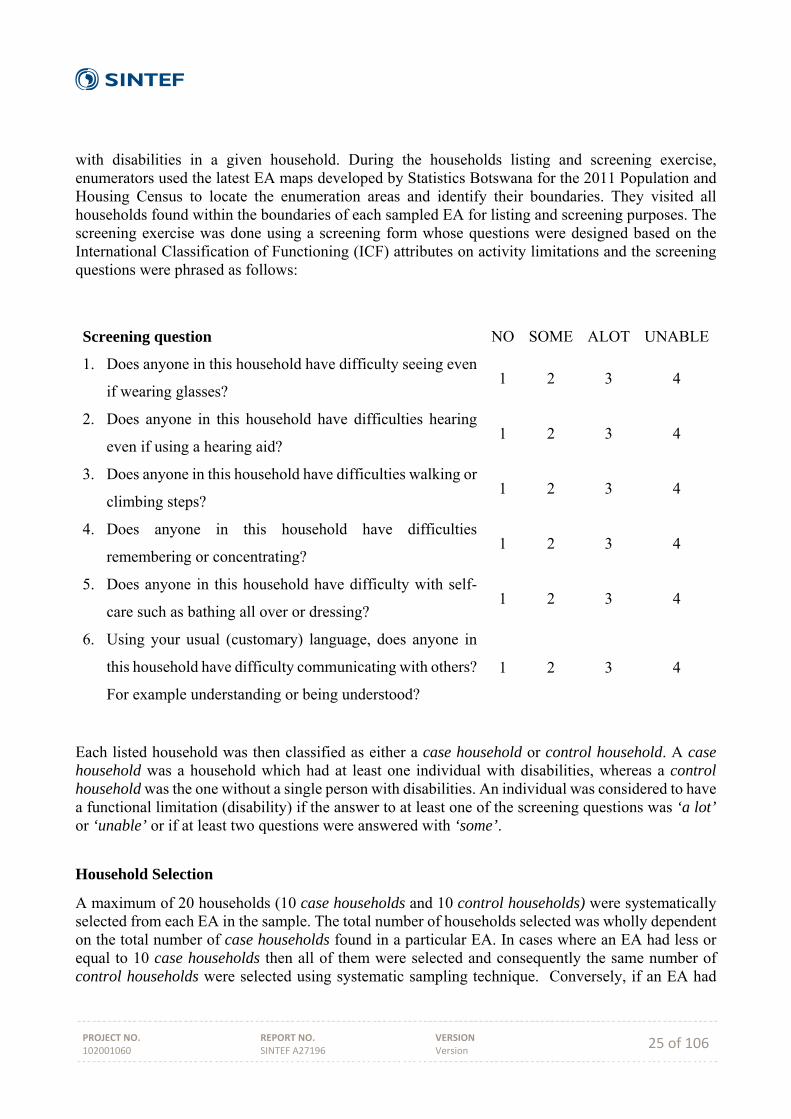
with disabilities in a given household. During the households listing and screening exercise, enumerators used the latest EA maps developed by Statistics Botswana for the 2011 Population and Housing Census to locate the enumeration areas and identify their boundaries. They visited all households found within the boundaries of each sampled EA for listing and screening purposes. The screening exercise was done using a screening form whose questions were designed based on the International Classification of Functioning (ICF) attributes on activity limitations and the screening questions were phrased as follows:
Each listed household was then classified as either a case household or control household. A case household was a household which had at least one individual with disabilities, whereas a control household was the one without a single person with disabilities. An individual was considered to have a functional limitation (disability) if the answer to at least one of the screening questions was ‘a lot’ or ‘unable’ or if at least two questions were answered with ‘some’.
Household Selection
A maximum of 20 households (10 case households and 10 control households) were systematically selected from each EA in the sample. The total number of households selected was wholly dependent on the total number of case households found in a particular EA. In cases where an EA had less or equal to 10 case households then all of them were selected and consequently the same number of control households were selected using systematic sampling technique. Conversely, if an EA had
Screening question NO SOME ALOT UNABLE
1. Does anyone in this household have difficulty seeing even
if wearing glasses? 1 2 3 4
2. Does anyone in this household have difficulties hearing
even if using a hearing aid? 1 2 3 4
3. Does anyone in this household have difficulties walking or
climbing steps? 1 2 3 4
4. Does anyone in this household have difficulties
remembering or concentrating? 1 2 3 4
5. Does anyone in this household have difficulty with self-
care such as bathing all over or dressing? 1 2 3 4
6. Using your usual (customary) language, does anyone in
this household have difficulty communicating with others?
For example understanding or being understood?
1 2 3 4
PROJECT NO. 102001060
REPORT NO. SINTEF A27196
VERSION Version 26 of 106
more than 10 case households then only 10 of these households were systematically selected. Consequently, ten (10) control households would also be sampled for matching purposes. Data Collection Tools [A.H. Eide & Mmatli] Data was collected by way of face‐face interviews using the following tools:
i) Household screening and listing form which was used to identify households with members with disabilities within a selected EA.
ii) Household questionnaire which was aimed at determining the living conditions of the selected households.
iii) Individual Case questionnaire. This was aimed at soliciting specific information on the living conditions of persons with disabilities. This questionnaire was administered to all members with disabilities within a household. The number of the individual questionnaires administered in each household depended on the number of members identified as having disabilities in that particular household.
iv) Control questionnaire which was aimed at determining the living conditions of people without disabilities. This was mainly to compare the living conditions of persons with disabilities to those of their non‐disabled counterparts.
The household questionnaire covers the following topics:
‐ Demographics ‐ Education and literacy ‐ Economic activity of household members aged 15 years or above ‐ Reproductive health of female household members aged 12‐49 years ‐ Income and expenditure ‐ Household assets and housing ‐ Transport and communication
The Individual Case questionnaire covers the following topics:
‐ Activity limitation and participation restriction ‐ Environmental factors ‐ Cause of impairment and discrimination experiences due to impairment ‐ Services needed and received ‐ Education and employment ‐ Accessibility in the home and surroundings ‐ Assistive devices ‐ Inclusion in family and social life ‐ Health and general wellbeing
The Control questionnaire covers the following topics:
PROJECT NO. 102001060
REPORT NO. SINTEF A27196
VERSION Version 27 of 106
‐ Activity limitation and participation restriction ‐ Environmental factors ‐ Services needed and received ‐ Education and employment ‐ Inclusion in family and social life ‐ Health and general wellbeing
The screening tool was the Washington Group on Disability Statistics 6 questions (Eide et. al. 2003; Eide, van Rooy & Loeb 2003; Loeb & Eide 2004; Eide & Loeb 2006; Eide & Kalameri 2009; Kamaleri & Eide 2010; Eide & Jele 20112). All other tools are adapted (to the context) versions of questionnaires previously used in several similar studies in the region (Madans et. al. 2004), combining validated tools from the literature on disability statistics as well as measures developed for these particular studies. Data Processing and Analysis Upon completion of data collection, all questionnaires were sorted according to their EA numbers and submitted for quality assurance assessment. The procedure entailed sampling 10% of each enumerator’s questionnaires and each enumerator allowed only up-to 5% of their sampled questionnaires spoiled. In instances where the number of spoiled questionnaires exceeded the threshold (5%), all questionnaires for that particular enumerator were submitted for quality assessment. Only three (3) out of thirty-five (35) enumerators had the spoiled questionnaires exceeding the 5% threshold. However, when all of their respective questionnaires were assessed, the numbers of spoiled questionnaires were less than the allowed threshold. Consequently, all the questionnaires that were deemed spoiled were excluded from the data, and the rest that were properly done were analysed. The statistical data analyses was carried out using mainly descriptive statistical methods using IBM SPSS and the summaries have been presented in the form of tables and charts. In addition, relationships between any two categorical variables were investigated using different tests for association, including Chi-square and F-test and independent samples t-test. Research Teams A total of 35 field personnel were recruited for executing data collection activities of the study within a period of ten (10) weeks. The principal investigators recruited eight supervisors and twenty-four (24) enumerators who were all nondisabled. The remaining three (3) enumerators were people with disabilities, and were recruited with the assistance of Botswana Federation of Disabled (BOFOD). It should be noted that BOFOD was afforded the opportunity to recruit more numbers of people with disabilities. However, most people with disabilities did not have the requisite qualifications. Most of the few that were identified as suitable for inclusion as enumerators were already engaged elsewhere. There were a total of 8 field-work teams and each comprised of 3 or 4 enumerators, one (1) field supervisor and a driver. The field supervisor’s role was to take a leading role in identifying the boundaries of selected enumeration areas, selection of case and control households, oversee the day‐
2 All reports available on: http://www.sintef.no/lc
PROJECT NO. 102001060
REPORT NO. SINTEF A27196
VERSION Version 28 of 106
to‐day data collection procedures while in the field and checking completed questionnaires for quality control purposes. The enumerators’ role was mainly the listing of households in the EAs utilizing the screening form and carrying out interviews with respondents in the selected households. A field coordinator was identified and tasked with the responsibility of overseeing and managing all aspects of the data collection process to ensure that all procedures necessary for the successful data collection exercise in the field were being adhered to and solve problems which the field teams could not handle on their own.
PROJECT NO. 102001060
REPORT NO. SINTEF A27196
VERSION Version 29 of 106
RESULTS (A. H. Eide, T. Mmatli & K G Hem)
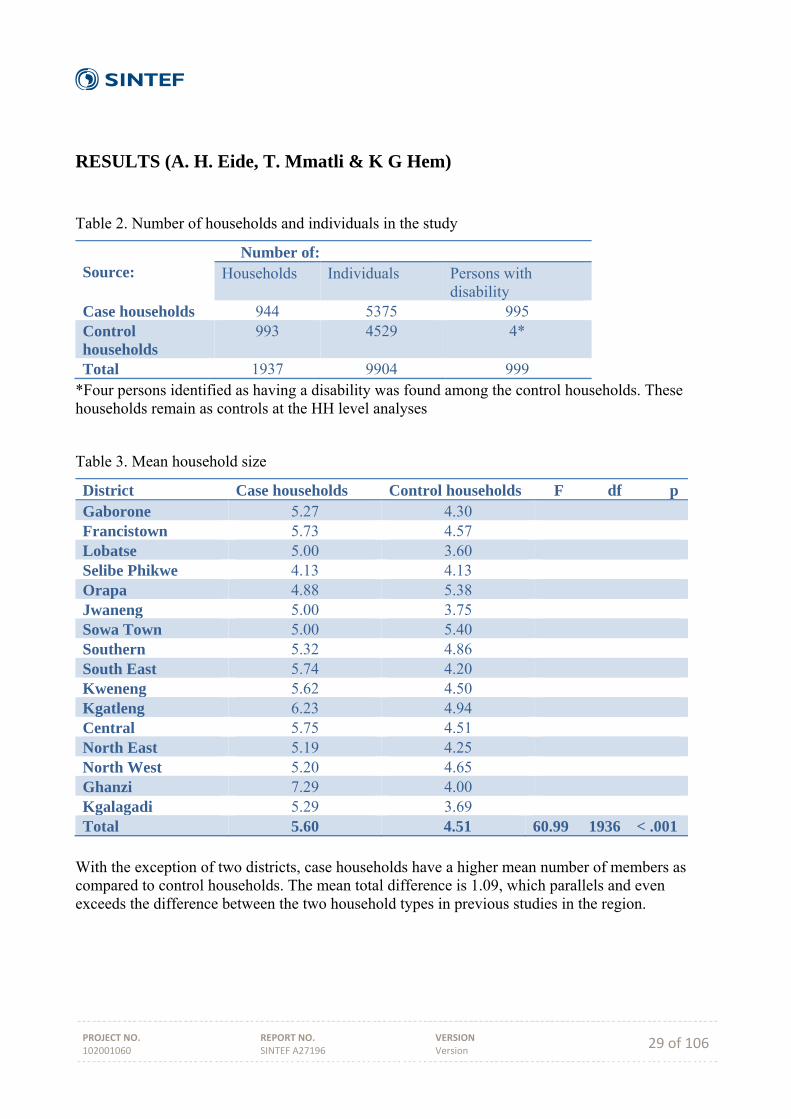
Table 2. Number of households and individuals in the study
Source:
Number of: Households Individuals Persons with
disability Case households 944 5375 995 Control households
993 4529 4*
Total 1937 9904 999 *Four persons identified as having a disability was found among the control households. These households remain as controls at the HH level analyses
Table 3. Mean household size
District Case households Control households F df pGaborone 5.27 4.30 Francistown 5.73 4.57 Lobatse 5.00 3.60 Selibe Phikwe 4.13 4.13 Orapa 4.88 5.38 Jwaneng 5.00 3.75 Sowa Town 5.00 5.40 Southern 5.32 4.86 South East 5.74 4.20 Kweneng 5.62 4.50 Kgatleng 6.23 4.94 Central 5.75 4.51 North East 5.19 4.25 North West 5.20 4.65 Ghanzi 7.29 4.00 Kgalagadi 5.29 3.69 Total 5.60 4.51 60.99 1936 < .001
With the exception of two districts, case households have a higher mean number of members as compared to control households. The mean total difference is 1.09, which parallels and even exceeds the difference between the two household types in previous studies in the region.
PROJECT NO. 102001060
REPORT NO. SINTEF A27196
VERSION Version 30 of 106
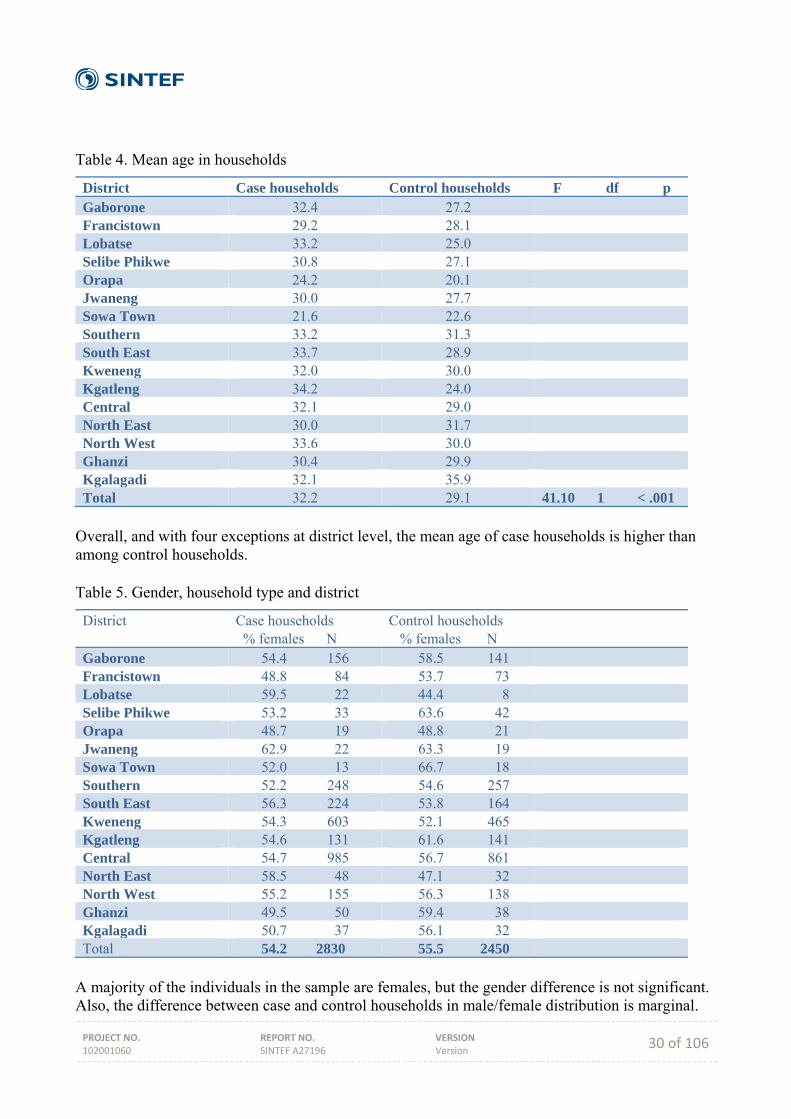
Table 4. Mean age in households
District Case households Control households F df pGaborone 32.4 27.2 Francistown 29.2 28.1 Lobatse 33.2 25.0 Selibe Phikwe 30.8 27.1 Orapa 24.2 20.1 Jwaneng 30.0 27.7 Sowa Town 21.6 22.6 Southern 33.2 31.3 South East 33.7 28.9 Kweneng 32.0 30.0 Kgatleng 34.2 24.0 Central 32.1 29.0 North East 30.0 31.7 North West 33.6 30.0 Ghanzi 30.4 29.9 Kgalagadi 32.1 35.9 Total 32.2 29.1 41.10 1 < .001
Overall, and with four exceptions at district level, the mean age of case households is higher than among control households. Table 5. Gender, household type and district
District Case households % females N
Control households % females N
Gaborone 54.4 156 58.5 141 Francistown 48.8 84 53.7 73 Lobatse 59.5 22 44.4 8 Selibe Phikwe 53.2 33 63.6 42 Orapa 48.7 19 48.8 21 Jwaneng 62.9 22 63.3 19 Sowa Town 52.0 13 66.7 18 Southern 52.2 248 54.6 257 South East 56.3 224 53.8 164 Kweneng 54.3 603 52.1 465 Kgatleng 54.6 131 61.6 141 Central 54.7 985 56.7 861 North East 58.5 48 47.1 32 North West 55.2 155 56.3 138 Ghanzi 49.5 50 59.4 38 Kgalagadi 50.7 37 56.1 32 Total 54.2 2830 55.5 2450
A majority of the individuals in the sample are females, but the gender difference is not significant. Also, the difference between case and control households in male/female distribution is marginal.
PROJECT NO. 102001060
REPORT NO. SINTEF A27196
VERSION Version 31 of 106
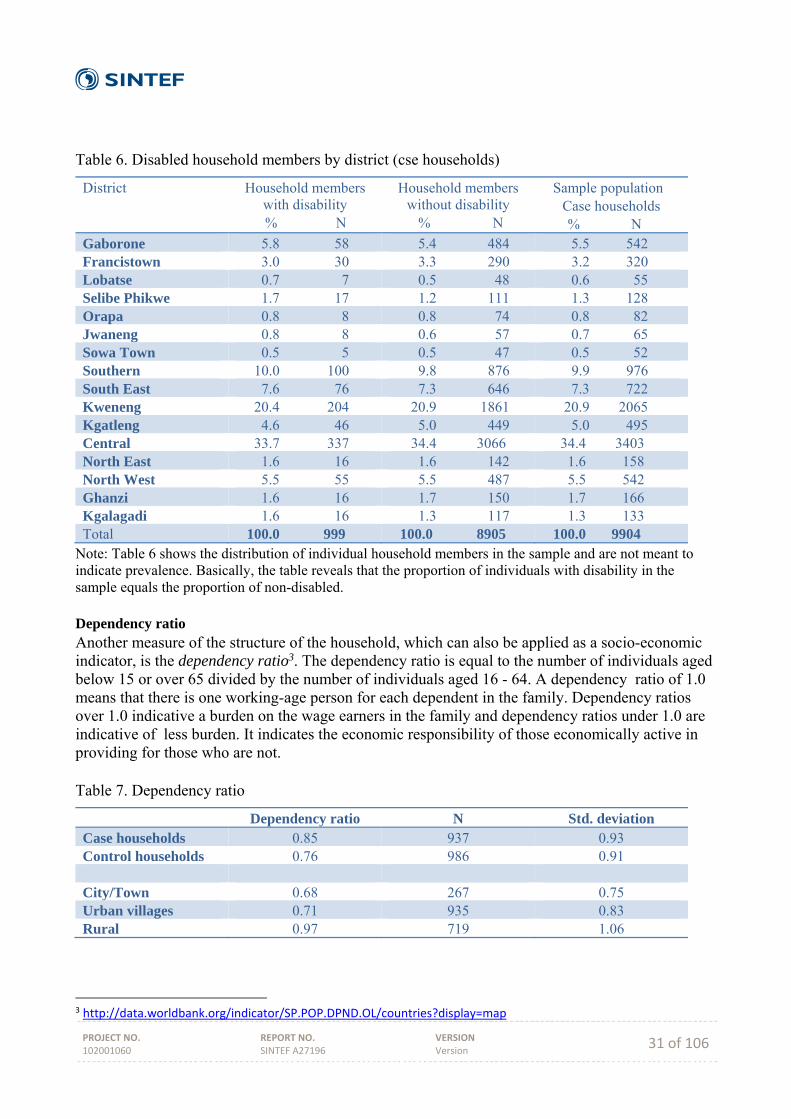
Table 6. Disabled household members by district (cse households)
District Household members with disability
% N
Household members without disability
% N
Sample population Case households
% N Gaborone 5.8 58 5.4 484 5.5 542 Francistown 3.0 30 3.3 290 3.2 320 Lobatse 0.7 7 0.5 48 0.6 55 Selibe Phikwe 1.7 17 1.2 111 1.3 128 Orapa 0.8 8 0.8 74 0.8 82 Jwaneng 0.8 8 0.6 57 0.7 65 Sowa Town 0.5 5 0.5 47 0.5 52 Southern 10.0 100 9.8 876 9.9 976 South East 7.6 76 7.3 646 7.3 722 Kweneng 20.4 204 20.9 1861 20.9 2065 Kgatleng 4.6 46 5.0 449 5.0 495 Central 33.7 337 34.4 3066 34.4 3403 North East 1.6 16 1.6 142 1.6 158 North West 5.5 55 5.5 487 5.5 542 Ghanzi 1.6 16 1.7 150 1.7 166 Kgalagadi 1.6 16 1.3 117 1.3 133 Total 100.0 999 100.0 8905 100.0 9904
Note: Table 6 shows the distribution of individual household members in the sample and are not meant to indicate prevalence. Basically, the table reveals that the proportion of individuals with disability in the sample equals the proportion of non-disabled. Dependency ratio Another measure of the structure of the household, which can also be applied as a socio-economic indicator, is the dependency ratio3. The dependency ratio is equal to the number of individuals aged below 15 or over 65 divided by the number of individuals aged 16 - 64. A dependency ratio of 1.0 means that there is one working-age person for each dependent in the family. Dependency ratios over 1.0 indicative a burden on the wage earners in the family and dependency ratios under 1.0 are indicative of less burden. It indicates the economic responsibility of those economically active in providing for those who are not. Table 7. Dependency ratio
Dependency ratio N Std. deviation Case households 0.85 937 0.93 Control households 0.76 986 0.91 City/Town 0.68 267 0.75 Urban villages 0.71 935 0.83 Rural 0.97 719 1.06
3 http://data.worldbank.org/indicator/SP.POP.DPND.OL/countries?display=map
PROJECT NO. 102001060
REPORT NO. SINTEF A27196
VERSION Version 32 of 106
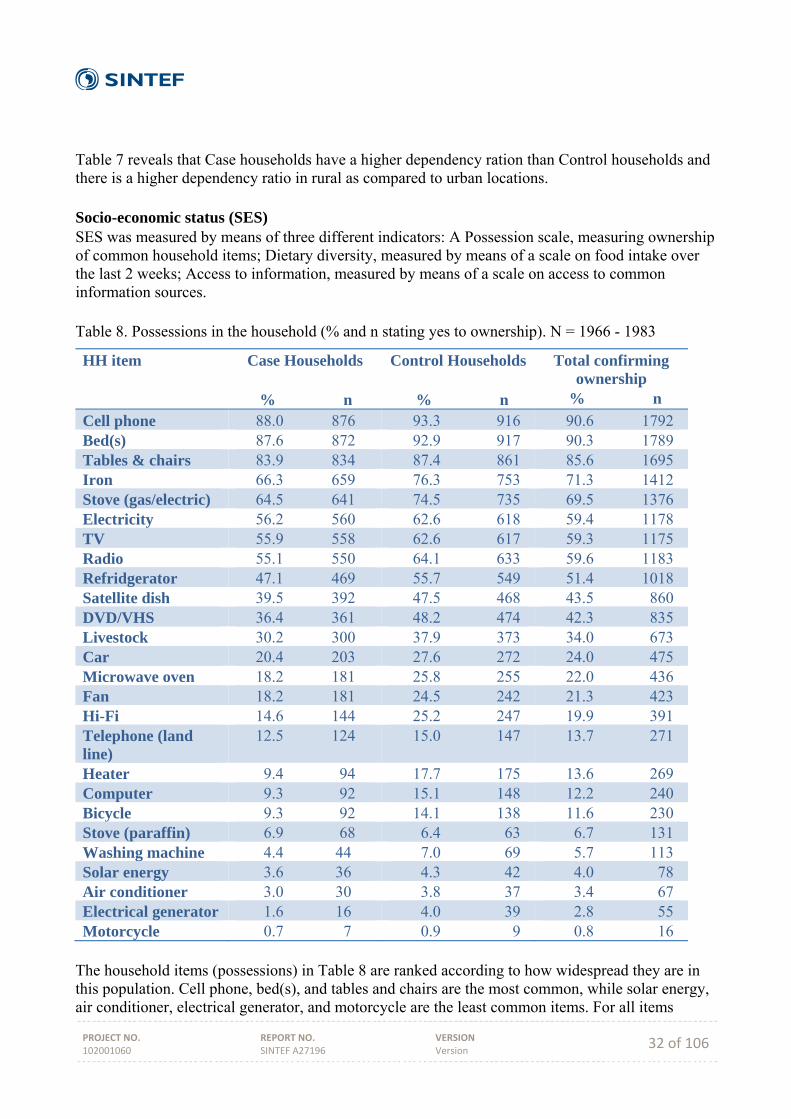
Table 7 reveals that Case households have a higher dependency ration than Control households and there is a higher dependency ratio in rural as compared to urban locations. Socio-economic status (SES) SES was measured by means of three different indicators: A Possession scale, measuring ownership of common household items; Dietary diversity, measured by means of a scale on food intake over the last 2 weeks; Access to information, measured by means of a scale on access to common information sources. Table 8. Possessions in the household (% and n stating yes to ownership). N = 1966 - 1983
HH item Case Households % n
Control Households
% n
Total confirming ownership
% n
Cell phone 88.0 876 93.3 916 90.6 1792 Bed(s) 87.6 872 92.9 917 90.3 1789 Tables & chairs 83.9 834 87.4 861 85.6 1695 Iron 66.3 659 76.3 753 71.3 1412 Stove (gas/electric) 64.5 641 74.5 735 69.5 1376 Electricity 56.2 560 62.6 618 59.4 1178 TV 55.9 558 62.6 617 59.3 1175 Radio 55.1 550 64.1 633 59.6 1183 Refridgerator 47.1 469 55.7 549 51.4 1018 Satellite dish 39.5 392 47.5 468 43.5 860 DVD/VHS 36.4 361 48.2 474 42.3 835 Livestock 30.2 300 37.9 373 34.0 673 Car 20.4 203 27.6 272 24.0 475 Microwave oven 18.2 181 25.8 255 22.0 436 Fan 18.2 181 24.5 242 21.3 423 Hi-Fi 14.6 144 25.2 247 19.9 391 Telephone (land line)
12.5 124 15.0 147 13.7 271
Heater 9.4 94 17.7 175 13.6 269 Computer 9.3 92 15.1 148 12.2 240 Bicycle 9.3 92 14.1 138 11.6 230 Stove (paraffin) 6.9 68 6.4 63 6.7 131 Washing machine 4.4 44 7.0 69 5.7 113 Solar energy 3.6 36 4.3 42 4.0 78 Air conditioner 3.0 30 3.8 37 3.4 67 Electrical generator 1.6 16 4.0 39 2.8 55 Motorcycle 0.7 7 0.9 9 0.8 16
The household items (possessions) in Table 8 are ranked according to how widespread they are in this population. Cell phone, bed(s), and tables and chairs are the most common, while solar energy, air conditioner, electrical generator, and motorcycle are the least common items. For all items
PROJECT NO. 102001060
REPORT NO. SINTEF A27196
VERSION Version 33 of 106
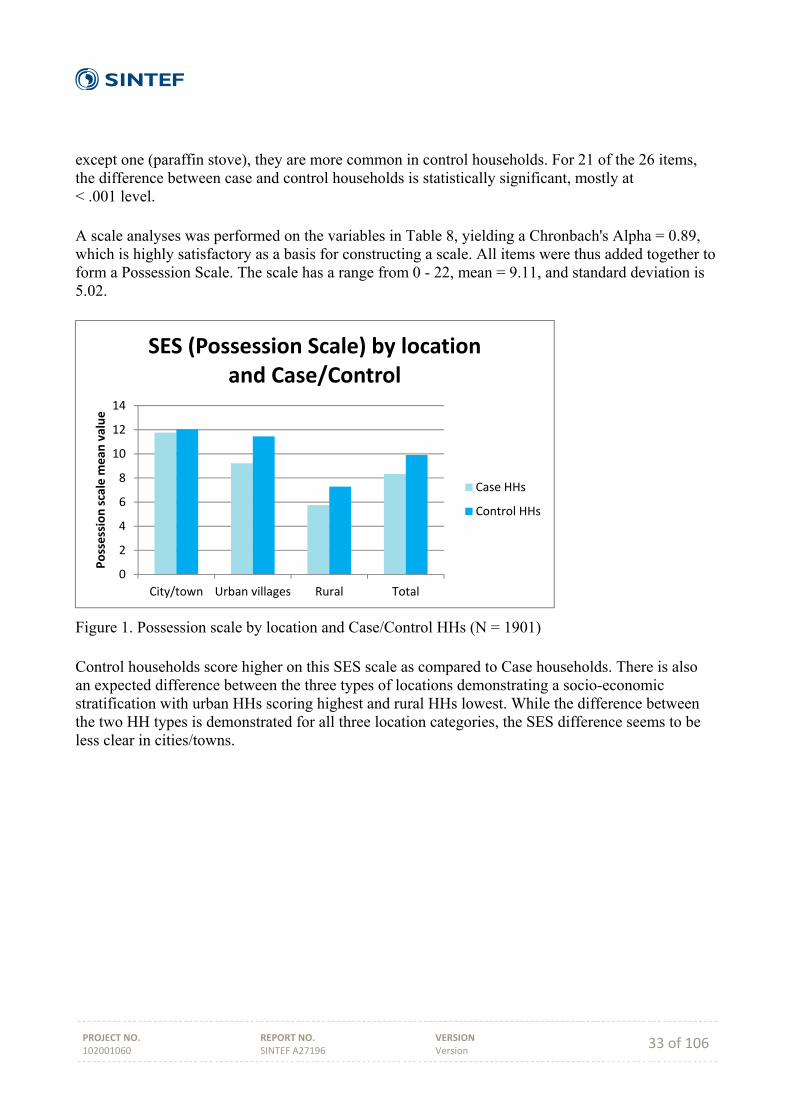
except one (paraffin stove), they are more common in control households. For 21 of the 26 items, the difference between case and control households is statistically significant, mostly at < .001 level. A scale analyses was performed on the variables in Table 8, yielding a Chronbach's Alpha = 0.89, which is highly satisfactory as a basis for constructing a scale. All items were thus added together to form a Possession Scale. The scale has a range from 0 - 22, mean = 9.11, and standard deviation is 5.02.
Figure 1. Possession scale by location and Case/Control HHs (N = 1901) Control households score higher on this SES scale as compared to Case households. There is also an expected difference between the three types of locations demonstrating a socio-economic stratification with urban HHs scoring highest and rural HHs lowest. While the difference between the two HH types is demonstrated for all three location categories, the SES difference seems to be less clear in cities/towns.
0
2
4
6
8
10
12
14
City/town Urban villages Rural Total
Possession scale m
ean
value
SES (Possession Scale) by location and Case/Control
Case HHs
Control HHs
PROJECT NO. 102001060
REPORT NO. SINTEF A27196
VERSION Version 34 of 106
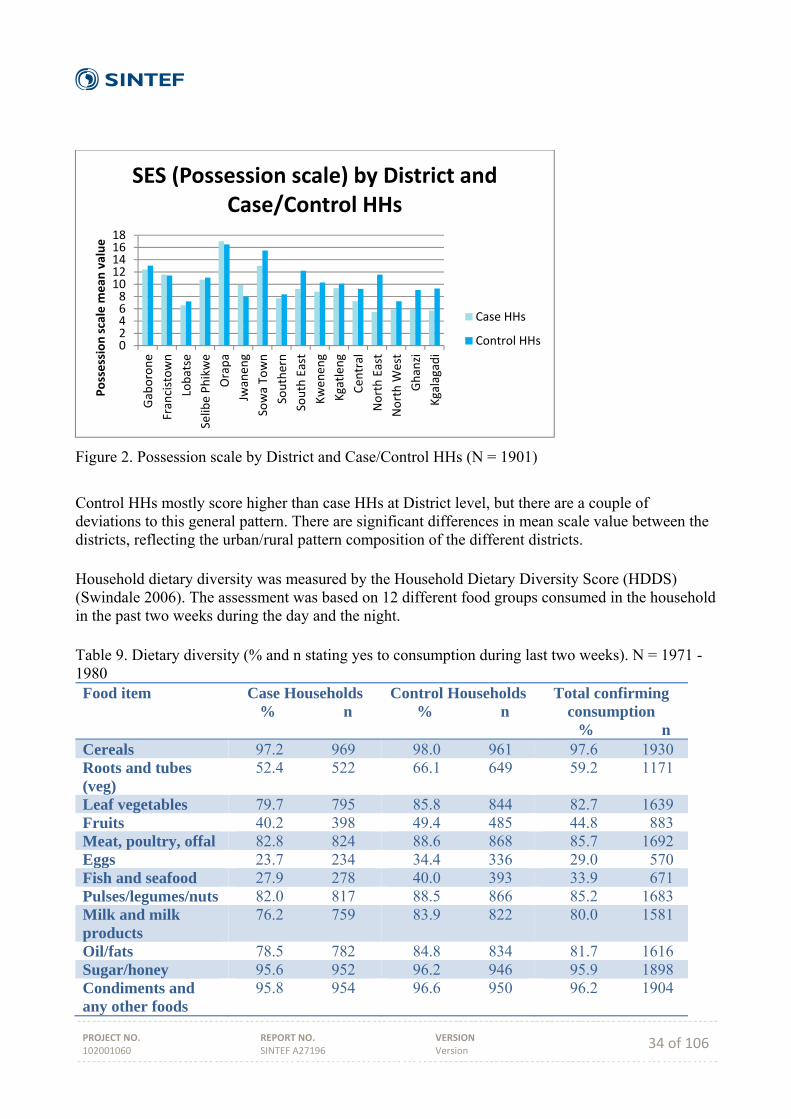
Figure 2. Possession scale by District and Case/Control HHs (N = 1901)
Control HHs mostly score higher than case HHs at District level, but there are a couple of deviations to this general pattern. There are significant differences in mean scale value between the districts, reflecting the urban/rural pattern composition of the different districts. Household dietary diversity was measured by the Household Dietary Diversity Score (HDDS) (Swindale 2006). The assessment was based on 12 different food groups consumed in the household in the past two weeks during the day and the night. Table 9. Dietary diversity (% and n stating yes to consumption during last two weeks). N = 1971 - 1980 Food item Case Households
% n Control Households % n
Total confirming consumption
% n Cereals 97.2 969 98.0 961 97.6 1930 Roots and tubes (veg)
52.4 522 66.1 649 59.2 1171
Leaf vegetables 79.7 795 85.8 844 82.7 1639 Fruits 40.2 398 49.4 485 44.8 883 Meat, poultry, offal 82.8 824 88.6 868 85.7 1692 Eggs 23.7 234 34.4 336 29.0 570 Fish and seafood 27.9 278 40.0 393 33.9 671 Pulses/legumes/nuts 82.0 817 88.5 866 85.2 1683 Milk and milk products
76.2 759 83.9 822 80.0 1581
Oil/fats 78.5 782 84.8 834 81.7 1616 Sugar/honey 95.6 952 96.2 946 95.9 1898 Condiments and any other foods
95.8 954 96.6 950 96.2 1904
024681012141618
Gaborone
Francistown
Lobatse
Selibe Phikwe
Orapa
Jwanen
g
Sowa Town
Southern
South East
Kwen
eng
Kgatlen
g
Cen
tral
North East
North W
est
Ghanzi
Kgalagadi
Possession scale m
ean
value
SES (Possession scale) by District and Case/Control HHs
Case HHs
Control HHs
PROJECT NO. 102001060
REPORT NO. SINTEF A27196
VERSION Version 35 of 106
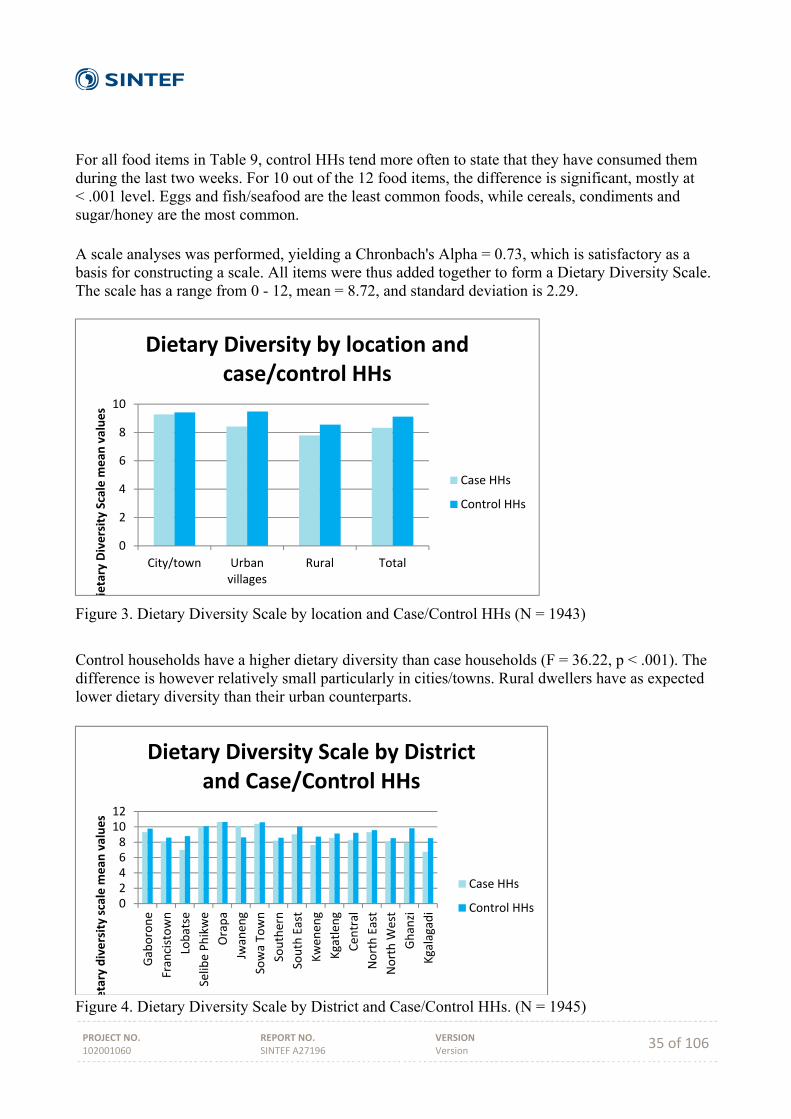
For all food items in Table 9, control HHs tend more often to state that they have consumed them during the last two weeks. For 10 out of the 12 food items, the difference is significant, mostly at < .001 level. Eggs and fish/seafood are the least common foods, while cereals, condiments and sugar/honey are the most common. A scale analyses was performed, yielding a Chronbach's Alpha = 0.73, which is satisfactory as a basis for constructing a scale. All items were thus added together to form a Dietary Diversity Scale. The scale has a range from 0 - 12, mean = 8.72, and standard deviation is 2.29.
Figure 3. Dietary Diversity Scale by location and Case/Control HHs (N = 1943)
Control households have a higher dietary diversity than case households (F = 36.22, p < .001). The difference is however relatively small particularly in cities/towns. Rural dwellers have as expected lower dietary diversity than their urban counterparts.
Figure 4. Dietary Diversity Scale by District and Case/Control HHs. (N = 1945)
0
2
4
6
8
10
City/town Urbanvillages
Rural Total
ietary Diversity Scale m
ean
values
Dietary Diversity by location and case/control HHs
Case HHs
Control HHs
024681012
Gaborone
Francistown
Lobatse
Selibe Phikwe
Orapa
Jwanen
g
Sowa Town
Southern
South East
Kwen
eng
Kgatlen
g
Cen
tral
North East
North W
est
Ghanzi
Kgalagadi
etary diversity scale m
ean
values
Dietary Diversity Scale by Districtand Case/Control HHs
Case HHs
Control HHs
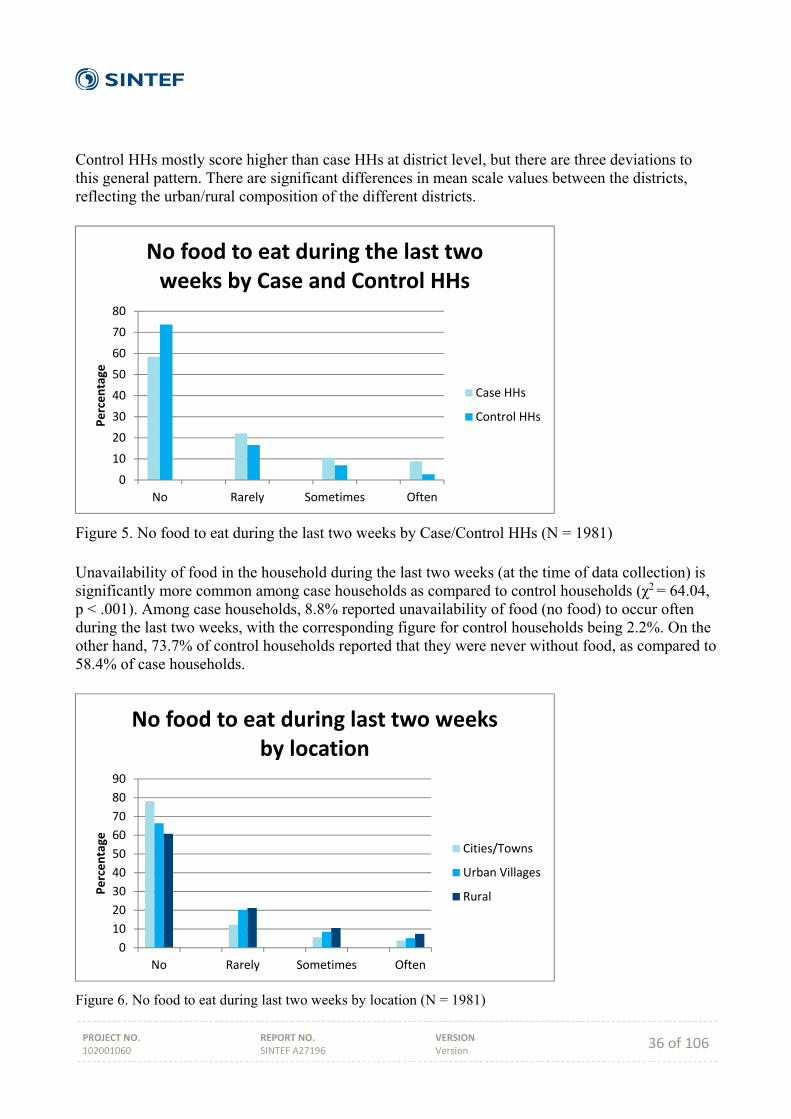
PROJECT NO. 102001060
REPORT NO. SINTEF A27196
VERSION Version 36 of 106
Control HHs mostly score higher than case HHs at district level, but there are three deviations to this general pattern. There are significant differences in mean scale values between the districts, reflecting the urban/rural composition of the different districts.
Figure 5. No food to eat during the last two weeks by Case/Control HHs (N = 1981) Unavailability of food in the household during the last two weeks (at the time of data collection) is significantly more common among case households as compared to control households (χ2 = 64.04, p < .001). Among case households, 8.8% reported unavailability of food (no food) to occur often during the last two weeks, with the corresponding figure for control households being 2.2%. On the other hand, 73.7% of control households reported that they were never without food, as compared to 58.4% of case households.
Figure 6. No food to eat during last two weeks by location (N = 1981)
0
10
20
30
40
50
60
70
80
No Rarely Sometimes Often
Percentage
No food to eat during the last two weeks by Case and Control HHs
Case HHs
Control HHs
0
10
20
30
40
50
60
70
80
90
No Rarely Sometimes Often
Percentage
No food to eat during last two weeks by location
Cities/Towns
Urban Villages
Rural
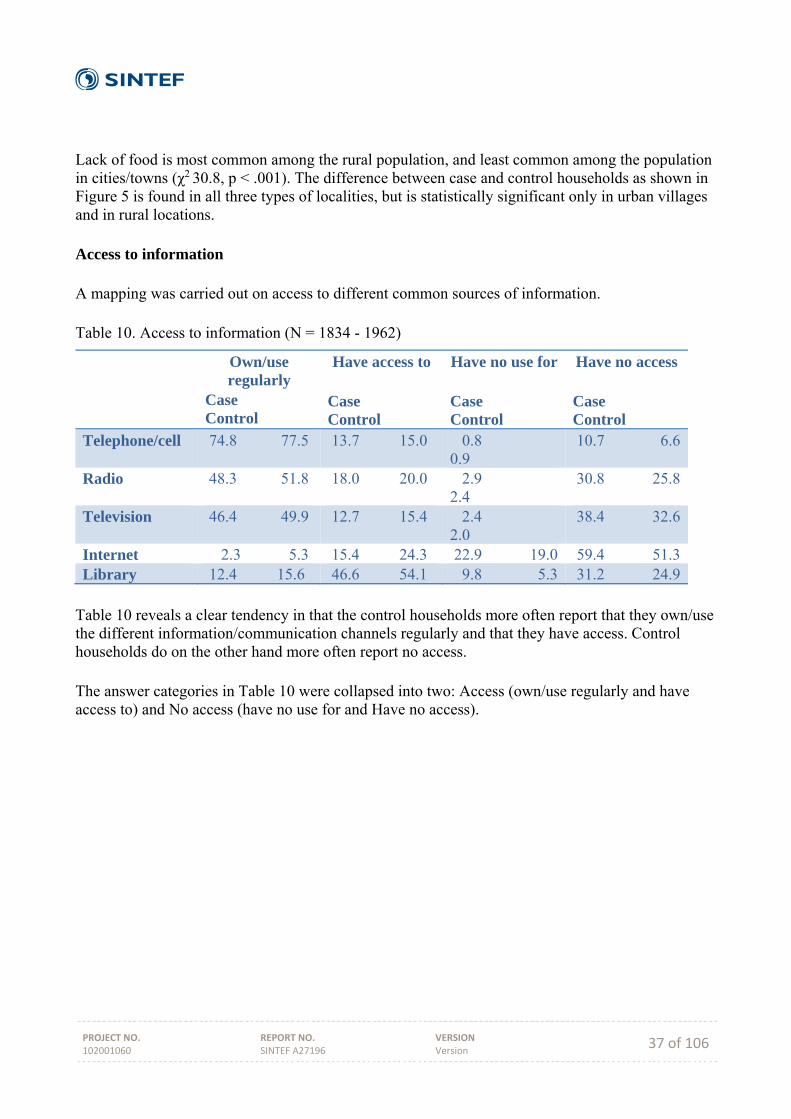
PROJECT NO. 102001060
REPORT NO. SINTEF A27196
VERSION Version 37 of 106
Lack of food is most common among the rural population, and least common among the population in cities/towns (χ2 30.8, p < .001). The difference between case and control households as shown in Figure 5 is found in all three types of localities, but is statistically significant only in urban villages and in rural locations. Access to information A mapping was carried out on access to different common sources of information. Table 10. Access to information (N = 1834 - 1962)
Own/use regularly
Case Control
Have access to Case Control
Have no use for Case Control
Have no access Case Control
Telephone/cell 74.8 77.5 13.7 15.0 0.8 0.9
10.7 6.6
Radio 48.3 51.8 18.0 20.0 2.9 2.4
30.8 25.8
Television 46.4 49.9 12.7 15.4 2.4 2.0
38.4 32.6
Internet 2.3 5.3 15.4 24.3 22.9 19.0 59.4 51.3Library 12.4 15.6 46.6 54.1 9.8 5.3 31.2 24.9
Table 10 reveals a clear tendency in that the control households more often report that they own/use the different information/communication channels regularly and that they have access. Control households do on the other hand more often report no access. The answer categories in Table 10 were collapsed into two: Access (own/use regularly and have access to) and No access (have no use for and Have no access).
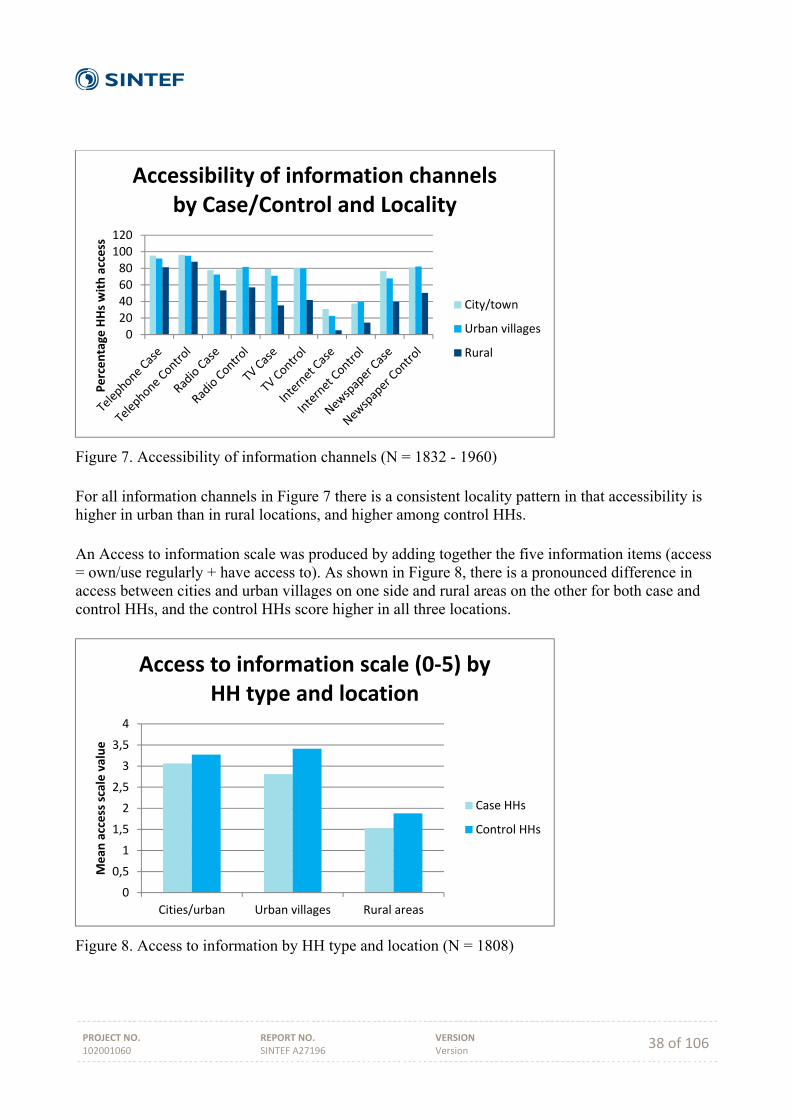
PROJECT NO. 102001060
REPORT NO. SINTEF A27196
VERSION Version 38 of 106
Figure 7. Accessibility of information channels (N = 1832 - 1960) For all information channels in Figure 7 there is a consistent locality pattern in that accessibility is higher in urban than in rural locations, and higher among control HHs. An Access to information scale was produced by adding together the five information items (access = own/use regularly + have access to). As shown in Figure 8, there is a pronounced difference in access between cities and urban villages on one side and rural areas on the other for both case and control HHs, and the control HHs score higher in all three locations.
Figure 8. Access to information by HH type and location (N = 1808)
020406080100120
Percentage
HHs with access
Accessibility of information channels by Case/Control and Locality
City/town
Urban villages
Rural
0
0,5
1
1,5
2
2,5
3
3,5
4
Cities/urban Urban villages Rural areas
Mean
access scale value
Access to information scale (0‐5) by HH type and location
Case HHs
Control HHs
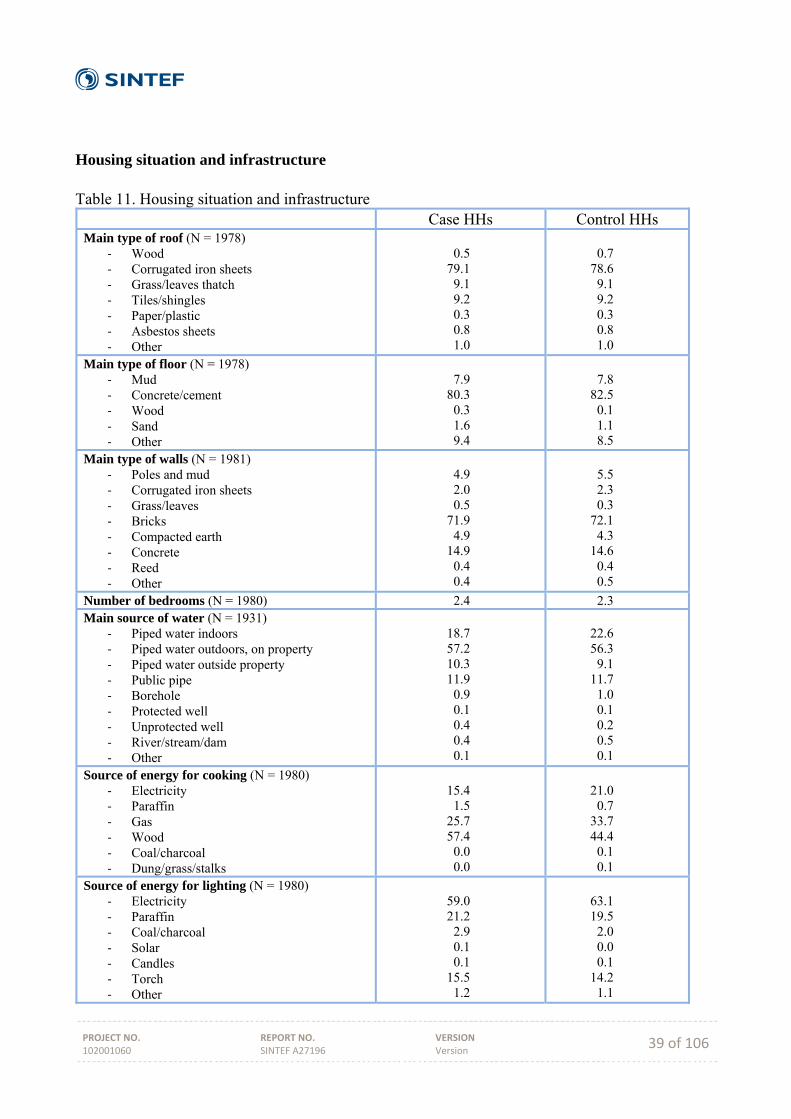
PROJECT NO. 102001060
REPORT NO. SINTEF A27196
VERSION Version 39 of 106
Housing situation and infrastructure Table 11. Housing situation and infrastructure
Case HHs Control HHs Main type of roof (N = 1978)
‐ Wood ‐ Corrugated iron sheets ‐ Grass/leaves thatch ‐ Tiles/shingles ‐ Paper/plastic ‐ Asbestos sheets ‐ Other
0.5 79.1 9.1 9.2 0.3 0.8 1.0
0.7 78.6 9.1 9.2 0.3 0.8 1.0
Main type of floor (N = 1978) ‐ Mud ‐ Concrete/cement ‐ Wood ‐ Sand ‐ Other
7.9 80.3 0.3 1.6 9.4
7.8 82.5 0.1 1.1 8.5
Main type of walls (N = 1981) ‐ Poles and mud ‐ Corrugated iron sheets ‐ Grass/leaves ‐ Bricks ‐ Compacted earth ‐ Concrete ‐ Reed ‐ Other
4.9 2.0 0.5 71.9 4.9 14.9 0.4 0.4
5.5 2.3 0.3 72.1 4.3 14.6 0.4 0.5
Number of bedrooms (N = 1980) 2.4 2.3 Main source of water (N = 1931)
‐ Piped water indoors ‐ Piped water outdoors, on property ‐ Piped water outside property ‐ Public pipe ‐ Borehole ‐ Protected well ‐ Unprotected well ‐ River/stream/dam ‐ Other
18.7 57.2 10.3 11.9 0.9 0.1 0.4 0.4 0.1
22.6 56.3 9.1 11.7 1.0 0.1 0.2 0.5 0.1
Source of energy for cooking (N = 1980) ‐ Electricity ‐ Paraffin ‐ Gas ‐ Wood ‐ Coal/charcoal ‐ Dung/grass/stalks
15.4 1.5 25.7 57.4 0.0 0.0
21.0 0.7 33.7 44.4 0.1 0.1
Source of energy for lighting (N = 1980) ‐ Electricity ‐ Paraffin ‐ Coal/charcoal ‐ Solar ‐ Candles ‐ Torch ‐ Other
59.0 21.2 2.9 0.1 0.1 15.5 1.2
63.1 19.5 2.0 0.0 0.1 14.2 1.1
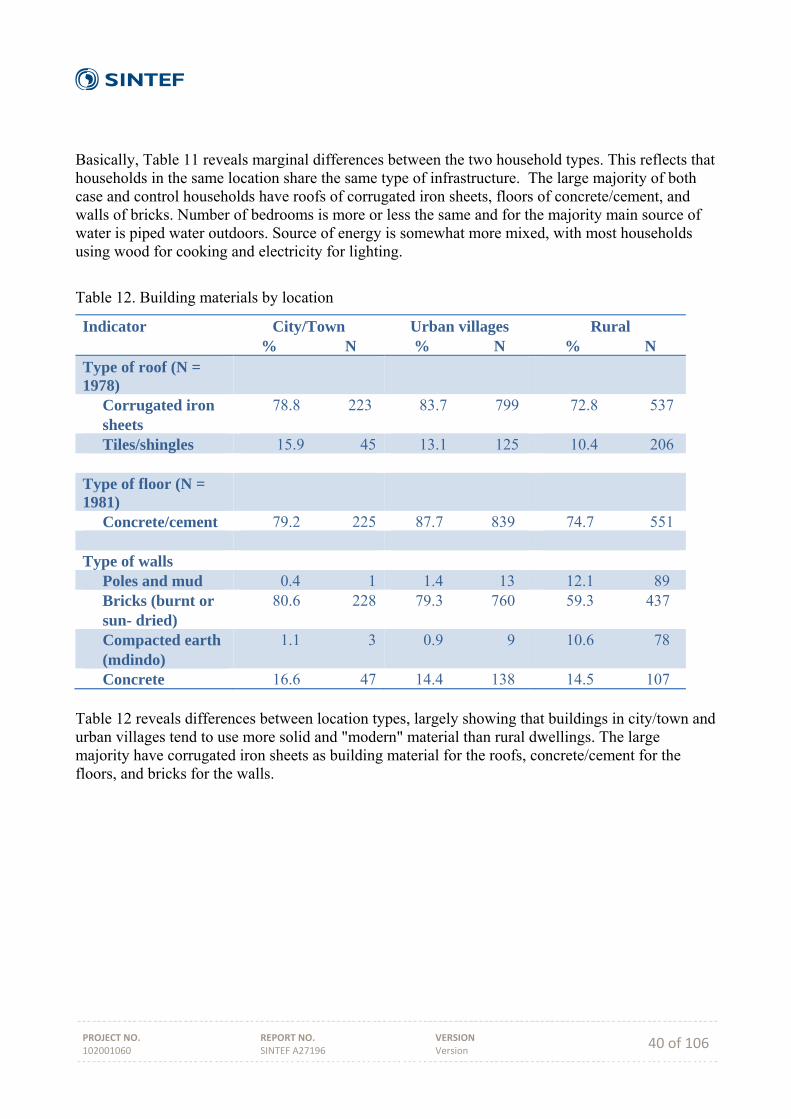
PROJECT NO. 102001060
REPORT NO. SINTEF A27196
VERSION Version 40 of 106
Basically, Table 11 reveals marginal differences between the two household types. This reflects that households in the same location share the same type of infrastructure. The large majority of both case and control households have roofs of corrugated iron sheets, floors of concrete/cement, and walls of bricks. Number of bedrooms is more or less the same and for the majority main source of water is piped water outdoors. Source of energy is somewhat more mixed, with most households using wood for cooking and electricity for lighting.
Table 12. Building materials by location
Indicator City/Town % N
Urban villages % N
Rural % N
Type of roof (N = 1978)
Corrugated iron sheets
78.8 223 83.7 799 72.8 537
Tiles/shingles 15.9 45 13.1 125 10.4 206 Type of floor (N = 1981)
Concrete/cement 79.2 225 87.7 839 74.7 551 Type of walls Poles and mud 0.4 1 1.4 13 12.1 89 Bricks (burnt or sun- dried)
80.6 228 79.3 760 59.3 437
Compacted earth (mdindo)
1.1 3 0.9 9 10.6 78
Concrete 16.6 47 14.4 138 14.5 107 Table 12 reveals differences between location types, largely showing that buildings in city/town and urban villages tend to use more solid and "modern" material than rural dwellings. The large majority have corrugated iron sheets as building material for the roofs, concrete/cement for the floors, and bricks for the walls.
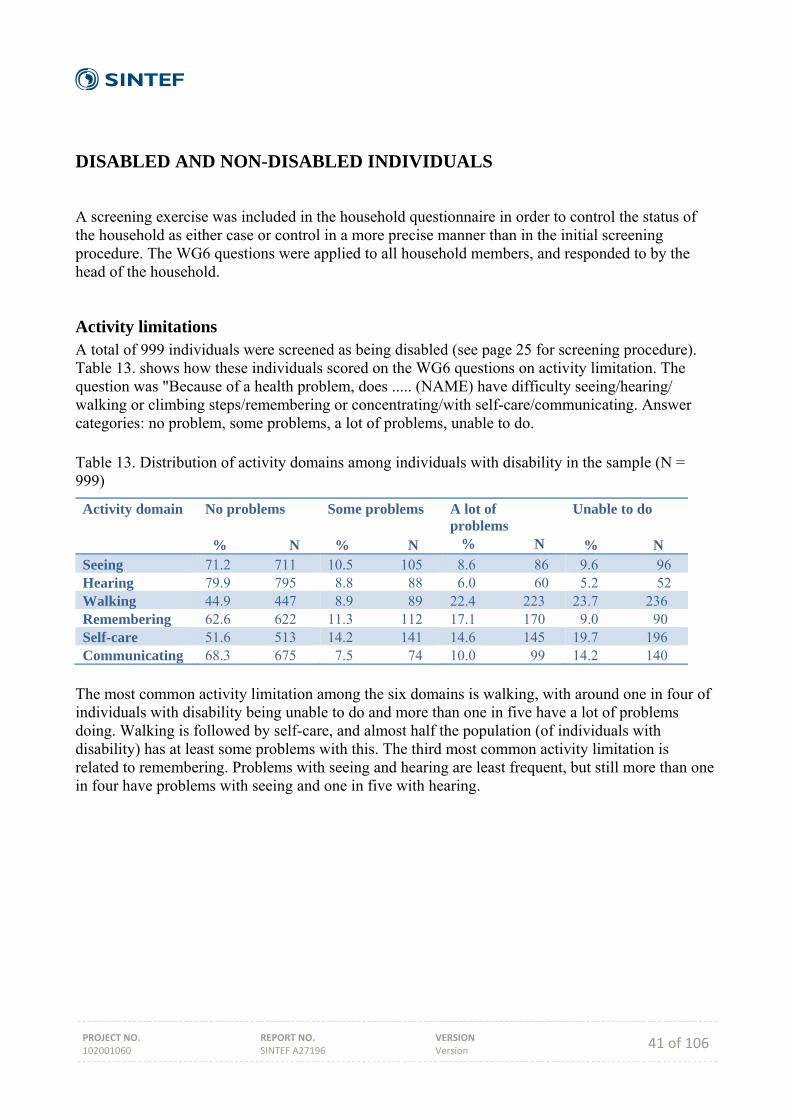
PROJECT NO. 102001060
REPORT NO. SINTEF A27196
VERSION Version 41 of 106
DISABLED AND NON-DISABLED INDIVIDUALS
A screening exercise was included in the household questionnaire in order to control the status of the household as either case or control in a more precise manner than in the initial screening procedure. The WG6 questions were applied to all household members, and responded to by the head of the household.
Activity limitations A total of 999 individuals were screened as being disabled (see page 25 for screening procedure). Table 13. shows how these individuals scored on the WG6 questions on activity limitation. The question was "Because of a health problem, does ..... (NAME) have difficulty seeing/hearing/ walking or climbing steps/remembering or concentrating/with self-care/communicating. Answer categories: no problem, some problems, a lot of problems, unable to do. Table 13. Distribution of activity domains among individuals with disability in the sample (N = 999)
Activity domain No problems % N
Some problems % N
A lot of problems % N
Unable to do % N
Seeing 71.2 711 10.5 105 8.6 86 9.6 96 Hearing 79.9 795 8.8 88 6.0 60 5.2 52 Walking 44.9 447 8.9 89 22.4 223 23.7 236 Remembering 62.6 622 11.3 112 17.1 170 9.0 90 Self-care 51.6 513 14.2 141 14.6 145 19.7 196 Communicating 68.3 675 7.5 74 10.0 99 14.2 140
The most common activity limitation among the six domains is walking, with around one in four of individuals with disability being unable to do and more than one in five have a lot of problems doing. Walking is followed by self-care, and almost half the population (of individuals with disability) has at least some problems with this. The third most common activity limitation is related to remembering. Problems with seeing and hearing are least frequent, but still more than one in four have problems with seeing and one in five with hearing.
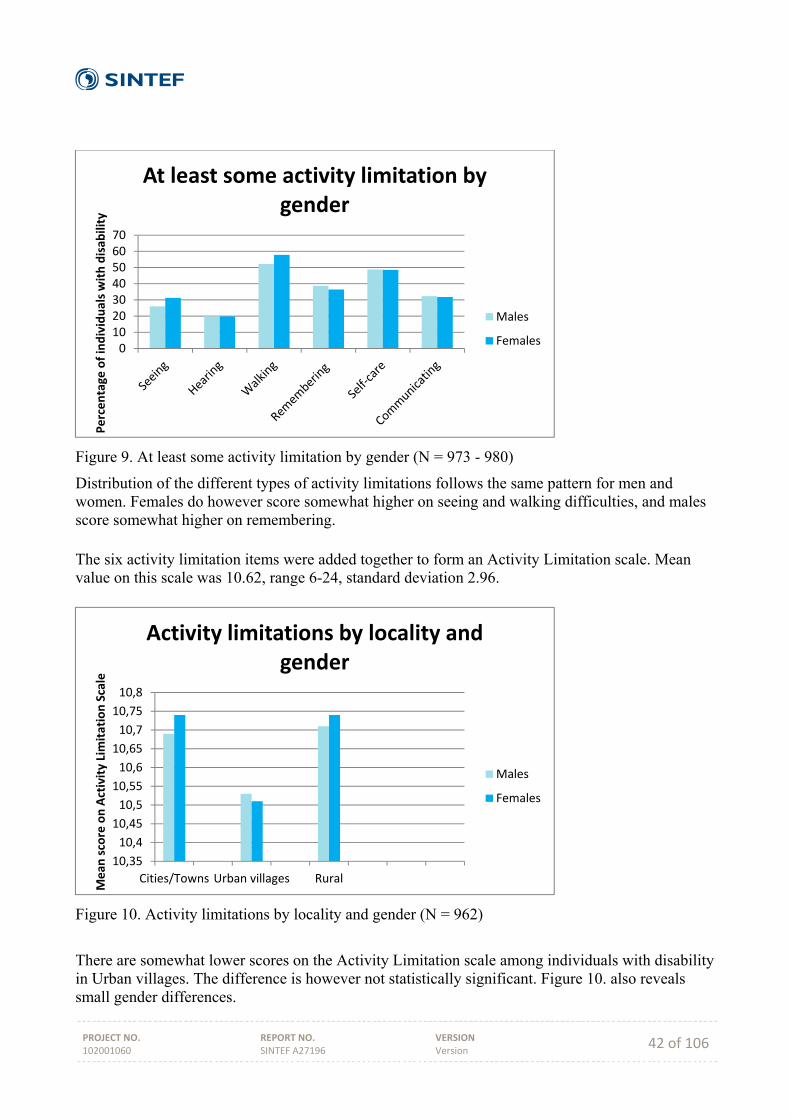
PROJECT NO. 102001060
REPORT NO. SINTEF A27196
VERSION Version 42 of 106
Figure 9. At least some activity limitation by gender (N = 973 - 980)
Distribution of the different types of activity limitations follows the same pattern for men and women. Females do however score somewhat higher on seeing and walking difficulties, and males score somewhat higher on remembering. The six activity limitation items were added together to form an Activity Limitation scale. Mean value on this scale was 10.62, range 6-24, standard deviation 2.96.
Figure 10. Activity limitations by locality and gender (N = 962)
There are somewhat lower scores on the Activity Limitation scale among individuals with disability in Urban villages. The difference is however not statistically significant. Figure 10. also reveals small gender differences.
010203040506070
Percentage
of individuals with disab
ility
At least some activity limitation by gender
Males
Females
10,35
10,4
10,45
10,5
10,55
10,6
10,65
10,7
10,75
10,8
Cities/Towns Urban villages Rural
Mean
score on Activity Limitation Scale
Activity limitations by locality and gender
Males
Females
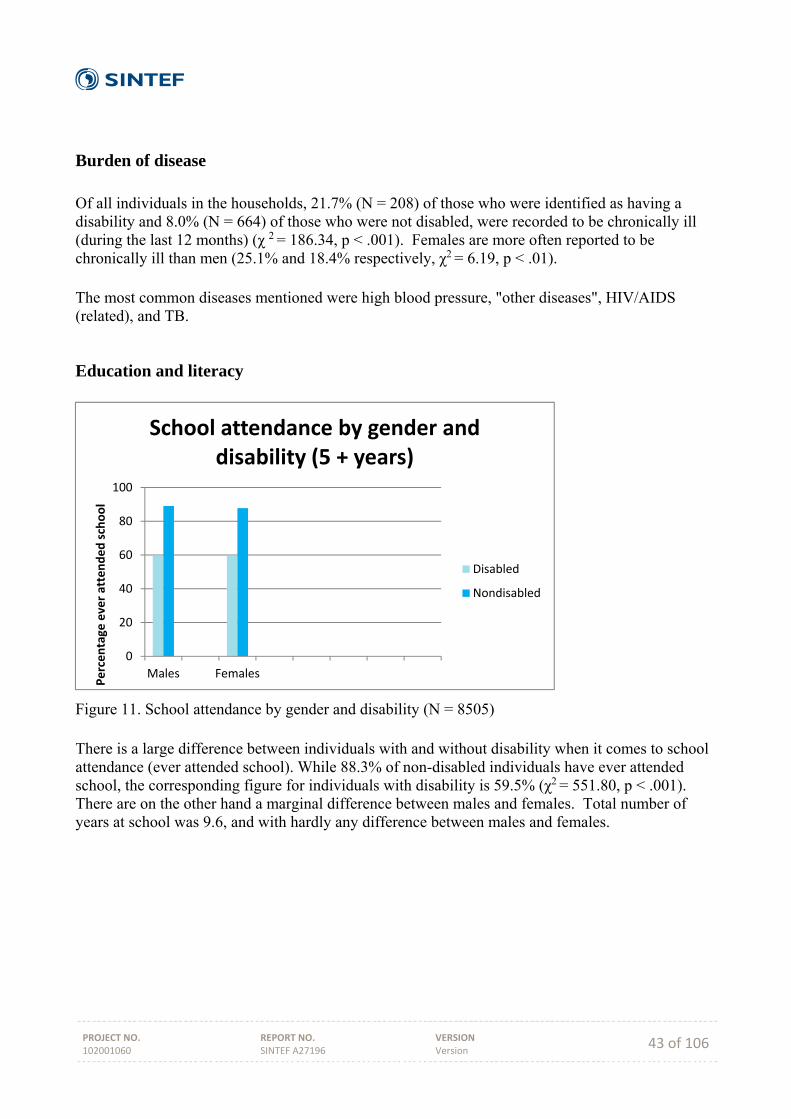
PROJECT NO. 102001060
REPORT NO. SINTEF A27196
VERSION Version 43 of 106
Burden of disease Of all individuals in the households, 21.7% (N = 208) of those who were identified as having a disability and 8.0% (N = 664) of those who were not disabled, were recorded to be chronically ill (during the last 12 months) (χ 2 = 186.34, p < .001). Females are more often reported to be chronically ill than men (25.1% and 18.4% respectively, χ2 = 6.19, p < .01). The most common diseases mentioned were high blood pressure, "other diseases", HIV/AIDS (related), and TB.
Education and literacy
Figure 11. School attendance by gender and disability (N = 8505) There is a large difference between individuals with and without disability when it comes to school attendance (ever attended school). While 88.3% of non-disabled individuals have ever attended school, the corresponding figure for individuals with disability is 59.5% (χ2 = 551.80, p < .001). There are on the other hand a marginal difference between males and females. Total number of years at school was 9.6, and with hardly any difference between males and females.
0
20
40
60
80
100
Males Females
Percentage
ever attended school
School attendance by gender and disability (5 + years)
Disabled
Nondisabled
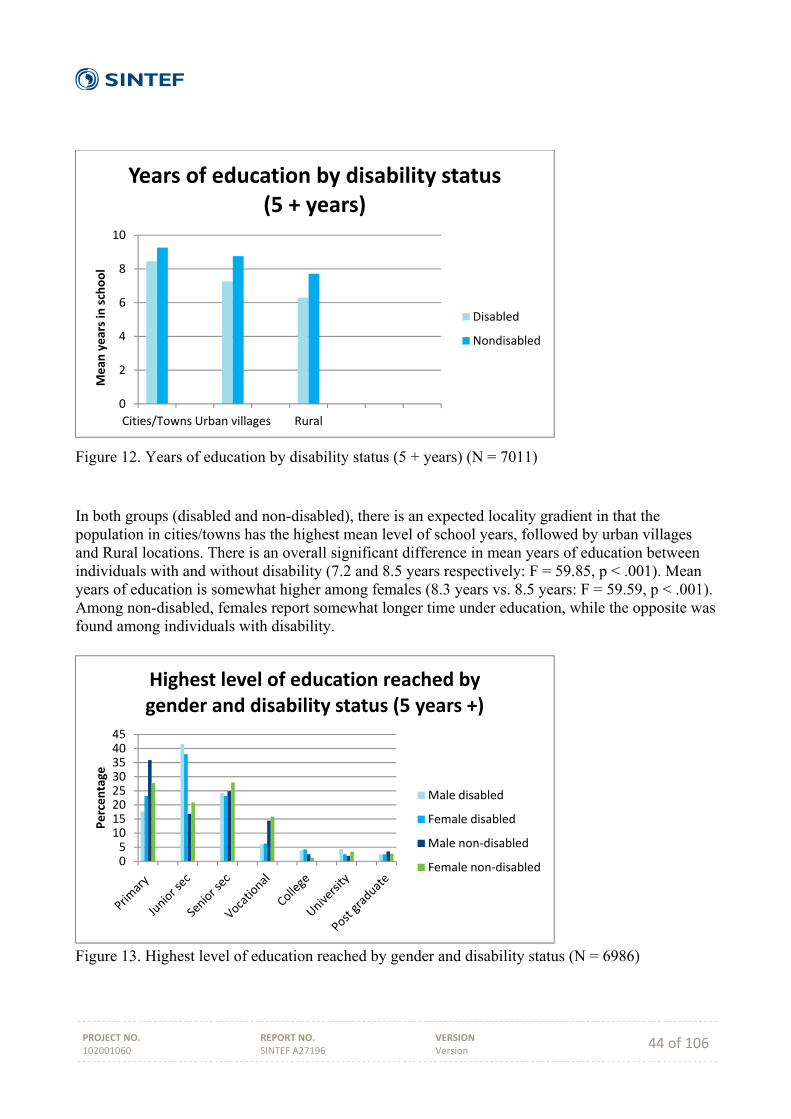
PROJECT NO. 102001060
REPORT NO. SINTEF A27196
VERSION Version 44 of 106
Figure 12. Years of education by disability status (5 + years) (N = 7011) In both groups (disabled and non-disabled), there is an expected locality gradient in that the population in cities/towns has the highest mean level of school years, followed by urban villages and Rural locations. There is an overall significant difference in mean years of education between individuals with and without disability (7.2 and 8.5 years respectively: F = 59.85, p < .001). Mean years of education is somewhat higher among females (8.3 years vs. 8.5 years: F = 59.59, p < .001). Among non-disabled, females report somewhat longer time under education, while the opposite was found among individuals with disability.
Figure 13. Highest level of education reached by gender and disability status (N = 6986)
0
2
4
6
8
10
Cities/Towns Urban villages Rural
Mean
years in school
Years of education by disability status (5 + years)
Disabled
Nondisabled
051015202530354045
Percentage
Highest level of education reached by gender and disability status (5 years +)
Male disabled
Female disabled
Male non‐disabled
Female non‐disabled
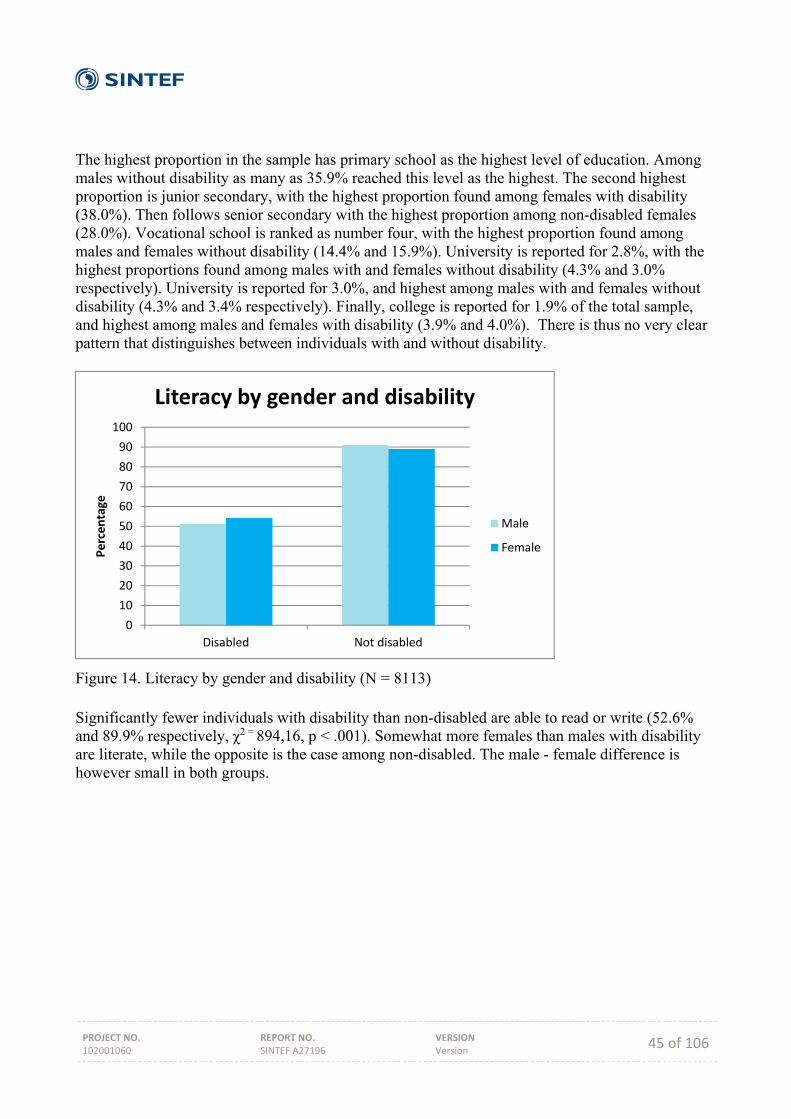
PROJECT NO. 102001060
REPORT NO. SINTEF A27196
VERSION Version 45 of 106
The highest proportion in the sample has primary school as the highest level of education. Among males without disability as many as 35.9% reached this level as the highest. The second highest proportion is junior secondary, with the highest proportion found among females with disability (38.0%). Then follows senior secondary with the highest proportion among non-disabled females (28.0%). Vocational school is ranked as number four, with the highest proportion found among males and females without disability (14.4% and 15.9%). University is reported for 2.8%, with the highest proportions found among males with and females without disability (4.3% and 3.0% respectively). University is reported for 3.0%, and highest among males with and females without disability (4.3% and 3.4% respectively). Finally, college is reported for 1.9% of the total sample, and highest among males and females with disability (3.9% and 4.0%). There is thus no very clear pattern that distinguishes between individuals with and without disability.
Figure 14. Literacy by gender and disability (N = 8113) Significantly fewer individuals with disability than non-disabled are able to read or write (52.6% and 89.9% respectively, χ2 = 894,16, p < .001). Somewhat more females than males with disability are literate, while the opposite is the case among non-disabled. The male - female difference is however small in both groups.
0
10
20
30
40
50
60
70
80
90
100
Disabled Not disabled
Percentage
Literacy by gender and disability
Male
Female
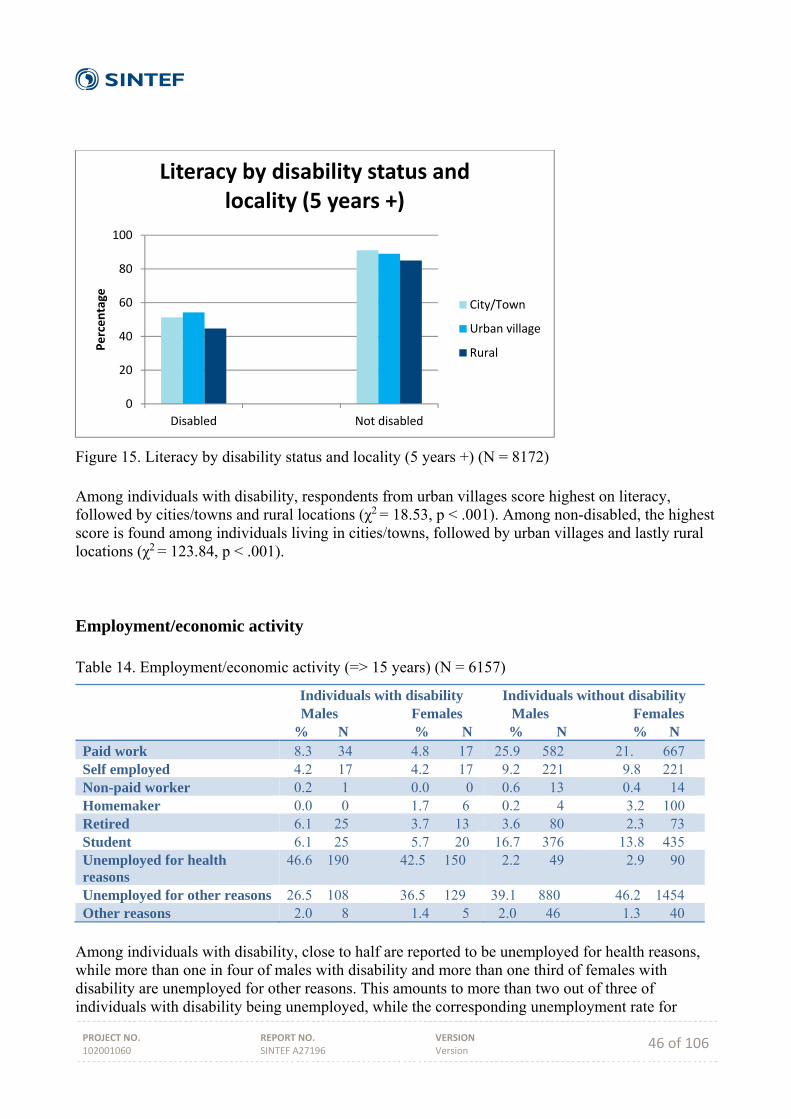
PROJECT NO. 102001060
REPORT NO. SINTEF A27196
VERSION Version 46 of 106
Figure 15. Literacy by disability status and locality (5 years +) (N = 8172) Among individuals with disability, respondents from urban villages score highest on literacy, followed by cities/towns and rural locations (χ2 = 18.53, p < .001). Among non-disabled, the highest score is found among individuals living in cities/towns, followed by urban villages and lastly rural locations (χ2 = 123.84, p < .001).
Employment/economic activity Table 14. Employment/economic activity (=> 15 years) (N = 6157)
Individuals with disability Males Females
% N % N
Individuals without disability Males Females % N % N
Paid work 8.3 34 4.8 17 25.9 582 21. 667 Self employed 4.2 17 4.2 17 9.2 221 9.8 221 Non-paid worker 0.2 1 0.0 0 0.6 13 0.4 14 Homemaker 0.0 0 1.7 6 0.2 4 3.2 100 Retired 6.1 25 3.7 13 3.6 80 2.3 73 Student 6.1 25 5.7 20 16.7 376 13.8 435 Unemployed for health reasons
46.6 190 42.5 150 2.2 49 2.9 90
Unemployed for other reasons 26.5 108 36.5 129 39.1 880 46.2 1454 Other reasons 2.0 8 1.4 5 2.0 46 1.3 40
Among individuals with disability, close to half are reported to be unemployed for health reasons, while more than one in four of males with disability and more than one third of females with disability are unemployed for other reasons. This amounts to more than two out of three of individuals with disability being unemployed, while the corresponding unemployment rate for
0
20
40
60
80
100
Disabled Not disabled
Percentage
Literacy by disability status and locality (5 years +)
City/Town
Urban village
Rural
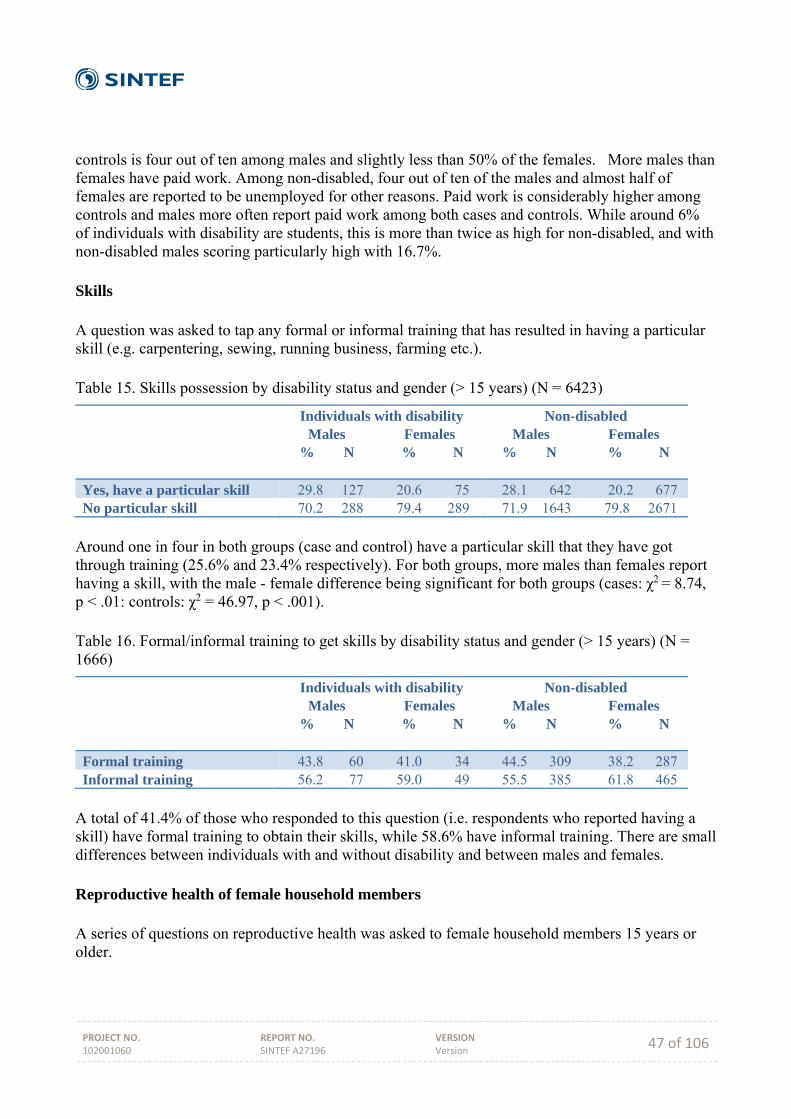
PROJECT NO. 102001060
REPORT NO. SINTEF A27196
VERSION Version 47 of 106
controls is four out of ten among males and slightly less than 50% of the females. More males than females have paid work. Among non-disabled, four out of ten of the males and almost half of females are reported to be unemployed for other reasons. Paid work is considerably higher among controls and males more often report paid work among both cases and controls. While around 6% of individuals with disability are students, this is more than twice as high for non-disabled, and with non-disabled males scoring particularly high with 16.7%. Skills A question was asked to tap any formal or informal training that has resulted in having a particular skill (e.g. carpentering, sewing, running business, farming etc.). Table 15. Skills possession by disability status and gender (> 15 years) (N = 6423)
Individuals with disability Males Females
% N % N
Non-disabled Males Females
% N % N
Yes, have a particular skill 29.8 127 20.6 75 28.1 642 20.2 677 No particular skill 70.2 288 79.4 289 71.9 1643 79.8 2671
Around one in four in both groups (case and control) have a particular skill that they have got through training (25.6% and 23.4% respectively). For both groups, more males than females report having a skill, with the male - female difference being significant for both groups (cases: χ2 = 8.74, p < .01: controls: χ2 = 46.97, p < .001). Table 16. Formal/informal training to get skills by disability status and gender (> 15 years) (N = 1666)
Individuals with disability Males Females
% N % N
Non-disabled Males Females
% N % N
Formal training 43.8 60 41.0 34 44.5 309 38.2 287 Informal training 56.2 77 59.0 49 55.5 385 61.8 465
A total of 41.4% of those who responded to this question (i.e. respondents who reported having a skill) have formal training to obtain their skills, while 58.6% have informal training. There are small differences between individuals with and without disability and between males and females. Reproductive health of female household members A series of questions on reproductive health was asked to female household members 15 years or older.
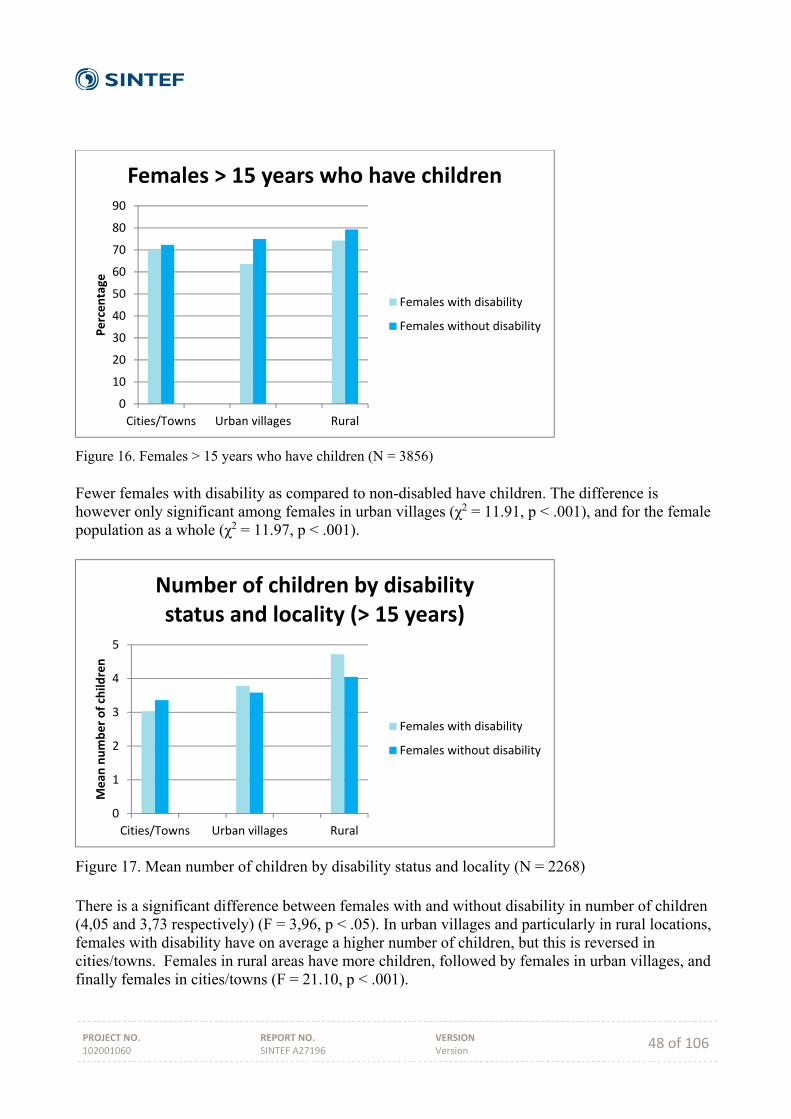
PROJECT NO. 102001060
REPORT NO. SINTEF A27196
VERSION Version 48 of 106
Figure 16. Females > 15 years who have children (N = 3856) Fewer females with disability as compared to non-disabled have children. The difference is however only significant among females in urban villages (χ2 = 11.91, p < .001), and for the female population as a whole (χ2 = 11.97, p < .001).
Figure 17. Mean number of children by disability status and locality (N = 2268) There is a significant difference between females with and without disability in number of children (4,05 and 3,73 respectively) (F = 3,96, p < .05). In urban villages and particularly in rural locations, females with disability have on average a higher number of children, but this is reversed in cities/towns. Females in rural areas have more children, followed by females in urban villages, and finally females in cities/towns (F = 21.10, p < .001).
0
10
20
30
40
50
60
70
80
90
Cities/Towns Urban villages Rural
Percentage
Females > 15 years who have children
Females with disability
Females without disability
0
1
2
3
4
5
Cities/Towns Urban villages Rural
Mean
number of child
ren
Number of children by disability status and locality (> 15 years)
Females with disability
Females without disability
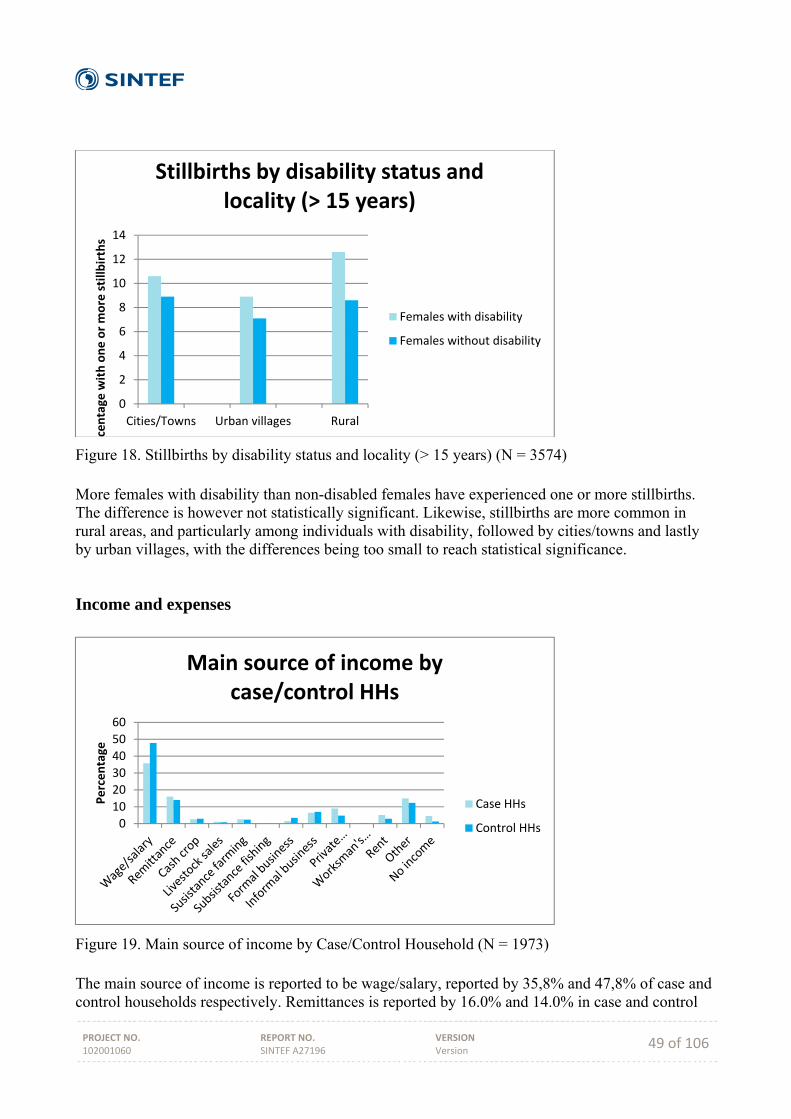
PROJECT NO. 102001060
REPORT NO. SINTEF A27196
VERSION Version 49 of 106
Figure 18. Stillbirths by disability status and locality (> 15 years) (N = 3574) More females with disability than non-disabled females have experienced one or more stillbirths. The difference is however not statistically significant. Likewise, stillbirths are more common in rural areas, and particularly among individuals with disability, followed by cities/towns and lastly by urban villages, with the differences being too small to reach statistical significance.
Income and expenses
Figure 19. Main source of income by Case/Control Household (N = 1973) The main source of income is reported to be wage/salary, reported by 35,8% and 47,8% of case and control households respectively. Remittances is reported by 16.0% and 14.0% in case and control
0
2
4
6
8
10
12
14
Cities/Towns Urban villages Rural
rcentage
with one or more stillb
irths
Stillbirths by disability status and locality (> 15 years)
Females with disability
Females without disability
0
10
20
30
40
50
60
Percentage
Main source of income by case/control HHs
Case HHs
Control HHs

PROJECT NO. 102001060
REPORT NO. SINTEF A27196
VERSION Version 50 of 106
HHs, private insurance by 9.0% and 4.8%, and rent by 5.1% and 2.9% respectively. The figure demonstrates that Control households more often have income from formal employment, while case HHs rely more on cash transfer from Government. Other smaller differences are found in that case households more often report remittance and private insurance as main source of income, while control households more often report informal business. Finally, case households more often report no income whatsoever.
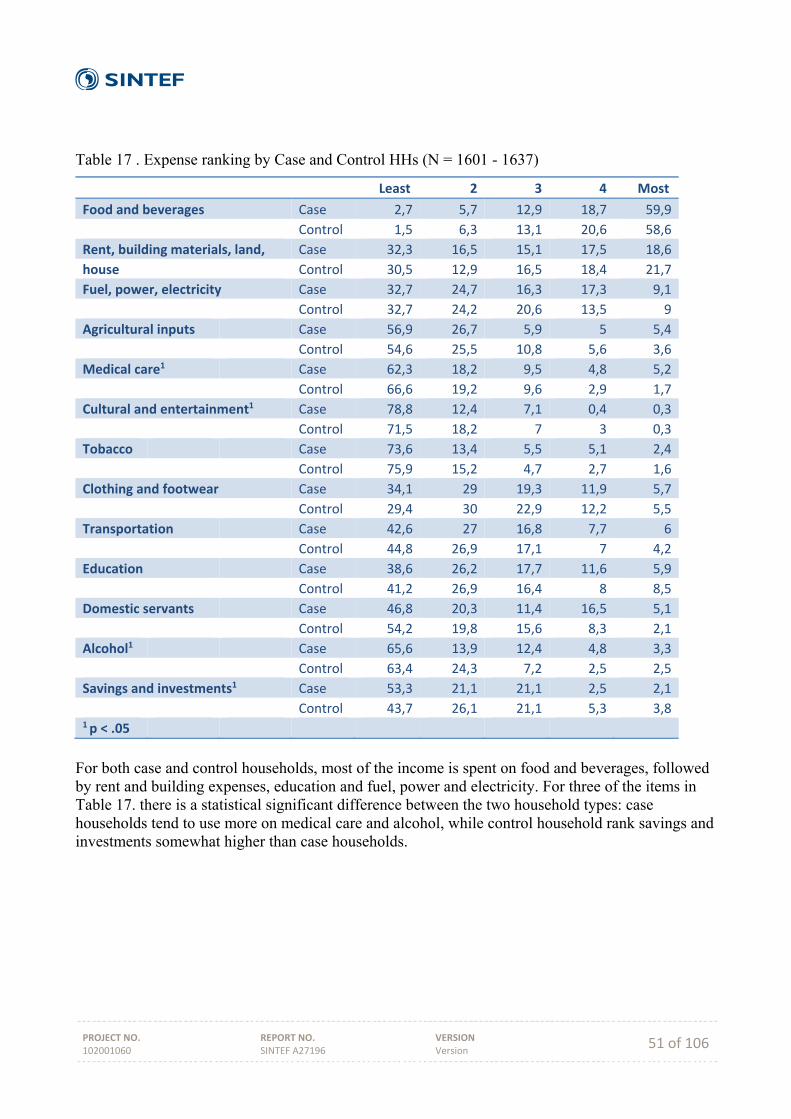
PROJECT NO. 102001060
REPORT NO. SINTEF A27196
VERSION Version 51 of 106
Table 17 . Expense ranking by Case and Control HHs (N = 1601 - 1637)
Least 2 3 4 Most
Food and beverages Case 2,7 5,7 12,9 18,7 59,9
Control 1,5 6,3 13,1 20,6 58,6
Rent, building materials, land, Case 32,3 16,5 15,1 17,5 18,6
house Control 30,5 12,9 16,5 18,4 21,7
Fuel, power, electricity Case 32,7 24,7 16,3 17,3 9,1
Control 32,7 24,2 20,6 13,5 9
Agricultural inputs Case 56,9 26,7 5,9 5 5,4
Control 54,6 25,5 10,8 5,6 3,6
Medical care1 Case 62,3 18,2 9,5 4,8 5,2
Control 66,6 19,2 9,6 2,9 1,7
Cultural and entertainment1 Case 78,8 12,4 7,1 0,4 0,3
Control 71,5 18,2 7 3 0,3
Tobacco Case 73,6 13,4 5,5 5,1 2,4
Control 75,9 15,2 4,7 2,7 1,6
Clothing and footwear Case 34,1 29 19,3 11,9 5,7
Control 29,4 30 22,9 12,2 5,5
Transportation Case 42,6 27 16,8 7,7 6
Control 44,8 26,9 17,1 7 4,2
Education Case 38,6 26,2 17,7 11,6 5,9
Control 41,2 26,9 16,4 8 8,5
Domestic servants Case 46,8 20,3 11,4 16,5 5,1
Control 54,2 19,8 15,6 8,3 2,1
Alcohol1 Case 65,6 13,9 12,4 4,8 3,3
Control 63,4 24,3 7,2 2,5 2,5
Savings and investments1 Case 53,3 21,1 21,1 2,5 2,1
Control 43,7 26,1 21,1 5,3 3,81 p < .05
For both case and control households, most of the income is spent on food and beverages, followed by rent and building expenses, education and fuel, power and electricity. For three of the items in Table 17. there is a statistical significant difference between the two household types: case households tend to use more on medical care and alcohol, while control household rank savings and investments somewhat higher than case households.
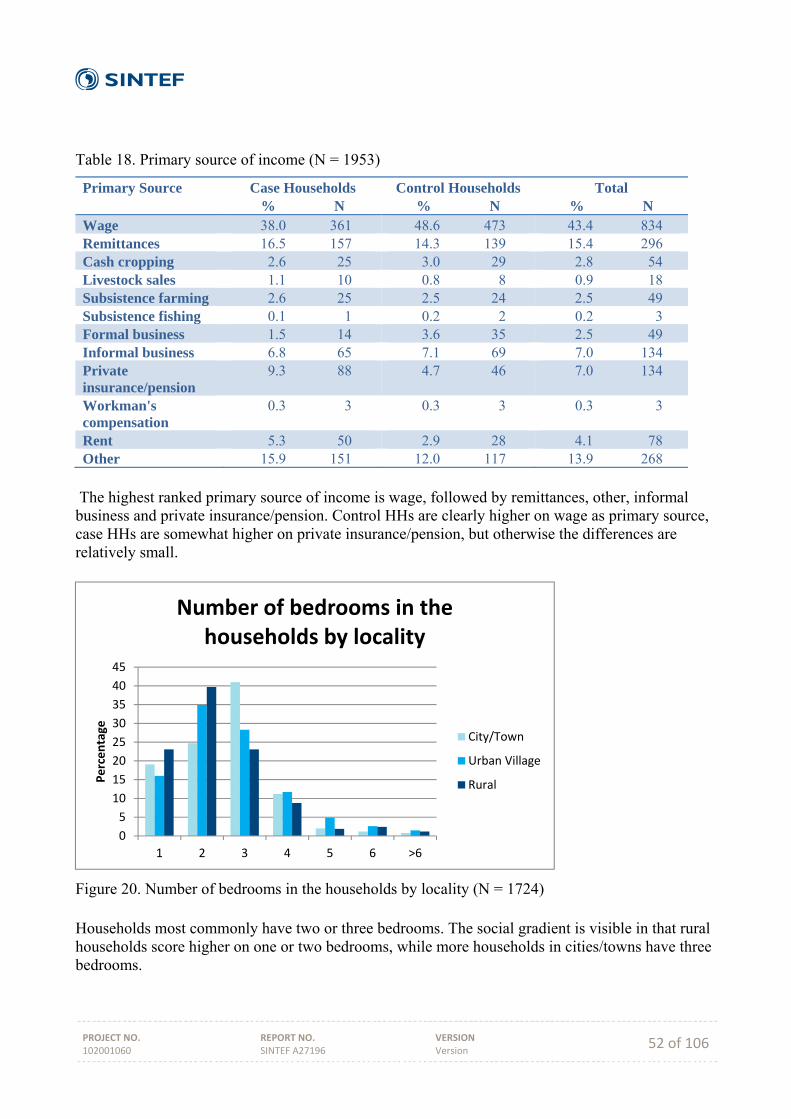
PROJECT NO. 102001060
REPORT NO. SINTEF A27196
VERSION Version 52 of 106
Table 18. Primary source of income (N = 1953)
Primary Source Case Households % N
Control Households % N
Total % N
Wage 38.0 361 48.6 473 43.4 834 Remittances 16.5 157 14.3 139 15.4 296 Cash cropping 2.6 25 3.0 29 2.8 54 Livestock sales 1.1 10 0.8 8 0.9 18 Subsistence farming 2.6 25 2.5 24 2.5 49 Subsistence fishing 0.1 1 0.2 2 0.2 3 Formal business 1.5 14 3.6 35 2.5 49 Informal business 6.8 65 7.1 69 7.0 134 Private insurance/pension
9.3 88 4.7 46 7.0 134
Workman's compensation
0.3 3 0.3 3 0.3 3
Rent 5.3 50 2.9 28 4.1 78 Other 15.9 151 12.0 117 13.9 268
The highest ranked primary source of income is wage, followed by remittances, other, informal business and private insurance/pension. Control HHs are clearly higher on wage as primary source, case HHs are somewhat higher on private insurance/pension, but otherwise the differences are relatively small.
Figure 20. Number of bedrooms in the households by locality (N = 1724) Households most commonly have two or three bedrooms. The social gradient is visible in that rural households score higher on one or two bedrooms, while more households in cities/towns have three bedrooms.
0
5
10
15
20
25
30
35
40
45
1 2 3 4 5 6 >6
Percentage
Number of bedrooms in the households by locality
City/Town
Urban Village
Rural

PROJECT NO. 102001060
REPORT NO. SINTEF A27196
VERSION Version 53 of 106
ble 19. Housing situation by location (N = 1979) City/Town
% N Urban villages % N
Rural % N
Total % N
Rented 32.0 91 15.5 148 3.0 22 13.2 261 Owned 52.1 148 79.9 764 94.0 695 81.2 1607 Rent free (not owned)
1.8 5 3.2 31 1.9 14 2.5 50
Provided by employer (Government
6.3 18 0.8 8 0.3 2 1.4 28
Provided by employer (Private
7.4 21 0.1 1 0.4 3 1.3 25
Other 0.4 1 0.4 4 0.4 3 0.4 8 Self-ownership of house is the most common housing situation in all three locations, but while this is dominating strongly in rural areas, and also dominates in urban villages, only slightly over half of the households own their own house in cities/towns. Rented dwellings is however much more common in cities/towns than in urban villages, and in rural areas very few rent the house they live in. Housing provided by employers, whether Government or private, is almost entirely a city/town phenomenon.
Figure 21. Household situation by case and control (N = 1981) Figure 21 shows small differences between the two household types. Somewhat more case households own the house that they live in, while somewhat more control households rent their dwelling.
0
10
20
30
40
50
60
70
Percentage
Household situation by Case and Control HHs
Case HHs
Control HHs

PROJECT NO. 102001060
REPORT NO. SINTEF A27196
VERSION Version 54 of 106
Table 20. Main source of drinking water (N = 1929)
City/Town % N
Urban villages % N
Rural % N
Total % N
Piped water indoors
50.4 142 22.4 210 6.5 46 20.6 398
Piped water outside, on property
43.3 122 68.3 640 47.0 334 56.8 1096
Public pipe 0.7 2 3.0 28 27.5 195 11.7 225 Borehole 0.0 0 0.0 0 2.7 19 1.0 19 Protected well 0.0 0 0.0 0 0.3 2 0.1 2 Unprotected well 0.0 0 0.0 0 0.6 4 0.2 4 River/stream/dam 0.0 0 0.0 0 1.4 10 0.4 10 Tanker 0.0 0 0.0 0 0.0 0 0.0 0 Other 0.0 0 0.1 1 0.0 0 0.1 1
In cities/towns, the most common source of drinking water is piped water indoors, while a substantial number also have piped water outside, on the property. In urban villages, the main source is piped water outside, on property, while more than one in five has piped water indoors. In rural area, almost half report piped water outside, on property, while more than one in five report that they use public pipe. These differences reflect the expected infrastructure differences between the three locations.
Figure 22. Source of drinking water by Case and Control Households (N = 1931) There are small differences in source of drinking water between the two household types. Slightly more control households have Piped water inside, while slightly more case households have piped water outside, on their own property, and piped water outside their property.
010203040506070
Percentage
Source of drinking water by Case and Control HHs
Case HHs
Control HHs
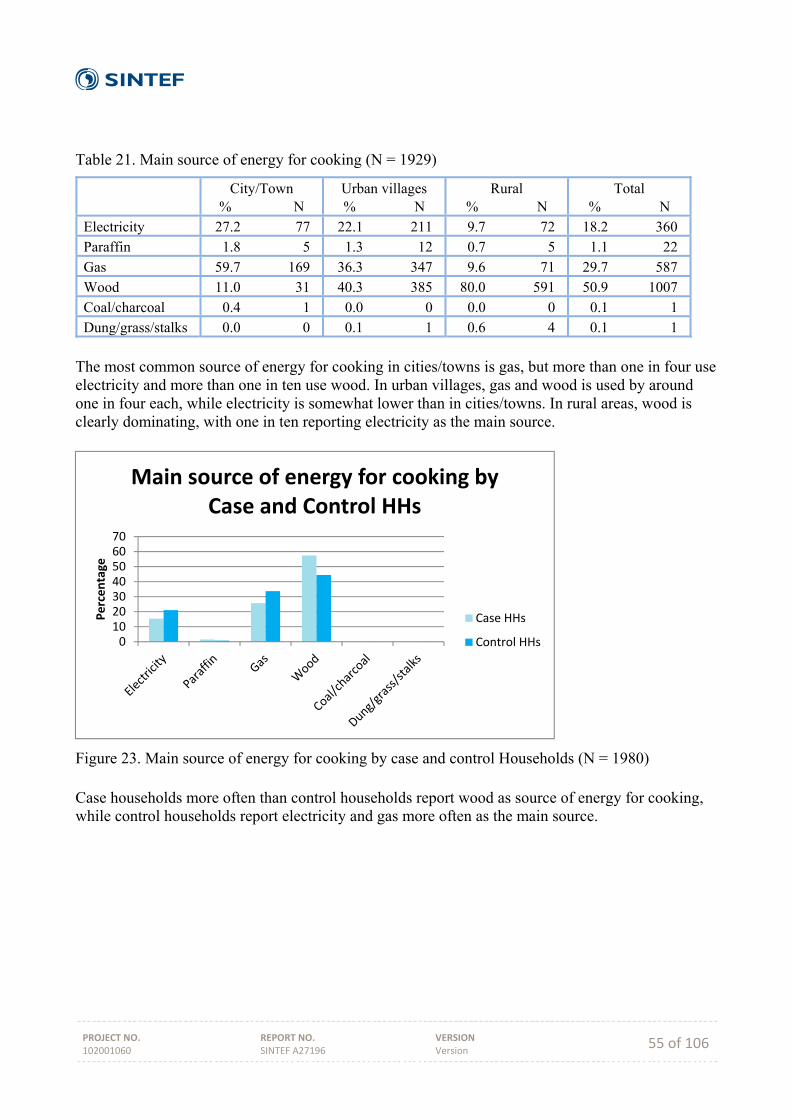
PROJECT NO. 102001060
REPORT NO. SINTEF A27196
VERSION Version 55 of 106
Table 21. Main source of energy for cooking (N = 1929)
City/Town % N
Urban villages % N
Rural % N
Total % N
Electricity 27.2 77 22.1 211 9.7 72 18.2 360 Paraffin 1.8 5 1.3 12 0.7 5 1.1 22 Gas 59.7 169 36.3 347 9.6 71 29.7 587 Wood 11.0 31 40.3 385 80.0 591 50.9 1007 Coal/charcoal 0.4 1 0.0 0 0.0 0 0.1 1 Dung/grass/stalks 0.0 0 0.1 1 0.6 4 0.1 1
The most common source of energy for cooking in cities/towns is gas, but more than one in four use electricity and more than one in ten use wood. In urban villages, gas and wood is used by around one in four each, while electricity is somewhat lower than in cities/towns. In rural areas, wood is clearly dominating, with one in ten reporting electricity as the main source.
Figure 23. Main source of energy for cooking by case and control Households (N = 1980) Case households more often than control households report wood as source of energy for cooking, while control households report electricity and gas more often as the main source.
010203040506070
Percentage
Main source of energy for cooking by Case and Control HHs
Case HHs
Control HHs
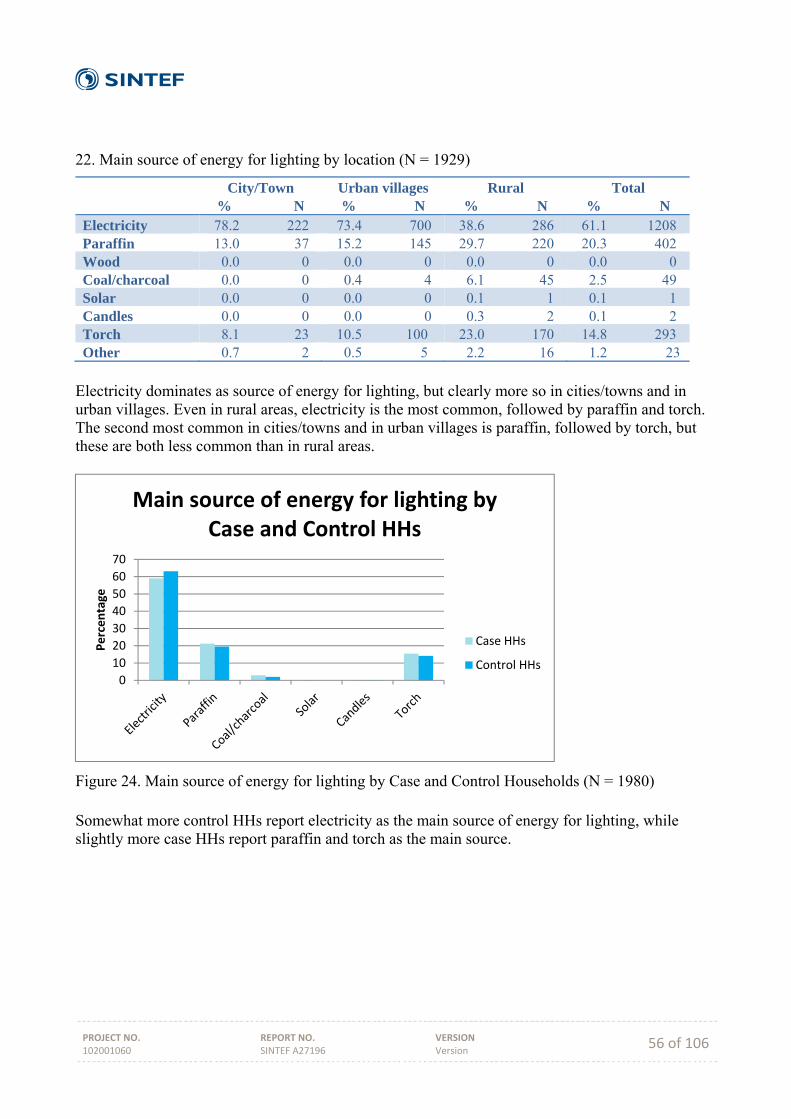
PROJECT NO. 102001060
REPORT NO. SINTEF A27196
VERSION Version 56 of 106
22. Main source of energy for lighting by location (N = 1929)
City/Town % N
Urban villages % N
Rural % N
Total % N
Electricity 78.2 222 73.4 700 38.6 286 61.1 1208 Paraffin 13.0 37 15.2 145 29.7 220 20.3 402 Wood 0.0 0 0.0 0 0.0 0 0.0 0 Coal/charcoal 0.0 0 0.4 4 6.1 45 2.5 49 Solar 0.0 0 0.0 0 0.1 1 0.1 1 Candles 0.0 0 0.0 0 0.3 2 0.1 2 Torch 8.1 23 10.5 100 23.0 170 14.8 293 Other 0.7 2 0.5 5 2.2 16 1.2 23
Electricity dominates as source of energy for lighting, but clearly more so in cities/towns and in urban villages. Even in rural areas, electricity is the most common, followed by paraffin and torch. The second most common in cities/towns and in urban villages is paraffin, followed by torch, but these are both less common than in rural areas.
Figure 24. Main source of energy for lighting by Case and Control Households (N = 1980) Somewhat more control HHs report electricity as the main source of energy for lighting, while slightly more case HHs report paraffin and torch as the main source.
0
10
20
30
40
50
60
70
Percentage
Main source of energy for lighting by Case and Control HHs
Case HHs
Control HHs
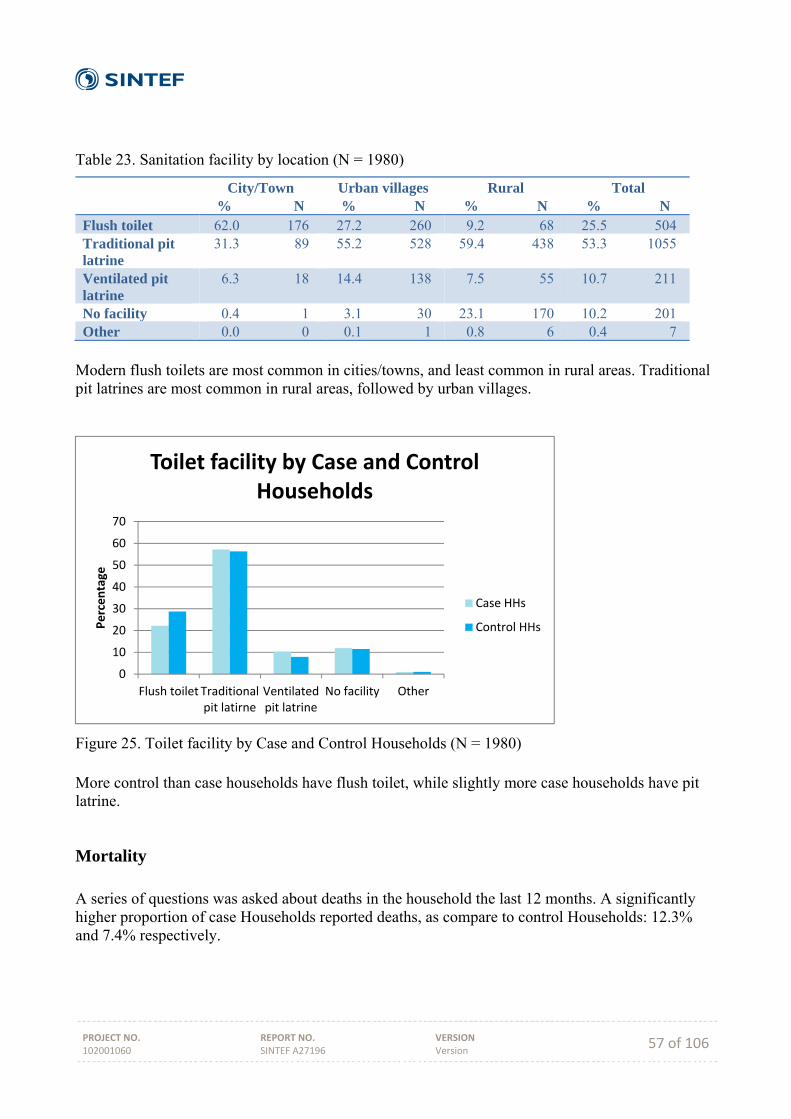
PROJECT NO. 102001060
REPORT NO. SINTEF A27196
VERSION Version 57 of 106
Table 23. Sanitation facility by location (N = 1980)
City/Town % N
Urban villages % N
Rural % N
Total % N
Flush toilet 62.0 176 27.2 260 9.2 68 25.5 504 Traditional pit latrine
31.3 89 55.2 528 59.4 438 53.3 1055
Ventilated pit latrine
6.3 18 14.4 138 7.5 55 10.7 211
No facility 0.4 1 3.1 30 23.1 170 10.2 201 Other 0.0 0 0.1 1 0.8 6 0.4 7
Modern flush toilets are most common in cities/towns, and least common in rural areas. Traditional pit latrines are most common in rural areas, followed by urban villages.
Figure 25. Toilet facility by Case and Control Households (N = 1980) More control than case households have flush toilet, while slightly more case households have pit latrine.
Mortality A series of questions was asked about deaths in the household the last 12 months. A significantly higher proportion of case Households reported deaths, as compare to control Households: 12.3% and 7.4% respectively.
0
10
20
30
40
50
60
70
Flush toilet Traditionalpit latirne
Ventilatedpit latrine
No facility Other
Percentage
Toilet facility by Case and Control Households
Case HHs
Control HHs
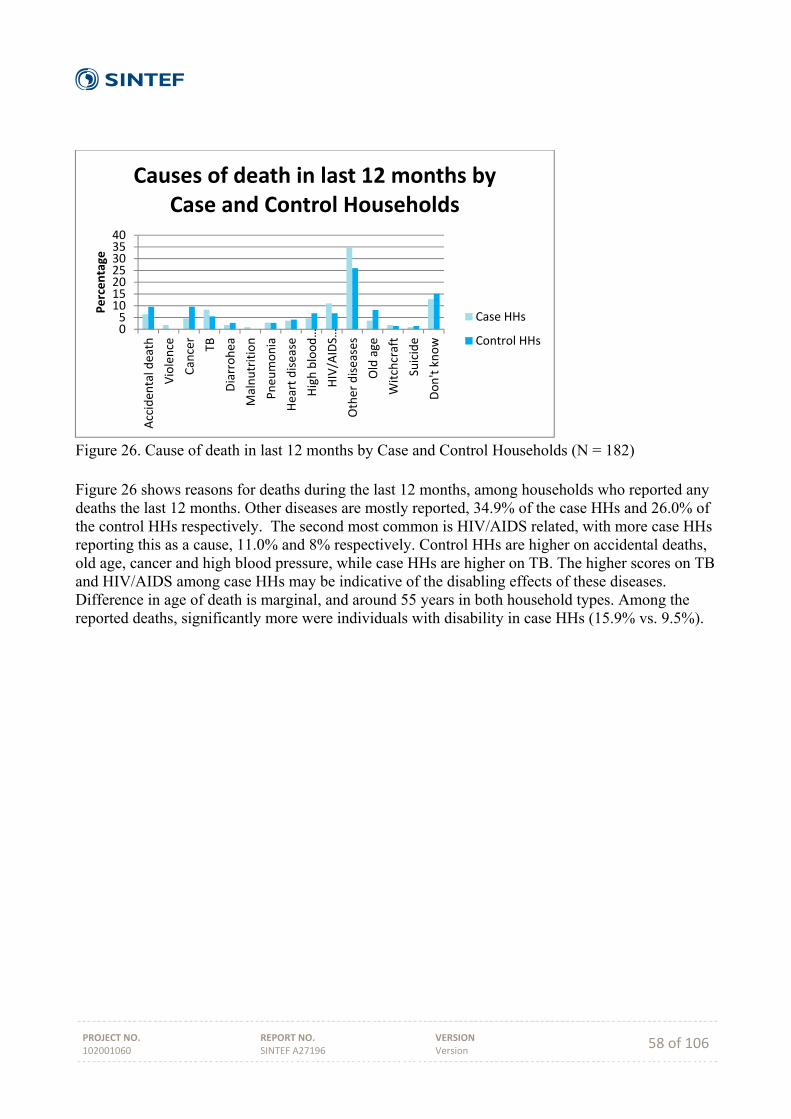
PROJECT NO. 102001060
REPORT NO. SINTEF A27196
VERSION Version 58 of 106
Figure 26. Cause of death in last 12 months by Case and Control Households (N = 182) Figure 26 shows reasons for deaths during the last 12 months, among households who reported any deaths the last 12 months. Other diseases are mostly reported, 34.9% of the case HHs and 26.0% of the control HHs respectively. The second most common is HIV/AIDS related, with more case HHs reporting this as a cause, 11.0% and 8% respectively. Control HHs are higher on accidental deaths, old age, cancer and high blood pressure, while case HHs are higher on TB. The higher scores on TB and HIV/AIDS among case HHs may be indicative of the disabling effects of these diseases. Difference in age of death is marginal, and around 55 years in both household types. Among the reported deaths, significantly more were individuals with disability in case HHs (15.9% vs. 9.5%).
0510152025303540
Acciden
tal death
Violence
Cancer
TB
Diarrohea
Malnutrition
Pneu
monia
Heart disease
High blood…
HIV/AIDS…
Other diseases
Old age
Witchcraft
Suicide
Don't know
Percentage
Causes of death in last 12 months by Case and Control Households
Case HHs
Control HHs
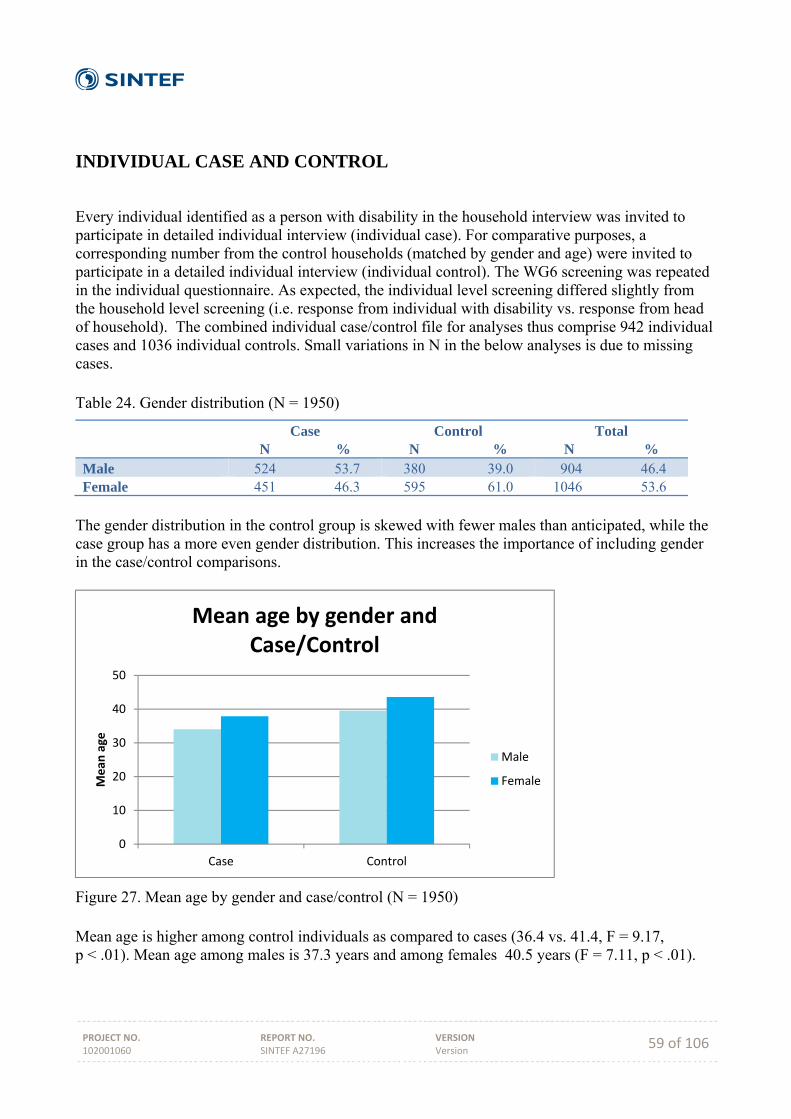
PROJECT NO. 102001060
REPORT NO. SINTEF A27196
VERSION Version 59 of 106
INDIVIDUAL CASE AND CONTROL
Every individual identified as a person with disability in the household interview was invited to participate in detailed individual interview (individual case). For comparative purposes, a corresponding number from the control households (matched by gender and age) were invited to participate in a detailed individual interview (individual control). The WG6 screening was repeated in the individual questionnaire. As expected, the individual level screening differed slightly from the household level screening (i.e. response from individual with disability vs. response from head of household). The combined individual case/control file for analyses thus comprise 942 individual cases and 1036 individual controls. Small variations in N in the below analyses is due to missing cases. Table 24. Gender distribution (N = 1950)
Case N %
Control N %
Total N %
Male 524 53.7 380 39.0 904 46.4 Female 451 46.3 595 61.0 1046 53.6
The gender distribution in the control group is skewed with fewer males than anticipated, while the case group has a more even gender distribution. This increases the importance of including gender in the case/control comparisons.
Figure 27. Mean age by gender and case/control (N = 1950) Mean age is higher among control individuals as compared to cases (36.4 vs. 41.4, F = 9.17, p < .01). Mean age among males is 37.3 years and among females 40.5 years (F = 7.11, p < .01).
0
10
20
30
40
50
Case Control
Mean
age
Mean age by gender and Case/Control
Male
Female

PROJECT NO. 102001060
REPORT NO. SINTEF A27196
VERSION Version 60 of 106
Activity limitations
Figure 28. Number of difficulties by gender (N = 991) Mean number of difficulties is marginally higher among females compared with men (2.22 vs. 2.17, p = n.s.). In Figure 28, all values above 0 on any difficulty (i.e. "some difficulty" or higher) have been recoded to 1, so this is a simple count of numbers without including the degree of activity limitation (disability). More men have only one (out of six) difficulty, and men also score higher on three difficulties. Women score higher on two and five difficulties. WG6 scale The six activity limitation questions were added together to form an Activity Limitations Scale. A small number of missing values were replaced by mean. Possible scale values ranged from 0 to 18, mean value (among cases) was 4.51 and standard deviation 2.95. There were only a marginal difference between men and women (mean: 4.57 and 4.45 respectively). Small and insignificant differences were also found between the three location types (City/Town: 4.55, Urban villages: 4.48, Rural: 4.55).
0
5
10
15
20
25
30
35
40
1 2 3 4 5 6
Percentage
Number of difficulties by gender
Men
Women
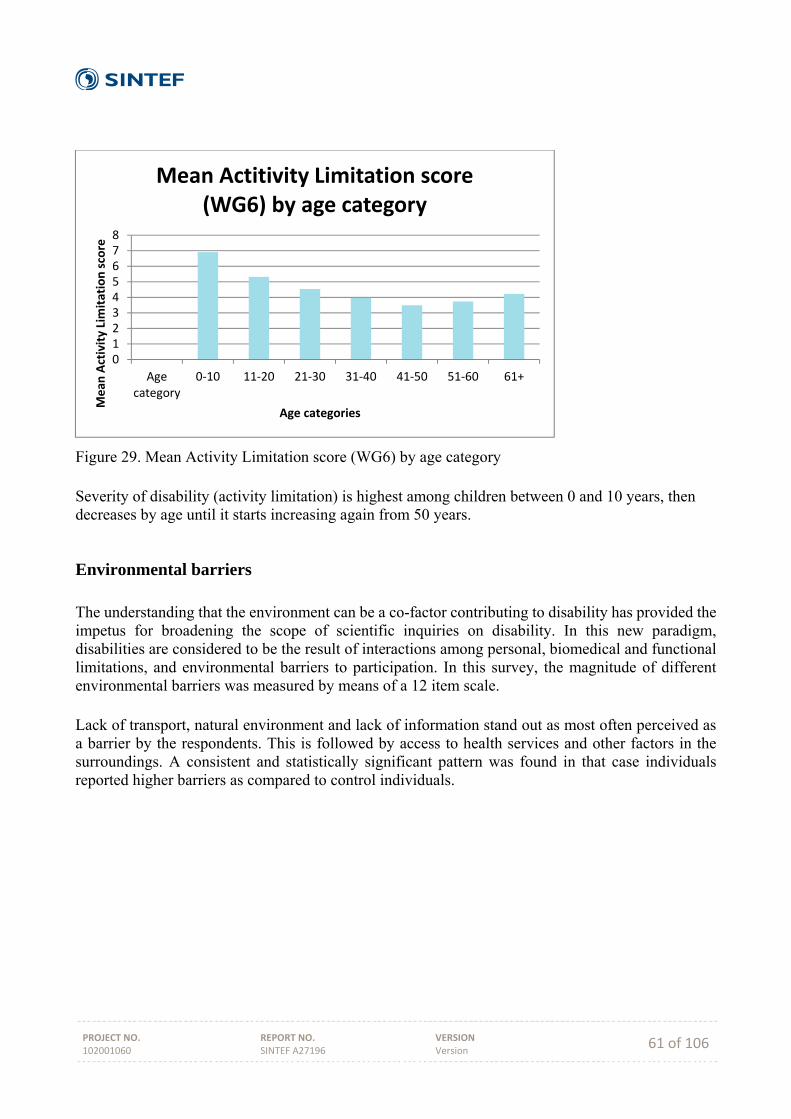
PROJECT NO. 102001060
REPORT NO. SINTEF A27196
VERSION Version 61 of 106
Figure 29. Mean Activity Limitation score (WG6) by age category Severity of disability (activity limitation) is highest among children between 0 and 10 years, then decreases by age until it starts increasing again from 50 years.
Environmental barriers The understanding that the environment can be a co-factor contributing to disability has provided the impetus for broadening the scope of scientific inquiries on disability. In this new paradigm, disabilities are considered to be the result of interactions among personal, biomedical and functional limitations, and environmental barriers to participation. In this survey, the magnitude of different environmental barriers was measured by means of a 12 item scale. Lack of transport, natural environment and lack of information stand out as most often perceived as a barrier by the respondents. This is followed by access to health services and other factors in the surroundings. A consistent and statistically significant pattern was found in that case individuals reported higher barriers as compared to control individuals.
012345678
Agecategory
0‐10 11‐20 21‐30 31‐40 41‐50 51‐60 61+
Mean
Activity Limitation score
Age categories
Mean Actitivity Limitation score (WG6) by age category
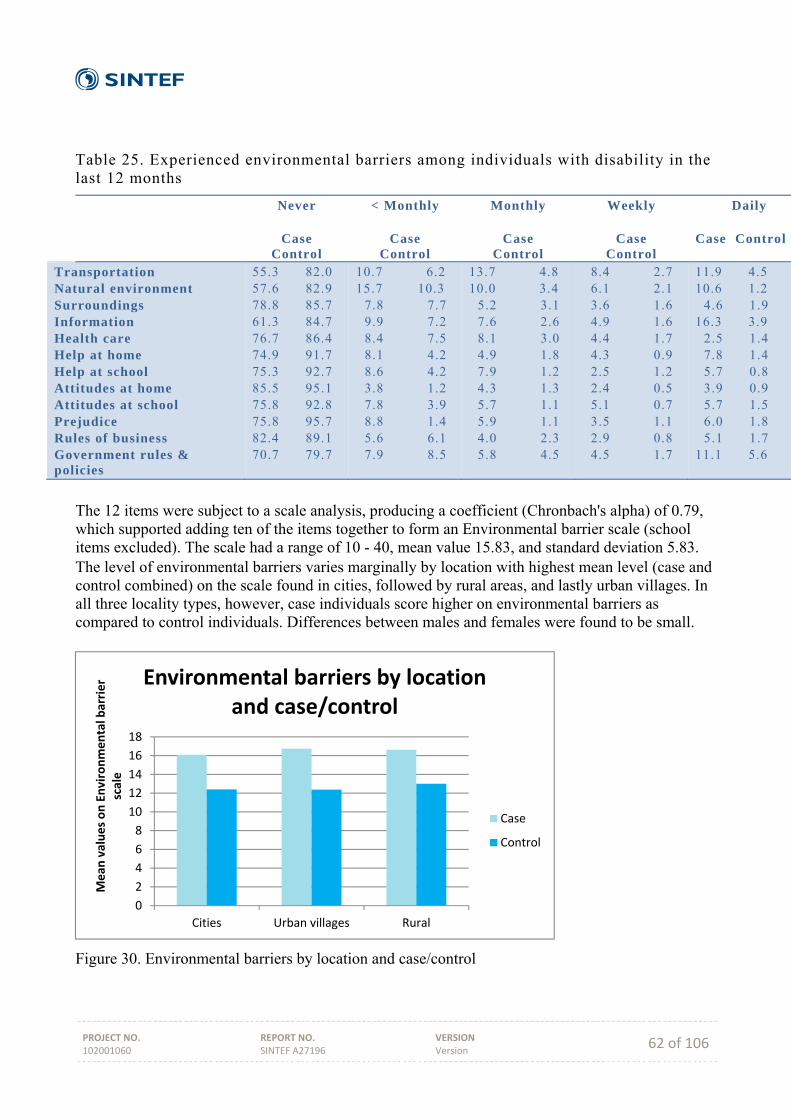
PROJECT NO. 102001060
REPORT NO. SINTEF A27196
VERSION Version 62 of 106
Table 25. Experienced environmental barriers among individuals with disability in the last 12 months
Never
Case Control
< Monthly
Case Control
Monthly
Case Control
Weekly
Case Control
Daily Case Control
Transportation Natural environment Surroundings Information Health care Help at home Help at school Attitudes at home Attitudes at school Prejudice Rules of business Government rules & policies
55.3 82.0 57.6 82.9 78.8 85.7 61.3 84.7 76.7 86.4 74.9 91.7 75.3 92.7 85.5 95.1 75.8 92.8 75.8 95.7 82.4 89.1 70.7 79.7
10.7 6.2 15.7 10.3 7.8 7.7 9.9 7.2 8.4 7.5 8.1 4.2 8.6 4.2 3.8 1.2 7.8 3.9 8.8 1.4 5.6 6.1 7.9 8.5
13.7 4.8 10.0 3.4 5.2 3.1 7.6 2.6 8.1 3.0 4.9 1.8 7.9 1.2 4.3 1.3 5.7 1.1 5.9 1.1 4.0 2.3 5.8 4.5
8.4 2.7 6.1 2.1 3.6 1.6 4.9 1.6 4.4 1.7 4.3 0.9 2.5 1.2 2.4 0.5 5.1 0.7 3.5 1.1 2.9 0.8 4.5 1.7
11.9 4.5 10.6 1.2 4.6 1.9 16.3 3.9 2.5 1.4 7.8 1.4 5.7 0.8 3.9 0.9 5.7 1.5 6.0 1.8 5.1 1.7 11.1 5.6
The 12 items were subject to a scale analysis, producing a coefficient (Chronbach's alpha) of 0.79, which supported adding ten of the items together to form an Environmental barrier scale (school items excluded). The scale had a range of 10 - 40, mean value 15.83, and standard deviation 5.83. The level of environmental barriers varies marginally by location with highest mean level (case and control combined) on the scale found in cities, followed by rural areas, and lastly urban villages. In all three locality types, however, case individuals score higher on environmental barriers as compared to control individuals. Differences between males and females were found to be small.
Figure 30. Environmental barriers by location and case/control
0
2
4
6
8
10
12
14
16
18
Cities Urban villages Rural
Mean
values on Environmental barrier
scale
Environmental barriers by location and case/control
Case
Control
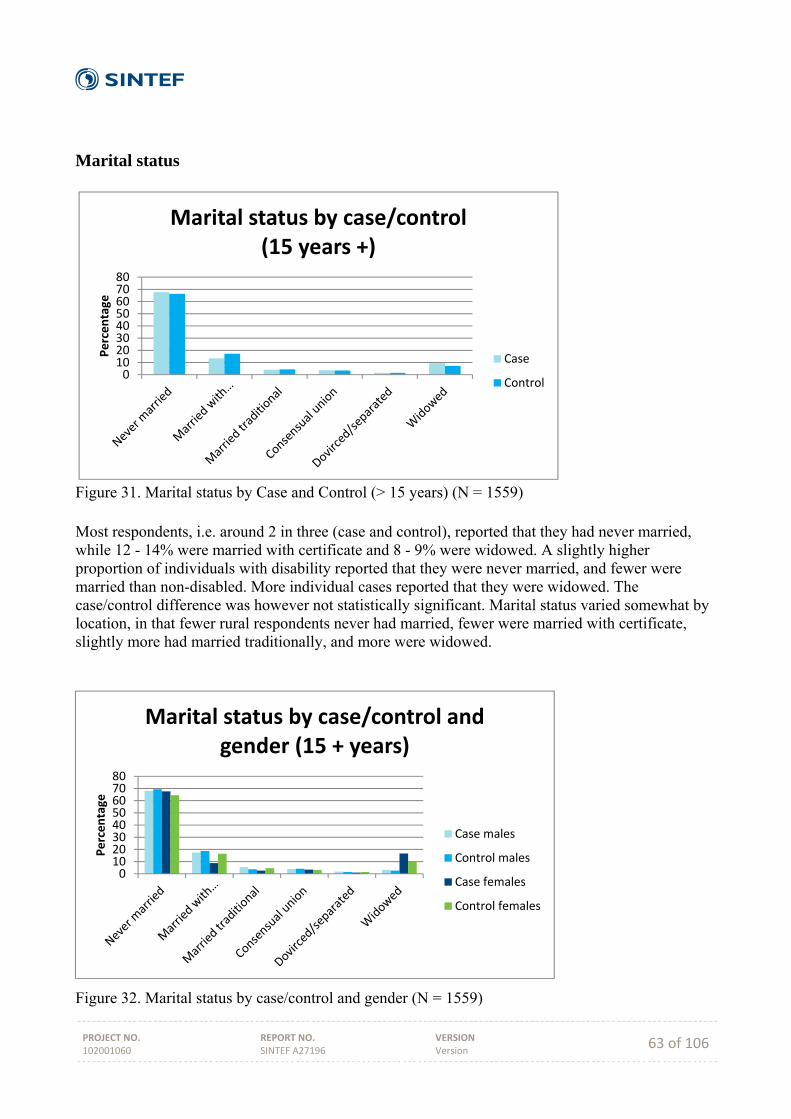
PROJECT NO. 102001060
REPORT NO. SINTEF A27196
VERSION Version 63 of 106
Marital status
Figure 31. Marital status by Case and Control (> 15 years) (N = 1559) Most respondents, i.e. around 2 in three (case and control), reported that they had never married, while 12 - 14% were married with certificate and 8 - 9% were widowed. A slightly higher proportion of individuals with disability reported that they were never married, and fewer were married than non-disabled. More individual cases reported that they were widowed. The case/control difference was however not statistically significant. Marital status varied somewhat by location, in that fewer rural respondents never had married, fewer were married with certificate, slightly more had married traditionally, and more were widowed.
Figure 32. Marital status by case/control and gender (N = 1559)
01020304050607080
Percentage
Marital status by case/control (15 years +)
Case
Control
01020304050607080
Percentage
Marital status by case/control and gender (15 + years)
Case males
Control males
Case females
Control females

PROJECT NO. 102001060
REPORT NO. SINTEF A27196
VERSION Version 64 of 106
Figure 32 reveals that the distribution of marital status remains largely the same when analysing by gender. We can however observe (Figure 32) that fewer females with disability were married with certificate, while more were widowed, as compared to non-disabled females. The difference between females with and without disability was statistically significant (χ2= 20.15, p < .01), but not for males. Differences between males and females were statistically significant, but somewhat stronger among cases (χ2= 55.19, p < .01 than controls (χ2= 14.14, p = .015).
Health
Figure 33. Chronical illness during last 12 months by gender and case/control (N = 1874) Individuals with disability report more often that they had been chronically ill during the last 12 months (22.2% vs. 11.9%, χ2= 34.30, p < .001). This also goes for males (18.9% vs. 9.0%, χ2= 15.95, p = .015) and females (25.9% vs. 13.7%, χ2= 23.69, p < .001). Also with regards to gender, females report chronical illness more often than men (19.2% vs. 15%, χ2= 5.76, p = .001), and this was found also among cases (18.9% vs. 25.9%, χ2= 6.83, p < .01) and among controls (9.0% vs. 13.7%, χ2= 4.39, p < .05). There is thus a clear case/control and gender difference. The variation in reported chronic illness by location was marginal, although respondents from urban villages reported somewhat higher incidence (2 percentage points). A question on specific illnesses was asked to all respondents who had reported a chronic illness during the last 12 months. Of the 15 mentioned illnesses, individuals with disability reported significantly higher incidence as compared to non-disabled. The same pattern of differences was mostly upheld when analysing males and females separately, but for a few of the illnesses, the differences were statistically significant only for males or for females. The most common illnesses among individuals with disability were back/neck problem, depression/anxiety/emotional problem, mental retardation, and hypertension.
0
5
10
15
20
25
30
Male Case MaleControl
FemaleCase
FemaleControl
Percentage
Illness last 12 months by gender and case/control
Illness last 12 months
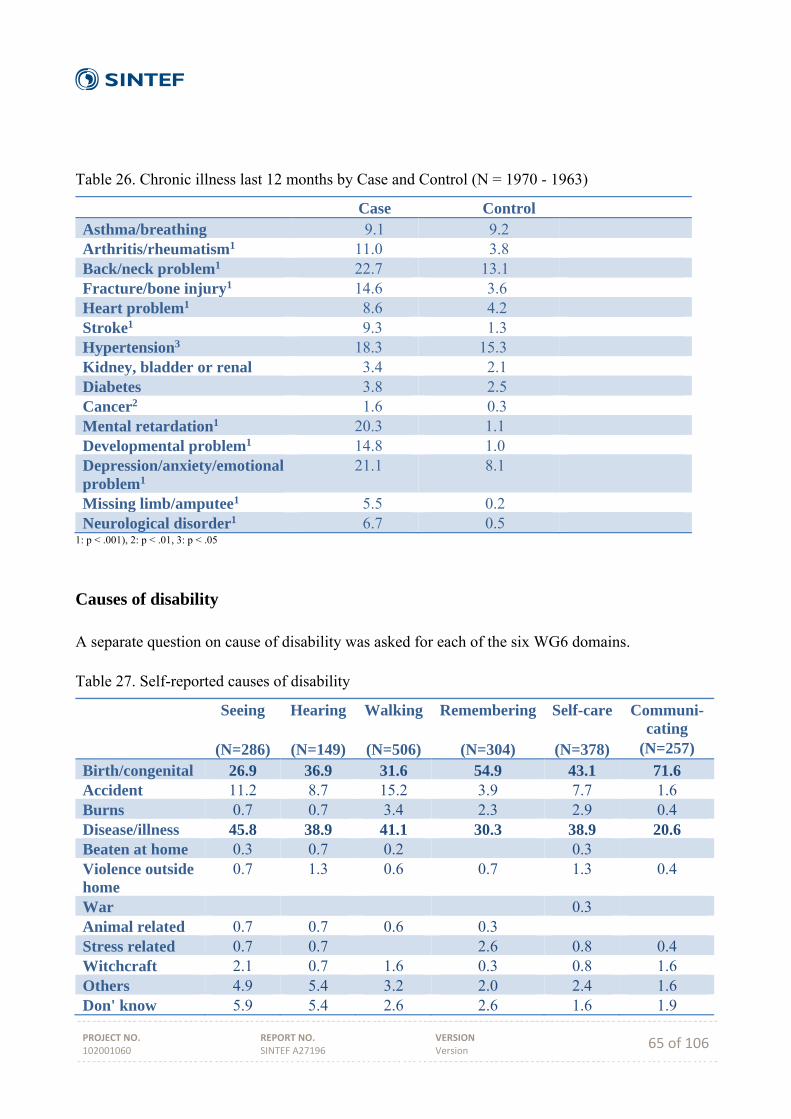
PROJECT NO. 102001060
REPORT NO. SINTEF A27196
VERSION Version 65 of 106
Table 26. Chronic illness last 12 months by Case and Control (N = 1970 - 1963)
Case Control Asthma/breathing 9.1 9.2 Arthritis/rheumatism1 11.0 3.8 Back/neck problem1 22.7 13.1 Fracture/bone injury1 14.6 3.6 Heart problem1 8.6 4.2 Stroke1 9.3 1.3 Hypertension3 18.3 15.3 Kidney, bladder or renal 3.4 2.1 Diabetes 3.8 2.5 Cancer2 1.6 0.3 Mental retardation1 20.3 1.1 Developmental problem1 14.8 1.0 Depression/anxiety/emotional problem1
21.1 8.1
Missing limb/amputee1 5.5 0.2 Neurological disorder1 6.7 0.5
1: p < .001), 2: p < .01, 3: p < .05
Causes of disability A separate question on cause of disability was asked for each of the six WG6 domains. Table 27. Self-reported causes of disability
Seeing
(N=286)
Hearing
(N=149)
Walking
(N=506)
Remembering
(N=304)
Self-care
(N=378)
Communi-cating
(N=257)
Birth/congenital 26.9 36.9 31.6 54.9 43.1 71.6 Accident 11.2 8.7 15.2 3.9 7.7 1.6 Burns 0.7 0.7 3.4 2.3 2.9 0.4 Disease/illness 45.8 38.9 41.1 30.3 38.9 20.6 Beaten at home 0.3 0.7 0.2 0.3 Violence outside home
0.7 1.3 0.6 0.7 1.3 0.4
War 0.3 Animal related 0.7 0.7 0.6 0.3 Stress related 0.7 0.7 2.6 0.8 0.4 Witchcraft 2.1 0.7 1.6 0.3 0.8 1.6 Others 4.9 5.4 3.2 2.0 2.4 1.6 Don' know 5.9 5.4 2.6 2.6 1.6 1.9
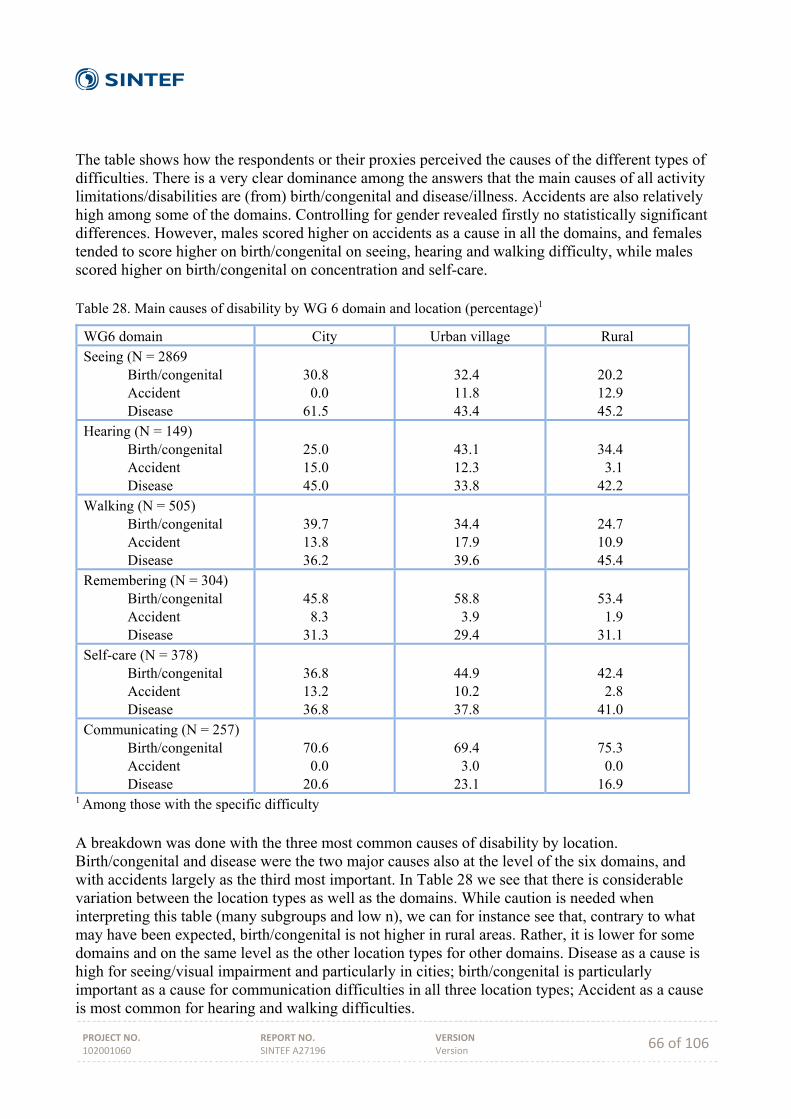
PROJECT NO. 102001060
REPORT NO. SINTEF A27196
VERSION Version 66 of 106
The table shows how the respondents or their proxies perceived the causes of the different types of difficulties. There is a very clear dominance among the answers that the main causes of all activity limitations/disabilities are (from) birth/congenital and disease/illness. Accidents are also relatively high among some of the domains. Controlling for gender revealed firstly no statistically significant differences. However, males scored higher on accidents as a cause in all the domains, and females tended to score higher on birth/congenital on seeing, hearing and walking difficulty, while males scored higher on birth/congenital on concentration and self-care. Table 28. Main causes of disability by WG 6 domain and location (percentage)1
WG6 domain City Urban village Rural Seeing (N = 2869 Birth/congenital Accident Disease
30.8 0.0 61.5
32.4 11.8 43.4
20.2 12.9 45.2
Hearing (N = 149) Birth/congenital Accident Disease
25.0 15.0 45.0
43.1 12.3 33.8
34.4 3.1 42.2
Walking (N = 505) Birth/congenital Accident Disease
39.7 13.8 36.2
34.4 17.9 39.6
24.7 10.9 45.4
Remembering (N = 304) Birth/congenital Accident Disease
45.8 8.3 31.3
58.8 3.9 29.4
53.4 1.9 31.1
Self-care (N = 378) Birth/congenital Accident Disease
36.8 13.2 36.8
44.9 10.2 37.8
42.4 2.8 41.0
Communicating (N = 257) Birth/congenital Accident Disease
70.6 0.0 20.6
69.4 3.0 23.1
75.3 0.0 16.9
1 Among those with the specific difficulty A breakdown was done with the three most common causes of disability by location. Birth/congenital and disease were the two major causes also at the level of the six domains, and with accidents largely as the third most important. In Table 28 we see that there is considerable variation between the location types as well as the domains. While caution is needed when interpreting this table (many subgroups and low n), we can for instance see that, contrary to what may have been expected, birth/congenital is not higher in rural areas. Rather, it is lower for some domains and on the same level as the other location types for other domains. Disease as a cause is high for seeing/visual impairment and particularly in cities; birth/congenital is particularly important as a cause for communication difficulties in all three location types; Accident as a cause is most common for hearing and walking difficulties.
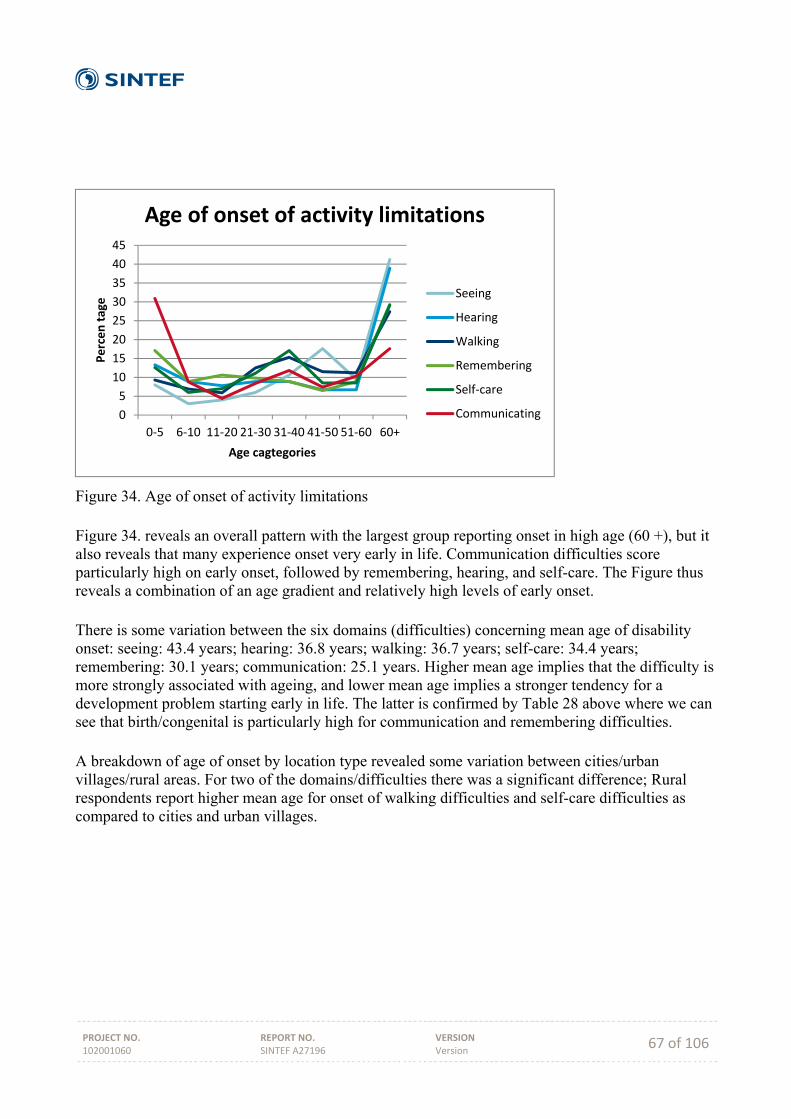
PROJECT NO. 102001060
REPORT NO. SINTEF A27196
VERSION Version 67 of 106
Figure 34. Age of onset of activity limitations Figure 34. reveals an overall pattern with the largest group reporting onset in high age (60 +), but it also reveals that many experience onset very early in life. Communication difficulties score particularly high on early onset, followed by remembering, hearing, and self-care. The Figure thus reveals a combination of an age gradient and relatively high levels of early onset. There is some variation between the six domains (difficulties) concerning mean age of disability onset: seeing: 43.4 years; hearing: 36.8 years; walking: 36.7 years; self-care: 34.4 years; remembering: 30.1 years; communication: 25.1 years. Higher mean age implies that the difficulty is more strongly associated with ageing, and lower mean age implies a stronger tendency for a development problem starting early in life. The latter is confirmed by Table 28 above where we can see that birth/congenital is particularly high for communication and remembering difficulties. A breakdown of age of onset by location type revealed some variation between cities/urban villages/rural areas. For two of the domains/difficulties there was a significant difference; Rural respondents report higher mean age for onset of walking difficulties and self-care difficulties as compared to cities and urban villages.
0
5
10
15
20
25
30
35
40
45
0‐5 6‐10 11‐20 21‐30 31‐40 41‐50 51‐60 60+
Percen tage
Age cagtegories
Age of onset of activity limitations
Seeing
Hearing
Walking
Remembering
Self‐care
Communicating
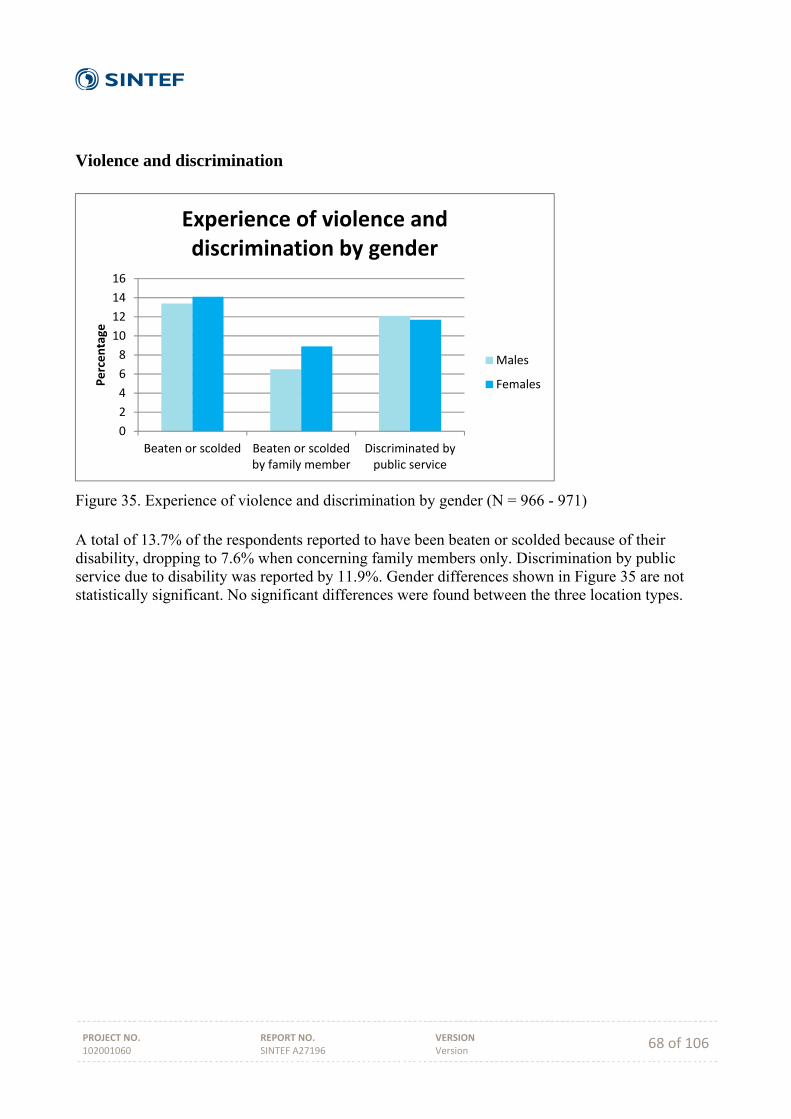
PROJECT NO. 102001060
REPORT NO. SINTEF A27196
VERSION Version 68 of 106
Violence and discrimination
Figure 35. Experience of violence and discrimination by gender (N = 966 - 971) A total of 13.7% of the respondents reported to have been beaten or scolded because of their disability, dropping to 7.6% when concerning family members only. Discrimination by public service due to disability was reported by 11.9%. Gender differences shown in Figure 35 are not statistically significant. No significant differences were found between the three location types.
0
2
4
6
8
10
12
14
16
Beaten or scolded Beaten or scoldedby family member
Discriminated bypublic service
Percentage
Experience of violence and discrimination by gender
Males
Females
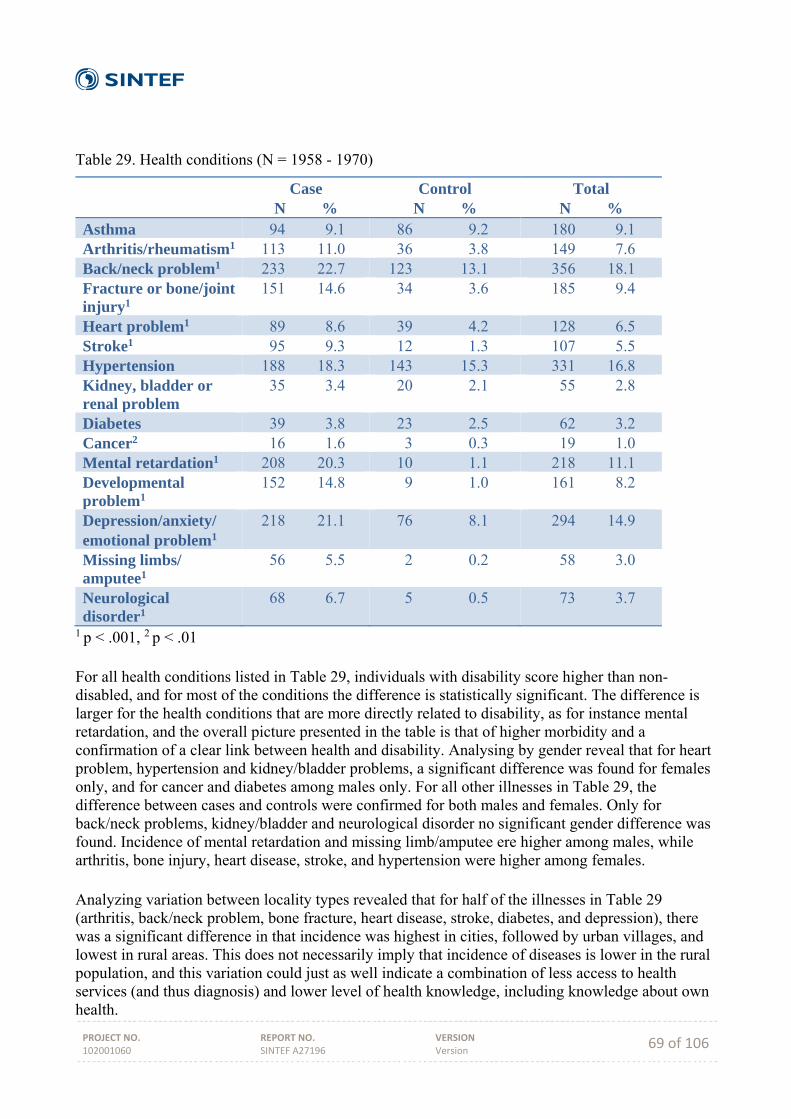
PROJECT NO. 102001060
REPORT NO. SINTEF A27196
VERSION Version 69 of 106
Table 29. Health conditions (N = 1958 - 1970)
Case N %
Control N %
Total N %
Asthma 94 9.1 86 9.2 180 9.1 Arthritis/rheumatism1 113 11.0 36 3.8 149 7.6 Back/neck problem1 233 22.7 123 13.1 356 18.1 Fracture or bone/joint injury1
151 14.6 34 3.6 185 9.4
Heart problem1 89 8.6 39 4.2 128 6.5 Stroke1 95 9.3 12 1.3 107 5.5 Hypertension 188 18.3 143 15.3 331 16.8 Kidney, bladder or renal problem
35 3.4 20 2.1 55 2.8
Diabetes 39 3.8 23 2.5 62 3.2 Cancer2 16 1.6 3 0.3 19 1.0 Mental retardation1 208 20.3 10 1.1 218 11.1 Developmental problem1
152 14.8 9 1.0 161 8.2
Depression/anxiety/ emotional problem1
218 21.1 76 8.1 294 14.9
Missing limbs/ amputee1
56 5.5 2 0.2 58 3.0
Neurological disorder1
68 6.7 5 0.5 73 3.7
1 p < .001, 2 p < .01 For all health conditions listed in Table 29, individuals with disability score higher than non-disabled, and for most of the conditions the difference is statistically significant. The difference is larger for the health conditions that are more directly related to disability, as for instance mental retardation, and the overall picture presented in the table is that of higher morbidity and a confirmation of a clear link between health and disability. Analysing by gender reveal that for heart problem, hypertension and kidney/bladder problems, a significant difference was found for females only, and for cancer and diabetes among males only. For all other illnesses in Table 29, the difference between cases and controls were confirmed for both males and females. Only for back/neck problems, kidney/bladder and neurological disorder no significant gender difference was found. Incidence of mental retardation and missing limb/amputee ere higher among males, while arthritis, bone injury, heart disease, stroke, and hypertension were higher among females. Analyzing variation between locality types revealed that for half of the illnesses in Table 29 (arthritis, back/neck problem, bone fracture, heart disease, stroke, diabetes, and depression), there was a significant difference in that incidence was highest in cities, followed by urban villages, and lowest in rural areas. This does not necessarily imply that incidence of diseases is lower in the rural population, and this variation could just as well indicate a combination of less access to health services (and thus diagnosis) and lower level of health knowledge, including knowledge about own health.
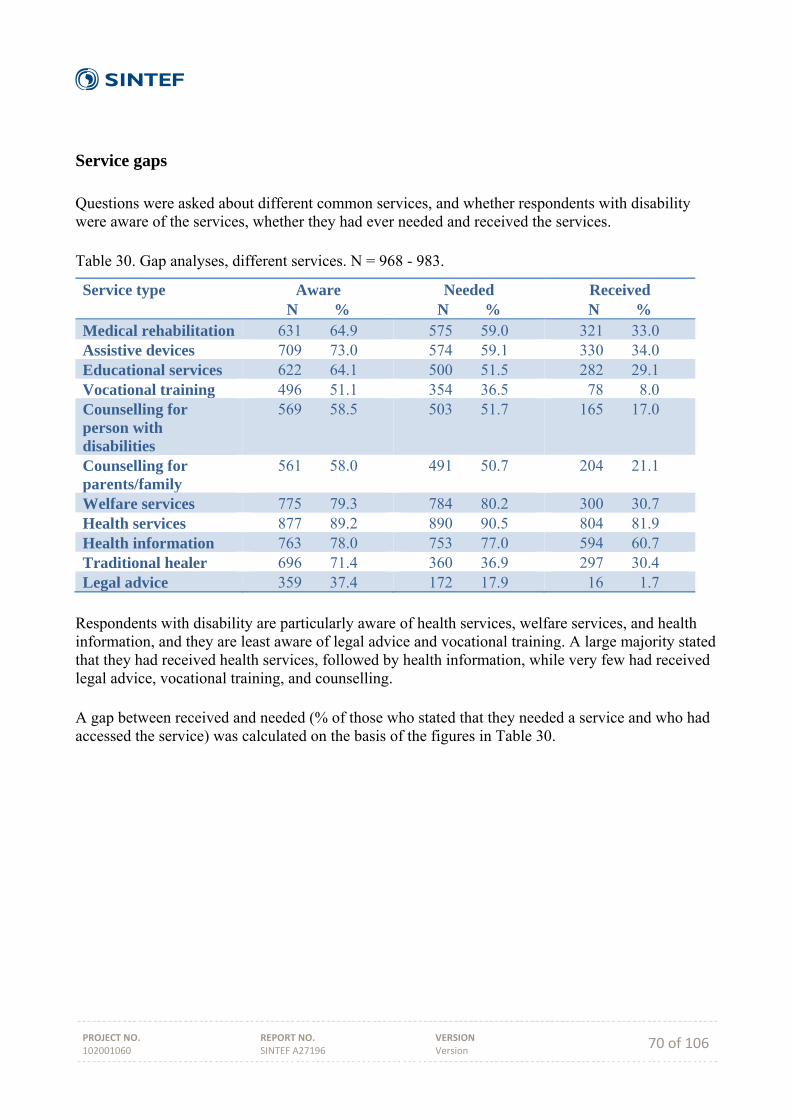
PROJECT NO. 102001060
REPORT NO. SINTEF A27196
VERSION Version 70 of 106
Service gaps Questions were asked about different common services, and whether respondents with disability were aware of the services, whether they had ever needed and received the services. Table 30. Gap analyses, different services. N = 968 - 983.
Service type Aware N %
Needed N %
Received N %
Medical rehabilitation 631 64.9 575 59.0 321 33.0 Assistive devices 709 73.0 574 59.1 330 34.0 Educational services 622 64.1 500 51.5 282 29.1 Vocational training 496 51.1 354 36.5 78 8.0 Counselling for person with disabilities
569 58.5 503 51.7 165 17.0
Counselling for parents/family
561 58.0 491 50.7 204 21.1
Welfare services 775 79.3 784 80.2 300 30.7 Health services 877 89.2 890 90.5 804 81.9 Health information 763 78.0 753 77.0 594 60.7 Traditional healer 696 71.4 360 36.9 297 30.4 Legal advice 359 37.4 172 17.9 16 1.7
Respondents with disability are particularly aware of health services, welfare services, and health information, and they are least aware of legal advice and vocational training. A large majority stated that they had received health services, followed by health information, while very few had received legal advice, vocational training, and counselling. A gap between received and needed (% of those who stated that they needed a service and who had accessed the service) was calculated on the basis of the figures in Table 30.
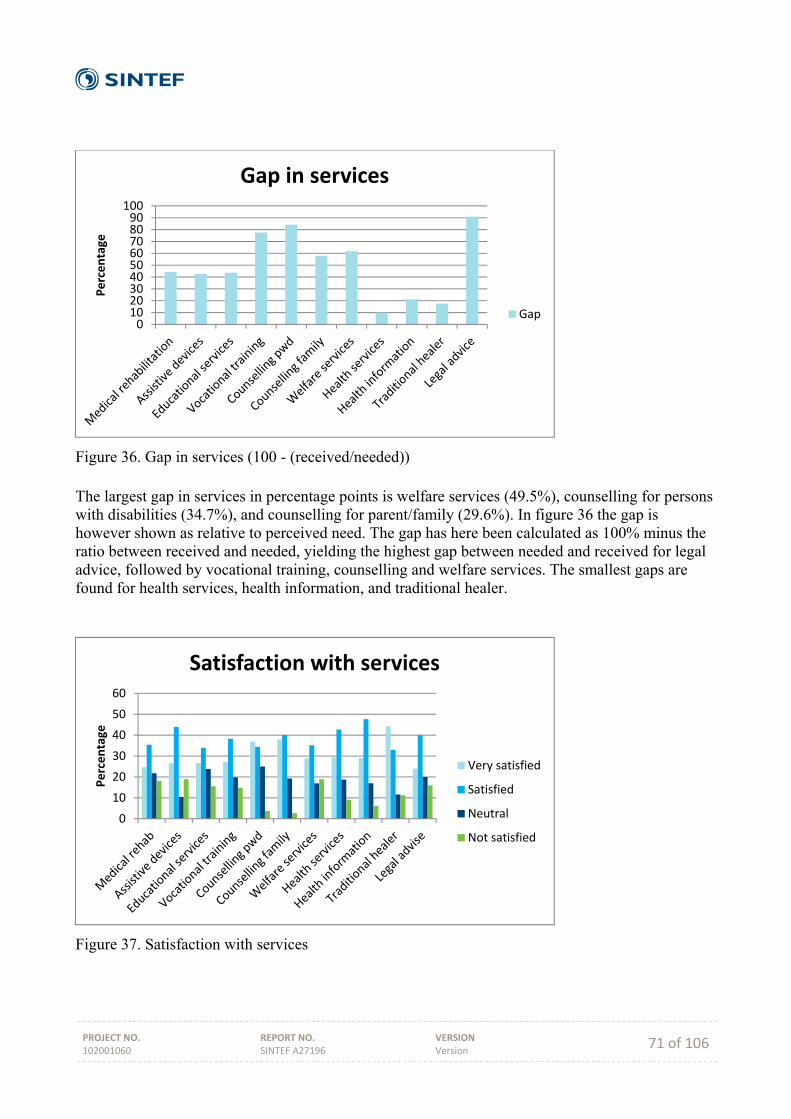
PROJECT NO. 102001060
REPORT NO. SINTEF A27196
VERSION Version 71 of 106
Figure 36. Gap in services (100 - (received/needed)) The largest gap in services in percentage points is welfare services (49.5%), counselling for persons with disabilities (34.7%), and counselling for parent/family (29.6%). In figure 36 the gap is however shown as relative to perceived need. The gap has here been calculated as 100% minus the ratio between received and needed, yielding the highest gap between needed and received for legal advice, followed by vocational training, counselling and welfare services. The smallest gaps are found for health services, health information, and traditional healer.
Figure 37. Satisfaction with services
0102030405060708090100
Percentage
Gap in services
Gap
0
10
20
30
40
50
60
Percentage
Satisfaction with services
Very satisfied
Satisfied
Neutral
Not satisfied
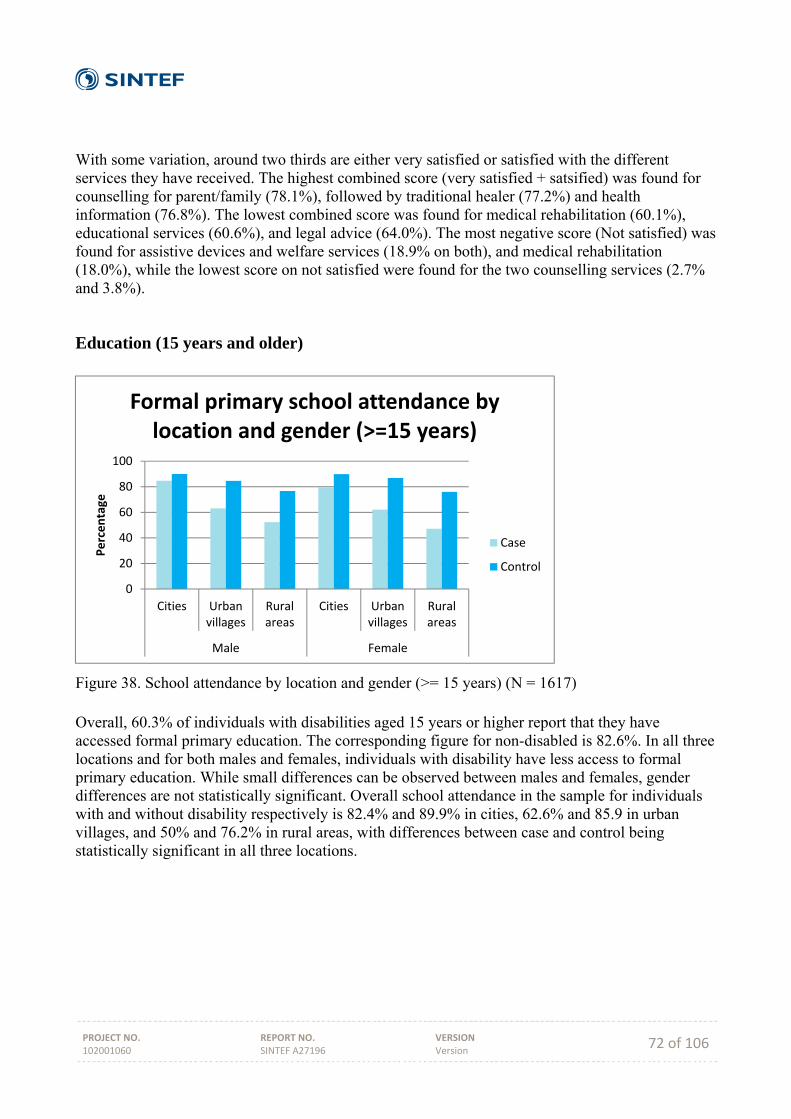
PROJECT NO. 102001060
REPORT NO. SINTEF A27196
VERSION Version 72 of 106
With some variation, around two thirds are either very satisfied or satisfied with the different services they have received. The highest combined score (very satisfied + satsified) was found for counselling for parent/family (78.1%), followed by traditional healer (77.2%) and health information (76.8%). The lowest combined score was found for medical rehabilitation (60.1%), educational services (60.6%), and legal advice (64.0%). The most negative score (Not satisfied) was found for assistive devices and welfare services (18.9% on both), and medical rehabilitation (18.0%), while the lowest score on not satisfied were found for the two counselling services (2.7% and 3.8%).
Education (15 years and older)
Figure 38. School attendance by location and gender (>= 15 years) (N = 1617) Overall, 60.3% of individuals with disabilities aged 15 years or higher report that they have accessed formal primary education. The corresponding figure for non-disabled is 82.6%. In all three locations and for both males and females, individuals with disability have less access to formal primary education. While small differences can be observed between males and females, gender differences are not statistically significant. Overall school attendance in the sample for individuals with and without disability respectively is 82.4% and 89.9% in cities, 62.6% and 85.9 in urban villages, and 50% and 76.2% in rural areas, with differences between case and control being statistically significant in all three locations.
0
20
40
60
80
100
Cities Urbanvillages
Ruralareas
Cities Urbanvillages
Ruralareas
Male Female
Percentage
Formal primary school attendance by location and gender (>=15 years)
Case
Control
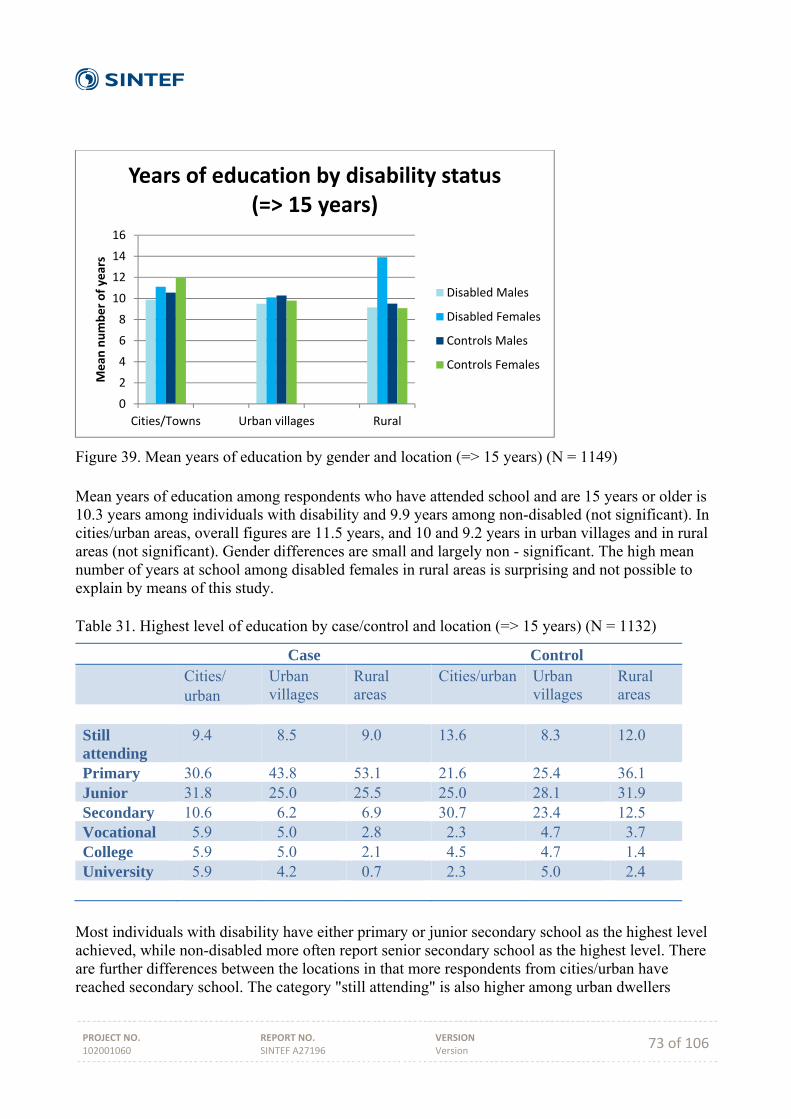
PROJECT NO. 102001060
REPORT NO. SINTEF A27196
VERSION Version 73 of 106
Figure 39. Mean years of education by gender and location (=> 15 years) (N = 1149) Mean years of education among respondents who have attended school and are 15 years or older is 10.3 years among individuals with disability and 9.9 years among non-disabled (not significant). In cities/urban areas, overall figures are 11.5 years, and 10 and 9.2 years in urban villages and in rural areas (not significant). Gender differences are small and largely non - significant. The high mean number of years at school among disabled females in rural areas is surprising and not possible to explain by means of this study. Table 31. Highest level of education by case/control and location (=> 15 years) (N = 1132)
Case Control Cities/
urban Urban villages
Rural areas
Cities/urban Urban villages
Rural areas
Still attending
9.4 8.5 9.0 13.6 8.3 12.0
Primary 30.6 43.8 53.1 21.6 25.4 36.1 Junior 31.8 25.0 25.5 25.0 28.1 31.9 Secondary 10.6 6.2 6.9 30.7 23.4 12.5 Vocational 5.9 5.0 2.8 2.3 4.7 3.7 College 5.9 5.0 2.1 4.5 4.7 1.4 University 5.9 4.2 0.7 2.3 5.0 2.4
Most individuals with disability have either primary or junior secondary school as the highest level achieved, while non-disabled more often report senior secondary school as the highest level. There are further differences between the locations in that more respondents from cities/urban have reached secondary school. The category "still attending" is also higher among urban dwellers
0
2
4
6
8
10
12
14
16
Cities/Towns Urban villages Rural
Mean
number of years
Years of education by disability status (=> 15 years)
Disabled Males
Disabled Females
Controls Males
Controls Females
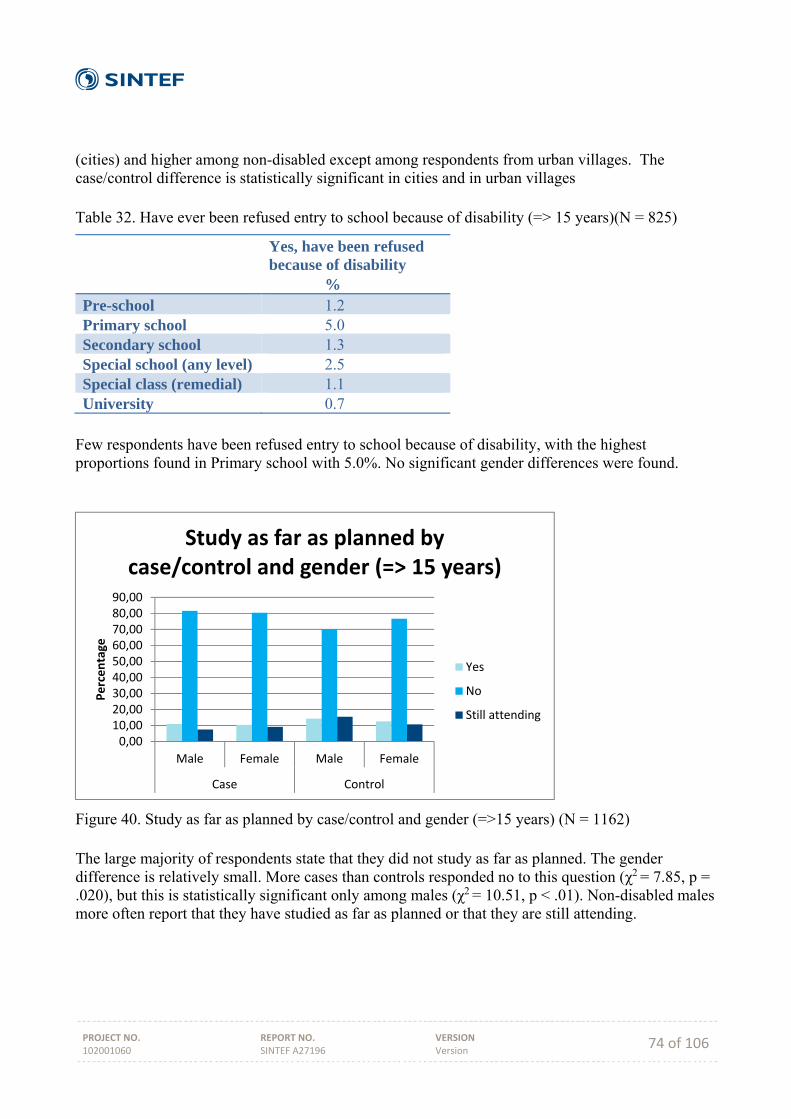
PROJECT NO. 102001060
REPORT NO. SINTEF A27196
VERSION Version 74 of 106
(cities) and higher among non-disabled except among respondents from urban villages. The case/control difference is statistically significant in cities and in urban villages Table 32. Have ever been refused entry to school because of disability (=> 15 years)(N = 825)
Yes, have been refused because of disability %
Pre-school 1.2 Primary school 5.0 Secondary school 1.3 Special school (any level) 2.5 Special class (remedial) 1.1 University 0.7
Few respondents have been refused entry to school because of disability, with the highest proportions found in Primary school with 5.0%. No significant gender differences were found.
Figure 40. Study as far as planned by case/control and gender (=>15 years) (N = 1162) The large majority of respondents state that they did not study as far as planned. The gender difference is relatively small. More cases than controls responded no to this question (χ2 = 7.85, p = .020), but this is statistically significant only among males (χ2 = 10.51, p < .01). Non-disabled males more often report that they have studied as far as planned or that they are still attending.
0,0010,0020,0030,0040,0050,0060,0070,0080,0090,00
Male Female Male Female
Case Control
Percentage
Study as far as planned by case/control and gender (=> 15 years)
Yes
No
Still attending

PROJECT NO. 102001060
REPORT NO. SINTEF A27196
VERSION Version 75 of 106
Figure 41. Study as far as planned by case/control and location (=> 15 years) (N = 1179) The additional (to Figure 40) information in Figure 41 is that more individuals with disabilities report that they did not study as far as planned within each of the location types. The difference is however significant only when comparing all cases and controls (χ2 = 7.68, p < .05) and among rural respondents (χ2 = 7,07, p < .05).
Employment and income
Figure 42. Work status by case/control and gender (>= 15 years) (N = 1615)
0,0010,0020,0030,0040,0050,0060,0070,0080,0090,00
Cities Urbanvillages
Rural Cities Urbanvillages
Rural
Case Control
Percentage
Study as far as planned by case/control and location (=> 15 years)
Yes
No
Still attending
0
10
20
30
40
50
60
Yes, curren
tly working
No, but have been
employed before
No, never been
emlpoyed
Homem
aker
Yes, curren
tly working
No, but have been
employed before
No, never been
employed
Homem
aker
Case Control
Percentage
Work status by case/control and gender (=> 15 years)
Male
Female
PROJECT NO. 102001060
REPORT NO. SINTEF A27196
VERSION Version 76 of 106
More controls than cases state that they are currently working (32.9% and 14.7% respectively), and more males with disability have previously been employed as compared to non-disabled males (42.7% and 29.6% respectively). More cases than controls have never been employed (46.9% and 35.5% respectively). The case/control difference is highly significant (χ2 = 81.41, p < .001), and for both males (χ2 = 60.75, p < .001) and females (χ2 = 35.50, p < .001). Figure 42 shows a clear tendency for individuals with disability to be less included in the labor market. Likewise, there is a significant gender difference in that females are less included in working life than males (χ2 = 35.72, p < .001), and for both individuals with and without disability (χ2 = 31.66, p < .001 and χ2 = 16.96, p < .01 respectively). Table 33. Regular current income per month (BWP)
Mean income N F p Case Control
339 1727.11 2813,30
5.03 < .05
Case Males Females
107 2034,71 1168.57
2.49 n.s.
Control Males Females
232 3594.31 2121.19
5.93 < .05
Case Cities Urban villages Rural
109 2078.67 2175.88 681.09
3.41 < .05
Control Cities Urban villages Rural
233 2232.74 3352.29 2086.19
2.01 n.s.
Respondents were asked about their regular current income. Among those relatively few with a regular income, individuals with disability stated significantly less income than non-disabled; mean income among individuals with disability is 60% of mean income for non-disabled. Males stated higher income than females, but the difference was only significant among controls, where females reported around 60% of mean income among males. The relative gender difference in mean income is even larger among individuals with disability, but lower N impacts on the level of significance. The mean income difference reflects socio-economic differences primarily between the two urban locations and rural areas. Among cases, mean income among rural respondents is less than a third of mean income among respondents from urban villages, while the difference among controls is smaller.
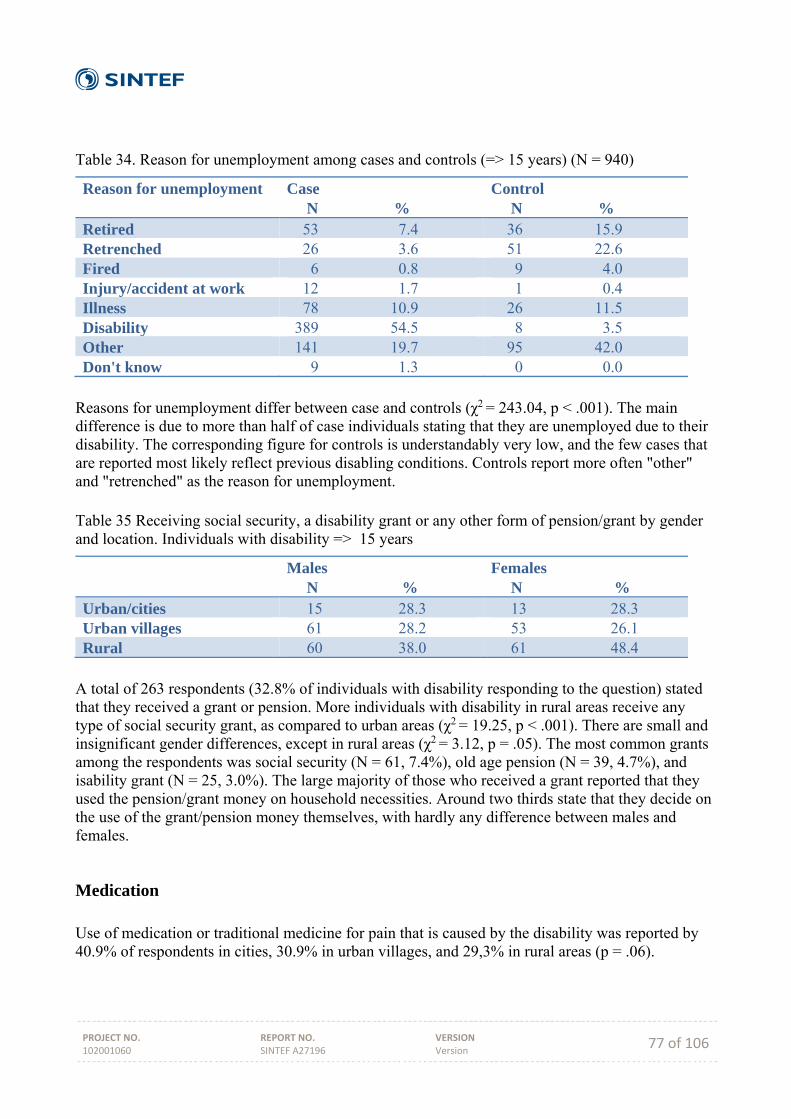
PROJECT NO. 102001060
REPORT NO. SINTEF A27196
VERSION Version 77 of 106
Table 34. Reason for unemployment among cases and controls (=> 15 years) (N = 940)
Reason for unemployment Case N %
Control N %
Retired 53 7.4 36 15.9 Retrenched 26 3.6 51 22.6 Fired 6 0.8 9 4.0 Injury/accident at work 12 1.7 1 0.4 Illness 78 10.9 26 11.5 Disability 389 54.5 8 3.5 Other 141 19.7 95 42.0 Don't know 9 1.3 0 0.0
Reasons for unemployment differ between case and controls (χ2 = 243.04, p < .001). The main difference is due to more than half of case individuals stating that they are unemployed due to their disability. The corresponding figure for controls is understandably very low, and the few cases that are reported most likely reflect previous disabling conditions. Controls report more often "other" and "retrenched" as the reason for unemployment. Table 35 Receiving social security, a disability grant or any other form of pension/grant by gender and location. Individuals with disability => 15 years
Males N %
Females N %
Urban/cities 15 28.3 13 28.3 Urban villages 61 28.2 53 26.1 Rural 60 38.0 61 48.4
A total of 263 respondents (32.8% of individuals with disability responding to the question) stated that they received a grant or pension. More individuals with disability in rural areas receive any type of social security grant, as compared to urban areas (χ2 = 19.25, p < .001). There are small and insignificant gender differences, except in rural areas (χ2 = 3.12, p = .05). The most common grants among the respondents was social security (N = 61, 7.4%), old age pension (N = 39, 4.7%), and isability grant (N = 25, 3.0%). The large majority of those who received a grant reported that they used the pension/grant money on household necessities. Around two thirds state that they decide on the use of the grant/pension money themselves, with hardly any difference between males and females.
Medication Use of medication or traditional medicine for pain that is caused by the disability was reported by 40.9% of respondents in cities, 30.9% in urban villages, and 29,3% in rural areas (p = .06).
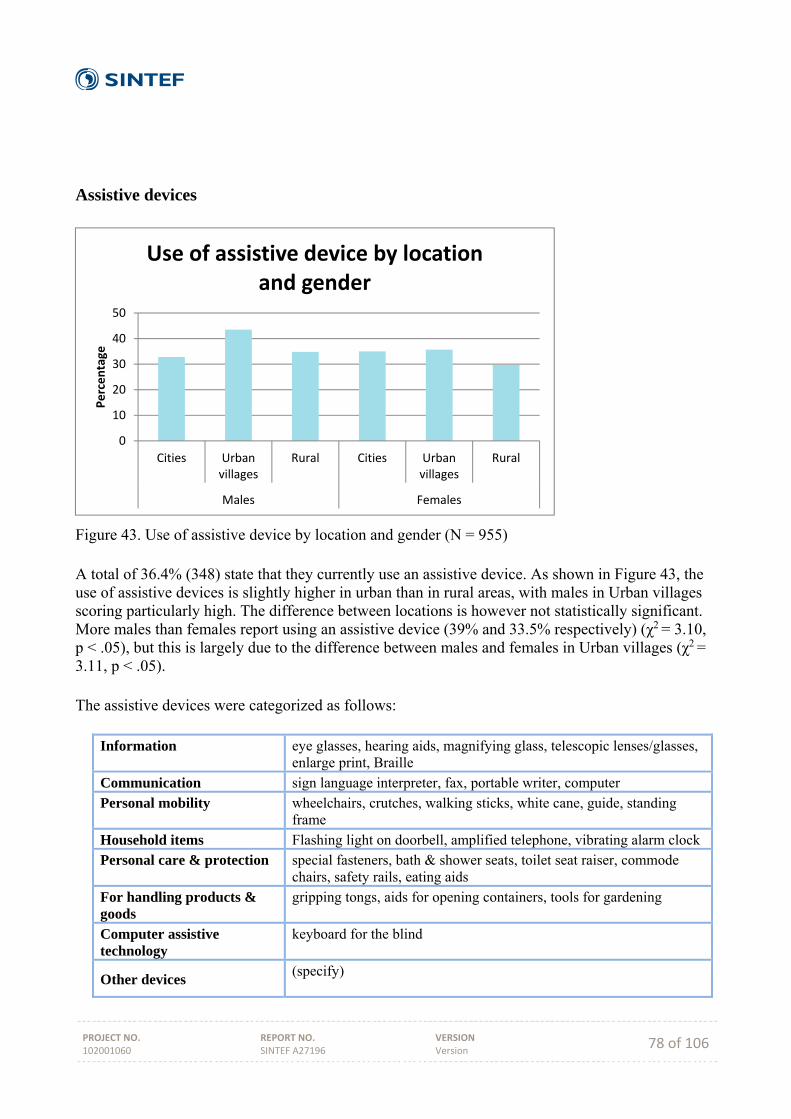
PROJECT NO. 102001060
REPORT NO. SINTEF A27196
VERSION Version 78 of 106
Assistive devices
Figure 43. Use of assistive device by location and gender (N = 955) A total of 36.4% (348) state that they currently use an assistive device. As shown in Figure 43, the use of assistive devices is slightly higher in urban than in rural areas, with males in Urban villages scoring particularly high. The difference between locations is however not statistically significant. More males than females report using an assistive device (39% and 33.5% respectively) (χ2 = 3.10, p < .05), but this is largely due to the difference between males and females in Urban villages (χ2 = 3.11, p < .05). The assistive devices were categorized as follows:
Information eye glasses, hearing aids, magnifying glass, telescopic lenses/glasses, enlarge print, Braille
Communication sign language interpreter, fax, portable writer, computer
Personal mobility wheelchairs, crutches, walking sticks, white cane, guide, standing frame
Household items Flashing light on doorbell, amplified telephone, vibrating alarm clock Personal care & protection special fasteners, bath & shower seats, toilet seat raiser, commode
chairs, safety rails, eating aids
For handling products & goods
gripping tongs, aids for opening containers, tools for gardening
Computer assistive technology
keyboard for the blind
Other devices (specify)
0
10
20
30
40
50
Cities Urbanvillages
Rural Cities Urbanvillages
Rural
Males Females
Percentage
Use of assistive device by location and gender
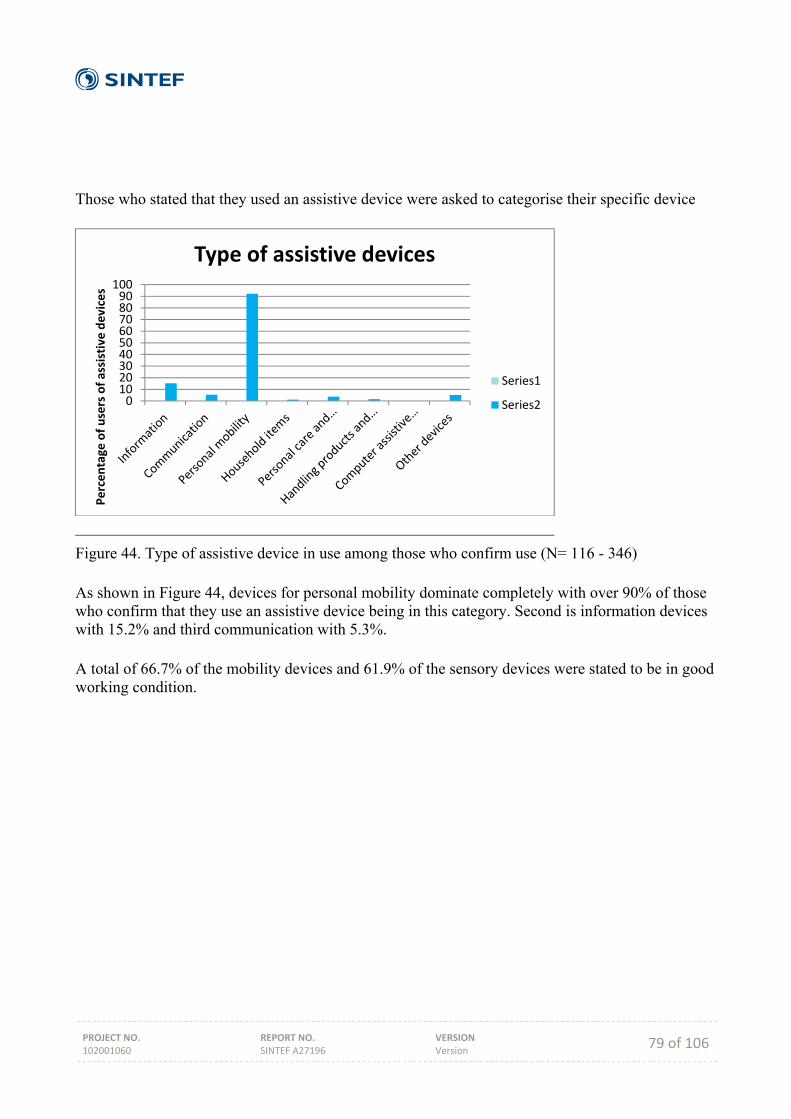
PROJECT NO. 102001060
REPORT NO. SINTEF A27196
VERSION Version 79 of 106
Those who stated that they used an assistive device were asked to categorise their specific device
____________________________________________________________
Figure 44. Type of assistive device in use among those who confirm use (N= 116 - 346) As shown in Figure 44, devices for personal mobility dominate completely with over 90% of those who confirm that they use an assistive device being in this category. Second is information devices with 15.2% and third communication with 5.3%. A total of 66.7% of the mobility devices and 61.9% of the sensory devices were stated to be in good working condition.
0102030405060708090100
Percentage
of users of assistive devices
Type of assistive devices
Series1
Series2
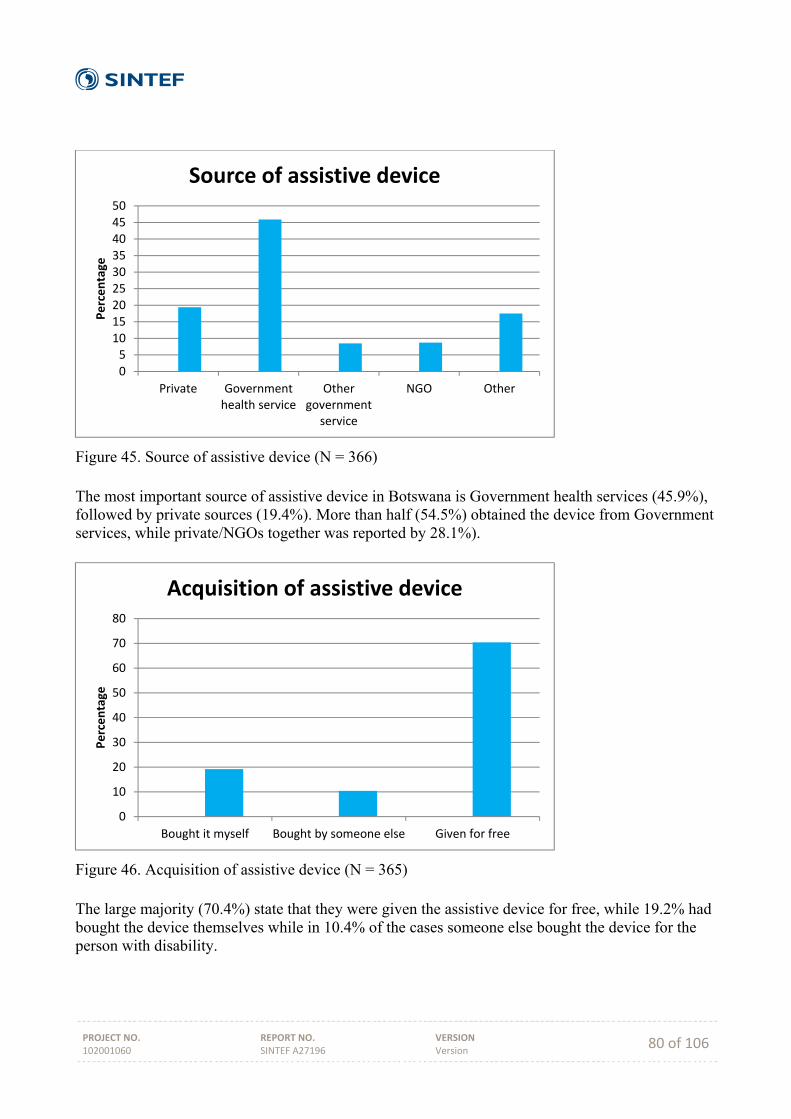
PROJECT NO. 102001060
REPORT NO. SINTEF A27196
VERSION Version 80 of 106
Figure 45. Source of assistive device (N = 366) The most important source of assistive device in Botswana is Government health services (45.9%), followed by private sources (19.4%). More than half (54.5%) obtained the device from Government services, while private/NGOs together was reported by 28.1%).
Figure 46. Acquisition of assistive device (N = 365) The large majority (70.4%) state that they were given the assistive device for free, while 19.2% had bought the device themselves while in 10.4% of the cases someone else bought the device for the person with disability.
05101520253035404550
Private Governmenthealth service
Othergovernment
service
NGO Other
Percentage
Source of assistive device
0
10
20
30
40
50
60
70
80
Bought it myself Bought by someone else Given for free
Percentage
Acquisition of assistive device

PROJECT NO. 102001060
REPORT NO. SINTEF A27196
VERSION Version 81 of 106
Figure 47. Maintenance of assistive device (N = 363) The most common answer to the question about maintenance is that the device is not maintained (40.0%). This is followed by Government (22.4%), self (18.7%), and family (9.4%).
Figure 48. Information on how to use the device (N = 364) Approximately half (49.5%) of the respondents report that they have received complete information on how to use their device. Around one fifth (20.6%) have received no information what so ever, while 30% have received some information.
05
1015202530354045
Maintenance of assistive device
0
10
20
30
40
50
60
Complete information Some information No information
Percentage
Information on how to use the assistive device
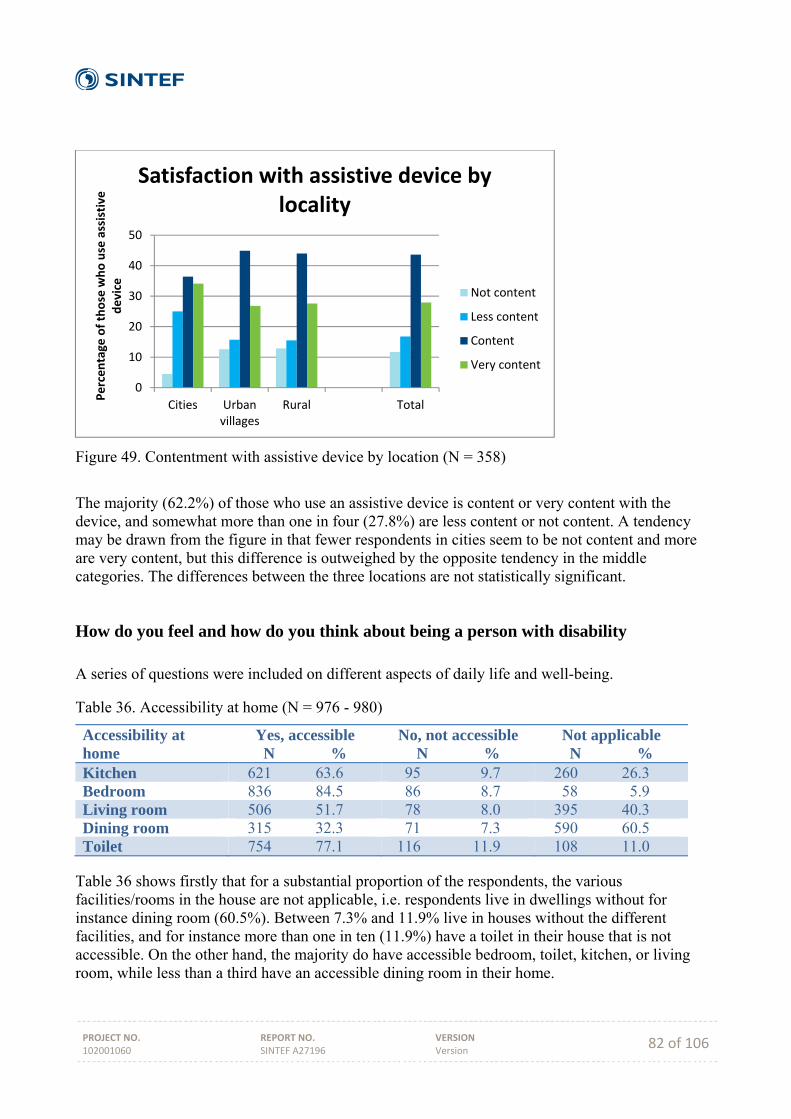
PROJECT NO. 102001060
REPORT NO. SINTEF A27196
VERSION Version 82 of 106
Figure 49. Contentment with assistive device by location (N = 358)
The majority (62.2%) of those who use an assistive device is content or very content with the device, and somewhat more than one in four (27.8%) are less content or not content. A tendency may be drawn from the figure in that fewer respondents in cities seem to be not content and more are very content, but this difference is outweighed by the opposite tendency in the middle categories. The differences between the three locations are not statistically significant.
How do you feel and how do you think about being a person with disability A series of questions were included on different aspects of daily life and well-being.
Table 36. Accessibility at home (N = 976 - 980)
Accessibility at home
Yes, accessible N %
No, not accessible N %
Not applicable N %
Kitchen 621 63.6 95 9.7 260 26.3 Bedroom 836 84.5 86 8.7 58 5.9 Living room 506 51.7 78 8.0 395 40.3 Dining room 315 32.3 71 7.3 590 60.5 Toilet 754 77.1 116 11.9 108 11.0
Table 36 shows firstly that for a substantial proportion of the respondents, the various facilities/rooms in the house are not applicable, i.e. respondents live in dwellings without for instance dining room (60.5%). Between 7.3% and 11.9% live in houses without the different facilities, and for instance more than one in ten (11.9%) have a toilet in their house that is not accessible. On the other hand, the majority do have accessible bedroom, toilet, kitchen, or living room, while less than a third have an accessible dining room in their home.
0
10
20
30
40
50
Cities Urbanvillages
Rural Total
Percentage
of those who use assistive
device
Satisfaction with assistive device by locality
Not content
Less content
Content
Very content
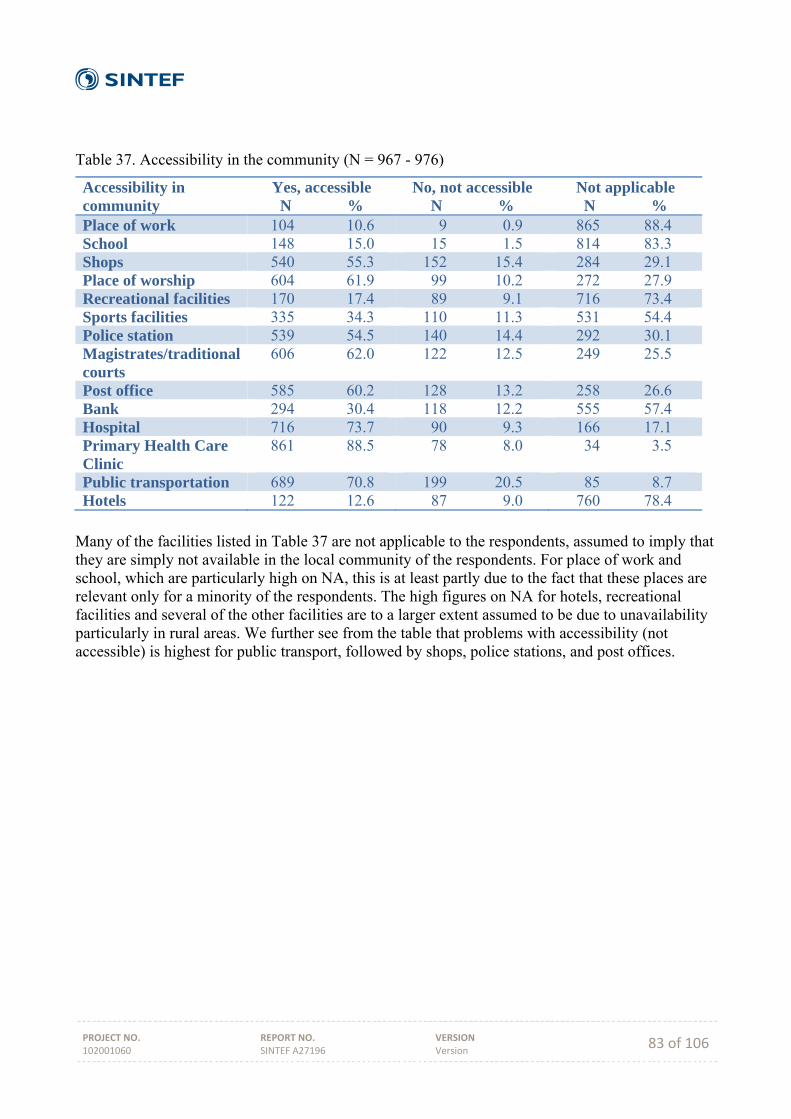
PROJECT NO. 102001060
REPORT NO. SINTEF A27196
VERSION Version 83 of 106
Table 37. Accessibility in the community (N = 967 - 976)
Accessibility in community
Yes, accessible N %
No, not accessible N %
Not applicable N %
Place of work 104 10.6 9 0.9 865 88.4 School 148 15.0 15 1.5 814 83.3 Shops 540 55.3 152 15.4 284 29.1 Place of worship 604 61.9 99 10.2 272 27.9 Recreational facilities 170 17.4 89 9.1 716 73.4 Sports facilities 335 34.3 110 11.3 531 54.4 Police station 539 54.5 140 14.4 292 30.1 Magistrates/traditional courts
606 62.0 122 12.5 249 25.5
Post office 585 60.2 128 13.2 258 26.6 Bank 294 30.4 118 12.2 555 57.4 Hospital 716 73.7 90 9.3 166 17.1 Primary Health Care Clinic
861 88.5 78 8.0 34 3.5
Public transportation 689 70.8 199 20.5 85 8.7 Hotels 122 12.6 87 9.0 760 78.4
Many of the facilities listed in Table 37 are not applicable to the respondents, assumed to imply that they are simply not available in the local community of the respondents. For place of work and school, which are particularly high on NA, this is at least partly due to the fact that these places are relevant only for a minority of the respondents. The high figures on NA for hotels, recreational facilities and several of the other facilities are to a larger extent assumed to be due to unavailability particularly in rural areas. We further see from the table that problems with accessibility (not accessible) is highest for public transport, followed by shops, police stations, and post offices.
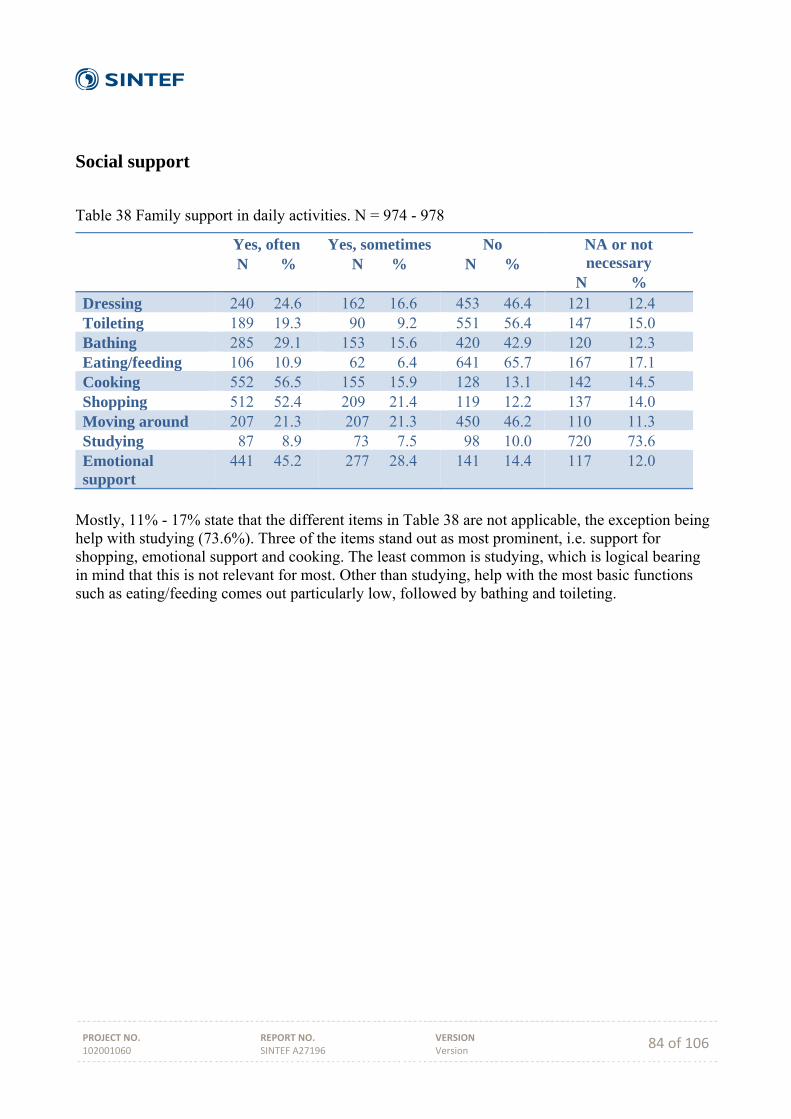
PROJECT NO. 102001060
REPORT NO. SINTEF A27196
VERSION Version 84 of 106
Social support
Table 38 Family support in daily activities. N = 974 - 978
Yes, often N %
Yes, sometimes N %
No N %
NA or not necessary
N % Dressing 240 24.6 162 16.6 453 46.4 121 12.4 Toileting 189 19.3 90 9.2 551 56.4 147 15.0 Bathing 285 29.1 153 15.6 420 42.9 120 12.3 Eating/feeding 106 10.9 62 6.4 641 65.7 167 17.1 Cooking 552 56.5 155 15.9 128 13.1 142 14.5 Shopping 512 52.4 209 21.4 119 12.2 137 14.0 Moving around 207 21.3 207 21.3 450 46.2 110 11.3 Studying 87 8.9 73 7.5 98 10.0 720 73.6 Emotional support
441 45.2 277 28.4 141 14.4 117 12.0
Mostly, 11% - 17% state that the different items in Table 38 are not applicable, the exception being help with studying (73.6%). Three of the items stand out as most prominent, i.e. support for shopping, emotional support and cooking. The least common is studying, which is logical bearing in mind that this is not relevant for most. Other than studying, help with the most basic functions such as eating/feeding comes out particularly low, followed by bathing and toileting.
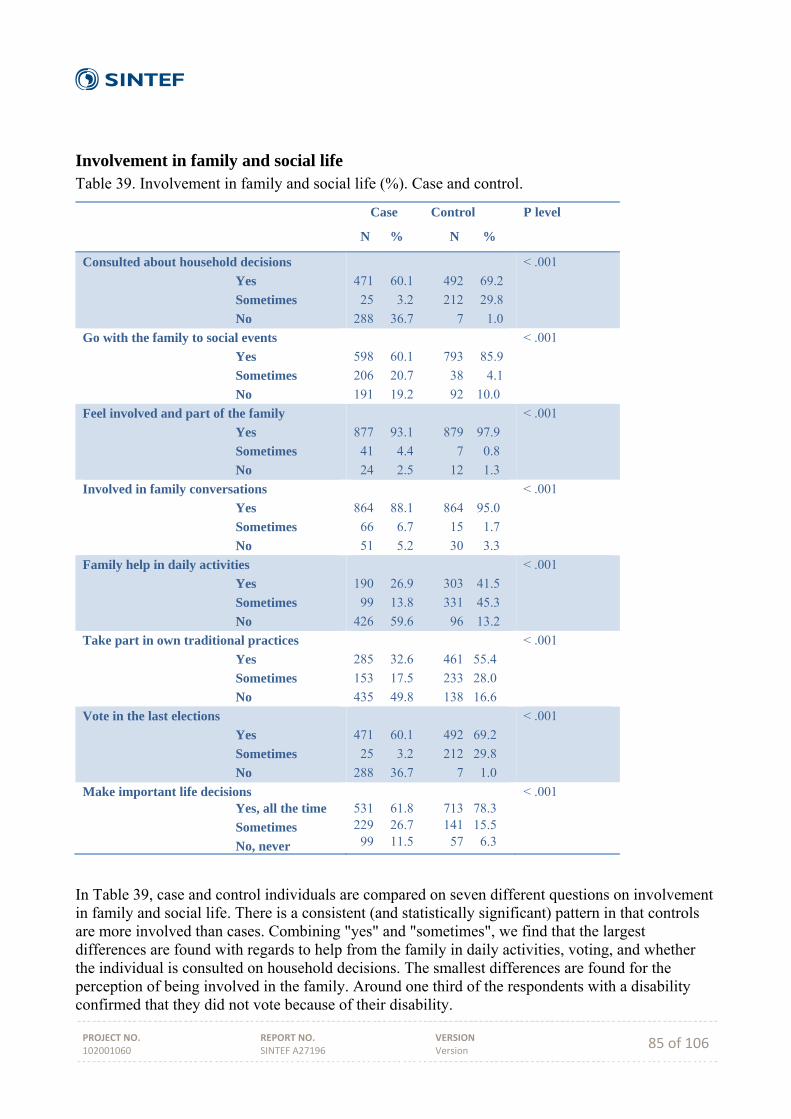
PROJECT NO. 102001060
REPORT NO. SINTEF A27196
VERSION Version 85 of 106
Involvement in family and social life Table 39. Involvement in family and social life (%). Case and control.
Case Control
N % N %
P level
Consulted about household decisions
Yes
Sometimes
No
471 60.1 492 69.2
25 3.2 212 29.8
288 36.7 7 1.0
< .001
Go with the family to social events
Yes
Sometimes
No
598 60.1 793 85.9
206 20.7 38 4.1
191 19.2 92 10.0
< .001
Feel involved and part of the family
Yes
Sometimes
No
877 93.1 879 97.9
41 4.4 7 0.8
24 2.5 12 1.3
< .001
Involved in family conversations
Yes
Sometimes
No
864 88.1 864 95.0
66 6.7 15 1.7
51 5.2 30 3.3
< .001
Family help in daily activities
Yes
Sometimes
No
190 26.9 303 41.5
99 13.8 331 45.3
426 59.6 96 13.2
< .001
Take part in own traditional practices
Yes
Sometimes
No
285 32.6 461 55.4
153 17.5 233 28.0
435 49.8 138 16.6
< .001
Vote in the last elections
Yes
Sometimes
No
471 60.1 492 69.2
25 3.2 212 29.8
288 36.7 7 1.0
< .001
Make important life decisions Yes, all the time
Sometimes
No, never
531 61.8 713 78.3 229 26.7 141 15.5 99 11.5 57 6.3
< .001
In Table 39, case and control individuals are compared on seven different questions on involvement in family and social life. There is a consistent (and statistically significant) pattern in that controls are more involved than cases. Combining "yes" and "sometimes", we find that the largest differences are found with regards to help from the family in daily activities, voting, and whether the individual is consulted on household decisions. The smallest differences are found for the perception of being involved in the family. Around one third of the respondents with a disability confirmed that they did not vote because of their disability.
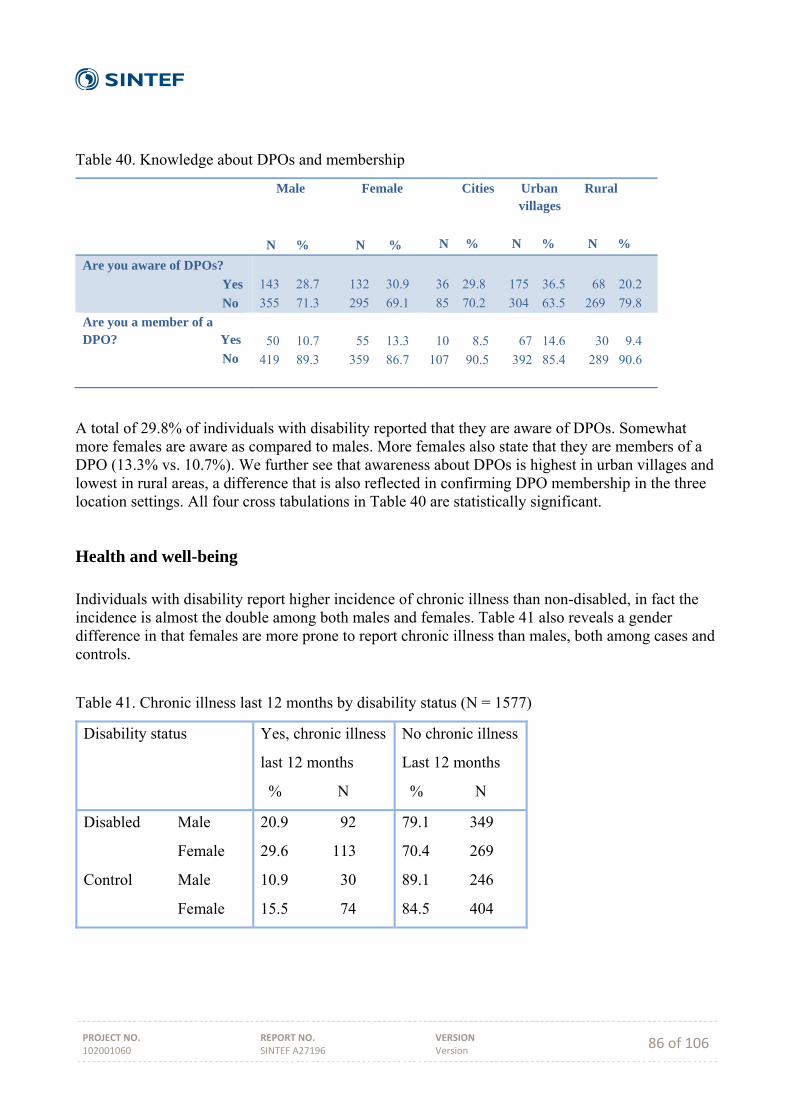
PROJECT NO. 102001060
REPORT NO. SINTEF A27196
VERSION Version 86 of 106
Table 40. Knowledge about DPOs and membership
Male Female
N % N %
Cities Urban Rural villages
N % N % N %
Are you aware of DPOs?
Yes
No
143 28.7 132 30.9
355 71.3 295 69.1
36 29.8 175 36.5 68 20.2
85 70.2 304 63.5 269 79.8
Are you a member of a DPO? Yes
No
50 10.7 55 13.3
419 89.3 359 86.7
10 8.5 67 14.6 30 9.4
107 90.5 392 85.4 289 90.6
A total of 29.8% of individuals with disability reported that they are aware of DPOs. Somewhat more females are aware as compared to males. More females also state that they are members of a DPO (13.3% vs. 10.7%). We further see that awareness about DPOs is highest in urban villages and lowest in rural areas, a difference that is also reflected in confirming DPO membership in the three location settings. All four cross tabulations in Table 40 are statistically significant.
Health and well-being Individuals with disability report higher incidence of chronic illness than non-disabled, in fact the incidence is almost the double among both males and females. Table 41 also reveals a gender difference in that females are more prone to report chronic illness than males, both among cases and controls.
Table 41. Chronic illness last 12 months by disability status (N = 1577)
Disability status Yes, chronic illness
last 12 months
% N
No chronic illness
Last 12 months
% N
Disabled Male
Female
Control Male
Female
20.9 92
29.6 113
10.9 30
15.5 74
79.1 349
70.4 269
89.1 246
84.5 404
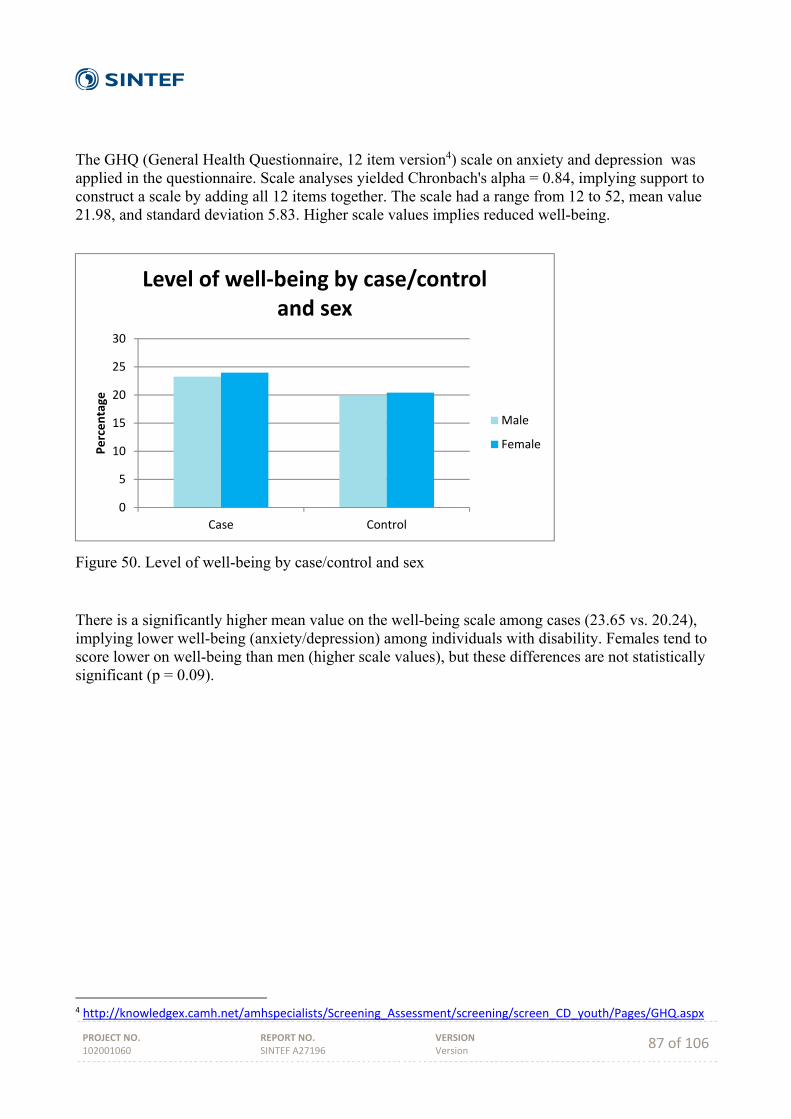
PROJECT NO. 102001060
REPORT NO. SINTEF A27196
VERSION Version 87 of 106
The GHQ (General Health Questionnaire, 12 item version4) scale on anxiety and depression was applied in the questionnaire. Scale analyses yielded Chronbach's alpha = 0.84, implying support to construct a scale by adding all 12 items together. The scale had a range from 12 to 52, mean value 21.98, and standard deviation 5.83. Higher scale values implies reduced well-being.
Figure 50. Level of well-being by case/control and sex
There is a significantly higher mean value on the well-being scale among cases (23.65 vs. 20.24), implying lower well-being (anxiety/depression) among individuals with disability. Females tend to score lower on well-being than men (higher scale values), but these differences are not statistically significant (p = 0.09).
4 http://knowledgex.camh.net/amhspecialists/Screening_Assessment/screening/screen_CD_youth/Pages/GHQ.aspx
0
5
10
15
20
25
30
Case Control
Percentage
Level of well‐being by case/control and sex
Male
Female

PROJECT NO. 102001060
REPORT NO. SINTEF A27196
VERSION Version 88 of 106
Figure 51. General physical health by case/control and sex
Respondents were asked to rate their physical and mental health on a four-point scale. Individuals with disability, both genders, score higher on poor or nor very good and lower on good and very good physical health than non-disabled (controls). For instance, 35.5% of cases (both genders) report poor or not very good health, while the same figures for controls are considerably lower (12.2%).
Figure 52. General mental health by case/control and sex
The same pattern appears with regards to mental health as shown in the figure above for physical health. Individuals with disability, both genders, score higher on poor or nor very good and lower on good and very good mental health than non-disabled (controls). For instance, 29.7 of cases (both
0
10
20
30
40
50
60
Poor Not verygood
Good Very good
Percentage
General physical health by case/control and sex
Case Male
Case Female
Control Male
Control Female
0
10
20
30
40
50
60
Poor Not verygood
Good Very good
Percentage
General mental health by case/control and sex
Case Male
Case Female
Control Male
Control Female
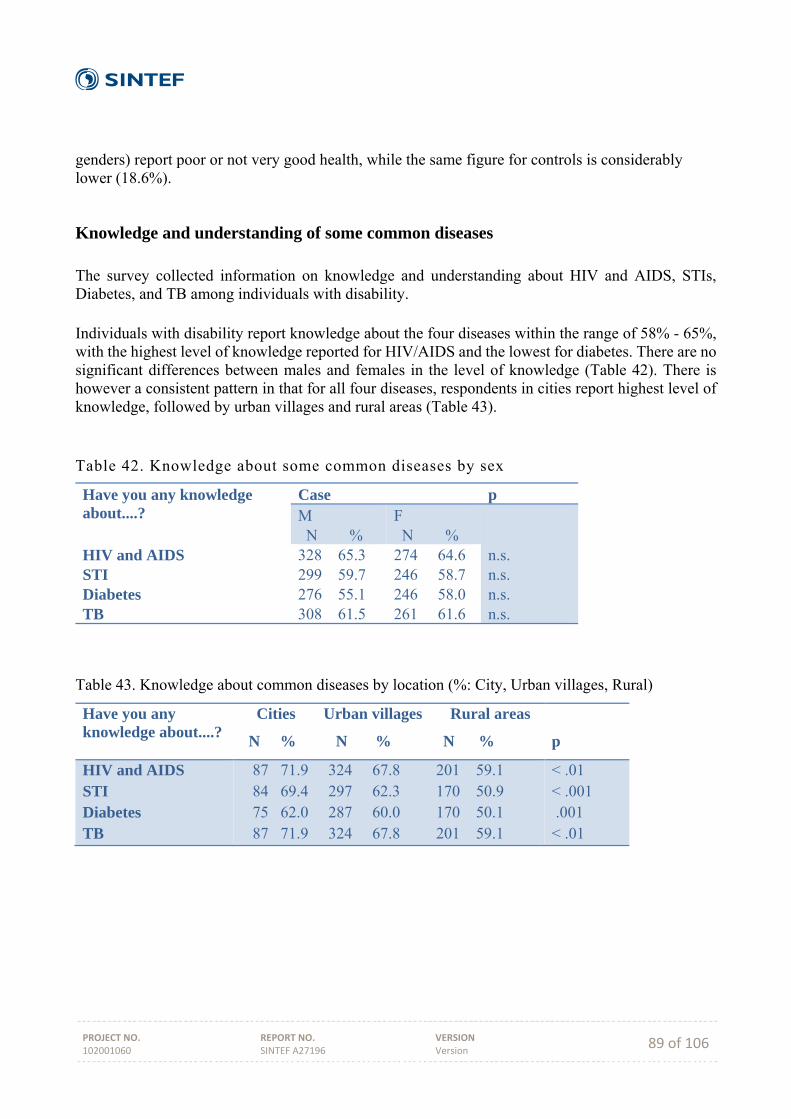
PROJECT NO. 102001060
REPORT NO. SINTEF A27196
VERSION Version 89 of 106
genders) report poor or not very good health, while the same figure for controls is considerably lower (18.6%).
Knowledge and understanding of some common diseases The survey collected information on knowledge and understanding about HIV and AIDS, STIs, Diabetes, and TB among individuals with disability. Individuals with disability report knowledge about the four diseases within the range of 58% - 65%, with the highest level of knowledge reported for HIV/AIDS and the lowest for diabetes. There are no significant differences between males and females in the level of knowledge (Table 42). There is however a consistent pattern in that for all four diseases, respondents in cities report highest level of knowledge, followed by urban villages and rural areas (Table 43). Table 42. Knowledge about some common diseases by sex
Have you any knowledge about....?
Case p M N %
F N %
n.s. n.s. n.s. n.s.
HIV and AIDS STI Diabetes TB
328 65.3 299 59.7 276 55.1 308 61.5
274 64.6 246 58.7 246 58.0 261 61.6
Table 43. Knowledge about common diseases by location (%: City, Urban villages, Rural)
Have you any knowledge about....?
Cities Urban villages Rural areas
N % N % N %
p
HIV and AIDS STI Diabetes TB
87 71.9 324 67.8 201 59.1 84 69.4 297 62.3 170 50.9 75 62.0 287 60.0 170 50.1 87 71.9 324 67.8 201 59.1
< .01 < .001 .001 < .01

PROJECT NO. 102001060
REPORT NO. SINTEF A27196
VERSION Version 90 of 106
Table 44. Major sources of Information on four common diseases
Source of Information HIV and AIDS STI Diabetes TB
Male Female Male Female Male Female Male Female
Health Clinic School Radio/TV Family Friends Work place Doctor Magazines/newspapers Posters and pamphlets Other
49.4 15.9 19.5 5.2 3.7 1.5 1.8 0.3 2.1 1.3
60.6 13.9 10.9 5.8 0.7 0.4 2.9 2.2 1.1 1.5
48.716.3 17.3 6.3 6.5 2.2 1.8 0.9 0.6 1.2
61.813.4 11.0 5.3 3.7 1.7 2.0 0.7 1.3 2.0
52.315.8 17.6 4.7 3.6 0.7 1.8 0.7 1.1 1.8
59.813.5 11.9 7.8 0.8 0.0 2.9 1.6 0.4 1.2
53.1 15.2 16.8 10.1 4.5 1.0 1.9 0.6 1.0 2.9
60.7 12.2 11.5 7.5 6.9 0.0 3.1 1.9 1.8 1.5
For all four diseases, around 55% of the respondents (males and females combined) get their information from a health clinic (Table 44). School follows as second important sources together with radio/TV, with almost 15% stating these as important sources. Family are reported as a source among 5 – 6 % for three of the diseases and with TB score somewhat higher. Finally, friends are reported as a major source by around 5%. HIV/AIDS stand out as the only disease with significant differences between males and females, in that females more often report health clinic as a source of information, while males report higher figures for radio/TV.
Table 45. Major sources of information on HIV/AIS by location
Source of information Cities Urban Rural villages
Health Clinic School Radio/TV Family Friends Work place Doctor Magazines/newspapers Posters and pamphlets
Other
35.6 54.3 61.7 25.3 12.3 14.9 20.7 19.8 7.5 5.7 4.9 6.0 1.1 2.5 2.5 4.6 0.0 1.0 3.4 2.5 1.5 1.1 0.9 1.5 1.1 0.9 0.5 1.1 1.9 3.0
1 p < .001
With regards to location, table 45 presents the figures for HIV/AIDS. Health clinics are more important as source of information in rural areas, followed by urban villages and lastly cities. Schools are more important in cities, and radio/TV is less important in rural areas as compared to the other location types. The differences between location types are largely the same, with small variations, for the other three diseases.

PROJECT NO. 102001060
REPORT NO. SINTEF A27196
VERSION Version 91 of 106
Table 46. Problems understanding information about diseases by sex
Have you any problems in understanding information about....?
Case p M N %
F N %
n.s. n.s. n.s. n.s.
HIV and AIDS STI Diabetes TB
42 13.0 37 12.4 28 10.1 40 13.0
29 10.7 25 10.2 22 9.1 27 10.4
There are small variations between the four diseases when it comes to problems in obtaining and/or understanding information, ranging from 9.7% (diabetes) to 11.9% (HIV/AIDS). No significant differences between males and females or between location types were found. Table 47. Experience of disease by sex
Have you ever had this disease?
Case p M N %
F N %
.02 n.s. n.s. n.s.
HIV and AIDS STI Diabetes TB
40 12.2 16 5.2 16 5.6 36 11.5
51 18.4 11 4.4 17 6.9 31 11.7
The most prevalent of the four diseases in this data material, bearing in mind that this is based on self-reported information, is HIV (15.1%), followed by TB (11.6%), Diabetes (6.2%), and STI (4.9%) (Table 47). There are small differences between males and females, except for HIV/AIDS where more females report that they have the disease than males. Also between location types no significant differences were found, although HIV/AIDS as well as TB tended to be higher in rural areas and urban villages, and the other way around for diabetes (Table 48).
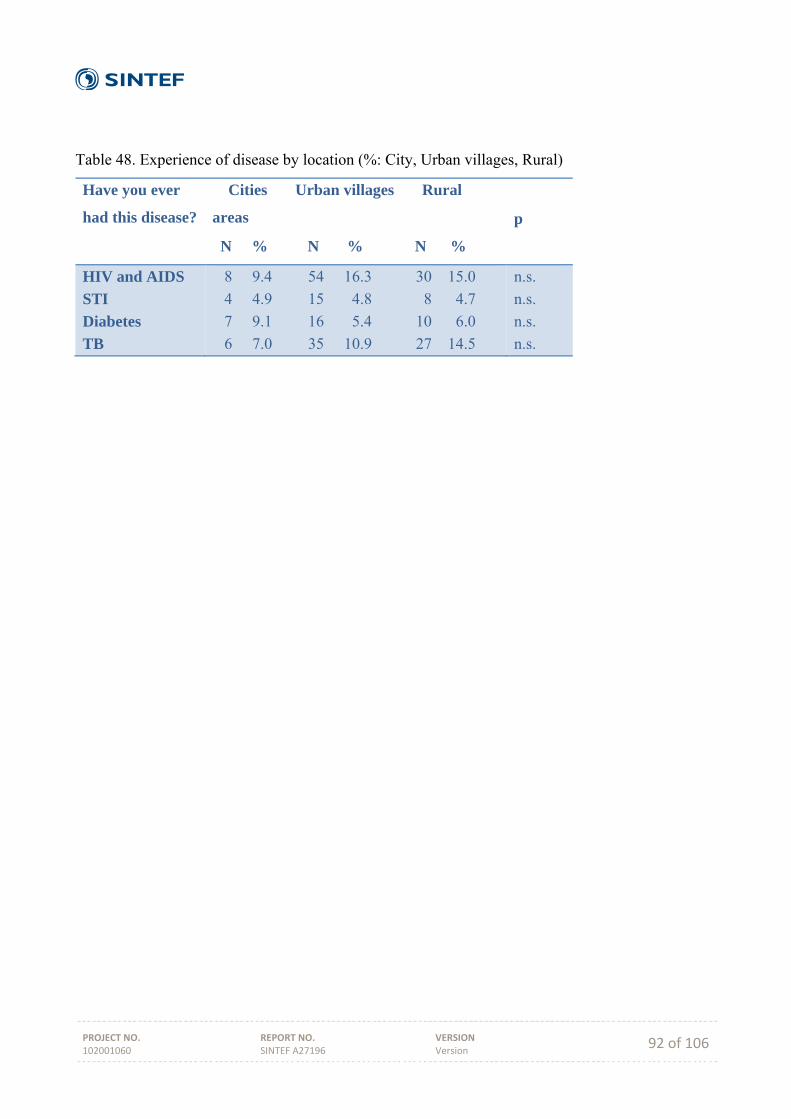
PROJECT NO. 102001060
REPORT NO. SINTEF A27196
VERSION Version 92 of 106
Table 48. Experience of disease by location (%: City, Urban villages, Rural)
Have you ever
had this disease?
Cities Urban villages Rural
areas
N % N % N %
p
HIV and AIDS
STI
Diabetes
TB
8 9.4 54 16.3 30 15.0
4 4.9 15 4.8 8 4.7
7 9.1 16 5.4 10 6.0
6 7.0 35 10.9 27 14.5
n.s.
n.s.
n.s.
n.s.
PROJECT NO. 102001060
REPORT NO. SINTEF A27196
VERSION Version 93 of 106
DISCUSSION
Arne H. Eide
A national, representative study on living conditions among people with disabilities has been carried out in Botswana in 2013 - 2014. This report brings some of the key results from this study. SAFOD, FFO, University of Botswana and SINTEF have, in collaboration with the Office of the President, BOFOD and Statistics Botswana, established the first generation of data about individuals with disabilities and their households in the country. The data base also comprises a sample of non‐disabled, which provides a basis for comparing between disabled and non‐disabled. The study, which follows similar studies in Namibia, Zimbabwe, Malawi, Zambia, Mozambique, Lesotho and Swaziland, adds to a growing body of information on the situation among people with disabilities in the southern Africa region. The regional data base provides opportunities for comparing between countries and across the region and may be a vehicle for sharing of experiences and building capacity in the region to improve the situation for people with disabilities. The particular way in which this study was organised, including both DPOs (SAFOD and BOFOD) and the Office of the President and Statistics Botswana, implies a good fundament for translating the results into practice. While the strong involvement of the Office of the President may have contributed to less influence of the DPOs in this particular study, this may on the other hand pave the way for a broader alliance in Botswana. It leaves to be seen whether this particular feature of the study can contribute to strengthen the dialogue between DPOs and Government and to improvement in the situation for individuals with disability in the country. Comparing households
An interesting feature of household composition, which has been found also in previous studies, is that households with disabled members tend to be larger than control households and with a higher mean age among the household members. This is of importance as it implies more mouths to feed, more school fees to pay, etc. Four different indicators on standard of living, i.e. a Possession scale, the Dietary diversity scale, a scale on Access to information, and the Dependency ratio, all point in the same direction: control households are better off than case households. This implies higher burdens and less resources among households with disabled members as compared to control households. Bearing in mind the differences in household composition, the real difference between the two household types is in fact underestimated in the household comparisons in this report. Unlike the indicators on resources and burden mentioned above, comparing housing situation and infrastructure revealed marginal differences between the two household types. Thus, all households within a location type share more or less the same standard, and the variation is rather found between locations than within.
PROJECT NO. 102001060
REPORT NO. SINTEF A27196
VERSION Version 94 of 106
Activity limitations/disability
The concept of "activity limitation" as derived from the ICF (WHO 2001) invites an understanding of disability as a broad, continuous phenomenon of relevance for all. The profile of activity limitations in the current study does not deviate much from previous studies, with mobility as the most prevalent difficulty. The study applied a screening procedure that was "stricter" than in previous living conditions studies carried out by SAFOD/SINTEF and partners in the region (higher threshold on WG6 to be identified as being disabled). This has had some influence on results and an underestimation of number of persons with disabilities when compared to a broader screening procedure. The results on disability onset reveal firstly that disability is age related, i.e. increasing disability with increasing age. This is as expected and part of natural development, but is clearly also an indication of need for intervention among the older age groups. It is however the relatively high incidence of early onset, i.e. among children, that gives reason for concern. This is further emphasized by the perceived causes of disability, strongly dominated by "by birth/congenital" and "disease/illness. These findings have to be taken as indicating access and/or quality problems in prenatal and perinatal care for mother and child and should be an area of intervention, and also a need for further studies in order to reveal more detailed knowledge on causes and critical factors. There is good reason to assume that a substantial proportion of child disability in Botswana as in the other countries in the Region is preventable.
Violence and abuse
A small proportion of the respondents (1 - 2%) have stated violence as the cause of their disability, increasing somewhat (with around 1%) if witchcraft is also included under violence. The figures are however considerably higher when asking for experiences of violence because of disability, up to around 14%, and to 8% if only including violence within households. This is slightly lower than for instance found in Swaziland. More females reported experience of being beaten or scolded than males. Any experiences of being beaten, scolded or discriminated are unacceptable and a violation of human rights, and even though these figures cannot be perceived as dramatically high, they do indicate that many individuals with disability suffer under unacceptable treatment in their social environment. Bearing in mind the sensitivity of these questions and the context of the survey (household data collection), it is however likely that violence is somewhat underreported.
Health, well-being and health information
The comparison between case and controls with regards to chronic illness reveals a substantial difference with much higher incidence of chronic illness among cases. This is as expected, and although disability is created in the exchange between the individual and his/her social and physical surroundings, health is still an important explanatory component for disability within the ICF framework. The relationship between health and disability is confirmed by both the household level and the individual level data, with lower levels of well-being, physical and mental health as assessed by the individuals with disability themselves. At the same time, the study has revealed that a large proportion of individuals with disability have no or limited knowledge and information about
PROJECT NO. 102001060
REPORT NO. SINTEF A27196
VERSION Version 95 of 106
common diseases and that some have problems understanding information given to them about these common diseases. This is clearly serious both in a preventive and treatment perspective and may indicate that vulnerable groups are not sufficiently targeted by prevention efforts. While this study does not have comparable data on disease knowledge from non-disabled, other similar studies have previously shown that the knowledge gap is smaller among non-disabled. Health clinics, schools, and media (radio/TV) are the major sources of information for all four diseases included, thus also indicating where improvements may be most effective. Access problems and limited information may be regarded as barriers, and in particular for individuals with disability. Addressing health and disability is thus about more than the health service itself - additionally it is also about information and knowledge and securing that tailor made information is provided to individuals and groups that are harder to reach than the general population and that easily get sidelined. An information/ knowledge gap among individuals with disability also requires consciousness-raising among health workers and particular strategies to ensure inclusion of individuals with disability. Individuals with disability have higher levels of anxiety and depression than non-disabled, and they rate both their physical and mental health lower. This is of importance as the status of being disabled may easily shadow for health problems. It is a prerequisite for equitable health services that service providers are conscious about the double burden of many individuals with disability, i.e. poorer mental and physical health in addition to the impairment/disability. Services
While there are indications of quality problems in health care for children and mothers (above), access seems to be largely in place. Further, satisfaction with health services is somewhat higher than the average of the included services. The latter may of course be closely linked to high access, i.e. individuals are simply happy that they at least are attended to by a health worker and may have limited ability to assess the quality. While the gap (between needed and received services) is low for health services, it is particularly high for legal advice, vocational training, counseling and welfare services - and relatively high also for medical rehabilitation, assistive devices and educational services. Considering that many will need and can profit from these services, the results clearly indicate that the current specter of basic services is not sufficient to cater for the needs of individuals with disability. This must be assumed to impact on the inclusion of individuals with disability in society and an evident area for improvements. This may partly be a capacity problem and partly a matter of exclusion. Further research will be necessary to reveal this. While respondents generally seem to be satisfied with the services they have received, there are nevertheless some indications of quality problems in that between 10 and 20% are not satisfied with seven of the eleven services included, and even more have a neutral response to this question.
PROJECT NO. 102001060
REPORT NO. SINTEF A27196
VERSION Version 96 of 106
Daily life and social inclusion
The results on accessibility at home reflect the standard of housing which will vary between locations. Many respondents live in traditional houses in rural areas and are thus without separate living rooms, dining rooms etc. While accessibility in the home is a major problem for those who are affected, it is very likely that minor adjustments at a moderate cost could improve accessibility for most. Whereas the large majority of those who had the different facilities in their home did not report any accessibility problems, mapping and adaptation where needed could be carried out by health and rehabilitation services at community level. Also concerning accessibility in the community, many of the facilities mentioned in the questionnaire were not applicable, i.e. assumed not to be available. This again reflects the infrastructure primarily in rural areas. When the different facilities were seen as relevant (i.e. available), the majority reported that they were accessible. Hotels, banks and recreational facilities were least accessible, while least accessibility problems were recorded for workplace, school and primary health clinic. Accessibility problems varied from 8% - 41% for the different facilities, indicating severe problems for many individuals with disability, leading to dependency and lack of inclusion. A mapping exercise of accessibility at public places/buildings/services could be a first step towards reducing such barriers. While many individuals with disability report that the family support them in their daily activities, the study has also revealed that non-disabled individuals receive more help in daily activities than individuals with disability. There is a consistent pattern in that control individuals are more involved than case individuals. For instance, there is a 35 percentage point difference in voting (in the last election, answer categories "yes" and "sometimes" combined), with one third of individuals with disability stating that they did not vote because of their disability. The results clearly indicate inclusion as an area in need of intervention both at family/household and community level. It adds to this that awareness of DPOs and membership in DPOs among individuals with disability is low, leaving the large majority of individuals with disability without this potentially important source of support.
Education
The individual level data in the HH section revealed a substantial difference between individuals with and without disability in school attendance and literacy. The difference in school attendance is more than 20 percentage points. It was further found that in all three locality types, non-disabled reported (somewhat) more years of education, higher school achievement and more often stated that they studied as far as planned. All in all, the results reveal that many individuals with disability are excluded from the education system, and other indicators indicate lower school achievement among individuals with disability although differences are largely relatively small. Supported by the results of the study, the combination of many individuals with disability not accessing school and relatively small differences between school going cases and controls, indicates a selection process whereby the most competent individuals with disability are included and the more severely disabled are excluded from education. This is thus a matter of both ensuring access to education for all and to improve the way students with disability are handled. The study does not reveal the mechanisms whereby individuals with disability are excluded from their right to education. We nevertheless
PROJECT NO. 102001060
REPORT NO. SINTEF A27196
VERSION Version 97 of 106
argue that both competence and attitudes within the school system should be targeted to improve the situation.
Economic activity
The different socio-economic indicators (possession scale, dietary diversity, dependency ratio, access to information, income types) all point in the same direction: control households are in a better economic position than cases, with more secure and stable income. The individual level data (Individual section) reveals that substantially more control individuals are employed, and that more case individuals have previously or never been employed. This is also reflected in the mean salary level which is substantially higher among case individuals. While there are differences in economic activity to the advantage of control households, the large majority of both individuals with and without disability do not have work that gives them regular income. Results on economic activity, however, show clearly that control individuals and households are more integrated into the formal labor market. This must be regarded as the major reason for the economic/SES differences between the two groups (HHs and individuals), and the difference between the groups is exacerbated by the difference in mean number of household members in that case households cater for more people. Assistive devices
A relatively high proportion of the respondents state that they are not satisfied with the assistive device services they have received - almost 30% are either not satisfied or neutral. Still, more than one third of individuals with disability in Botswana use an assistive device, which is high compared to some neighboring countries. This may be due to the sampling strategy used in this study that was stricter (higher threshold) than the other studies that we can compare with. It is likely that the difference between Botswana and for instance Namibia and other countries is overestimated because of this, but that supply of assistive devices still is relatively high. Mobility devices dominate in Botswana as in other countries in the region. While there are private sources, the majority state Government health or other services as the main source, and mostly they had received the device without any cost. The apparent key role of Government as a supplier combined with low/no cost for the users of assistive devices may explain some of the difference in access between Botswana and other countries in the region. Around half of respondents state that the device is not maintained. For the remaining half, the most common is that maintenance is done by Government services, and many do also maintain the device themselves. Around 50% have received complete information on use, with around one third having received no information at all. Mostly, individuals with disability are satisfied with their device, although more than one in four is less content or not content. Summing up, the major difference between Botswana and the other countries in the region is a higher proportion of individuals with disability who state that they use an assistive device, and that Government seems to play a somewhat more central role in service delivery. Still, the study has revealed that the delivery system in Botswana basically has some of the same weaknesses as in other countries in the region concerning fragmentation of supply and services.
PROJECT NO. 102001060
REPORT NO. SINTEF A27196
VERSION Version 98 of 106
Gender
The study has revealed some important gender differences. More females have poor or very poor physical and mental health. The gap in services tend to be larger for females and in particular with regards to educational services and assistive devices. Somewhat more females report that they have been refused entry to school. Fewer females have paid work, and more females report that they are unemployed. On the positive side, more females report that they are literate. All in all, most of the indicators that were analysed point towards somewhat less favorable results for females as compared to males. Many of these differences were however small, and other differences were not statistically significant. Fewer females with disability have children as compared to non-disabled females, but among those who have children, females with disability still have a higher mean number of children, and there is a higher number of stillbirths among females with disability. These three indicators indicate that both functional and social conditions contribute to a difference in reproductive life courses among females with and without disability, with further consequences for social participation/ inclusion.
The urban - rural dimension
The study distinguishes between three types of localities, i.e. city/town, urban villages and rural areas. Urban villages are close to cities, share some of the infrastructure with their urban neighbors, and may be seen as suburbs and peri-urban areas. Important differences in standard of living between the three locations were demonstrated by the indicators on infrastructure, with the major difference being between rural areas and the two other location types. Also, the contextual differences are reflected in the measure on environmental barriers. The three SES indicators all indicate that the living standard is lowest in rural areas. For many indicators there are relatively small differences between cities/towns and urban villages. On some indicators urban villages/individuals living in urban villages are better off than cities/individuals living in cities, while for other indicators it is the opposite. The case/control difference is however found also within the three location categories. The study thus confirms that households without disabled members are better off than case households. Although the differences largely are statistically significant, they are however mostly on the low side. It does add to the difference however that case households are larger than controls (higher mean number of members) and that all indicators point in the same direction.
PROJECT NO. 102001060
REPORT NO. SINTEF A27196
VERSION Version 99 of 106
CONCLUSION
Having established evidence for differences between disabled and non‐disabled is an important step in the promotion of human rights and improved level of living among individuals with disability. The study offers an opportunity for boosting advocacy, for setting priorities, for assessing impact and developing policies, for monitoring the situation, and for increased knowledge among disabled and the public in general. Generally, the study reveals consistent differences between case/control households and case/control individuals. Level of living, measured by means of a range of different indicators, is higher among controls than among cases at both levels (household and individual). All together the study thus provides evidence for differences in level of living in Botswana that should be reduced and limited completely. This requires an active stand from the side of public authorities and a multi-sector strategy that deals with these differences. Measures to achieve this will be both general and sector specific and a thorough analysis of what can be done to reduce the documented differences and to address service gaps and inadequacy in assistive device services, etc.
PROJECT NO. 102001060
REPORT NO. SINTEF A27196
VERSION Version 100 of 106
REFERENCES
Eide A H, Jele B (2011) Living Conditions among People with Disabilities in Swaziland. A National, Representative Study. SINTEF A 20047. Oslo; SINTEF Technology & Society. Eide A H, Kamaleri Y (Eds.) (2009) Living conditions among people with disabilities in Mozambique. SINTEF Report No. A9348. Oslo; SINTEF Health Research. Eide A H, Loeb M E (2006) Living conditions among people with disabilities in Zambia. A national representative survey. SINTEF Report No. A262. Oslo, SINTEF Health Research Eide A H, Nhiwathiva S, Muderedzi J, Loeb ME. Living Conditions among people with activity limitations in Zimbabwe. A representative regional study. STF78 A034512, November 2003, SINTEF Unimed Health & Rehabilitation, Oslo. Eide A H, van Rooy G, Loeb M E. Living Conditions among people with disabilities in Namibia. A National, Representative Study. STF78 A034503, April 2003, SINTEF Unimed Health & Rehabilitation, Oslo. Finkelstein, V., & French, S. (1993). Towards a psychology of disability. In J. Swain, V. Finkelstein, S. French & M. Oliver (Eds.), Disabling barriers - enabling environments (pp. 26-33). London: Sage. Heiberg M, Øvensen G (1993) Palestinian Society in Gaza, West Bank and Arab Jerusalem. A Survey of Living Conditions. FAFO Report no. 151. Oslo, FAFO. Hem, K.-G., Eide, A. H. (1998) Funksjonshemmedes levekår 1987-1995: Sakker akterut tross forbedringer. Samfunnsspeilet, 2, 20 - 25. Kamaleri Y, Eide A H (Eds.) (2010) Living Conditions among People with Disabilities in Lesotho. A National, Representative Study. SINTEF Report No. A17239. Oslo: SINTEF Technology & Society. Loeb M, Eide A H (Eds.) (2004) Living Conditions among People with Activity Limitations in Malawi. SINTEF Report no. STF78 A044511. Oslo, SINTEF Health Research. Madans, J. H., Altman, B. M., Rasch, E. K., et al. (2004). Washington Group Position Paper: Proposed Purpose of an Internationally Comparative General Disability Measure. Available at: http://www.cdc.gov/nchs/data/washington_group/WG_purpose_paper.pdf. Mmatli M, Lesetedi G, Kebotsamang K (2011). Disability Analysis. In: Statistics Botswana (2011) Population and Housing Census 2011. Dissemination Seminar. 9th -12th December 2013, Gaborone, Botswana. NPC (2000) Level of Living Conditions Survey. Windhoek: National Planning Commission. Schneider M, Claassens M, Kimmie Z, Morgan R, Naicker S, Roberts A, McLaren P. (1999) We also count! The extent of moderate and severe reported disability and the nature of disability experience in South Africa. Pretoria, Community Agency for Social Enquiry.
PROJECT NO. 102001060
REPORT NO. SINTEF A27196
VERSION Version 101 of 106
Shakespeare, T. (2014). Disability Rights and Wrongs Revisited (Second ed.). Oxon: Routledge, Taylor & Francis Ltd. UN (2006). Convention on the Rights of Persons with Disabilities and Optional Protocol. New York: United Nations. United Nations Development Programme (1997) Human Development Report 1997. Oxford, Oxford University Press. WHO (1980). International Classification of Impairments, Disability and Handicap. Geneva: World Health Organization. WHO (2001) International Classification of Disability, Functioning and Health. Geneva: World Health Organization. WHO (2011) World Disability Report. Geneva: World Health Organization. Whyte SR, Ingstad B. (1998) Help for people with disabilities: do cultural differences matter? World Health Forum, 19, 1, 42 - 46.
PROJECT NO. 102001060
REPORT NO. SINTEF A27196
VERSION Version 102 of 106
APPENDICES
APPENDIX 1. INFORMATION ABOUT BOFOD
The Botswana Federation of the Disabled (BOFOD) has in the past years heavily advocated for the inclusion of persons with disabilities in socio - economic development activities. We at BOFOD believe that disability is part of the human condition and should be accommodated and accepted by society in all development programmes.
BOFOD Objectives
1. To promote and advocate for the rights of persons with disabilities. 2. To advocate for and monitor the equalisation of opportunities for persons with disabilities as
stipulated in the United Nation’s Standard Rules. 3. To coordinate and strengthen the capacity of the affiliated DPOs The Botswana Federation of the Disabled (BOFOD) is a membership umbrella organization of organizations of persons with disabilities (DPOs) in Botswana to provide a unified voice of all persons with disabilities. BOFOD was formed in 2007 to advocate for rights of persons with disabilities in Botswana for the purposes of inclusion in all areas of cultural, political and socio-economic development. BOFOD is registered under societies Act of 13th December 2007 with Registration number: CR 7547. Since its inception, BOFOD has organised and has been involved in various activities towards the realisation of its objectives. These have covered the following areas among others: 1. Conducting community awareness building campaigns, workshops to sensitise the
communities on disability issues. 2. Currently playing a significant role in lobbying and advocating for the formulation and
enactment of the Bill on the Equalisation of Opportunities for Persons with Disabilities and disability policies.
3. Playing a leading role in fighting for the inclusion of disability in all programmes that are meant to sensitise the population on the dangers of HIV/Aids and other national programmes.
4. Lobbied for a Study on the Living Conditions of Persons With Activity Limitations. 5. Lobbied for access for inclusion of youth with disabilities on Youth Development fund,
women and gender programmes and youth policies at national level 6. Building of stakeholder partnership regionally and internationally BOFOD has recently carried out projects and training workshops such as;
a. Youth with Disabilities PITSO ( attended by over 250 participants) June 2014 in partnership with Ministry of youth sports and Culture b. Women with disabilities Legislation and empowerment workshop (attended by 30
participants) in partnership with Gender affairs Department. c. Round tables meetings Youth and Women (attended by 60 participants) d. DPO Empowerment mini Forum ( attended by 20 participants at governance level) e. HIV/ AIDS workshop seminar in partnership with office of the president (attended
by 30 participants)

PROJECT NO. 102001060
REPORT NO. SINTEF A27196
VERSION Version 103 of 106
Governance Structures BOFOD’s governance structure provides a source of particular stability. The BOFOD Board is the institution’s governing body, and its five (7) members are nominated after every four years at the organizations AGM. These members are then entrusted with the authority to exercise the responsibilities of the governance required. The small size of the Board permits intensive deliberation and thereby is a source of strength. The Board, in fact and deed, is the governing body with ultimate responsibility for the organization’s quality and integrity. The role of the governing board is to ensure that organizations of persons with disabilities also benefit from the monies being disbursed to carry out meaningful disability development programmes. Collaborative Structures The current members include DPOs registered under society’s act whose constitution includes direct service, advocacy and lobbying of people by disabilities themselves.
1. Botswana Association of the Deaf,
2. Kweneng Association of people with Disabilities,
3. Gaborone Association of people with Disabilities,
4. Botswana society of people with disabilities,
5. le Rona re teng association of people with disabilities,
6. Tshimologo Association of people with disabilities,
7. Lobatse Association of people with disabilities,
8. Botswana association of Blind and partially sighted,
9. Serowe association of people with disabilities.
10. Lerona re batho association of people with disabilities
11. Itirele Association of people with Disabilities
12. SESAD committee of people with Disabilities
13. Lorato Person with Disability society
BOFOD VISION: An inclusive barrier free society, where people with disabilities fully enjoy their human rights. BOFOD MISSION: BOFOD is a non- profit organization that strives to lobby and advocate for a barrier free society in partnership with the Government, NGOs and private sector with the ultimate goal of ensuring that people with disabilities fully enjoy their human
PROJECT NO. 102001060
REPORT NO. SINTEF A27196
VERSION Version 104 of 106
APPENDIX 2. QUESTIONNAIRES
PROJECT NO. 102001060
REPORT NO. SINTEF A27196
VERSION Version 105 of 106

Technology for a better society www.sintef.no