
Report Plug-in Electric Vehicle Sales Forecast … PEV...Plug-in Electric Vehicle Sales Forecast...
16
June 2017 Report Plug-in Electric Vehicle Sales Forecast Through 2025 and the Charging Infrastructure Required Prepared by: Adam Cooper (IEI) and Kellen Schefter (EEI)
Transcript of Report Plug-in Electric Vehicle Sales Forecast … PEV...Plug-in Electric Vehicle Sales Forecast...
June 2017
Report
Plug-in Electric Vehicle Sales Forecast Through 2025 and the Charging Infrastructure Required
Prepared by: Adam Cooper (IEI) and Kellen Schefter (EEI)

1
Executive Summary
Today, technology improvements are expanding the opportunity for electric transportation, and
electric companies are leading efforts to advance electric transportation and move the market
forward. Electric transportation is a win-win; it meets customer needs while also supporting
America’s energy security and sustainability.
The Edison Electric Institute (EEI) and the Institute for Electric Innovation (IEI) developed a
plug-in electric vehicle (PEV) sales forecast through 2025, including both plug-in hybrid electric
vehicles and battery electric vehicles, and identified the associated charging equipment
infrastructure needs. This paper identifies both the scope and scale of charging infrastructure
needed to support PEVs and the different approaches to infrastructure build-out.
The results show the following:
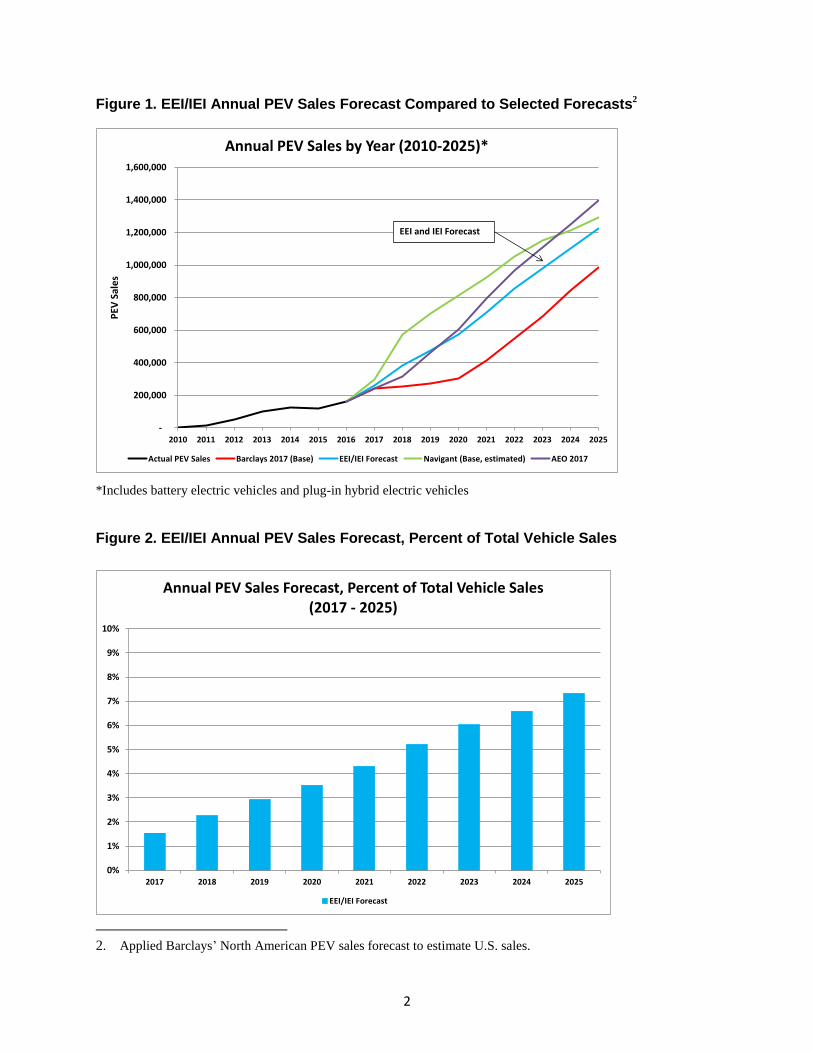
Annual sales of PEVs will exceed 1.2 million vehicles in 2025, reaching more than 7
percent of annual vehicle sales by 2025 (see Figures 1 and 2).
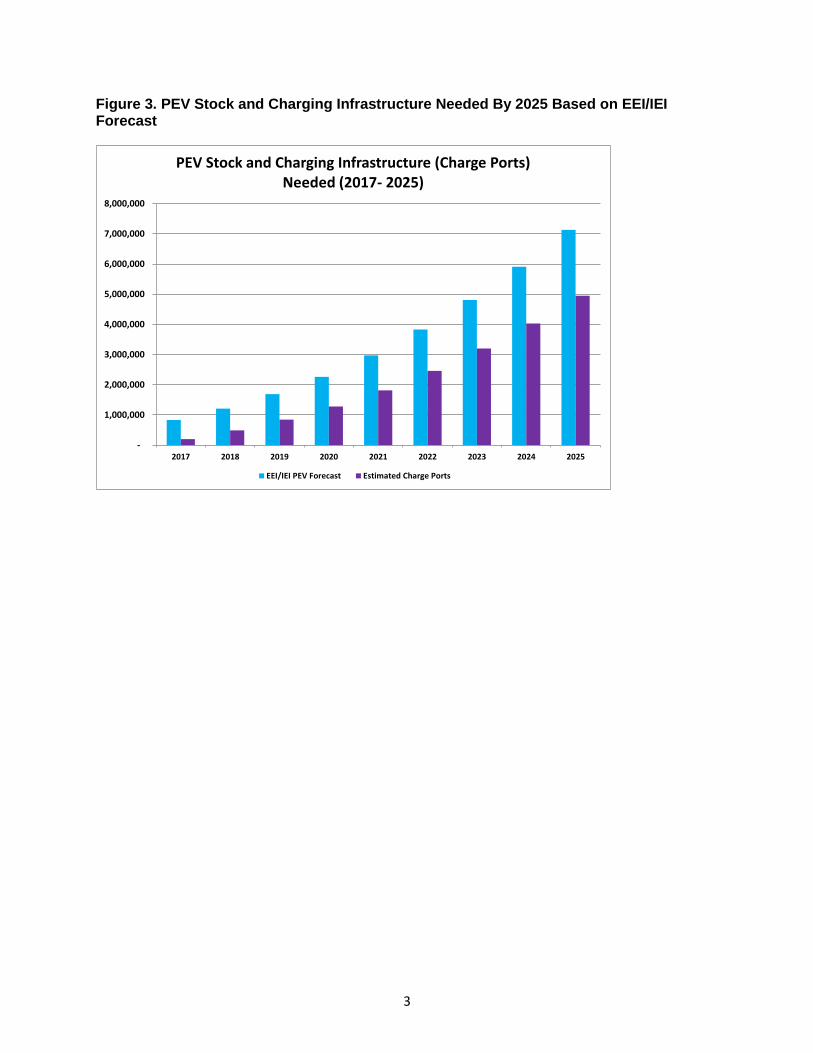
The stock of PEVs (i.e., the number of PEVs on the road) is projected to reach 7 million
by 2025, up from 567,000 at the end of 2016 (see Figure 3). This is about 3 percent of
the 258 million vehicles (cars and light trucks) expected to be registered in the United
States in 2025.
About 5 million charge ports will be required to support 7 million PEVs in 2025 (see
Figure 3). This represents a significant investment in PEV charging infrastructure.1
Growing customer demand, corporate average fuel economy (CAFE) standards, and declining
battery costs are all major drivers of PEV sales. A continued decline in battery costs will result in
increased cost- competitiveness of PEVs with internal combustion engine (ICE) vehicles.
However, relaxing current CAFE standards (54.5 MPG by 2025) will put downward pressure on
PEV sales. Regardless, customers are buying PEVs in record numbers, and the demand for
charging infrastructure is increasing.
Most PEV charging infrastructure to date is paid for by the entity that “hosts” the charging
equipment (the “site host”), such as a homeowner, a commercial property owner, or a public
entity. The PEV charging marketplace is evolving, and different approaches to providing the
charging infrastructure for the PEV market are being tested. Electric companies are well-
positioned to help develop PEV charging infrastructure.
1. The share of battery electric vehicles is expected to increase from 52 percent of annual PEV sales in 2016 to
more than 60 percent in 2025. This impacts charging infrastructure needs because BEVs directly influence the
number of DC fast chargers.
2
Figure 1. EEI/IEI Annual PEV Sales Forecast Compared to Selected Forecasts2
*Includes battery electric vehicles and plug-in hybrid electric vehicles
Figure 2. EEI/IEI Annual PEV Sales Forecast, Percent of Total Vehicle Sales
2. Applied Barclays’ North American PEV sales forecast to estimate U.S. sales.
-
200,000
400,000
600,000
800,000
1,000,000
1,200,000
1,400,000
1,600,000
2010 2011 2012 2013 2014 2015 2016 2017 2018 2019 2020 2021 2022 2023 2024 2025
PEV
Sal
es
Annual PEV Sales by Year (2010-2025)*
Actual PEV Sales Barclays 2017 (Base) EEI/IEI Forecast Navigant (Base, estimated) AEO 2017
EEI and IEI Forecast
0%
1%
2%
3%
4%
5%
6%
7%
8%
9%
10%
2017 2018 2019 2020 2021 2022 2023 2024 2025
Annual PEV Sales Forecast, Percent of Total Vehicle Sales (2017 - 2025)
EEI/IEI Forecast
3
Figure 3. PEV Stock and Charging Infrastructure Needed By 2025 Based on EEI/IEI Forecast
-
1,000,000
2,000,000
3,000,000
4,000,000
5,000,000
6,000,000
7,000,000
8,000,000
2017 2018 2019 2020 2021 2022 2023 2024 2025
PEV Stock and Charging Infrastructure (Charge Ports) Needed (2017- 2025)
EEI/IEI PEV Forecast Estimated Charge Ports
4
Background
EEI and IEI developed a consensus forecast of PEV sales projections from 2017 to 2025 based
on three independent forecasts:
U.S. Energy Information Administration (EIA) Annual Energy Outlook 2017 Reference
Case (January 2017).3
Barclays Equity Research Note – Together in Electric Dreams (January 2017).4
Navigant Research – Electric Vehicle Geographic Forecasts (June 2016).5
These forecasts were selected because they include three key factors: customer preference
models that determine interest in PEVs; declining battery costs that influence PEV cost
competitiveness with ICE vehicles and manufacturer profitability; and fuel efficiency standards
and environmental regulations.
Declining battery costs and growing customer demand for PEVs act as an accelerant to PEV
sales. Cost reductions in battery packs enable longer-range PEVs, increase cost-competitiveness
with ICE vehicles, and result in automobile manufacturers producing a wider variety of PEVs
across more vehicle segments to better meet customer demand.
Between 2010 and 2016, battery pack costs [$ per kilowatt-hour (kWh)] declined by
about 20 percent per year. The U.S. Department of Energy estimated battery pack costs in
2016 at $245 per kWh.
Barclays projects that battery pack costs at $100 per kWh will create price parity with
ICE vehicles.
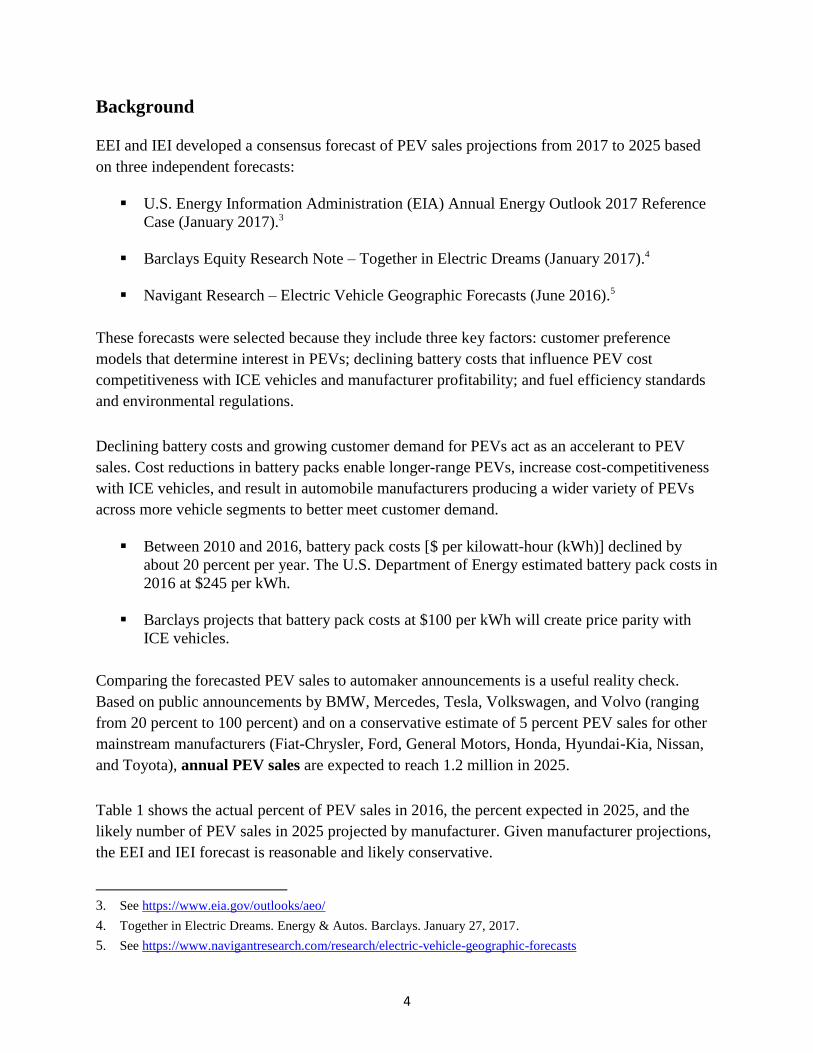
Comparing the forecasted PEV sales to automaker announcements is a useful reality check.
Based on public announcements by BMW, Mercedes, Tesla, Volkswagen, and Volvo (ranging
from 20 percent to 100 percent) and on a conservative estimate of 5 percent PEV sales for other
mainstream manufacturers (Fiat-Chrysler, Ford, General Motors, Honda, Hyundai-Kia, Nissan,
and Toyota), annual PEV sales are expected to reach 1.2 million in 2025.
Table 1 shows the actual percent of PEV sales in 2016, the percent expected in 2025, and the
likely number of PEV sales in 2025 projected by manufacturer. Given manufacturer projections,
the EEI and IEI forecast is reasonable and likely conservative.
3. See https://www.eia.gov/outlooks/aeo/
4. Together in Electric Dreams. Energy & Autos. Barclays. January 27, 2017.
5. See https://www.navigantresearch.com/research/electric-vehicle-geographic-forecasts
5
Table 1. Annual PEV Sales in 2025 Projected by Vehicle Manufacturer
CAFE & GHG Standards Compliance Issues
CAFE standards are a primary driver for the 31 PEV models available today in the United States
from 17 automakers. Fuel efficiency standards and environmental regulations [i.e., CAFE and
greenhouse gas (GHG) regulations] act as a floor for PEV sales (i.e., minimum compliance). To
comply with CAFE & GHG standards, automakers have had to:
1. Advance technologically via improved vehicle aerodynamics, light-weight materials,
turbo-charged engines, continuously variable transmissions, and stop-start technologies.
2. Offer a range of PEVs.
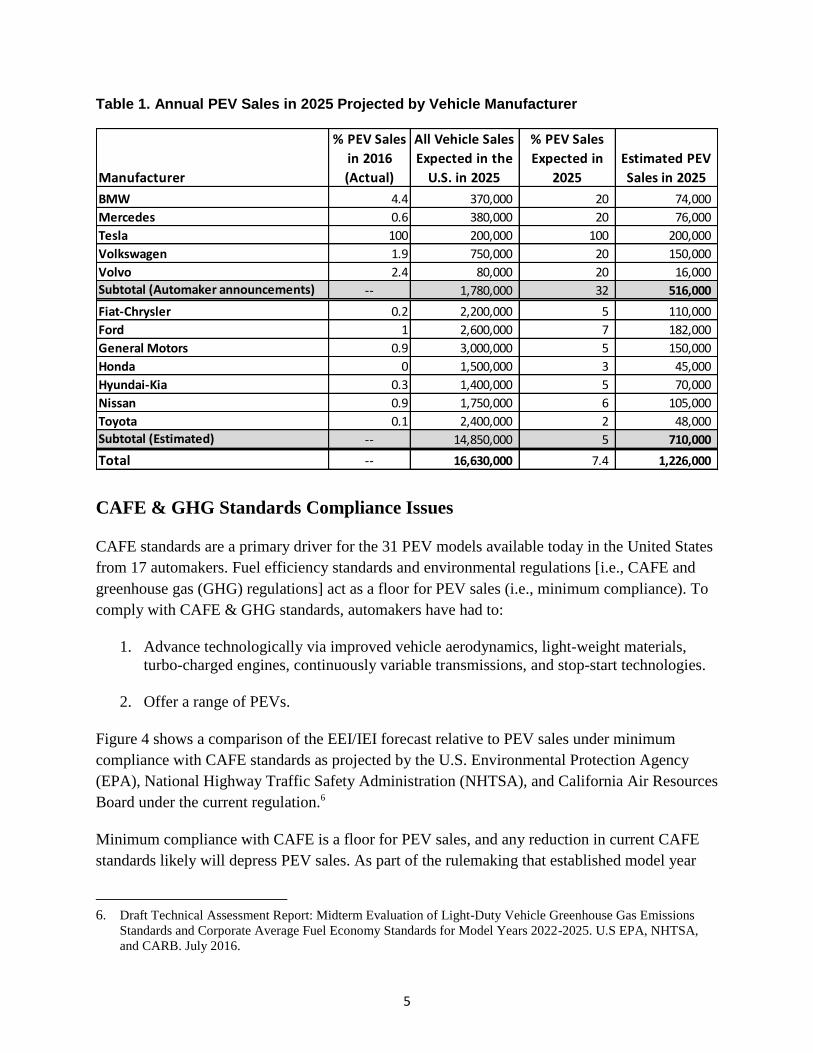
Figure 4 shows a comparison of the EEI/IEI forecast relative to PEV sales under minimum
compliance with CAFE standards as projected by the U.S. Environmental Protection Agency
(EPA), National Highway Traffic Safety Administration (NHTSA), and California Air Resources
Board under the current regulation.6
Minimum compliance with CAFE is a floor for PEV sales, and any reduction in current CAFE
standards likely will depress PEV sales. As part of the rulemaking that established model year
6. Draft Technical Assessment Report: Midterm Evaluation of Light-Duty Vehicle Greenhouse Gas Emissions
Standards and Corporate Average Fuel Economy Standards for Model Years 2022-2025. U.S EPA, NHTSA,
and CARB. July 2016.
Manufacturer
% PEV Sales
in 2016
(Actual)
All Vehicle Sales
Expected in the
U.S. in 2025
% PEV Sales
Expected in
2025
Estimated PEV
Sales in 2025
BMW 4.4 370,000 20 74,000
Mercedes 0.6 380,000 20 76,000
Tesla 100 200,000 100 200,000
Volkswagen 1.9 750,000 20 150,000
Volvo 2.4 80,000 20 16,000
Subtotal (Automaker announcements) -- 1,780,000 32 516,000
Fiat-Chrysler 0.2 2,200,000 5 110,000
Ford 1 2,600,000 7 182,000
General Motors 0.9 3,000,000 5 150,000
Honda 0 1,500,000 3 45,000
Hyundai-Kia 0.3 1,400,000 5 70,000
Nissan 0.9 1,750,000 6 105,000
Toyota 0.1 2,400,000 2 48,000
Subtotal (Estimated) -- 14,850,000 5 710,000
Total -- 16,630,000 7.4 1,226,000
6
(MY) 2017-2025 standards, EPA and NHTSA made a regulatory commitment to conduct a
midterm evaluation of the standards for MY 2022-2025, which increase fuel economy from 46.8
MPG to 54.5 MPG. Recently, EPA Administrator Scott Pruitt and Department of Transportation
Secretary Elaine Chao announced that EPA and NHTSA intend to reconsider the appropriateness
of the MY 2022-2025 standards by no later than April 1, 2018.
Figure 4. PEV Sales: EEI/IEI Forecast vs. Minimum Compliance With Current CAFE Standards
-
200,000
400,000
600,000
800,000
1,000,000
1,200,000
1,400,000
2010 2011 2012 2013 2014 2015 2016 2017 2018 2019 2020 2021 2022 2023 2024 2025
PEV
Sal
es
Annual PEV Sales by Year (2010-2025)
Actual PEV Sales EEI/IEI Forecast Minimum Compliance with Current CAFE Standards
7
PEV Charging Infrastructure
The availability of PEV charging infrastructure is fundamental to the growth of PEVs. Unlike
conventional vehicles, which typically refuel only at gasoline stations, PEVs may charge while
parked at home, at work, or in public spaces.
Charging equipment is needed to connect a vehicle to the energy grid. This charging equipment,
which often is referred to as a charging station or a charge port, comes in a variety of types and
configurations, but is generally categorized by power level:
Level 1 (L1): 120-volt, alternating current (AC) power. Level 1 charging refers to
charging stations, as well as typical electric outlets that a driver plugs into via a cord set
included with the vehicle. A PEV connected to a Level 1 charger takes about 12 hours to
charge a fully depleted 50-mile battery (about 4 miles of electric range per hour of
charging).
Level 2 (L2): 240-volt, AC power. Level 2 chargers typically are mounted on a wall or
on a pedestal. A PEV connected to a Level 2 charger takes between 3 to 5 hours to charge
a fully depleted 50-mile battery (about 10 to 20 miles of electric range per hour of
charging depending on the PEV).
DC Fast Charger (DCFC): Converts AC electricity to direct current (DC) and delivers
charge to the vehicle at higher power, typically 50 kilowatt or greater. A PEV connected
to a DC fast charger takes about 30 minutes to charge a fully depleted battery to about 80
percent, depending on battery size. Not all PEVs are able to accept DC fast charging.
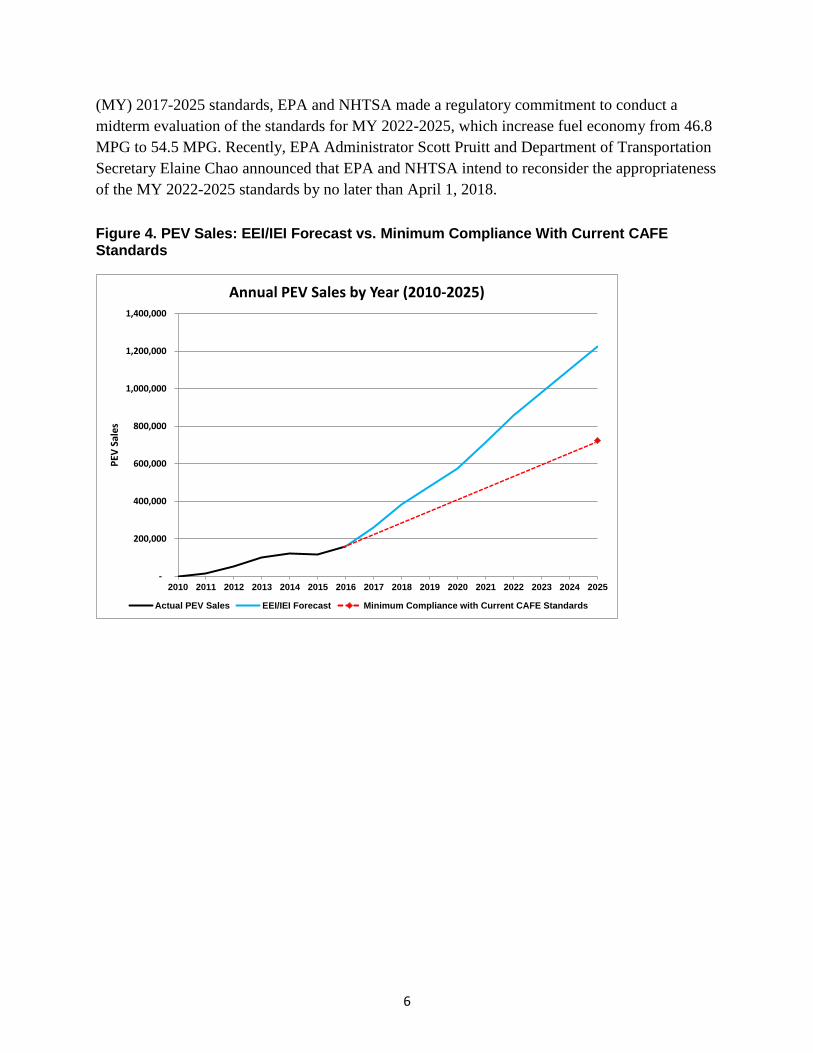
Table 2 summarizes likely PEV charging infrastructure locations, durations, and the charging
equipment that is commonly installed at each location.
Table 2. PEV Charging Equipment By Use
To date, the vast majority of PEV charging occurs at home. However, having charging
infrastructure at workplaces or in public settings allows PEV owners to drive more miles on
electric, enables longer trips, and reduces range anxiety. In addition, public charging
Category Use Case Park/Charge Time Charger Type
Single family home Overnight (~12 hours) L1, L2
Multi-unit dwelling Overnight (~12 hours) L1, L2
Work Workplace charging Work day (~8 hours) L1, L2
Short/medium-dwell (e.g., retail) 1-2 hours L2
Long-dwell (e.g., airports) 2-4 hours or longer L1, L2
Metro-based (intra-city) ~ 30 minutes or less DCFC
Long-distance (inter-city) ~30 minutes or less DCFC
Home
Public
8
infrastructure is important for PEV owners who do not have dedicated home charging, such as in
multi-unit dwellings (e.g., apartment buildings) or those with street parking.
Charging Infrastructure Needs
EEI and IEI estimated the PEV charging infrastructure needed to support the projected 7 million-
plus PEVs on the road in 2025 based on two models: the National Renewable Energy Laboratory
(NREL) model, as described in the National Economic Assessment of Plug-In Electric Vehicles
(December 2016)7 and the Electric Power Research Institute’s (EPRI’s) Red Line/Blue Model
(June 2014).8
The NREL and EPRI models typically are used by electric companies and state organizations to
support PEV charging infrastructure analysis and to identify the need for at-home and away-
from-home charge ports.9 The NREL model estimates infrastructure needs separately for battery
electric vehicles and plug-in hybrid electric vehicles, while the EPRI model estimates
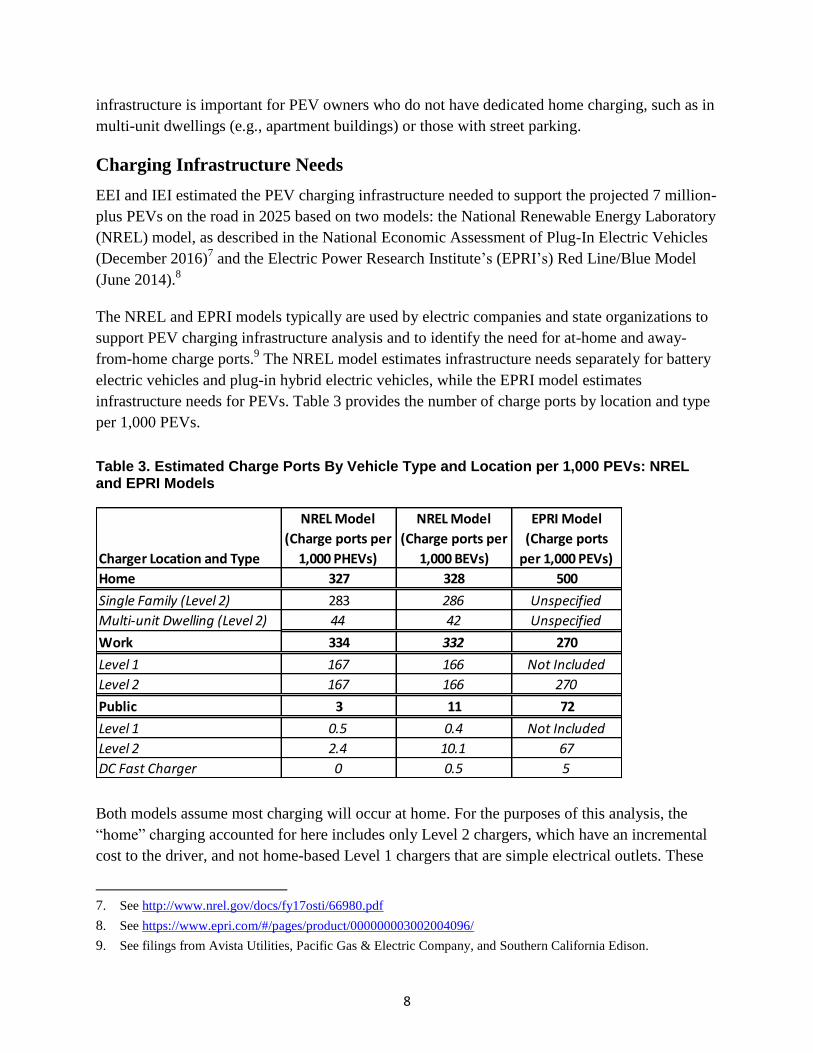
infrastructure needs for PEVs. Table 3 provides the number of charge ports by location and type
per 1,000 PEVs.
Table 3. Estimated Charge Ports By Vehicle Type and Location per 1,000 PEVs: NREL and EPRI Models
Both models assume most charging will occur at home. For the purposes of this analysis, the
“home” charging accounted for here includes only Level 2 chargers, which have an incremental
cost to the driver, and not home-based Level 1 chargers that are simple electrical outlets. These
7. See http://www.nrel.gov/docs/fy17osti/66980.pdf
8. See https://www.epri.com/#/pages/product/000000003002004096/
9. See filings from Avista Utilities, Pacific Gas & Electric Company, and Southern California Edison.
Charger Location and Type
NREL Model
(Charge ports per
1,000 PHEVs)
NREL Model
(Charge ports per
1,000 BEVs)
EPRI Model
(Charge ports
per 1,000 PEVs)
Home 327 328 500
Single Family (Level 2) 283 286 Unspecified
Multi-unit Dwelling (Level 2) 44 42 Unspecified
Work 334 332 270
Level 1 167 166 Not Included
Level 2 167 166 270
Public 3 11 72
Level 1 0.5 0.4 Not Included
Level 2 2.4 10.1 67
DC Fast Charger 0 0.5 5
9
models predict about 327 to 500 charge ports at home per 1,000 PEVs, and 270 to 334 charge
ports at work per 1,000 PEVs. Public charging infrastructure estimates vary widely between the
two models, from 3 to 72 charge ports per 1,000 PEVs.
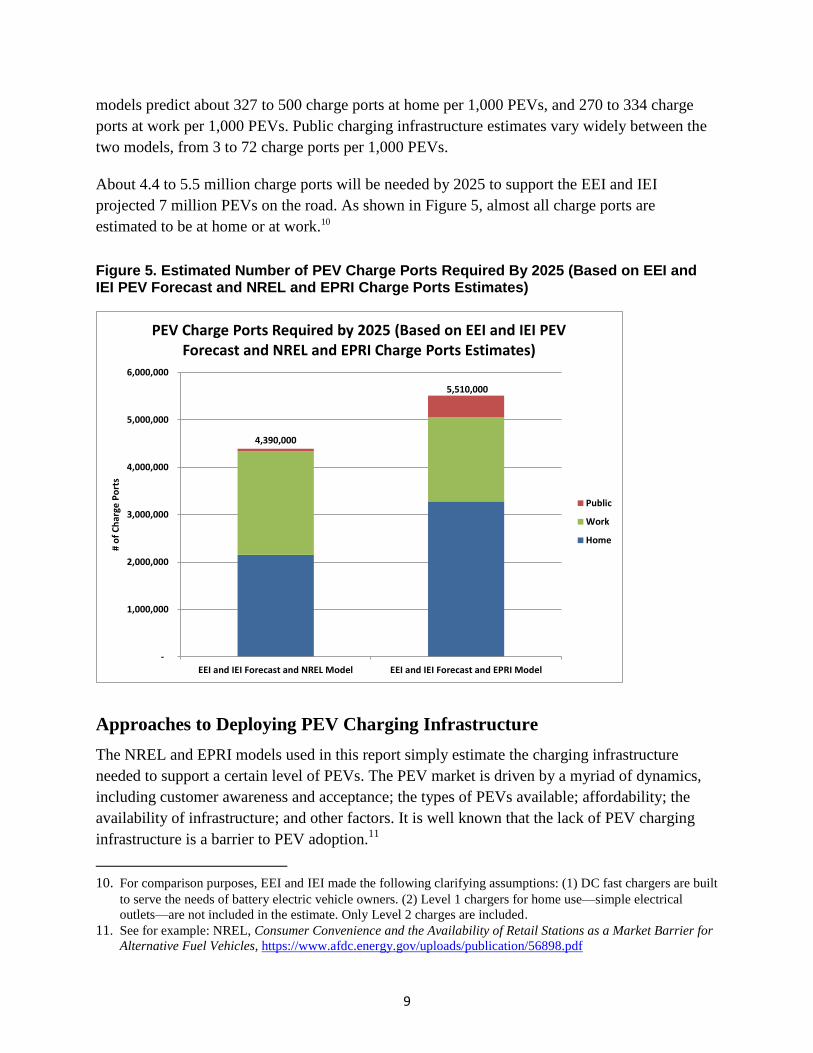
About 4.4 to 5.5 million charge ports will be needed by 2025 to support the EEI and IEI
projected 7 million PEVs on the road. As shown in Figure 5, almost all charge ports are
estimated to be at home or at work.10
Figure 5. Estimated Number of PEV Charge Ports Required By 2025 (Based on EEI and IEI PEV Forecast and NREL and EPRI Charge Ports Estimates)
Approaches to Deploying PEV Charging Infrastructure
The NREL and EPRI models used in this report simply estimate the charging infrastructure
needed to support a certain level of PEVs. The PEV market is driven by a myriad of dynamics,
including customer awareness and acceptance; the types of PEVs available; affordability; the
availability of infrastructure; and other factors. It is well known that the lack of PEV charging
infrastructure is a barrier to PEV adoption.11
10. For comparison purposes, EEI and IEI made the following clarifying assumptions: (1) DC fast chargers are built
to serve the needs of battery electric vehicle owners. (2) Level 1 chargers for home use—simple electrical
outlets—are not included in the estimate. Only Level 2 charges are included. 11. See for example: NREL, Consumer Convenience and the Availability of Retail Stations as a Market Barrier for
Alternative Fuel Vehicles, https://www.afdc.energy.gov/uploads/publication/56898.pdf
4,390,000
5,510,000
-
1,000,000
2,000,000
3,000,000
4,000,000
5,000,000
6,000,000
EEI and IEI Forecast and NREL Model EEI and IEI Forecast and EPRI Model
# o
f C
har
ge P
ort
s
PEV Charge Ports Required by 2025 (Based on EEI and IEI PEV Forecast and NREL and EPRI Charge Ports Estimates)
Public
Work
Home
10
The costs of PEV infrastructure can vary widely, from a few hundred dollars to install a Level 2
charger at home, to tens of thousands of dollars to install a multi-port DC fast charging station.
The cost includes the equipment itself, as well as the installation, permit, and inspection needed
to get power to the charging station. Much of the PEV charging infrastructure to date has been
paid for by the customer or entity that hosts the charging equipment (the “site host”), whether
that is a homeowner, a commercial property owner, or a public entity. (See Appendix for
examples.)
The current charging infrastructure at workplaces and in public locations is estimated to be
between 50,000 to 70,000 predominantly Level 2 charge ports.12 Based on the NREL and EPRI
models, Figure 5 shows a need for more than 2 million charge ports in work and public locations
by 2025. The significant difference between the current availability of charging infrastructure
and the expected charging infrastructure needed suggests a growing “infrastructure gap” that will
need to be addressed.
The PEV charging marketplace is evolving, and different approaches to providing the charging
infrastructure for the PEV market are being tested.
Electric companies are well-positioned to help develop PEV charging infrastructure. Electric
companies can support the development of PEV charging infrastructure and the smart integration
of PEV charging load into the distribution grid in different ways, including:
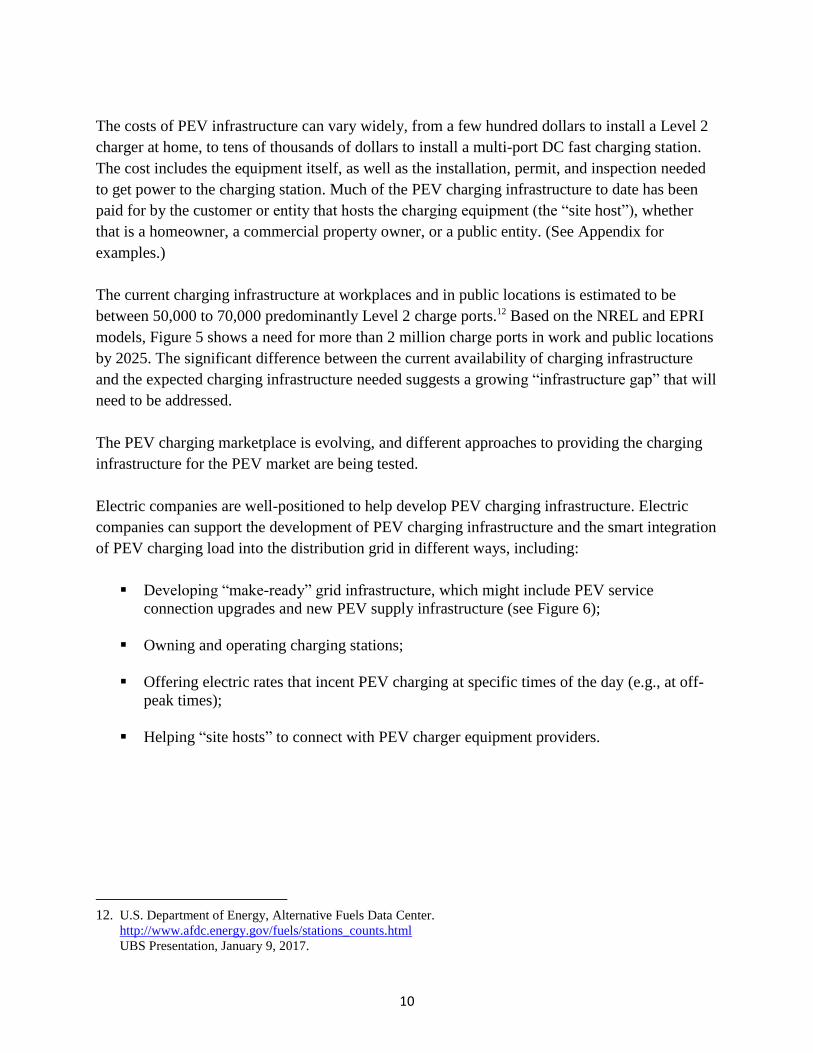
Developing “make-ready” grid infrastructure, which might include PEV service
connection upgrades and new PEV supply infrastructure (see Figure 6);
Owning and operating charging stations;
Offering electric rates that incent PEV charging at specific times of the day (e.g., at off-
peak times);
Helping “site hosts” to connect with PEV charger equipment providers.
12. U.S. Department of Energy, Alternative Fuels Data Center.
http://www.afdc.energy.gov/fuels/stations_counts.html
UBS Presentation, January 9, 2017.
11
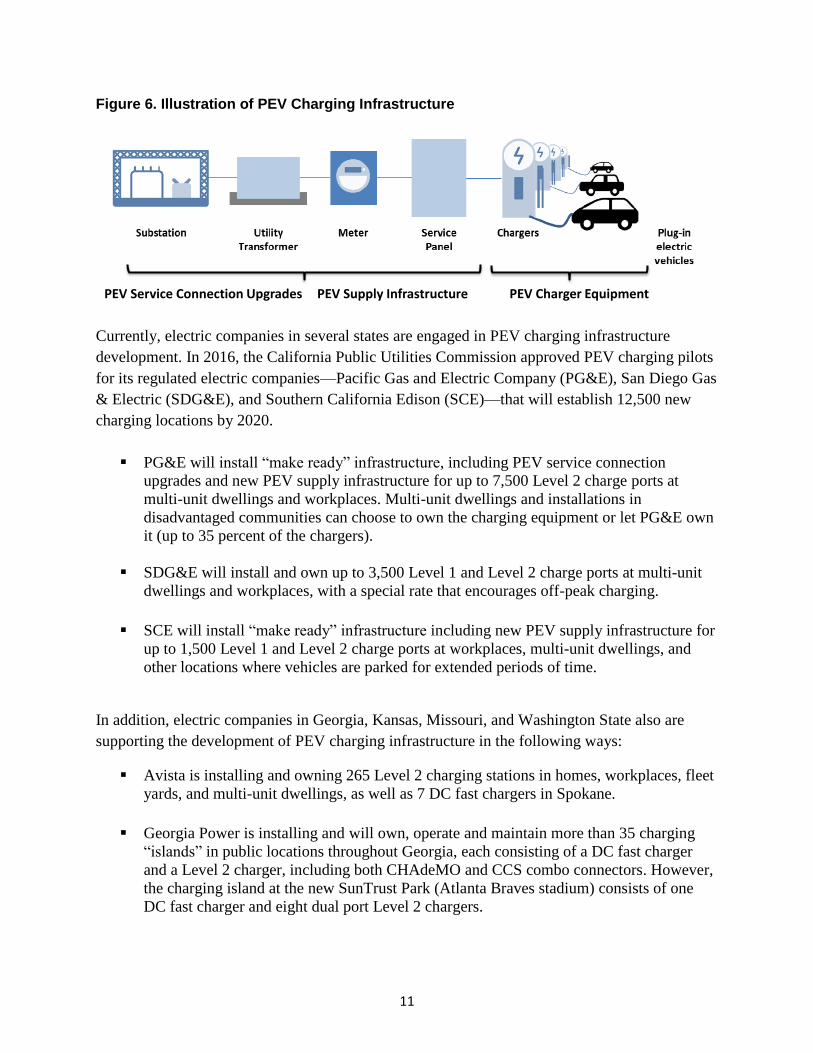
Figure 6. Illustration of PEV Charging Infrastructure
Currently, electric companies in several states are engaged in PEV charging infrastructure
development. In 2016, the California Public Utilities Commission approved PEV charging pilots
for its regulated electric companies—Pacific Gas and Electric Company (PG&E), San Diego Gas
& Electric (SDG&E), and Southern California Edison (SCE)—that will establish 12,500 new
charging locations by 2020.
PG&E will install “make ready” infrastructure, including PEV service connection
upgrades and new PEV supply infrastructure for up to 7,500 Level 2 charge ports at
multi-unit dwellings and workplaces. Multi-unit dwellings and installations in
disadvantaged communities can choose to own the charging equipment or let PG&E own
it (up to 35 percent of the chargers).
SDG&E will install and own up to 3,500 Level 1 and Level 2 charge ports at multi-unit
dwellings and workplaces, with a special rate that encourages off-peak charging.
SCE will install “make ready” infrastructure including new PEV supply infrastructure for
up to 1,500 Level 1 and Level 2 charge ports at workplaces, multi-unit dwellings, and
other locations where vehicles are parked for extended periods of time.
In addition, electric companies in Georgia, Kansas, Missouri, and Washington State also are
supporting the development of PEV charging infrastructure in the following ways:
Avista is installing and owning 265 Level 2 charging stations in homes, workplaces, fleet
yards, and multi-unit dwellings, as well as 7 DC fast chargers in Spokane.
Georgia Power is installing and will own, operate and maintain more than 35 charging
“islands” in public locations throughout Georgia, each consisting of a DC fast charger
and a Level 2 charger, including both CHAdeMO and CCS combo connectors. However,
the charging island at the new SunTrust Park (Atlanta Braves stadium) consists of one
DC fast charger and eight dual port Level 2 chargers.
PEV Service Connection Upgrades PEV Supply Infrastructure PEV Charger Equipment
12
Kansas City Power & Light (KCP&L) is installing and owning approximately 1,000
Level 2 charging stations and 15 DC fast chargers in public locations in and around
Kansas City as part of its Clean Charge Network. The first two years of the program
provided free charging to PEV drivers who joined the Clean Charge Network.
Conclusion
With more than 7 million PEVs anticipated to be on the road in the United States by 2025, and
every PEV owner expecting to be able to charge his or her car at home, on the street, at the
office, at shopping malls, or along major highways, targeted deployment of charging
infrastructure and coordinated collaboration among all stakeholders are required. Electric
company participation in the development of PEV charging infrastructure supports state-level
clean energy and transportation goals, expands customer choice, and helps to scale and ensure
the availability of needed PEV charging infrastructure.
13
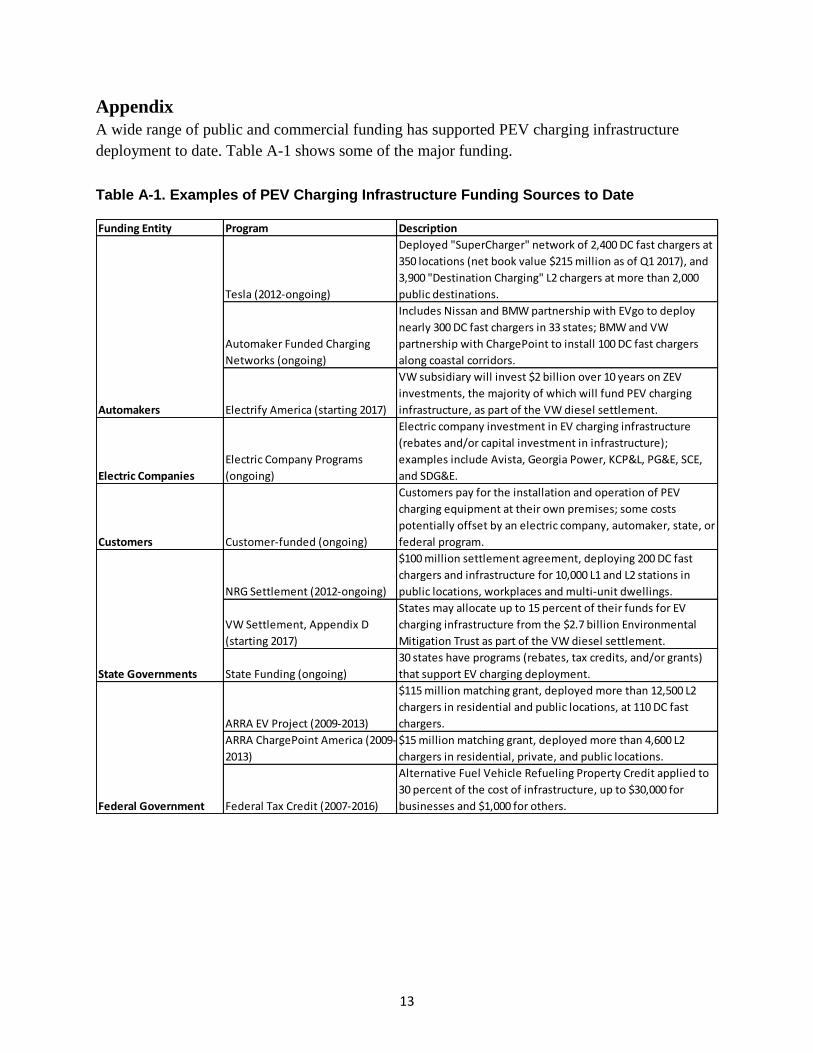
Appendix
A wide range of public and commercial funding has supported PEV charging infrastructure
deployment to date. Table A-1 shows some of the major funding.
Table A-1. Examples of PEV Charging Infrastructure Funding Sources to Date
Funding Entity Program Description
Tesla (2012-ongoing)
Deployed "SuperCharger" network of 2,400 DC fast chargers at
350 locations (net book value $215 million as of Q1 2017), and
3,900 "Destination Charging" L2 chargers at more than 2,000
public destinations.
Automaker Funded Charging
Networks (ongoing)
Includes Nissan and BMW partnership with EVgo to deploy
nearly 300 DC fast chargers in 33 states; BMW and VW
partnership with ChargePoint to install 100 DC fast chargers
along coastal corridors.
Electrify America (starting 2017)
VW subsidiary will invest $2 billion over 10 years on ZEV
investments, the majority of which will fund PEV charging
infrastructure, as part of the VW diesel settlement.
Electric Companies
Electric Company Programs
(ongoing)
Electric company investment in EV charging infrastructure
(rebates and/or capital investment in infrastructure);
examples include Avista, Georgia Power, KCP&L, PG&E, SCE,
and SDG&E.
Customers Customer-funded (ongoing)
Customers pay for the installation and operation of PEV
charging equipment at their own premises; some costs
potentially offset by an electric company, automaker, state, or
federal program.
NRG Settlement (2012-ongoing)
$100 million settlement agreement, deploying 200 DC fast
chargers and infrastructure for 10,000 L1 and L2 stations in
public locations, workplaces and multi-unit dwellings.
VW Settlement, Appendix D
(starting 2017)
States may allocate up to 15 percent of their funds for EV
charging infrastructure from the $2.7 billion Environmental
Mitigation Trust as part of the VW diesel settlement.
State Funding (ongoing)
30 states have programs (rebates, tax credits, and/or grants)
that support EV charging deployment.
ARRA EV Project (2009-2013)
$115 million matching grant, deployed more than 12,500 L2
chargers in residential and public locations, at 110 DC fast
chargers.
ARRA ChargePoint America (2009-
2013)
$15 million matching grant, deployed more than 4,600 L2
chargers in residential, private, and public locations.
Federal Tax Credit (2007-2016)
Alternative Fuel Vehicle Refueling Property Credit applied to
30 percent of the cost of infrastructure, up to $30,000 for
businesses and $1,000 for others.
Automakers
State Governments
Federal Government
About the Institute for Electric InnovationThe Institute for Electric Innovation focuses on advancing the adoption and appli-cation of new technologies that will strengthen and transform the energy grid. IEI’s members are the investor-owned electric companies that represent about 70 percent of the U.S. electric power industry. The membership is committed to an affordable, reliable, secure, and clean energy future.IEI promotes the sharing of information, ideas, and experiences among regu-lators, policy makers, technology companies, thought leaders, and the electric power industry. IEI also identifies policies that support the business case for the adoption of cost-effective technologies.IEI is governed by a Management Committee of electric industry Chief Executive Officers. In addition, IEI has a Strategy Committee made up of senior electric industry executives and a select group of technology companies on its Technol-ogy Partner Roundtable.
Institute for Electric Innovation701 Pennsylvania Avenue N.W Washington, D.C. 20004-2696www.edisonfoundation.net
Edison Electric Institute 701 Pennsylvania Avenue NW Washington, D.C. 20004-2696202.508.5000 | www.eei.org
About the Edison Electric InstituteEEI is the association that represents all U.S. investor-owned electric companies. Our members provide electricity for 220 million Americans, and operate in all 50 states and the District of Columbia. As a whole, the electric power industry sup-ports more than 7 million jobs in communities across the United States. In addi-tion to our U.S. members, EEI has more than 60 international electric companies as International Members, and hundreds of industry suppliers and related organiza-tions as Associate Members.


