Report on the National Assessment Framework of Enabling...
172
i Report on the National Assessment Framework of Enabling Environment and Technology Innovation Eco-system for Making Sustainable Energy Options Affordable and Accessible INDONESIA Prepared by Syahrul Aiman and Budi Prawara Indonesian Institute of Sciences, Jakarta, Indonesia May 2014
Transcript of Report on the National Assessment Framework of Enabling...

i
Report on the National Assessment
Framework of Enabling Environment
and Technology Innovation Eco-system
for Making Sustainable Energy Options
Affordable and Accessible
INDONESIA
Prepared by
Syahrul Aiman and Budi Prawara
Indonesian Institute of Sciences, Jakarta, Indonesia
May 2014

ii
© Asian and Pacific Centre for Transfer of Technology, 2014
This publication may be reproduced in whole or in part for educational or non-profit purposes without special
permission from the copyright holder, provided that the source is acknowledged. APCTT-ESCAP would
appreciate receiving a copy of any publication that uses this publication as a source.
No use may be made of this publication for resale or any other commercial purpose whatsoever without prior
permission. Applications for such permission, with a statement of the purpose and extent of reproduction,
should be addressed to the Head, APCTT-ESCAP, P.O. Box 4575, C-2, Qutub Institutional Area, New Delhi 110
016, India.
The opinions, Figures and estimates set forth in this publication are the responsibility of the authors, and
should not necessarily be considered as reflecting the views or carrying the endorsement of the United
Nations APCTT-ESCAP.
The designations used and the presentation of the material in this publication do not imply the expression of
any opinion whatsoever on the part of the United Nations APCTT-ESCAP concerning the legal status of any
country, territory, city or area, or of its authorities, or concerning the delimitation of its frontiers or
boundaries.
Mention of firm names and commercial products does not imply the endorsement of the United Nations
APCTT-ESCAP.
This document has been issued without formal editing.

iii
Table of Contents
List of Tables...........................................................................................................................................v
List of Figures........................................................................................................................................vii
Abbreviations.......................................................................................................................................viii
A. National Scenario for Sustainable Energy ................................................................................ 1
General Information ............................................................................................................................ 1
Topology and Administrative ............................................................................................................. 3
Population, Households and Electrification Rate................................................................................ 4
Population and Households ............................................................................................................. 4
Electrification Rate ......................................................................................................................... 5
Energy Consumption per Capita ......................................................................................................... 8
Administrative set up for Energy Issues ............................................................................................. 9
Current Power Sector Set-up ............................................................................................................ 10
Electricity Generation ................................................................................................................... 10
Transmission and Distribution ...................................................................................................... 11
Retail Tariff ................................................................................................................................... 12
Example of Suitability of Established Technology ....................................................................... 12
Capital Cost Range ....................................................................................................................... 12
Resources Availability and Access ................................................................................................... 13
Percentage Share of Different Primary Sources............................................................................ 13
Kerosene to - LPG Conversion Programme.................................................................................. 15
Potential and Install Capacity in Development of Renewable Energy ............................................. 15
Renewable Energy Power Plant .................................................................................................... 15
Hydro Power ................................................................................................................................. 16
Solar Energy .................................................................................................................................. 20
Wind Power .................................................................................................................................. 23
Biomass ......................................................................................................................................... 25
Geothermal .................................................................................................................................... 29
Installed Capacity .............................................................................................................................. 35
Energy Production and Purchase ...................................................................................................... 35
Market and Potential Services........................................................................................................... 35

iv
Energy (Electricity) Sales ............................................................................................................. 35
Electricity Sale Price ..................................................................................................................... 37
PLN Business Area and Electrification Ratio ................................................................................... 38
Number of Subscribers ..................................................................................................................... 39
Energy Sources of Power Generation ............................................................................................... 40
Regional Operations West and East Indonesia ............................................................................. 40
Energy Source of Power Station in Java-Bali Region .................................................................. 41
Indonesia Demand and Supply Gap .................................................................................................. 42
Electricity Demand and Supply Gap ............................................................................................. 42
Total Energy...................................................................................................................................... 43
Indonesia Energy Efficiency ............................................................................................................. 46
B. Technology Enabling Environment and Ecosystem ................................................................ 49
Government support for infrastructure ............................................................................................. 49
Attractive opportunities for IPPs....................................................................................................... 49
Legal and regulatory framework ....................................................................................................... 50
The 2009 Electricity Law .............................................................................................................. 51
Generation ......................................................................................................................................... 51
Transmission, Distribution and Retailing ......................................................................................... 52
Operations and Maintenance (“O&M”) ............................................................................................ 52
Regulatory History of Electricity ...................................................................................................... 52
History of Reforms ....................................................................................................................... 52
Differences between the 2009 and 1985 Laws ............................................................................. 54
Other Relevant Laws ......................................................................................................................... 56
The Geothermal Law .................................................................................................................... 56
The Investment Law ..................................................................................................................... 56
The Negative List .......................................................................................................................... 57
Environment Issues ....................................................................................................................... 58
Fast Track Programme II Expanded ................................................................................................. 58
Rationale ....................................................................................................................................... 59
From 10,000 MW to 18,000 MW ................................................................................................. 59
Institutional, technical, financial, technology transfer support mechanisms .................................... 72
Incentives for Renewable Energy Generation .................................................................................. 88
C. Business Enabling Environment and Ecosystem .................................................................... 92

v
Feed-In-Tariff (FIT) Policies ............................................................................................................ 92
Renewable Energy Push ................................................................................................................... 92
Feed-in Tariff for Solar Power .......................................................................................................... 93
Feed-in-Tariff (FIT) for Renewable Energy Sources ........................................................................ 94
Electricity Purchasing of Small Scale and Medium Scale Renewable Energy Power Plant or Excess
Power by PLN ................................................................................................................................... 95
Feed-In-Tariff, Terms & Conditions ................................................................................................. 95
Average Generation Cost & Electricity Subsidy .............................................................................. 98
Basic Electricity Tariffs (TDL) ....................................................................................................... 102
D. Business Models for SET Delivery .......................................................................................... 111
Electricity Generation ..................................................................................................................... 111
Fast Track Programme 10.000 MW Phase 1 .................................................................................. 123
Project Finance ............................................................................................................................ 124
Development of 10,000 MW Phase 1 ......................................................................................... 124
Fast Track Programme 10,000 MW Phase 2 .............................................................................. 127
Electrical Power Provider ............................................................................................................... 127
PT. PLN (Persero) ....................................................................................................................... 127
Field of Business PT. PLN .......................................................................................................... 128
Planning ...................................................................................................................................... 129
Development ............................................................................................................................... 129
Corporate / Operational Activities .............................................................................................. 130
Independent Power Producer ...................................................................................................... 130
Business Development for Renewable Energy (Case: Geothermal) ............................................... 134
E. Social-Economic Factors ..................................................................................................... 137
Social Factor ................................................................................................................................... 137
The government efforts to promote RE .......................................................................................... 137
National and Societies Openness to Technology Innovations ........................................................ 138
Example of Community involvement in developing RE ................................................................ 139
Example of women involvement in RE .......................................................................................... 140
Assistance from Local Community Group in Promoting SET/RET ............................................... 141
Affordability and Accessibility ....................................................................................................... 141
Conventional Energy Being Use and Unit Price ......................................................................... 141
Average Monthly Spending on Use of Conventional Energy ..................................................... 142

vi
The Government Subsidy for Conventional Fuels ...................................................................... 142
Financing Scheme for purchasing RE ......................................................................................... 143
F. South-South Co-operation ................................................................................................... 144
Cooperation among Indonesia-India-South Africa on Development of Renewable Energy .......... 144
Background ................................................................................................................................. 144
Purpose of Cooperation ............................................................................................................... 145
Main Activities ............................................................................................................................ 145
Expected Impact.......................................................................................................................... 145
Project Information ..................................................................................................................... 146
Indonesia-Republic of Korea Cooperation ..................................................................................... 146
Indonesia-Thailand Energy Forum ITEF ........................................................................................ 146
Summary ................................................................................................................................. 147
Suggestion ....................................................................................................................................... 148
Urgent Problems ............................................................................................................................. 148
Case Study ............................................................................................................................... 149
Introduction ..................................................................................................................................... 149
Government Strategy ...................................................................................................................... 151
Government Efforts ........................................................................................................................ 151
Development Problems ................................................................................................................... 151
Efforts for Achieving Energy Targets Mix ..................................................................................... 152
Efforts To Speed UpThe Geothermal Development In Indonesia .................................................. 154
Local Content RegulationFor Geothermal Power Plant.................................................................. 154
Development of Small-Scale Geothermal Power Plant .................................................................. 155
Future Challenges and Opportunity ................................................................................................ 157

vii
List of Tables
Table 1. Energy Consumption by Users ............................................................................................. 2
Table 2. The Government’s Subsidy for Energy. ............................................................................... 2
Table 3. Population Density per Provinces of Indonesia [15]............................................................. 4
Table 4. Percentage of Households in Urban and Rural Received Electricity from PLN’s Grid
in year 2010-2012[21]. .......................................................................................................... 6
Table 5. Potential and Install Capacity of Renewable Energy in Indonesia (up to 2011) [36] ......... 16
Table 6. Primary energy supply share in Indonesia [37]. ................................................................. 16
Table 7. Installed capacity of hydropower station in Indonesia [37]. ............................................... 17
Table 8. Biogas Energy Potential in each Province [37]................................................................... 26
Table 9. Major biomass energy potential as energy resources [37]. ................................................. 27
Table 10. Geothermal distribution potencies by region [37]. ............................................................. 29
Table 11. Geothermal power plant capacity [37]. ............................................................................... 30
Table 12. Electricity Demand Projection and Target Electrification Ratio. [10]. ............................... 34
Table 13. PLN’s Electricity Sales (TWh) [44].................................................................................... 36
Table 14. The electricity tariff for 2013 at each user category. .......................................................... 38
Table 15. Electrification Ratio Growth (%) [44] ................................................................................ 39
Table 16. Subscribers Numbers Growth (Thousands) [44]................................................................. 40
Table 17. Type of Installed Generating Capacity, Operating at Certain Region of Indonesia
(MW) Year 2011. [44] ........................................................................................................ 40
Table 18. Type of Plant and Its Capacity of Power System Java-Bali Year 2011. [44] ..................... 42
Table 19. Electricity Power Demand and Power Gap. [45]. ............................................................... 42
Table 20. Primary energy supply share in Indonesia [37]. ................................................................. 46
Table 21. Differences between the 1985 and 2009 Laws ................................................................... 55
Table 22. Summary of some of the existing policies and regulations related to the promotion of
renewable energy in Indonesia ............................................................................................ 59
Table 23. Key R&D Institutions involved in the Development and Transfer of Renewable
Energies [60] ....................................................................................................................... 72
Table 24. Key Indonesian Non-Governmental Organization in the field of Renewable Energy
Sector .................................................................................................................................. 74
Table 25. Ministries and Government Agencies Involved in the Promotion of Renewable Energy .. 77
Table 26. R&D funding trend of new and renewable energy [62] ...................................................... 80
Table 27. Consulting Organizations/Consultants with Expertise in Renewable Energy
Technology System Design, Application, and Transfer ..................................................... 81
Table 28. Technology Commercialization Agencies/Technology Business Incubators in the
Renewable Energy .............................................................................................................. 82
Table 29. Financial Institutions for Supporting Renewable Energy Development,
Commercialization, Transfer and Adoption ........................................................................ 83
Table 30. Bank credit for energy sector .............................................................................................. 85
Table 31. Potential Renewable Energy in Indonesia .......................................................................... 86
Table 32. Negative Investment List in Indonesia ................................................................................ 87
Table 33. Tax Incentives - Comparison for Conventional and Renewable Power Plants ................... 90

viii
Table 34. Feed-in Tariff for Solar Power ............................................................................................ 93
Table 35. FIT for timeframe of construction of solar power .............................................................. 94
Table 36. Feed-In-Tariff (FIT) Schemes in Indonesia ........................................................................ 95
Table 37. Average Selling Price of Electricity by Type of Customer and by Province (2011) .......... 99
Table 38. Average Generation Cost by Type of Power Plants (IDR/kWh) 2006 – 2011 ................. 101
Table 39. Average Selling Price of Electricity (HJTL) by Type of Customers (IDR/kWh)
2003 – 2011....................................................................................................................... 101
Table 40. The latest Basic Electricity Tariff (TDL) for Residential Use Q4 2013 ........................... 102
Table 41. The latest Basic Electricity Tariff (TDL) for Commercial Use Q4 2013 ......................... 103
Table 42. The latest Basic Electricity Tariff (TDL) for Industrial Use Q4 2013 .............................. 104
Table 43. Summary of PVES sustainability dimensons for Case Study (Lampung, West Java
and NTT) ........................................................................................................................... 105
Table 44. PLN’s Electricity Supply Facilities (2006 – 2011) ........................................................... 112
Table 45. National’s Installed Capacity of Power Plant by Type (MW) (2006 – 2011) ................... 113
Table 46. PLN’s Installed Capacity of Power Plant by Type (MW) (2006 – 2011) ......................... 114
Table 47. PLN’s Installed Capacity of Power Plant by Type and by Region (MW) (2011) ............ 115
Table 48. PLN’s Installed Capacity Rented by Type of Power Plant and by Region (MW) (2011) 116
Table 49. Private (IPP & PPU)’s Installed Capacity by Type of Power Plant and by Region
(MW) (2011) ..................................................................................................................... 117
Table 50. Rated Capacity of Power Plant (MW) (2011) ................................................................... 119
Table 51. Rated Capacity of Power Plant by Type and by Region (MW) (2011) ............................ 119
Table 52. Rated Capacity of Power Plant by Type (MW) (2011) [63] ............................................. 121
Table 53. Rated Capacity of Power Plant by Type (MW) (2011)-continued [63] ............................ 122
Table 54. Rated Capacity of Power Plant by Type (MW) (2011)-continued [63] ............................ 125
Table 55. IPP’s Power Plants [65] .................................................................................................... 131
Table 56. IPP’s Power Plants Will be Operated [64] ........................................................................ 133
Table 57. Retail Price of Fuel Oil (as per April 2014) ...................................................................... 141
Table 58. The subsidy of non-conventional energy per type of fuel. ................................................ 142
Table 59. The potency of geothermal in Indonesia [Anang, H , PLN 2014) .................................... 149
Table 60. Geothermal power plant capacity [37]. ............................................................................. 150
Table 61. The government’s target in the “Energy Mix” is to realize 9500 MWe operated by
year 2025 ........................................................................................................................... 150
Table 62. Industrial Minister Regulation No. 54/2012 .................................................................... 154
Table 63. Local Industries which get involved in Geothermal Power Plan Development in
Indonesia ........................................................................................................................... 156

ix
List of Figures Figure 1: Names of Provinces of Indonesia ....................................................................................... 3
Figure 2: Electrification rate at each province in 2012 ...................................................................... 8
Figure 3: Trends of energy consumption per capita 2000-2011[24] .................................................. 8
Figure 4: PLN’s Power Plant Composition (Total 35,617 MW, 2012) [10] .................................... 11
Figure 5: The role of IPPs compare to PLN, for electricity power generation (MW) [10] .............. 11
Figure 6: Energy Resources for Electricity Generation Share in 2013 [10] .................................... 13
Figure 7: Energy Mix 2011 (Source: Hasrul, ESDM, 2012) ........................................................... 14
Figure 8: Target Energy Mix 2025 [32, 33] ..................................................................................... 14
Figure 9: Intensity of Solar Radiation in Indonesia (kWh/ m2/ day) [29] ....................................... 21
Figure 10: Solar Cell Power Generation, PLTS at Morotai Island [50] ............................................. 22
Figure 11: Sumba’s wind energy mapping [37] ................................................................................. 24
Figure 12: West Timor’s wind energy mapping [37]......................................................................... 24
Figure 13: A typical of biogas collector [39] ..................................................................................... 28
Figure 14: Installed Geothermal Power Plant (GPP) [43] ................................................................. 31
Figure 15: Geothermal working area in Indonesia [43] ..................................................................... 31
Figure 16: Projects in geothermal power plant [43] .......................................................................... 32
Figure 17: Trend of Energy Supply and demand in Indonesia [46] ................................................... 43
Figure 18: Trend of primary energy supply by fuel type in Indonesia [37] ....................................... 44
Figure 19: Trends of final energy consumption by sector in Indonesia [37] ..................................... 44
Figure 20: Distribution share of final energy consumption ............................................................... 45
Figure 21: Efficiency of power generation and thermal power plants [59] ....................................... 48
Figure 22: Basic Allocation Expenses (BPP) and Average Selling Price of Electricity
1990-2010 ......................................................................................................................... 98
Figure 23: National’s Installed Capacity of Power Plant by Type (MW) (2005-2011) ................... 114
Figure 24: Local players are producing 3 MW geothermal equipment ........................................... 156
Figure 25: Pilot plant for geothermal energy ................................................................................... 156

x
ABBREVIATIONS
BPPT Badan Pengkajian dan Penerapan Teknologi, Agency for the Assessment and
Application of Technology
CPO Crude palm oil
LAPAN Lembaga Penerbangan dan Antariksa Nasional, Institute of Aeronautics and
Space Agency of Indonesia
LIPI Lembaga Ilmu Pengetahuan Indonesia, Indonesian Institute of Sciences
MBOE Million barrel oil equivalent
MEMR Ministry of Energy and Mineral Resources
PLTA Pembangkit Listrik Tenaga Air, Hydropower Electric Power Generation
PLTB Pembangkit Listrik Tenaga Bayu, Wind Power Electric Power Generation
PLTD Pembangkit Listrik Tenaga Diesel, Diesel Oil Electric Power Generation
PLTSa Pembangkit Listrik Tenaga Sampah, Municipal Solid Waste Electric Power
Generation
PLTS Pembangkit Listrik Tenaga Surya, Solar Power Electric Power Generation
PLTGU Pembangkit Listrik Tenaga Gas dan Uap, Gas and Steam Electric Power
Generation
PLTU Pembangkit Listrik Tenaga Uap, Steam Electric Power Generation
PLTM Pembangkit Listrik Tenaga Minihidro, Mini-hydro Electric Power Generation
PLTG Pembangkit Listrik Tenaga Gas, Gas Electric Power Generation

A. National Scenario for Sustainable Energy
General Information
With considerable economic, population growth and the resulting increase in energy demand
and consumption, Indonesia has the interest to manage and use energy as effectively and as
efficiently as possible. Indonesia's economic growth ranged from 6.2% in 2010, 6.5% in
2011, 6.2% in 2012, and 5.78% in 2013, while GDP per capita (PPP) in 2013 was US 5,180
[1]. The population growth was at 1.49%/year in last decade [2]. The increase in energy
consumption was on average 7% per year [3].
Development and utilization of new and renewable energy become a priority in the energy
development programme of Indonesia. Solar energy, biomass, wind, hydro power and
geothermal are renewable energy resources that have been used to produce electricity to
fulfill the increasing demand on electricity. Biomass, as raw material for production of
biodiesel and bioethanol, to be utilized to substitute the fossil fuel, has become one of main
concerns.
Various regulations and programmes have been launched to drive the investment, production
and utilization of renewable energy for electricity power generation and for transportation. A
list of laws and regulations related to sustainable energy and energy efficiency programme is
shown in Appendix A.
There are four main sectors of energy users, namely household, commercial, industrial and
transportation. In 2011, the largest energy user was the industrial sector with a share of
32.2%, and households 28% and transportation 24.5% [4]. Household energy consumption
was tending to decrease, while energy for transportation was on the increase. Table 1 shows
the progress of energy consumption by sectors in last five years.
The primary sources of energy still come from fossil fuels, namely 46.9% from oil, 26.4%
from coal, and 21.9% from natural gas. The remainder is made up of hydro power and other
renewable energy [5]. Hydro power and other renewable energies only make up about 4.8%
from the total of utilized energy resources.

2
In the past, the government has put a lot of subsidies for fuel oil for transportation, gas for
households, electricity, and fertilizers in order to support to support low income families and
micro and home industries. Overall, subsidies for energy are the biggest proportion of
government subsidies. For 2014, the government allocated energy subsidy could be as much
as Rp 282.1 trillion (US $ 24.5 Billion, as the rate in March 2014 is around Rp 11,500/US $)
[6]. Table 2 shows the government budget planning for energy subsidy for 2012 to 2014.
Table 1: Energy Consumption by Users
No Sector 2008 (%) 2010 (%) 2011 (%)
(*) (**) (*) (**) (*) (**)
1 Industrial 33.03 40.58 33.30 39.31 33.28 37.78
2 Transportation 21.71 31.30 23.95 32.19 24.09 33.73
3 Households 34.94 13.44 29.09 10.27 28.75 10.23
4 Commercial 3.22 4.43 3.10 4.00 3.05 3.91
5 Others 7.10 10.25 10.56 14.23 10.95 14.26
Total (%) 100 100 100 100 100 100
Total (MBOE) 906.8 628.97 1,067.5 793.94 1,114.76 834.72
Notes: Recalculated from Reference [4], pp 20-21.
MBOE (Million barrel oil equivalent); (*) Biomass included; (**): Biomass excluded.
Table 2: Government Subsidy for Energy
Year Subsidy for energy (Rp, in trillion) References
Electricity Fuel oil Total
2014 71.4 210.7 282.1 [6]
2013 80.9 193,8 274.7 [7]
2012 45 123.6 168.6 [8]
Note: [6], [7], [8],APBN 2014, 2013, and 2012. The Government Budget Planning for 2014, 2013 and 2012,
respectively.
The government has taken necessary steps in anticipating and responding to a surge of energy
needs, especially electrical energy. One of the first steps was to create a blueprint National
Energy Management 2006-2025 (Presidential Decree, number 5 in 2006). There were two

3
kinds of approach to be conducted in stages until 2025, i.e. an increase in energy efficiency
(savings) and utilization of new and renewable energy sources (energy diversification).
Given the electrification ratio was still relatively low at 63% in 2005 [9], 80.4% in 2013 [10]
while Indonesia is targeting more than 95% electrification ratio in 2020, the discussion in this
report would be on the promotion and utilization of alternative energy source for generating
electricity, especially for rural areas.
Topology and Administrative
Indonesia is the largest archipelago country with more than 13,466 islands (islands with
names), and the coastline is more than 99,000 km [11]. The length from east to west is around
5,150 km, width of 1,700 km, with a land area of 1.9 million square km and sea of 7.9 square
km. The covered area of Indonesia is about 9,822,570 km2. As a country within the ring of
fire, there are more than 80 major active volcanoes scattered around the islands [12].
In 2013, Indonesia consisted of 34 provinces (see Figure 1). Each province is divided into
several regions (Kabupaten) headed by Bupati, and Municipal/City (Kota) headed by
Walikota (Mayor). Currently, the number of Kabupatensis 410, and the number of Kotas is
98[13]. Each Kabupaten consists of several Kecamatan, headed by a Camat. The number of
provinces and regions in near future might be increased. As of March 2014, the Indonesian
Parliament is considering a number of proposals to establish new provinces and regions
(DPR, Dewan Perwakilan Rakyat).
Figure 1: Names of Provinces of Indonesia

4
Population, Households and Electrification Rate
Population and Households
In 2010, the population was 237.5 million, and it is estimated that Indonesian population
would be of 321 million in 2025 [14]. In the period of 2000 to 2010, population growth was
1.49% per year. In 2010, the ratio of men and women was of 119.5 million and of 118million
respectively [15]. 54% of the population lives in urban areas, while 46% of the population
lives in rural areas [16]. Java Island is the most populated island with more than 135 million
people living on the island. The Figure of population density at each province is shown in
Table 3.
In 2010, 34.4% of the population was at the productive age of 15-35 years. Dependency ratio
was 51.3%, meaning that 100 productive people have to take care of 51.3 unproductive
people. The dependency ratio is predicted to be 40% at year 2030[17].
Table 3: Population Density per Provinces of Indonesia [15]
No Provinces Population (in millions)
1 Aceh 4.48
2 North Sumatera 12.98
3 West Sumatera 4.84
4 Riau 5.54
5 Riau Islands 1.69
6 Jambi 3.09
7 South Sumatera 7.44
8 Bangka Belitung 1.22
9 Bengkulu 1.71
10 Lampung 7.59
11 Banten 10.54
12 DKI Jakarta 9.59
13 West Java 43.02
14 Central Java 32.38
15 DI Yogyakarta 3.45
16 East Java 37.47
17 Bali 3.89
18 NTB 4.49

5
19 NTT 4.68
20 West Kalimantan 4.39
21 Central Kalimantan 2.2
22 South Kalimantan 3.63
23 East Kalimantan 3.55
24 North Sulawesi 2.27
25 Gorontalo 1.04
26 Central Sulawesi 2.63
27 West Sulawesi 1.16
28 South Sulawesi 8.03
29 West-South Sulawesi 2.23
30 Maluku 1.53
31 North Maluku 1.03
32 West Papua 0.76
33 Papua 2.85
34 North Kalimantan
Total 237.6
In 2013, 28.5 million (11.47% of the population) people were living below the poverty line –
8.52 among the urban population and 14.42% among the rural population. According to BPS,
the poverty line income was of Rp 308,000/capita/month in urban areas and Rp
275,800/capita/month in rural areas (18). The currency rate in early 2013 was Rp 9,500 to
US$1.
Electrification Rate
Indonesia’s economic development triggered a high growth in national electricity demand.
Unfortunately supply could not fulfil the demand. As a result, Indonesia is facing electricity
shortage in several areas. Several provinces have electrification rates less than 60% and
thousands of islands are without access to the electricity grid [10]. Figure 2 shows
electrification rate in each provinces of Indonesia.
In 2011, the electrification rate was 70.4% of the total number of households. The number of
households in 2011 was 60,2million [19]. In 2013, this rose to 64 million [20]. In 2013, the
electrification rate increased to 79.6%. PLN is targeting 96.8% electrification rate by 2020
[10].

6
The electrification rate of households varies from province to province. The highest
electrification rate for urban areas is 99.91% (Jakarta), while the lowest is 96.42% (Papua).
For rural areas, the highest electrification rate is 99.11% (West Java) while the lowest is
23.02% (Papua). In some areas, the electrification rate of households in urban areas is much
higher than those in rural. In 2012 for example, in Riau province in urban areas the
electrification rate was 94.88%, while in rural areas it was only 46%. In Papua province, the
rate in urban areas was93.44%, whereas in rural areas was 12.53%. In more detail, the
electrification rates of households in urban and rural areas are shown Table 4, while Figure 2
shows average electrification rate per provinces.
Table 4: Percentage of Households in Urban and Rural Received Electricity from PLN’s Grid in year 2010-2012 [21]
No Provinces 2010 2011 2012
Urban Rural Urban Rural Urban Rural Note
1 Aceh 96,57 88,81 98,79 92,59 98,68 93,86
2 Sumatera
Utara 97,07 81,71 98,50 84,22 98,98 86,93
3 Sumatera
Barat 94,79 78,45 95,41 81,57 98,34 85,55
4 Riau 86,05 37,25 93,06 40,99 94,88 46,08
5 Kepulauan
Riau 91,29 59,86 95,93 48,73 95,30 46,06
Many
islands
6 Jambi 90,95 67,30 94,42 67,94 95,97 74,89
7 Sumatera
Selatan 94,21 65,62 97,41 70,63 97,64 77,19
8 Kepulauan
Bangka
Belitung
90,09 55,39 91,91 66,57 94,59 78,72
9 Bengkulu 96,27 69,56 96,68 69,91 98,13 81,78
10 Lampung 92,39 74,40 98,04 77,24 98,85 79,16
11 DKI Jakarta 98,79 - 99,65 - 99,82 No rural
12 Jawa Barat 98,33 96,06 98,71 96,99 99,33 97,98
13 Banten 98,15 91,57 99,03 96,16 99,16 98,16
14 Jawa Tengah 98,59 97,95 99,32 98,18 99,72 98,96
15 DI Yogyakarta 99,77 99,21 99,48 99,64 99,57 99,05

7
16 Jawa Timur 98,42 96,49 98,79 96,57 99,63 97,92
17 Bali 98,24 94,58 99,39 95,55 99,30 97,70
18 Nusa Tenggara
Barat 88,40 76,58 94,83 80,30 98,64 88,01
Many
islands
19 Nusa Tenggara
Timur 92,09 32,83 95,78 31,82 97,56 38,84
Many
islands
20 Kalimantan
Barat 96,27 56,74 96,21 60,68 96,82 64,55
21 Kalimantan
Tengah 90,43 48,02 94,19 51,41 96,93 54,50
22 Kalimantan
Selatan 97,12 84,46 98,30 83,32 99,04 88,03
23 Kalimantan
Timur 94,54 60,73 93,54 60,65 96,61 58,49
24 Sulawesi Utara 95,73 90,62 97,72 89,66 98,29 92,56
25 Gorontalo 91,49 60,89 95,01 62,63 95,15 64,23
26 Sulawesi
Tengah 91,87 61,04 96,06 64,58 97,13 71,14
27 Sulawesi
Selatan 97,41 82,37 98,57 81,05 98,57 84,75
28 Sulawesi Barat 86,22 34,41 90,02 40,39 96,01 44,27
29 Sulawesi
Tenggara 93,64 59,07 95,91 67,86 96,05 72,67
30 Maluku 93,07 61,94 91,93 58,08 94,96 61,35
31 Maluku Utara 90,30 54,22 97,11 52,65 94,69 59,24
Many
islands
32 Papua 86,29 14,58 92,65 12,47 93,44 12,53
33 Papua Barat 86,54 49,25 96,18 48,33 98,39 49,78
34 North
Kalimantan - - - - - -
No data
Source: Ministry of Energy and Mineral Resources, 2012

Figure 2
Energy Consumption per Capita
Energy consumption per capita
compared to Japan which has an energy consumption
consumption per capita was much lower than avera
energy consumption per capita
(Note: Primary energy supply, excluded Biomass)
Figure 3: Trends of energy consumption per capita 2000
-
1.00
2.00
3.00
4.00
5.00
6.00
2000 2001
Final Energy Consumption per Capita *) BOE/capita
Primary Energy Supply per Capita *) BOE/capita
8
2: Electrification rate at each province in 2012
per Capita
pita was around 3.46 BOE/capita in 2011,which is
which has an energy consumption of 29.8 BOE/capita [22]
consumption per capita was much lower than average world consumption.
energy consumption per capita since 2000 are shown in Figure 3 [23].
(Note: Primary energy supply, excluded Biomass)
Trends of energy consumption per capita 2000-2011[24]
2001 2002 2003 2004 2005 2006 2007 2008 2009 2010
Final Energy Consumption per Capita *) BOE/capita
Primary Energy Supply per Capita *) BOE/capita
which is very low
of 29.8 BOE/capita [22] The
ge world consumption. The trends of
[24]
2010 2011

9
Electricity consumption in 2011 was 655 kWh/capita, and in 2013was 900 kWh. Data in
2010 showed that Indonesia electricity consumption per capita was lower than many other
countries in ASEAN such as those in Malaysia of 3490, Thailand of 2079, and Vietnam
799kWh/capita [25]
Administrative set up for Energy Issues
The Ministry of Energy and Mineral Resources (MEMR) governs all energy issues
nationally, included new and renewable energy resources. Since December 2013, regarding to
sustainable energy, under new organizational structure of MEMR, there are three directors
under the Director General of New, Renewable Energy and Energy Conservation namely
Director for Geothermal, Directors for Bioenergy and Director for New and Renewable
Energy.
The MEMR on behalf of the Government of Indonesia, proposes law to the DPR, define
regulations, and determine national policies concerning energy, including energy subsidy.
Besides that, the ministry also establishes and enforces standards and procedures on energy.
The Dinas Energi dan Sumber Daya Mineral Propinsi (Office of Energy and Mineral
Resources of Province, an agency under Governor)engage with energy issues at the
provincial level. The function of the office is to define provincial regulations, to determine
cross regencies/cities management policies regarding energy issues. In reality, the office was
just implementing the regulations and procedures determined by the ministry.
At the regency level, Dinas Energi Kabupaten (Office of Energy of Kabupaten, an agency
under Bupati) works on energy issues at Kabupaten level. The office defines regency level
regional regulations, provides guidance and supervision on regency endeavors and
determines management policies within regency. It is important to be noted that in reality, the
offices were just implementing the regulations and procedures determined by the ministry.
The Ministry of Finance provides funding to promote utilization of renewable energy, to
support efforts for energy saving, etc. Banks and BRI provide loans to support utilization of
renewable energy through Kupedes.

10
PLN is the only state owned company that produces electricity and distributes it to users
nationwide. Private companies may produce electricity, and sell it to PLN to be distributed to
users [10]. The electricity tariff calculated and proposed by PLN to the MEMR to be
discussed to, and determined by the DPR (Source: www.pln.go.id).
In terms of investment, a local or foreign private company which plans to make an
investment, including for energy businesses, should be applied to Badan Koordinasi
Penanaman Modal, BKPM, (Investment Coordinating Board of Indonesia). BKPM is
responsible for issuing approval for an investment (Source: www.bkpm.go.id).
Pertamina is a state own company which produces and distributes fuel oil in Indonesia.
Before 2001, Pertamina was the only company which was allowed to distribute fuel oil, and
establish fuel filling stations / fuel dispensers in Indonesia. Since then, private and foreign
companies have been allowed to build fuel filling stations. Currently, companies such as
Shell, Total, Petronas, etc. are operating in Indonesia.
Current Power Sector Set-up
Electricity Generation
The electricity power generation in Indonesia is dominated by PLN. PLN controls
approximately 35,000 MW of installed generating capacity, or over 85% of Indonesia’s
electricity power. Most of electricity (46.6%) is produced through burning coal. The role of
sustainable energy in 2013 was still limited at 13.7%, predominantly through hydropower and
geothermal. The distribution of energy sources is shown in Figure 4.
PLN owns and operates 1,267 generation plants, and the main purchaser of electricity from
Independent Power Producers (IPPs). IPPs play a dominant role in generating electricity from
geothermal energy in Indonesia. The role of IPPs compared to PLN’s is shown in Figure 5.

11
Transmission and Distribution
PLN is the only provider of power transmission in Indonesia, it owns approximately 36,741
km of transmission lines, and 66,354 MVA of transmission transformer capacity. PLN is also
sole distributor of electricity to end customers in Indonesia, with approximately 685,785 km
of distribution lines and 36,430 MVA of transformer capacity. PLN serves approximately 46
million customers [10]. IPPs may produce electricity for themselves, or sell it to PLN. IPP’s
cannot sell it directly to users.
Figure 4: PLN’s Power Plant Composition (Total 35,617 MW, 2012) [10]
Note: (CCPP = Combine Cycle Power Plant, GTPP = Gas Turbine Power Plant)
Figure 5: The role of IPPs compare to PLN, for electricity power generation (MW) [10]

12
Retail Tariff
PLN, under control of MEMR, arranges and proposes electricity retail tariff. The MEMR
then proposes the tariff to the Parliament to be reviewed and approved. The tariffs are
clustered into several clusters namely household, business, industry, social activities, and
government. Each cluster is divided into several groups of electricity power limit. For
example, the household cluster is divided into six groups. The lowest power limit for
households is 450 VA. The tariff for each group in each cluster depends on the power limit
and the magnitude of electricity used. Users pay to PLN for regular/monthly fee plus charge
for utilization. Details of the tariff for households, commercial and industry clusters are
shown in Appendix B.
Example of Suitability of Established Technology
PLN and IPPs produce electricity utilizing established technologies based on large
hydropower, coal fired boiler, diesel fuel and geothermal power plant technologies. For
remoteareas PLN generates power mostly utilizing diesel power plants. In several small
cases, such as in Morotai Island, PLN also generates electricity utilizing PV based
technology. A pilot project for a feasibility study in Bali, PLN is also producing electricity
power utilizing wind power.
IPP and private industries are utilizing renewable material such as municipal solid waste,
biomass, agricultural or forestry solid waste. These sources have been utilized to generate
electricity at limited amount. Crude palm oil (CPO) processing industries, for example,
utilize empty fruit bunches of oil palm to generate electricity in order to produce a supply of a
few megawatts [26].
At Bantar Gebang, Bekasi, West Java, a private company generates electricity from Jakarta’s
municipal solid waste. Jakarta produces around 6000 tonnes per day of municipal solid waste.
The waste is dumped to Bantar Gebang. The company taps landfill gas in the dumping area,
and utilizes gas to generate electricity. Currently, it produces 10 MW electric power part of
26 MW their master plan [27].
Capital Cost Range
Appropriate data of capital cost range for electricity generation from various energy sources
in Indonesia could not be found yet.

13
Resources Availability and Access
Percentage Share of Different Primary Sources
Indonesia is a country that has abundant energy resources, a variety of fossils such as
petroleum, coal and natural gas, and new and renewable energy sources such as solar power,
wind power, hydropower, geothermal, biomass, tidal and raw material for nuclear power. In
addition, Indonesia has a potential for CBM, coal bed methane as well. Despite this potential,
Indonesia is still not able to meet the energy needs within the country as a result of the
significant increase in energy demand.
As shown in Table 1, the total energy consumption of Indonesia increased on average of
around 7% /year. A study conducted by the Agency for Assessment and Application of
Technology (Badan Pengkajian dan Penerapan Teknologi, BPPT) reported that based on
energy intensity data, utilization of energy sources were not yet efficient enough. (BPPT
2012). Another study [25] stated that Indonesiais not a rich of fossil resources country.
Unfortunately, most Indonesian people are not aware to the situation and not many efforts
have been made to explain the existing condition. Tumiran [25] mentioned that Indonesia
population is about 3.4% of the world population, whereas the fossil energy reserve in
Indonesia is below 3.4%, meaning that Indonesia’s fossil energy reserve per capita in
insufficiently low. Fortunately, Indonesia has a huge potential of renewable energy resources
which might play important role for future national energy mix.
Figure 6 shows the share of energy resources for electricity generation. From this we can see
that coal is currently the major source for electricity generation in Indonesia [10]. The share
of other resources is described in Figure 6.
Figure 6: Energy Resources for Electricity Generation Share in 2013 [10]

14
Diversification of energy (the energy mix) is a concept / strategy that can be used as a tool to
achieve economic and sustainable development. Energy mix policies have stressed that
Indonesia should not only depend on fossil-based energy sources but also develop the use of
renewable energy. Indonesia's energy mix policy needs be developed with a clear strategy,
target utilization and national energy management, taking into account the potential energy,
energy demand, energy infrastructure, and other factors such as energy prices, technology,
taxes, investments and so on.
In 2005, the main sources of energy supply in Indonesia were petroleum (54.78%), followed
by natural gas (22.24%), coal (16.77%), water (3.72%) and geothermal (2.46%). In 2011, the
main energy supply was petroleum oil (46.39%), Gas (21.9%), Coal (26.38%) and NRE
4.79%) [31]. When we compare with Business As Usual Scenario (for 2011, Figure 7), it
could be seen that dependency on oil was still high.
The government's goal in 2025 (as shown in Figure 8), is expected to realize optimal energy
mix, namely: petroleum (<20%), natural gas (> 30%), coal (> 33%), biofuels (> 5%),
geothermal (> 5%), renewable energy (> 5%) and liquefied coal (> 2%).
Figure 7: Energy Mix 2011 (Source: Hasrul, ESDM, 2012)
Figure 8: Target Energy Mix 2025 [32, 33]

15
Kerosene to - LPG Conversion Programme
Traditionally, wood and kerosene were primary energy sources for cooking and heating
processes at households, micro and small industries and micro and small traders. Since 2005,
the government has launched a programme to convert utilization of kerosene to LPG to be
used by households, micro and small industries and micro and small traders.
Under the programme, the government supported low income households and micro and
home industries by providing them with a suitable LPG gas stove, gas regulator, and a 3 kg
LPG gas container for free. Beside that the government gives subsidy for the 3 kg LPG
package utilized by those subsidy targets.
The programme was viewed as a successful programme since it could change traditional
dependence on kerosene for cooking in most households and home industries in Indonesia.
Currently most of households especially in Java, Bali, Madura (the most populated islands in
Indonesia) and several provinces of Sumatera utilize LPG for cooking and heating processes.
Recent data showed that in early 2014, LPG has been utilized by 48 million households [34]
out of 64.06 million household in Indonesia at end of 2013 [35]. The programme is still
continued to other provinces in Indonesia.
Potential and Install Capacity in Development of Renewable Energy
Renewable Energy Power Plant
In the last 10 years, world demand for renewable energy sources increased at a rate of nearly
25% per year. This increase was driven by: (i) increasing electrical energy requirements, (ii)
increasing desire to use cleaner technologies, (iii) continued rising prices of fossil fuels,
(iv) increased cost of construction of transmission lines, and (v) increased to increase
assurance energy supply. To be able to increase the role of renewable energy quickly, the
price and reliability of renewable energy-based electricity generation should be able to
compete with conventional power [48].
In Indonesia, renewable energy sources have been utilized for electric power generation and
for household purposes for many years. The potential and uses are shown in Table 5.

16
Table 5: Potential and Installed Capacity of Renewable Energy (both Grid-connected and Off-grid) in Indonesia (up to 2011) [36]
No Renewable Energy Potential (MW) Installed
Capacity (MW)
Ratio (%)
1 2 3 4 5 = 4/3
1 Large hydro 75,670 5,705.29 7.54
2 Geothermal 29,038 1,189 4.00
3 Small hydro (Micro-hydro) 769.69 217.8 19 28.31
4 Biomass 49,810 1,618.40 3.25
5 Solar 4.80
kWh/m2/day
13.5 -
6 Wind 3-6 m/s 1.96 -
7 Sea 43,000 - -
Java Island is the most populated island in the country. However, the island has insufficient
energy resources to fulfill the energy need. On the other hand, Sumatera and Kalimantan are
much less densely populated, but the island possesses an abundance of energy resources. So,
the distribution and transportation cost of fuel and electricity from island to island become a
challenge for energy management in Indonesia. Table 6 shows the share of energy supply in
major islands in the country.
Table 6: Primary energy supply share in Indonesia [37]
Regional Oil (%) Natural gas (%) Coal (%) Hydropower (%) Geothermal
(%)
Java 19 6 0 6 34
Sumatra 69 55 50 21 47
Kalimantan 9 14 50 29 0
Sulawesi 1 2 0 14 8
Others 2 24 0 31 10
Hydro Power
Hydropower is one of renewable energy technology that is commercially viable on large
scale in Indonesia. Moreover, hydropower dams have made important and significant

17
contributions to economic and human development. Firstly, it is a renewable energy source
and produces negligible amounts of greenhouse gases. In the long term, it produces large
amounts of electricity at low cost and it can be adjusted to meet consumer demand.
Furthermore, hydro dams are multipurpose and are built primarily for socio-economic
developments such as irrigation, water supply, flood control, electric power and for tourism.
Indonesia has a huge amount of hydropower resources. The potential of hydropower was
estimated at about 75,000 MW, which ranks Indonesia fourth in Asia after China, the former
Russian Federation and India. [37] However, only 34,000 MW of 75,000 MW is exploiTable.
This is basically due to the high capital investment required to develop dams and the
frequency of the emergence of socio-environment issues. In Indonesia, the development of a
hydropower dam is overwhelmingly complex as the issues are not confined to the design,
construction and operation of dams themselves but also involve issues of social,
environmental and political dimensions. [37]
An advantage of hydropower is generally obvious from both economic and environmental
aspects. Economically, hydropower apparently has a relatively low cost of production. As
well as this, hydropower generally has a long life of approximately 50-100 years [49]. In
terms of environmental issues, the reduction in carbon emissions from the use of clean energy
sources such as water power is clearly a valuable contribution to the environment.
But there are also negative effects on the environment caused by the construction of
hydropower dams. These large dams typically disrupt the ecological balance of rivers and
lakes. Table 7 shows the installed capacity of hydropower stations in Indonesia.
Table 7: Installed capacity of hydropower station in Indonesia [37]
Station Installed capacity
(MW) Total
1. Aceh
PLTA Angkup – –
PLTA Peusangan 2 × 22.1 MW; 2 × 21.2 MW 86.6 MW
2. North Sumatra
PLTA Sigura-gura 4 × 71.50 MW 286 MW

18
PLTA Tangga 4 × 79.25 MW 317 MW
PLTA Lau Renun 2 × 41 MW 82 MW
PLTA Sipan Sihaporas 2 × 25 MW 50 MW
PLTA Asahan I 2 × 90 MW 180 MW
3. West Sumatra
PLTA Agam 3 × 3.5 MW 110.5 MW
PLTA Maninjau 4 × 17 MW 68 MW
PLTA Singkarak 4 × 43.75 MW 175 MW
4. Bengkulu
PLTA Tes 4 × 4 MW 16 MW
PLTA Musi 3 × 70 MW 210 MW
5. Riau
PLTA Koto Panjang 3 × 38 MW 114 MW
6. Lampung
PLTA Besai 2 × 46.4 MW 90 MW
PLTA Batu Tegi 2 × 14 MW 28 MW
7. West Java
PLTA Ubrug 2 × 10.80 MW; 1 × 6.30 MW 17.1 MW
PLTA Bengkok 3 × 3.15 MW; 1 × 0.70 MW 3.85 MW
PLTA Cibadak – –
PLTA Cikalong 3 × 6.40 MW 19.2 MW
PLTA Saguling 4 × 175 MW 700 MW
PLTA Cirata 8 × 126 MW 1.008 MW
PLTA Jatiluhur 7 × 25 MW 175 MW
PLTA Lamajan 3 × 6.40 MW 19.2 MW
PLTA Parakan Kondang 4 × 2.48 MW 9.92 MW
8. Central Java
PLTA Jelok 4 × 5.12 MW 20.48 MW
PLTA Timo 4 × 3 MW 12 MW
PLTA Ketenger 2 × 3.52 MW 7 MW
PLTA Gajah Mungkur 1 × 12.4 MW 12.4 MW
PLTA Garung 2 × 13.2 MW 26.4 MW
PLTA Wadas Lintang 2 × 8.2 MW 16.4 MW
PLTA Mrica 3 × 61.5 MW 184.5 MW

19
PLTA Kedung Ombo 1 × 23 MW 23 MW
PLTA Sidorejo 1 × 1.4 MW 14 MW
PLTA Klambu 1 × 1.1 MW 1.1 MW
9. East Jawa
PLTA Mendalan 3 × 5.8 MW 23 MW
PLTA Siman 3 × 3.6 MW 10.8 MW
PLTA Giringan 2 × 1.35 MW; 1 × 0.5 MW 3 MW
PLTA Selorejo 1 × 4.48 MW 4.48 MW
PLTA Karangkates 3 × 35 MW 105 MW
PLTA Wlingi 2 × 27 MW 54 MW
PLTA Lodoyo 1 × 4.5 MW 4.5 MW
PLTA Sengguruh 2 × 14.5 MW 29 MW
PLTA Tulung Agung 2 × 23 MW 46 MW
PLTA Tulis 2 × 7 MW 14 MW
10. South Kalimantan
PLTA Riam Kanan 3 × 10 MW 30 MW
11. North Sulawesi
PLTA Tonsea Lama 1 × 4.44 MW; 14.38 MW
1 × 4.5 MW;
1 × 5.44 MW
PLTA Tanggari I 1 × 17.2 MW 17.20 MW
PLTA Tanggari II 1 × 19 MW 19 MW
12. South Sulawesi
PLTA Larona 3 × 55 MW 165 MW
PLTA Balambano 2 × 65 MW 130 MW
PLTA Karrebe 2 × 70 MW 140 MW
PLTA Bakaru 2 × 63 MW 126 MW
13. Cental Sulawesi
PLTA Sulewana Poso I 4 × 40 MW 160 MW
PLTA Sulewana Poso II 3 × 60 MW 180 MW
PLTA Sulewana Poso III 5 × 80 MW 400 MW
Besides large hydropower, Indonesia also has potential for small hydropower across the
country. The potential of micro hydro is estimated to be about 459.91 MW. Of this, 20.85

20
MW or 4.54%of the potential has been developed by the PLN for power generation in rural
areas [37]. The potential sites are located in West Kalimantan, West Sumatra and Central
Sulawesi, while the largest installed capacity of micro hydro can be found in North Sumatra,
Central Java, West Java and Bengkulu. Indonesia, as a tropical country, possesses several
large and many small rivers. As a result, it is highly possible that the development of micro
and mini hydropower plants could play a prominent role for future energy mix of the country.
About 6000 plants of the mini hydropower range (300 kW to 5 MW) are economically
feasible these days. Considering these potential small-scale of hydro are distributed evenly
around the islands, small hydro power plants are seen as one option that may be used as local
energy resource especially in remote areas for rural independent power generation. By
exploring this potential intensively with involvement of private sector, it gives an excellent
opportunity to develop energy sector as well as the policy. [37]
Solar Energy
Despite the fact that Indonesia is crossed by the equator, granting abundant amount of energy
source with considerably high intensity (up to 4.8 kWh/ m2/ day), the development and
utilization of solar power has not yet been sufficiently intensive.
Several studies [28, 29, 30] showed that, considering solar intensity, Indonesia is suitable for
the utilization of solar energy. In particular, the eastern part of Indonesia has the most
potential for developing this system. However, considering the high humidity level, the most
suitable technology should be searched. A study conducted by Irawan Rahardjo dan Ira
Fitriana [28] and Budi [29] show that many islands of Indonesia received solar intensity at
medium level (Figure 9).
The main problem for the use of solar energy is solar availability and variation of intensity.
Solar energy is only available during the day. Therefore, solar power system should work
with others system to store the energy in order to improve the reliability. Currently, a few
research activities conducted by universities and research institutions in Indonesia are
carrying out to get a suitable solar energy system for rural and urban area. Until 2012, the

21
largest solar cell system in country, at 600 kWp, was set up by PLN at Morotai Island. Figure
10 shows the PV solar power at Morotai Project.
Figure 9: Intensity of Solar Radiation in Indonesia (kWh/ m2/ day) [29]
Another example of result of solar resource assessment for particular area is at Sumba Island.
Currently 55% (4.45 MW) of Sumba Island electricity demand (8 MW) was supplied by solar
energy and micro hydro power generation. In this island, PLN successfully developed and
combined PLTMH and PLTS to fulfil local demand. Some examples of renewable energy
power station in the island are:
1 x 40 kWh PLTMH at Kamanggih Area,
2 x 800 kWh PLTMH at Lapopu Area
1 x 150 kWp (peak)PLTS at Salura Area
1 x 450 kWp at Semau Area,
1 x 2, 3 MW PLTMH Lokomombo
1 x 480 kWp PLTS at Bilachenge,
The local government set a target of making Sumba Island iconic for its utilization of
renewable energy technology by creating a target which aimed at 100% of locally available
energy coming from renewable energy sources. [30]

22
Figure 10: Solar Cell Power Generation, PLTS at Morotai Island [50]
Currently, the government has put significant attention to driving utilization of Solar Power
Electricity Generating System, Pembangkit Listrik Tenaga Surya, PLTS, as PLTS would be
useful for the people of Indonesia who live in the off-grid rural areas and remote islands. In
addition, PLTS is also hoped to support the programme for reduction of carbon dioxide (CO2)
emissions. A combination of PLTS and CO2 reduction is a government programme.
Utilization of solar power has the opportunity to eliminate more than 1 kg of CO2 for every
kWh of electricity it generates (compared to coal power plant) [50].
Currently, utilization of solar energy, especially solar water heaters in large houses or offices,
has become a trend as it improves the image of the houses or the company. Unfortunately, the
cost for installation is still considerably high for small houses, and for home and small
industries. During this report preparation, it was impossible to find any studies relating to the
assessment of potential of solar energy for water heating for households or industries in
Indonesia could be found.
By 2025, the Indonesian government plans to install a number of solar power systems with a
total capacity up to 1000 MW [51]. So, the solar power business opportunities in Indonesia,
specifically utilization of solar cell, are going to be very large and increase rapidly.
Unfortunately, competitive local technology is limited. There is no industry in Indonesia that
produces solar cells.

23
The challenge in optimally utilizing solar power is the preparation of human resources,
industry acceptance and energy subsidies. Barriers such as energy subsidies, as mentioned in
Table 2 above, result in a reduction in the development and application of solar energy
technologies. The government has recently been advised by a number of actors to reduce the
size of subsidy given to oil in order to create a level playing field for renewable energies.
Wind Power
As Indonesia is located on the equator, the potential of the wind power plant is relatively
small. However, based on available data, there are several areas in middle and east part
Indonesia, for example NTB and NTT Islands, which have great potential. Most of the
provinces in Indonesia have an average wind speed of about 4 m/s, except in the two
provinces NTB and NTT. Therefore, a suitable Wind Power Electricity Generation
(Pembangkit Listrik Tenaga Bayu, PLTB) developed in Indonesia is low speed turbine, and a
power plant with a small capacity, below 100 kW [52].
The main challenge on utilization of PLTB is the low availability of wind. In order to cope
with this problem, PLTB has to be operated in hybrid with other power sources. Electricity
generation could be coupled with other alternative energy sources or with conventional
plants. Although a PLTB usually generates power less than 100 kW, a dozen PLTBs have
been built and operated in the region. [52]
On islands such as NTB and NTT, where all their energy needs must be imported from other
islands of Indonesia, the presence of PLTB supports their energy independence. By utilizing
PLTB the need for fossil fuels from other islands would be reduced. As well as this, the use
of PLTB will increase the energy security of an area especially in off-grid rural areas. Again,
utilization of PLTB supports the government programme to reduce CO2 emission, as
compared with diesel power plant (usually used to generate electricity at remote island of
Indonesia), PLTB has the potential to reduce CO2 emissions of 700 grams per kWh of
electricity generated.
Utilization of wind power as an energy source in the country has a potential for further
development, specifically at coastal areas where relative high speed wind is available.
However, until now Indonesia has not had a comprehensive map of potential wind power yet.

24
Based on data collected by the Institute of Aeronautics and Space Agency of Indonesia
(LAPAN) in 120 locations, areas that have wind speeds above 5 m/sec are at West Nusa
Tenggara, East Nusa Tenggara, South Coast of Java and South Sulawesi. Example of
Sumba’s and West Timor’s wind energy mapping is given in Figure 11 and Figure 12.
Considering the wind speeds are between2 and 6 m/s, the suitable wind power generators to
be developed in Indonesia are small (10 kW) and medium scale power generations(10–100
kW). Indonesia has constructed 5 units of windmill generators across the country, each with a
capacity of80 kW and 7 other units with the same capacity have been developed in four
locations, North Sulawesi, the Pacific Islands, Selayar Island and Nusa Penida, Bali [37].
Figure 11: Sumba’s wind energy mapping [37]
Figure 12: West Timor’s wind energy mapping [37]

25
Biomass
Many doubted if bio-energy is a possible renewable energy solution, especially for bio-
energy derived from agricultural and aquaculture. This is because a biomass can require very
large land use and the production time is too long Moreover, it turns out the difference
between output energy and fossil energy used in the process is not too significant. It is also
worth noting that bio energy production also results in CO2 emissions, however this is
considerably less than that of fossil fuels. [37] So the challenge ahead is to determine whether
or not biofuels could compete with other energy sources. The technical challenge is how to
improve the efficiency of the process technology and how to accelerate the production of
energy resources.
Utilization of biomass into biofuels in Indonesia can be grouped in three ways: (i) the
combustion of solid biomass as traditionally used (ii) the production of fuel gas from biomass
such as biogas, and (iii) the production of liquid fuels from biomass (biodiesel, bioethanol).
The first is direct burning of biomass, traditionally used for cooking, heating processes, and
for steam generation for turbine applications. Until recently, small houses in rural or remote
areas still used wood or agricultural waste for cooking purposes. Typically, they utilized
waste material of forestry, agricultural processes such wood chips, coconut shells and
branches of trees. Recently, utilization of municipal solid waste for electricity generation,
Municipal Solid Waste Electric Power Generation (Pembangkit Listrik Tenaga Sampah,
PLTSa) started to be realized, especially to tap the methane gas from landfill areas [38], or to
burn the wastes.
Direct burning of biomass in this way has been generally discarded (except in PLTSa).
Although the technology is simple, its efficiency is very low and produces a lot of CO2. In
Indonesia, Municipal Solid Waste Electric Power Generation (PLTSa) considered as an
interesting solution to be developed, given the municipal waste production is increasing from
year to year, and land for dumping is becoming limited. Local government programmes to
build PLTSa are hindered due to rejection from the public who are concerned with
environmental pollution, especially air pollution. Implementation of an environmentally
sound technology for PLTSa is a challenge for future.
The second way to utilize biomass is the production of biogas from biomass. There are
several reasons behind the development of this technology in Indonesia. The biogas can be

26
used for regular burning / heating at households. It can also be used as a fuel to generate
electricity, and the solid waste could be utilized as fertilizer. Recently, many of biogas-to
electricity plants have come up in small and large farms, schools (Pesantren), rural housing
complexes, industrial estates, etc. [53]
The challenge for biogas production is that it requires certain initial investment to build the
system. This is particularly true for small farms and low income people in rural areas. It is
suggested that the government supports farmers on investment for construction of small
biogas plant.
The potential of small biogas systems for applications in rural areas is somewhat
encouraging. The waste from buffaloes, pigs and cows can be found in all provinces in
Indonesia, though the quantities are in different amounts. Table 8 shows the summary of
biogas energy potential by province in Indonesia and Table 9 shows major biomass energy
potential as energy resources. Figure 13 shows typical small scale biogas digester in village
or at home industries.
Table 8: Biogas Energy Potential in each Province [37]
Province Biogas potential (MW)
East Java 125.9
Central Java 63
NTT 56.7
North Sumatra 46.8
Aceh 42.7
South Sulawesi 28.8
West Java 40.1
Bali 32
NTB 28.2
South Sumatra 26.8
West Sumatra 10–19
West Kalimantan, and Lampung, -
Other provinces <10

27
Table 9: Major biomass energy potential as energy resources [37]
Biomass Main region Production
(million tons/
year)
Technical
energy
potential
(GJ/year)
Remarks
Rubber wood Sumatra,
Kalimantan, 41 (replanting) 120
Small log < 10 cm medium
and big logs are
Java used as fire wood in brick and
roof tile industry
Logging
residues
Sumatra,
Kalimantan
4.5 19
Sawn timber
residues
Sumatra,
Kalimantan
1.3 13 Residues of the factory often
used as fire wood by local
communities, residue available
for free
Plywood and
veneer
Kalimantan,
Sumatra,
1.5 16 Residues are generally used
yet
production
residues
Java, Irian Jaya,
Maluku
Sugar
residues
Java, Sumatra, Bagasse: 10 78 Bagasse is generally used in
sugar factories
Sulawesi,
Kalimantan,
Cane tops: 4 (90%), The use of cane leaf
and tops need to be
Bali/Nusa
Tenggara
Cane leaf: 9.6 investigated
Rice residues Java, Sumatra, Husk: 12 150 Stalk and straw are generated
at the field and
Sulawesi,
Kalimantan,
Bran: 2.5 generally burnt, in some areas
used for feeding
Bali/Nusa,
Tenggara
Stalk: 2 or raw material for paper
industry
Straw: 49 Husks often burnt uncontrolled
Coconut
residues
Sumatra, Java,
Sulawesi
Husk: 12 7 Residues are used generated
decentralized and
Bran: 2.5 usually left on the plantation

28
field. Largely
Stalk: 2 Straw:
49
used as Firewood and for
production charcoal
Palm oil
residues
Sumatra, new
areas: Empty fruit 67
Palm cells and fiber are
common fuel source,
Kalimantan,
Sulawesi,
Bunches: 3.4 EFB are generally incinerated
Maluku, Nusa Fibers: 3.6
Tenggara, Irian
Jaya Palm shells: 1.2
Figure 13: A typical of biogas collector [39]
The third way is to produce liquid fuels from biomass. In Indonesia, the biggest focus on the
development of biodiesel oil from fruit oil (palm oil, jatropha oil) and from cooking oil
waste, and bio-ethanol molasses, tapioca starch, and other kind of starch. In last few years,
many research institutes and universities attempt to utilize lignocellulosic agricultural and
forestry waste material as raw material to produce bioethanol. The latter are mostly at lab or
pilot scales. [42]
Utilization of bio-ethanol as fuel in Indonesia is that it reduces the use of gasoline as
currently a blend of bio-ethanol (5%) into 95% gasoline (Pertamina Premium, RON 90)
called as bio premium. Pertamina, the state-owned company that produces and distributes

29
gasoline in Indonesia, has wisely planned to increase the amount of bioethanol in bio
premium to 10% and 15% steps.
Indonesia was known as the largest palm oil producer in the world after overtaking Malaysia
in 2006. The country produce 21.6 million tons of palm oil, rise 3.8% from 2009. One of the
factors leading to higher production is the expansion of palm oil plantation area by 6.7% to
5.73 million hectare in 2010. Most of the CPO (around 60%) that is exported to other
countries is still in a raw form and is considered as a low value-added industry. Owing to the
abundance of raw materials in the country, it has been utilized for biodiesel as an alternative
fuel. Since 2013, 10% of biodiesel oil (derived from palm oil) mixed with 90% of diesel oil,
bio solar, has been utilized. Currently Indonesia is the largest biodiesel producer in the Asia-
Pacific.
Geothermal
In Indonesia, geothermal power plant is an increasingly significant source of renewable
energy as deeply discussed. As a consequence of Indonesia’s location in The Ring of Fire and
its volcanic geology, the country is blessed with untapped potential of geothermal energy. It
is estimated, the country has 28,000 MW of geothermal potential, corresponds to 40%of
world’s potential geothermal resource. The country constructed about 1200 MW of power
plant from seven geothermal areas in North Sulawesi, North Sumatra, and Java. In 2009,
geothermal energy represented 1.22% of the country’s total energy supply and 3.6% of its
electric power. The country also plans to develop nine other Geothermal Working Areas
(GWA) such as GWA Seuwalah Agam (Aceh), GWA Soboi (Aceh), GWA Jailolo (North
Maluku), GWA Telaga Ngebel (East Java), GWA Ungaran (Central Java), GWA Gunung
Tampomas (West Java), GWA Cisolok-Cisukarame (WestJava), GWA Tangkuban Perahu
(West Java), and GWA Sokoria[37]. Geothermal distribution potential in Indonesia by region
is given in Table 10 and geothermal power plant capacity is presented in Table 11.
Table 10: Geothermal distribution potencies by region [37]
Area Resource (MW)
Speculative
Hypothetic Reserve (MW)
Probable
Possible Proven
Sumatra 4975 2121 5845 15 380
Java 1960 1771 3265 885 1815

30
Bali-Nusa
Tenggara 410 359 973 – 15
Sulawesi 1000 92 982 150 78
Maluku 595 37 327 – –
Kalimantan 45 – – – –
Papua 75 – – – –
Total 9060 4380 11392 1050 2288
Table 11: Geothermal power plant capacity [37]
Working Area Location Turbine capacity
1 × 30 MWe
Operator Total capacity
PLTP Kamojang West Java 2 × 55 MWe 1 × 60
MWe
PLN 200 MW
PLTP Lahendong
(Pertamina) North Sulawesi
2 × 20 MWe 1 × 20
MWe PLN 60 MW
PLTP Sibayak
(Pertamina) North Sumatra 1 × 12 MWe Pertamina 12 MW
PLTP Salak
(Chevron GS)
West Java 3 × 60 MWe 3 × 65
MWe
PLN CGS 375 MW
1 × 55 MWe PLN
PLTP Darajat
(Chevron GI)
West Java 1 × 90 MWe CGI 255 MW
1 × 110 MWe CGI
PLTP Wayang
Windu West Java
1 × 110MWe 1 ×
117 MWe SE 227 MW
PLTP Dieng
(Geo Dipa
Energi)
Central Java 1 × 60 MWe GDE 60 MW
Total 1189 MW
Source: M.H. Hasan et al. / Renewable and Sustainable Energy Reviews 16 (2012) 2316– 2328
Figure 14 and Figure 15 show the existing installed geothermal power plant (GPP) and
geothermal working area in Indonesia, respectively.

31
Figure 14: Installed Geothermal Power Plant (GPP) [43]
Source: Djadjang Sukarna (Energy Efficiency and Renewable Energy in Indonesia)
Figure 15: Geothermal working area in Indonesia [43]
In the Master Plan for Acceleration and Expansion of Indonesia Economic Development
(MP3EI) 2011-2025) document, it was stated that development of geothermal as electricity
generation plant is a priority programme. Figure 16 shows current geothermal project in
Indonesia.

32
Figure 16: Projects in geothermal power plant [43]
Government Policies to Scale Up Geothermal Development in Indonesia
The Government intends to accelerate and speed up the development of geothermal. In order
to drive development of geothermal electricity power plant, the government launched
strategies and policies such as:
- Presidential Regulation No. 04/2010 on Assignment to PT. PLN to Accelerate
Power Plant Development Using Renewable Energy, Coal and Gas
- MEMR Regulation No. 01/2012 as revised of Ministerial Regulation No.
15/2010 on Projects List of Power Plant Accelerated Development using
Renewable Energy, Coal and Gas as well as Related Transmission
- Target for Geothermal Power Plant Development on Crash Program 10.000 MW
Phase II
Development for Production on Existing Field : 465 MW
Development for not yet in production on Existing Field : 1535 MW
New Development Geothermal Working Area : 2925 MW
Total of Geothermal Development 4925 MW
In order to enhance the investment climate for both existing developers as well as new
entrants to the geothermal sector in Indonesia, the government launched:

33
1. Law No. 27/2003 on Geothermal and Government Regulations No. 59/2007 on
Geothermal Business Activities jo Government Regulations No. 70/2010 are the
basis of geothermal development Indonesia
2. Presidential Regulation No. 04/2010 jo Ministerial Regulation No. 01/2012 as
revised of Ministerial Regulation No. 15/2010 (2nd Stage of 10,000 MW Crash
Program) in order to speed up the development of geothermal power.
3. Pricing Policy
Ministerial Regulation of MEMR No. 02/2011 on geothermal price structure.
The MR gives certainty on electricity price from geothermal power plant:
- Electricity price as the result of a GWA tender, is represented as purchase
price by PT PLN in the Power Purchase Agreement, which is final and
non-negotiable
- Ceiling price for geothermal energy: US$ 9.7 cents/kWh
- If the price exceeds US$ 9.7 cents/kWh, negotiations between Parties are
needed.
Fiscal incentives for geothermal development (based on Government
Regulation No. 62/2008 jo No. 1/2007; MR of MoF No. 177/PMK.011/2007;
and MR of MoF No. 22/PMK.011/2011) :
- 30% of corporate income tax;
- 10% of added-value tax paid by the GoI;
- Custom duties exemption for geothermal developer;
- 25% per year depreciation for 8 years with double declining balance
method; and
- Investment tax credit 5% per year for 6 years.
Currently the mechanism of Feed in Tariff for each GWA is being developed
by the GoI in order to make geothermal business more attractive to investors.
4. Access to Potential Geothermal Resources for Investors
The Government offers a Preliminary Survey Assignment to third party
(investor) which provides “first right refusal”.
The GoI establishes new GWAs and widely open opportunities for investors to
participate in the geothermal business through GWAs tendering mechanism

34
5. In order to accelerate the tender process of new GWAs, the policies which
regulate bidding process are being revised in order to make the tender more
simple, transparent and bankable.
6. Coordinating with all relevant parties to accelerate and simplify the permit
process.
7. Related to Forestry Issues, currently MEMR and Ministry of Forest have signed
the MoU regarding the acceleration of geothermal utilization permit within
production forest, protected forest, and conservation forest.
8. The government has issued a Presidential Decree that guarantees support for
investment in Geothermal Infrastructure Project (PR No. 13/2010 jo PR
No.67/2005 and PR 78/2010) and Ministry of Finance Regulation No. 139/2011
(PMK No. 139/2011) which guarantee the business feasibility of PT PLN for
developing electricity from renewable energy, coal, and gas through cooperation
with Independent Power Producers.
Need and Demand for Energy: Electrical Power Condition in Indonesia
Electricity demand forecast conducted by PLN is as shown in Table 12.
Table 12: Electricity Demand Projection and Target Electrification Ratio [10]
Year Demand (TWh) (a) Electrification ratio (%) (b)
2013 189 79.2
2014 208 82.6
2015 227 85.9
2016 246 88.9
2017 266 91.9
2018 286 93.7
2019 308 95.3
2020 332 96.8
2021 358 97.4
2022 387 97.8
Notes: (a) Based on average annual growth 8.4%.
(b) Targeted electrification ratio.

35
Installed Capacity
At the end of December 2011, PLN and subsidiary companies owned and operated 5,269
generating units with total installed capacity of 29,268.16 MW, of which 22,513.61 MW
(76.9%) was installed in Java. The total installed capacity was up 8.82% compared to
December 2010.The total generating plant capacity broken down by type of power plant as
follows: Steam Turbine 12,053 MW (41.2%), Combined Cycle 7,834 MW (26.8%), Diesel
2,569 MW (8.8%), Hydro 3,511 MW (12%), Gas Turbine 2,839 MW (9.7%), and
Geothermal 435 MW (1.5%). [54]
Energy Production and Purchase
The PLN electricity production (included rented, and purchase from utilities outside PLN)
throughout 2011 was 183,421 GWh, up 8% over the previous year (2012 – 169,786 GWh).
Of the energy production, 47.4% was produced by PT PLN (Persero) Holding, and 52.6%
came from Subsidiary Companies, i.e. PT Indonesia Power, PT PJB, PT PLN Batam and PT
PLN Tarakan. [54]
24.3% of this energy production was produced by natural gas, 41.5% was produced by coal
fired, 31.6% by fossil oil, 7.8% by hydro and 2.6% came from geothermal. The share of oil,
coal and geothermal used for electricity production increased over the previous year, while
natural gas was constant relatively and hydro was decreased. [55]
Of this energy production, the energy purchased from other utilities outside PLN amount
40,681.87 GWh (22.2%). This was increased by 2,605.71 GWh or 6.8% over the previous
year. From the total energy purchased the greater parts were 9,415 GWh (23.1%) from PT
Paiton Energy Company and 8,162 GWh (20%) from PT Jawa Power. [55]
Market and Potential Services
Energy (Electricity) Sales
PLN’s total energy sales in 2011 were 157,993 GWh, up 7.3% from the previous year. [54]
Among groups of customers, energy was sold to:
a) Residential was the major share, consuming 65,111.57 GWh (41%),
b) Industry 54,725.82 GWh (35%),
c) Commercial 28,307.21 GWh (18%), and

36
d) Others (social, government office building, and public street lighting) 9,848.06
GWh (6%).
Electricity sold to Industry, Residential, Commercial and others group of customers increased
by 7%, 9%, 4% and 6% over the previous year. Total number of customers was 45,895,145 at
the end of December 2011. This was up 8% from the end of December 2010.
Sales of electric power in the last five years grew on average 8.5% per year, as shown in
Table 13.
Table 13: PLN’s Electricity Sales (TWh) [44]
Region 2007 2008 2009 2010 2011 Average
Indonesia 120.0 127.6 133.1 145.7 158
Growth (%) 7.6 6.4 9.4 10.7 8.5 8.5
Java – Bali 95.6 100.8 104.1 113.4 120.8
Growth (%) 7.4 5.4 3.3 8.9 6.5 6.3
Sumatera 14.7 16.4 17.6 19.7 21.5
Growth (%) 7.9 11.9 7.2 11.6 9.3 9.6
Kalimantan 3.9 4.2 4.7 5.1 5.7
Growth (%) 7.6 8.2 9.6 10.3 10.1 9.2
Sulawesi 3.9 4.2 4.6 5.1 5.6
Growth (%) 10.2 7.3 8.8 10.7 11.0 9.6
Maluku, Papua and Nusa
Tenggara
1.8 2.0 2.2 2.4 2.7
Growth (%) 12.3 8.3 9.9 10.7 13.0 10.8
From Table 13, it can be seen that the average growth in electricity sales in Java, Bali (6.3%
per year) is relatively lower than the average growth in Sumatra, Kalimantan, Sulawesi,
Maluku, Papua and Nusa Tenggara. Lower sales growth in Java Bali in 2007 was due to the
control of sales due to limited generation capacity in that year1. Furthermore, in 2008 the
global financial crisis began until the end of 2009, which led to the sale of electric power in
2009 growing only by 3.3%. In 2010, growth in Java led to a recovery from the effects of the
global financial crisis.
1No additional new plant in 2006 [55]

37
Sales of electric power in Sumatra grow much higher, at an average of 9.6% per year. This
growth is not balanced by the addition of generation capacity that only grew an average of
5.2% per year, so that in many areas of chronic power crisis by 2009 and addressed to the
rental power throughout 2010. [56]
Sales of electric power in Kalimantan grew by an average 9.2% per year, while the addition
of generation capacity on average only 1% per year, so that in many areas there was a power
crisis and limited sales.
Sales of electricity in Sulawesi grew by an average 9.6% per year, while the addition of
generation capacity on average grew only 2.7% per year. This has resulted in electricity
supply crisis until 2009, especially in the South Sulawesi. In 2010, this was partially resolved
by the renting of generators.
The same thing happened in the other Eastern Indonesia, the Moluccas, Papua, and West
Nusa Tenggara. Growth in Sumatra, Kalimantan, Sulawesi and East Indonesia is predicted to
have the potential to rise further due to high waiting lists and due to limited supply and
electrification ratio will be improved.
Electricity Sale Price
The sale price of electricity is controlled by the central government through the ministerial
energy and mineral resources (MEMR). The price of electricity planned by the MEMR
should be approved by the parliament.
The current price of electricity for major users is still under subsidy. As a result, the
government is planning to reduce the level of subsidy wisely. Since 2013, the government
gradually increased the sale price of electricity for certain groups of users, namely electricity
for households which have a power allocation above 1300 VA and for industries in every
three months (see Table 14). For a certain group of users, especially for small houses of low
income people (households with allocated power of 450 VA and 900 VA), the price is still
subsidized by the government.
In 2011, PLN’s average power price per kWh was Rp 714.24 /kWh. It was increased
compared to 2010 of Rp 699.1/kWh. The price for 2012 and 2013 is shown in Table 14.

38
Table 14: The electricity tariff for 2013 in each user category
A. Household 2012 Tariff The first –three
months
II-Three
months
III -Three
months IV – Three months
a) 450 VA Rp 410/Kwh Same Same Same Same (under
subsidy)
b) 900 VA Rp 585/Kwh Same Same Same Same (under
subsidy)
c) 1.300 VA Rp 790/Kwh Rp 833/Kwh Rp 879/Kwh Rp 928/Kwh Rp 979/kwh
d) 2.200 VA Rp 795/Kwh Rp 843/Kwh Rp 893/Kwh Rp 947/Kwh Rp 1.004/Kwh
e) 3.500-5.500 VA Rp 890/Kwh Rp 948/Kwh Rp 1.009/Kwh Rp 1.975/Kwh Rp 1.145/Kwh
f) Above 6.600 VA Rp1.154/Kwh Rp 1.195/Kwh Rp 1.310/Kwh Rp 1.340/Kwh Rp1.362/Kwh
(no subsidies)
B. Industries
a) 450 VA Rp476/Kwh Same Same Same Same (under
subsidy)
b) 900 VA Rp585/Kwh Same Same Same Same (under
subsidy)
c) 1.3 kVA Rp765/Kwh Rp803/Kwh Rp843/Kwh Rp886/Kwh Rp930/Kwh
d) 3.5- 14 kVA Rp915/Kwh Rp961/Kwh Rp1.009/Kwh Rp1.059/Kwh Rp1.112/Kwh
e) 14-200 kVA Rp870/Kwh Rp914/Kwh Rp959/Kwh Rp1.007/Kwh Rp1.057/Kwh
f) Above 200 kVA Rp731/Kwh Rp757/Kwh Rp783/Kwh Rp823/Kwh Rp864/Kwh
PLN Business Area and Electrification Ratio
With the growth of total number of residential customers from 39,324,520 at the end of 2010
to 45,829,980 at the end of 2011, the electrification rate reached around 71.23% at the end of
2011. The rate in 2012 was 75.9%, and the target for 2016 is 83, 4%.
Electricity Supply Permit PLN has been determined by the Minister of Energy and Mineral
Resources Decree No. 634-12/20/600.3/2011 dated 30 September 2011. The decree stipulates
PLN Activity Region covering the entire territory of the Republic of Indonesia, except those

39
specified by the Government as Regional Enterprises for other State-Owned Enterprises,
Regional Owned, privately owned companies or cooperatives.
For 2012 to 2021, the entire area of business PLN established by the Decree of the Minister
of Energy and Mineral Resources in which the area of PLN business is divided into three
operational areas, namely Bali, East Java, and the rest of Indonesia.
The development of the national electrification ratio from year to year has increased, from
64.3% in 2007 to 75.79% in 2012. In period of 2007-2011, the increase electrification ratio in
areas of Java, Bali, Sumatra, Kalimantan, Sulawesi and other islands were as shown in Table
15.
Table 15: Electrification Ratio Growth (%) [44]
Wilayah 2007 2008 2009 2010 2011
Indonesia 60,8 62,3 65 67,5 71,23
Java-Bali 66,3 68 69,8 71,4 72,32
Sumatera 56,8 60,2 60,9 67,1 69,38
Kalimantan 54,5 53,9 55,1 62,3 64,25
Sulawesi 53,6 54,1 54,4 62,7 66,63
East Part of Indonesia 30,6 30,6 31,8 35,7 44,24
Table15 shows that growth occurs unevenly in each region. The main difficulty of PLN was
the limited ability of plants and scattered geographical situation.
Number of Subscribers
The actual number of subscribers during the year 2007-2011 has increased from 37.2 million
to 45.6 million. In other words, there has been a growth of 1.68 million people per year. The
additional largest customers was in the household sector, which is an average of 1.6 million
per year, followed by the business sector with an average of 87 thousand customers per year,
public sector average of 45 thousand customers per year, and new industry in average 700
customers per year. Table 16shows the development of the number of customers by sector of
PLN customers in five years.

40
Table 16: Subscribers Numbers Growth (Thousands) [44]
Customer Type 2007 2008 2009 2010 2011
Residential 34,508.1 35,835.1 36,897 39,108.5 42,348.3
Commercial 1,585.1 1,687.3 1,770.4 1,877.6 2,019.0
Public 988.8 1,052.2 1,164.7 1,147.8 1,213.7
Industrial 46.6 46.3 47.6 48.4 50.02
Total 37,128.6 38,620.9 39,879.7 42,182.4 45,631.6
Energy Sources of Power Generation
Regional Operations West and East Indonesia
For electricity generation, PLN utilizes several kinds of resources for their power generating
systems, which spread in western and eastern Indonesia as shown in Table 17.
Table 17: Type of Installed Generating Capacity in Operation in Indonesia (MW) in 2011 [44]
Province PLN (MW) Total
PLN
IPP (MW) Total
IPP
TOTAL
PLTD PLT
G
PLT
GU
PLT
U
PLT
A/M
PLT
P
PLTU PLT
A/M
PLT
P
Aceh 217.5 0.0 0.0 0.0 1.8 0.0 219.0 219.0
Sumatera
Utara
37.6 203.5 203.
5
0.0 490.0 140.
0
871.0 183.
0
183.0 1,065.0
Sumatera
Barat
32.8 54.0 817.
9
200.0 254.2 0.0 1.359.
0
1,359.0
Riau 86.7 59.7 59.7 0.0 0.0 114.
0
260.0 260.0
Kep. Riau 81.6 0.0 0.0 0.0 0.0 0.0 82.0 82.0
Bengkulu 21.6 0.0 0.0 0.0 0.0 233.
9
256.0 256.0
Sumatera
Selatan
30.9 175.5 175.
5
40.0 285.0 0.0 531.0 230.0 227.0 457 988.0
Jambi 49.4 78.0 78.0 0.0 0.0 0.0 127.0 127.0
Bangka
Belitung
91.8 0.0 0.0 0.0 0.0 0.0 92.0 92.0
Lampung 65.8 18.0 18.0 0.0 200.0 119.
6
403.0 403.0

41
Kalimantan
Barat
194.8 34.0 34.0 0.0 0.0 1.6 230.0 230.0
Kalimantan
Selatan
125.8 21.0 21.0 0.0 130.0 30.0 307.0 307.0
Kalimantan
Tengah
78.1 0.0 0.0 0.0 0.0 0.0 78.0 11.0 11.0 89.0
Kalimantan
Timur
223.9 38.4 38.4 60.0 0.0 0.0 322.0 45.0 45.0 367.0
Sulawesi
Utara
73.3 0.0 0.0 0.0 10.0 55.4 199.0 3.0 3.0 202.0
Gorontalo 31.7 0.0 0.0 0.0 0.0 1.5 33.0 33.0
Sulawesi
Tengah
110.2 0.0 0.0 0.0 30.0 8.6 149.0 27.0 3.0 30.0 179.0
Sulawesi
Selatan
72.7 122.7
2
122.
7
0.0 12.5 151.
1
359.0 135.0 12.0 267.0 626.0
Sulawesi
Barat
6.5 0.0 0.0 0.0 0.0 0.0 6.0 6.0
Sulawesi
Tenggara
89.7 0.0 0.0 0.0 0.0 1.6 91.0 91.0
Maluku 134.6 0.0 0.0 0.0 0.0 0.0 135.0 135.0
Maluku
Utara
62.0 0.0 0.0 0.0 0.0 0.0 62.0 62.0
Papua 89.6 0.0 0.0 0.0 0.0 2.0 92.0 92.0
Papua
Barat
53.7 0.0 0.0 0.0 2.0 0.0 56.0 56.0
NTB 144.8 0.0 0.0 0.0 0.9 0.0 146.0 146.0
NTT 137.5 0.0 0.0 0.0 1.1 0.0 139.0 139.0
TOTAL 2,344.
5
804,9 917.
9
1,357
.5
1,119
.2
60.0 6,604.
0
310.0 201.0 11.0 1,007.0 7,611.0
Note: IPP (Independent power producers) has PLTG = 60, PLTGU = 365 only at Sulawesi Selatan
Energy Source of Power Station in Java-Bali Region
The energy sources to produce electricity in Java and Bali Island are a bit different compared
to other parts of Indonesia. As shown in Table 18, PLTGU and PLTA is major type of plant.
Details of energy sources and the capacity of the Java-Bali power system as follows.

42
Table 18: Type of Plant and Its Capacity of Power System Java-Bali Year 2011 [44]
No Power Plant
Type
PLN IPP Total
MW
1 PLTA 2,392 150 2,542
2 PLTU 107 3,012 3,119
3 PLTG 2,035 300 2,335
4 PLTGU 6,916 0 6,916
5 PLTP 375 685 1,060
5 PLTD 105 0 105
Note: IPP = Independent power producers
Indonesia Demand and Supply Gap
Electricity Demand and Supply Gap
The Electricity Demand and Supply Gap is shown in Table 19.
Table 19: Electricity Power Demand and Power Gap [45]
Provinces/Region Peak Load
At Year 2013
Power Demand
At Year 2013
Committed
Project
Power Needed/
Power Gap,
up to 2013
Java, Bali and
Madura
24,319 31,615 5,743 7,395
North Sumatera and
Aceh
2,051
2,666 712 1,154
West and South
Sumatera, Lampung
and Riau
2,805
,3646 749 1,287
Bangka Belitung 130 176 2.5 103
West Kalimantan 326 440 125 19
Central and South
Kalimantan
524
733 46 258
East Kalimantan 406 548 90 392
North and Central
Sulawesi, and
Gorontalo
509
712 251 150
South Sulawesi, and 885 1,195 305 436

South –West
Sulawesi
Maluku & North
Maluku
110
Papua 157
Nusa Tenggara Barat
172
Nusa Tenggara Timur 109
Batam Island 332
Total Energy Indonesia is the fourth most populous nation with 237.5
primary energy use. Like many
growth continue to affect the growing of energy consumption
had increased steadily over the past 19 years. It
more than200% increase from 1990
Figure 17 and Figure 18.
Figure 17: Trend of Energy Supply and demand in Indonesia
43
110
153 34
157 228 42
172 241 36
109 152 26
332 432 -
th most populous nation with 237.5 million people and ranks 13th in the
Like many others developing countries, development and economic
e growing of energy consumption. Total primary
had increased steadily over the past 19 years. It was about 1270.9 Mboe in 2009 which is
more than200% increase from 1990. The trends of energy demand and supply are shown in
rend of Energy Supply and demand in Indonesia [46]
44
42
74
30
572
people and ranks 13th in the
developing countries, development and economic
. Total primary energy supply
about 1270.9 Mboe in 2009 which is
. The trends of energy demand and supply are shown in
[46]

44
Figure 18: Trend of primary energy supply by fuel type in Indonesia [37]
Compare to the world’s energy consumption, i.e.1.7 TOE per capita, Indonesia energy
consumption is much lower i.e. 0.65 TOE per capita, with an average growth of primary
energy about 7.7% in the past 20 years. [58] It is expected to continue to increase in the
future as the demand for transportation fuel continues to increase. Apart from that, the final
energy consumption increased drastically due to rapid urbanization and industrialization.
Figure 19 shows the final energy consumption by sector in Indonesia from 1990 to 2009.
Figure 19: Trends of final energy consumption by sector in Indonesia [37]

45
Industrial sectors dominate energy consumption in Indonesia with its consumption is about
296 MBOE (41%) from total consumption of national energy in 2009 and followed closely
by transportation sector which consumes 226.6 Mboe (37%). Residential and commercial
sectors have also increased steadily. As shown in Table 6, most of the energy resources are
located out of Java, but the demand of energy is concentrated in Java as can be seen from
Figure 20, so energy transportation cost and facilities are important issues in Indonesia.
The energy consumption of transportation sector in the future will be an important factor for
the future of energy demand supply projection and has potential to become the highest sector
of energy consumption.
Figure 20: Distribution share of final energy consumption
In 2009, the final energy supply was dominated by non-renewable energy resources such as
oil, gas and coal which contributed for 75% of the final energy consumption. This situation
makes the government and the energy society worry as the fossil energy resources and supply
will be diminished in the near future. On the other hand, the utilization of new and renewable
energy resources has not been optimized due to its high production cost and by the subsidy
policy on fossil energy. The contribution of crude oil in energy supply in Indonesia has
decreased from 45% in 1990 to 39% in 2009, and increase again to 42% in 2013. On the
other hand, the contribution of coal in energy supply has accelerated from 4% in1990 to 18%
in 2009 which was mainly used in power generation and the cement industry. The primary
energy supply share in 2009 is presented in Table 20. With increasing environmental issues,

46
the use of natural gas also is expected to grow at a steadily increasing pace. The contribution
of the other energy resources such as hydropower, geothermal, wind, and solar were only 3%
in 2009, which was very low in comparison to other countries. [52]
Table 20: Primary energy supply share in Indonesia [37]
Primary energy
supply
Amount (kboe)
1990
2009 Share (%)
1990
2009
Crude oil 297,435 495,710 45 39
Biomass 193,191 279,251 29 22
Natural gas 127,604 220,930 29 18
Coal 24,390 231,351 4 18
Hydropower 21,678 28,688 3 2
Geothermal 2185 14,973 0 1
Note: Biomass was used in several ways such as on direct burning of wood at household at rural areas.
Indonesia Energy Efficiency
In 2009, total energy consumption per unit of GDP (primary energy intensity), measured at
purchasing power parity is 16% higher than the world average which means that Indonesia is
still not efficient enough in utilizing energy sources. It has decreased by 1.2%/year since
1990.
1) Objectives
Energy Efficiency in Indonesia has the following objectives (Sources: RIKEN (PP 70/2009,
and APEC, 2012):
- Growth in energy consumption slower than GDP growth by 2025
- Industrial energy intensity reduction target of about 1% per year until 2025
The goal of the National Energy Conservation Master Plan, entitled RIKEN (PP 70/2009), is
to achieve Indonesia’s energy saving potential through energy efficiency and conservation
(EE&C)measures, and so avoid wasteful energy use in Indonesia.
RIKEN identified the following sector energy saving potentials:
- 15-30% in industry,
- 25% in commercial buildings for electricity, and

47
- 10-30% in the households sector.
The National Energy Policy (2006) states that Indonesia’s goal is to achieve an energy
elasticity of less than 1 in 2025 (Note: The energy elasticity is the rate of change of total
primary energy supply over the rate of change of GDP).
2) National programme
To increase the share of renewable energies from 5% in 2005 to 10.6% by
2025 (3.8% of which would be from geothermal energy and 5% from
biofuels). Geothermal plants will account for 39% of the second 10,000 MW
crash programme launched in 2010, and hydroelectricity for 12%.
Indonesia’s goal under the National Energy Conservation Master Plan is to
reduce energy intensity by around 1%/year, on average, until 2025. Fiscal
incentives (tax deductions and soft loans) together with other instruments such
as training and educational programmes as well as energy audits are used to
implement that plan.
3) National Policy and Laws
2008 – The government implemented feed-in tariffs for electricity produced
from renewables.
2011 – President Instruction No.13/2011 concerning Efficient Use of Energy
and water Resources.
2012 – Ministry EMR Regulation on Efficient Use of Electricity Energy,
Kepmen 13/2012.
4) Energy Efficiency Plan
Book of Guidelines for Building Energy Efficiency, 2012, ESDM.
Planning of Energy Efficiency and Elasticity 2012, BPPT.
5) Energy efficiency standard and labeling programmes
(2011) Minister EMR no 06/2011 regarding the labeling and Sign of Energy
Saving Lamp.
6) Awareness level of community to use energy efficient product

48
Community: the role of Dompet Dhuafa in promoting RE.
Power sector: The efficiency of the power sector tends to fluctuate and has
decreased slightly since 1990. It stood at 38.5% in 2009, compared with 40%
in 1990. The reduction of the share of hydroelectricity and the development of
coal power plants explain the deterioration of that ratio. In 2009, thermal
power plants had an efficiency rate of 35%; that rate has remained relatively
stable since 1990. The limited development of more efficient technologies,
such as gas combined cycles and cogeneration, did not permit an increase in
the ratio for thermal power generation. [59]
Figure 21: Efficiency of power generation and thermal power plants [59]

49
B. Technology Enabling Environment and Ecosystem
Government support for infrastructure
Separate to the initiatives around electricity, the Government has recently sought to
encourage the development of infrastructure more generally. President Yudhoyono for
instance has made infrastructure development a top Presidential priority by including it as a
key element in Indonesia’s medium term (2010-2014) development plan (or “RJPM”) as
prepared by the National Development Planning Board (or Bappenas).
The Government’s working plan (“RKP”) for 2010, as part of the RJPM, outlines 45 key
infrastructure programmes including:
a. The development of facilities needed for energy processing (e.g. oil refineries, power
generation), energy transmission and distribution (e.g. pipelines for gas and oil fuels)
and energy storage (e.g. depots);
b. The utilization of alternative energy including renewables (e.g. geothermal, solar,
water, wind and biomass); and
c. The completion of implementing regulations to Law No. 30 of 2007 on energy.
The Government has also sought to clarify “public private partnership” regulations with the
passing of Presidential decree No.13/2010.
Attractive opportunities for IPPs
Overall Indonesia’s economic fundamentals and its emerging regulatory framework are
coming together to allow for renewed optimism within the electricity investment sector. The
targeted GDP growth rates of 6.2% p.a. and an electrification ratio of 91% by 2019i should
see electricity demand growing by 7% to 9% p.a. (and even 9.2% p.a. through to 2019) and
take installed capacity to 81.6 GW by 2019. Accounting for retired capacity, this should
equate to 54GW of new generating capacity or about 5GW per yearii.
Massive capital investment will be required if these targets are to be met with the funding
needs for the period 2010 to 2019 estimated at around US$66 billion or US$6.6 billion p.a.
For the next five years the investment required is estimated at US$31.4 billion for 22 GW of

50
generating capacity, US$7.3 billion for some 17,000 km of transmission networks and
US$5.3 billion for distribution, totaling around US$44 billion.
IPPs and other private investment in associated areas will be needed to help meet these
capital demands. Whilst IPPs currently account for only 14% of generating capacity, the role
of private investment in new capacity will surely grow. The second fast track programme
alone will require an estimated US$16.4 billion in investment with approximately US$11.1
billion of this earmarked for the private sector. Overall, investors are potentially at the dawn
of the most exciting electricity investment opportunities for at least a generation.
Legal and regulatory framework
The electricity sector is regulated by the Ministry of Energy and Mineral Resources
(“MEMR”) and its sub-agencies. These include the Directorate General of Electricity and
Energy Utilization and the (newly created) Directorate General of Renewable Energy and
Energy Conservation.
The current regulatory framework is provided by Electricity Law No.30/2009 (the “2009
Electricity Law”).
The MEMR is responsible for developing the electricity master plan (“RUKN”) which sets
out, amongst other things, a ten year estimate of power demand and supply, the investment
and funding policy, and the approach to the utilization of new and renewable energy
resources. The RUKN also provides guidance to the central and regional Governments, and
to potential investors, on energy contribution levels for renewable sources (to increase from
5% to 17% of Indonesia’s total energy consumption by 2025). The RUKN is reviewed
annually.
The Electrification Development Program 2013-2022 (“RUPTL”) is based on the RUKN and
constitutes an official ten year power development plan. The RUPTL is prepared by PLN,
approved by the MEMR, and mandated by the current law and regulations. The RUPTL
contains demand forecasts, future expansion plans, kWh production, and fuel requirements
51
and indicates which projects will be developed by PLN and IPP investors. The RUPTL is also
reviewed annually.
The 2009 Electricity Law provides that regional Governments should also prepare a Regional
General Plan of Electricity (“RUKD”) based on the RUKN.
The 2009 Electricity Law
The 2009 Electricity Law divides the electricity business into two broad categories as
follows:
a) Those activities involved in supplying electrical power such as:
i. Electrical power generation (both for self-use and for sale to an off- grid
captive consumer);
ii. Electrical power transmission;
iii. Electrical power distribution; and
iv. The sale of electrical power
b) Those activities involved in electrical power support such as:
i. Consulting activities;
ii. The construction and installation of electrical power equipment;
iii. The operations and maintenance of electrical power equipment;
iv. The development of electrical supporting equipment technology.
Generation
The power generation sector is dominated by PLN which controls around 86% (or 26.609
GW) of generation assets in Indonesia including through subsidiaries such as PT Indonesia
Power, PT Pembangkit Jawa Bali, and PT PLN Batam.
Private sector partnership is allowed through Independent Power Producer (“IPP”)
arrangements (which continued to be sanctioned by the 2009 Electricity Law). IPP
appointment is usually through competitive bidding except in certain circumstances (e.g. for
renewable energy, mine-mouth, crisis, marginal gas, or expansion projects) in which case
appointment can be direct. The structure involves the IPP signing an Energy Sales
Agreements or Power Purchase Agreement with PLN to produce electric power and supply
PLN electricity at an agreed price for an agreed period. Based on regulation of The Minister

52
of Energy And Mineral Resources of The Republic of Indonesia No. 4 Year 2012 and the
Government Regulation No. 14 Year 2012, the bidding price could be higher than the feed-in
tariff.
Of Indonesia’s current installed capacity of 30.941GW, IPPs account for 4.269GW, or
approx. 14%. Electricity generation licenses or “IUPTLs” can be offered to private entities
(with up to 95% foreign shareholding) with PLN acting as the single buyer (see below).
Transmission, Distribution and Retailing
The 2009 Electricity Law provides PLN with priority rights to conduct these businesses
throughout Indonesia. PLN, as the sole owner of transmission and distribution assets, also
remains the only business entity in chargeof transmitting and distributing electric power.
Further, whilst the 2009 Electricity Law allows private participation in the supply of
electricity for public use (which includes transmission and distribution), current private sector
participation is still limited to the power generation sector.
Operations and Maintenance (“O&M”)
O&M services for conventional electrical power can take the form of the following activities:
a) Consulting services for the installation of electricity power supply;
b) Construction and placement of electrical power supply installations;
c) Inspection and testing of electrical power installations;
d) Operation of electrical power installations; and
e) Maintenance of electrical power installations.
The provision of O&M services for geothermal activities is separately licensed under
MoEMR Regulation No.5/2010.
Regulatory History of Electricity
History of Reforms
Early electricity arrangements in Indonesia were probably carried out pursuant to the 1890
Dutch Ordinance entitled the “Installation and Utilization of the Conductors for Electrical
Lighting and Transferring Power via Electricity in Indonesia”.

53
This ordinance was annulled in 1985 with the introduction of Electricity Law No.15/1985
(the “1985 Electricity Law”). The 1985 Electricity Law essentially commenced the modern
era of electricity regulation in Indonesia.
The 1985 Electricity Law provided for a centralized system with a state-owned electricity
company, being PLN, holding exclusive powers over the transmission, distribution and sale
of electricity. Private companies were however allowed to generate electricity.
In 2002, the Government enacted Electricity Law No.20/2002 (the “2002 Electricity Law”)
which was aimed at liberalizing the electricity sector by allowing private investors to produce
and sell power directly to customers in those areas designated as “competitive” areas.
However, in December 2004, Indonesia’s Constitutional Court annulled the 2002 Electricity
Law and re-enacted the 1985 Electricity Law. This was on the basis that the 2002 Electricity
Law contravened Article 33 of the Indonesian Constitution. According to the Constitutional
Court, electricity is a strategic commodity and its generation and distribution should remain
under the exclusive control of the Government.
The 1985 Electricity Law was implemented through Government Regulation (“GR”)
No.10/1989 on the “provision and utilization of electricity” as amended by GR No.3/2005
and GR No.26/2006. Based on these regulations, IPPs were permitted to develop and supply
power to “Electric Power Business License” holders (“PKUK” and “PIUKs”) which was
essentially limited to PLN. This was also with the approval of the MoEMR, Governors and
heads of the regions/districts. Electricity development by IPPs was also required to be in-line
with the prevailing RUPTL and RUKN [66].
Other important legislation includes:
a) Presidential decree No.67/2005 (since amended by Presidential decree No.13/2010)
and MoF Regulation No.38/2006 which set rules and procedures for “public/private
participation” arrangements;

54
b) Presidential decree No.42/2005 which outlined the inter-ministerial Committee for the
Acceleration Program (KKPPI) responsible for coordinating policy related to the
private provision of infrastructure;
c) MoEMR Reg No.44/2006 which allowed direct tender for the first fast track
programmes (of coal-fired plants); Presidential decree No.71/2006 which launched
the first fast track programme; Presidential decree No.4/2010 which launched the
second fast track programme; and
d) MoEMR Reg No. 1/2006 (and its revisions via MoEMR Reg.No. 4/2007) on “electric
power purchasing or rental transmission lines” which covered the appointment of
IPPs.
Differences between the 2009 and 1985 Laws
As indicated, the 2009 Electricity Law replaced the 1985 Electricity Law (with effect from 23
September 2009). However, unlike the (intervening) 2002 Electricity Law, the 2009
Electricity Law does not eliminate the main role of PLN in the electricity supply business (as
PLN is given “priority” rights to conduct this business throughout Indonesia). The 2009
Electricity Law also provides a greater role to the regional authorities in terms of licensing
and in determining electricity tariffs.
For instance, under the 1985 Electricity Law, the electricity supply business in Indonesia was
conducted by PLN as the holder of the Electricity Business Power license (or “PKUK”).
Under the 2009 Electricity Law, electricity supply is still controlled by the State, but is
conducted by the central and regional Governments through PLN and regionally owned
entities.
To highlight the State’s control in the sector, the 2009 Electricity Law also provides a first
right of refusal to PLN to conduct an electricity supply business in an area before the central
or regional government can offer the supply opportunity to regionally owned entities, private
entities or cooperatives.
The 2009 Electricity Law also offers an improvement in the regulatory framework by
providing a greater role for regional governments and other entities to participate in this

business. However, many of the finer points of the 2009 Electricity Law are to be stipulated
in the 13 implementing regulations which, at the time of writing, were yet to issue (initially
due within 1 year the effective date i.e. 23 September 2010).Some key differences betw
the 1985 and 2009 Laws are as follows
Taxation Guide, PWC, 2011):
Table 21
55
many of the finer points of the 2009 Electricity Law are to be stipulated
in the 13 implementing regulations which, at the time of writing, were yet to issue (initially
due within 1 year the effective date i.e. 23 September 2010).Some key differences betw
the 1985 and 2009 Laws are as follows (source: Electricity in Indonesia
:
21: Differences between the 1985 and 2009 Laws
many of the finer points of the 2009 Electricity Law are to be stipulated
in the 13 implementing regulations which, at the time of writing, were yet to issue (initially
due within 1 year the effective date i.e. 23 September 2010).Some key differences between
source: Electricity in Indonesia – Investment and

56
Other Relevant Laws
The Geothermal Law
Geothermal energy utilization is conducted under a regime regulated by the following:
a) Presidential Decree No.76/2000;
b) Geothermal Law No.27/2003 (the “2003 Geothermal Law”);
c) Government Regulation No.59/2007;
d) MEMR Regulation No.11/2009 (along with the 2009 Electricity Law for power
generation activities); and
e) MEMR Regulation No.32/2009 which sets purchasing price arrangements for PLN.
The 2003 Geothermal Law only covers geothermal activities (i.e. the production of steam)
while power generation actually falls under the2009 Electricity Law. In other words, the
new arrangements differentiate between geothermal activities and the actual power
generation. This means there are two different regulatory and licensing requirements.
An integrated geothermal business therefore now requires an “IUP” (geothermal business
license) and an IUPTL (electricity supply business license). Notwithstanding the requirement
for two licenses, the geothermal and power operations can be carried out through a single
Indonesian company.
This regime takes over from the (integrated) geothermal and power arrangements covered
under the former Joint Operation Contract arrangements.
The Investment Law
Investment Law No.25/2007 (the “2007 Investment Law”) is aimed at providing a one-stop
investment framework for investors. This includes key investor guarantees such as the right
to freely repatriate foreign currency, and key incentives such as exemptions from Import
Duties and VAT otherwise due on the import of capital goods, machines or equipment for
production needs.
Obligations for power plant investors under the 2007 Investment Law include:
a) Prioritizing the use of Indonesian manpower;
b) Ensuring a safe and healthy working environment;

57
c) Implementing a corporate social responsibility programme; and
d) Certain environmental conservation obligations.
Power plants must also fulfill a “local component level’ which includes local services and
goods under MEMR Regulation No. 48/2010.
The Capital Investment Coordination Board (“BKPM”) is given the power to coordinate
implementation of investment policy including that pursuant to the 2007 Investment Law.
Foreign investors wishing to participate in the electricity sector must first obtain a foreign
investment license from BKPM pursuant to the 2007 Investment Law. To do this an
Indonesian incorporated entity must be established and licensed as a PT PMA company
(under the Investment Law No. 25/2007 and Company Law No.40/2007 - see below). A PT
PMA can be licensed for both the geothermal and electricity sectors.
Once the PT PMA Company is established, the company must apply through the MoEMR for
an IUPTL license and other licenses such as the permanent business license and principal
license for investment facility through BKPM according to the prevailing regulations.
The Negative List
The “negative list”, as set out in Presidential decree No.77/2007, 11/2007, and 36/2010
prescribe a set of business activities which are closed for investment or which have
limitations on foreign participation.
The negative list generally limits foreign ownership to 95% for investments in the production,
transmission and distribution of electricity (includingfor O&M of electrical
power/geothermal installations). In recent changes, Presidential Regulation No.36/2010
extended foreign ownership as follows:
a) Small scale power plants (1-10MW) are now open to partnerships with small-medium
businesses and cooperatives (“UMKK”); and
b) Geothermal support services such as O&M services may have a maximum foreign
ownership of 90% and for drilling services a maximum of 95%.

58
As a result, foreign investors are generally limited to a 95% equity interest in companies
producing electricity (conventional or geothermal based) and to 90% of an entity performing
operations and maintenance service for geothermal energy.
Environment Issues
In October 2009, the Indonesian Parliament passed Environment Law No.32/2009 (“the 2009
Environment Law”). The 2009 Environment Law requires investors to comply with specific
environmental practicesand secure environmental permits before they begin operations. An
environmental impact planning document (“AMDAL”) is required for projects greater than
10MW capacity and an environmental management effort document (“UKL” or “UPL”) is
required for those less than 10MW. These documents are a prerequisite to obtaining a
business license. Investors are also exposed to special environmental taxes.
Sanctions for non-compliance can include fines, revocation of operating permits and/or
imprisonment. [source: Electricity in Indonesia – Investment and Taxation Guide, PWC,
2011].
The 2007 Company Law also imposes environmental obligations on companies undertaking
business activities in the natural resources sector. The cost of these obligations is to be borne
by the company. As this publication went to print; a Government Regulation providing
details of these environmental responsibilities had not been issued. Whilst the obligations
would seem to apply to geothermal and hydropower producers, they may ironically exclude
IPPs using nonrenewable feed stocks.
Fast Track Programme II Expanded
On 6 August 2013, the Minister of Energy and Mineral Resources Regulation No. 21/2013
was issued providing an expanded list of power plants to be built by PLN and Independent
Power Producers (IPPs) under the Fast Track Programme II (FTP II).

59
Rationale
The increasing demand for electricity needs significant additional investment. By allocating
new projects to FTP II the Government hopes to attract more investors. FTP II projects come
with a Government Guarantee through a Business Viability Guarantee Letter (BVGL).
Procedure for providing BVGL regulated by Ministry of Finance Regulation
No.139/PMK.011/2011. This regulation is generally applied and not related to the provision
of subsidies. The guarantee covers PLN’s payment obligations for the purchase of power
during the operation period of a project only.
From 10,000 MW to 18,000 MW
The new target for FTP II is 17,918 MW up from 10,047 MW. PLN is tasked to build 5, 749
MW (up from 3,757 MW) while projects comprising a total of 12,169 MW are earmarked for
IPPs (almost double the previous total of 6,290 MW).
Most of the new projects will be coal-fired and in Java with 2,000 MW to be built by PLN
and 6,320 MW to be built by IPPs. The overall number of power plants to be built has been
reduced from 97 to 76 with many small coal-fired and coal gasification projects in
Kalimantan, Sulawesi, NTT and NTB being dropped from the list.
The number and total capacity of power plants using renewable energy (geothermal and
hydropower) changes little except for a new 110 MW hydro power plant in West Java and a
small 10 MW geothermal power plant in NTT. The following Table summarizes some of the
existing policies and regulations related to the promotion of renewable energy in Indonesia
Table 22: Summary of some of the existing policies and regulations related to the promotion of renewable energy in Indonesia
No Regulation
1 Regulation of the Minister of
Energy and Mineral
Resources No. 002 Year 2006
on Concession Power
Medium Scale Renewable
Energy
Clause 2 (1):
PKUK or PIUKU shall meet electricity demand in
their respective business areas
Clause 2 (2):
In meeting the demand for electricity in the area of
business as referred to in subsection (1), PKUK or

60
PIUKU must purchase electricity from renewable
energy power plant
Clause 2 (3):
Renewable energy power plant referred to in
subsection (2) include:
a. Renewable energy power plant with an installed
capacity of over 1 (one) MW to 10 (ten) MW, or
b. More power (excess power) which is above 1
(one) MW up to ten (10) MW of renewable energy
power plant
Clause 6 (1):
PKUK or PIUKU in the process of purchasing the
labor power of the offer cooperative or other entity
attention to the rules of healthy and transparent
business
2 Regulation of the Minister of
Energy and Mineral
Resources No. 10 Year 2012
About Implementing Physical
Activity Energy Utilization of
New and Renewable Energy
Clause 2:
Physical activity utilization of new energy and
renewable energy implemented in order to support
sustainable national development to enhance
national energy security
Clause 3 (1):
Physical activity energy utilization of new and
renewable energy, as defined in Clause 2 of the form
of development, procurement and / or installation of:
(a) installation of electricity supply;
(b) biofuels supply installation and / or
(c) productive tools to support the business activities
resulting from the utilization of new energy and
renewable energy.

61
Clause 3 (2):
Physical activity referred to in subsection (1) aims
to:
(a) encourage the development of an energy
independent country programme;
(b) encourage the provision of energy from new
energy sources and renewable energy;
(c) promote growth and equitable development
energy infrastructure in remote areas, lagging,
borders, small islands and outermost, post-disaster,
and / or post-conflict, and
(d) pilot exploitation of new energy and renewable
energy.
Clause 4 (3):
New Energy Management Program, Renewable and
Energy Conservation as referred to in subsection (2)
in place to support the accelerated development of
new energy and renewable energy
Clause 5: Directorate General shall:
(a) made accountable for the implementation of
physical activity utilization new energy and
renewable energy;
(b) monitoring and evaluation of the implementation
of physical activity energy utilization of new and
renewable energy;
(c) reported the achievement of physical activity
goals and objectives of the utilization of new energy
and renewable energy to the Minister;
(d) of monitoring, evaluation and outcomes
management guidance and supervision of physical
activity energy utilization of new and renewable
energy; and

62
(e) process and proposed outcomes of physical
activity energy utilization of new and renewable
energy as referred to in Clause 3 subsection (1) as a
grant Ministry of Energy and Mineral Resources to
Local Government.
Clause 13 (1):
Governor or regent / mayor in accordance with the
authority set managers use the results of the physical
implementation of new energy and renewable
energy was delivered as referred to in Clause 12
subsection (2).
Clause 13 (2):
Business results of the implementation of physical
activity referred to in subsection (1) include:
(a) people directly or
(b) management institutions to form joint venture
group, cooperatives, associations, non-governmental
organizations, or groups of peoples.
3 Government Regulation No.
70 Year 2009 on Energy
Conservation
Clause 4:
The government referred to in Clause 2 nationally
responsible for:
(a) formulate and determine policy, strategy, and
energy conservation programmes;
(b) develop qualified human resources in the field of
energy conservation;
(c) conduct a thorough and comprehensive
socialization for the use of technology to implement
energy conservation;
(d) assess, develop and establish policies and
allocate funds for the implementation of energy
conservation programmes;
(e) provide facilities and/or incentives for the

63
implementation of energy conservation
programmes;
(f) undertake energy conservation technical
assistance to employers, users of energy sources,
dang energy users;
(g) implement energy conservation programmes and
activities that have been set, and
(h) to guide and supervise the implementation of
energy conservation programmes.
Clause 18:
Government and / or local government to provide
incentives to:
(a) energy users that use energy greater than or
equal to 6,000 (six thousand) tons of oil equivalent
per year, as referred to in Clause 12 subsection (2),
and
(b) energy-saving equipment manufacturers in the
country, successfully implement energy
conservation in a certain period.
4 Presidential Regulation No. 4
of 2010 On Assignment To
the State Electricity Company
(Limited) for Conducting
Accelerated Development of
Power Plant That Uses
Renewable Energy, Coal and
Gas.
Clause 1: Implementation construction acceleration
of power plants that use renewable energy, coal, and
gas through the assignment of the Government to
the State Electricity Company (Limited), hereinafter
referred to PT PLN (Limited) and through
cooperation between PT PLN (Persero) and private
power developer with power purchase scheme.
Clause 2:
Power plants that use renewable energy, coal and
gas as referred to Clause 1 shall use environmentally
friendly technology in accordance with the
provisions of the legislation.

64
Clause 3 (1):
Government commissioned PT PLN (Persero) to
organize the procurement of power plants that use
renewable energy, coal, and gas.
Clause 5:
Funding the construction of the power plant and
related transmission as referred to in Article 3 are
from the State Budget (Budget), internal budget PT
PLN (Persero), and other legitimate sources of funds
in accordance with the provisions of the legislation.
5 Government Regulation No. 3
year 2005 on the Amendment
of Government Regulation
No. 10 year 1989 On the
Provision and Utilization of
Electricity
Clause 2 (4):
To ensure the availability of primary energy to
supply electricity for public use, priority use of local
energy sources with liabilities prioritize the
utilization of renewable energy sources
Clause 6 (1):
Does not damage the interests of the state,
Electricity Business Permit granted to cooperatives
and other business entities to conduct electricity
supply business in the public interest or the
electricity supply business for its own sake.
Clause 6 (2):
Other entity referred in subsection (1) to conduct the
electricity supply business for public interest include
regional-owned enterprises, private companies,
government organizations and individuals.
Clause 6 (3):
Other entity referred to in subsection (1) to conduct
the electricity supply business for its own cover-
owned enterprise state-owned enterprises, private,
non-governmental organizations, individuals or
other state agencies.

65
6 Presidential Regulation No. 5
Year 2006 on National
Energy Policy
Clause 2 (2): National Energy Policy Objectives are:
(a) Achieving energy elasticity less than 1 (one) in
2025.
(b) The realization of energy (primary) optimal mix
in 2025, namely the role of each type of energy to
the national energy consumption: 1) Petroleum to
less than 20% (twenty percent); 2) Natural gas to
more than 30% (thirty percent); 3) Coal to more
than 33% (thirty three percent); 4) Biofuels
(biofuels) to more than 5% (five percent); 5)
Geothermal to more than 5% (five percent); 6) New
energy and other renewable energy, especially
biomass, nuclear, hydroelectric, solar, and wind
power to more than 5% (five percent); and 7) Coal is
liquefied (liquefied coal) to more than 2% (two
percent)
Clause 3 (3):
Supporting policies referred to in subsection (1)
include:
(a) development of energy infrastructure including
increased consumer access to energy;
(b) partnership between government and the
business community;
(c) community empowerment;
(d) development of research and development and
education and training
Clause 6 (1):
Minister of Energy and Mineral Resources set
certain alternative energy sources
Clause 6 (2):
Government can provide facilities and incentives to
the energy conservation and development of

66
alternative energy sources specified as mentioned in
subsection (1)
Clause 6 (3):
Further provisions concerning the ease of
administration and incentives referred to in
subsection (2) is regulated by the relevant Minister
in accordance with the authority of each
7 Presidential Instruction No. 1
Year 2006 concerning the
Provision and Use of Biofuels
(Biofuel) As material Other
Fuels
Presidential Instruction To the Coordinating
Minister for the Economy:
coordinate the preparation of the supply and use of
biofuels as an alternative fuel
Presidential Instruction To the Minister of Energy
and Mineral Resources:
(a) establish and implement a policy provision and
use of biofuels (biofuels) as an alternative fuel,
which contain guarantees the availability of biofuels
(biofuel) and guarantee the smooth and equitable
distribution;
(b) establish incentives and tariff policy package for
the development of the supply and use of biofuels
(biofuels) as an alternative fuel in coordination with
relevant agencies;
(c) set the standard and quality of biofuels (biofuels)
as alternative fuel;
(d) establish systems and procedures that are simple
to test the quality of biofuels (biofuels) as an
alternative fuel;
(e) set of simple trading system from biofuels
(biofuels) as an alternative fuel to the trade system
of fuel oil; raw biofuel;
(f) the dissemination of the use of biofuels (biofuels)
as an alternative fuel; and

67
(g) encourage companies engaged in the energy and
mineral resources to utilize biofuels (biofuels) as an
alternative fuel.
Presidential Instruction To the Minister of
Agriculture:
(a) encourage the provision of feedstock crops for
biofuels (biofuels), including seeds
and seeds;
(b) conduct outreach development
(c) facilitate the provision of seeds and seedlings of
raw materials for biofuels (biofuels);
(d) integrate the development and post-harvest
activities feedstock crops biofuels (biofuels).
Presidential Instruction To the Minister of Forestry:
authorize the use of forest land that is not productive
for the development of feedstock for biofuels
(biofuels) in accordance with the provisions of
legislation.
Presidential Instruction To the Minister of Industry:
promote the development of domestic production of
raw materials processing equipment for biofuels
(biofuels) and encourage entrepreneurs in the
developing biofuels industry.
Presidential Instruction To the Minister of Trade:
(a) encourage the supply and distribution of raw
materials for biofuels (biofuels);
(b) Ensure smooth supply and distribution
components of the processing equipment and the use
of biofuels.
Presidential Instruction To the Minister of
Transportation encourage increased use of biofuels
(biofuels) as an alternative fuel in the transportation

68
sector.
Presidential Instruction To the Minister of Research
and Technology:
developing technology, applications suggest the use
of technology and the provision of processing,
distribution of raw materials and utilization of
biofuels (biofuels) as an alternative fuel.
Presidential Instruction To the Minister of
Cooperatives and Small and Medium
Enterprises:assist and encourage cooperatives and
small and medium enterprises to participate in the
development of plantfeedstock for biofuels
(biofuels) as well as processing and commercial
biofuels (biofuels) as an alternative fuel.
Presidential Instruction To the Minister of State
Owned Enterprises (SOEs):
(a) encouraging state-owned agriculture, plantations
and forestry to develop feedstock crops for biofuels
(biofuels);
(b) encouraging state-owned industry to develop
biofuel processing industry (biofuels);
(c) encourage BUM.N engineering to develop
materials processing technology
biofuels (biofuels);
(d) encourage SOEs to harness the energy field of
biofuels (biofuels) as alternative fuel.
President instruction to the interior ministry:
coordinate and facilitate local government and staff
as well as the preparation of the community in the
provision of land in their respective areas, especially
critical lands for the cultivation of raw materials for
biofuels (biofuels)

69
Presidential Instruction To the Minister of Finance:
reviewing laws and regulations in the financial
sector in the context of the provision of incentives
and fiscal relief for the supply of raw materials and
the use of biofuels (biofuels) as an alternative fuel.
Presidential Instruction To the Minister of the
Environment: do socialization and communication
to the public regarding the use of biofuels (biofuels)
as alternative fuel is environmentally friendly.
Presidential Instruction To Governors:
(a) implement policies to increase the use of biofuels
(biofuel as alternative fuel in the region in
accordance with the authority;
(b) the dissemination of the use of biofuels (biofuel)
as an alternative fuel in the region; facilitate the
provision of Lahari in each region according to its
authority especially critical land for cultivation of
biofuel feedstock (biofuel);
(c) report the instruction execution to the Minister of
the Interior.
Presidential Instruction To the Regent/Mayor:
(a) implement policies to increase the use of biofuels
(biofuels) as an alternative fuel in the region in
accordance with the authority;
(b) perform socialization utilization of biofuels
(biofuel) as alternative fuel in the region;
(c) facilitate the provision of land in each region
according to its authority especially critical land for
cultivation of raw materials for biofuels (biofuels);
(d) report on the implementation of the instruction to
the Governor.

70
8 Regulation of the Minister of
Industry Decree No. 04/M-
IND/PER/1/2009 About
Guidelines for Use of
Domestic Production of
Electricity Infrastructure
Clause 5:
Any development of electricity infrastructure by
state and or PIUKU executed by electric power
construction services business, including
Engineering, Procurement & Construction (EPC).
Clause 7 (1):Construction of hydropower up to 100
MW per unit held and led by the National EPC
company
Clause 7 (2):
Above 100 MW hydropower unit can be carried out
by the EPC company shall cooperate with foreign
and national EPC company. Any development of
electricity infrastructure in the public interest or
mandatory use of goods and services produced
domestically.
Incentives
9 Insentif Riset Sistem
Inovasi Nasional (National
Innovation System Research
Incentive)
Insentif Riset Sistem Inovasi Nasional (National
Innovation System Research Incentive) is one of the
policy instruments
Ministry of Research and Technology to develop and
optimize R& D resources, improving synergies
between industry with research and development
institution, and strengthen the capacity of science and
technology between industry with research and
development institution. The proposal of this research
funding scheme must be derived from government
agencies or institutions / Non-Government legal
entities such as: LPNK - Research and Technology,
Research and Development
Ministry, the Regional Research and Development,
Industrial (state or private), college (Public or Private),
or R & D Foundation NGOs.

71
There are 4 founding schemes:
(a) Basic Research (RD) intended to pursue dropping
mastery of science and technology (state of the art)
and generate new qualified invention (breakthrough,
Nobel Prize);
(b) Applied Research (RT) which is intended to
improve technology integration capabilities, especially
in apply the results of basic research into proven
technology;
(c) System Science Research Capacity Production
(KP) aimed to improving the technological
capabilities in the production sector R & D institutions
through research partnerships with industry;
(d) Accelerating Diffusion and Utilization of Science
and Technology (DF) were intended to improve the
utilization of the results financing of R & D through
the application of technology in the sector production,
financing intermediary institutions that can applied R
& D results in the production sector (performance
based) and the stimulus for the growth of start-up
company.
The proposal title must be according to seven priority
areas of science and technology: food technology;
health and medicine technology; energy;
transportation; information and
communications; defense and security technology; and
material technology.

72
10 Desa Mandiri Energi
(Energy self-sufficient
village)
There are two types of Desa Mandiri Energi:1. Desa
Mandiri Energi non-fuel, such as using micro hydro,
solar, and biogas; 2. Desa Mandiri Energi use of
biofuels. There are seven departments that have
developed and fund the Desa Mandiri Energi: 1.
Ministry of Energy and Mineral Resources; 2.
Ministry of Agriculture; 3. Ministry of Manpower and
Transmigration; 4. Department of Internal Affairs; 5.
State Minister for Acceleration Development
Backward Regions; 6. State Minister for State Owned
Enterprises; and 7. Ministry of Maritime Affairs and
Fisheries
11 DIKTI Incentives Encourage and increase the interest of Indonesian
researchers to produce and publish their research
results without exception in energy area
Source: Country Specific Information on Renewable Energy in Indonesia
Institutional, technical, financial, technology transfer support mechanisms2
Support mechanisms including institutional, technical, financial, technology transfer have
been quite developed in Indonesia. The following Tables briefly describe most of the
available support mechanism.
Table 23: Key R&D Institutions involved in the Development and Transfer of Renewable Energies [60]
No. R&D Institutions
1 Ministry of Energy & Mineral resources republic of Indonesia (Kementrian Energi dan
Sumber Daya Mineral) – ESDM. In charge of policy setting and national programme on
Energy including renewable energy.
2 Ministry of Industry (MoI/Kementrian Perindustrian). Policy development to promote and
strengthen national industry in the area of renewable energy.
3 State ministry for Science and Technology (KNRT/Kementrian Negara Riset dan Teknologi).
Coordinating R&D Activities at major R&D Institutes and major research centers;
2 More detail description on this support mechanism can be seen at Country Specific Information on
Renewable Energi-INDONESIA by Dr. Syahrul Aiman and Manaek Simamora

73
development of national strategic R&D.
4 Indonesian Institute of Sciences (LIPI). Conducting R&D including renewable energy.
5 Agency for Technology assessment and Application (BPPT). Conducting R&D including
renewable energy.
6 National Nuclear Power Agency (BATAN/Badan Tenaga Atom Nasional). Conducting R&D
including renewable energy.
7 National Institute of Aeronautics and Space (Lembaga Penerbangan dan Antariksa Nasional,
LAPAN). Conducting R&D including renewable energy.
8 National Institute of Electronic (LEN/Lembaga Elektronika Nasional). A state owned
enterprise producing products on electronics including supporting electronics for renewable
energy companies.
9 PT. Pertamina (State Owned Enterprise). A major Indonesian major oil company currently
includes renewable energy in its project development portfolio.
Academic Institutions Offering Capacity Building Programmes in the Field of Renewable
Energy (Including Undergraduate and Postgraduate Level Programmes in Renewable Energy)
10 Gadjahmada University (UGM, Universitas Gadjah Mada)
11 University of Indonesia (UI)
12 Bandung Institute of Technology (ITB)
13 Bogor Institute of Agriculture (IPB/Institute Pertanian Bogor)
14 Institute Technology Surabaya (ITS/Institute Technology Surabaya)
15 Universitas Tanjungpura (Tanjung Pura University) Pontianak
16 International Institute for Clean Energy and Climate Change
17 Politeknik Negeri (Technical Vocational Academy) Jember
18 Darma Persada University
19 Atmajaya University Yogyakarta
20 PoliteknikNegeri (Technical Vocational Academy) Sriwijaya
21 Politeknik Negeri (Technical Vocational Academy) Semarang (Polines)
22 Politeknik Negeri (Technical Vocational Academy) Bandung (Polban)
23 Politeknik Negeri (Technical Vocational Academy) Ujung Pandang
24 Universitas Hasanudin/Hasanuddin University (UNHAS)
Other universities
Source: Country Specific Information on Renewable Energy in Indonesia [61]

74
Table 24: Key Indonesian Non-Governmental Organization in the field of Renewable Energy Sector
1
Name of Institution
Yayasan IBEKA (Institut Bisnis dan Ekonomi Kerakyatan)
People Centered Business and Economic Institute
Focus Area Develop small hydropower project (5-400 kW) to electrify poor,
rural communities across Indonesia in the scope of
Citizen/Community Participation, Energy, and Income
Generation.
Contact Director: Tri Mumpuni (Ashden Awards 2012)
Yety Sofi Rahayu
Administration and Finance Staff
e-mail: [email protected]
Tel: +62-21-53661517
2
Name of Institution IESR (Institute for Essential Services Reform)
Focus Area Power Sector Restructuring
Address Jl. Mampang Prapatan VIII
(KomplexBappenas) No. R-13
Jakarta, 12790
Indonesia
Tel: +62-21-7992945
Fax: +62-21-7996160
E-mail: [email protected]
Contact Kharina Dewayani
Administration and Finance Staff
E-mail: [email protected]
Cut Rindayu
Corporate Communication
E-mail: [email protected]
Tel: +62-817823778
3 Name of Institution EEP (Energy and Environmental Partnership)
based on agreement between Finland and Indonesia

75
Focus Area Overall Objective of EEP Indonesia is the increased access to
sustainable renewable energy and reduced growth rate of
greenhouse gas (GHG) emissions in the participating provinces of
IndonesiaActivities:- Capacity building/ training- Pilot and
demonstration projects on renewable energy, energy efficiency
and waste-to energy.- Pre-feasibility and feasibility studies on
renewable energy, energy efficiency and waste to-energy,
environmental impact assessments (EIA).- Strategic studies for
renewable energy and energy efficiency development and biomass
production and utilization for energy production.
Contact National Coordination Unit (NCU)
Nasrullah (Eriell) Salim, National Coordinator
E-mail: [email protected]
Mobile: +62 815 825 2392; +62 821 1454 3407
Juhani Harkonen, Chief Technical Advisor
Email: [email protected]
Mobile: +62 821 2562 7013; +358 400 724025
EEP Indonesia Riau Office
Mohammad Amin
Email: [email protected]
Mobile: +62 813 7127 2767
EEP Indonesia Kalteng Office
Ivi Anggraeni
Email: [email protected]
Mobile: +62 813 6547 6347
4
Name of Institution METI (Masyarakat Energi Terbarukan Indonesia)
Indonesia Renewable Energy Society (IRES)
Focus Area Power Generation/Clean EnergyCommunication, consultancy and
cooperation forum among Renewable Energy (RE)
practitioner.METI establishes various Groups, each focusing on a
particular Renewable Energy, including Solar PV, Geothermal,
Micro Hydro, Biomass, and Other RE (such as Wind, Bio-Diesel,

76
Bio-Ethanol, and Tidal Wave. Each Focus Group deals with
concerns and prospects of maximum and effective use of RE
available in Indonesia, and it strives toward continuous
development, applications, promotion, advocacy and support for
using RE on which it is focusing on. The outputs produced by
each Focus Group will be compiled and used by METI for the
government, legislators and other stakeholders on the effective
sustainable use of RE in the country's strives to achieving the
national long term energy security.Membership of each Focus
Group is open for METI's members. Application for joining Focus
Group activities is submitted to the Coordinator of each Focus
Group via METI's Secretariat. METI, in addition to fulfilling its
programme, also establishes various Working Teams, each
dealing with particular issues including Environment, RE
Technology and Education, Policies and Regulations, Socio-
Economics, Model of Rural Area Development Utilizing RE, and
Sustainable RE Business Development. The contributions of these
Working Teams are providing basis for METI's advocacies on
specific issues and advisory consultancy for rural and RE business
developments.
Address Graha Niaga Lantai 9Jl. Jend. SudirmanKav. 58 Jakarta 12190
Indonesia
Tel : +62-21 5291 2380-83Website: www.meti.or.idE-mail :
[email protected] Secretariat c/o. PT. Makmur Wisesa
Sejahtera Graha Irama 6th floor Jl. HR. Rasuna Said Block XI
Kav.1-2Jakarta 12950Telp. +62 21 5790 3287Fax. +62 21 5790
3289Email. [email protected] / [email protected]
Contact Sinta
Public Relation and Communication
Tel: +62-81280090080
5 Name of Institution INOTEK (YayasanInovasiTeknologi Indonesia/Indonesia
Technology Innovation Foundation)

77
Focus Area INOTEK Foundation ended 2011 by starting to work on a
programme “Building Innovation Capacity in Clean Energy in
Indonesia”. This 2-year pilot programme until November 2013 is
supported by the World Bank, wherein INOTEK is collaborating
with GATD, APEX, Yayasan Gaia and Catapult Design to focus
on supporting pro-poor clean energy design-driven innovation.
The programme aims to identify technology challenges from
target rural communities, create innovative design solutions that
meet the challenges and needs, and involve entrepreneurs and
private sector for sustainable dissemination of technologies.
Contact Jenggala street II, No. 9, Kebayoran Baru, DKI Jakarta, 12110
Indonesia.
Tel: (+62-21) 7211179Fax: (62-21) 7223878
Source: Country Specific Information on Renewable Energy in Indonesia [61]
Table 25: Ministries and Government Agencies Involved in the Promotion of Renewable Energy
No Institution Focus Area
1 Ministry of Energy and Mineral
Resources - Directorate General of New
Renewable Energy and Energy
Conservation (Kementerian
EnergidanSumber Daya Mineral
Direktorat Jenderal Energi Baru
Terbarukan dan Konservasi Energi)
Develop, promote and applicants new energy
(nuclear, hydrogen, coal bed methane, liquefied
coal, gasified coal), renewable energy
(geothermal, wind power, solar cell, micro-
hydro, hydropower, bioenergy, ocean wave
energy) and conservation energy at all region in
Indonesia.
2 Indonesian Institute of Sciences
(Lembaga Ilmu Pengetahuan Indonesia)
LIPI
Renewable energy on biomass, micro hydro
power, wind, solar, battery lithium, energy
conservation, energy saving, etc.
3 Agency for The Assessment and
Application of Technology (Badan
Pengkajian dan Penerapan Teknologi)
BPPT
a non-departmental government agency under
the coordination of the Ministry of Research
and Technology, which has the tasks of carrying
out government duties in the field of assessment
and application of energy resources and
development technology

78
4 State Ministry of Research and
Technology (Kementerian Risetdan
Teknologi)
Increase productivity to meet the needs of the
national R&D technology in the production
sector and improve the competitiveness of
productsnational and cultural innovation with
focus on strengthening competencies in R&D
areas of food security, energy, technology and
transportation management, information
technology and communications, defense and
security technology, medical technology, and
medicine, and advanced materials.
5 National Development and Planning
Agency (Badan Perencanaan
Pembangunan Nasional)-Bappenas
Coordination and synchronization of national
development planning in the field of including
in the area of, energy resources, minerals and
mining, and the environment (clause 278)
6 Ministry of Cooperatives and Small and
Medium Enterprises (Kementerian
Koperasi dan Usaha Kecil dan
Menengah)
Assist Ministry of Cooperatives and Small and
Medium Enterprises in preparing policy
formulation and coordination of policy
implementation in the areas of production
include the formulation, coordination, planning,
policy development and implementation of
technical functions KUMKM empowerment in
the field of production.
7 Ministry of Industry (Kementerian
Perindustrian)
1. Preparation of technical policies plans and
programmes as well as research and study of
macro planning industrial development of
medium and long term
2. Implementation and assessment of research
and development of macro planning medium
and long-term industry, industry cluster
development policy priorities as well as the
climate and quality of industrial
8 Ministry of State Owned Enterprises
(Kementerian BUMN)
1. Formulation and policy making in the field of
construction of state-owned enterprises
2. coordination and synchronization of policy

79
implementation in the field of construction of
state-owned enterprises
9 PT PLN (Persero), state-owned
enterprise
the provision of electricity nationally with
fossil-based energy sources, new energy and
renewable energy
10 PT. Indonesia Power (IP), state-owned
enterprise
11 PT. Pertamina, state-owned company engaged in oil and gas and is currently
undertaking the development of new energy-
based energy and renewable energy
Source: Country Specific Information on Renewable Energy in Indonesia [61]
The government through the Ministry of Research and Technology has provided direction
and stage of development of science and technology achievements in the field of new and
renewable energy.
Indonesian Energy Sector Policy Research in Indonesia stated in the White Book (Buku
putih) Research Development and Application of Science and Technology Field of New and
Renewable Energy Sources to Support Security and Availability of Energy 2025. White book
is a reference for the preparation of science and technology development strategies at the
national, regional and community stages.
Road map of new and renewable energy that is contained in this white book has the following
objectives:
a. The realization of the technology and the nation's energy infrastructure roles to support
its own energy business.
b. The realization of research, development, and implementation roles to achieve the
electrification ratio of household sector by 90%.
c. The realization of research, development, and implementation roles in increasing the
share of renewable energy (other than geothermal) by at least 5%.
d. The application of the research, development, and application results in the utilization
of nuclear energy with a share of about 4% of the national electricity production.

80
e. The application of the research, development, and application results of biofuels in the
provision of the transport sector by 10%.
f. The application of the research, development, and application results in the use of gas
for industrial and power generation sectors, transportation, and household
g. The realization of research, development, and implementation roles in energy
consumption per capita of 10 BOE.
h. The application of the research, development, and application results in support of the
establishment of energy infrastructure that is able to maximize public access to and
utilization of energy for export.
i. The application of the research, development, and application results to search for
energy sources at home and abroad.
j. The application of the research, development, and application results of energy
conservation to reduce energy elasticity is smaller than 1.
Table 26: R&D funding trend of new and renewable energy [62]
Category
of
Research
2007 2008 2009
Budget
(IDR)x1M
Number
of
Research
Budget
(IDR)x1M
Number
of
Research
Budget
(IDRp)x1M
Number
of
Research
Basic
Reseach
4,205 33 6,649 37 5,926 29
Applied
Research
2,.790 34 6,201 30 2,102 9
Science &
Technology
Capacity
1,560 7 3,.515 15 5,502 16
Diffusion 570 7 NA NA 1,113 4
Total 9,125 81 16,365 82 14,643 58

81
Table 27: Consulting Organizations/Consultants with Expertise in Renewable Energy Technology System Design, Application, and Transfer
1
Name of Institution PT. Indoenergi Consultant
Focus Area The company is specialized in handling consultancy services in
various fields particularly in relation to the energy sector, to serve
the interests of corporations, governments, and individual
independently
2
Name of Institution Indonesia Environment Consultant
Focus Area An energy audit of the environmental management proactive
targeting efficiency of energy use is used. Given the high cost of
energy today, then perform an energy audit by a business unit is
important. The benefits of an energy audit are to determine the level
of energy efficiency that can raise the level of profit for the
company as well as participating in environmental management.
The method through action planning, feasibility analysis,
implementation, monitoring and continuous improvement.
3
Name of Institution Biogas Energi Persada (EP)
Focus Area Biogas Energy Persada (EP) is the developer, contractor and
consultant biomass-based renewable energy using biogas
technology.
4
Name of Institution KAMASE
Focus Area Kamase Care is an organization engaged in research and
consultancy in the field of renewable energy. Renewable energy is
one of great potential in Indonesia, but its utility is less / minimum.
Care Kamase formed as a manifestation of the desire to exploit the
immense potential and develop it so that it becomes a source of
energy that is widely used by the public.
Founded in 2006, the main activity is to conduct studies and
research on energy conservation and renewable energy, as well as
providing consulting services for the community / service users who
need it. The scope of our activities is an energy audit of buildings,
Building Automation Systems, Solar Water Pump System,
renewable energy consulting services, and Fire Protection
Engineering.

82
Some of the activities that have and are being done Kamase Care, in
collaboration with Kamase is bio digester plant construction for the
community and the farmers / ranchers and development of ground
water lifter with renewable energy.
5
Name of Institution Energi Management Indonesia
Focus Area Is a state-owned company engaged in the field of conservation and
energy management.
Assist the government, state enterprises and private sector in energy
conservation, energy management and energy diversification. The
implementations of our business activities carried out by trained
specialists are professionals in their fields and supported by
adequate equipment as needed. Our accumulated experiences in
various sectors of society and in many industrial added values in the
implementation of our business perform tasks of conservation,
management and energy diversification.
Source: Country Specific Information on Renewable Energy in Indonesia [61]
Table 28: Technology Commercialization Agencies/Technology Business Incubators in the Renewable Energy
No Name
1 Partnership and Business Incubator Directorate, University of Indonesia
2 Technology Incubator Division, Agency for the Assessment and Application of Technology
(BPPT)
3 Technology Incubator, Centre for Innovation – LIPI
4 BPPT Engineering
5 Business and Industry Incubator, Bandung Technology Institute (ITB)
6 Business Innovation Centre (BIC)
7 Centre for Business Incubator and Entrepreneurship Development Kewirausahaan (P3K)-Bogor
Agriculture Institute (IPB)
8 Business Incubator Centre (PusatInkubatorBisnisdanLayananMasyarakat), Brawijaya University
9 New Entrepreneur Incubator (INWUB) LPPM Soedirman University
10 R. Didiek Embriyakto, SE, ST, MM

83
11 Business Incubator, Gajah Mada University (UGM)
12 Business Incubator Centre (Pusat Inkubator Bisnis IKOPIN PIBI) Institut Manajemen Koperasi
Indonesia IKOPIN
Indonesia IKOPIN
13 Technology Business Incubator, North Sumatera University (USU)
14 Incubator Centre, Technology Institute of Sepuluh November (ITS)
15 Business Incubator-LPPM Pelita Harapan University
16 Agribusiness Incubator Jember University
17 Business Incubator Unit, Manufacturing Polytechnic, Polman Bandung
18 Business Incubator Centre, Padjadjaran University
19 Business Incubator-PPM, Atmajaya University
Source: Country Specific Information on Renewable Energy in Indonesia [61]
In general, the above technology and business incubators provide its services to new
businesses including in the area of renewable energy. There is no special treatment for any
area of business. However, the incubators can access several of support from various sources
be it in private and government institution that provides financial support to renewable
energy.
Table 29: Financial Institutions for Supporting Renewable Energy Development, Commercialization, Transfer and Adoption
No. Name of Financial
Institutions
Description and Contact Address
1 PT. Astra Mita Ventura PT. Astra Mitra Ventura PT Astra Mitra Ventura (AMV) was
established in 1991.
Objective to provide financial facilities to medium & small
enterprises (SMEs) to develop its business to be independent,
modern and resilient,
The company aims to assist SMEs through equity and training
in order to develop management, technology, human resources
and market opportunity. AMV participates through direct equity
participation, convertible bond and profit sharing.

84
2 Dharma Bhakti Astra
Foundation (YDBA)
In line with its philosophy, Astra established Yayasan Dharma
Bhakti Astra (YDBA) in 1980 to generate potential, highly
competent and competitive SMEs in national industrial
structure. YDBA plays its role as an agent of development in
empowering SMEs through building competency and capability
of skilled manpower. YDBA main objective is to develop and
to provide advocacy for SMEs. YDBA currently provides
general assistance to SMEs in the range of:
Education such as apprenticeships, comparison studies,
technical assistance, plant visits and management training. The
material of education and training is relevant with theories yet
applicable.
Financial resources access.
Network development.
Business development services for SMEs in Jakarta, Bandung,
Tegal, Yogyakarta, Waru Sidoardjo, Lombok and Batam.
Facilitate exhibitions and seminars.
3 Revolving Fund
Management (Lembaga
Pengelola Dana Bergulir -
LPDB KUKM)-Ministry of
Cooperative and SMEs
Provide loan to cooperatives and SMEs including green tech-
based SMEs through its strategic partner institutions.
4 Government Investment
Centre (Pusat Investasi
Pemerintah-PIP) Ministry
of Finance
Support financing of development of infrastructure in Indonesia
including in the area of renewable energy at large scale
5 CSR Programmes, State-
owned enterprises
State-owned enterprises provide funding for development of
green-based economy including renewable energy programmes
and businesses through partnership fund and for non-bankable
SMEs
Source: Country Specific Information on Renewable Energy in Indonesia [61]

85
The example of revolving fund management is: PLN and LPDB-KUMKM has Signed the
Memorandum of Understanding (MoU) about New and Renewable Energy Development.
Utilization of new and renewable energy sources (renewable energy) to generate power in
Indonesia is continue to be developed by the government , including involving the sector of
Small and Medium Enterprises (SMEs). Regarding this, PT PLN (Persero) together with the
Institute of Cooperative Revolving Fund Management, Micro, Small and Medium Enterprises
(MSME - LPDB) agreed to collaborate in developing and improving the infrastructure
facilities that utilize bioenergy sources of energy and new and renewable energy that exist in
Indonesia.
Cooperation begins with the signing the MoU on August 28th between the President Director
of PT PLN (Persero) and the Managing Director LPDB KUMKM. The period of is 1 (one)
year after the signing of the MoU.
There are at least three points highlighted in this cooperation, namely to increase the
knowledge, insight and cooperation in the field of new and renewable energy as well.
Second, improvement and development of infrastructure in the fields of energy resources and
new and renewable energy in Indonesia, as well as the development and utilization KUMKM.
In this case the electric company is ready to provide technical support and assistance on the
operation and maintenance of the plant to cooperatives and small entrepreneurs.
Table 30. Bank credit for energy sector
Name of Bank Total loan
(BillionIDR)
Energy sector loan
(Billion IDR)
BRI 348.2 18.1
Mandiri 388.8 19.4
BNI 200.7 10.8
Total 937.7 48.4
Based on data from the financial statements of banks, especially state banks such as BRI,
Bank Mandiri, and state-owned enterprises, the average bank lending is still about 5% of all
outstanding loans. The major distribution is given to companies engaged in the oil & gas as
well as coal mining.

86
The Indonesian government develops a programme to support energy security, including
KKP-E (Credit Food Security and Energy). The real purpose is for the development of
resilience of food derived from vegetable and it is expected that the derivatives can be used as
energy.
In the same boat with the KKPE programme, the banks are still not considering the renewable
energy field as the main business. The banks programmes related to renewable energy is still
limited to the company CSR as a social responsibility to the community.
The low bank lending to the energy industry can be caused by several things as follows:
1. For a loan to the corporate, the bank has a credit limit on a business field for the spread
of risk.
2. High dependence on fossil fuels, therefore the utilization of renewable energy is very
limited
3. Banks have difficulties in selecting viable borrowers.
4. Related KKPE, the bank has several limitations including its distribution should be
through farmer groups / businesses.
Table 31: Potential Renewable Energy in Indonesia
Energy source Installed capacity Resource potential Undeveloped
potential (%)
Hydropower 4,264.0 MW 75,670 MW 94
Geothermal 1,052.0 MW 27,510 MW 96
Mini-hydropower 86.1 MW 500 MW 83
Biomass 446.0 MW 49,810 MW 99
Solar 12.2 MW 4.8 kWh/m2/day -
Wind 1.1 MW 9,190 MW 99
Ocean 0.0 MW 35 MW 100
Source: PLN presentation to the US Energy Association
The Foreign Investment Law regulates Direct Foreign Investment (FDI) by granting a right of
entry to foreign businesses through a government licensing procedure principally controlled
by Indonesian Capital Investment Coordinating Board (BKPM). Foreigners are permitted to
invest with no restriction on the maximum size of the investment, the source of funds or the
destination market of the products. This is except in an industry sector which is listed as

87
closed to foreign investment on the Investment Negative List (“Negative List”) which
attaches to the Foreign Investment Law under Presidential Regulation. (Source: Investing in
Indonesia, kpmg.com/id)
The latest 2010 Negative List set out in Presidential Regulation No.36/2010 contains 20
nominated industries or fields of business that are closed to foreign investment. The rest are
open if certain conditions are fulfilled. The revision of Indonesia's Negative Investment List
of Indonesia has been conducted in order to attract more foreign investment in Southeast
Asia's largest economy by making the country more competitive. Basically the revised
Negative Investment List will be grouped in 5 (five) categories. First, business sectors which
will be more open for foreign investment; Second, business sectors which will be more
restricted for foreign investment; Third, business sectors that adopt the harmonization of the
simplification of the foreign capital ownership; Fourth, business sectors which have
relationship with the public private partnership (PPP) (kerjasama pemerintah swasta/KPS);
and Fifth, business sectors which have to be inline with the prevailing laws and regulations.
Energy sector is included in the fourth category. Energy and mineral resources sectors
specifically on the power industry whereby for the transmission and distribution of the power
supply, during the concession period, allowing foreign investors to hold 100% for PPP/KPS
and maximum of 95% for non-PPP/KPS, power plant with small scale of 1-10 MW limits the
foreign investment at the maximum of 49% for PPP/KPS as well as non-PPP/KPS, and for
power plant above 10MW scale 100% for PPP/KPS and 95% for non-PPP/KPS maximum
ownership for foreign investors. (Source: http://www.hprplawyers.com/indonesian-negative-
list-for-investment-will-be-issued-soon/)
Table 32: Negative Investment List in Indonesia

88
Since 2008, the government has offered tax incentives for foreign investment, including
investors in renewable energy. Incentives include a 30 percent net income tax reduction for
six years, free repatriation of investments and profits, and dispute settlement.
In addition, Indonesia’s National Energy Policy of 2006 amended several policies and
regulations to support renewable energy deployment. The law codified the targets for
renewable energy production by 2025 set by Presidential Decree No. 5 and strengthened the
position of cooperatives, private companies, and community organizations in PPA
negotiation.
The regulations that support investment in renewable energy are:
1. PMK 117.PMK.06/2006 (credit for bioenergy development)
2. Gov.Regulation No 1/2007 (income tax for investment) refurbished by Gov. Regulation
No.62/2008
3. Presidential Regulation No 8/2007 (biofuel fund)
4. Government Regulation No. 8/2007 on the establishment of the Government Investment
Board may also support biofuel projects, by facilitating investment.
5. Presidential Regulation No.4 /2010 Exemption of import duty for fast-track stage 2
Incentives for Renewable Energy Generation
There are a number of tax incentives which may be applicable for renewable energy projects,
particularly geothermal powered projects. These include:
a) Income Tax incentives under GR No.1 (as lastly amended byGR No. 62/2008) which
currently applies to the “conversion” of geothermal energy into electric power. GR
No.1 concessions include:
i) An “investment credit” @30% of the qualifying capital investment (i.e. as an uplift
in deductions at five percent p.a. each year from commercial production);
ii) An extended tax loss carry forward period of up to 10 years;
iii) Accelerated depreciation rates (essentially at double the general rates);
iv) A maximum dividend Withholding Tax (“WHT”) of 10%.
Implementing regulations to GR No.1 indicate that:

89
i) BKPM is to recommend the granting of any tax incentives to the MoF (i.e. the
initial application will be through BKPM). The DGT will issue a decision on behalf of
the MoF;
ii) The tax incentives are to take effect from the beginning of commercial production;
iii) The tax loss carry forward period is extended incrementally to a maximum of 10
years (i.e. an extension to between 5 and 10 years is a possible outcome);
iv) The DGT determines the beginning of the commercial production and the tax loss
carry forward period (separately) and after tax audit (i.e. entitlement to these
concessions may not be known in advance).
b) For electricity generation driven by renewable energy, MoF regulation No.
21/PMK.011/2010 may also provide tax and customs incentives similar to those
available under GR No.1.
c) Minister of Finance (“MoF”) Regulation No.177/2007 (for geothermal operations)
and MoF Regulations No.154/2008 and No.176/2009 (for power operations) may
provide a separate Import Duty exemption;
d) an Import Duty exemption (specifically for projects under the 2ndfast track
programme) may alternatively be available under Presidential Regulation No.4/2010
(to be further regulated under MoF Decree yet to issue);
e) An Import VAT “borne by the Government” facility is available under MoF
Regulation No.24/2010 (for geothermal projects in exploration phase). This facility is
subject to annual renewal; and
f) For imports of capital goods during the development/construction phase, import VAT
may be exempted under MoF Regulation No.31/2008.

Table 33: Tax Incentives
90
Tax Incentives - Comparison for Conventional and Renewable Power PlantsComparison for Conventional and Renewable Power Plants

Source: Eletricity in Indonesia – Investment and Taxation Guide, PWC, 2011
91
Investment and Taxation Guide, PWC, 2011

92
C. Business Enabling Environment and Ecosystem
Feed-In-Tariff (FIT) Policies
A Feed-In Tariff (FIT, standard offer contract advanced renewable tariff or renewable energy
payments) is a policy mechanism designed to accelerate investment in renewable energy
technologies. It achieves this by offering long-term contracts to renewable energy producers,
typically based on the cost of generation of each technology. Technologies such as wind
power, for instance, are awarded a lower per-kWh price, while technologies such as solar PV
and tidal power are offered a higher price, reflecting higher costs.
In addition, feed-in tariffs often include "tariff depression", a mechanism according to which
the price (or tariff) ratchets down over time. This is done in order to track and encourage
technological cost reductions. The goal of feed-in tariffs is to offer cost-based compensation
to renewable energy producers, providing the price certainty and long-term contracts that
help finance renewable energy investments.
Renewable Energy Push
In recent years the Indonesian government has shown an increasing interest in renewable
energy (RE) as a means to address the growing energy demand in the archipelago.
Presidential Regulation No.5/2006 on National Energy Policy and the creation of the
Directorate General of New & Renewable Energy and Energy Conservation (EBTKE) in
2011 both stressed the importance of RE as an avenue to increase electrification of the
country and to meet the energy needs of an expanding economy whilst minimizing the
environmental impact. Indonesia has an ambitious target to increase new and renewable
energy to 17% of total energy use by 2025 (2010: 4.4%).
In the past few months the Ministry of Energy and Mineral Resources has issued new feed-in
tariffs (FITs) for solar PV power stations and waste-based power stations (see page 11 and 12
for further details) and is expected to announce new FITs for geothermal power stations. At
the New and Renewable Energy and Energy Conservation Conference (ETBKE Conex 2013)
in August speakers highlighted Indonesia’s potential for the use of RE as well as the current
under- utilization of these resources.

93
In September, PwC was a content partner for a Solar PV trade mission and conference hosted
by Solar Plaza. The 20 trade mission delegates were in Jakarta to hear more about the
upcoming tender for 140 MW of solar PV power stations. The location and capacity quota of
the PV power stations to be tendered out are detailed in the decision of the Director-General
of New and Renewable Energy and Energy Conservation No.979 K/29DJE/2013. Further
details on the tender schedule are expected by the end of 2013.
Feed-in Tariff for Solar Power
On 12 June 2013, the Minister of Energy and Mineral Resources Regulation No.17/2013 was
issued which stipulates a feed-in tariff (FIT) that PLN must pay for electricity generated from
privately owned PV solar power plants.
The capacity quota and location of 140 MW of PV Power Plants to be tendered in 2013 are
listed in the EBTKE Director General Decision No. 979 K/29DJE/2013.
The details:
• FIT: The price of electricity to be purchased by PLN has been increased to a maximum
of US$0.25 per kWh and includes all interconnection costs from the PV solar power
plant to the electricity network of PLN. Investors sourcing 40% or more of components
domestically would enjoy higher prices.
Table 34: Feed-in Tariff for Solar Power
FIT (<40% domestic
components)
FIT (40% domestic
components)
Comments
US$ 0.25/kWh US$0.30/kWh EBTKE Director General
will verify that 40%
threshold has been met and
enforce tender rules.
Source: Indonesian Electricity – Investment and Taxation Guide, PWC, 2011
• Tender process: The government will retain its competitive bidding process for new
solar power facilities, so the final purchase price paid by PLN to the winning bidder
may be lower than US$0.25/kWh. The tender winner must deposit 20% of construction
cost within 15 days of being announced as tender winner, and register a Tax ID.

94
• 20 year contract: The power sale and purchase agreement is valid for 20 years, and
may be extended.
• Timeframe: Construction of the solar power plant must commence within three months
of Agreement execution, with the plant reaching commercial operability within 18
months of Agreement execution. An extension of 12 months may be granted with the
following penalties imposed in the form of a reduction in the purchase price of power.
Table 35: FIT for timeframe of construction of solar power
Delay in commercial operability (in
months)
Price Reduction
≤3 months 3%
3 months ≤6 months 5%
>6 months ≤12 months 8%
> 12 months N/A – Agreement is terminated
Source: Indonesian Electricity – Investment and Taxation Guide, PWC, 2011
Feed-in-Tariff (FIT) for Renewable Energy Sources
A Feed-In Tariff (FIT, standard offer contract advanced renewable tariff or renewable energy
payments) is a policy mechanism designed to accelerate investment in renewable energy
technologies. It achieves this by offering long-term contracts to renewable energy producers,
typically based on the cost of generation of each technology. Technologies such as wind
power, for instance, are awarded a lower per-kWh price, while technologies such as solar PV
and tidal power are offered a higher price, reflecting higher costs.
In addition, feed-in tariffs often include "tariff digression", a mechanism according to which
the price (or tariff) ratchets down over time. This is done in order to track and encourage
technological cost reductions. The goal of feed-in tariffs is to offer cost-based compensation
to renewable energy producers, providing the price certainty and long-term contracts that
help finance renewable energy investments.
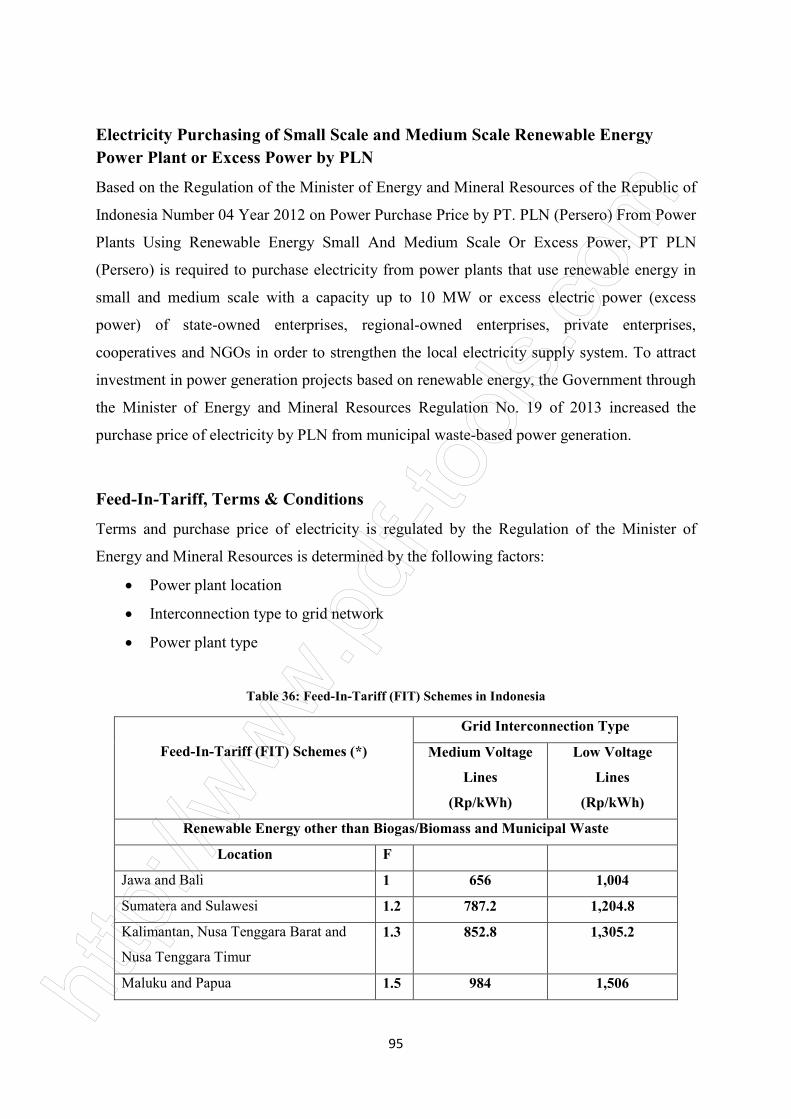
95
Electricity Purchasing of Small Scale and Medium Scale Renewable Energy
Power Plant or Excess Power by PLN
Based on the Regulation of the Minister of Energy and Mineral Resources of the Republic of
Indonesia Number 04 Year 2012 on Power Purchase Price by PT. PLN (Persero) From Power
Plants Using Renewable Energy Small And Medium Scale Or Excess Power, PT PLN
(Persero) is required to purchase electricity from power plants that use renewable energy in
small and medium scale with a capacity up to 10 MW or excess electric power (excess
power) of state-owned enterprises, regional-owned enterprises, private enterprises,
cooperatives and NGOs in order to strengthen the local electricity supply system. To attract
investment in power generation projects based on renewable energy, the Government through
the Minister of Energy and Mineral Resources Regulation No. 19 of 2013 increased the
purchase price of electricity by PLN from municipal waste-based power generation.
Feed-In-Tariff, Terms & Conditions
Terms and purchase price of electricity is regulated by the Regulation of the Minister of
Energy and Mineral Resources is determined by the following factors:
Power plant location
Interconnection type to grid network
Power plant type
Table 36: Feed-In-Tariff (FIT) Schemes in Indonesia
Feed-In-Tariff (FIT) Schemes (*)
Grid Interconnection Type
Medium Voltage
Lines
(Rp/kWh)
Low Voltage
Lines
(Rp/kWh)
Renewable Energy other than Biogas/Biomass and Municipal Waste
Location F
Jawa and Bali 1 656 1,004
Sumatera and Sulawesi 1.2 787.2 1,204.8
Kalimantan, Nusa Tenggara Barat and
Nusa Tenggara Timur
1.3 852.8 1,305.2
Maluku and Papua 1.5 984 1,506

96
Biogas/Biomass
Location F
Jawa, Madura, Bali and Sumatera 1 975 1,325
Sulawesi, Kalimantan, Nusa Tenggara
Timur and Nusa Tenggara Barat
1.2 1,170 1,590
Maluku and Papua 1.3 1,267.5 1,722.5
Municipal Waste - Zero Waste Technology
MoEM
R
4/2012
MoEM
R
19/2013
MoEM
R
4/2012
MoEM
R
19/2013
Location F
Jawa, Madura, Bali and Sumatera 1 1,050 1,450 1,398 1,798
Sulawesi, Kalimantan, Nusa Tenggara
Timur and Nusa Tenggara Barat
1.2 1,260 1,740 1,677.6 2,157.6
Maluku and Papua 1.3 1,365 1,885 1,817.4 2,337.4
Municipal Waste – Sanitary Landfill
Location F
Jawa, Madura, Bali and Sumatera 1 850 1,250 1,198 1,598
Sulawesi, Kalimantan, Nusa Tenggara
Timur and Nusa Tenggara Barat
1.2 1,020 1,500 1,437.6 1,917.6
Maluku and Papua 1.3 1,105 1,625 1,557.4 2,077.4
Notes: F: factor incentive based on power plant location
Medium Voltage Lines: 1 kV - 35 kV (e.g. 6 kV, 7 kV, 12 – 20 kV)
Low Voltage Lines: 100 V – 1 kV (e.g. 220 V, 380 V)
*Differences feed in tarrif of 2012 and 2013 showed that the government encourages investment
in new and renewable energy
Source: Ministry of Energy and Mineral Resource Regulation No.4/2012 and No.19/2013
Zero waste is a waste management technology resulting in a significant reduction in waste
volume through a specific process or incinerator integrated gasification and anaerobic.
Sanitary landfill is a waste treatment technology in a particular area isolated until it is safe for
the environment.
The purchase price of electricity in the Table above are used in a power purchase contract
from power plants and from excess power (excess power) that uses renewable energy in small

97
and medium scale without price negotiating and price approval from the Minister of Energy
and Mineral Resources. Power purchasing is based on the Self-Estimated Price (HPS) by PT.
PLN (Persero) and must obtain approval from the Minister of Energy and Mineral
Resources.PT. PLN (Persero) purchases electricity from power plants that use renewable
energy and small and medium scale biomass-based power plants, biogas and municipal waste
from state-owned enterprises, regional-owned enterprises, private enterprises, cooperatives
and non-government at a price exceeding the price of the Table (higher than FIT). In the
event of a crisis condition of electricity supply and limited numbers of consumers, PT PLN
(Persero) also will purchase excess electricity (excess power) at a price higher than the price
set forth in the Table (FIT). However such prices must be approved by the MoEMR. PLN can
also purchase excess power during conditions of electricity supply crises with a higher price
based on PLN estimates. Article 4 of regulation of MoEMR No. 4 Year 2012 allows PLN to
buy the power at the higher price or in excess of the amounts specified in the regulation,
subject to the agreement by the parties and based on PLN’s own estimates and approved by
the Minister, suggesting the possibility of revising the existing pricing through negotiations.
Purchase of electricity at the same price or higher than the Base Supply (BPP) power must be
approved by the provincial Director General of Electricity on behalf of the Minister of
Energy and Mineral Resources. The legal basis of price escalation is accommodated in the
article 39 of the Government Regulation No. 14 Year 2012, which stipulates that the price of
electricity as approved by the Minister, governor or regent/city mayor, in accordance with
their respective authority, can be adjusted due to certain changes of cost elements on the basis
of mutual agreement which should be stated in the PPA.
Provincial Basic Allocation Expense of electricity prepared by the Board of Directors of PT.
PLN (Persero) and submitted to the Director General of Electricity every 3 (three) months.
Duration of the contract of purchase excess electricity (excess power) a maximum of 1 (one)
year and may be extended. Directors of PT. PLN (Persero) must report the purchase of excess
electricity (excess power) to the Director General of Electricity every 3 (three) months.

Average Generation Cost & Electricity Subsidy
Removing the corresponding electricity price market mechanism is not possible government
amid the still high level of poverty. Based on data from the Central Statistics Agency (BPS),
in 2010 the number of poor people in Indonesia reached 31.02 million people, or 13:33 per
cent of the 237 million population. Moreover, Article 33 UUD 1945 clearly states that the
production branch that controls the lives of many people controlled by the state, as well as the
earth, water and natural riches contained therein shall be controlled by the state and used in
the best interests of the people.
state and spread evenly and affordable by all levels of society. Theref
intervention is necessary to encourage the production and distribution of electric power is
more evenly distributed at an affordable price.
One of the government interventions in the power sector is the involvement in the
determination of electricity tariff. The electricity tariff policy is closely associated with the
policy of subsidies. This is because since 1998 the government set electricity rates is always
lower than the cost of electricity supply (
electric power providers. So as to compensate for the determination of the selling price of
electricity, the government pays the difference in price to the company providing electric
power in the form of electricity subsidies.
Figure 22: Basic Allocation Expenses (BPP) and Average Selling Price of Electricity 1990
Putting in force the presidential
as well as the size of government subsidies. The Government of the Republic of Indonesia
98
Average Generation Cost & Electricity Subsidy
Removing the corresponding electricity price market mechanism is not possible government
amid the still high level of poverty. Based on data from the Central Statistics Agency (BPS),
or people in Indonesia reached 31.02 million people, or 13:33 per
cent of the 237 million population. Moreover, Article 33 UUD 1945 clearly states that the
production branch that controls the lives of many people controlled by the state, as well as the
th, water and natural riches contained therein shall be controlled by the state and used in
people. So the electricity supply business must be provided by the
state and spread evenly and affordable by all levels of society. Theref
intervention is necessary to encourage the production and distribution of electric power is
more evenly distributed at an affordable price.
One of the government interventions in the power sector is the involvement in the
electricity tariff. The electricity tariff policy is closely associated with the
policy of subsidies. This is because since 1998 the government set electricity rates is always
lower than the cost of electricity supply (Figure 22). This caused the company a
electric power providers. So as to compensate for the determination of the selling price of
electricity, the government pays the difference in price to the company providing electric
power in the form of electricity subsidies.
: Basic Allocation Expenses (BPP) and Average Selling Price of Electricity 1990
Source: PLN Statistics 2011
presidential instructions mentioned above influences PLN
of government subsidies. The Government of the Republic of Indonesia
Removing the corresponding electricity price market mechanism is not possible government
amid the still high level of poverty. Based on data from the Central Statistics Agency (BPS),
or people in Indonesia reached 31.02 million people, or 13:33 per
cent of the 237 million population. Moreover, Article 33 UUD 1945 clearly states that the
production branch that controls the lives of many people controlled by the state, as well as the
th, water and natural riches contained therein shall be controlled by the state and used in
So the electricity supply business must be provided by the
state and spread evenly and affordable by all levels of society. Therefore, government
intervention is necessary to encourage the production and distribution of electric power is
One of the government interventions in the power sector is the involvement in the
electricity tariff. The electricity tariff policy is closely associated with the
policy of subsidies. This is because since 1998 the government set electricity rates is always
). This caused the company a loss of
electric power providers. So as to compensate for the determination of the selling price of
electricity, the government pays the difference in price to the company providing electric
: Basic Allocation Expenses (BPP) and Average Selling Price of Electricity 1990-2010
PLN electricity sales
of government subsidies. The Government of the Republic of Indonesia

99
provides consumer subsidies through the company. The method for calculation of and
remittance for the electricity subsidy in the 2010 and 2011 Budget used Republic of
Indonesia Finance Ministry Regulation (PMK) No. 111/PMK.02/2007 dated 14 September
2007, which was amended by Regulation No. 162/PMK.02/2007 dated 17 December 2007.
The electricity subsidy and the negative difference between the average sales price of electric
energy (IDR/kWh) from each tariff category minus Basic Allocation Expenses (BPP) for
electric energy (IDR/kWh) depending on the electrical current for each tariff category is
multiplied by sales volume (kWh) for each tariff category. BPP for electric energy is
calculated based on this formula, and incorporates allowance for network, transmission and
distribution leakages as determined by the Energy and Mineral Resource Ministry c.q.
Directorate General of Electricity.
Based on that formula, on year BPP can be projected by Average Selling Price of Electricity
by Type of Customer on previous year, as well as Province’s BPP.
Table 37: Average Selling Price of Electricity by Type of Customer and by Province (2011)
PLN Operational Unit/Province Residential Industrial Business Social Gov. Office
Building
Publ. Street
Lighting Total
Region of NAD 552.76 813.79 891.30 606.86 1,034.03 819.79 658.16
Region of North Sumatera 587.19 726.24 929.69 663.12 1,027.00 819.91 700.63
Region of West Sumatera 582.12 625.43 949.35 615.10 1,064.28 830.24 667.50
Region of Riau 663.62 753.08 954.85 670.93 1,049.30 819.34 761.02
-Riau 654.49 744.81 942.92 760.60 1,036.24 819.45 755.00
-Riau Archipelago 706.87 798.80 1,012.86 61.33 1,099.81 818.69 790.38
Region of South Sumatera, Jambi & Bengkulu 613.78 737.92 941.62 634.73 1,015.84 796.62 704.64
-South Sumatera 599.79 736.09 927.87 634.12 1,003.58 789.81 697.74
-Jambi 659.47 747.24 970.70 644.60 1,020.25 810.18 739.91
-Bengkulu 590.49 751.53 955.62 620.33 1,058.29 819.62 670.71
Region of Bangka Belitung 623.16 828.54 1,007.66 639.14 1,050.79 819.58 710.45
Region of Lampung 608.47 737.83 909.67 632.37 1,032.17 818.74 688.35
East Sulawesi 586.31 790.00 796.20 554.83 997.72 818.72 659.70
Region of S & C Kalimantan 561.46 753.25 988.04 615.93 1,063.63 819.97 678.83
-South Kalimantan 544.25 754.40 998.36 610.30 1,081.23 819.97 6,669.06
-Central Kalimantan 598.27 745.04 967.33 627.38 1,042.20 820.00 700.88
Region of East Kalimantan 615.76 772.40 987.26 661.41 1,010.57 819.93 737.34
Region of N, C Sulawesi & Gorontalo 592.56 792.84 986.55 612.78 1,062.40 823.92 703.28
-North Sulawesi 607.85 773.76 1,008.98 637.73 1,038.79 800.13 720.69
-Gorontalo 558.82 784.77 915.01 619.08 1,057.41 828.85 663.64
-Central Sulawesi 583.48 883.59 952.65 621.42 1,087.04 846.73 689.71

100
Region of S, SE & W Sulawesi 580.00 688.51 941.22 645.82 1,023.69 815.94 696.04
-South Sulawesi 571.49 684.23 933.23 648.94 1,014.16 815.26 692.21
-Southeast Sulawesi 617.08 792.42 1,011.05 620.64 1,049.19 820.00 722.72
-West Sulawesi 605.53 871.84 927.64 637.21 1,078.98 819.98 700.43
Region of Maluku & North Maluku 573.94 819.43 946.40 627.13 1,108.05 819.75 699.36
-Maluku 565.99 805.18 987.89 619.37 862.94 890.02 693.96
-North Maluku 586.12 866.33 859.15 641.38 1,500.48 758.63 708.24
Region of Papua 700.53 792.13 975.53 689.71 1,036.09 851.88 813.46
-Papua 765.34 901.11 1,061.25 741.54 1,088.45 930.21 888.63
-West Papua 595.21 742.54 818.99 600.43 898.19 752.93 684.64
Distribution of Bali 640.33 815.46 991.26 653.03 1,063.31 820.13 821.86
Region of West Nusa Tenggara 531.14 828.78 985.52 574.99 1,022.50 819.42 690.33
Region of East Nusa Tenggara 603.60 873.31 992.59 664.15 1,040.25 823.50 740.01
PT PLN Batam 835.74 1,085.77 1,383.34 775.15 1,421.05 1,347.14 1,118.32
PT PLN Tarakan 744.52 - 1,578.80 928.12 2,668.58 - 942.66
Outside Java 605.68 744.43 980.09 617.36 1,063.18 820.63 728.57
Dist. Of East Java 576.73 708.71 986.96 651.73 1,040.35 819.58 697.09
Dist. Of East Central Java & Yogyakarta 536.29 724.28 996.66 651.10 1,021.50 826.77 669.92
-Central Java 525.84 723.12 993.73 636.09 1,027.38 827.56 662.63
-D.I. Yogyakarta 608.92 755.57 1,009.38 701.74 998.69 820.00 729.66
Dist. Of West Java & Banten 533.48 699.88 963.03 620.36 933.82 818.58 669.55
-West Java 533.77 716.50 957.95 625.80 920.25 818.42 674.21
-Banten 530.18 651.18 1,031.62 558.22 1,063.31 819.96 647.73
Dist. Of Jakarta Raya & Tangerang 765.44 728.00 943.81 757.60 874.07 819.78 812.21
Java 608.20 710.25 959.81 681.85 922.21 821.60 717.76
Indonesia 617.95 695.46 951.05 646.36 939.80 791.52 714.24
Source: PLN Statistic 2011[55]
Based upon the Budget Implementation Authorization Form letter (DIPA), the subsidy
ceiling for electricity in budget year 2011 is set at IDR 40,700 billion, including an 8%
margin above primary expenses for electricity supply. On 23 December 2011, the
government raised the subsidy ceiling for electricity in 2011 to IDR 86,245 billion.
Based upon the DIPA, the top ceiling for the electricity subsidy in the 2010 budget was set to
IDR 35,300 billion, including an 8% margin above primary expenses for electricity supply. In
accordance with the revised 2010 state budget, the government raised the 2010 electricity

101
subsidy ceiling to IDR 51, 106 billion. On 29 December 2010, the government raised the
electricity subsidy ceiling to IDR 3,606 billion.
Table 38: Average Generation Cost by Type of Power Plants (IDR/kWh) 2006-2011
Year Hydro Steam Diesel Gas Geothermal Combined
Cycle
Average
2006 143.19 389.48 1,631.36 1,999.15 579.74 889.33 705.96
2007 118.80 405.91 2,438.47 2,155.67 615.10 873.80 706.62
2008 131.60 597.26 3,578.25 3,298.03 746.61 1,278.79 1,051.84
2009 139.48 598.31 2,696.52 1,422.71 639.87 739.79 767.79
2010 98.02 559.22 2,043.71 1,594.93 701.39 788.46 795.59
2011 155.79 588.47 2,536.85 2,260.96 792.61 960.58 1,051.14
Source: PLN Statistics 2011 [55]
Table 39: Average Selling Price of Electricity (HJTL) by Type of Customers (IDR/kWh) 2003-2011
Year Residential Industrial Business Social Gov.
Office
Building
Publ.
Street
Lighting
Total
2003 522.48 530.32 661.41 538.09 725.90 594.98 550.74
2004 557.76 559.15 682.32 568.65 712.47 638.99 581.75
2005 563.05 569.87 694.71 569.90 730.32 628.72 590.91
2006 571.12 624.23 764.25 585.30 755.53 644.87 628.14
2007 571.76 621.32 772.51 574.08 743.40 647.73 629.18
2008 588.01 622.04 850.56 580.89 847.15 665.11 653.00
2009 589.33 644.34 890.90 577.77 870.38 663.33 670.02
2010 615.92 660.99 934.32 623.76 953.03 745.77 699.09
2011 617.95 695.46 951.05 646.36 939.80 791.52 714.24
Source: PLN Statistics 2012
It was agreed in the proposed electricity subsidy in 2013, among others, about the increase in
electricity tariffs by 15% in 2013 gradually, electricity sales growth of 9% and sales volume
of 182.3 TWh of electricity. Basic allocation expense for electricity shrinkage of 8.5% and

102
Basic Electricity Allocation Expense IDR 212.07 trillion or IDR 1,163 per kWh, so total BPP
in 2013 was IDR 1,261 per kWh.
In addition to adjustments in electricity tariffs, the government encourages the generation of
electric energy from new and renewable energy. This effort will reduce the share of fossil
energy in electricity generation such as diesel and gas respectively burdensome costs of
power generation per kWh of IDR 2,536.85 and IDR 2,260.96 is far above the average selling
price of electricity (HJTL) IDR 714.24 (2011). With the increasing portion of electricity
generation from non-fossil energy, it will reduce the Average Generation Cost and Expenses
Basic Allocation (BPP), thus reducing the burden on the state budget electricity subsidy.
Basic Electricity Tariffs (TDL)
Ministry of Energy and Mineral Resources (MoEMR) Regulation No.30/2012 has determined
Basic Electricity Tariffs (TDL) 2013 as shown as Tables below (for Residential, Commercial
and Industrial type of customer). In every 3 months, Basic Electricity Tariffs proposed by
PT.PLN (Persero) to get approved by MoEMR. Based on RAPBN 2013, the tariffs will be
increase 15% gradually in a year.
Table 40: The Latest Basic Electricity Tariff (TDL) for Residential Use Q4 2013
No Group
Rates
Power
Limit
Regular Pre-Paid
Price
(IDR/kVA/mon
th)
Usage Fee
(IDR/kWh)
1 R-1/TR until 450
VA
11,000 Block I : 0-30 kWh : 169
Block II: > 30 – 60
kWh: 360
Block III: >60 kWh :
495
415
2 R-1/TR 900 VA 20,000 Block I : 0-20 kWh : 275
Block II: > 20 – 60
kWh: 445
Block III: >60 kWh :
495
605

103
3 R-1/TR 1,300 VA *) 979 979
4 R-1/TR 2,200 VA *) 1,004 1,004
5 R-2/TR 3,500-5,500
VA
*) 1,145 1,145
6 R-3/TR 6,600 VA
above
*)
1,352 1,352
Source: MoEMR Regulation No.30/2012
Table 41: The Latest Basic Electricity Tariff (TDL) for Commercial Use Q4 2013
No Group
Rates
Power
Limit
Regular Pre-Paid
Price
(IDR/kVA/m
onth)
Usage Fee
(IDR/kWh)
1 B-1/TR 450 VA 23,500 Block I : 0-30 kWh : 254
Block II: > 30 : 420
535
2 B-1/TR 900 VA 26,500 Block I : 0-108 kWh : 420
Block II: > 108 kWh: 465
630
3 B-1/TR 1,300 VA *) 966 966
4 B-1/TR 2,200 VA –
5,500 VA
*) 1,100 1,100
5 B-2/TR 6,600-200
kVA
**) 1,352 1,352
6 B-3/TM > 200 kVA ***)
Block WBP = K x 1,020
Block LWBP = 1,020
kVArh = 1,117 ***)
-
Source: MoEMR Regulation No.30/2012

104
Table 42: The Latest Basic Electricity Tariff (TDL) for Industrial Use Q4 2013
No Group
Rates
Power
Limit
Regular Pre-Paid
Price
(IDR/kVA/m
onth)
Usage Fee
(IDR/kWh)
1 I-1/TR 450 VA 26,000 Block I : 0-30 kWh : 160
Block II: > 30 : 395
485
2 I-1/TR 900 VA 31,500 Block I : 0-72 kWh : 315
Block II: >72 kWh: 405
600
3 I-1/TR 1,300 VA *) 930 930
4 I-1/TR 2,200 VA *) 960 960
5 I-1/TR 3,500-14
kVA
*) 1,112 1,112
6 I-2/TR >14 - 200
kVA
**)
Block WBP = K x 972
Block LWBP = 972
kVArh = 1,057 ***)
-
7 I-3/TM > 200 kVA **) Block WBP = K x 803
Block LWBP = 803
kVArh = 864 ***)
-
8 I-4/TT >30,000
kVA
***) Block WBP and LWBP =
723
kVArh = 723 ***)
-
Source: MoEMR Regulation No.30/2012
The price of electricity on average in 2012 amounted to IDR 782 per kWh (Persero), with a
gradual increase in TDL 15% during 2013, the price of electricity on average in 2013 is
estimated at about Rp. 899.30 per kWh. With an estimated value of the Basic Allocation
Expenses (BPP) in 2013 amounted to IDR 1,261 per kWh, the electricity subsidy to be borne
by the state budget is around IDR 361 per kWh.
Law No. 30/2009: PLN is no longer an Authorized Agency in The Electrical Power Business,
but a State-owned Enterprise assigned the duty of supplying electricity to meet public needs.
The 2009 Electricity Law provides PLN with priority rights to conduct these businesses
throughout Indonesia. PLN, as the sole owner of transmission and distribution assets, also

105
remains the only business entity in chargeof transmitting and distributing electric power.
Further, whilst the 2009 Electricity Law allows private participation in the supply of
electricity for public use (which includes transmission and distribution), current private sector
participation is still limited to the power generation sector.
MEMR Regulation No.28/2012 Clause/Article 2 stated that Electricity distribution business,
the sale of electricity, and integrated electricity supply business for public interest in the
Business Area implemented. In one region there is only one Business Enterprises. The region
defined in the terms of existing business enterprises which has inaccessibility and inability to
meet quality and reliability in the terms of generation and distribution of electricity. It is good
opportunities but face many challenges. Weaker fossil fuel prices of late have undermined the
attractiveness of investments in renewable energy technology. Many renewable-electricity
generated projects tend to be small scale and typically have high unit capital costs. This
means that they often rely on price protection especially with regard to their tariff. They may
also face grid connection and land acquisition/use problems. If they have to develop their
distribution lines, it will need more funds, resulting in higher risk investment. Moreover, PLN
required buying electricity from renewable energy. Therefore, electricity generation in
Indonesia will be distributed mostly on-grid connection, located in the area which PLN have
already have distribution and transmission lines. Finally, financing can be an issue as there is
little early stage risk equity available in Indonesia with investors typically looking for more
mature projects driven off conventional power sources.
Government encourages “Go Green” not by financial assistant but through policies which
encourage state-owned enterprises and large companies to support “Go Green” projects.
Table 43: Summary of PVES sustainability dimensions for Case Study (Lampung, West Java and NTT)
Institutional dimension: Benefits & Issues
- The establishment of organic,
informal PVES market institution
has facilitated the PVES horizontal
network for information sharing
- Institutional capacity building for
providers (market facilitation,
technical assistance, increased
capacity for manufacturing and
- Dual objectives on GHG
reduction credit & SRD,
delivered using top down and
bottom up approach

106
exporting BOS component) consolidated the differing
interests of the investor and
host community
- Institutional skill: autonomy in the
selection of the form of electricity
supply (PVES or grid), in the PVES
transaction (payment terms, PVES
configuration)
- Rural outlets were established in
the project areas to approach
customers, however many outlets
were forced to close down due to
declining sales following the
project closure
- Institutional capacity
building: the establishment
of PLD, KUEP and KUPD,
exercise in defining the rule
of the game resulting in users
high commitment to the
continued operation of PLD
- The vertical network did not allow
users to be active participants
- The PM training allowed
local people, who managed
PLD, to handle the plant
operation and management
- Involvement of local
community and local capable
institution (NGO) to act as
facilitator was instrumental
in achieving a successful
project outcome
- The rural electrification
project was accompanied by
rural economy
empowerment, made explicit
in the contractual document
Financial dimension: Benefits & Issues
- Affordability for users as new
module is still perceived too
expensive
- Increased accessibility for
providers and users (limited to
wealthier households) during
project life (Section 3.4.3.b)
- A full capital investment is
required for the less
commercial market segment
(grants, or fully funded
externally, in this case)
- Saving from cost and effort to
obtain fossil fuel, dry cell batteries
and battery charging
- Saving from cost and effort to
obtain fossil fuel, dry cell batteries
and battery charging
- Users pay monthly fee to
cover PLD operation, and the
revenue was deposited in a
bank account, authority from
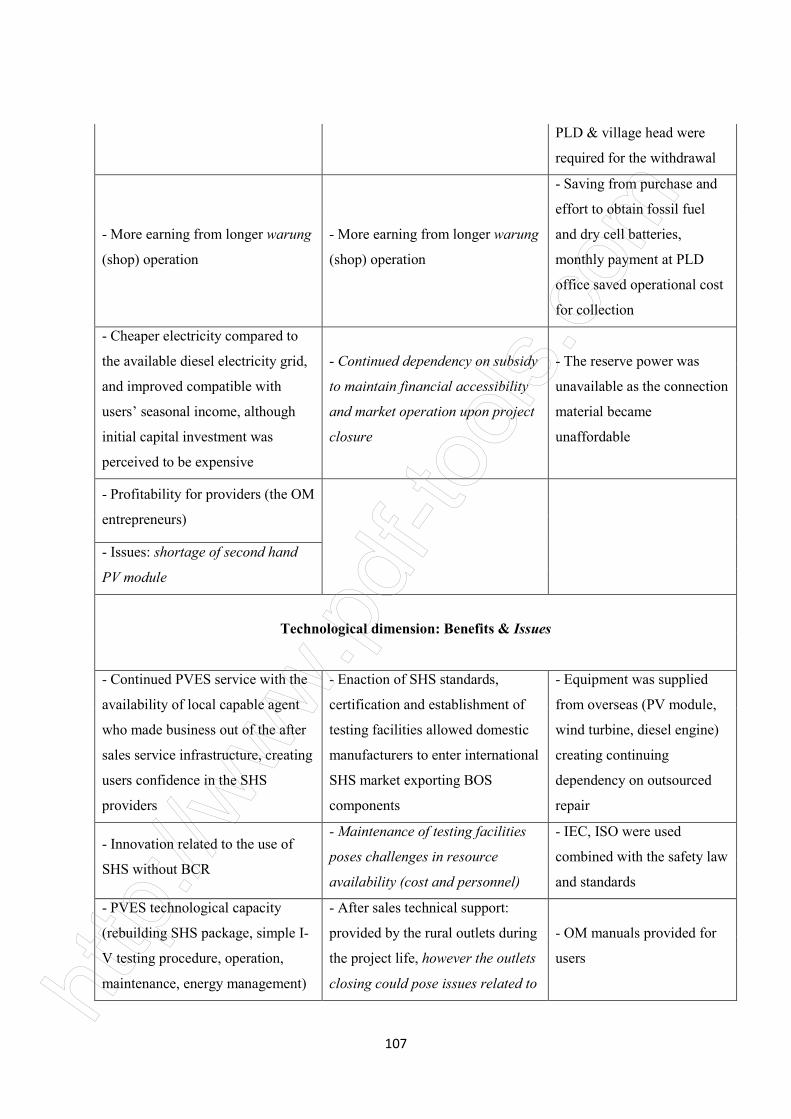
107
PLD & village head were
required for the withdrawal
- More earning from longer warung
(shop) operation
- More earning from longer warung
(shop) operation
- Saving from purchase and
effort to obtain fossil fuel
and dry cell batteries,
monthly payment at PLD
office saved operational cost
for collection
- Cheaper electricity compared to
the available diesel electricity grid,
and improved compatible with
users’ seasonal income, although
initial capital investment was
perceived to be expensive
- Continued dependency on subsidy
to maintain financial accessibility
and market operation upon project
closure
- The reserve power was
unavailable as the connection
material became
unaffordable
- Profitability for providers (the OM
entrepreneurs)
- Issues: shortage of second hand
PV module
Technological dimension: Benefits & Issues
- Continued PVES service with the
availability of local capable agent
who made business out of the after
sales service infrastructure, creating
users confidence in the SHS
providers
- Enaction of SHS standards,
certification and establishment of
testing facilities allowed domestic
manufacturers to enter international
SHS market exporting BOS
components
- Equipment was supplied
from overseas (PV module,
wind turbine, diesel engine)
creating continuing
dependency on outsourced
repair
- Innovation related to the use of
SHS without BCR
- Maintenance of testing facilities
poses challenges in resource
availability (cost and personnel)
- IEC, ISO were used
combined with the safety law
and standards
- PVES technological capacity
(rebuilding SHS package, simple I-
V testing procedure, operation,
maintenance, energy management)
- After sales technical support:
provided by the rural outlets during
the project life, however the outlets
closing could pose issues related to
- OM manuals provided for
users

108
continued after sales service
- Confidence in PVES service
which, given the right utilization,
was more reliable than the grid
- Degree of users familiarity with
SHS varied, in some cases resulting
in users disappointment from
overselling
- Technician and spare parts
were available at PLD office
- The SHS power is limited but to
many users is found to suit their
energy demand
- The reduction in energy level in
the battery (within 6 months after
installation) resulted in users
deciding to bypass the BCR
- At the end of the hybrid
technical life, SHS would be
preferred
Social dimension: Benefits &Issues
- PVES meets the low energy
demand of some end users, those
who require more capacity also own
portable diesel engine, many of
those who decided to connect to the
grid have kept their SHS as a
backup supply
- Job creation, economic activities
facilitated
- Economic activities: The
accompanying community
empowerment programme,
allowed users to tap into
electrical and non-electrical
economic activities, based on
the pre-existing local
economy, enabling them to
pay for the electricity
regularly
- Facilitate night gathering, share
SHS use with neighbors, share TV
watching
- Healthier lifestyle (more house
cleaning)
- Significant revenue was
generated, but not sufficient
to refinance a similar
investment. The expensive
overseas repair of overseas
made electronic components
could drain the revenue
generated
- Less dispute in the family, save
children from the hazardous risk of
preparing kerosene lamps
- Better quality of lighting for study
and longer shop operation at night
- Initial local skepticism
towards PVES was overcome
by technical demonstration
and meetings in the village
- Close connectedness between - Increased security feeling - Better quality of lighting

109
providers and users based on trust
and reciprocity
for study, longer shop
operation at night, handicraft
making in the evening, avoid
fire risk, respiratory
problems from indoor
pollution
- SHS use has evolved to power CD
player to play recorded swallow’s
twitter for swallow bird farming;
and to charge mobile phones
- Facilitate night gathering and TV
watching
- Increased feeling of
security facilitated night-time
gatherings
- Expect further PVES-based
equipment use for economic
activities: carpentry equipment
(sugu, portable drilling machine),
tailoring machine
- Many users perceived the SHS
capacity insufficient to fulfill their
energy need, many decided to
purchase more SHS, others
remained interested to connect to
the grid, others purchased SHS as a
back up to the grid
- Isolation reduced by access
to infotainment, use of rural
telephone and TV watching
which also facilitated people
gathering
- Portable solar powered radio
expected
- Social prestige,
strengthened social
hierarchy (women’s domestic
task reinforced)
- Reduced isolation due to access to
infotainment and use of mobile
phones
- Villagers were not familiar with a
banking system
- Lamps too bright for sleeping at
night
- Fear that brighter light provoked
observation by thieves
- Strengthened social hierarchy
(women’s domestic task reinforced)
Ecological dimension: Benefits & Issues

110
- Less use of fossil fuel (kerosene
and diesel)
- Less use of fossil fuel (kerosene
and diesel)
- Less use of fossil fuel
(kerosene and diesel)
- Waste disposal: the custom for
used battery compartments was
either reuse or resale, other PVES
wastes were dumped in the yard
- Waste disposal: the custom for
used battery compartments was
either reuse or resale,
- Waste disposal: PVES
wastes were dumped in the
yard
other PVES wastes were dumped in
the yard
- Corrosion was a serious
issue as the metallic
equipment could not stand
the harsh natural
environment of the Oeledo
location
Source: Enhancing the Sustainability of Off-Grid Photovoltaic Energy Service Delivery in Indonesia, School of
Electrical Engineering and Telecommunications, University of New South Wales, Sydney, Australia2007
There is no difference between RE and non-RE sector in Indonesia for priority sector in
lending or soft loans. Also currently, there is no regulation related with options for end user
financing for adoption of off-grid solutions in Indonesia

111
D. Business Models for SET Delivery
Electricity Generation
Power generation development in Indonesia from 2006-2011 was still dominated by fossil-
based sources. There is an increasing trend on the use of non-fossil based energy such as
geothermal, hydro power, wind power, and solar power (mora details, see Table 16-26). It is
interesting to note that the use of these non fossil-based sources of energy is still insignificant
compared to toral energy sources. Specifically the use of non fossil energy sources such as
mini hydro, micro hydro, wind, and solar is still very insiginifcant; while its potential
especially geothermal, for example, is very huge (approx. 40% of world reserve is Indonesia).
The use of non fossil energy sources such as wind and solar is also not encouraging due to
different causes. Wind power is not well developed due to local charasteristics of wind
velocity (mostly low speed). This make the energy efficiency on this source very low. In
other words, it requires much higher investment level to generate the same unit of energy.
Policy implication of this situation is that this source of energy would only be used widely if
there is significant incentives to boost its utilizaiton. Solar energy source has a high energy
pontential. However, its use has not been widely used due to low energy effiency. As such,
source of energy can be widely utilized if it is supported with related incentives and policy.
And also this source of energy can be used for specific purposes such as electrification in the
remote areas, telecommunication infrastructures, lighting of public road, etc.

112
Table 44: PLN’s Electricity Supply Facilities (2006-2011)
No Description 2006 2007 2008 2009 2010 2011
1 POWER PLANT MW 23,354.69 23,664.48 24,031.37 24,366.16 26,337.81 30,528.63
Steam PP MW 6,900 7,114 7,344 7,644 8,031.50 10,177.50
Gas Turbine PP MW 2,727.23 2,743,626 2,496.69 2,563.59 3,223.68 3,391.93
Combuned Cycle PP MW 7,021.00 7,061.00 7,371.00 7,371.00 6,951.30 7,841.97
Machine-Gas MW - - 9.8 14.00 26.8 80.54
Diesel PP MW 2,782.40 2,829.20 2,829.30 2,829.10 4,142.60 5,020.73
Hydro PP MW 3,529.10 3,501.50 3,504.30 3,508.50 3,522.60 3,488.71
Mini Hydro PP MW - - - - - 27.23
Micro Hydro PP MW - - - - - 2.55
Geothermal PP MW 395 395 415 435.00 438.8 455.00
Wind Power MW - - 0.3 1.10 0.3 0.34
Solar MW - - - - 0.2 1.13
Coal Gasification MW - - - - - 41.00
2 TRANSMISSION
LINES km 32,916.63 33,162.87 34,183.85 40,041.14 48,563,63 41,771.74
500 kV TL
(EHVTL) km 5,047.78 5,047.78 5,092.00 5,092.00 4,923.00 5,052.00
25-150 kV
TL(HVTL) km 27,869.05 28,115.09 29,091.85 34,949.14 43,640.63 36,719.74
SUB STATUION
Transformer
Capacity MVA 54,527.00 58,713.00 59,508.00 81,875.00 85,169.00 94,614.50
Units unit 1,101 1,136 1,144 1,220 1,228 1,280
3 DISTRIBUTION
LINES km 573,049.44 598,497.69
614,925.2
0
639,517.2
3 661,762.35 679,424.50
Medium Voltages
(6-20 kV) km 246,775.43 253,908.02
261,163.2
0
268,611.8
7 275,613.31 288,719.36
Low Voltage (<6
kV) km 326,274.01 344,589.67
353,762.0
0
370,905.3
6 406,149.04 390,704.94
DISTRIBUTION

113
SUBSTATION
Transformer
Capacity MVA 32,873.70 33,826.37 32,244.40 34,724.80 35,701.36 39,211.11
Units unit 259,444 279,454 276,549 286,724 298,357 318,107.00
Source: PLN Statistic 2011
Table 45: National’s Installed Capacity of Power Plant by Type (MW) (2006-2011)
Year Steam PP Gas PP Combined
Cycle PP
Engine
PP
Diesel
PP
Hydro
PP
Mini
Hydro
PP
Micro
Hydro PP
Geothermal
PP
2006 11,170.00 3,102.95 7,659.97 21.00 3,165.05 3,715.61 3.03 0.55 850.00
2007 12,014.00 3,220.18 7,699.97 33.00 3,211.91 3,688.04 6.03 0.55 980.00
2008 12,294.00 3,068.97 8,009.97 66.84 3,272.98 3,690.80 6.03 0.69 1,052.00
2009 12,594.00 3,135.88 8,009.97 71.00 3,256.36 3,694.95 6.03 0.69 1,189.00
2010 12,981.50 3,821.57 7,590.32 92.84 4,569.89 3,719.69 13.53 0.69 1,192.75
2011 16,318.00 4,236.02 8,480.97 169.54 5,471.93 3,880.83 57.66 5.93 1,209.00
Wind Power
PP Solar PP
Coal Gasification
PP
Waste
PP Total
0.00 0.00 0.00 0.00 29,688.15
0.10 0.00 0.00 0.00 30,853.77
0.26 0.00 0.00 0.00 31,462.54
1.06 0.00 0.00 0.00 31,958.93
0.34 0.19 0.00 0.00 33,983.30
0.93 1.16 41.00 26.00 39,898.97
Source: Handbook of Energy & Economic Statistics of Indonesia 2012

Figure 23: National’s Installed Capacity of Power Plant by Type (MW) (2005
Source: PLN Statistic 2011
Table 46: PLN’s Installed Capacity of P
Year Steam
PP Gas PP*
2006 6,900.00 2,727.20
2007 7,114.00 2,743.60
2008 7,344.00 2,496.70
2009 7,644.00 2,563.60
2010 8,031.50 3,223.70
2011 10,177.50 3,391.90
Micro
Hydro
PP
Geothermal
PP
- 395.00
- 415.00
- 415.00
- 435.00
- 438.80
2.60 455.00
*2011 includes power plant rented (
114
: National’s Installed Capacity of Power Plant by Type (MW) (2005
PLN Statistic 2011
PLN’s Installed Capacity of Power Plant by Type (MW) (2006
Gas PP* Combined
Cycle PP*
Gas
Engine
PP*
Diesel
PP*
Hydro
PP
2,727.20 7,021.00 0.00 2,782.40 3,529.10
2,743.60 7,061.00 0.00 2,829.20 3,501.50
2,496.70 7,371.00 9.80 2,890.30 3,504.30
2,563.60 7,371.00 14.00 2,829.10 3,508.50
3,223.70 7,371.00 26.80 4,142.60 3,522.60
3,391.90 7,842.00 80.50 5,020.70 3,488.70
Geothermal Wind
Power PP Solar PP
Coal
Gasification
PP
- - -
0.10 - -
0.30 - -
1.10 - -
0.30 0.20 -
0.30 1.10 41.00
(Source: Handbook of Energy & Economic Statistics of Indonesia 2012
: National’s Installed Capacity of Power Plant by Type (MW) (2005-2011)
(MW) (2006-2011)
Hydro
PP
Mini
Hydro
PP
3,529.10 -
3,501.50 -
3,504.30 -
3,508.50 -
3,522.60 -
3,488.70 27.20
Total
23,354.69
23,664.48
24,031.37
24,366.16
26,337.81
30,528.63
Handbook of Energy & Economic Statistics of Indonesia 2012)

115
Table 47: PLN’s Installed Capacity of Power Plant by Type and by Region (MW) (2011)
No Region/Province PLTU/Steam
PP
PLTG/Gas
PP
PLTGU/Combined
Cycle PP
PLTMG/Gas
Engine PP
PLTD/Diesel
PP
1 Nanggroe Aceh
Darussalam - - - - 200.68
2 North Sumatera 490.00 223.29 817.88 - 41.42
3 West Sumatera 200.00 64.05 - - 32.79
4 Riau - 64.80 - - 89.02
5 Riau Island - - - - 81.64
6 Bengkulu - - - - 20.04
7 Jambi - 61.77 - - 44.12
8 South Sumatera 285.00 174.85 40.00 - 32.69
9 Bangka Belitung - - - - 91.78
10 Lampung 200.00 - - - 81.52
11 Banten 4,940.00 - 740.00 - -
12 DKI Jakarta 500.00 52.00 2,441.58 - 16.08
13 West Java 990.00 1,148.00 660.00 - 0.20
14 Central Java 930.00 135.26 1,033.90 - -
15 D. I. Yogyakarta - - - - -
16 East java 1,500.00 342.45 2,040.61 - 8.83
17 Bali - 356.85 - - 79.40
18 West Kalimantan - 34.00 - - 194.84
19 Central Kalimantan - - - - 78.05
20 South Kalimantan 130.00 21.00 - - 125.82
21 East Kalimantan - 38.40 60.00 13.94 223.99
22 North Sulawesi - - - - 103.56
23 Gorontalo - - - - 31.70
24 Central Sulawesi - - - - 118.84
25 West Sulawesi - - - - 6.49
26 South Sulawesi 12.50 122.72 - - 72.69
27 South East
Sulawesi - - - - 89.70
28 West Nusa
Tenggara - - - - 144.82

116
29 East Nusa Tenggara - - - - 137.50
30 Maluku - - - - 154.04
31 North Maluku - - - - 42.55
32 Papua - - - - 91.60
33 Papua Barat - - - - 51.67
INDONESIA 10,177.50 2,839.44 7,833.97 13.94 2,488.10
Source: PLN Statistic 2011
Table 48: PLN’s Installed Capacity Rented by Type of Power Plant and by Region (MW) (2011)
No Region/Province PLTG/Gas
Turbine PP
PLTGU/Combi
ned Cycle PP
PLTMG
/ Gas
Engine
PP
PLTD/Die
sel PP
PLTGB
/Coal
Gas
Total
1 Nanggroe Aceh
Darussalam - - - 246.00 - 246.00
2 North Sumatera - - - 117.00 - 117.00
3 West Sumatera - - - 80.15 - 80.15
4 Riau 58.50 8.00 - 194.75 - 261.25
5 Riau Island - - - 61.95 - 61.95
6 Bengkulu - - - 17.00 - 17.00
7 Jambi 120.00 - 17.50 5.00 - 142.50
8 South Sumatera 354.00 - 33.00 - - 387.00
9 Bangka Belitung - - - 116.04 - 116.04
10 Lampung - - - 158.94 - 158.94
11 Banten - - - - - -
12 DKI Jakarta - - - - - -
13 West Java - - - - - -
14 Central Java - - - - - -
15 D. I. Yogyakarta - - - - - -
16 East java - - - - - -
17 Bali - - - 126.00 - 126.00
18 West Kalimantan - - - 202.50 33.00 235.50
19 Central Kalimantan - - - 58.10 - 58.10
20 South Kalimantan - - - 119.00 - 119.00

117
21 East Kalimantan 20.00 - 16.10 150.35 8.00 194.45
22 North Sulawesi - - - 79.00 - 79.00
23 Gorontalo - - - 29.00 - 29.00
24 Central Sulawesi - - - 63.00 - 63.00
25 West Sulawesi - - - - - -
26 South Sulawesi - - - 255.00 - 255.00
27 South East Sulawesi - - - 84.00 - 84.00
28 West Nusa Tenggara - - - 142.50 - 142.50
29 East Nusa Tenggara - - - 50.85 - 50.85
30 Maluku - - - 62.00 - 62.00
31 North Maluku - - - 26.00 - 26.00
32 Papua - - - 66.50 - 66.50
33 Papua Barat - - - 22.00 - 22.00
INDONESIA 552.50 8.00 66.60 2,532.63 41.00 3,200.73
Source: Handbook of Energy & Economic Statistics of Indonesia 2012
Table 49: Private (IPP & PPU)’s Installed Capacity by Type of Power Plant and by Region (MW) (2011)
N
o
Region/
Province
Classif
ication PLTU
PLT
G
PLT
GU
PLT
MG
PLT
D
PLT
A
PLT
M
PLT
MH
PLT
P
PLT
B
PLT
S
PLT
Sa Total
1
Nanggro
e Aceh
Darussal
am
IPP 15 0.09 15.09
2 North
Sumatera IPP 30 187.5 7.5 12 237
3 West
Sumatera IPP 0.33 0.33
4 Riau IPP
5 Riau
Island IPP 22
262.0
87 58
289.
959
632.0
46
6 Jambi IPP 6 19 0.22 25.22
7 South
Sumatera IPP 312 112 150 574
8 Bangka
Belitung IPP 7 5 12
9 Lampung IPP

118
10 Banten IPP 400
11 DKI
Jakarta IPP
12 West
Java IPP 150 186.5 0.5 1.67 682 26
1,046
.67
PPU 386 204 590
13 Central
Java IPP 2,745 0.14 60
2,805
.14
14 East Java
IPP 2,450 0.025 2,460
.03
15 Bali
IPP 0.025 0.39
5 0.03 0.45
16
West
Kalimant
an
IPP 0.4 0.40
17
Central
Kalimant
an
IPP 28 20.00
18
South
Kalimant
an
IPP 14 14.00
19
East
Kalimant
an
IPP 71.5 44.6 116.1
0
PPU 7 24 12 38.6
87 81.67
20 North
Sulawesi IPP 3 3.00
21 Central
Sulawesi IPP 30 9.3 39.30
22 South
Sulawesi IPP 3 60 135
62.2
2 8.12 10.1 0.29 0.2
278.9
3
23
West
Nusa
Tenggara
IPP 0.2 0.20
24
East
Nusa
Tenggara
IPP 0.015 0.02

119
25 Papua IPP 305 3.05
26 West
Papua IPP 7.7 7.70
Indonesia
6,140.5
0
844.0
87 639 89
451.
2
392.1
2
30.4.2
5 3.38 754
0.59
5 0.03 26
9.370
.34
Source: Handbook of Energy & Economic Statistics of Indonesia 2012
Table 50: Rated Capacity of Power Plant (MW) (2011)
Year Hydro
PP
Steam
PP
Gas
Turbine
PP
Combine
Cycle PP
Geothermal
PP
Diesel
PP
Gas
Engine
PP
Solar
PP
Wind
Power
PP
Total
2006 3,283.24 7,608.16 2,323.48 6,493.77 373.71 1.937.27 - - - 22,019.63
2007 3,409.12 7,748.73 2,455.87 6,165.33 388 1,885.56 - - - 22,052.61
2008 3,397.87 7,406.12 2,173.79 6,399.79 394 1,808.53 - - 0.26 21,580.36
2009 33,418.62 7,976.65 2,236.66 6,340.60 394 1,669.11 - - 1.06 22,036.70
2010 3,433.79 8,652.01 2,792.87 6,139.72 415.8 2,071.90 34.6 0.17 - 23,540.86
2011 3,430.11 10,844.21 2,357.43 6,817.82 434 1,555.20 10 1.15 - 25,.449.92
Source: Handbook of Energy & Economic Statistics of Indonesia 2012
Table 51: Rated Capacity of Power Plant by Type and by Region (MW) (2011)
No Region/Province
Hydro
PP Steam PP
Gas Turbine
PP
1 Nanggroe Aceh Darussalam 0.8 - -
2 North Sumatera - - -
3 West Sumatera 0.4 - -
4 Riau - - -
5 Riau Island - - -
6 South Sumatera - 121 -
7 Jambi - - -
8 Bengkulu 1.2 - -
9 Bangka Belitung - - -
10 Lampung - - -
11 West Kalimantan 1.58 - 30
12 South Kalimantan 30 - 18

120
13 Central Kalimantan - - -
14 East Kalimantan - - 32
15 North Sulawesi 50.3 - -
16 Gorontalo 1.2 - -
17 Central Sulawesi 5.45 10 -
18 South Sulawesi 147.37 - 72
19 South East Sulawesi 4 - -
20 West Sulawesi - - -
21 Maluku - - -
22 North Maluku - - -
23 Papua 1.85 - -
24 West Papua 1.6 - -
25 Dist. Bali - - -
26 West Nusa Tenggara 0.62 - -
27 East Nusa Tenggara 1.03 - -
28 PT PLN Batam - - -
29 PT PLN Tarakan - - -
30 Kit Sumbagut 252.26 263.87 217.58
31 Kit Sumbagsel 604.41 375.25 247.96
32 P3B Sumatera - - -
Outside Java 1,104.07 770.12 617.74
33 Dist. East Java 1.8 - -
34 Dist. Central Java 0.38 - -
35 D.I Yogyakarta 0.1 - -
36 West Java - - -
37 Banten - - -
38 Dist. Jakarta Raya and
Tangerang - - -
39 PT Indonesia Power 1,100.88 3,599.59 728.69
40 PT PJB 1,222.88 1,617.00 171
41 P3B Jawa Bali - - -
42 Pembangkit Muara Tawar - - 840
43 Pembangkit Cilegon - 587.5 -
44 Pembangkit Tanjung Jati B - 2,840 -

121
45 Lontar - 560 -
46 Indramayu - 870 -
Java 2,326.04 10,074.09 1,739.69
Indonesia 3,340.11 10,844.21 2,357.43
Source: Annual Report PLN 2011
Table 52: Rated Capacity of Power Plant by Type (MW) (2011) [63]
PLTGU
Combined
Cycle PP
PLTP
Geothermal
PP
PLTD
Diesel
PP
PLTM-
G/Gas
Engine PP
PLTS/Sola
r PP
PLT
Bayu/Wind
Power PP
Total %
- - 88.4 - - - 89.2 0.35
- - 7.91 - - - 7.91 0.03
- - 19.02 - - - 19.42 0.08
- - 49.33 - - - 49.33 0.19
- - 52.93 - - - 52.93 0.21
- - 4.3 - - - 4.3 0.02
- - 9.32 - - - 9.32 0.04
- - 12.64 - - - 13.84 0.05
- - 56.07 - - - 56.07 0.22
- - 2.04 - - - 2.04 0.01
- - 142.81 - - - 174.45 0.69
- - 55.96 - - - 224.96 0.88
- - 53.67 - - - 224.96 0.21
58.3 - 109.76 - - - 200.35 0.79
- 80 64.36 - - - 195 0.77
- - 18.3 - - - 19.5 0.08
- - - - - - 84.01 0.33
- - 47.17 - - - 266.54 1.05
- - 65.77 - - - 69.77 0.27
- - 4.9 - - - 4.9 0.02
- - 60.77 - 0.1 - 60.87 0.24
- - 29.32 - - - 29.32 0.12
- - 56.96 - - - 58.81 0.23
- - 40.4 - - - 42 0.17

122
- - 2.23 - - - 2.23 0.01
- - 81.3 - 0.21 - 82.13 0.32
- - 92.1 - 0.35 - 93.48 0.37
- - 47.52 - - - 47.52 0.19
- - 10.8 10 - - 20.8 0.08
673 - 48.2 - - - 1,454.91 5.72
36 - 86.97 - - - 1,350.59 5.31
- - - - - -
- - 6.74 - - - 8.54 0.03
- - - - - - 0.38 0
- - - - - - 0.1 0
- - - - - - - -
- - 0.16 - - - 0.16 0
- - 58 - - - - -
2,320.52 354 58.51 - - - 8,162.19 32.07
2,315.00 - - - - - 5,325.88 20.93
- - - - - - - -
- - - - - - 840 3.3
1,415.00 - - - - - 2,002.50 7.87
- - - - - - 2,840.00 11.16
- - - - - - 560 2.2
- - - - - - 870 -
6,050.52 354 65.41 - - - 20,609.75 80.98
6,817.82 434 1,555.20 10 1.15 - 25,449.92 100
Table 53: Rated Capacity of Power Plant by Type (MW) (2011) Continued [63]
PLTA/Hydro
PP
PLTM/Mini
Hydro PP
PLTMH/Mi
cro Hydro
PP
PLTP/Geother
mal PP
PLTB/Wind
Power
PLTS/Solar
PP Total
1.75 - - - - - 202.43
132.00 7.50 - - - - 1,712.09
254.16 - - - - - 551.00
114.00 - - - - - 267.82
- - - - - - 81.64

123
236.04 - - - - - 256.08
- - - - - - 105.89
- - - - - - 532.54
- - - - - - 91.78
118.00 - - - - - 399.52
- - - - - - 5,680.00
- - - - - - 3,009.66
1,805.36 - - 375.00 - - 4,978.56
306.82 2.80 - - - - 2,408.78
0.32 - - - - - 0.32
283.03 - - - - - 4,174.92
- - - - 0.26 - 436.51
1.60 - - - - 0.07 230.51
- - - - - - 78.05
30.00 - - - - - 306.82
- - - - 0.09 - 336.42
51.38 5.00 - 80.00 0.08 0.34 240.36
- 1.50 - - - - 33.20
- 8.55 - - - - 127.39
- - - - - - 6.49
148.50 - - - - - 356.41
1.60 - 2.55 - - - 93.85
- 0.92 - - - 0.26 146.00
0.12 0.96 - - - 0.37 138.95
- - - - - - 154.04
- - - - - - 42.55
2.04 - - - - - 93.64
2.00 - - - - - 53.67
3,488.72 27.23 2.55 455.00 0.43 1.04 27,327.92
Fast Track Programme 10.000 MW Phase 1
Based on Republic of Indonesia presidential Regulation no. 71 Year 2006 dated 5 July 2006,
which was replaced by Republic of Indonesia presidential Regulation no. 59 Year 2009 dated
23 December 2009, the government assigned the company to develop coal-fired steam power

124
plants (PLTU) at 42 locations in Indonesia, including 10 with total capacity of 7,490 MW for
Java – Bali and 32 with 2,769 MW off Java – Bali. The projects are expected to operate in
2012-2014.
Project Finance
From the finance perspective, the Fast track programme of 10,000 MW has already
experienced a significant progress. For the projects related to generation, financing needed
from foreign currency already secured total of uS$5.1 billion, while financing from local
currency has been secured to the amount of Rp21.6 trillion. For the related transmission
project, the foreign currency of uS$346 million and local currency of Rp12.17 trillion has
been secured. Some 85% of the total required financing the Fast track programme
development comes from credit that is guaranteed by the government of Indonesia
In accordance with Presidential Regulation (PP) No.91 Year 2007, this replaced PP No. 86
Year 2006 on Government Guarantee for development of coal generated electric power. The
remaining 15% will be covered by internal PLN’s financing.
As of 31 December 2011, the company had already paid a down payment of uS$872 million
and Rp.4, 750,379 million for 36 EPC contracts, or around 15% of the total value of the
contracts that were classified as construction in progress. The down payments were funded by
the issued guaranteed notes and withdrawals of credit facilities for the fast track programme.
In 2011, the company signed 131 contracts for upgrading and constructing new transmission
and sub stations both in Java and outside Java. These projects are financed by own funds and
withdrawal of credit facilities from bank. Construction signed for additional power plants and
own funds and other external funding through offshore loans grants and investment projects
from the State budget finance development regular of transmission and distribution network.
Development of 10,000 MW Phase 1
In 2011, PLN signed 36 Engineering, Procurement and Construction (EPC) contracts, which
consist of 10 electricity power plants with aggregate capacity of 7,490 MW for Java-Bali and
26 electric power plants with aggregate capacity of 2.4 GW outside Java and Bali. Based on

125
these EPC contracts, the company was required to pay the contractor down payment
approximately 15% of contract value upfront while the remaining 85% will be funded
through credit facilities from banks.
In 2011 additional capacity of 3,274 MW for the 10,000 MW Fast Track Program Phase I
was added by PLTU 3 Banten - Lontar 3x315 MW, PLTU 1 Banten - Suralaya 1x625 MW,
PLTU 1 JABAR - Indramayu 3x330 MW, PLTU 1 Jateng – Rembang 2x315 MW, PLTU
Kep.Riau - Tanjung. Balai Karimun 2x7 MW, PLTU 2 Sulut - Amurang 2x25 MW, PLTU
Sultra - Kendari 2x10 MW.
Table 54: Rated Capacity of Power Plant by Type (MW) (2011) Continued [63]
No Project Capacity
(MW) Unit COD Contract
COD
Est./Realization
Jawa-Bali
1 Steam Power Plant 1 Banten-
Suralaya 1x625 1 12-Mar-10 22 Ags 2011
2 Steam Power Plant 2 Banten-Labuan 2x300 1
2
12 Sep 2009
12 Des 2009
29 Oct 2009
15 Apr 2010
3 Steam Power Plant 3 Banten-Lontar 3x315
1
2
3
7 Apr 2010
7 Jun 2010
7 Aug 2010
Des 2011
Feb 2012
Mar 2012
4 Steam Power Plant 1 Jabar-
Indramayu 3x330
1
2
3
12 Sep 2009
12 Dec 2009
12 Mar 2010
29 Jan 2011
19 Mey 2011
Des 2011
5 Steam Power Plant 2 Jabar-
Pelabuhan 3x350
1
2
3
Agt 2012
Nov 2012
Feb 2013
Agt 2012
Nov 2012
Feb 2013
6 Steam Power Plant 1 Jateng-
Rembang 2x315
1
2
21 Sep 2009
21 Dec 2009
10 Des 2011
10 Des 2011
7 Steam Power Plant 2 Adipala-
Cilacap 1x660 1 22-Apr-12 May-14
8 Steam Power Plant 1 Jatim-Pacitan 2x315 1
2
7 Feb 2010
7 May 2010
Jun 2012
Sep 2012
9 Steam Power Plant 2 Jatim-Paiton 1x660 1 12-Mar-10 Apr-12

126
10 Steam Power Plant 3 Jatim-Tj Awar-
awar 2x350
1
2
25 Oct 2010
25 Jan 2011
Sep 2013
des 2013
Total FTP-1 Jawa-Bali 7,490
West Indonesia
11 Steam Power Plant NAD-Meulaboh 2x110 1
2
6 Jan 2011
6 Apr 2011
Oct 2012
Des 2012
12 Steam Power Plant 2 Sumut-
Pangkalan Susu 2x220
1
2
11 Aug 2011
11 Nov 2011
Jun 213
Oct 2013
13 Steam Power Plant 1 Riau-Bengkalis 2x10 1
2
9 Oct 2010
9 Dec 2010
Nov 2013
Des 2013
14 Steam Power Plant 2 Riau-Selat
Panjang 2x7
1
2
19 Aug 2010
19 Oct 2010
Apr 2012
Jun 2012
15 Steam Power Plant Riau-Tenayan 2x110 1
2
-
-
Jan 2014
Apr 2014
16 Steam Power Plant Kep. Riau-Tj
Balai Karimun 2x7
1
2
16 May 2010
16 May 2010
Nov 2011
Des 2011
17 Steam Power Plant Sumbar-Teluk
Sirih 2x112
1
2
17 Apr 2010
17 Jul 2010
Oct 2012
Des 2012
18 Steam Power Plant 3 Babel-Bangka
Baru 2x300
1
2
10 Nov 2010
10 Jan 2011
Mar 2012
Apr 2012
19 Steam Power Plant 4 Babel-Belitung 2x16.5 1 02 Nov 2010
02 Jan 2011 Mar-12
20 Steam Power Plant Lampung-
Tarahan Baru 2x100
1
2
29 Apr 2010
29 Jul 2010
Mar 2012
Apr 2012
21 Steam Power Plant 1 Kalbar-Parit
Baru 2x50
1
2
28 Dec 2011
28 Feb 2012
Sep 2013
Nov 2013
22 Steam Power Plant 2 Kalbar-
Bengkayang 2x27.5
1
2
Mar 2012
May 2012
Sep 2013
Des 2013
Total FTP-1 West Indonesia 1,600
East Indonesia
23 Steam Power Plant Kalsel-Asam-
Asam 2x65
3
4
20 Aug 2010
20 Oct 2010
Feb 2012
May 2012
24 Steam Power Plant 1 Kalteng-Pulau
Pisau 2x60
1
2
19 Dec 2012
19 Feb 2013
Feb 2013
Apr 2013

127
Fast Track Programme 10,000 MW Phase 2
Development of Fast Track Program Phase 2 of the 10,000 MW development project is based
on Presidential Decree No.4/2010, which was later amended by Presidential Decree
No.48/2011, under which a mandate was given to PLN to establish a 9.522 MW power plant
using gas and coal as fuel. This was later revised by ESDM Ministry Instruction No. 1/2012
to increase power generation to a supply capacity of 10.047 MW.
The goal of implementing FTP 2 is to meet Indonesia’s electricity requirements that extend
beyond the capacity of FTP 1 in accordance with Finance Ministry Instruction no. 139/2011
regarding government preparedness for guarantee for the said IPP’s and PLN obligations to
the IPP’s to purchase electric energy in accordance with the PPA.
Within FTP 2, the IPP has more dominant role in developing more than half of the total FTP
2 capacity with responsibility for 5.023 MW, with a composition of 17.5% hydropower, 3%
from gas, 49% geothermal and 30.7% from coal.
Construction for the FTP 2 project has largely already begun with coal based generator
development at 4 (four) locations with total capacity of 154 MW, some of which is included
in the EPC contract. Financially, the FTP 2 is financed in two steps loans, the company
budget, bank loans and the capital market.
Electrical Power Provider
PT. PLN (Persero)
In the late 19th century, electricity development in Indonesia was intensified by a number of
Dutch companies operating sugar and tea factories that developed power plants for their own
needs. Between 1942 and 1945, there was a shift in management from Dutch companies to
Japanese after the Dutch surrendered to the Japanese troops at the beginning of World War II.
A shift occurred once more at the end of World War II in August 1945, when the Japanese
surrendered to the Allied Forces. The youths and electricity workers took advantage of this
shift and a delegation of Electricity and Gas laborers/Employees along with the leaders of the
KNL took the initiative to meet president Soekarno to request the handover of these

128
companies to the Government of the Republic of Indonesia. On 27 October 1945, president
Soekarno established the Electricity and Gas Bureau under the Department of Public Work
and Energy with a total power generation capacity of 157.5 MW.
On 1 January 1961, the Electricity and Gas Bureau was renamed BPU-PLN (Board of
General Administration of the State Electricity Company) working in the fields of electricity,
gas and coke. On 1 January 1965, BPU-PLN was disbanded and inaugurated as 2 (two) state-
owned enterprises, State. Electricity Company (PLN) to manage electrical power and State
Gas Company (PGN) to manage gas.
In 1972, in accordance with Government Regulation no.17, the status of the State-owned
Electricity Company (PLN) was defined as a General State-owned Electricity Company and
as Authorized Agency for Electrical Power Business (PKUK) assigned the duty of providing
electricity to meet public needs. In line with a Government policy to provide electricity
provision opportunities to the private sector, since 1994 until the present day the status of
PLN has been amended from a General Company to Corporation (Persero) and also as the
PKUK supplying electricity to meet public needs.
Furthermore, with the issuance of law number 30/2009, PLN is no longer an authorized
agency in the electrical power business (PKUK), but a State-owned Enterprise assigned the
duty of supplying electricity to meet public needs.
Field of Business PT. PLN
The Company’s fields of business cover various activities as referred to in Law No.30/2009,
as well as the Company’s Articles of Association, including:
1. Provision Of Electrical Power:
• Generation of electricity
• Supply of electricity
• Distribution of electricity
• Planning and constructing facilities to supply electrical power
• Development of electricity supply
• Sales of electric power

129
2. Electricity Support:
• Electricity consultation
• Construction and installation of electrical power equipment
• Maintenance of electrical power equipment
• Developing technology to support electricity supply
3. Other Activities:
• Managing utilization of natural resources and other energy sources in the
interests of electrical power
• Operating and dispatching services for generation, supply, distribution and
retail sales of electrical power.
• Industrial activity related to electrical power hardware and software and
other equipment related to electrical power
• Cooperation with other parties and institutions related to electrical power,
both domestically and abroad in the fields of development, operations,
telecommunications and other information related to electrical power
• Electricity services
• The company’s business activities are divided into a number of categories:
Planning
Covers planning development of electric power facilities (generation, transmission and
distribution) and supporting activities: budgeting, business development, organization
development and human resources. Planning activities related to network distribution and
electricity in rural areas will be implemented by the Head office, while lower levels of
planning will be carried out by district organization units or distributors.
Development
Covers construction of power generating facilities, transmission and substations, which are
under the organization construction unit of the main construction agency. Meanwhile,
construction of distribution networks is implemented by each district organization unit and
distribution units. Rural development of electricity projects funded from the State Budget is
the responsibility of the Government and run through the Directorate General for Electricity.
130
Corporate / Operational Activities
Activities related to the production of electricity are the responsibility of electrical power
generation units consisting of various kinds of power plants, Steam power plants (PLTU)
fired by coal, natural gas or oil (BBM); Hydroelectric power plants (PLTA) fired by water
powered turbines; Gas power plants (LTG-gas turbine) fired by natural gas or oil;
Geothermal power plants (PLTP) fired by steam within our planet; and Diesel power plants
(PLTD) fired by oil.
Further, the Company also purchases electrical power produced by private power plants
(IPP), which also use various kinds of power generation. Electrical power generated by
power plants is distributed to the main substation through a transmission network with
varying voltage levels: extra high voltage (500 kV), high voltage (150 and 70 kV) and
medium voltage (20 kV). The greater the voltage being transmitted along transmission lines
of the same measurement, the greater the voltage required. The voltage levels at substations
with capacities of 500 kV or 150 kV are reduced for distribution to customers.
PLN main customers are served by high voltage networks of 150 and 70 kV and medium
networks of 20 kV, while our customers with smaller electrical requirements are sourced
from substations distributing medium voltage of 20 kV; subsequently, voltage at the
distribution substation is reduced to the level of 380/220 volts for further distribution through
low voltage networks to home connections.
All the above services are conducted by PLN through its business units distributed across the
entire Indonesian archipelago. A list of all PLN business units is presented in following
Table.
Independent Power Producer
Before the year 1997, the company established sales agreements (PPA and ESC) for
preparation of large-scale private electricity supply (IPP). In 1999, the company carried out
renegotiations of the PPA and ESC through the Special PLN Working Contract Renegotiation
team under the government. The renegotiations included, among other aspects, rebalancing

131
the conditions of contracts, including price legitimacy and price disparities between the actual
sales price of electricity and the PLN sales price.
Within agreement with specific IPP’s, it had been agreed that for the length of the
arrangement, PLN had the option to buy the selling rights, ownership rights and interest in
specified contracts. The Table below shows IPPs that are already in operation and those that
are not operating.
Table 55: IPP’s Power Plants [65]
No. Company Project Fuel Capacity
(MW)
AF B)
(%) Period
1 PT Cikarang Listrindo Cikarang, West Java Gas 300 72 1998-
2018
2 PT Energy Sengkang Sengkang, South
Sulawesi Gas 255 85
1999-
2028
3 Chevron Geothermal Salak, Ltd Salak, West Java Geothermal 165 90 1997-
2027
4 PT Makassar Power Pare-Pare, South
Sulawesi MFO 60 80
1998-
2013
5 PT Paiton Energy Paiton I, East Java Coal 1,230 85 2000-
2040
6 PT Jawa Power Paiton II, East Java Coal 1,220 83 2000-
2030
7 Chevron Geothermal Indonesia,
Ltd Drajat, West Java Geothermal 180 95
2000-
2030
8
Star Energy Geothermal
(Wayang Windu) Ltd.
(d/h/formerly Magma
Nusantara Limited)
Wayang Windu, West
Java Geothermal 220 90
2000-
2042
9 PT Geo Dipa Energi Dieng, Central Java Geothermal 60 85 2002-
2044
10 PT Asrigita Prasarana Palembang, South
Sumatera Gas 150 85
2004-
2024
11 PT Sumber Segara Primadaya Cilacap, Central Java Coal 562 80 2007-
2037

132
12 PT Dalle Energy Batam Panaran, Batam Island Gas 55 80 2005-
2016
13 PT Mitra Energi Batam Panaran, Batam Island Gas 55 84 2005-
2016
14 PT Indo Matra Power Kawasan Industri
Kabil, Batam Island Gas 17 90
2005-
2017
15 PT Jembo Energindo Panaran, Batam Island Gas 24 65 2008-
2011
16 PT Metaepsi Pejebe Power
Generation
Gunung Megang,
South Sumatera Gas 80 80
2005-
2025
17 PT Pusaka Jaya Palu Power Palu, Central Sulawesi Coal 27 80 2007-
2032
18 PT Pertamina Geothermal
Energi Kamojang, West Java Geothermal 60 90
2008-
2038
19 PT Cahaya Fajar Kaltim Embalut, East
Kalimantan Coal 45 72
2008-
2038
20 PT Dizamatra Powerindo Sebayak, North
Sumatera Geothermal 11 90
2008-
2038
21 PT Bajradaya Sentranusa Asahan, North
Sumatera Hidro 180 90
2010-
2010
22 PT Cipta Daya Nusantara Mobuya, North
Sumatera Hidro 3 80
2007-
2027
23 Perum Jasa Tirta Purwakarta, West Java Hidro 150 - 2012
24 Aggreko International Project,
Ltd Batam Island Gas 30 80
2008-
2011
25 PT Fajar Futura Energy Luwu Luwu, South Sulawesi Hidro 2 - 2010-
2035
26 PT Sulawesi Mini Hydro Power Sinjai, South Sulawesi Hidro 10 - 2011-
2036
27 PT Guo Hua Energi Musi
Makmur
Muara Enim, South
Sumatera Coal 227 80
2011-
2041
28 PT Eksploitasi Energi Indonesia Pangkalan Bun,
Central Kalimantan Coal 11 80
2011-
2036
Total
5,389

133
Table 56: IPP’s Power Plants Will be Operated [64]
No. Company Project Fuel Capacity
(MW) AF B) (%) Period Status
1 PT Paiton Energy Paiton Expansion, East Java Coal 815 80 2012-
2042 d)
2 PT Cirebon Electric
Power Cirebon, West Java Coal 660 80
d)
3 PT General Energy Bali Celukan Bawang, Bali Coal 380 85
d)
4 Sarulla Operations Ltd Sarulla, North Sumatera Geothermal 330 90
e)
5 PT Ranyza Energi Kuala Tanjung, North
Sumatera Coal 225 94
e)
6 PT Priamanaya Power
Energi Baturaja, South Sumatera Coal 225 80
e)
7 PT Bukit Pembangkit
Innovative Banjarsari, South Sumatera Coal 220 80
d)
8 PT Bosowa Energy Jeneponto, South Sulawesi Coal 200 80
d)
9 PT Poso Energy Poso, Central Sulawesi Hidro 195 846GWh/th
d)
10 PT Geo Dipa Energi Patuha, West Java Geothermal 180 90
e)
11 Bali Energi Ltd Bedugul, Bali Geothermal 175 95
e)
12 PT TJK Power Batam Island Coal 110 85
e)
13 PT Geo Dipa Energi Dieng, Central Java Geothermal 60 85
e)
14 PT Equator Manunggal
Power Pontianak, West Kalimantan Geothermal 54 85
d)
15 PT Indo Ridatama Samboja, East Kalimantan Coal 55 80
e)
16 Others Coal
Total
4,110
a) The agreements are effective from the date of signing and buy and sell of electricity is valid between 19 to
30 years starting from the commercial operation date.
b) AF = power supply factor which should be absorbed by the Company.
c) Represent contracts with 27 Ipps, consisting of 20 Ipps under construction and 7 Ipps in financing stage,
which are located in several areas of Indonesia and are generated by coal, geothermal and mini hydro each
with power plant’s capacity of less than 50 MW.
d) Under-construction.
e) Financing stage.
The price of gas, MFO and coal generated electric power per kWh was determined based
upon specific formulas considering agreements on, among other things, the cost of capital,

134
payment of operational and maintenance expenses, fuel expenses and payment of variable
operational and maintenance expenses. For power generation using geothermal resources, the
price of electricity was determined by a specific formula as formalized in the Energy Charge
and Capacity Charge agreement, among other things.
Business Development for Renewable Energy (Case: Geothermal)
The private sector can play an important role in developing the energy, especially at a time
when the global economy is increasingly unclear, leading to reluctance from parties to invest.
One company that has set its commitment is PT Pertamina Geothermal Energy (PGE).
PGE will focus on their own to make electricity from geothermal energy began in 2012. The
goal is to augment electricity supply in Indonesia with minimal pollution. Until the year
2011, PGE has been explored as much as 1,560 MW of geothermal energy.
According to the Director of PGE it still continues to do the development of a number of
plants. Among plants Hulu Lais 2 x 55 megawatts, Kotamobagu 2 x 20 megawatts and
Karaha is expected to generate approximately 60 megawatts of electricity.
PGE plans to invest more than $ 2 billion to add to the development of geothermal capacity
1,050 MW in the period 2011-2015. In the development of geothermal energy using PGE has
three business models.
First, the company produces steam which is then sold to PLN to be converted into electrical
energy. Second, PGE also produces electricity and steam at the same time supply to PLN
through a transmission that is in the area of operations and Sibayak Kamojang each with a
capacity of 60 MW and 2 MW. The third business model is collaboration with independent
power producers (IPP) with the Joint Operation Agreement (JOA) system, which was
implemented in operational areas Salak, Darajat, Wayang Windu, Sarulla and Bedugul (Bali).
The government is targeting the development of geothermal energy could reach 12,300 MW
by 2025. Indonesia is expected to utilize geothermal energy to become the largest in the
world.

135
In 2014, the development is expected to already be approaching 3500 MW, which will
operate its own PGE of 3,000 MW. Indonesia itself has touted prospect geothermal generated
from ring volcano in Sumatra, Java, Bali, Nusa Tenggara and Sulawesi until potentially
250,150 volcanoes have been identified.
Other companies such as PT Wijaya Karya (Persero) Tbk continue to strengthen its
investment in the field of energy and electricity. Wika plans in 2012 to invest for a power
plant Siak 28 MW with a contract value of Rp 350 billion and investment cooperation micro-
hydro power plant (MHP) 13 MW West Java Rp 300 billion.
In February 2011, Wika has completed the first investment project in the field of energy,
namely diesel Pesanggaran Bali 3x18 MW system using Build-Operate-Transfer (BOT)
system. Wika also was carrying 3 investment projects generating 25 MW namely Ambon
diesel, diesel Forms 60 MW and 20 MW power plant Rengat. Target total sales per year from
2012 to 2019 from four investment projects is Rp 469.99 billion with a total profit of Rp
46.99 billion per year.
Other companies such as Zug Industry Indonesia instead create a new plant as an extension of
a previous building. The company is engaged in the business of design engineers and power
system plan. The electricity company also continues to develop many innovations for
electricity in the country.
But admittedly the development of electricity in the country is still constrained by
infrastructure problems. National Development Planning Agency (Bappenas) assess the
problem of electricity infrastructure in the country is still a barrier to the growth rate of the
overall electricity investment. The provision of electricity infrastructure is not optimal due to
the lack of funding is judged.
Previous surveys by the World Bank doing business in 2012 downgraded the climate of doing
business (investment) in Indonesia from position 126 to 129 due to the lack of electricity
infrastructure.
136
But of course there remains optimism. The Government through the PLN continues to meet
the needs of electricity. PLN targets the number of customers using pre-paid electricity to
more than 5 million customers in 2012, up 6% from the current postpaid subscribers has
reached 3.5 million subscribers. In addition, the government encourages the development of
independent power plants (private) or IPP in order to supply more electricity to PLN. Good
cooperation between the government and companies engaged in the field of electricity and
energy will certainly make optimism the development of electricity during 2012.
All projects include RE/SET project or service will follow the applicable procedures, need
approvals required from concerned authorities and there is no ease of getting such approvals.
In addition to the lack of clarity Bantar Gebang landfill project, also occurs misperceptions
among the public Bantar Gebang and Bekasi City Government regarding the compensation
fund. For Bantar Gebang’s community, the compensation funds should be distributed to those
affected by the presence of TPA Bantar Gebang. However, Bekasi municipal government, the
compensation fund should be entered into the budget first and then channeled into projects
that are according to the study. Damage to the environment, facilities and infrastructure that
may be caused by the presence of the project needs to be a concern for the projecy
management and the government, which appears to reduce the cost of the socio-economic
impact, both for municipal solid waste power generation projects and geothermal power.

137
E. Social-Economic Factors
Social Factor
Like other Asian countries, traditionally Indonesian rural communities get used to utilize
renewable energy technology to fulfill their energy needs especially for agricultural
production processes. A traditional hydropower rice milling and a simple solar power rice
dryer are examples of the technologies. Besides that, since early 70s, biogas from animal
manure has been utilized by rural communities for household cooking. Socially, a simple
wind power propeller to drive “a bird strike” at rice field is another example.
Unfortunately, these are now becoming obsolete, and many are switching to the use of fossil
fuels to drive a variety of motors and machines.
The government efforts to promote RE
In order to promote utilization of renewable energy resources the government, through
MEMR, have introduced and implemented the following measures:
a) Facilitate and give incentives for industry which use biodiesel.
b) Field Advisor and Award Pioneer.
In 2010, Ministry of Mineral and Energy Resources launched a programme to train
field advisors for energy related matters (Petugas Penyuluh Lapangan, PPL, Energi)
to support and help communities in order to utilize energy resources efficiently. In
addition, the ministry has also launched a programme to give awards and grant for
people who showed pioneering activities in energy. The idea is to drive and support
urban communities to utilize energy resource efficiently and drive rural communities
to utilize locally available renewable energy resources to fulfil their energy needs and
to utilize resources efficiently. (Source: www.esdm.go.id, Arsip Berita/Pemerintah
Luncurkan Program PPL Energi, Agustus 2010). Example of the activities are to train
or advise on how to use 3 kg LPG system during the conversion of kerosene to LPG
for household cooking. Another example is a Renewable Energy Initiator Program
(Program Kepioneeran Bidang Energi), which provides rewards and prizes for people
who showed pioneering activities in energy saving and utilizing renewable energy
technology related to micro hydro, biogas, biomass, and efficiently used energy

138
resources. The Program is conducted jointly with religious communities and schools.
The training for the advisor is conducted by MEMR’s training centres.
c) Local governments through Province Education Offices (Dinas Pendidikan Propinsi)
provide students (preliminary and junior high school, at certain provinces or regions)
with knowledge on solar energy, by building demo facilities, Smart Education Park
(Taman Pintar) at recreation and at tourism objects at certain cities (in Jakarta,
Yogyakarta, Surabaya, Makasar cities) to show RET to student.
d) Almost at all the governmental R&D Institution and many public and private
universities promote renewable energy technology. Several universities, such as
University of Muhammadiah Yogyakarta (UMY) and Darma Persada University,
have special curricula for renewable energy development, and renewable energy
technology. UMY for example just received Indonesia Green Award 2014 for its
achievement in renewable energy conservation education programme (Source:
www.kompas.com, 22 April 2014). Darma Persada University has Master Programme
for Renewable Energy (www.unsada.ac.id/?page_id=3663). Bakrie University,
Politeknik Jember, Surabaya University, Jenderal Sudirman University are several
university which has curricula concerning renewable energy in their education
programme. These education programmes indicate that universities in Indonesia are
aware the important of development renewable energy for future energy mix in this
country.
e) ESDM give award for energy efficient for commercial buildings.
National and Societies Openness to Technology Innovations
Technology innovations, including renewable technology innovations, are the concerns of the
government and society. To enhance local technology innovations, the ministry of science
and technology built Business Innovation Centre (BIC) to drive innovation, including
renewable energy. The centre is designed to drive, collect information on technology
innovations resulted by public and private universities, research institution, and promote them
to community especially to related industries.
a) Implement code of conduct for research scientists
b) Certain Media (TV and Newspaper) offers innovation award related to Green Tech.
c) National championship on Energy Saving.

139
Example of Community involvement in developing RE
Involvement and enthusiasm of Indonesian communities in developing and promoting
renewable energy could be seen throughout a number of societies and their activities in RET.
In this report only several examples of societies and communities activities are reviewed as
follows.
a) Indonesia Renewable Energy Society (Masyarakat Energy Terbarukan Indonesia,
METI) is a society of scholars who are concerned with RE development. The member
consists of industries, research scientists, lecturers, businessmen and women, and
government official. The society is media for people for communication, consultancy,
or develop cooperation among members. Regularly, the society conducts national or
international activities such as seminar, workshop, focus group discussion related to
renewable energy (www.meti.or.id)
b) APEBTI (Asosiasi Perusahaan Penunjang Energi Baru Terbarukan Indonesia) The
Association Of Indonesian Renewable Energy Supporting Companies (AIRESCO)"
(www.apebti.com). APEBTI’s members are company which deals with new and
renewable energy activities. Their objectives are to support and enhance Indonesian
business and economy in the areas of new and renewable energies. The association is
a media for members to exchange information, discuss their activities and challenges,
to give training for members, etc. Numerous activities of APEBTI may be learned
from their website.
c) Association of Indonesian Bioethanol Producers (Asosiasi Pengusaha Bioethanol
Indonesia, APBI). The association was founded on November 2008 by members. The
association’s member is restricted.
d) Association of Indonesian Biofuels Producers (Asosiasi Produsen Biofuels Indonesia
(APROBI) is an association of biodiesel oil and others biofuels.
e) Indonesian NGO “Yayasan Rumah Energi” (Energy House Foundation) collaborated
with HIVOS, an NGO from the Netherlands, support the utilization of biogas in rural
areas (www.biru.or.id). Their activities has supported construction of more than
11,000 biogas digester system for farmers in nine provinces and providing access to
biogas for more than 17,700 people at rural areas. About 550 biogas digesters have
been built in West Java provinces only (source: bisnis-jabar.com). Their support is

140
especially for small scale biogas digester construction, at size of the biogas digesters
between 4 m3 (for one house) and 12 m3 (for three houses).
f) Indonesia Wind Power Society (IWES), (Masyarakat Energi Angin Indonesia, MEAI)
is a society of experts, scientists, industry and business people who has interest in
conducting research and developing wind power technology and businesses in
Indonesia. The mission are to develop and utilize wind power, to support the
government programme on providing electricity for rural areas, especially for remote
areas by utility wind power, and to enhance human resources capability in wind
power technology.
g) Indonesia Geothermal Association, INAGA (Asosiasi Panasbumi Indonesia, API)
(wwww.inaga.org) is a society of industries expert, scientist, business people, and
other community members who has interest to develop and enhance utilization of
geothermal in Indonesia. The association was founded in 1991. Their mission is to
proactively position geothermal energy at competitive edge because of its renewable,
environmentally sound, economically attractive options to meet increasing demand of
Indonesia’s energy market.
h) GreenRadio.fm is a radio broadcaster which has regular programme to promote green
and eco technology for people with a tag “eco-lifestyle”.
Example of women involvement in RE
Example of women involvement in renewable energy at rural areas has been studied by
AbuBakar Lubis (Lubis, A, 2004). He studied and showed how role of women at rural
households especially at villages which have operated solar PV for lighting. Operation and
maintenance of the system is mostly conducted by women because of their husbands are out
for works. The study showed number of positive impacts of the renewable energy to
economy and social issues of household such as a better sanitation and better standard of
living, give a chance for women to understand and operate the system, provide job
opportunities, etc. The study also showed the negative impacts, such as creating ‘tension’
between husband and wife and a pressure on schools and teachers to provide more and better
infrastructure for student.
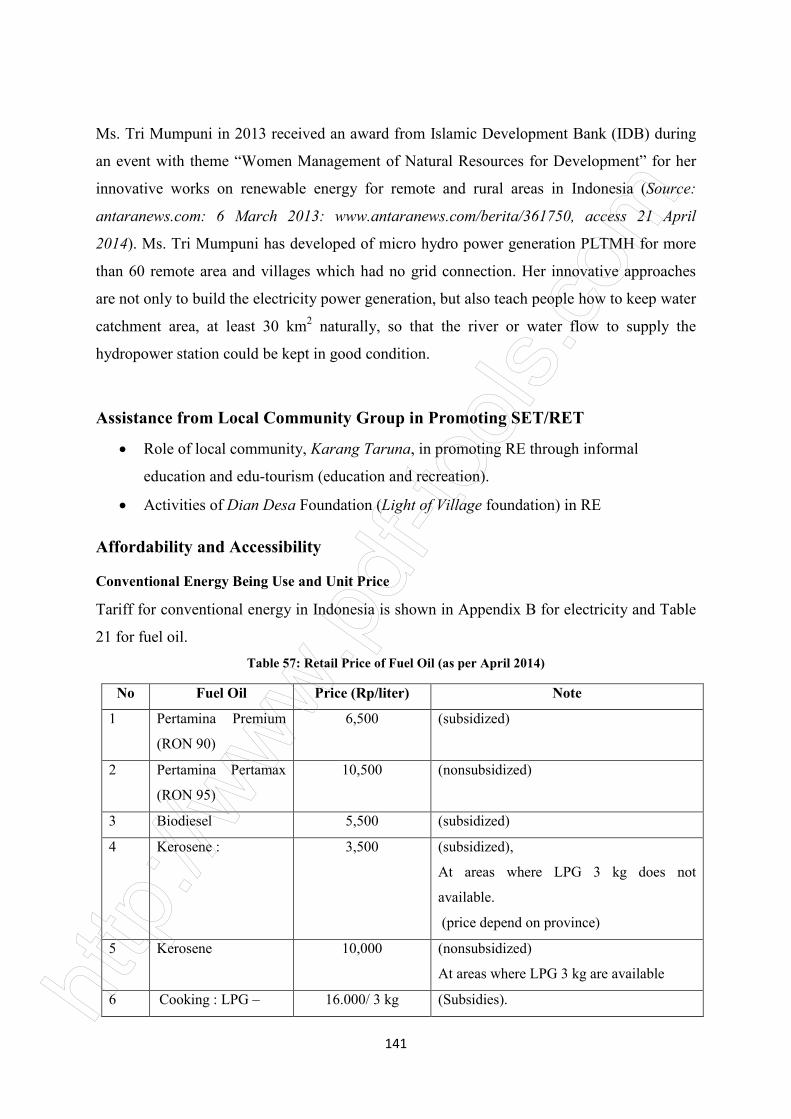
141
Ms. Tri Mumpuni in 2013 received an award from Islamic Development Bank (IDB) during
an event with theme “Women Management of Natural Resources for Development” for her
innovative works on renewable energy for remote and rural areas in Indonesia (Source:
antaranews.com: 6 March 2013: www.antaranews.com/berita/361750, access 21 April
2014). Ms. Tri Mumpuni has developed of micro hydro power generation PLTMH for more
than 60 remote area and villages which had no grid connection. Her innovative approaches
are not only to build the electricity power generation, but also teach people how to keep water
catchment area, at least 30 km2 naturally, so that the river or water flow to supply the
hydropower station could be kept in good condition.
Assistance from Local Community Group in Promoting SET/RET
Role of local community, Karang Taruna, in promoting RE through informal
education and edu-tourism (education and recreation).
Activities of Dian Desa Foundation (Light of Village foundation) in RE
Affordability and Accessibility
Conventional Energy Being Use and Unit Price
Tariff for conventional energy in Indonesia is shown in Appendix B for electricity and Table
21 for fuel oil.
Table 57: Retail Price of Fuel Oil (as per April 2014)
No Fuel Oil Price (Rp/liter) Note
1 Pertamina Premium
(RON 90)
6,500 (subsidized)
2 Pertamina Pertamax
(RON 95)
10,500 (nonsubsidized)
3 Biodiesel 5,500 (subsidized)
4 Kerosene :
3,500 (subsidized),
At areas where LPG 3 kg does not
available.
(price depend on province)
5 Kerosene 10,000 (nonsubsidized)
At areas where LPG 3 kg are available
6 Cooking : LPG – 16.000/ 3 kg (Subsidies).

142
package
7 Cooking LPG 90.000/12 kg
package.
(Nonsubsidized)
Average Monthly Spending on Use of Conventional Energy
During this report preparation, there is no study or survey which showed monthly spending of
a household in Indonesia. BPS as the agency of statistic published that there was a trend of
reduction of family spending for food from 51.4% of family income in 2010 to 47.7% in Sep
2012. The rest was spending for nonfood, included for electricity, transportation, etc. (BPS
2013, Statistik Pendapatan dan Pengeluaran, www.bps.go.id). Merdeka.com a newspaper of
Indonesia, on Jan 2, 2014 published that in Jakarta average living cost of low income
households, with 4 people in a family in 2012, was Rp 7.500.700 a month, 35% of the
spending was for food. Another source mentioned that average low- and middle-income
households spend Rp 100,000 (about US$10) for cooking gas LPG for a month. It should be
noted here that LPG gas for low income family is subsidized by the government.
The Government Subsidy for Conventional Fuels
As mentioned earlier that the government of Indonesia provides several type of subsidy for
energy. The allocated government budget for total energy subsidy for 2014 is Rp 282 trillion
or about US$24.50, with exchange rate per April 2014. The subsidy is for diesel fuel and
gasoline (i.e. Premium Pertamina, RON 90) for transportation and for LPG (3 kg package)
designed for low income households and micro or home industries. The subsidy is also for
electricity for small houses/ low income families. The amount of subsidy per type of fuel is
shown in Table 20.
Table 58: The subsidy of non-conventional energy per type of fuel
No Type of Non-
Conventional
Energy
Retail Price
(Rp/unit)
Subsidized
(Rp/unit)
Note
1 Gasoline
:Pertamina
Premium (RON
90)
6,500 / liter 2,300/liter 2013
(Source :
www.pertamina.com/news)

143
2 LPG :
package 3 kg.
16,000/3 kg 5,500/kg Data: Jan 2014.
Source :
www.pertamina.com/news-
room/siaran-pers/sesuaikan-
harga- elpiji
3 Bio Solar
(biodiesel fuel oil)
5,500/litre
(current retail
price )
3,900/litre The amount of subsidy based on
exchange value in 2012 (US $
1/Rp 9000).
(Source :
www.finance.detik.com, Date :
Data on March 29/2012)
4 Electricity a) For consumer
with 450 VA and
900 VA
396 /kWh
(average subsidy).
Source: (“Tanya Jawab seputar
pengurangan subsidy : Kenaikan
tariff listrik 2013”,
www.pln.go.id/
Financing Scheme for purchasing RE
• In 2004-2006, in collaboration with Yayasan Dian Desa Kupedes BRI through the
programme, helping the villagers build solar energy.
• Kupedes, micro loans (up to US$25 M) also helps in the renewable energy business.
KUPEDES initially be general rural credit (general credit / loan for rural areas / villages),
but lately Kupedes name used for a variety of micro-credit BRI.
• A programme from BRI Bank to support solar energy (BRI - Kupedes - PLTS).

144
F. South-South Co-operation
In order to enhance development and utilization of new and renewable energy resources, the
government of Indonesia signed agreements with several countries. The following is a short
list of cooperation in the field.
a) Cooperation among Indonesia-India- South Africa on development of renewable
energy.
b) Cooperation between Indonesia and South Korea to develop and enhance utilization of
renewable energy in Indonesia as decided by the President of two countries on October
2013 (Source: Energy Today)
c) Cooperation between Indonesia and Philippine signed in June 2013 concerning
development renewable energy in two countries.
d) Cooperation between Indonesia and Hungary, June 2011, concerning renewable energy.
e) Cooperation between Indonesia and New Zealand, Dec 2011, to develop wind energy
and micro hydro power to be implemented at east part Indonesia.
f) Indonesia Thailand Energy Forum (ITEF). During their meeting in Bali, 2013, and at
meeting in Feb 2014, the forum agreed to develop renewable energy, especially bio-
fuels.
g) Cooperation between Indonesia and Finland in the frame of EEP – Energy and
Environment Program, April 2010. The cooperation was agreed to support capacity
building, especially for Central Kalimantan and Riau Provinces.
h) ASEAN – MERCOSUR (Mercado Comun Del Sur/ Common Market of the South), in
their meeting in Bali, Nov 2008, agreed to cooperate in field of renewable energy
development to reduce on fossil oil dependency.
Cooperation among Indonesia-India-South Africa on Development of Renewable
Energy
Background
Both Indonesia and South Africa are at a stage where national policies on climate change
mitigation have been formulated, and there is scope for cities to begin taking concrete action.
ICLEI, an international association of local governments committed to sustainable
development, has developed a local renewable (LR) initiative which steers city governments

145
through the integration of increased energy efficiency (EE) and RE generation into all city
activities.
Purpose of Cooperation
To develop two model local renewables initiatives, one in Ekurhuleni Municipality in South
Africa, and the other in Yogyakarta city in Indonesia while providing both with guidance
from a city in India, and to facilitate the adoption of similar initiatives in other South African
and Indonesian cities
Main Activities
- Make the final selection of the project cities, currently slated to be Yogyakarta and
Ekurhuleni, and designate one Indian city as a resource city to provide process
guidance
- Assess each project city's carbon emissions inventory to identify priority interventions
- Develop action plan for each city adopting EE and RE initiatives in line with national
policy, involving a multi-tier stakeholder committee.
- Identify financial sources for implementation, and relevant demonstration projects
- Implement a pilot project in each city and showcase the process and results to
observer cities, disseminate via country workshops
- Develop a local RE resource centre for each city showcasing local initiatives and
products
- Develop a country-specific Solar Cities Guidebook to actively promote renewable
energy
Expected Impact
- Starting impetus provided for major cities in South Africa and Indonesia to work
towards national and international EE and emission reduction goals
- Long term action plans in place following an analysis of reduced energy use and
emissions
- Potentials identified for RE and EE to improve delivery of municipal services
- Shortened learning curve for cities through the South-South exchange of experiences

146
- Communities catalyzed into adopting RE and EE initiatives at household level thanks
to resource centers showcasing case studies
- Potential for project cities to transform into “Solar Cities” as was the case in India
- Strengthened ICLEI regional capacity to roll out this programme on a wider scale
- Related News
- Coimbatore hosts launch workshop for ICLEI Local Renewables project
Project Information
- Programmed sector: RE & EE (Policy& Regulation)
- Stage of project: Ongoing
- Location: IN/India, ZA/South Africa, ID/Indonesia
- Duration: 2011 - 2013
- Budget: € 150,326 including co-funding from Co- funding from Ekurhuleni and
Yogyakarta project cities
Indonesia-Republic of Korea Cooperation
Both countries agreed to develop renewable energy. Several activities have been conducted.
One of the implementing projects is development of pilot-scale system for production of
bioethanol from palm oil industry solid waste (a lignocellulose material). The facilities were
based on Korean technology, while the process condition based on Indonesian research
results. The Republic of Korea (through KOICA) funded the project for construction the pilot
scale facilities, laboratory analytical equipment and for training, while Indonesia funded for
operational of the facilities.
Indonesia-Thailand Energy Forum ITEF
Indonesia-Thailand Energy Forum (ITEF) was result from a meeting between the President of
Indonesia and Prime Minister of Thailand on October 2006. In December 2007 in Bangkok,
the two ministers for energy affair from both countries signed an agreement to form the
Energy Forum. On the first ITEF meeting July 11-12 2008 in Bangkok, both countries agreed
to collaborate in the field of energy sector, for R&D, electricity, Petroleum and Gas, and coal.

147
In the 4th meeting in 2013 in Bali, the collaboration has been expanded to cover new and
renewable energy such as biofuels, CBM. (Source: http://www.esdm.go.id/agenda/)
Summary
This report describes the relevant information to sustainable energy technology innovation
eco-system in Indonesia. This includes current national sustainable energy policies and
programmes, including support mechanisms (regulatory, institutional, technical, financial,
etc.) that compliments and supplements promotion of affordable and accessible sustainable
energy options. It also identifies South-South cooperation opportunities to import/adopt
sustainable energy technologies in such areas as solar energy and geothermal, etc.
In terms of regulatory supporting mechanism, Indonesia has launched a number of policies
and regulations in attempts to promote the use of renewable energy so as to accelerate the
fulfillment of energy mix target. The policies and regulation is also aimed at developing and
strengthening technology innovation ecosystem on sustainable energy in Indonesia. A more
consistent enforcement of those policies and regulation will have a positive impact to
concretely promote a wider energy options for various stakeholders in Indonesia. It is also
necessary for Indonesia to create policy and regulation that encouraging the strengthened
sustainable energy technology innovation ecosystem amongst the South-South Cooperation
and also in the Asia and the Pacific region.
Indonesia has also participated in South-South Cooperation on sustainable energy such as
with India, South Africa, and other countries. Given the energy potential of geothermal,
biomass, hydro power in Indonesia, it is necessary Indonesia to strengthen its innovation
technological capacity in these important areas and develop collaboration with other
countries in the region that have same energy potential to participate.
Challenges in Indonesia
The biggest challenge to promote utilization of RE and to drive ‘energy saving concern’ are:
a) very limited support for those who need fund /investment for a change in their energy
system to be a more efficient one, because they need to change or upgrade (apparatus,
equipment, etc.), and b) people of Indonesia get use on low cost of energy due to the huge

148
subsidy from government. For 2014 the government allocated Rp 210 trillion and Rp 71.4
Trillion for fuel and electricity subsidy respectively.
Suggestion
Due to environmental consequences of burning fossil fuels like greenhouse gas emission and
the fact that fossil fuel like greenhouse gas emission will be depleted one day, the
dependency of Indonesian energy scenario to fossil fuels will have an adverse effect on the
economy in Indonesia. Therefore, action toward using renewable energy source should be put
as priority by the government. Some of successful implementation of renewable energy
programmes from developed and developing countries that can be adopted by Indonesian
government.
Urgent Problems
Pressing issues currently faced by PLN are a) to meet the need of areas that lack of electricity
and b) replace the fossil oil-fired power plant with other type fuel and c) provide electricity
for areas that do not have power, including border areas and remote areas, both in the short
term and long term.
In several major islands, such as Sumatra, Kalimantan, etc. experiencing power shortages.
The fulfillment of the electricity demand is a major challenge, and utilization of renewable
energy to fulfill local need should be considered.

149
Case Study
Development of Local Technology for Geothermal Electric Power Generation to
Increase Electricity Power Generation Utilizing Renewable Energy in Indonesia
Introduction
In order to accelerate economic development of Indonesia, the government launched a
development programme called MP3EI, Master Plan Percepatan Pembangunan Ekonomi
Indonesia (2011-2025),the Master Plan for Acceleration and Expansion of Indonesia
Economic Development. The document mentioned that the government plan to build 10,000
MW (at each step) power plan infrastructure and facilities in several potential provinces of
Indonesia to support industries development in those selected provinces3.
Development geothermal electricity power generation plant is a priority in the programme, as
the huge sources of geothermal in Indonesia (See Figure 14 and 15 on Page 31). As a
consequence of Indonesia’s location in The Ring of Fire and its volcanic geology, the country
is blessed with untapped potential of geothermal energy. It is estimated that the country has
29,000 MW of geothermal potential, corresponding to 40% of world’s potential geothermal
resource (Table 59). So far, it is only less than 10% of the potential that has been utilized
(Table 60).
Table 59: The potency of geothermal in Indonesia (Anang, H , PLN 2014)
RESOURCE (MW) % RESERVE (MW) %
Speculative Hypothetical
45.36%
Possible Probable Proven
54.64% 8.780 4.391 12.756 823 2.288
13.171 15.867
29.038
3Nenny Saptadji (2008): Strategi dan Langkah-langkah dibidang: ENERGI PANAS BUMIJune, ITB.

150
Table 60: Geothermal power plant capacity [37]
Working Area Location Turbine capacity
1 × 30 MWe
Operator Total
capacity
PLTP Kamojang West Java 2 × 55 MWe 1 × 60
MWe
PLN 200 MW
PLTP Lahendong
(Pertamina) North Sulawesi
2 × 20 MWe 1 × 20
MWe PLN 60 MW
PLTP Sibayak
(Pertamina) North Sumatra 1 × 12 MWe Pertamina 12 MW
PLTP Salak (Chevron
GS) West Java
3 × 60 MWe 3 × 65
MWe
PLN CGS 375 MW
1 × 55 MWe PLN
PLTP Darajat
(Chevron GI) West Java 1 × 90 MWe CGI 255 MW
1 × 110 MWe CGI
PLTP Wayang Windu West Java 1 × 110MWe 1 × 117
MWe SE 227 MW
PLTP Dieng (Geo
Dipa Energi)
Central Java 1 × 60 MWe GDE 60 MW
Total 1,189 W
I. Programme: Target and Road Map of Geothermal Power Plant Development
Table 61: The government’s target in the “Energy Mix” is to realize 9500 MWe operated by year 2025
Year Total Capacity (MWe) Increasing Capacity
(MWe)
2008 2000 1193
2012 3442 1442
2016 4600 1158
2020 6000 1400
2025 9500 3500

151
Government Strategy
1. Increase gradually the existing capacity of geothermal power plants;
2. Develop Mining Working Areas (WKP) for geothermal drilling in proven areas;
3. Conduct exploration drilling at WKPs that have been explored in detail and then
develop these fields for power generation;
4. Conduct WKP geothermal energy exploration where rights management has been
handed over to Pertamina and PLN; and
5. Auction new WKP for geothermal energy exploration.
Government Efforts
1. Increase gradually the existing capacity of geothermal power plants at the moment
(existing) in accordance with the potential reserves, which cover Kamojang, Darajat,
Awibengkok - Mount Salak, Wayang Windu, Lahendong, Dieng and Sibayak.
2. Developing Mining Working Area (WKP) Geothermal who has proven through
drilling, the field Bedugul (Bali), Patuha (West Java), Sarula (North Sumatra), Cibuni
(West Java), Ulumbu (East Nusa Tenggara) and Karaha Bodas (West Java).
3. Conducting exploration drilling at the WKP few have been explored in detail and then
develop these fields for power generation. These fields include Moss Hall (South
Sumatra), field Ulubelu (Lampung), and the PT PLN, i.e. Mataloko Field (Ambon).
4. Doing WKP Geothermal Exploration in the rights management has been handed over
to Pertamina and PLN, ie Tulehu field (Ambon), Kotamubagu (North Sulawesi), I-
Argopuro (East Java), Full River (Jambi) and Hulu Lais (Bengkulu).
5. Auction Geothermal new WKP with priority WKP ex Pertamina.
Development Problems
Dieng and Patuha : There is still no certainty about the settlement of related issues:
o Elimination / release inbreng assets Pertamina and PT PLN.
o Status former HCE assets / PPL (OPIC).
At the time of high oil prices, Rig (drilling tower) is difficult to obtain fierce
competition and price plans delayed drilling rig rental services increased.

152
Price agreement between PLN and business communities is difficult to achieve /
require considerable time (Kompas News: sdh no agreement PLN and Pertamina
Geothermal power price related).
There are provisions in the Forestry Act prohibits any activity in the nature reserve
forests and national parks for non-forestry activities
Bedugul: Permits the use of forests for geothermal development and denial of
Balinese society (socio-cultural).
Geothermal areas are in remote locations, where infrastructure facilities are
generally less supportive (minimal).
Availability of experts in the field of geothermal energy to support geothermal
development is still very limited.
Efforts for Achieving Energy Targets Mix
Now the target geothermal has missed 50% of the Plan 2008.
STRATEGY
Geothermal Road Map should be 'revised'
Must be have a commitment from all parties, namely the Central and Local
Government, DESDM, Dept. of Finance, Dept. Forestry, DLPE, PT PLN, and
businesses to resolve problems in the fields of Dieng, Patuha, Bedugul,
Kamojang (Unit-5) and another field.
Formed "EXPERT TEAM" and assigned special responsibility in monitoring
the achievement of targets set in the "ENERGY MIX".
The government needs to dedicate Rig-rig (drilling tower) for drilling
geothermal wells, as is done in Iceland.
Intensify the development of small -scale geothermal power plants in remote
areas, such as NTT, Maluku and Sulawesi
REGULATORY ASPECTS
1. Provisions on forestry land use needs to be revisited by providing an
exception for geothermal development (not equated with open pit).
2. Policy Price: least cost concept is not adopted PLN applied to renewable
energy.

153
3. Government regulation governing geothermal direct use should be published
soon
EDUCATIONASPECTS
Accelerating the provision of skilled professionals in geothermal development in
Indonesia
TECHNICAL ASPECTS
1. Optimizing Geothermal Power Plant existing and to be built , with :
- Utilizing brine (water of separation in the separator) to generate electricity with a
flash binary cycle or cycle.
- Utilizing the condenser heat to generate electricity with binary cycle.
- Utilize excess fluid pressure before entering into the turbine.
2. Improvements in technology and methodologies in use today , with the goal of
reducing uncertainty in the assessment of resources (resource assessment) , improving
efficiency , reducing the risk of exploration and development as well as minimizing
the impact of development on the environment.
3. Assessment technical and economic feasibility of developing a geothermal field in
Java and Sumatra.
Intensify research to solve problems of silica, so that very high geothermal temperatures
(> 300oC) can be utilized.
Organizing theNon-
Academic TrainingProgram
On
AppliedAcademicMaster Program(S2)
"Geothermal Engineering" beganat the ITB

154
ASPECTS OF CAPACITY BUILDING
(Improve Ability of Nation)
- To date the use of goods, services, technology, and engineering and design
capabilities in the country is still very limited. As per the spirit of Law. 27/2003 on
Geothermal, Article 32 (h) the use of goods, services, technology, and engineering
and design capabilities in the country needs to be improved. Should begin upaya2
komponen2 equipment manufacture in the country (for example, to manufacture small
capacity turbines).
- Software development (software) for applications in the field of Geothermal continues
to be implemented.
- Update software for the analysis of technical feasibility and economics of geothermal
projects that have been developed ITB.
Efforts To Speed UpThe Geothermal Development In Indonesia
Development of Local Technology (BPPT-2014)
1. Until 2012, all power plants used foreign technology.
2. BPPT is appointed by the government to develop national technology, in cooperation
with local industries.
3. Improving and harmonizing regulations in geothermal business, including a revision
of the Geothermal Law to allow the geothermal development in conservation forest.
4. Pricing regulation with comprehensive treatment.
5. Fiscal incentives for geothermal development.
Local Content RegulationFor Geothermal Power Plant
Table 62: Industrial Minister Regulation No. 54/2012
CAPACITY
LOCAL CONTENT
EQUIPMENT* SERVICE** COMBINATION
5 MW 31,30% 89,18% 42,00%
> 5 MW - 10 MW 21,00% 82,30% 40,45%
>10 MW - 60 MW 15,70% 74,10% 33,24%
> 60 MW - 110 MW 16,30% 60,10% 29,21%
> 110 MW 16,00% 58,40% 28,95%

155
Notes: *) Equipment: Equipment consists of steam turbine, boiler, generator, electrical, instrument and control,
balance of plant and/or civil and steel structure.
**) Service: Consultancy service (feasibility study), integrated construction service (engineering,
procurement, and construction), inspection, test, certification and/or supporting services.
Development of Small-Scale Geothermal Power Plant
Noting that the technology of geothermal power plants all from abroad, BPPT as government
research institutions, along with some of the local industry, build local technology to design
and create a geothermal power plant. Currently the system is being test d (commissioning).
Goals:
To accelerate the development small scale geothermal power plants by domestic human
resources and national industries.
1. It is a national priority programme stated in the Presidential Regulation No.
05/2010 regarding the National Medium-Term Development Plan 2010 – 2014.
2. Output :
Condensing Turbine Technology of 3 MW GeoPP.
Ready for operation in Kamojang Geothermal Field
Binary Cycle Technology of 100 kW GeoPP.
Under construction in Wayang Windu Field

156
Figure 24: Local players are producing 3 MW geothermal equipment
Figure 25: Pilot plant for geothermal energy

157
Table 63: Local Industries which get involved in Geothermal Power Plan Development in Indonesia
No Component of System Industries/Institution Note
1 Engineering Design BPPT A government RD
Institution.
2 Production well, Hot Well Pump,
Reejection Well.
PT. PGE
3 Demister, Condensor, Jet Ejector, After
Condenser,
PT.BBI
4 Turbine PT.NTP
5 Generator PT.PINDAD A state owned
company.
6 Vacuum Pump, ACW Pump PT.TGE
7 Cooling Tower PT. Hamon
(Source: Unggul BPPT, 2014)
Future Challenges and Opportunity
1. The Geothermal Power Plant operates at its3MW scale, the challenge ahead is to build
GPP on a bigger scale with the technology of the country, so that the utilization of
geothermal energy as a source of electricity from renewable energy materials can be
optimized.
2. How this technology can be co-operated with many countries in Asia which have the
potential for geothermal energy.

158
REFERENCES [1]. Deputy Assistant Foreign policy, Kemensetneg, 2014, “Kajian Kebijakan : Mencermati
Perangkap Negara Berpendapatan Menengah dan Kesenjangan Kesejahteraan”,
Ministry of the State Secretariat, pp.3
[2]. BPS, Indonesia Statistics Agency, “Penduduk Indonesia”, 2011.
[3]. Tumiran, 2013, “Pemikiran berlandaskan Kerangka Pikir: Kebijakan Energi Nasional
Menuju tahun 2050”, Presentation on Congress National Energy, Gadjah Mada
University Yogyakarta, 16 Desember 2013.
[4]. ESDM (2013): “Handbooks of energy and economics statistic of Indonesia”, 2012,
MEMR.
[5]. Dr. Hasrul L.A., “New and renewable Energy Policies”, Director of Various New Energy
and Renewable Energy, ESDM, July 2012.
[6]. The Government Budget Planning for 2012, Ministry of Finance (APBN 2012), site:
www.kemenkeu.go.id.
[7]. The Government Budget Planning for 2013, Ministry of Finance (APBN 2013).
[8]. The Government Budget Planning for 2014, Ministry of Finance (APBN 2014).
[9].Anonymous, (2008), “Kebijakan & RPP Dibidang Energi Baru Terbarukan”, a
presentation at Workshop ‘The Role of PV in Providing Electricity in Indonesia’,
Jakarta, 15 July, Director REEC-MEMR.
[10].Yahmadi, Anang (2014), Renewable Energy Power Supply for Development, a
Presentation at Indonesia National Workshop on Accessible and Sustainable Energy,
Jakarta, 19-20 March 2014.
[11]. BIG, site: http://www.bakosurtanal.go.id/berita-surta/show/ig-yang-terintegrasi-untuk-
indonesia-yang-lebih-baik
[12]. List of Mountains in Indonesia, site: http://www.gunungsemeru.com/2013/04/daftar-
nama-gunung-di-indonesia-beserta-letaknya.html
[13]. List of Provincial, District Municipality in Indonesia, Mei 2013, site:
www.kppod.org/datapdf/.../daerah-indonesia-2013.
[14]. BKKBN (2014), “Buku Proyeksi Penduduk Indonesia 2010-2035”, site:
http://www.bkkbn.go.id/ViewSiaranPers.aspx?SiaranPersID=66.

159
[15]. BPS (2012), Indonesian Population by Provinces, “Penduduk Indonesia Menurut
Propinsi”, site: www.bps.go.id.
[16]. Kompas News, “The Ratio of Urban And Rural Residents”, 23 August 2012.
[17]. Anonymous, “Indonesian Population Ratio In 2030”, site:
http://www.yuswohady.com/2012/11/17/bonus-demografi/.
[18]. BPS, “The Poverty Line and Number of Poor People, Batas Garis Kemiskinan dan
Jumlah Penduduk Miskin”,Sep 2013.
[19]. BPS, “Kependudukan. (jumlah rumah tanggah tahun 2011, sekitar 60 juta)”, 2013.
[20]. Kemenpora, site: www.kemenpera.go.id.
[21]. BPS, “Social and Population Statistics”, 2013.
[22]. Ayuni, Maryam (2012), “Kebijakan Konservasi Energi”, a Presentation at ‘Workshop
Efisiensi Energi di Sektor Industri Kecil dan Menengah (IKM)’, 27 March 2012,
Directorat Energy Conservation, Directorate General of New Renewable Energy and
Energy Conservation, MEMR.
[23]. PLN Statistics 2011 – PT.PLN (Persero)
[24].Anonymous, “Handbook Of Energy & Economic Statistics Of Indonesia”, 2012.
[25].Tumiran (2013), “Road Map Menuju Kedaulatan Energi : Pemikiran berlandasarkan
Kerangka Pikir Kebijakan Eerergi Nasional Menuju tahun 2050”, a Presentation at
National Energy Congress, Gadjah Mada University, Yogyakarta.
[26]. Direct discussion between LIPI and several industries namely PTPN IV, and PTPN V
and PT. Sinar Mas.
[27]. A study visit by LIPI to Bantar Gebang.
[28]. Irawan Rahardjo dan Ira Fitriana, “Analisis Potensi Pembangkit Listrik Tenaga Surya
Di IndonesiadalamStrategi Penyediaan Listrik Nasional Dalam Rangka Mengantisipasi
Pemanfaatan PLTU Batubara Skala Kecil, PLTN, Dan Energi Terbarukan”,
site:http://www.oocities.org/markal_bppt/publish/pltkcl/plrahard.pdf, 4 April 2014.
[29]. Budi Prawara, Syahrul Aiman [Source: Ref 10 in a publication Budi Prawara-LIPI,
2013].
[30].The Globe Journal, 1 Jan 2014, site: http://theglobejournal.com/teknologi/kini-55-listrik-
sumba-dari-energi-terbarukan).
[31]. Azhari, Hasrul L., “New and Renewable Energy Policies’, Director Of Various New
Energy And Renewable Energy, ESDM, July 2012.

160
[32]. Source: ESDM
[33]. site: http://www.globalccsinstitute.com/publications/indonesia-regional-
overview/online/90071)
[34]. Source: Koran Sindo, 7 March 2014.
[35]. Site: www. kemenpera.go.id
[36]. Azhari, Hasrul L.,”Indonesia’s Feed-in Tariff for Renewable Energy”, Director of
Various New Energy and Renewable Energy ESDM.
[37]. M.H. Hasana, T.M.I. Mahlia, Hadi Nur; “A Review On Energy Scenario And
Sustainable Energy In Indonesia”; Renewable and Sustainable Energy Reviews 16
(2012) pp. 2316– 2328.
[38]. A study visit of LIPI to Bantar Gebang, 2013, UPT –BBPTTG –LIPI.
[39]. LIPI Report (Research Centre for Electrical Power and Mechatronics) About Biogas
[40]. LIPI Report (IPTEKDA Project About Biogas).
[41]. LIPI cooperation with the Dutch foundation.
[42]. LIPI Report (Research Centre for Chemistry) About Bioethanol.
[43]. Sukarna, Djadjang, “Energy Efficiency And Renewable Energy In Indonesia”,
[44]. Annual Report PLN 2011.
[45]. Anonymous, “Kebijakan Pemerintah Di Sektor Energi & Ketenagalistrikan”, 2013,
Directorate General of Electricity and Energy Utilization, MEMR.
[46]. site: http://www.energyefficiencyindonesia.info
[47]. Anonymous, “Indonesia Energy Outlook & Statistic 2006”, Depok, Indonesia: Energy
Reviewer, University of Indonesia.
[48]. Kadir, Abdul, IPM, “Beberapa Kecenderungan Perkembangan Teknologi Pembangkit
Listrik”, Chairman of the Technical High School Foundation PLN, Jakarta
[49]. Pekik A. Dahono, “Sumber Energi Alternatif (SEA),Laboratorium Penelitian Konversi
Energi Elektrik”, Electrical Engineering-ITB.
[50]. Wenas, Wilson Walery, “Teknologi Sel Surya : Perkembangan Dewasa Ini dan yang
Akan Datang”, Semiconductor Laboratory, Physics –ITB.
[51]. Priyambodo, Teguh, “Pembangkit Listrik Tenaga Surya: Memecah Kebuntuan
Kebutuhan Energi Nasional dan Dampak Pencemaran Lingkungan”, 2006, Jakarta
[52]. Dwiastuti, Inne, “Pengembangan Industri Energi Alternatif”, 2010, Indonesian Institute
of Sciences.

161
[53].Publication Research Centre for Electrical Power and Mechatronics -LIPI, IPTEKDA
Project
[54]. Annual Report 2011 - PT.PLN (Persero)
[55]. PLN Statistic 2011 – PT.PLN (Persero)
[56]. Report, “Statistic Book of Electricity No.25/2012, Directorate General of Electricity”,
Ministry of Energy and Mineral Resources (MoEMR)
[57]. Kapasitas PLN 2013 (PLN Capacity on 2013)
[58]. Adam, Rinaldi, et.al; “Handbook of Energy & Economic Statistics of Indonesia 2012”;
Centre for Data and Information on Energy and Mineral Resources - Ministry of Energy
and Mineral Resources.
[59]. Indonesia Energy Efficiency Report January 2011.
[60]. Aiman, Syahrul; Simamora, Manaek, “Renewable Energy Report Indonesia”, 2008,
Cooperation with APCTT-UNESCAP.
[61].Report: “Document Country Specific Information on Renewable Energy in Indonesia”,
Prepared By LIPI
[62]. Sukarna, Djadjang, “Energy Efficiency and Renewable Energy in Indonesia”, Secretary
of Directorate General of New Renewable Energy and Energy Conservation - Ministry
Of Energy and Mineral Resources, Republic Of Indonesia, 2012
[63]. RUPTLDocument, “Plan to Develop Public Electric Power (RUPTL 2012 – 2021)”,
approved by MEMR Act. No.3440/K/21/MEM/2012, PT.PLN (Persero)
[64]. RUPTLDocument, “The Electrification Development Program”, PT. PLN, 2010-2019
[65]. List of Partners, “Renewable Energy & Energy Efficiency Partnership, Version: 5”,
November 2012
[66]. RUPTL Document, “Rencana Usaha Penyediaan Tenaga Listrik PT PLN (Persero)
2013-2022”, 2013, Prepared by PT. PLN (Persero).
Other Websites:
o http://mext-atm.jst.go.jp/02-01-01-10/01.gif
o http://www.energyefficiencyindonesia.info
o http://tehnologi-sel-surya.blogspot.com/
o http://www.globalccsinstitute.com/publications/indonesia-regional-
overview/online/90071
o http://beranda.miti.or.id/kendala-elektrifikasi-daerah-terpencil-dan-solusi-pltmh/

162
Other Documents:
- Ministry of Energy and Mineral Resources (MEMR) Regulation No.4/2012
- Ministry of Energy and Mineral Resources (MEMR) Regulation No.30/2012
- Ministry of Energy and Mineral Resources (MEMR) Regulation No
2682K/21/MEM/2008
- Ministry of Energy and Mineral Resources (MEMR), “Draft Document of RUKN
(Rencana Umum Ketenagalistrikan Nasional 2012 – 2031, October 2012, Jakarta.
- Saptadji, Nenny, “Strategi dan Langkah-langkah dibidang: Energi Panas Bumi”, June
2008, ITB.
- Priyanto, Unggul, “Development Of Renewable Energy: Oppotunities And ChallengesIn
Indonesia”, BPPT-The Agency for The Assessment and Application of Technology -
Indonesia , LIPI-Jakarta, March 2014.
- Yahmadi, Anang , ”Renewable Energy Power Supply For Development”, LIPI-Jakarta,
March 2014.
- M.H. Hasan et al; “Renewable and Sustainable Energy Reviews”, 2012, 16, pp. 2316–
2328.


![NIS-Elements Viewer The User's Guide - Laboratory Imaging · NIS-Elements Viewer. iv. 1. Abilities The [ MacOS X ]clone of NIS-Elements V iewer is a softw are enabling user s to open](https://static.fdocuments.us/doc/165x107/5fd74c073d4b47631d3f5673/nis-elements-viewer-the-users-guide-laboratory-imaging-nis-elements-viewer-iv.jpg)