REPORT ON THE 2ND NATIONAL CONFERENCE OF … · REPORT ON THE 2ND NATIONAL CONFERENCE OF THE BDS...
83
REPORT ON THE 2ND NATIONAL CONFERENCE OF THE BDS DONOR COORDINATION GROUP HELD ON: 3RD – 4TH October 2006 VENUE: LAKE NAIVASHA SIMBA LODGE REPORT COMPILED BY: KENYA GATSBY TRUST P.O BOX 44817,00100 GPO NAIROBI. TEL: 020-2720711, 2720703,2720571 Email: [email protected]
Transcript of REPORT ON THE 2ND NATIONAL CONFERENCE OF … · REPORT ON THE 2ND NATIONAL CONFERENCE OF THE BDS...

REPORT ON THE 2ND NATIONAL CONFERENCE OF THE BDS
DONOR COORDINATION GROUP
HELD ON: 3RD – 4TH October 2006VENUE: LAKE NAIVASHA SIMBA LODGE
REPORT COMPILED BY:
KENYA GATSBY TRUSTP.O BOX 44817,00100 GPO
NAIROBI.TEL: 020-2720711, 2720703,2720571
Email: [email protected]

October 31, 2006
Dear Conference Participant:
Re: Second National Conference of the BDS Donor Coordination Group Technical Report
On behalf of the BDS Donor Coordination Group, I am happy to forward you the technical report for the Second National Conference of the BDS Donor Coordination Group, held this 3-4 October at Naivasha Simba Lodge.
This report offers a complete summary of the presentations and discussions which were held duringthe two-day event. In addition, we have included technical papers by each break-out panel presenterwhich provide a more in-depth account of their case study.
Once again, thank you for your active participation at this year’s event.
Sincerely,
David KnoppChair, BDS Donor Coordination Group

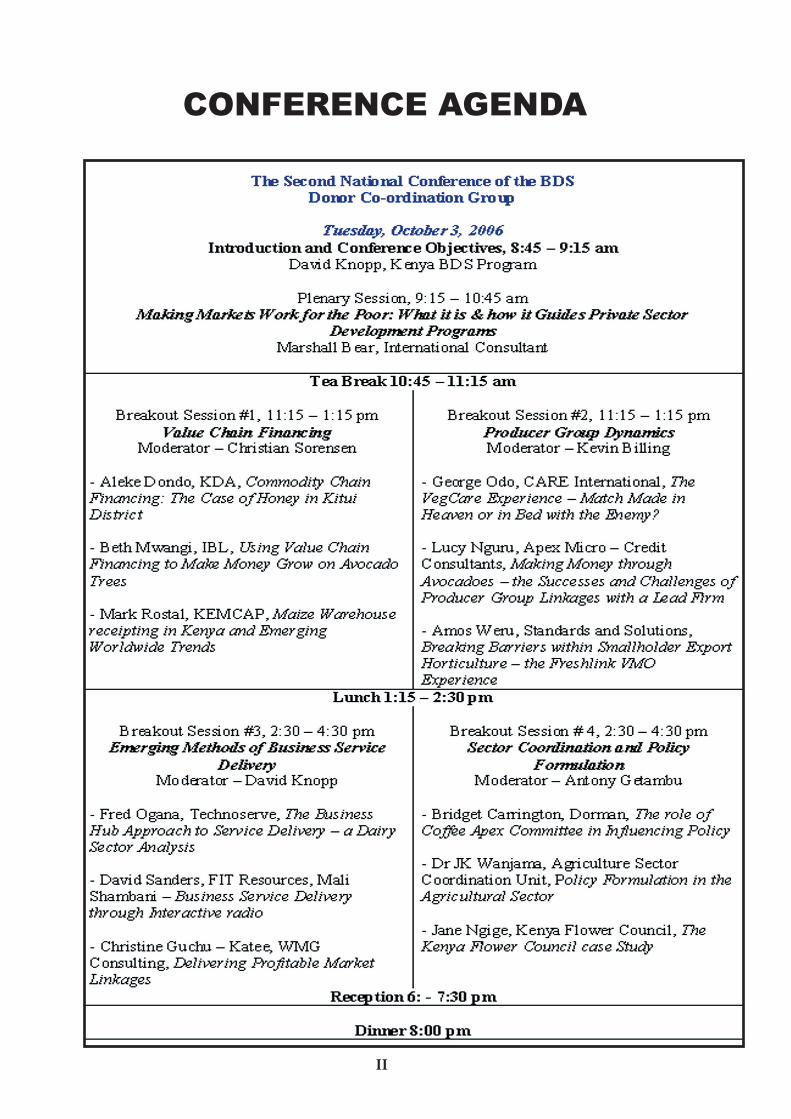
TABLE OF CONTENTS ABBREVIATION……………………………………………………………………………………...I CONFERENCE AGENDA....…………………………………………………………………………II PLENARY SESSION ONE: MAKING MARKETS WORK FOR THE POOR: WHAT IT IS AND HOW IT GUIDES PRIVATE SECTOR DEVELOPMENT PROGRAM.…………………….III1 BREAK-OUT SESSION ONE: VALUE CHAIN FINANCING...................................................... 11.0 INTRODUCTION..........................................................................................................................................11.1 COMMODITY CHAIN FINANCING: THE CASE OF HONEY IN KITUI DISTRICT.....................21.1.1 Introduction.....................................................................................................................................................21.1.2 Financial Sector in Kenya...............................................................................................................................21.1.3 The Honey Market Chain in Kitui District..................................................................................................31.1.4 KDA/ABD Response.......................................................................................................................................31.1.5 Actors and Financial Products.......................................................................................................................41.1.6 Conclusion........................................................................................................................................................41.2 USING VALUE CHAIN FINANCING TO MAKE MONEY GROW ON AVOCADO TREES..........51.2.1 Avocado Production in Kenya.......................................................................................................................51.2.2 Constraints to Avocado Production..............................................................................................................61.2.3 Response to these Constraints .......................................................................................................................61.2.4 Lessons Learnt..................................................................................................................................................71.2.5 Challenges Faced.............................................................................................................................................81.2..6 Key Innovations..............................................................................................................................................81.3 MAIZE WAREHOUSE RECEIPTING - AGRICULTURE PRODUCTIVITY AND POVERTY IN KENYA.........................................................................................................................81.3.1 Agriculture Productivity.................................................................................................................................81.3.2 Poverty Assessment in Kenya........................................................................................................................91.3.3 Key Challenges and Constraints to Growth................................................................................................91.3.4 What is Warehouse Receipting?..................................................................................................................111.3.5 Why is Maize Warehouse Receipting Important for Kenya?...................................................................131.3.6 Where is Maize Warehouse Receipting in Kenya?....................................................................................131.3.7 Current Situation...........................................................................................................................................171.3.8 Lessons Learned, Recommendations and the Way Forward...................................................................172 BREAK-OUT SESSION TWO: PRODUCER GROUP DYNAMICS............................................182.0 INTRODUCTION........................................................................................................................................182.1 THE VEGCARE PARTNERSHIP STORY – MATCH MADE IN HEAVEN OR IN A BED WITH THE ENEMY.......................................................................................................................192.1.1 Background....................................................................................................................................................192.1.2 The New Approach – Vegcare .....................................................................................................................212.1.3 Results after the 1st year...............................................................................................................................222.1.4 Farmer selection............................................................................................................................................222.1.5 EUREPGAP Protocols..................................................................................................................................23

2.1.6 Commercially sustainable marketing entity..............................................................................................232.1.7 Partnership.....................................................................................................................................................232.1.8 Conclusion.....................................................................................................................................................232.2 MAKING MONEY THROUGH AVOCADOES.....................................................................................242.2.1 Successes and Challenges of ‘Producer Group’ Linkages with a Lead Export Firm............................242.2.2 Innovative Market Approach.......................................................................................................................242.3 FRESHLINK VMO – BREAKING BARRIERS WITHIN THE HORTICULTURE INDUSTRY......262.3.1 Introduction...................................................................................................................................................262.3.2 Freshlink model............................................................................................................................................272.3.3 Achievements................................................................................................................................................282.3.4 Challenges......................................................................................................................................................282.3.5 Conclusions....................................................................................................................................................292.3.6 Future work....................................................................................................................................................293 BREAK-OUT SESSION THREE: EMERGING METHODS OF BUSINESS SERVICE DELIVERY.....................................................................................................................................303.0 INTRODUCTION........................................................................................................................................303.1 THE BUSINESS HUB APPROACH TO SERVICE DELIVERY.............................................................313.1.1 Introduction...................................................................................................................................................313.1.2 Chilling Plant Model.....................................................................................................................................323.1.3 Muki Dairy Case Analysis............................................................................................................................343.1.4 Replication......................................................................................................................................................343.1.5 Lessons............................................................................................................................................................343.1.6 Results.............................................................................................................................................................353.1.7 Risks in the model.........................................................................................................................................353.2 MALI SHAMBANI – BUSINESS SERVICE DELIVERY THROUGH INTERACTIVE RADIO......363.2.1 Project Background......................................................................................................................................363.2.2 The research phase........................................................................................................................................373.2.3 The Project Model.........................................................................................................................................373.2.4 Monitoring and Evaluation Framework.....................................................................................................383.2.5 Radio Format.................................................................................................................................................393.2.6 Information Integration...............................................................................................................................393.2.7 Success to Date..............................................................................................................................................403.2.8 Key Project Outputs.....................................................................................................................................413.2.9 Challenges/Lessons Learnt..........................................................................................................................423.2.10 The Next Stage...............................................................................................................................................423.3 DELIVERING PROFITABLE MARKET LINKAGES: AVOCADOS FOR OIL PROCESSING.......43

3.3.1 Constraining Factors at the Farmer Level..................................................................................................443.3.2 Marketing Constraints..................................................................................................................................443.3.3 Our Solution: A Profitable Market - Link Business..................................................................................453.3.4 Challenges and Lessons................................................................................................................................483.3.5 Conclusion.....................................................................................................................................................484 BREAK-OUT SESSION FOUR: SECTOR COORDINATION AND POLICY FORMULATION............................................................................................................494.0 INTRODUCTION........................................................................................................................................494.1 ROLE OF COFFEE APEX COMMITTEE IN INFLUENCING POLICY.............................................504.1.1 Background....................................................................................................................................................504.1.2 World Bank Value Chain Analysis..............................................................................................................514.1.3 Formation of the Coffee Apex Committee.................................................................................................514.2 AGRICULTURE POLICY FORMULATION............................................................................................534.2.1 Introduction...................................................................................................................................................534.2.2 Purpose for the Policy...................................................................................................................................534.2.3 Who should be involved...............................................................................................................................544.2.4 Process of policy formulation......................................................................................................................544.2.5 The Case for Coffee.......................................................................................................................................544.2.6 Future Policy Formulation Process.............................................................................................................554.3 KENYA FLOWER COUNCIL: SECTOR COORDINATION AND POLICY FORMULATION....554.3.1 Background Information..............................................................................................................................554.3.2 Main Objectives.............................................................................................................................................574.3.3 Key Activities.................................................................................................................................................574.3.4 Industry Promotions.....................................................................................................................................584.3.5 Capacity Building..........................................................................................................................................584.3.6 Lessons Learnt................................................................................................................................................594.3.7 Challenges.......................................................................................................................................................594.3.8 Conclusions....................................................................................................................................................595 PLENARY SESSION 2: CONFERENCE SYNTHESIS AND REMARKS FROM THE GLOBAL DONOR COMMITTEE........................................................................................606 ANNEXES......................................................................................................................................626.0 LIST OF PARTICIPANTS............................................................................................................................62

ABBREVIATIONS
ABL African Beekeepers LimitedABS African Breeders ServicesABD Agricultural Business Development ASAL Arid And Semi-Arid LandsAVOPP Avocado Oil Processing ProgramBDS Business Development ServicesBSMDP Business Service Marketing Development CBK Central Bank Of KenyaEBA Everything But ArmsESA Eastern And Southern AfricaEPA Economic Partnership AgreementEUREPGAP European Retailers Producer Good Agricultural PracticeGAP Good Agricultural PracticeGDP Gross Domestic ProduceGMO Group Management OfficersIFFP International Fair Flowers And PlantsIFAD International Federation Of Agricultural DevelopmentKEMCAP Kenya Micro Finance Capacity Building ProgrammeKFC Kenya Flower CouncilKMDP Kenya Maize Development ProgrammeKPLC Kenya Power And Lighting CompanyMFI Micro Finance InstitutionsMOU Memorandum Of UnderstandingR&D Research And DevelopmentREAP Rural Enterprise Agribusiness PromotionSACCO Savings &Credit Cooperative SocietySME Small And Micro EnterprisesWTO World Trade Organization
I
ABBREVIATIONS
ABL African Beekeepers LimitedABS African Breeders ServicesABD Agricultural Business Development ASAL Arid And Semi-Arid LandsAVOPP Avocado Oil Processing ProgramBDS Business Development ServicesBSMDP Business Service Marketing Development CBK Central Bank Of KenyaEBA Everything But ArmsESA Eastern And Southern AfricaEPA Economic Partnership AgreementEUREPGAP European Retailers Producer Good Agricultural PracticeGAP Good Agricultural PracticeGDP Gross Domestic ProduceGMO Group Management OfficersIFFP International Fair Flowers And PlantsIFAD International Federation Of Agricultural DevelopmentKEMCAP Kenya Micro Finance Capacity Building ProgrammeKFC Kenya Flower CouncilKMDP Kenya Maize Development ProgrammeKPLC Kenya Power And Lighting CompanyMFI Micro Finance InstitutionsMOU Memorandum Of UnderstandingR&D Research And DevelopmentREAP Rural Enterprise Agribusiness PromotionSACCO Savings &Credit Cooperative SocietySME Small And Micro EnterprisesWTO World Trade Organization
II
CONFERENCE AGENDA

PLENARY SESSION ONE
Making Markets Work for the Poor: What it is and how it guides Pri-vate Sector Develop-
ment Programs
By Marshall Bear

PLENARY SESSION ONEMaking Markets Work for the Poor: What it is and how it guides Private Sector Development ProgramsBy Marshall Bear, International Consultant
Introduction The purpose of this presentation was to explain to donor practitioners how MMW approach works andhow it can be used to guide project design and implementation. It also sought to understand how the ap-proach embraces sub-sector/value chains and other PSD approaches. More importantly, it focused on how to develop markets as opposed to why have the markets.It emerges that rural Small and Micro Enterprises (SMEs) are constrained by lack of information. There istherefore need to increase information accessibility for these rural SMEs on a sustainable basis. But while doing this, it is important to first understand the kind of information that is useful to rural SMEs. For in-stance, the mass media must ensure that the content that they deliver is relevant for the locals. The Essence of MMWMMW approach has an objective to provide more effective and inclusive market systems for the poor. It isgrounded in detailed understanding of market systems and shaped by an open, justified picture of sustain-ability. The approach has flexible, multi-faceted interventions aimed at leveraging more market activitythat are of a light touch, are indirect and facilitative.Objectives: the strategic rationaleAn effective private sector development generates growth and in doing so, builds capacity and createsopportunities. On the other hand, marketing systems functioning well creates the right and conducive environment for development of an effective and inclusive private sector. Development experiences showthat MMW intervention is necessary to bring about an inclusive and sustainable systematic change. Con-ventional interventions however often leave out the market system development and go straight to privatesector development from MMW interventions. What’s different about a MMW approachBoth the conventional and MMW interventions seeks to address problems that businesses face. A conven-tional approach asks how it can help to solve the problems. On the other hand, a MMW approach asks the market environment is not providing solutions to the problems. It also tries to identify why the market is not working for the poor.Defining pro-poor focusPro-poor potential refers to those high numbers of poor or disadvantaged groups that are close to markets, producers, workers and consumers and therefore they have a potential to change their situation. Pro-poor growth potential means ‘stepping up’ productivity/market share or ‘stepping out’’ new markets, jobs and opportunities. However, there are systematic constraints that hinder the pro-poor growth. Defining a realistic picture of sustainabilityThe following supporting functions presents a realistic picture of sustainability, for example for a commu-nity based tourism: • Maintenance and construction • Mediation • Finance • Infrastructure • Information • Negotiation • Booking • Marketing
III

The rules that can ensure sustainability and shift from communities’ interest in local tourism industryand also in the wider tourism industry include: Regulations, Standards, Informal rules and norms and Laws.
Developing a realistic picture of sustainability
FUNCTION WHO DOES? WHO PAYS? Business training/advice NGO/PS Donor / PS internship Advocacy NGO Donor/ members Finance NGO Donor Construction and maintenance PS Donor Joint venture mediation NGO/PS Donor Booking NGO Donor Marketing and branding NGO /PS Donor Information NGO Donor Standards NGO Donor Market research NGO /PS Donor Legal services PS Donor Conflict arbitration NGO Donor Regional planning NGO/ PS / Govt Donor/ Govt Advice to government NGO Donor
Market systems: A conclusion Market systems are more than mere transactions. They are both multi-functional and multi- player andmust involve the private and public. Market understanding is driven by what you need to know - pro-poor growth potential, systemic constraints and feasibility of donor practitioner intervention. Further, market systems are interconnected and interdependent - rules and supporting functions are often partsof other market systems. Finally, understanding of system constraints guides intervention decisions - may be indirect but explicitly links to pro-poor growth.
Sustainability: A conclusion - Conventional Vs. MMWConventional • Sustainability is not operationalised • General but ill-defined aspiration for the future MMW • Sustainability is placed at the centre of strategy and action • MMW builds a realistic, transparent picture of the future for the private and public sec-tors.
Intervention Design And Implementation – Conventional vs. MMWConventional There is general support for macro reform and;Direct delivery of support to target groups.
IV

MMWThere is specific support aimed at addressing market constraints through limited intervention; • Finite • Focussed • Facilitative
The method applies indirect intervention, relies on intelligence, influence and leverage.
A Facilitation Approach to ImplementationThere is need to stimulate market players to perform valid roles. Currently they’re not doing well in thatarea. This means ‘catalyzing, initiating, motivating and linking’ and getting them to do things. This strategyfor intervention is to determine a “pathway to crowding in” rather than “crowding out”.This strategy must recognize the importance of indigenous ownership and that interventions are time de-fined with finite resources. The strategy must also be one which establishes credible exit strategies fromoutset, against which progress can measured.
Guiding facilitation questions • Are intervention activities likely to be a market function in the future? Is what we are doing now likely to be required in the market in the future or is it purely temporal? • Should we be working through a market player? If action is a market function, identify market players with the incentives and capacity to play this role (or seek to ‘leave the door open’ for this to happen in the future) • Are our relationships with market players appropriate? Our interaction with market players should encourage them into roles and practices consistent with local system, building on local incentives and ownership. • Is our support right sized? Our actions must be consistent with local norms not development norms: otherwise we distort function, displace ownership, disorient players. • Is there potential for ‘crowding in’? keep asking “ should we be doing this?” always look for opportunities to crowd in market functions and players that better serve the poor.
Guidance for Panel DiscussionsThe following topics will be discussed; • Value chain financing, • Business service methods, • Producer group dynamics, • Sector coordination and policy.MMW guidanceThe MMW approach demands for markets and not models! It seeks to go beyond standard statistical mod-els and also to engage dynamic markets and new playersMMW model supports systems (not firm) solutions: • May be indirect but with explicit links to poor producers • May work with lead firms but to leverage wider change • Strengthen and align incentives of market players/functionsThe MMW model seeks to create and sustain market system capacity: • Benefits • Relationships • Learn and innovate
V

BREAK-OUT SESSION ONE: VALUE CHAIN FINANCING
PRESENTERS:
1. Aleke Dondo - Commodity Chain Financing: The Case of Honey in Kitui District.
2. Beth Mwangi –Using Value Chain Financing to Make Money Grow on Avocado Trees.
3. Mark Rostal – Maize Warehouse Receipting in Kenya.”

1 BREAK-OUT SESSION ONE: Value Chain Financing1.0 INTRODUCTIONBy Christian Sorensen, Senior Advisor ABDTwo worlds meet whenever the term value-chain financing is used, the BDS world and the microfinanceworld. Microfinance has been seen as a response to integrated approaches of development, where finan-cial and non-financial interventions are intertwined. But while micro-finance minimalism or purismis an important pillar in growth of the micro-finance sector, it is increasingly becoming clear that busi-nesses need much more than financial input to grow.On the other hand, BDS is treated as a non-financial service. As an answer to microfinance minimalism,possible business development services are identified to address all constraints along market chains. This,it emerges, has resulted into a bi-polar development world of projects, NGOs, specialists and consultants, who either focus on pure micro-finance or pure BDS, and who do not communicate with each other.During the seminar where one of the themes was the ‘interrelationship between micro-finance and BDS’it was concluded that those SMEs which receive loans have the capacity to do business up to a certain level before grounding to a halt. It also emerges that BDS is needed to improve their capacity – both tech-nically and in terms of e.g. business planning. This could also be interpreted to mean that those SMEswhich have received BDS need capital to expand and that SMEs require both microfinance and BDS.The Value Chain Approach and Sub-Sector Analysis describe the market chain and the transactions init from producer to final consumer. These approaches seek to identify and address constrains along thechain. The smoother functioning of the market chain is often the objective for developmental interven-tions. Most of these constrains are financial.
• Most producers e.g. farmers have problems with financing inputs and therefore sell their harvestimmediately at low prices due to lack of storage facilities and good marketing strategies. • Traders often complain of lack of short term finance to buy in bulk.• Volume suppliers – be they traders or organized farmers - have working capital constrains to cover the gaps from delivery to payment.• Processors have similar gaps from buying the raw material to selling the processed commodi-ties.• Asset financing is limited by lack of financial sources and appropriate finance products availablefor small farmers and processors in agriculture.
However, new financial products and initiatives especially for agriculture and SMEs are emerging. Theyinclude input financing, (e.g. by processors via contract farming in cotton), factoring, micro leasing, mi-cro insurance (e.g. livestock insurance) and warehouse receipt systemSome of the key questions for the theme of value chain financing are:
• How can the finance sector be convinced to think ‘commodity chain’ approach instead of withtheir conventional ‘catchments area’ approach? • Minimalism in Microfinance needs to be replaced by a more holistic approach – but how can thisdone without returning to ‘integrated approaches’ - and who coordinates between the two worlds of microfinance and BDS?• Where are we with the innovative finance approaches in Kenya?
The theme group tries to answer some of the questions based on experiences and ideas from Kenya.This session has three contributors namely;
• Aleke Dondo, Managing Director of K-REP Development Agency who discusses commodity chain financing from the perspective of the microfinance sector using the Case of Honey in KituiDistrict.
1

• Beth Mwangi, Director of Ideal Business Links describes the case of Using Value Chain Financing to Make Money Grow on Avocado Trees.• Mark Rostal, Chief of Party of AID assesses the experiences with Maize Warehouse Receipting in Kenya. This is one of the emerging finance service that target market constraints.
1.1 Commodity Chain Financing: The Case of Honey in Kitui District By Aleke Dondo
1.1.1 IntroductionValue chain approach is becoming increasingly popular as a development intervention and as a focus for research. Value chains describe the market sequence and activities between the source of a product to the time it is purchased by consumers. The aim of this approach is to identify and address constraints alongthe chain. Development practitioners are concerned about developing interventions which remove con-straints that hinder the smooth functioning of the market chain.Constraints that hinder smooth functioning of the market chain are of varied nature and therefore require different solutions that can be grouped into three categories:
• Those that require policy or strategic interventions;• Those which can be solved by Business Development Services (BDS); and,• Those which require financial services.
In market chain analysis, a tendency is to disregard constraints caused by lack of financial services orpoorly functioning financial markets. Some analyses wrongly assume that financial constraints will auto-matically be catered for by existing formal and informal financial service providers.This presentation addresses those constraints along a commodity chain that can be addressed throughprovision of financial services. It uses honey in Kitui district as a case study but first examines the financialsector in Kenya.
1.1.2 Financial Sector in KenyaCompared to most sub-Saharan countries, Kenya has a relatively well established banking and micro-finance sector. However, formal banks are not flexible enough to offer financial services to low-incomegroups. They are also not geared towards business expansion along commodity chains. On the otherhand, the microfinance sector has grown significantly in the last 20 years to offer financial services to thisneglected group. The sector however, has three major biases. Most MFIs operate in urban areas thereby ignoring ruralparts of ASAL districts such as Kitui. In addition, due to restrictions of the banking Act, many MFIs have developed as credit–led organizations. This has limited the extent to which they can mobilize deposits toensure their sustainability. Most MFIs provide credit for trading purposes only with their loan asset port-folios concentrated in short-term working capital loans. Finally, very few MFIs provide services for small-holder farming activities, yet it is a sector that engages more than 70% of Kenya’s labour force. Currently, most MFIs offer a single product to SMEs operators through a single methodology commonly called theGrameen model. Consequently, only a limited segment of the potential market is reached.Even with huge investment in the Kenyan microfinance sector, it is clear that existing products and meth-odologies restricts MFIs from meeting the demands of their services. For instance, the 1999 baseline sur-vey of Kenyan SMEs revealed that only 10.4% of enumerated enterprises had received financial servicesfrom any source, be it banks, NGOs, MFIs or money lenders. Not forgetting that in addition to loans, SME business people also need other financial services like mortgages and insurance.It is imperative, therefore, to develop financial products that will address the diverse financial needs of lowincome groups and in particular the smallholder farmers. It is also important that Kenyan financial sectorthink commodity value chain and develop appropriate financial products along the value chain.
2

Lastly, the financial constraints enumerated at the introduction of this section go along the entire valuechain of any commodity and requires appropriate financial products.
1.1.3 The Honey Market Chain in Kitui DistrictThousands of beekeepers produce honey using traditional log hives in Kitui district. According to 2004estimates, the district had 295,000 traditional log hives, compared to 2,793 langstroth hives and 1,020 top bar hives in Kenya. While the district has a potential to produce over 8,000 tonnes of honey per year, the annual output rarely exceeds 3,000 tonnes. The price of crude honey in the district ranges from KSh 40to KShs. 80 per kilogramme for traditional log hives’ honey and KSh 80 to KSh 100 for honey extracted from the langstroth hives. The farmers supply honey to traders who supply local and distant market proc-essors who package the product to be sold to supermarkets and retail shops mainly in Nairobi. While the largest formal market for Kitui honey is Nairobi, the market can be segmented into:
• Local markets within the district – mainly for honey from log hives and used mostly in making traditional liquor and herbal medicines;• Local or regional markets – purchased by local refinery channels in Kitui and Mwingi towns;• The Nairobi market passing through brokers; and,• Distance markets through formal processors such as African Beekeepers Limited (ABL) and Honey Care Africa.
In 2004, Danida through the Agricultural Business Development (ABD) programme began work with honey producers in Kitui District. Preparations to develop the honey market chain started with a work-shop involving honey producers, traders, honey processors and government officials. The workshop ex-plored constraints to the development of the sector and the market opportunities. Lack of appropriate financial services was cited as one of the major constraints along the entire honey value chain. ABD alsocommissioned a number of studies on the honey value chain in the district. The studies showed thatdeveloping the honey market system requires coordinated action by several market chain actors and sup-port institutions.Marketing of honey is constrained by the disorganized and weak marketing structures from the producer to the consumer. Shortage of bee forage especially during the dry months posses a serious threat to bee keeping practice in the district.
1.1.4 KDA/ABD ResponseKDA in collaboration with ABD project has identified a number of constraints that could be addressedby appropriate financial products. These include limited financial ability to acquire hives and honey har-vesting kits, and for working capital required by traders to purchase honey from producers. They alsolack capital to purchase centrifuge machines by bulk buyers. However, KDA plans to develop appropri-ate financing products for the entire honey value chain in Kitui. These will include loans to producers oflog hives, lease of centrifuge machines to bulk honey buyers. Other support activities like implementing standards for high value honey and capacity building for honey producers will be undertaken by partner organizations.To deliver these products, KDA will work through its network of eight Financial Services Associations (FSAs). They will also disseminate those financial products that prove to be effective to other microfi-nance organizations in Kitui District.Following is a brief breakdown of financial constraints faced by key actors.ProducersHigh cost of inputs especially that of langstroth beehives and honey harvesting kit is a major constraint faced by producers. To address this, KDA plans to introduce its tested financial lease product for beehivesand harvesting gear to three FSAs in Kitui District who will avail them to the honey producers. Producers will also get other benefits such as saving facilities from FSAs.TradersThere are two kinds of traders; those who buy in bulk and small scale traders. In Kitui, some individual
3

traders and honey processing companies buy honey in bulk. Individuals face two financial constraints;working capital to pay for honey delivered by producers and capital to purchase centrifuge machines for bulking and refining. In response, KDA will develop a factoring facility to pay off the honey producers ondelivery of honey to the traders. Organized groups of honey producers will also benefit from this initiative.For the small scale traders who lack capital to buy honey, KDA through the FSAs will develop a working capital loan for them. They will also have access to financial leases to acquire centrifuge machines.ProcessorsProcessors such as ABL and Honey Care Africa supply their processed and packaged honey to supermar-kets and retail shops. Supermarkets need 90 days before payment therefore imposing a cash flow problemto processors who have to pay cash to their suppliers. KDA will develop a factoring product for honey supplied by traders to processors.
1.1.5 Actors and Financial ProductsThe diagram below has three components. The top component shows the major actors along the honeychain in Kitui. The second (middle) component shows the financial products that will be developed andtested for the different actors. The third (bottom) component shows the institutions (FSAs and KDA) thatwill supply the proposed financial services.
1.1.6 ConclusionAll market chain analyses need to consider constraints caused by lack of financial services or poorly func-tioning financial markets. The Kenya financial sector is not geared towards looking at business expansionalong commodity chains. It is imperative that the sector begins to think systematically about commodity value chains and to develop appropriate financial products along the value chain if efforts geared at com-modity market chain development are to realize their full potential.
4
Diagram 1

1.2 Using Value Chain Financing To Make Money Grow On Avocado Trees By Beth Mwangi
1.2.1 Avocado Production in KenyaAvocado is an important export fruit crop in Kenya in terms of value of output and export earnings. Over 15000 tons of avocado valued at over Ksh 1 billion were exported in 2004. The fruit grows bestat altitudes of 1500-2100 meters above sea level, with well distributed rainfall of more than 1,000mm. The main varieties grown in Kenya are the Fuerte variety, which is grown for the fresh export market,the Hass variety promoted in the country during 1960-70s and the Pueblo variety. Central province ac-counts for 35% of total production with Eastern province accounting for 29% while Nyanza and Western provinces account for 14% and 11% respectively.Avocado has a high nutritional content and can be utilized in the following forms: Fresh fruit for human consumption locally or in the export markets, with the latter being the main outlet; and avocado oil for cosmetics and specialized cooking in small under- developed markets. The domestic market consumesover 80% of total production with the rest being exported as fresh fruits. France has been the largest buyer of fresh avocado from Kenya. Other main export markets include United Arab Emirates (UAE), Netherlands, UK and Germany.In the 1990s, diseases and insect pests invaded this fruit and nearly destroyed it completely. Diseases such as anthracnose, scab, cercospora and rootrot are common while prevalent insect pests are thrips, scales and fruitfly. Anthracnose lives on twigs, rotten fruits and on dead leaves. It hardly infects undam-aged fruits. It can be controlled by observing field hygiene such as removing dead twigs, application ofcopper based fungicide and first spray when flower buds appears. The second spray comes one monthlater at fruit set with the third coming a month after fruit set.Fruits are susceptible to scab only from flowering until about half size development. The fungus re-quires wet conditions. Fruit may escape if conditions at fruit set are dry and warm. The disease can becontrolled by growing tolerant cultivar like hass and observing field hygiene by use of copper basedfungicides.Cercospora requires humid and hot condition (above 20 degrees centigrade) to produce spores. Spores are dispersed by splash or wind. Infection takes place through lenticels and symptoms appears about 3 weeks after infection. Mature fruits are resistant to the disease. The disease can be controlled by sprayingcopper fungicides. The spray should cover much of the development period of the crop and it shouldreach the top of the tree.Thrips is a slender insect pest 1-2 mm long. It sucks sap from the plant causing silvering of infested part.The infected part turns brown and dries up causing flower drop. It can be controlled by natural enemieslike ladybird beetles, predatory thrips and mites. It can also be controlled by use of chemicals like del-tamethrin (Decis) and Achook (zadirachtin) at flowering stage.Symptoms of scale include discoloration, malformation, leaf, fruit drop and retarded growth. Damage is caused by toxic saliva. Control of scales includes pruning and opening up the tree to allow for air circu-lation, use of agro chemicals like DC– tron plus and insecticide plus mineral oil. Fruit fly lays eggs underthe fruit skin. The eggs hatch within 1-2 days causing fruit rot. Fruit fly can be controlled by collectingand destroying all fallen fruit, use of bait sprays consisting of an insecticide mixed with molasses and by use of commercial bait – GF 120 or acceptable chemicals like Deltamethrin.Lack of essential micro nutrients also affects the yields of avocado fruits. For instance, iron deficiencycauses laminae to turn yellow, veins retain green colour lending the tree unproductive. Magnesium defi-ciency causes pale patches on old leaves. A band beside the vein remains green with young leaves being affected first. Such deficiencies can be corrected by application of foliar feed containing required micronutrient whenever symptoms are detected.
5

1.2.2 Constraints to Avocado ProductionThe diseases on the avocado fruit led to low quality yields resulting into low grade avocado products. This,coupled with delayed shipments of deliveries thus resulting in spoilt fruits tarnished Kenya’s reputation in the export markets. This greatly reduced foreign export earnings from the avocado fruit. In addition, bro-kers started buying avocados at throw away prices. This discouraged many farmers from growing the crop.As a result, orchards were routinely neglected and unprunned trees let to grow to unmanageable heights. Even picking fruits for domestic consumption became unbearable. Eventually, farmers started perceiving the avocado tree as any other ordinary tree with some in main production areas of Maragua, Thika andKiambu opting to cut down the trees to pave way for other more productive crops. Most small scale producers of the avocado fruit lack the requisite skills and knowledge to undertake the control measures against diseases and insect pests’ attacks. The following are some of the problems facingthe farmers:
• Little knowledge on what to spray, when to spray, how to spray.• They lack knowledge and facilities for proper handling and storage of agrochemicals.• Failure to gain access to or afford high cost (upfront) of agro chemicals, spray equipment and la-bour.• Lack of inputs, skills and knowledge in crop husbandry resulting in diseased and under ripe fruits.• Lack of access or knowledge of business services market.
1.2.3 Response to these ConstraintsSince the inception of the Kenya BDS, A USAID funded initiative, in September 2002, the perception of the avocado tree has changed. Kenya BDS invited bids from business development services (BDS) providers to design an intervention to commercialize disease and pest control services. A proposal by IBL to commer-cialize agro chemical spraying services among small scale producers was accepted by Kenya BDS.Kenya BDS contracted IBL to identify and develop independent service providers; sensitize farmers on need for integrated pest management (IPM) and agrochemical spraying services; approach a financial serv-ice provider to extend credit facility to farmers’ groups for agrochemical services backed by strength of sup-ply contract with exporter; establish a check of system where the exporter pays farmers through the bank, which deducts scheduled loan payment before releasing net proceeds to the farmer.
1.2.3.1 IBL’s Role as a FacilitatorIBL held discussions with different financial service providers to identify potential partners to work with.A key criteria was capacity of the institution to reach out to the small holder farmers and their commit-ment and willingness to invest in development of a new financial product. Equity bank was selected as themost suitable partner. The bank agreed to develop an appropriate financial product to meet the needs of theavocado farmers. Since the loan amounts required by individual farmers are fairly small, it was agreed that the bank waive the traditional security requirements and loans be secured by the supply contract signed between farmer’s groups backed by chattels mortgage signed by individual farmer. IBL also developed a spraying scheme that meets market requirements and shared it with different export-ers who approved it. They further coordinated meetings between exporters and Equity bank to discussand agree on how they could work together to facilitate recovery of loans disbursed to farmers from sale proceed to be paid by the exporters. This led to signing of an MOU between the bank and different export-ers.Equity Bank agreed to:
• Develop an appropriate loan product to meet the needs of the avocado farmers. • Waive the traditional requirements for collateral.• Accept the supply contract signed between farmers’ groups and exporters as security for loans.
6

• However, individual farmers to sign chattels mortgage to enhance their commitment to repay loans• Establish a check of system where the exporter pays farmers through the bank, which deducts scheduled loan payment before releasing net proceeds to the farmer.• Send their credit officers to meeting organized by farmers’ groups to educate them on the loan ap-plication process.• Allow farmers to complete and sign the loan forms in their usual meeting places and submit them to the bank for processing.• Develop promotional materials for the new financial products.
1.2.3.2 Loan application processThose farmers’ groups who have signed a supply contract with an exporter can approach Equity Bank foran agro chemical loan facility. Individual group members will complete a loan application form and chat-tel agreement form (for the whole avocado season). These applications are consolidated at group level andsubmitted as one loan application for the consolidated amount. The bank approves the loan and issues aletter of offer to the group indicating the amount approved for the entire season. Group members whowish to pay cash for services can put their deposits into the groups’ savings account with the bank. Thebank is instructed to hold the cash received under ‘lien’ to ensure that it cannot be withdrawn for other purposes.To get agro chemical spraying services, farmers’ groups fill a requisition form for chemical spraying serv-ices from the service providers. Details in the requisition form includes; the number of trees to be sprayed, how many will be paid for in cash and to be paid through the loan facility from Equity bank. On the strength of information received, a SP delivers service and raises a services delivery note to be signed by individual farmers to acknowledge receipt of services. Delivery notes for services rendered to group mem-bers are consolidated and one invoice is raised for the farmers’ groups with the authorized signatories for the group endorsing an invoice for payment. The invoice is submitted to Equity Bank for settlement. Thebank debits the group’s loan account and credits the service providers.Loan plus interest accrued is recoverable from the sale proceeds of the avocado to the exporter. When farmers deliver their fruits to the exporters, the exporters remit payment to the bank (with details breaking down payment by group). The bank then pays farmers’ groups less 20% deduction for the loan repaymentuntil the loan is cleared. Since payments are made twice a month, it is assumed the whole loan should be fully repaid within three months.
1.2.3.3 Achievements The loan facility was well received with more than 95% of farmers in the groups throwing in their applica-tions. Only less than 5% pay cash for services. 3,500 farmers are accessing commercial spray services. 38 commercial SPs with access to modern tools and equipment for agro chemical spraying services are pro-viding services to farmers. As a result, more than 25,000 trees have been sprayed in the current avocado season. 3 cycles of spraying have already been done and more farmers’ groups are applying for the loan facility.
1.2.3.4 Expectations4,000 farmers are expected to benefit from the agrochemical loan facility in the first year. At least 40,000avocado trees will receive spray services. It is hoped that the services provided will increase Grade 1 yields from less than 25 pieces to over 300 pieces per tree during the first year. This model will eventually be rep-licated with mango and passion fruit smallholders.
1.2.4 Lessons Learnt• Awareness creation among farmers on opportunities available for them is critical for success.
7

• Services and products must be customized to meet the specific needs of different customers.• Financial education for farmers is very important.• Different stakeholders in the value chain must work together for the mutual benefit of all stake-holders.• The strength of the entire value chain depends on the performance of every single partner in thevalue chain. • The competitiveness of the final product corresponds to the capacities of the weakest link in thevalue chain.• Innovation holds the key to solving the problems facing small scale products. • Stakeholders must be willing to think and work outside the ‘box’.• Flexibility is important in designing financial products and services in order to give customers achoice.
1.2.5 Challenges Faced• Initial reluctance by farmers to sign the chattels mortgage forms due to skepticism about bank loans.• Farmer education is a time consuming process and during the pilot phase, only two cycles of spray-ing were done.• Internal wrangles in the farmers’ groups adversely affect the loan application process leading todelays.• Farmers with no trees applying for the avocado loan product. • SPs going to provide services only to find no trees.• Farmers indicating fewer trees on the loan application than they actually have. • Illiteracy – some farmers cannot sign the loan application form.
1.2.6 Key Innovations• Kenya Commercial Bank has agreed to reach out to small holder farmers.• Loan product tailored in a flexible manner to minimize interest payable by farmers.• Waiver of traditional security requirements.• Illiteracy is not a barrier to accessing loans as farmers can append their thumb prints.• Signing of MOU with stakeholders in the value chain to facilitate loan repayment• Small holder farmers who could not access financial services now have access. As a result, theyhave been able to increase their household incomes by increasing the competitiveness of their farm yields.
1.3 Maize Warehouse Receipting - Agriculture Productivity and Poverty in Kenya By Mark Rostal
1.3.1 Agriculture ProductivityWhile agriculture plays a significant role in Kenya’s economic development, the sector is dominated bysmall scale farmers. They consist of approximately 3.5 million people each with 20 hectares or less andan average of 2.5 hectares. They produce an estimated 60% of Kenya’s produce both for domestic and forexport markets. These farmers account for up to 75% of production in some commodities like coffee andtea. In the past 20 years, Kenya’s overall economic development has been erratic and highly correlated with growth in the agriculture sector. But since 2001, economic growth has been on a slow pace due to poor performance by key sectors such as tourism, horticulture, services and manufacturing. This has led to in-crease in poverty levels.But the worst hit sector is agriculture. Numerous statistical sources show that:
• Value-added agricultural GDP decreased from 19.7% in 2000 to 15.8% in 2003 with a slight in-crease to 16.4% in 2004;
8
• Agriculture’s contribution to GDP declined from 35% in 1964 to 24% in 2000;• Maize yields declined from 1.84 tons/hectare in the five years between 1985/86 to 1989/90, to 1.71tons/hectare between 1990/91 and 1994/95, to 1.58 tons/hectare in the eight years since the 1995/96 season.
1.3.2 Poverty Assessment in KenyaIt is estimated that 17 million Kenyans live below the poverty line. A survey of the Kenyan poverty situ-ation revealed the following:
• Absolute poverty is found throughout Kenya, with no geographic specific areas.• While many farming households produce and sell, they are often net buyers and are negativelyaffected by high food prices, with most subsistence farming households expending almost 72% oftheir incomes on food purchases. • Nonfood-poor households derive approximately 44% of their household incomes from off-farmactivities, while food-poor obtain the largest share of their income from crops (43%), and earn more income from off-farm than from livestock.• Food-poor incomes are one-sixth that of the nonfood-poor.• 60% of households that had no adult with primary education were chronically poor.
The Food Price Index (FPI) shows that the cost of food has been rising in Kenya for several years. FPIhas increased significantly in the past three years. Combined with decreasing incomes, it has resulted inhigher levels of food insecurity. As earlier mentioned, majority of farmers are net buyers, buying more than they sell. As such, they are always negatively and disproportionably affected by high food prices.
1.3.3 Key Challenges and Constraints to GrowthRural credit, in particular agricultural credit, is considered one of the major constraints to increasing smallholder agricultural production in Kenya and improving absolute poverty levels. Previously, the gov-ernments provided farmers with credit through state owned corporations such as the Agriculture Finance Corporation (AFC) that supplied credit, Kenya Farmers Association (KFA) that distributed agricultural inputs and the National Cereals and Produce Board (NCPB) that purchased agricultural produce. Thescheme worked reasonably well and reached many farmers but not necessarily the smallest. For instance, AFC’s mandate was to serve farmers with more than 5 acres but the average farm size reached was 20 acres, approximately 8 times more than the size of a small-scale farmer. In 1992, under budgetary and donor pressure, a program for economic liberalization began and govern-ment control over exchange rates, product pricing and marketing were lifted. Private sector traders be-came active and often farmers would side-sell their crops to better paying private traders rather than thegovernment operated boards. This new reality further eroded government’s ability to maintain the closedsystem and ensure loan repayment that was critical to the viability of the scheme. In addition, the system fostered a degree of rent seeking behaviors by those in power and eventually the structure collapsed, leav-ing farmers without institutions or services. Some have however been revived by the new government. Today, the development of Kenya’s agricultural sector is characterized by the following difficulties:
• An Uncertain Policy Environment.• Lack of Access to Financial Services.• High Interest Rates.• Excess Liquidity.• High Risk Agriculture.• Shortage of Financial Products.• Policy Environment.
1.3.3.1 Uncertain policy environmentLiberalization in Kenya proceeded at different paces and degrees in each of the various agricultural sectors. At the same time, the government tried to maintain influence in politically important sectors through fre-quent policy reversals which caused uncertainty, often leading to false and unrealized expectations by the
9
poor. Moreover, these misleading actions resulted in an uneven response from the private sector, which provided the opportunity for government to reassert itself and dominate in areas where services were not being provided, thus discouraging the private sector to enter and compete. Still, a scarcity of services exists in many crucial spheres, such as rural finance and market information,where neither the government nor the private sector is adequately engaged. Since liberalization, however, the microfinance sector has successfully flourished. But the sector has not helped much due to its con-centration on urban based SMEs while avoiding the agriculture sector just as commercial banks have so adeptly done.
1.3.3.2 Lack of access to rural financial servicesFinancial services are often wrongly interpreted to mean credit or loans. A strong and unmet demand forsavings services is widespread throughout all rural areas. Still, farmers cite lack of credit (or lack of access) as the primary obstacle preventing them from purchasing quality enhancing products such as fertilizers, improved seeds, agro-chemicals and irrigation facilities.
1.3.3.3 High interest ratesFarmers, business persons and consumers complain of high interest rates charged by banks and non-bank financial institutions. While rates have widely varied over the past several years, they are currently around18-20% at banks. MFI rates are substantially higher, reflecting greater operating costs and riskier clientele(including covariant risk). In general, high interest rates are caused by:
• Above average non-performing loan ratios, often caused by directed lending of shareholders;• Lack of reliable information on individual and business credit worthiness; • Underdeveloped risk assessment and credit evaluation techniques;• Over reliance on collateral, often times unrealizable collateral;• An ineffectual and expensive judicial system
Many banks in Kenya report increasing profitability year after year but have little to show in terms of ini-tiating agriculture-oriented financial services.
1.3.3.4 Excess LiquidityThe banking sector has been very liquid of late. With rates paid on Treasury Bills decreasing in recentyears, financial institutions have been forced to offer new loan products, aimed primarily at the urban-based formal wage sector as a means to match their previous risk-free earnings. Meanwhile, the rural sector has almost no access to credit or other financial services. This vastly undersubscribed market repre-sents a large, albeit riskier, opportunity for banks and other providers.
1.3.3.5 High-Risk AgricultureEven with Kenya classified as a deficit arid country, most agricultural activities depend on rain water.Majority of farmers are affected by the water deficit resulting in sizable, nation wide loan defaults for agri-culture. In addition, Kenyan agriculture is smallholder based, with little information available to financialinstitutions on the credit worthiness of potential clients. Only a fraction of farmers are reached by banks and MFIs.1.3.3.6 Shortage of Financial ProductsLittle investment has been undertaken to develop product-specific solutions for the agriculture sector. Most MFIs have focused on developing sustainable business models and products that maximize financialreturns, just as banks have successfully done.
10
1.3.4 What is Warehouse Receipting?1.3.4.1 History and DescriptionGrain warehouse receipting was first recorded in Mesopotamia around the year 2,400 B.C. Today, ware-house receipts are widely used for most commodities. In general, warehouse receipt financing has thepotential to improve the cash flow of farmers, traders, millers and governments through strategic grainreserves. For farmers, the benefits accrue through safe and secure storage. This helps to reduce spoilageby holding crops after harvest when prices are low and market supplies high to a future time when pricesare high and market supplies low. A warehouse receipt is a contractual agreement between a warehouse and a commodity owner, in most cases a farmer. Often, warehouse receipts serve as title to stored commodities. Since warehouse receiptsare considered negotiable instruments, the receipts can be traded, swapped, sold, used as collateral to finance loans, or used as a method of delivery against future contracts.Banks financing warehouse receipts do not buy the commodity outright; technically, financial institu-tions lend money against the collateral guarantee of a graded commodity in a known storage facility. Therefore, should the borrower (farmer) default, the bank fully recovers its loan if the correct precautionsand safeguards were properly instituted and acted upon. Warehouse receipt financing is still considered speculative. Banks must have a thorough understandingof individual commodities and market behavior. Borrowers must also understand the market and attend-ant risks, including the legal actions banks implement to realize their investments. In summary, warehouse receipting systems bring together:
• Producers and traders who deposit commodities in warehouses.• Warehouses that provide secure storage of commodities and issue receipts.• Lenders who accept the receipts as collateral for loans.• Collateral manager who inspect commodities and certify that warehouses meet basic standards.• Insurance providers that underwrite deposit risk against loss.
1.3.4.2 Mechanics (a schematic)Warehouse receipt systems introduce a number of participant and mechanisms not found in other ag-ricultural schemes. The collateral manager is critical to the overall success of the system. Producers andtraders deposit commodities to the warehouse. The warehouse provides secure and safe storage and is-sues a receipt to the producer, certifying that it is in possession of a specified quantity of a particular
11

Under the scenario above, the lender can dispose off the pledged goods only if the borrower defaults onthe loan or if the trigger price in the loan agreement is realized. Otherwise, title and any changes in the value of the deposited commodity belong to the depositor or borrower. A depositor can also transfer the receipt to a buyer, who in turn can take delivery of the commodity at the warehouse.
1.3.4.3 Optimal Warehouse Receipting Conditions • Legal and regulatory requirements, including laws that clarify the rights and responsibilities of system participants; title to warehoused goods; transferability of receipts, legal equivalence of the stored and documented commodities; and use of receipts as collateral.• Commonly used and accepted grades and measures.• A competent and trusted certification and inspection service.• Financial institutions willing to lend against receipts.• Commodity grades and standards.• Market information systems.• Legal and regulatory expertise tied to contracts, commercial codes, and financial regulations.
12
Diagram of a Warehouse Receipt System

1.3.4.4 Expertise Required• Warehouse management, certification and inspection.• Commodity grades and standards expertise.• Grain merchandising expertise.• Legal and regulatory expertise (title, collateral, negotiable receipts, warehouse inspection and certification services).• Insurance.• Receipts-backed lending experience or expertise.
1.3.4.5 Implementation Need-to-Knows• Not effective for capital investment.• Significant conditions required.• Viable storage facilities are difficult to locate because of government intervention in marketprices and other distortionary practices, high cost of financing and long payback periods, andfacilities are of low quality and are inadequately distributed.• Financiers and warehouses favor large producers
1.3.5 Why is Maize Warehouse Receipting Important for Kenya?1.3.5.1 The Constraints It Seeks to Address
• Warehouse receipt systems extend the sales season while providing small farmers access to lower losses due to spoilage, higher average prices, a reduction in seasonal price swings, and the economies of scale that derive from upgrading the marketing process with consistent standards and grades.• Receipts allow for a new source of collateral - secured commodity deposits.• Lenders reduce transaction and monitoring costs.• Traders leverage initial capital by purchasing more commodities with loans against each deposit made in a warehouse.• An effective system can allow for extensive outreach due to reduced transaction costs for finan-cial institutions.
1.3.5.2 The Benefits and Opportunities It Creates• Cost Effective Screening of willingness and ability to pay.• Expanded Collateral.• Appropriate Terms or Conditions.• Increased yields.• Lower Costs.• Higher Product Prices.• Standards and Efficient Sales.• Market Access. • Technical Services.
1.3.6 Where is Maize Warehouse Receipting in Kenya?1.3.6.1 BackgroundMaize warehouse receipting in Kenya is underdeveloped and still in its infancy. The private sector hasmade attempts to develop a functional system only to be blocked during various phases of implementa-tion. Recently, the United States Agency for International Development (USAID) began working to-wards bringing together private sector participants that are critical to the creation of a viable system. Leading this effort is USAID’s Kenya Maize Development Program acting as the focal point from which
13

1 Farmers trained to understand how warehouse receipting function, the benefits, the cost and risks • KMDP2 Farmers form groups to meet minimum tonnage requirements set by the bank(s) • Farmers • KMDP3 Groups appoint key leaders/decision makers/signatories • Farmers • KMDP4 Group leader (treasurer) trained to keep accurate records of each farmer’s contribution (number of bags deposited) • Farmers • KMDP5 Group arranges collection, inspection, grading and warehouse transportation • Farmers • KMDP6 Group ensures that a minimum warehouse receipt deposit of 100 million tons is obtained (smaller amounts can be deposited at the warehouse until 100 million tons is reached) • Farmers • KMDP7 Warehouse and collateral manager inspect and grade the quality and weigh the quantity • Warehouse • Collateral manager8 Warehouse dries and cleans the maize if needed (and applies the costs to the group and individual accounts) • Warehouse9 Group representative examines and records costs and later informs individual farmers • Farmers • KMDP10 Warehouse issues storage and handling contract • Warehouse11 Group leaders sign warehouse storage contract • Farmers • KMDP
all critical actions are directed. These efforts include but are not limited to:
• Providing extension services to increase yields.• Organizing farmers into viable groups.• Providing farmers with market information and training them on its use.• Sourcing viable vertical storage facilities and negotiating on behalf of the farmer’s interests.• Locating experienced collateral managers in the African context.• Training farmers on the merits of warehouse receipting as an alternative to current market behaviors and practices.
In addition, a leading Kenyan bank was provided with a US government guarantee, insuring against loan losses up to 50%, principle only. USAID-funded Kenya Microfinance Capacity Building Program (KEMCAP)was tasked with providing the bank with technical assistance and capacity building services. KEMCAP also coordinated actions between KMDP and the bank, monitoring progress against negotiated benchmarks.
1.3.6.2 Roles and responsibilities (timeline excluded)
Steps Activity Responsibility
14

15
12 Warehouse and/or collateral manager issues a “goods received” note for each ton of grain deposited • Warehouse • Collateral manager13 Group leaders receive a copy of the “goods received” and secure it in a safe location • Farmers • KMDP14 Banks inform the warehouse and collateral manager of the grain lending rate (limited to a certain time period) • Bank15 Bank or collateral manager (on bank’s behalf) provides the group leaders with a copy of the signed loan contract • Bank • Collateral manager16 Bank states the market value in the terminal market (Nairobi) and lends a percentage of the stated value against the warehouse receipt • Bank17 Group leaders sign the loan agreement with the bank • Farmers • KMDP18 Collateral manager forwards the loan agreement and the warehouse receipt to the bank • Collateral Manager19 Bank remits the loan to the nominated bank account • Bank20 Bank loan(s) issued to farmers by their chosen leaders • Farmers • KMDP21 Extension agent helps the farmers and warehouse market the grain to millers (with farmers dictating pricing) • Farmers • KMDP Warehouse22 Group leaders sign sales contracts with millers, traders and government • Farmers • KMDP • Buyers23 “Goods received” and note provided to buyers once payment has been made (buyers pay the bank) • Farmers • KMDP • Buyers24 Bank deducts loan principle, interest and other costs, afterward remitting the balance to the nominated farmer bank account and the warehouse for storage and handling • Bank25 Bank forwards the warehouse receipt (with copies for the warehouse and farmer group) to the collateral manager, providing notification that the bank no longer has a lien on the commodity • Bank26 Group leaders apportion funds based on each farmer’s deposits • Farmer • KMDP27 Warehouse releases grain to miller • Warehouse

1.3.6.3 The role of Kenya Maize Development Program and the FarmersKMDP educates and assists the farmers. Since the farmers have no experience with formal warehouse receipt financing and commercial grade storage, KMDP provides extensive hands-on and continuouseducation. Throughout the growing cycle, KMDP organizes farmers into groups, creates bank accounts,assists with the delivery of the maize to storage, enters into contracts and disburses funds if an agency agreement is required. KMDP also helps its farmers with marketing grain to millers, traders and other institutions while supervising contracts and payments.
1.3.6.4 USAID’s Kenya Microfinance Capacity Building Program’s RoleKEMCAP assists all participants in the scheme, especially the bank and KMDP. Throughout the proc-ess, they serve as facilitators while guaranteeing that critical benchmarks are achieved and necessary resources are brought to bear. In particular, KEMCAP provides assistance to the bank as requested. However, together with KMDP, KEMCAP develops pricing and cost models and also designing sensi-tivity analysis to demonstrate profit potential to all participants in the scheme.
1.3.6.5 The Bank’s RoleOnce a suitable warehouse with a collateral manager is appointed, internal bank systems must be de-signed, beta tested and activated, if not already present. The bank then assesses the market value ofmaize in the terminal market (Nairobi), afterwards lending a percentage of the assigned value againstthe warehouse receipt. In effect, the bank uses the commodity as collateral for each loan. Since the bankis in control of the commodity (through the assistance of the collateral manager) the bank does not need to have a long history or a long relationship with the farmers. Farmers deposit grain; the bank controls the farmer’s grain. If the farmer does not repay the bank loan or if the price hits a predetermined trigger price, the bank sells the grain to recoup potential or real losses.In general, the bank is ultimately responsible for numerous key actions: • Appraising warehouses. • Appointing collateral management. • Drafting loan agreements. • Creating warehouse receipts. • Building personnel capacities and capabilities. • Designing and implements policies and procedures, such as: A database price information and market trends Methodology for determining terminal, loan and trigger pricing Methodology for transmitting pricing information to farmers, the warehouse and the collateral manager Methodology for sales, assignment and release of asset commodities Risk assessment techniques, in particular, market and price exposure (i.e. daily com parison between and continuous trend analysis of terminal market and trigger prices) Loan manuals, contracts, warehouse receipts 1.3.6.6 The Warehouse’s RoleToday, Lesiolo Grain Handling (LHG) is the only credible private-sector vertical-storage facility able to implement warehouse receipt financing. However, a few other independent structures are entering themarketplace. LGH has the option of utilizing its limited space in Nakuru or rent other facilities in areas of the country. The other large scale warehouse facility is owned and operated by the National Cerealsand Produce Board, a government parastatal. It is yet to be privatized and it does not have a history of or willingness to work with the private sector (farmers notwithstanding).The warehouse’s role is relatively straightforward: it weighs, grades and stores the commodity at precise
16
temperatures while maintaining a pest and disease free environment. The warehouse also ensures that thecommodity is safe and insured against theft and other occurrences of loss (robbery, fire, etc.). It is respon-sible for issuing a goods received note to the farmer, complimenting the documentation provided by the agent for the bank or the collateral manager.
1.3.6.7 The Collateral Manager’s RoleThe collateral manager is ultimately responsible for overseeing the interests of the bank, ensuring the grainis graded and weighed correctly. In addition, the manager:
• Issues or endorses warehouse receipts.• Provides loan price and trigger price information to farmers.• Manages the loan contracting, receipting and commodity release process at the warehouse gate, while safeguarding and distributing documentation per established procedures.
1.3.7 Current SituationTwo years have been devoted to operationalize the scheme outlined above. Valuable lessons have been learned throughout the process and maize warehouse receipting is much closer to realization than expect-ed, even though in the third growing cycle since work began, maize warehouse receipting will not become a fixture of the financial services landscape yet. Much work remains to be done, but a large degree of theheavy lifting has been accomplished with new found excitement generated among many banks, additionalstorage capacity secured and a sense of optimistic momentum characterizing the future outlook.
1.3.8 Lessons Learned, Recommendations and the Way Forward1.3.8.1 Lessons Learned
• Time is a critical component and donor patience and perseverance is required (it takes time to improve yields and create historical information which is important to banker’s and other’s projec-tions).• Warehouse receipting is a complicated process with many moving parts, necessitating overarching coordination.• The process will fail without the full participation of an extension agent (KMDP); however, KMDPcannot be expected to “go it alone” since it has limited resources and field specific skills and thereforeoverarching coordination and complimentary technical assistance is absolutely required.• Storage space is not guaranteed; the private sector seeks the highest return at the lowest cost and risk.• Deal competition should be encouraged among banks and not all banks all equal; generally larger banks are more risk adverse and conservative while smaller banks are less risk adverse and oppor-tunistic.• Banks need to understand all the requirements upfront with their participation tracked and graded against the performance and compliance of others.• Guarantees are not necessary since the loan is fully collateralized.
1.3.8.2 Recommendations and the Way ForwardThe time for maize receipting continues to improve as knowledge and experience accrues. This informa-tion must be shared within the larger development finance and business community, including engageddonors, so that momentum is not lost as some funded programs come to end. Institutional know-how is easily lost as projects wind down and people move on. A process must be put into place so that this loss and leakage does not occur. That way, initiatives can be carried forward to ultimate success with the long-runoutcome of creating permanent fixtures to the financial services marketplace that will be leveraged manytimes with new and innovative products and solutions generated – for smallholder agriculture producers and other economically disadvantaged participants in the value chain.
17

BREAK-OUT SESSION TWO: PRODUCER GROUP DYNAMICS
PRESENTERS:
1. George Odo - The REAP to VegCare story: Match made in heaven? Or in bed with the enemy?
2. Lucy Nguru - Making Money with Avocadoes: The Successes and Challenges of Producer Group Linkages with a Lead Firm.
3. Amos Waweru - Breaking Barriers with Smallholder Export Horticulture: The Freshlink VMO Producer Groups Experience.

2 BREAK-OUT SESSION TWO: Producer Group Dynamics
2.0 INTRODUCTION By Kevin BillingBusiness ventures strive to maximize their returns through efficient production. For larger operations,an economy of scale is easily achievable, due to bulk purchases, division of labor, transportation of high volumes of product, easy access to capital among others. However, small and micro enterprises (SMEs) cannot enjoy this economic benefit since they experience many limitations such as limited access to in-puts and credit, low technical skills, and poor access to markets, which are driven by the twin demands of high quality and volumes.SMEs can however overcome such limitations by pooling their resources together, be they financial,technical, production, or management – so that individual SMEs can grow and compete in the formal economy. This thinking has driven development and formation of business oriented producer groups.The formation and structuring of groups however is not always straightforward, and has often beenoversimplified by donor practitioners. The process of group formation can be expensive, time consum-ing, and quite often unsustainable. It is not uncommon to witness a group break apart even before do-nor support has ended. This is sometimes manifested by poor donor signals, whereby SMEs will join agroup specifically to “access donor resources” rather than to address a common commercial objective.At other times, group dynamics are challenged by poor leadership, or lack of solidarity related to issues of savings, credit, or buying and selling as a unit. With this in mind, the following break out session on Producer Group Dynamics examines the advan-tages and challenges of group formation as a means of bulking inputs, accessing business services, lev-eraging credit, or linking with the end market. George Odo of CARE International presentation is entitled “The REAP to VegCare story - ‘Match madein heaven? Or in bed with the enemy?” He shares experiences of his organization’s project in vegetable production in Kibwezi area. The project uses the model of a Central Management Unit providing coreservices to farmers groups organized in production units. Of interest is how the project moves or is transformed into a commercial joint venture (VegCARE) involving the NGO and a large exporter - an interesting change from a non-business-like operation to hard-nosed business. Individual groups are extensively rationalized and excess debt dealt with in an innovative way. Of later, the project has been meeting challenges of standard driven export market (EUREPGAP).Lucy Nguru of Apex Micro-Credit Consultants makes a presentation on “Making Money with Avoca-does – the Successes and Challenges of Producer Group Linkages with a Lead Firm” based on their ex-periences in facilitating a project for Kenya BDS to establish and organize avocado producer groups. Theproject helps recruit, train and develop Group Management Officers (GMOs) to support and developproducer groups. Once they are operational, they are to hand-over to a large exporter. This project isnow focusing on getting the exporter to pick-up all costs and to take over existing and planned GMOs. Amos Waweru of Standards and Solutions Consultants make the third presentation on - “Breaking Barriers with Smallholder Export Horticulture – the Freshlink VMO Producer Groups Expe-rience”. This sub-project funded under DFID BSMDP grant project has involved facilitation of a formerbroker transforming into a registered company providing area based services such as input supply, credit, scouting, spraying, production advice and record keeping. S&S helped develop and implement a EUREPGAP quality management system (QMS) for the nine loose groups working with the service provider – Freshlink. It also trained staff of a Central Management Unit in use and management of the
18

QMS and helped develop service delivery in line with the demanding requirements of the standard. The following common threads are clearly apparent in all the presentations.
• The delivery of services to groups is an important and cost effective method. All presentationsnotes significant economic benefits flowed to the participating groups.• Often, groups set up for purely social purposes can make a poor basis for evolution into a pro-duction group which needs to be business-like in its orientation. Two presentations note that it is easier to get an efficient production group to provide social services to its members as well than toconvert an established social group into an efficient unit.• Group social pressure can ensure compliance with individuals’ obligations.• Group establishment and leadership selection is important. Leaders should be given specifictraining.• Group Dynamics can be a difficult area and often, internal tension, generally underestimated, candestroy or distort the group. • Groups tend to exclude weaker members because of strict requirements of health and safety standards and this can often contradict the commitment to ensuring that development benefits areevenly spread.• Group Governance and self management is still a major issue.
2.1 The Vegcare Partnership Story – Match Made In Heaven Or In A Bed With The Enemy By George Odo
2.1.1 BackgroundFounded in 1964, CARE is an international relief and development Non Governmental Organization (NGO) working in 70 countries and is renowned for its community engagement and group organization skills.This paper draws from experiences that CARE International and its private sector partner Vegpro havehad over the past 5 years in business development services and group dynamics with rural horticultural smallholder groups in Eastern Kenya. Vegpro began in the 70s as a vegetable buying company but has evolved into one of the largest horticultural companies in the region with its main markets in Europe and with an annual turnover of over US $ 50 million. Vegpro gets some of its product lines from smallholders particularly the fruit and the Asian vegetables. Kenya is predominantly an agro based economy, with Agriculture employing about 80 percent of the population. Agriculture accounts directly for 26 percent of the gross domestic product and indirectly for an additional 27 percent.
Diagram I
19
It is estimated that small-scale farmers account for about 60 percent of the total agricultural output. Al-though smallholders in Kenya have dominated the horticultural sector, during the past decade they have steadily lost market share due to limitations in size of operation, as well as inadequate technical knowledge and managerial capacity. Their position has been further eroded by introduction of stringent new lawsand market standards that aim to ensure sound environmental management, ethical trade practices, good agricultural practices, and high quality. The cost of compliance to these standards makes it economicallyimpossible for the smallholder farmers to continue to engage with the market in their small parcels of land individually. The only way smallholders are able to access markets is to produce and market in groups tobulk their produce for the end market. The advantage of this bulking other than attracting buyers as thequantities increase is the reduced cost of market services and supplies due to economies of scale. International Federation of Agricultural Development (IFAD) through CARE initiated a regional pilot project known as Rural Enterprise Agribusiness Promotion (REAP) in Kenya, Zambia and Mozambique. Apart from IFAD, the project received financial support from the CARE Canada CIDA program agree-ment partnership fund and from CARE USA through the Africa Fund. The broad objective of the projectwas to link rural farmers to both input and for the output markets sustainably and thus increase their eco-nomic and food security. The project ran from1999 to 2001 with support from the original donors beforeAusAID came on board from 2002 to take the project to scale. In Kenya the REAP project was set up in Makueni district in Eastern Province about 200 kilometers from Nairobi towards the coast. The project area is also referred to as the greater Kibwezi area and includesKibwezi, Mtito Andei and Makindu divisions. The livelihood of the community is horticulture and cornfarming. The area is classified as an Arid and Semi Arid Land (ASAL) due to its low and inconsistent rain-fall coupled with predominantly savannah type vegetation. It is one of the poorest districts in the Country with a 76% poverty level. However the area is gifted with perennial water natural sources including the2nd largest river in Kenya, the Athi. The area has the right temperatures for horticulture production andhas been one of the largest producers of Asian vegetables. The project design aimed to capitalize on thisenvironment to promote all year round production. The REAP Kenya project’s vision was to commercial-ize agriculture by taking advantage of the prevailing opportunities to make the livelihoods of the target population sustainable. The specific objectives of the REAP project in Kenya were moulded around the following four areas:
• Group organization - This was done by organizing farmers into formal producer and marketingorganizations using CARE’s expertise in organizing community groups to train in internal account-ability and group management. The size of the groups was determined by land availability and theminimum production required for attracting the market. • Output market linkages - Linking farmers to produce output markets with vegetable export com-panies like Vegpro, East Africa Growers Association, Frigoken, and Kenya Horticultural Exporters who provided market contracts for the smallholders. The buyers were willing to buy produce at‘farm gate’ prices that were pre-negotiated with clear quality specifications.• Facilitating links to input markets and service providers - The project in organizing farmers intogroups engaged in production, created market demand for certain services and inputs. Some serv-ices that began to thrive as business areas include farm equipment maintenance services, fertilizer and seed supply. Farmers were also able to get the produce at lower prices as the quantities required were high. • Provision of technical support - With focus on farmer ownership but professionally managed pro-duction, the project was able to respond to stringent quality assurance standards that were imposed on farmers by the market. The farmers were able to access professional services again only becausethey bulked their production and needs thus benefiting from economies of scale. Some professionalmanagement that this commercial approach requires includes irrigation, business planning and
20

agronomical support. The approach used was to ‘outsource’ rather than to try to train farmers tobe the professionals. The capacity of farmers was built to the point where they could manage theprofessionals providing the services.
The main implementation principles applied to this model included: production and quality assurancewas driven and dictated by the market as opposed to producing first then trying to identify markets;bulk buying of inputs and services to benefit from economies of scale; farmer ownership but profes-sional agribusiness management and guaranteed forward market or pre-sale contracts. Between 2003 and 2004 the REAP Kenya project was evaluated both internally and externally and the results were as follows:
• There were over 800 participating farmers.• The participating farmers had increases in their annual income between USD 400 to 1000 onthe average from a baseline of less than 300.• The farmers were supplying a minimum of 30 to 40 metric tonnes of vegetables each week.• The rural communities used their increased incomes for education, health and investing inbusiness.• There was rural growth with new market centres mushrooming in Kibwezi• There was an new demand for various support services skills and businesses that have developedin the rural area.• Farmers were willing to pay for market services and business development services (BDS) as long as it resulted in a net income gain for them.
These results were encouraging since it proved that with the right group dynamics, smallholder farm-ers could indeed participate in formal markets and decide what their social priorities will be. However, the biggest challenge was to keep the project sustainable. One criticism was that the whole system ap-peared working because CARE was managing everything through its management team and in effectdistorting the market and subsidising the value chain with donor funds. The other censure was that theREAP team was made of NGOs workers operating under a not-for- profit environment and strugglingto survive in the business world. The emerging stringent consumer driven market standards that require increased investment by farm-ers in order to comply was also an issue. These included European Retailers and Producer Good Agri-cultural Practice (EUREPGAP), British Retailers Standards (BRS), Natures Choice and Ethical Trade Initiative (ETI) that intended to increase good environmental practices, ethical trade, as well as en-hanced health and safety standards. A series of consultations led CARE, the community and the private sector buyers to conclude that the REAP project in its form would never be commercially sustainable.
2.1.2 The New Approach – VegcareThe proposed new approach has four key components:
• The formation and development of a business “entity” that will be the service provider and fa-cilitator between the market and the smallholder.• A production and marketing model that ensures that smallholders are able to produce increased volumes and raise their incomes.• The development of a EUREPGAP protocol for smallholders.• The development of a pro-poor financing fund that is financed by the private sector and initiallyguaranteed by the donors.
21

Diagram II - The business model
2.1.3 Results after the 1st yearResults in the first year present some valuable lessons for Vegcare both as a business and as a partner-ship. It takes into account experiences in the group selection; its effort to help smallholders complywith stringent market standards like EUREPGAP; the challenges of side selling as related to contract supply and its experience in the governance of the Joint Venture.
2.1.4 Farmer selectionOne of the fundamental principles that underpin the model is that organizing producers into sustain-able groups is a must for the success of a sustainable value chain. Some of the benefits include:
• Joint marketing of produce and hence the ability to bulk the volumes that attract the market.• Joint sourcing of input supplies and hence benefiting from price benefits arising from econo-mies of scale.• Joint sourcing of professional agribusiness support services at competitive rates due to econo-mies of scale.• Joint sharing of risk e.g. undersupply by one farmer can be covered by another farmer, loans and inputs on credit can be guaranteed by group members.
Vegcare did not automatically select the farmers that were involved in the REAP project even though they wanted to work with skilled farmers. This was aimed at avoiding carrying the burden of the farm-ers with the old debt from the previous project as this would overburden the business model. Vegcare thus developed a selection criterion aimed at smallholders who were already farming but struggling to access markets. The criterion was also open to larger farmers used to bulk production. It also allowedfor individuals and groups. The criterion was categorical that farmers commit to repay any credit ex-tended and to supply any products contracted.While the older REAP selection targeted poor farmers who would be turned into entrepreneurs, the Vegcare criteria targets entrepreneurial farmers struggling to access markets. The Vegcare criterionis more ‘demand responsive’ and more sustainable. Despite the stringent farmer recruitment criteria, Vegcare recruited 450 farmers in the first 6 months against a target of 300 for the first year. This led to poorer coverage and lower quality extension service to the farmers.
22

2.1.5 EUREPGAP ProtocolsTo continue accessing the lucrative European markets, the ‘imported’ will have to be able to comply with stringent EUREPGAP regulations that ensures that products sold are grown under environmentally safe and ethically right practices. To enable this continued access for its smallholder clients, Vegcare has decided to work under ‘option 2’ of the EUREPGAP regulations that allows for a central quality manage-ment system (QMS). The Vegcare QMS was developed by House of Quality (SA) with the support fromthe DFIF funded Business Services Marketing Development (BSMDP) project during the first year. EUREPGAP requires not just a clear traceable system for inputs used for production but also certain basic infrastructure like stores, grading sheds, water facilities and washrooms. The cost of the QMS andthe infrastructure is given as a grant to the farmer but only if they are willing to contribute to some of the capital cost and then their business can maintain the infrastructure. The cost of setting up the infra-structure for a group on about 30 acres is about USD 5,000 which translates to just over USD 150 per farmer. The actual interest by the farmers to EUREPGAP certification was secondary to ensuring that their en-terprises were profitable.
2.1.6 Commercially sustainable marketing entityOne of the main objectives of the partnership was to set up a commercially viable fee for service market-ing entity that links farmers to markets. To ensure the commercial viability the marketing entity has to be able to sell adequate volumes of sales. The entity was set up and the Governance model used was a partnership model that was based uponequality rather than equity with a rotating chair among the partners. The challenge encountered wasthat the partner chairing the board is able to influence the direction of the company even when thereappeared to be a conflict of interest.The marketing strategy in the first year gave Vegpro the exclusive rights to purchase all of Vegcare’s pro-duce and the challenge was that they were only interested in buying the 1st grade produce and this leftthe farmers with no options for the 2nd grade. This situation led to ‘side selling’ or trading outside of thecontract leading to a loss of up to 50% of the contracted produce in some cases.
2.1.7 PartnershipThe joint venture partnership model was not without challenges. Initially, partners focused in areas ofcommon interest but later this emphasis changed to complimentary objectives rather than common ob-jectives. It also emerged that for a successful partnership, ‘champions’ at the high level are important but obtaining the ‘buy in’ of the implementing middle level staff was just as key. This particular partnershipwould have been more successful in the 1st year if there was more support and ‘buy in’ from the staff atthe operational level of partners.
2.1.8 ConclusionWithout doubt, understanding group dynamics is fundamental for a viable and sustainable value chain if the producers are primarily smallholders. However, it is less clear how to manage partnerships with private sector partners along their core business where there may be some vested and possibly a conflictof interest. The question is whether it is acceptable for social enterprises like Vegcare to have their profit-ability compromised as long as the end market buyers and the suppliers make profits or whether theymust themselves be commercially viable even if at the expense of the buyers and suppliers. From this experience, it is evident that the private sector is a valuable alliance in delivery of sustainable commer-cial development models thus a match made in heaven as a result of their business expertise. However, the nature of the relationship must be kept at a manageable level and there must be sustainable benefitsaccruing to the buyer and the communities. Lessons from the first year in this partnership model havebeen documented and used to develop a strategy for the 2nd year going forward. This social enterpriseis also being used as a case study in top MBA schools in Canada.
23

2.2.1 Successes and Challenges of ‘Producer Group’ Linkages with a Lead Export Firm2.2.1.1 Market Constraints Prior to intervention by KBDS/Indu-farm/AMC avocado project in Maragua, Central Kenya, farmers grew avocados as a traditional tree fruit. Most of the trees were aged and it was common to find overgrown trees as old as 50 years. Avocadotrees form part of the inherited property and each tree can be identified with a person in the family. Although avocadofruits were exported prior to this intervention, there was no relationship between farmers and exporters. Farmers’ market outlets were purely through brokers who dictated the prices as they wished since they were the sole market outlets avail-able.Further, the relationship between the brokers and smallhold-er farmers was unprofessional, unreliable and exploitative.
2.2.2 Innovative Market Approach 2.2.2.1 Project Design Armed with this background information, AMC embarked on a strategy of developing market linkages and the necessary support to serve these markets. After the project design, AMC’s first task was placement anddevelopment of Producer Group Management Officer. The officers recruited had an agronomy background.They were trained by the lead consultant on group recruitment, development and management skills bor-rowing heavily from the Microfinance scenarios. In addition, officers were trained in record keeping, har-vesting and sales, and reporting procedures and skills. In building the market linkage between exporter and producer groups, AMC provided the expertise in Group Development, and other business development services. For effective implementation, the targetarea was demarcated into three operational blocks with each officer assigned a specific area. One officercoordinated the field activities. The exporter appointed an agronomist who worked closely with the AMCstaff on matters of avocado production and marketing.
Sometimes, brokers would pick fruits and promise to pay when collecting but would fail to turn up leav-ing the harvest to waste. During harvest times when the fruits are in excess, farmers are forced to aban-don them on tree to rot or eaten by the animals. This neglect of trees led to poor productivity in terms ofboth quality and quantity. Exporters fulfilled their demand from brokers and hence had no informationabout the source or any control over quality of fruits produced.
24
2.2 Making Money through Avocadoes By Lucy Nguru
Project Organization Structure
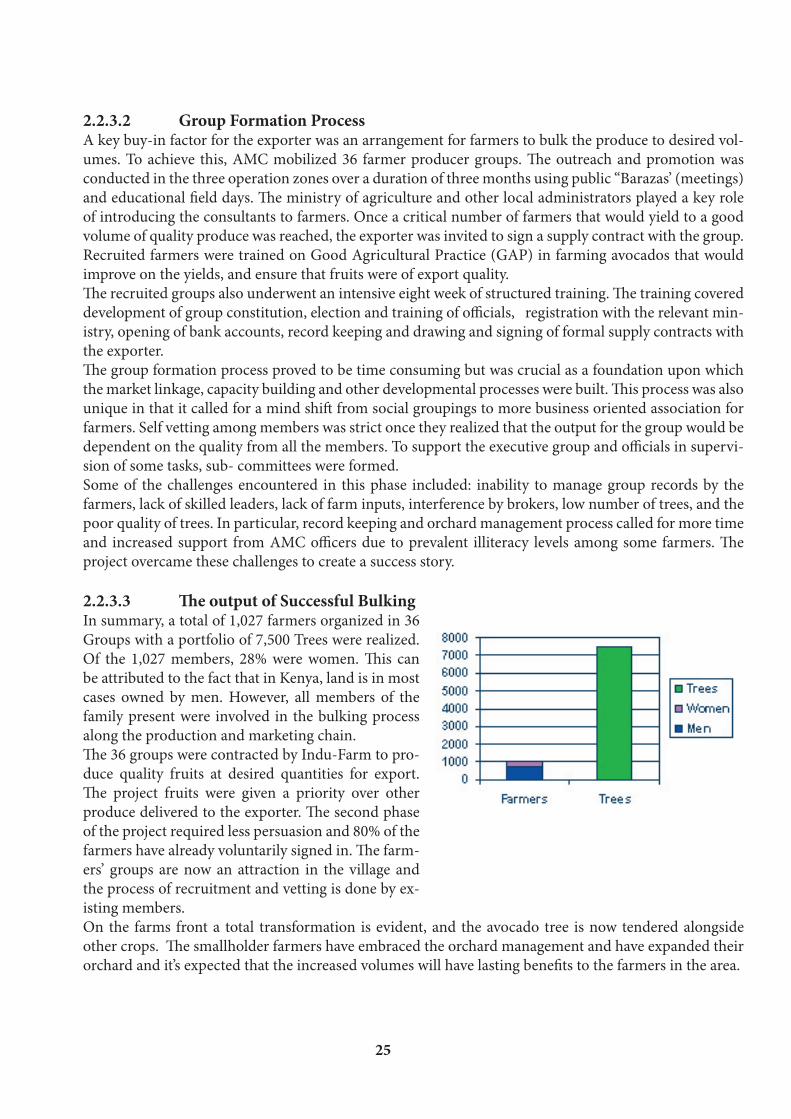
Sometimes, brokers would pick fruits and promise to pay when collecting but would fail to turn up leav-ing the harvest to waste. During harvest times when the fruits are in excess, farmers are forced to aban-don them on tree to rot or eaten by the animals. This neglect of trees led to poor productivity in terms ofboth quality and quantity. Exporters fulfilled their demand from brokers and hence had no informationabout the source or any control over quality of fruits produced.
2.2.3.2 Group Formation Process A key buy-in factor for the exporter was an arrangement for farmers to bulk the produce to desired vol-umes. To achieve this, AMC mobilized 36 farmer producer groups. The outreach and promotion wasconducted in the three operation zones over a duration of three months using public “Barazas’ (meetings) and educational field days. The ministry of agriculture and other local administrators played a key roleof introducing the consultants to farmers. Once a critical number of farmers that would yield to a good volume of quality produce was reached, the exporter was invited to sign a supply contract with the group. Recruited farmers were trained on Good Agricultural Practice (GAP) in farming avocados that would improve on the yields, and ensure that fruits were of export quality. The recruited groups also underwent an intensive eight week of structured training. The training covereddevelopment of group constitution, election and training of officials, registration with the relevant min-istry, opening of bank accounts, record keeping and drawing and signing of formal supply contracts with the exporter. The group formation process proved to be time consuming but was crucial as a foundation upon whichthe market linkage, capacity building and other developmental processes were built. This process was alsounique in that it called for a mind shift from social groupings to more business oriented association forfarmers. Self vetting among members was strict once they realized that the output for the group would be dependent on the quality from all the members. To support the executive group and officials in supervi-sion of some tasks, sub- committees were formed. Some of the challenges encountered in this phase included: inability to manage group records by the farmers, lack of skilled leaders, lack of farm inputs, interference by brokers, low number of trees, and the poor quality of trees. In particular, record keeping and orchard management process called for more time and increased support from AMC officers due to prevalent illiteracy levels among some farmers. Theproject overcame these challenges to create a success story.
2.2.3.3 The output of Successful Bulking In summary, a total of 1,027 farmers organized in 36 Groups with a portfolio of 7,500 Trees were realized. Of the 1,027 members, 28% were women. This canbe attributed to the fact that in Kenya, land is in most cases owned by men. However, all members of the family present were involved in the bulking process along the production and marketing chain. The 36 groups were contracted by Indu-Farm to pro-duce quality fruits at desired quantities for export. The project fruits were given a priority over otherproduce delivered to the exporter. The second phaseof the project required less persuasion and 80% of the farmers have already voluntarily signed in. The farm-ers’ groups are now an attraction in the village and the process of recruitment and vetting is done by ex-isting members. On the farms front a total transformation is evident, and the avocado tree is now tendered alongside other crops. The smallholder farmers have embraced the orchard management and have expanded theirorchard and it’s expected that the increased volumes will have lasting benefits to the farmers in the area.
25
2.2.3.4 Project Sustainability and Exit Strategy The bulking of products for collection and marketing is a major buy-in factor for the exporter whoseparticipation in the project has increased. They have posted a full time agronomist to support AMC of-ficers, and have undertaken to absorb the project as part of its out-growers unit. This marks the start ofcommercialization that is expected to take root in the year 2007.Towards this end, clear parameters have been set in order to increase quality and quantity of production. All services to the smallholder are coordinated within the group structure during structured meetings. Orchard expansion is one of the key areas earmarked in ensuring that productivity is increased. Theexporter wants to see average trees per farmer increased from 7 to 30 to make business sense for the smallholder farmer and the exporter. Performance by staff on the project is based on targets. However, producer groups are being standard-ized to make realistic projections per officer in order to serve the market demand. During the reorgani-zation of groups, some farmers sought association with groups in close proximity as opposed to social bond in order to ease the provision of services such as marketing of the produce. The capacity buildingprocess has resulted in farmers being more business aware and group organizations are being realigned to the business opportunities and challenges.
2.2.3.5 Lessons Learnt • Group Development is a time consuming process that requires resources, dedication and a struc-tured curriculum to facilitate a strong foundation for interventions that are based on group model. With proper support and training, even smallholder farmers can form viable business groups that can produce for a competitive export market. • A strong group is a good base for effective market linkages. They can stand “the test of times”. Useof Social pressure can enhance observations of individual obligations.• Group leadership directly influences group performance.• Socially constituted groups are not best as business units due to conflict of interest and lack ofclear focus. On the other hand, Business Focused Groups address social issues more effectively.• Reliability by the exporter on market aspects is the ‘acid test’ of the relationship. Once met, the smallholder farmer contracts can enhance traceability of export produce.• The smallholder Exporter relationship is a mutual relationship that can lead to long lasting posi-tive impact if well facilitated.
2.3 Freshlink Vmo – Breaking Barriers Within The Horticulture Industry By Amos Waweru
2.3.1 IntroductionMost smallholder farmers involved in export horticulture organized into farmer groups are challenged in the area of forming, developing, governing and managing the groups. This is further complicated bythe fact that the cost of compliance is high and smallholder farmers lack the technical capacities to meet the EurepGAP standard requirements. A project was set up to examine if smallholder farmers can participate in forming farmer groups that are viable business entities and at the same time meet the market requirements. A business model was developed involving formation of farmer groups and restructuring a horticultural produce broker into a private limited company with a legal status. The limited company was not to trade directly but insteadprovides services to the farmer groups who in turn pay a commission from all the produce sold for the company to run its daily operations. The services offered include:
• Farmer groups formation and development.• Marketing of farmer groups’ horticultural produce and provision of technical advice • Bulking and transportation of produce from farm to markets.• Farm inputs supply arrangement at lower costs.
26
This new business model in the export horticulture value chain provided a clear opportunity to demon-strate that smallholder farmers, organized and managed by a service provider, offer the possibility of op-erating as viable commercial entities which can respond to stringent export horticulture market require-ments such as the EurepGAP Standard. At the end of the 12-month project, 9 farmer groups had been formed or rejuvenated with membership increasing by 45%. 180 farmers in six farmer groups have been certified against EurepGAP standard. Other benefits include; increase in production volumes by morethan 33 % and prices by 30%-50% for all the crops sold. The groups also exhibited increased cohesion andgood governance. On the other hand, the service provider, Freshlink Vegetable Market Organisers Ltd, increased its employees from 10 to 36 and commission earnings by slightly over 50%. This project wasfunded by Business Services Market Development Services (BSMDP), a DFID initiative, while Standards & Solutions Consulting Ltd provided technical consultancy.
2.3.2 Freshlink model
2.3.2.1 What is ‘Freshlink model’ Freshlink VMO is a model developed to address specific challenges faced by smallholder farmer engagingin export horticulture. Currently, the primary challenge is securing guaranteed access to EU market by demonstrating compliance to EurepGAP standard. Another challenge is reorganizing and repositioning to achieve a sustainable relationship with horticultural exporters.The ‘Freshlink VMO’ model involves three players in the value chain;
• The farmer groups whose role and function is to grow and produce horticulture crops as per themarket requirements.• The horticulture export companies whose role and function is to serve as a market for the farmergroups’ produce and provide market information and requirements to the farmer groups. • Freshlink VMO Ltd who primarily serves to link the farmer groups to the export horticulture companies and provide a range of services to the farmer groups and export companies.
In Kenya, export horticulture companies have traditionally contracted farmers to grow specific crops. Theprocess mainly involved organizing, managing and contracting smallholder farmers into farmer groups. There is evidence of export companies disengaging from farmer groups because of the logistical & super-visory costs associated with securing this produce as well as farmer groups’ unreliability. The FreshlinkVMO model is based on trust elements on the part of Freshlink VMO Ltd, exporters and farmers.The Freshlink VMO model attempts to relieve the smallholder farmer and export companies of extra du-ties to concentrate on their key functions which are production and exporting respectively. Thus, it fillsthe gap which is emerging in the value chain i.e. linking farmer groups to exporters.
2.3.2.2 Function of ‘Freshlink model’Freshlink VMO Ltd provides management and marketing services to farmer groups. This is achievedthrough farmer groups’ formation and development through training and groups’ management technical advice. It has facilitated the building of facilities and structures e.g. collection centres, Central Manage-ment Unit, spraying services e.t.c. and provision of farm inputs on credit basis. Other support services include linking farmer groups to banks to access banking services. It also provides logistical and supervi-sory services to the export companies who buy the farmer groups produce e.g. transportation of produce at the right time and quantities.
2.3.2.3 What are farmer groups in the modelFarmer groups are social and welfare organizations registered by the Ministry of Culture and Social Serv-ices in Kenya. They aim to improve the well being of their members by identifying and participating inincome generating activities, in this case export horticulture farming. They have a General Assembly as the main body comprising of all the members which elects the govern-ing body or the executive committee. This committee consists of the Chairman, the Secretary and Treas-
27

urer all with a deputy to assist in duty execution. There are sub-committees made of three members fromwhere the Chairman is appointed with the other two coming from the General assembly. The farmergroups are governed and managed by their constitution that consists of policies and procedures devel-oped by the General Assembly.
2.3.2.4 Role of farmer groups in the Freshlink VMO Ltd modelThe farmer groups’ main role is acting as production units of horticultural produce under agronomicaladvice by Freshlink VMO Ltd technical advisors. Freshlink VMO Ltd has translated the export compa-nies requirements on crops supply into a production program that ensures the farmer groups produce crops at the quantities and quality specified by the buying export company.The Farmer group enters into a contract with Freshlink VMO Ltd which stipulates the terms and condi-tion of their relationship including payments, produce delivery and commission charged. It is expected to implement and observe all service provider’s policies and procedures and to ensure that its member farmers comply with the contractual obligations.The farmer groups then enters into a contract with the export company brokered by Freshlink VMO.Individual member farmers of farmer groups sign contracts with the farmer group which stipulates the rules and conditions of membership.
2.3.3 AchievementsThe Freshlink VMO Ltd model has been able to achieve the following:
• Farmers now have access to a range of services; technical advice, produce handling facilities, spraying services e.t.c.• Farmers have an assured market for their farm produce. • Farmers have demonstrated the ability to meet stringent export horticulture market require-ments by successfully implementing EurepGAP standard.• A template now exists with guidelines on how to develop a EUREPGAP standard QMS for Ken-yan farmer groups. • Development of a mutually beneficial relationship between farmers, Freshlink VMO Ltd and tosome extent, export companies.• Increased production efficiencies gained by the farmers in farmer groups which has resulted indecreasing cost of production from 30% to 35%.• Increased income earned by farmers and Freshlink VMO Ltd (not fully quantified yet).• Farmers have increased their production volumes from previous 21 tonnes per month of all crop types to over 60 tonnes.• Increased contracts with export companies to four by Freshlink VMO Ltd, who are attracted by the EurepGAP standard certified produce.
2.3.4 ChallengesFreshlink VMO Ltd model has faced the following challenges:
• Low growth of fruits and vegetable market in terms of volumes due to high freight costs com-pared to countries like Morocco and Egypt.• The marketing system has failed to recognize and reward effective management and reliabledelivery of produce meeting market requirements to export companies through price incentives, image enhancement, preferred supplier status or other market mechanisms.• The commercial contracts that farmer groups enter into with export companies are weak with noclear legal status.• Farmer groups with poor management and governance structures leads to a non cohesive and weak farmer group resulting to inefficient production units as demonstrated by the 3 farmer groupsthat didn’t achieve certification.
28
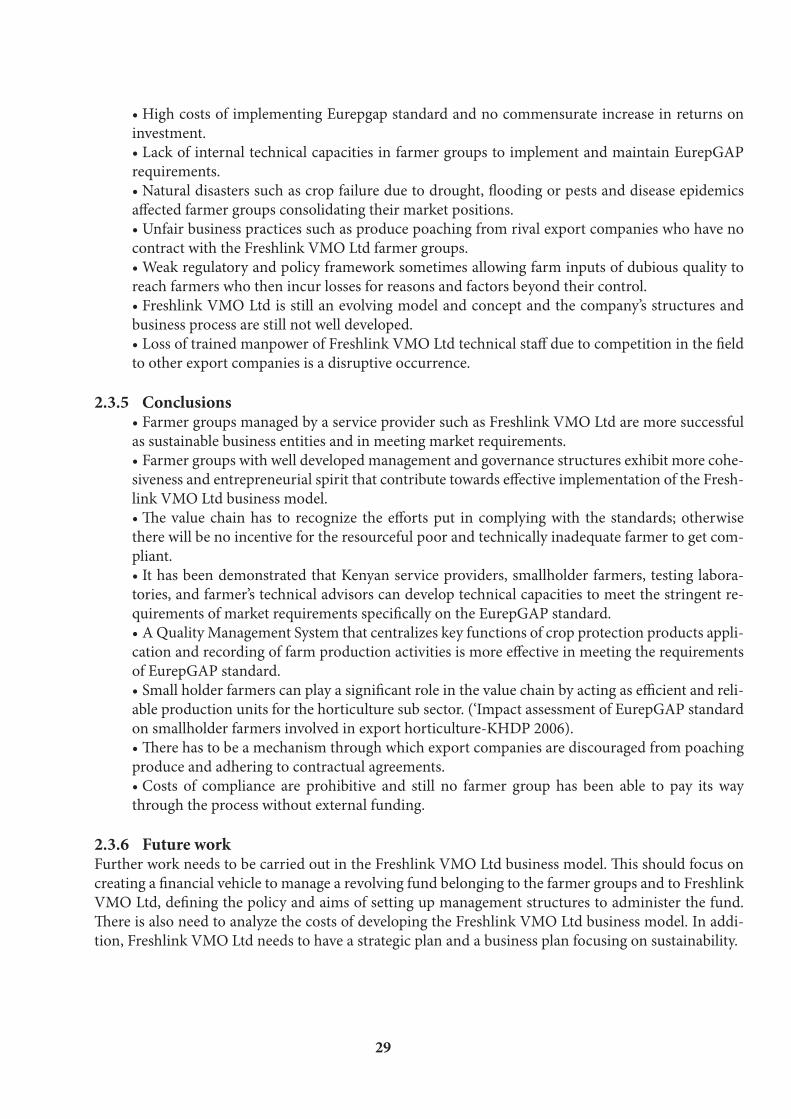
• High costs of implementing Eurepgap standard and no commensurate increase in returns on investment. • Lack of internal technical capacities in farmer groups to implement and maintain EurepGAP requirements.• Natural disasters such as crop failure due to drought, flooding or pests and disease epidemicsaffected farmer groups consolidating their market positions.• Unfair business practices such as produce poaching from rival export companies who have no contract with the Freshlink VMO Ltd farmer groups. • Weak regulatory and policy framework sometimes allowing farm inputs of dubious quality to reach farmers who then incur losses for reasons and factors beyond their control.• Freshlink VMO Ltd is still an evolving model and concept and the company’s structures and business process are still not well developed.• Loss of trained manpower of Freshlink VMO Ltd technical staff due to competition in the fieldto other export companies is a disruptive occurrence.
2.3.5 Conclusions• Farmer groups managed by a service provider such as Freshlink VMO Ltd are more successful as sustainable business entities and in meeting market requirements.• Farmer groups with well developed management and governance structures exhibit more cohe-siveness and entrepreneurial spirit that contribute towards effective implementation of the Fresh-link VMO Ltd business model.• The value chain has to recognize the efforts put in complying with the standards; otherwisethere will be no incentive for the resourceful poor and technically inadequate farmer to get com-pliant. • It has been demonstrated that Kenyan service providers, smallholder farmers, testing labora-tories, and farmer’s technical advisors can develop technical capacities to meet the stringent re-quirements of market requirements specifically on the EurepGAP standard.• A Quality Management System that centralizes key functions of crop protection products appli-cation and recording of farm production activities is more effective in meeting the requirementsof EurepGAP standard. • Small holder farmers can play a significant role in the value chain by acting as efficient and reli-able production units for the horticulture sub sector. (‘Impact assessment of EurepGAP standard on smallholder farmers involved in export horticulture-KHDP 2006).• There has to be a mechanism through which export companies are discouraged from poachingproduce and adhering to contractual agreements. • Costs of compliance are prohibitive and still no farmer group has been able to pay its way through the process without external funding.
2.3.6 Future workFurther work needs to be carried out in the Freshlink VMO Ltd business model. This should focus oncreating a financial vehicle to manage a revolving fund belonging to the farmer groups and to FreshlinkVMO Ltd, defining the policy and aims of setting up management structures to administer the fund.There is also need to analyze the costs of developing the Freshlink VMO Ltd business model. In addi-tion, Freshlink VMO Ltd needs to have a strategic plan and a business plan focusing on sustainability.
29

BREAK-OUT SESSION THREE: EMERGING METHODS OF BUSINESS SERVICE DELIVERY PRESENTERS:
1. Fred Ogana – The Business Hub Approach to Service Delivery.
2. David Sanders Mali Shambani –Business Service Delivery through Interactive Radio.
3. Christine Guchu-Katee – Delivering Profitable Market Linkages: Avocados for Oil Processing.

3 BREAK-OUT SESSION THREE: Emerging Methods Of Business Service Delivery 3.0 INTRODUCTIONBy David KnoppOver the past decade, donor practitioners have explored several ways of business service delivery. In mid 90’s rural-based business centers were a popular approach. Over-reliance on donor subsidies and heavy supply-side orientation however rendered this model unsustainable and highly distorted. Lessons from microfinance led the committee on donor agencies for Small Enterprise Development to conduct a seriesof working groups, conferences, and widespread discussions with an attempt to identify and achieve con-sensus on a more effective intervention. In February 2001, the ‘Guiding Principles for Donor Interven-tion’ were released. This introduced the BDS market development framework. This new approach indeed represents a fundamental shift in BDS donor intervention. For instance, itrecognizes BDS as largely private “goods” that are most efficiently provided within a commercial market.Small and Medium Enterprises (SMEs) are viewed as discerning consumers of BDS that are willing and able to pay for services if the product is appropriately designed, delivered, and priced. Today the primary objective of donor intervention is to improve the functioning of BDS markets, where effective supplymeets effective demand. This is achieved in two ways. First when SMEs recognize the need for a serviceand are willing to pay for it. Secondly, providers must look to MSE consumers for market signals and be able to meet their needs. Even with the acceptance of these principles, the reality of reaching down-market through the private sector has remained the main challenge for donor practitioners. Rural SMEs not only lack resources to invest in such services but often fail to realize a measurable impact on their bottom line. As a result, re-luctance to purchase such services is very common. At the service provider level, packaging and pricing a commercial service offering targeting rural SMEs is a big challenge. But to address this, delivery method-ologies have been changed to include stand-alone (fee-based) services as well as embedded service offer-ings where the cost of service delivery is “embedded” in the commercial transaction with the lead firm.The purpose of this break-out session is to examine emerging methods of service delivery in Kenya. Italso seeks to determine how donor practitioners are able to facilitate the provision of business services “down-market” while maintaining the principles of commercialization and market development. Threepresentations are made. These serve to broaden the perspective on both the means of payment and serv-ice delivery mechanisms. Fred Ogana explains the application of the business hub approach as a means of addressing concerns about quality, bulking, and marketing in the dairy sector. With the support of DFID/BSMDP, TechnoServe fa-cilitates the development of chilling plants as business service hubs. The hubs act as a “BDS broker”. Theyassist smallholder dairy farmers to access a variety of services such as feeds supply, bulking and packag-ing, market linkages and distribution, artificial insemination and extension. Others include auditing andfinancial management services. By purchasing shares, farmers become part-owners of the cooling center.Services offered through the hub are commercialized through sale of milk payable to farmers through avillage bank located within the hub. A check-off system is provided to farmers as an innovative meansof accessing hub-related services. Todate, the hub model has achieved efficiencies through economies ofscale. Every year, close to Ksh 0.5 billion is made from over 70,000 litres produced daily by 13,000 farm-ers. Financial constraints however cripple the model leading to inability of replicating similar models without seed capital. David Sanders expounds on emerging methods of BDS delivery by exploring application of interactive radio. ‘Mali Shambani’ is an example of an interactive program for smallholder farmers. It is piloted by local facilitators, FIT Resources through Kenya Broadcasting Corporation (KBC) due to its wider rural coverage. The weekly program is designed to respond to business and technical issues of rural SMEs inthe agricultural sector through guest speakers, technical discussion, and live call-in sessions. FIT Re-source employs a series of feedback loops to gauge listener response and to act as a guide to future content planning. Within the first year, the program has recorded the highest rural listenership in the country
30

with between 2.5 - 3 million listeners per week. It also acquired production profitability at the ninth week.Moving ahead FIT Resources focuses on improving content planning and the skill sets on business to business media within KBC before replicating the model to other radio stations in the country.Christine Guchu-Katee (WMG Consulting) gives a perspective on market linkages as a business service in the avocado sub sector. With support from USAID Kenya BDS Program, Christine has developed rural-based service providers that offer a market linkage service for both smallholder farmers and indus-trial scale processors for sale of grade 2 avocado fruit. Specifically, the rural based providers offer servicesrelated to bulking, projections and scheduling, monitoring of payments between producer and buyer, transportation, quality control, and marketing. To commercialize the service offering, a percentage-basedlevy is applied on the sale of all fruits acceptable by buyers. To professionalize the rural providers, Chris-tine facilitates the formation of “Agri-Outlets Company,” a rural-based firm that offers a one-stop-shopfor processors to access individual providers and source grade 2 fruit. In 2006 alone, the intervention realized total sales of 804,948 tons of fruit, and achieved a 150% increase in farm-gate price through greater competition. She is currently exploring an expansion of her service offering to incorporate othercommodities during the off-season lags.After the presentations, a number of common issues emerge. It is evident that a facilitator has a criticalrole in demonstrating value at the outset, as well as in ensuring quality standards in service delivery. Such perceived value is significant because it drives overall market development through the private sector. Anumber of interventions faced with replication or “scaling up” in other geographical areas or with other commodities are also challenged. It is however not clear to what extent this could be provided by the pri-vate sector, or if a facilitator is always required for the initial launch of an activity.
3.1 The Business Hub Approach to Service Delivery By Fred Ogana
3.1.1 IntroductionFarmer based organizations of 2000 to 6000 farmers are enabled to bulk and cool milk, in order to link them to secure wholesale buyers at contract prices and volumes. The chilling centres operate as farmer-owned business entities with independent management; they are formalized as either cooperatives or limited liability companies. These enterprises become business-hubs through which input and outputmarket needs are met. The hub is a one-stop-shop for input provider and farmers, the enterprise in returnenables easy access to credit and financial services. Payment for inputs and services is guaranteed via milksupplies.
3.1.2 Chilling Plant ModelWith funding from BSMDP, Techno Serve together with its partner Af-rican Breeders Services (ABS TCM) developed an integrated BDS servic-es input-output vortex through milk chilling plants. Service providers, African Breeders Services (ABS), fa-cilitates capacity-building in two key areas - production and animal genet-ics. On the other hand, Techno Serve is responsible for facilitating business capacity building via service provid-ers in business plan development, management systems, operations and market linkages for long-term viability. Thousands of farmers accessservices through the business hub. 31

Techno Serve evaluated the dairy sector value chain and identified lack of chilling and bulking facilitiesas the key challenge. The hub model promotes the use of business services to address and bridge servicegaps through a centralized revenue generating enterprise bulking 10,000 to 25,000 litres per day, produc-ers increase their negotiation power, reduce transaction costs for inputs and marketing, and can eliminate intermediaries in the market, thereby capturing more of the value within the value chain.With the facilitation of Techno Serve, farmers acquire an equity stake in the venture typically raising about Ksh 5 million ($65,000) for a 10,000 litre cooler. Service providers train staff and put in place necessarymanagement and operation systems - supply contracts are secured with processors. With facilitation of ABS at production level, service providers are linked to producers for provision of affordable inputs attimes on credit against milk supplies e.g. technical assistance and extension services. Additional benefitsinclude credit and savings mobilization and investment.Farmers access services through the chilling plant level (“business hub”) which reduces their transaction costs. Services reducing input transaction costs include provision of agricultural inputs on credit and at a reduced cost due to bulk purchases; technical assistance and extension services (including technical in-novation in the areas of Artificial Insemination); credit and savings mobilization and investment; and an-cillary health services. Delivery of extension services and education learning is done on a more local level based on smaller farmers’ groups. These interventions reduce farmers’ costs and increase yields throughthe farmers’ own investment in technology.
Figure 2 The Solution – Transforming Chilling plants to Business Hub
The Chilling Hub reduces marketing transaction costs by providing both a logistic channel to bulk/chillmilk and also access to wholesalers of raw milk who buy at a guaranteed volume at a fixed price. Theprice obtained by the Chilling Hub is 50% higher than that obtained by farmers working individually and volumes are twice as high. TechnoServe initial assessment has indicated that members of the cooperatives earn more than twice as much from dairy production than non-members.TechnoServe and its partner organization ABS facilitate the processes of capacity-building to the business hub organization in two key areas: business management and technical input. ABS is responsible for tech-nical assistance and TechnoServe is responsible for building the business capacity and market access of the farmers’ association, through facilitating market linkages; training association managers in management (including leadership, corporate governance, IT, taxation, finance); conducting market studies to assessthe long-term viability of different strategies including expansion and diversification into higher-valueprocessing activities; conducting portfolio analyses to identify the effectiveness of the Chilling Hub’s dif-ferent activities, and supporting outsourcing of areas identified as non-profitable to external private serv-
32
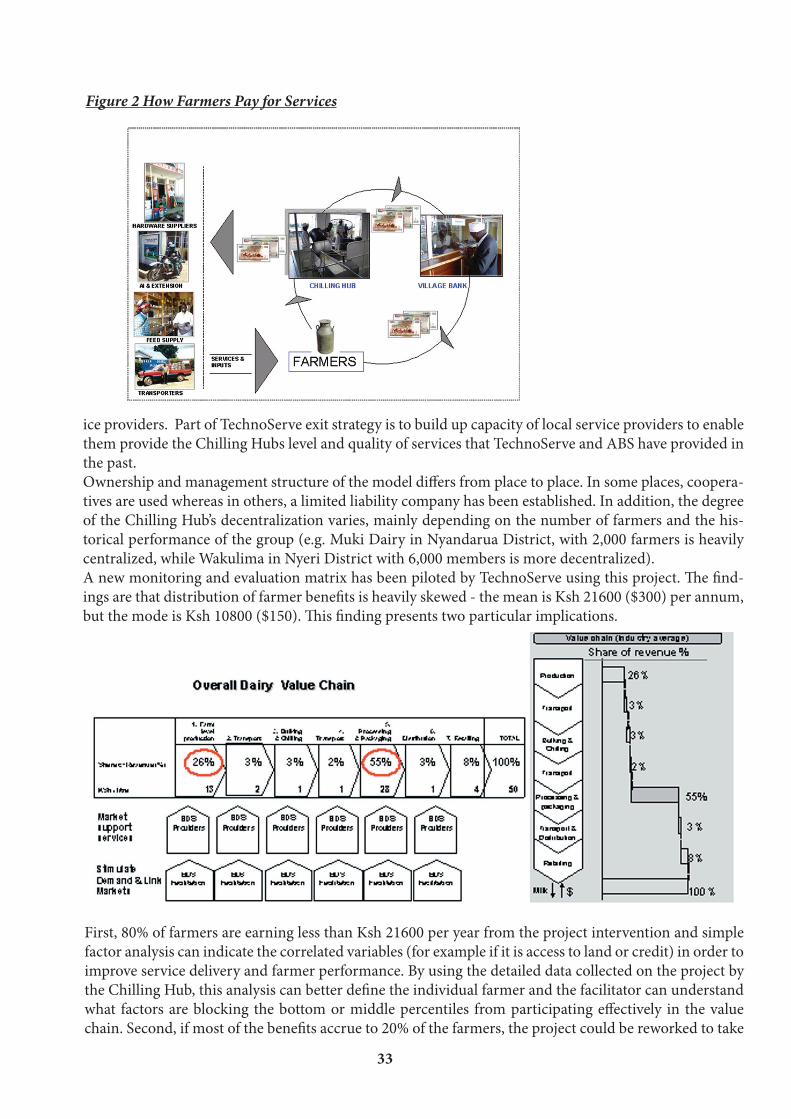
Figure 2 How Farmers Pay for Services
ice providers. Part of TechnoServe exit strategy is to build up capacity of local service providers to enable them provide the Chilling Hubs level and quality of services that TechnoServe and ABS have provided in the past.Ownership and management structure of the model differs from place to place. In some places, coopera-tives are used whereas in others, a limited liability company has been established. In addition, the degree of the Chilling Hub’s decentralization varies, mainly depending on the number of farmers and the his-torical performance of the group (e.g. Muki Dairy in Nyandarua District, with 2,000 farmers is heavily centralized, while Wakulima in Nyeri District with 6,000 members is more decentralized).A new monitoring and evaluation matrix has been piloted by TechnoServe using this project. The find-ings are that distribution of farmer benefits is heavily skewed - the mean is Ksh 21600 ($300) per annum,but the mode is Ksh 10800 ($150). This finding presents two particular implications.
First, 80% of farmers are earning less than Ksh 21600 per year from the project intervention and simple factor analysis can indicate the correlated variables (for example if it is access to land or credit) in order to improve service delivery and farmer performance. By using the detailed data collected on the project by the Chilling Hub, this analysis can better define the individual farmer and the facilitator can understandwhat factors are blocking the bottom or middle percentiles from participating effectively in the valuechain. Second, if most of the benefits accrue to 20% of the farmers, the project could be reworked to take
33

this into account. Costs can be cut back to focus outreach on the small percentage of profitable farmersand other ways developed including the other 80% in the local dairy economy (e.g. as feed-producers or processors), with parallel efforts to put in place equality-driving interventions. Ideally these marketconstraints and issues relating to access to services and inputs can be best addressed through service pro-viders linked at every level of the value chain.
3.1.3 Muki Dairy Case AnalysisMuki cooperative has direct links with its 2,000 farmer members and does not use lower-level groupings to provide services to members, except for training purposes. Key important features of the Muki set-up include the following:Distinct organizational entities and ownership structures for the different services provided to farm-ers.Muki Cooperative organizes technical assistance and extension services, agricultural inputs provision and milk collection from farmers. Muki Savings and Credit Scheme provide financial facilities for farm-ers and other members of the community. Share ownership is based on investment in SACCO. Muki Investment Company owns the tractors, real estate and Chilling plant. Mkulima, the Chilling plant and potential processing plant, is also run as a separate entity (25% part-owned by Muki Investment Com-pany and the rest by a private investor). Each entity is owned by its farmer members (who have shares in the business) and pays dividends on an annual basis. The entities pay each other at cost-recovery plusprices for the services rendered and coordinate responses to changing farmer needs. For example, Muki Cooperative pays Mkulima for chilling and bulking, pays Muki Investment for the use of offices and trac-tors, and then pays the farmers via SACCO.Oversight Mechanisms in placeSeparating the different services provided to farmers into different business entities is a deliberate risk-management strategy on the part of the Chilling Hub to enhance peer oversight and reduce the risk of collapse of the entire structure (as has happened in previous attempts with cooperatives in Kenya). Monthly reporting and transparent communication is in place. A supervisory committee is set up, con-sisting of an internal auditor and farmers’ representatives who assess performance of the management team of each entity, in particular its implementation of the by-laws and decisions of AGMs. Joint com-mittees of the management teams of the four entities also meet together regularly.Financing mechanismsThe farmers have access to monthly advances from SACCO underwritten by Muki Cooperative based onwhat they have produced that month. They also have access to borrow three times their savings if theyare members and are underwritten by another member who has shares in the SACCO of a sufficient levelas collateral. The loans are capped at Ksh 500,000 (over $5,000) and are paid back over a maximum of48 months. Since Muki Cooperative pays farmers through their accounts at SACCO, there is a very low default rate.
3.1.4 ReplicationThe model is being replicated in Western Kenya with some modifications because of negative experiencesof farmers with farmer cooperatives and other forms of associations. There, the project aims to identifyand support innovators and early-adopters and use their success as demonstration of the benefits of asso-ciation. The key to success of this model will be the effectiveness of the incentive systems being designedby TechnoServe to encourage the innovators to adopt an appropriate BDS model.
3.1.5 Lessons• The dairy value chain analysis identified a potential for small farmers to appropriate significantparts of the value chain by selling directly to processors and cutting out middlemen, and in the future by processing the milk themselves. • Profitability of the Chilling Hub depends heavily on the value added to farmers. In the case ofMuki, the cooperative can take a 6% overhead charge to cover its costs.• According to Cooperative leaders, there are risks involved with using intermediary organizations
34

(like farmer-based subgroups). This is because Chilling Hubs need to have a distinct relationshipwith each of the farmers instead of this being mediated through a group leader. If the business model only works at a certain level, then the members need to be loyal to that level. The loyalty thatis developed through value-added services provided by private sector BDS providers (e.g. input supplies, extension, micro-credit, etc) should be directed towards the institution that has realized these gains, rather than an intermediary group.• Separating different functions of the association into distinct business entities has oversight ad-vantages and also enables the management team of each business unit to focus on enhancing serv-ices they are responsible for and identify cost drivers.• BDS consumers are willing to adopt and pay for services provided their benefits are clearly un-derstood and have a direct contribution to revenue creation.• Extension services should largely remain embedded to major service streams and not sold sepa-rately as a means to stimulate demand. • Changing strongly-held business mind-sets, such as expecting subsidies from NGOs, and shift-ing paradigms is not an event but a process. As such, ample time should be allocated for change of business practice and adoption.
3.1.6 ResultsAn assessment of more than 12,000 smallholder pro-ducers shows that this intervention by Techno Serve in Kenya has improved access to services by dairy chilling plants resulting in establishment of a replica-tion model popularly known as the “Business Hub” model. Due to successful development and imple-mentation of the project, the donor is in the process of contracting TechnoServe Kenya to replicate the same model in Western Kenya.Different sites have unique business environments,thereby requiring adoption of customized strategies, as illustrated above. The consortium has learnt thatunder weak competitive environments, farmers have options of accessing BDS services via the business hub as demonstrated at Muki Dairy alongside inefficient providers. Where there is strong com-petitive environments, busi-ness hub starts off as theideal link to farmers, thereby setting delivery standards and slowly phasing out and leaveing the markets for the more competitive private providers as witnessed at the Wakulima Dairy site. Conse-quently it is not true that all services are best outsourced to BDS providers at the onset of all BDS projects.
3.1.7 Risks in the modelThe success of TechnoServe’sexit plan (hence sustainabil-ity of the model after Tech-noServe leaves) depends on the quality and cost of the services by BDS providers. If these are sub-par, there is risk that the associa-
35
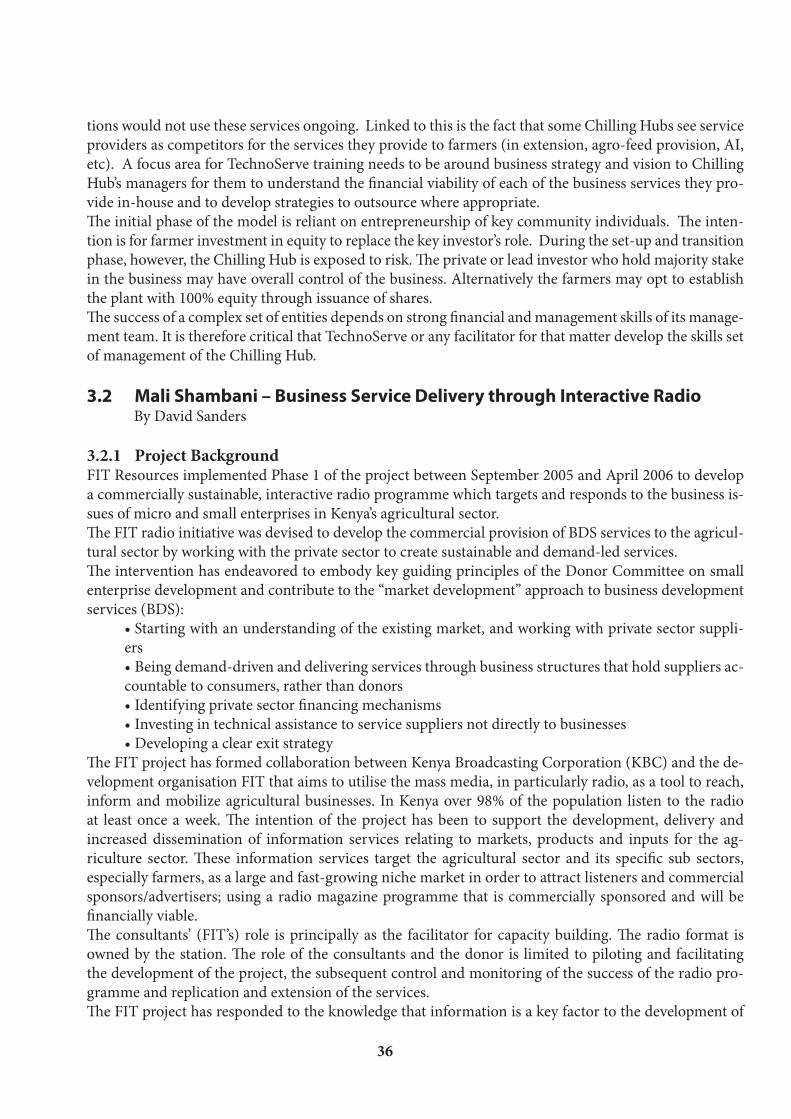
tions would not use these services ongoing. Linked to this is the fact that some Chilling Hubs see service providers as competitors for the services they provide to farmers (in extension, agro-feed provision, AI, etc). A focus area for TechnoServe training needs to be around business strategy and vision to Chilling Hub’s managers for them to understand the financial viability of each of the business services they pro-vide in-house and to develop strategies to outsource where appropriate.The initial phase of the model is reliant on entrepreneurship of key community individuals. The inten-tion is for farmer investment in equity to replace the key investor’s role. During the set-up and transition phase, however, the Chilling Hub is exposed to risk. The private or lead investor who hold majority stakein the business may have overall control of the business. Alternatively the farmers may opt to establish the plant with 100% equity through issuance of shares.The success of a complex set of entities depends on strong financial and management skills of its manage-ment team. It is therefore critical that TechnoServe or any facilitator for that matter develop the skills set of management of the Chilling Hub.
3.2 Mali Shambani – Business Service Delivery through Interactive Radio By David Sanders
3.2.1 Project Background FIT Resources implemented Phase 1 of the project between September 2005 and April 2006 to develop a commercially sustainable, interactive radio programme which targets and responds to the business is-sues of micro and small enterprises in Kenya’s agricultural sector.The FIT radio initiative was devised to develop the commercial provision of BDS services to the agricul-tural sector by working with the private sector to create sustainable and demand-led services. The intervention has endeavored to embody key guiding principles of the Donor Committee on smallenterprise development and contribute to the “market development” approach to business development services (BDS):
• Starting with an understanding of the existing market, and working with private sector suppli-ers • Being demand-driven and delivering services through business structures that hold suppliers ac-countable to consumers, rather than donors• Identifying private sector financing mechanisms• Investing in technical assistance to service suppliers not directly to businesses• Developing a clear exit strategy
The FIT project has formed collaboration between Kenya Broadcasting Corporation (KBC) and the de-velopment organisation FIT that aims to utilise the mass media, in particularly radio, as a tool to reach, inform and mobilize agricultural businesses. In Kenya over 98% of the population listen to the radio at least once a week. The intention of the project has been to support the development, delivery andincreased dissemination of information services relating to markets, products and inputs for the ag-riculture sector. These information services target the agricultural sector and its specific sub sectors,especially farmers, as a large and fast-growing niche market in order to attract listeners and commercial sponsors/advertisers; using a radio magazine programme that is commercially sponsored and will be financially viable.The consultants’ (FIT’s) role is principally as the facilitator for capacity building. The radio format isowned by the station. The role of the consultants and the donor is limited to piloting and facilitatingthe development of the project, the subsequent control and monitoring of the success of the radio pro-gramme and replication and extension of the services. The FIT project has responded to the knowledge that information is a key factor to the development of
36

the agricultural sector, and that farmers have access to only adhoc information sources leaving rural folk with little or no media voice to express their needs and desires. Over 6 million smallholder farmers in Kenya represent the single largest identifiable consumer group and are the largest single segment forthe purchase of consumer goods and services and agricultural input supplies. In addition to the farming sector as an employer, there are a large number of additional businesses which rely upon the sector such as transporters, packaging companies, brokers and input suppliers. This represents an audience of somepotential 6-12 million listeners or customers across the country.Prior to this intervention radio stations in Kenya have failed to see and identify ways that they can target the agricultural market, harness advertising revenue and generate profit from the sector. Consequentlythere has been little market development in the business to business marketplace. The agricultural serv-ice market makes up less than 3% of all above line advertising revenue, despite over 20% of the popula-tion being involved directly in farming. The agricultural market is the most important market segmentin Kenya, it is understood that sponsors/advertisers are anxious to reach that market, and radio is an effective way to do so.
3.2.2 The research phaseBefore the commencement of the pilot phase of the FIT project a detailed research initiative was un-dertaken by FIT with the support of Research International, between Dec 2004 and March 2005. Thisrepresented the first stage in the FIT initiative and was fundamental in the identification of:Basic audience information needs and preferred media formats. This information was used to deter-mine which station and time the programme should be broadcast and helped to determine the focus sub sectors, the programme clock and sectoral content. KBC proved to be the strongest rural provider, and the station most open to the proposed initiative that fulfilled the criteria required by the project be-yond outreach and potential impact of existing programming: such as existing relationship with target audiences, national office presence, existing internal infrastructure, network infrastructure, productioncommitment, sales commitment, management commitment, scheduling commitment and marketing commitment.The information available pertinent to the agricultural sector and where and in what format that in-formation is held. This information assisted the project to identify key content providers for the pro-gramme and initiate MOUs with 10 start-up partners across a range of sub sectors. Many more informal relationships have also been developed.The scale of existing and potential advertising revenue in the agricultural sector. This information as-sisted the sales and marketing team to target existing and potential advertisers and sponsors for the programme and seal deals with a small number of input suppliers.Which service providers and which business models would be of best use to delivering sustainable val-ue. This information assisted in determining which radio station FIT would work with based on theircapacity and interest and how best to partner and using what approaches and support components.As a result Memoranda of Agreements and a detailed Monitoring and Evaluation Plan were draftedwith KBC, the primary service provider and and external research agency.
3.2.3 The Project ModelThe model involves the building of an information architecture which has radio at the centre. The keyplayers include; service providers (radio stations), content providers (from the development, govern-ment and commercial sectors), advertisers (both commercial and non commercial) and the audience.The diagram below provides a snapshot of the linkages between various project components.
37
Note that in the diagram, the consultants’ role is principally as the facilitator for capacity building. Theradio format is owned by the appropriate station (s). As such it is intended that the program become financially sustainable as quickly as possible. The role of the donor is ‘invisible’. The donor’s function is as a support mechanism whilst the format builds sustainable audience and revenue.
3.2.4 Monitoring and Evaluation FrameworkA key success benchmark for the programme is on how ‘close’ it becomes to its audiences. For content to become demand driven, it is essential that a sustainable framework is created to regularly interro-gate listeners and content providers in order to consistently check programme quality and relevance and inform the production team of the most appropriate future content. This comprises a combina-tion on air direct feedback coupled with weekly panel research and periodic focus groups and case study tracking. The emphasis is on providing a holistic picture of listener ship performance and valueassessment. For example, the result of weekly tele-research panel is cross-referenced against the peri-odic research battery to provide a strong control mechanism. The diagram below provides an indica-tion of this framework.
38
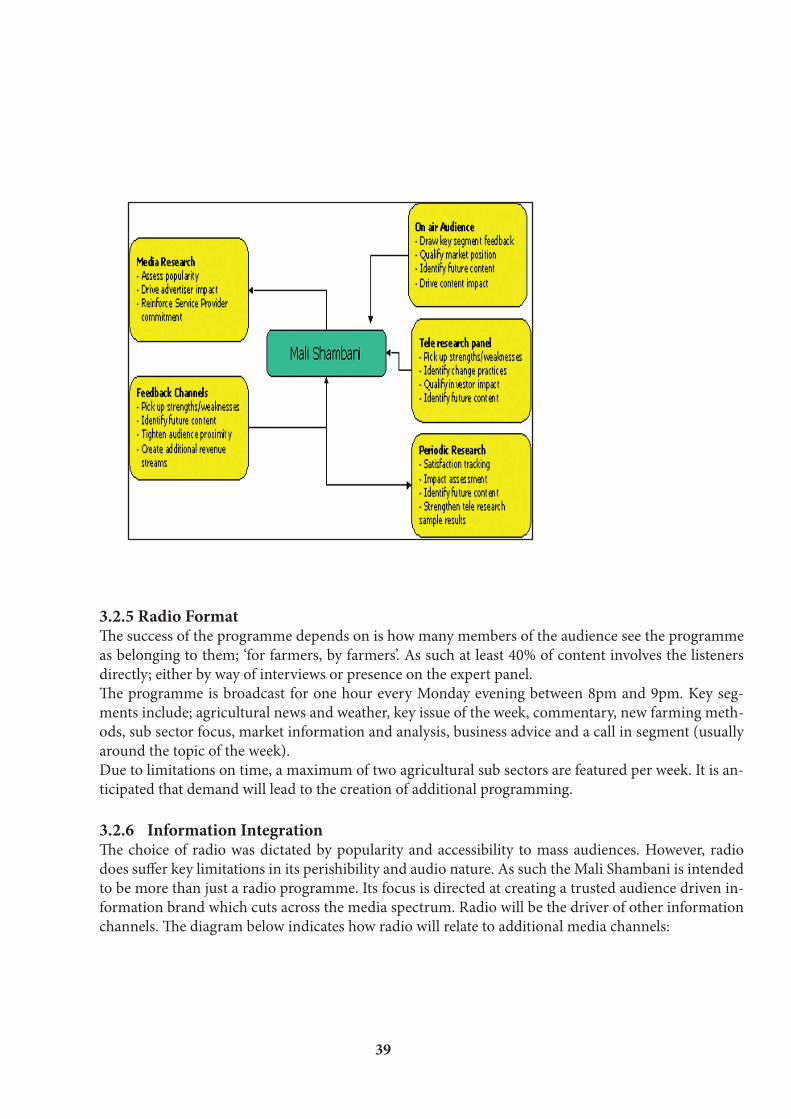
3.2.5 Radio FormatThe success of the programme depends on is how many members of the audience see the programmeas belonging to them; ‘for farmers, by farmers’. As such at least 40% of content involves the listeners directly; either by way of interviews or presence on the expert panel. The programme is broadcast for one hour every Monday evening between 8pm and 9pm. Key seg-ments include; agricultural news and weather, key issue of the week, commentary, new farming meth-ods, sub sector focus, market information and analysis, business advice and a call in segment (usually around the topic of the week). Due to limitations on time, a maximum of two agricultural sub sectors are featured per week. It is an-ticipated that demand will lead to the creation of additional programming.
3.2.6 Information IntegrationThe choice of radio was dictated by popularity and accessibility to mass audiences. However, radiodoes suffer key limitations in its perishibility and audio nature. As such the Mali Shambani is intendedto be more than just a radio programme. Its focus is directed at creating a trusted audience driven in-formation brand which cuts across the media spectrum. Radio will be the driver of other information channels. The diagram below indicates how radio will relate to additional media channels:
39
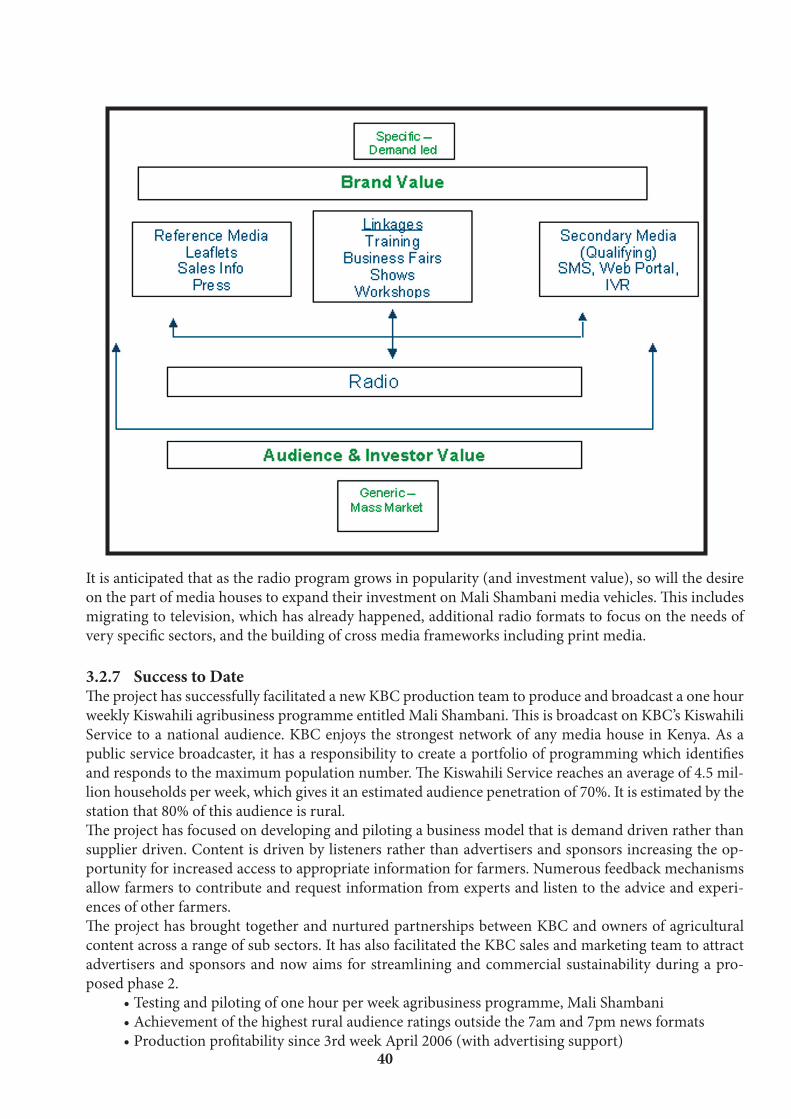
It is anticipated that as the radio program grows in popularity (and investment value), so will the desire on the part of media houses to expand their investment on Mali Shambani media vehicles. This includesmigrating to television, which has already happened, additional radio formats to focus on the needs of very specific sectors, and the building of cross media frameworks including print media.
3.2.7 Success to DateThe project has successfully facilitated a new KBC production team to produce and broadcast a one hourweekly Kiswahili agribusiness programme entitled Mali Shambani. This is broadcast on KBC’s KiswahiliService to a national audience. KBC enjoys the strongest network of any media house in Kenya. As a public service broadcaster, it has a responsibility to create a portfolio of programming which identifiesand responds to the maximum population number. The Kiswahili Service reaches an average of 4.5 mil-lion households per week, which gives it an estimated audience penetration of 70%. It is estimated by the station that 80% of this audience is rural. The project has focused on developing and piloting a business model that is demand driven rather thansupplier driven. Content is driven by listeners rather than advertisers and sponsors increasing the op-portunity for increased access to appropriate information for farmers. Numerous feedback mechanisms allow farmers to contribute and request information from experts and listen to the advice and experi-ences of other farmers. The project has brought together and nurtured partnerships between KBC and owners of agriculturalcontent across a range of sub sectors. It has also facilitated the KBC sales and marketing team to attract advertisers and sponsors and now aims for streamlining and commercial sustainability during a pro-posed phase 2.
• Testing and piloting of one hour per week agribusiness programme, Mali Shambani• Achievement of the highest rural audience ratings outside the 7am and 7pm news formats• Production profitability since 3rd week April 2006 (with advertising support)
40
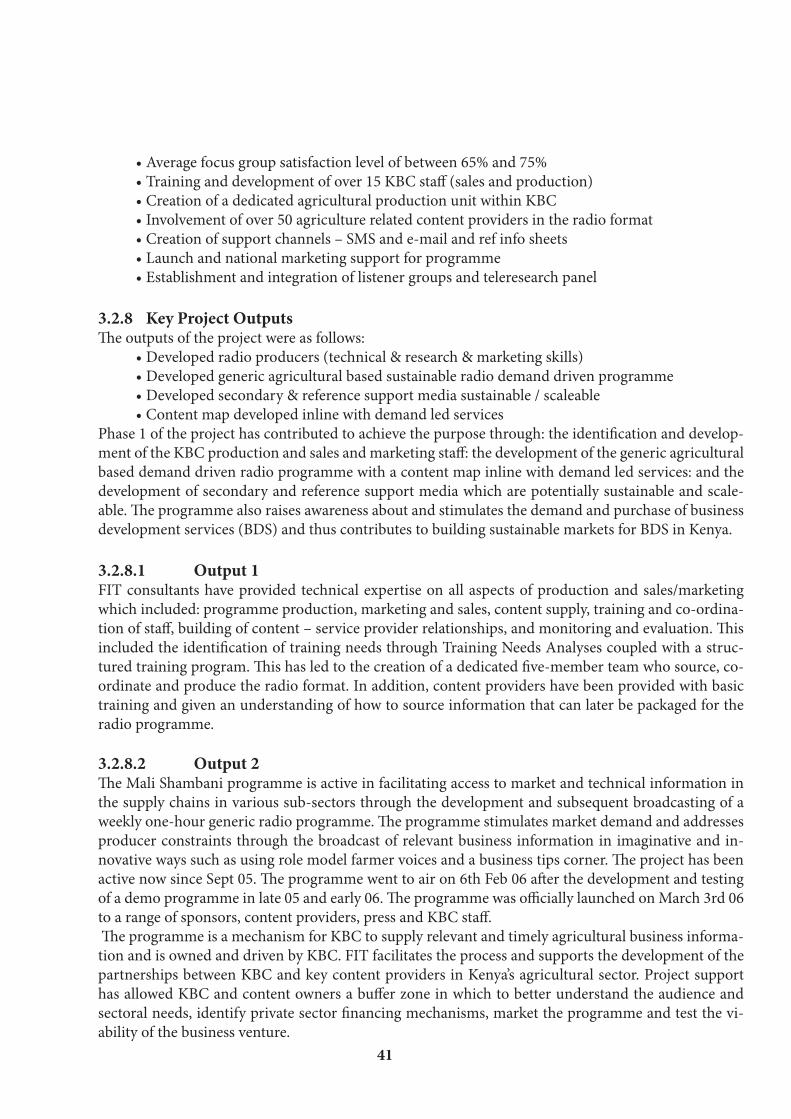
• Average focus group satisfaction level of between 65% and 75%• Training and development of over 15 KBC staff (sales and production)• Creation of a dedicated agricultural production unit within KBC• Involvement of over 50 agriculture related content providers in the radio format• Creation of support channels – SMS and e-mail and ref info sheets• Launch and national marketing support for programme • Establishment and integration of listener groups and teleresearch panel
3.2.8 Key Project OutputsThe outputs of the project were as follows:
• Developed radio producers (technical & research & marketing skills)• Developed generic agricultural based sustainable radio demand driven programme• Developed secondary & reference support media sustainable / scaleable• Content map developed inline with demand led services
Phase 1 of the project has contributed to achieve the purpose through: the identification and develop-ment of the KBC production and sales and marketing staff: the development of the generic agriculturalbased demand driven radio programme with a content map inline with demand led services: and the development of secondary and reference support media which are potentially sustainable and scale-able. The programme also raises awareness about and stimulates the demand and purchase of businessdevelopment services (BDS) and thus contributes to building sustainable markets for BDS in Kenya.
3.2.8.1 Output 1FIT consultants have provided technical expertise on all aspects of production and sales/marketing which included: programme production, marketing and sales, content supply, training and co-ordina-tion of staff, building of content – service provider relationships, and monitoring and evaluation. Thisincluded the identification of training needs through Training Needs Analyses coupled with a struc-tured training program. This has led to the creation of a dedicated five-member team who source, co-ordinate and produce the radio format. In addition, content providers have been provided with basic training and given an understanding of how to source information that can later be packaged for the radio programme.
3.2.8.2 Output 2The Mali Shambani programme is active in facilitating access to market and technical information inthe supply chains in various sub-sectors through the development and subsequent broadcasting of a weekly one-hour generic radio programme. The programme stimulates market demand and addressesproducer constraints through the broadcast of relevant business information in imaginative and in-novative ways such as using role model farmer voices and a business tips corner. The project has beenactive now since Sept 05. The programme went to air on 6th Feb 06 after the development and testingof a demo programme in late 05 and early 06. The programme was officially launched on March 3rd 06 to a range of sponsors, content providers, press and KBC staff. The programme is a mechanism for KBC to supply relevant and timely agricultural business informa-tion and is owned and driven by KBC. FIT facilitates the process and supports the development of the partnerships between KBC and key content providers in Kenya’s agricultural sector. Project support has allowed KBC and content owners a buffer zone in which to better understand the audience andsectoral needs, identify private sector financing mechanisms, market the programme and test the vi-ability of the business venture.
41

A key driver of radio content is the building of content owner relationships. Contest providers were ac-tive during the testing of the pilot and development of the farming calendar plus the talk back sessions and planning sessions. In addition each content provider has completed a detailed profile. Contentproviders have been canvassed regularly for information and support and kept fully up to date with the initiative.In order to develop the finished format a pilot programme was created with full imagery (jingles, pro-mos) and pre tested at focus group level. Results of testing were incorporated into the programme when it went live.
3.2.8.3 Output 3The radio programme has been highly supported by the development and implementation of a detailedmarketing plan and campaign. This plan was designed by the sales, marketing and production teamswith facilitation from FIT.Tactical components of the plan included; above line advertising in print media and an extensive on air promotional schedule across other radio programmes within KBC. In addition, a range of sales promo-tion merchandise was created to visualize the brand. This included banners, clothing and other acces-sories. These were primarily distributed to content providers, advertisers and to the audience through aseries of targeted road shows as well as being given away as rewards on air.
3.2.8.4 Output 4The project models aims to develop a complete information framework against which audiences cannot only access the information they need but also choose the mechanism by which the information is delivered. The next phase of this project focuses on building the additional components which willinclude; use of mobile/digital telephony (SMS/IVRS), development of reference media spin offs suchas newspaper supplements and the use of the internet through the development of a web site/portal. This not only adds value for the audience but also stimulates new opportunities for additional serviceproviders and investors who themselves have the chance to build a more integrated messaging system for their marketing objectives.
3.2.9 Challenges/Lessons LearntThere were a number of challenges facing the project:
• Working with a broadcaster in change. The project took longer to come to market due to thelack of commercial awareness in the concept on the part of broadcaster.• Training of production and sales staff took longer than an anticipated due to the change inworking practices demanded by the project.• The advertising support was slower than anticipated due to the requirement of developing busi-ness to business relationships and due to the lack of robust media research architectures.• A generic agri-format is not strong enough to cover the needs of all the important agricultural sub sectors in Kenya. The audience needs more about less. For the next stage a sub sector specificprogramme will be developed (dairy).• The content providers were not in general as enthusiastic about involvement. This was due to a lack of commercial relationship with them during this phase. • A key requirement for the next stage will be the project’s ability to move from awareness gen-eration to driving transactional relationships i.e. ensuring maximizing impact as a result of the content broadcast.
3.2.10 The Next StageThe next step in the process is to scale up the process by reinforcing the strength of the existing initia-tive and looking to create additional media formats. In this case, the first new programme will cater to
42
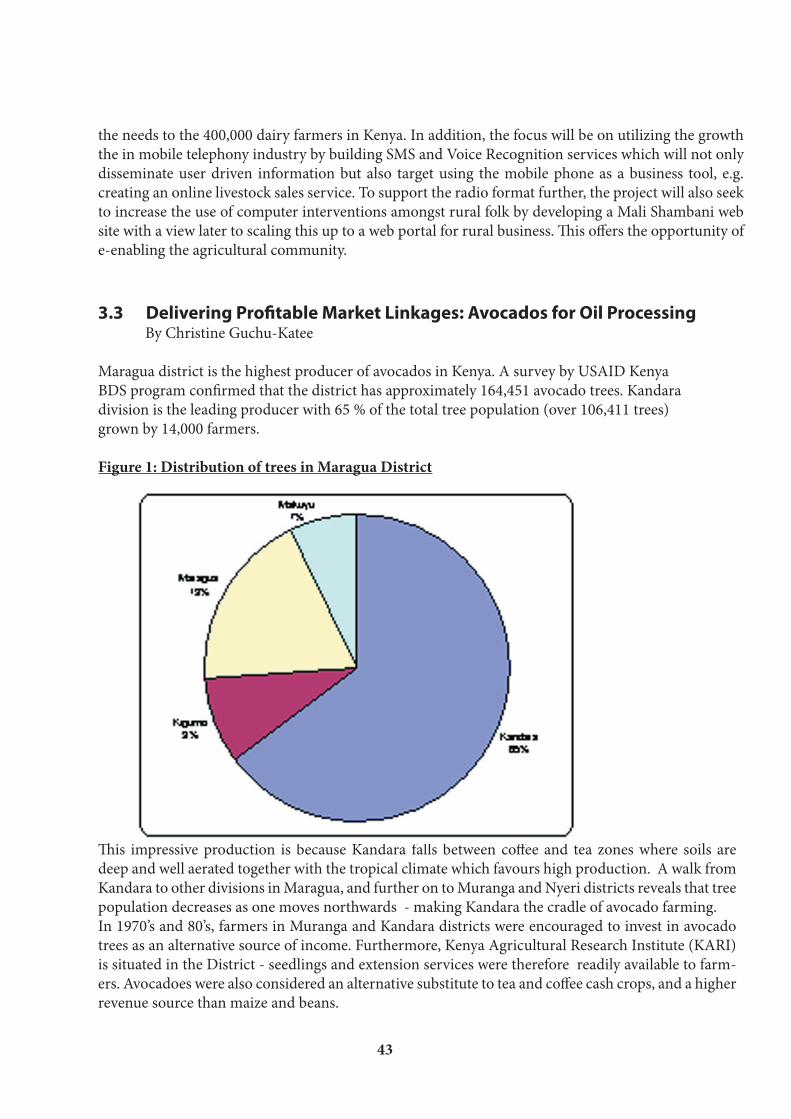
the needs to the 400,000 dairy farmers in Kenya. In addition, the focus will be on utilizing the growth the in mobile telephony industry by building SMS and Voice Recognition services which will not only disseminate user driven information but also target using the mobile phone as a business tool, e.g. creating an online livestock sales service. To support the radio format further, the project will also seek to increase the use of computer interventions amongst rural folk by developing a Mali Shambani web site with a view later to scaling this up to a web portal for rural business. This offers the opportunity ofe-enabling the agricultural community.
3.3 Delivering Profitable Market Linkages: Avocados for Oil Processing By Christine Guchu-Katee
Maragua district is the highest producer of avocados in Kenya. A survey by USAID KenyaBDS program confirmed that the district has approximately 164,451 avocado trees. Kandaradivision is the leading producer with 65 % of the total tree population (over 106,411 trees) grown by 14,000 farmers.
Figure 1: Distribution of trees in Maragua District
This impressive production is because Kandara falls between coffee and tea zones where soils aredeep and well aerated together with the tropical climate which favours high production. A walk from Kandara to other divisions in Maragua, and further on to Muranga and Nyeri districts reveals that tree population decreases as one moves northwards - making Kandara the cradle of avocado farming.In 1970’s and 80’s, farmers in Muranga and Kandara districts were encouraged to invest in avocado trees as an alternative source of income. Furthermore, Kenya Agricultural Research Institute (KARI) is situated in the District - seedlings and extension services were therefore readily available to farm-ers. Avocadoes were also considered an alternative substitute to tea and coffee cash crops, and a higherrevenue source than maize and beans.
43

However, and unlike in tea and coffee, marketing of avocadoes has been unstructured and farmers relyon middle men with thier poor prices and unreliable markets. By the time Kenya BDS program came to the scene, avocado trees had been left unattended for years and were now more like shade trees (over-grown and bushy) than a commercial cash crop. Production levels were dormant with many farmers cutting down trees to pave way for more productive crops like maize and beans. This paper elaborates the intervention introduced by USAID KBDS-Avocado Oil Processing Program(AVOPP) in the highest avocado production zone in the country. By creating sustainable market linkage service providers, the program sort to overcome the marketing constraints of second grade avocado fruit for smallholder farmers.
3.3.1 Constraining Factors at the Farmer LevelAt the production level, there are several constraining factors facing smallholder farmers.These include:
• Size of the farms: average land size is one hectare per household which affects the number oftrees per farm as other competing crops and immediate subsistence needs must be met. This af-fects economies of scale and capacity to increase volumes or improve on quality;• Neglected and over grown trees that have become dormant over the years, or reduced produc-tion levels to non-commercial levels;• Technology and knowledge on how to improve the levels of production both in terms of quality and quantity;• Limited financial capacity to invest in improvements and lack of alternative sources of incomefor investment;• Available and ready market which is typically dominated by brokers offering an unreliable mar-ket at poor, speculative prices.
While interventions are possible - and are actually in place for export fruit for all the constraints men-tioned above - the AVOPP focuses on market availability and access for grade two fruit. This is where theparadox begins - the problem is not simply ‘the market’ but access to it in terms of convenience, under-standing the market needs, organizing the logistics and getting the fruit to the market.
3.3.2 Marketing ConstraintsAs of May 2005, three industrial-scale avocado oil processors commenced operations with acombined capacity of crushing more than 80 tons of fruits a day. The term “we will buy all thefruit you can supply” echoes a familiar story among honey processors in Kenya three years ago who wanted to purchase “all the honey the farmers could produce”. and just like in avocado, the farmers could never supply enough honey. The marketing limitations are elaborated below:
44
Figure 1: SME Constraints

• Low Individual Production Levels: most SMEs own less than 5 trees which reduces their capac-ity to negotiate for orders or better prices, or even reach economies of scale to manage the farms as viable businesses.• Bulking: Limited capacity to bulk or provide substantial amounts of fruit either as individuals or as marketing units in groups. This includes the capacity to schedule fruit collection to a centralmarket place, quality control and assurance to processors.• Transporting: Finding and negotiating with a transporter, providing advance payments, pro-viding a guarantee on adequate workload and a payment schedule and developing and maintain-ing a long term relationship.• Payments: Invoicing the processor, cheque collection, banking, and distribution to farmers. Sometimes SMEs prefer cash payments because of limited confidence with the buyer.• Negotiating for next order: Maintaining contact with processors and consistently delivering agreed quantities.• Preparation for next season - limited capacity to expand, either the orchards, the number of participants in marketing units or through efficiencies of the operations.
These constraints have resulted in poor marketing channels, where farmers depend on ‘freelance’ buy-ers commonly known as brokers who also face similar constraints and thus offer low prices, unreliablecollection schedules, and rejected fruits are often left as waste. middlemen buy at Ksh 1 per piece foran export fruit and Ksh 1 per kilogram of grade II fruit. For the second grade fruit, prices could also be negotiated in “heaps of fruit”.
3.3.3 Our Solution: A Profitable Market - Link BusinessTo address the above constraints, AVOPP has designed two systems for bulking, transporting and processing payments through a network of commercial group management officers and a commercial-ized market-linkage business structure.
3.3.3.1 Commercial Group Management OfficersCommercial Group Management Officers (GMO) are locally hired business service providers respon-sible for developing a relationship with farmers for purposes of off-loading their fruit, and with proces-sors to deliver mature avocado fruits in bulk for oil processing. The GMOs provide a bridge betweenthe farmers and processors and are responsible for quality control and quantity assurance to enable the processors receive substantial volumes of fruit throughout the season, consistently. The value of market linkage business is that this arrangement should be profitable for all parties in-volved. For the farmers this is market assurance throughout the season, improved prices and structured picking and delivery of only correct (mature) fruits. For processors, it is a consistent supply of mature fruits in an orderly and structured system. For the GMOs it presents a source of income.The role of the GMO is invaluable in ensuring smooth operations of the entire business process. Theseinclude:
• Scouting and zoning: Their first task is to scout, survey and map production areas so as assessthe number of trees in a location and the capacity to support the required workload of a CO. Thisis followed by awareness raising and sensitization campaigns through meetings with leaders, dis-trict officers, extension staff and local administration, and through farm visits and distribution of posters to relevant institutions.• Group Formation: They are expected to identify and form producer SMEs into marketinggroups of 25-35 members with a minimum of 150 trees per group. This is done with assistancefrom local chiefs and extension officers from the Ministry of Agriculture. To ease group manage-
45
ment and coordination, the GMO organizes each group into production clusters of five personseach, based on their neighborhoods (close proximity). Once a group is in place by having consist-ent members, production clusters and leadership, a bank account and are registred by the Ministry of Culture and Social Services, the group is registered with the program. A census of actual trees in group is taken and the expected production capacity of the group is recorded into a database. Thisis important for future projections and providing fruit estimates to processors.• Collection Centres: GMOs identify and establish centralized collection centres based on the clusters or neighbourhoods per group and distances between each cluster as avocado is a bulky commodity. This is done jointly with the group members to especially determine the most central-ized collection points for each production cluster, and the overall number of collection points. For the business to deliver a large proportion of the market demand, designated collection centres are placed in prime production areas, with the objective of tapping farmers who are not in groups. These collection centres are a base for farmers to drop off their fruits. For farmers, the most at-tractive aspect of the collection centres is an available and reliable drop-off point for their fruits(irrespective of the quantity available) and the cash payment. • Projections: During harvesting seasons, GMOs provide projections on expected fruit tonnage for each processor two weeks in advance to facilitate planning for the processors and to ensure a smooth supply system. This information is also critical for formalizing collection logistics withtransporters, as well as assisting farmers to manage their cash flow.• Transport Coordination: As part of the terms of reference, GMOs identify local transporters with reliable trucks who will negotiate with the program on delivery schedules and mode of payment. Fruit collection and delivery schedule are also provided in advance to the transporters, including a 10-20 % mobilization fee. A business relationship is already in place with several transporters from Maragua and Thika which worked well in the previous season. • Fruit Collection and Delivery: GMOs then supervise the actual collection process of fruits at each site, which entails weighing and recording of kilograms delivered by each farmer and quality control to ensure that the fruits are mature and of the grafted variety (which is the best for maxi-mum oil content). This process is undertaken for each farmer and at each collection centre untilall fruits are quality checked, weighed and loaded for delivery to the processor where it is weighed again. • Payments: After the delivery, GMOs, with the group leaders, calculate the dues to each farmerand per group, management fees due and transportation costs. An invoice is then sent to the proc-essor for payment. Cheques are collected and banked the same day the invoice is delivered (on rare occasions, there is a delay of one week). The GMOs then oversee payment of individual groupmembers to ensure transparency and fairness and address any issues that arose during delivery.
3.3.3.2 CommercializationIn designing commercialization business, the basic question was “how can we make money from mar-keting avocadoes?” Our solution is based on four parameters: (i) establishing a business entity, (ii) volumes, (iii) price, (iv) an efficient management structure and fee, and (v) a network of commercialofficers.Establishing a business entityThe first task was to establish a business entity to “develop a strategy and operate commercially”. Thiswas part of the overall AVOPP program strategy - to ultimately commercialize the business development services. Agri Outlets Company was registered as a business entity with the main objective of marketing agricultural produce in rural areas, initially targeting avocado fruits from Maragua, Thika and Murang’adistricts. The target is to market the two grades of avocadoes with grade I being supplied to specifiedexporters, while the remaining grade II (which is the bulk) is supplied to oil processors such as Avo Oil Industries, Ruiru Natural Oils and Sunny Processors. The business operations are located at Kenol
46

market in Maragua district, which is a central convergence for the three districts, thus enabling a good linkage to both farmers and the market. The Business Entity has the following aims (under oil processing)
• To become a respected and commercialized marketing company for avocado in the District and beyond.• To become a respected supplier for Grade 2 avocado among the processors.• To be a trusted and respected marketing outlet among avocado farmers.Volumes
The processors needs are simple and straightforward - though not as simple to fulfill. Each processorrequires approximately 20-40 tons of fruits delivered daily. Fruits must be non-export, therefore grade 2 quality and fully matured and delivered to the processing plant. Based on the above and from experi-ence, the Agri Outlets Company targets to supply 20 % of fruit in the coming season (2007) and increase supply to 40 % by the third year. During the current season, a total of 500,000 kgs were supplied directly and 394,000 kgs indirectly. This was approximately 10 % of the processor’s requirements.
The business strategy involves sourcing for quality (mature) oil fruits through three distinct approach-es: establishment of collection centres, forming avocado business groups and facilitating farmer train-ing and development targeting larger avocado orchards of 30 trees and above.PriceThe current price of fruits at the factory is between Ksh 5 - 6. Some processors and ‘big brokers’ havepaid as high as Ksh 7 at some point in the season. If larger volumes can be achieved, negotiating power for a better price will be strengthened. The target price for 2007 is Ksh 6.50.An efficient management structure and feeAs discussed above, an important factor in management of the commercial entity is the efficienciescreated at the outreach level and getting as many farmers (trees) into a business relationship, accurate projections, efficiencies within the collection centres, transport coordination, deliveries and payments.Management fees are negotiated annually with farmers in the groups and with the processors. In the 2006 season, a levy of 35 cents was charged but only to farmers - which was not adequate to break even. A similar management fee will be negotiated with processors (or the increase in price to Ksh 6.50 ) to enable the business entity to break even by the end of July 2007. Discussions have been held with the three processors who have agreed to a fee on top of the price offered.
47

A network of commercial officersAs commercial officers are an important element in the business, their selection, training and per-formance is critical. In this regard, the business takes time in selecting the team, orientation, training and mentoring. During the selection process, officers are sought from within the production areas(and recently externally). They must be O level graduates who have undertaken local activities withinthe community in the recent past. All officers are expected to have entrepreneurial interests, goodcommunication skills to effectively communicate with a diverse group of stakeholders, be team play-ers, are respected within the community and are dynamic. The assessment process during selectionand interviews focuses on characters and achievements to date, rather than on years of experience. Once recruited, officers undergo an orientation process where the business concept, principles andoperation procedures are explained in detail and the roles of different players elaborated. The officersare also provided with administrative protocols as a guide and to create uniformity in the messages and systems implemented. Thereafter, weekly meetings are held which are review sessions and opportunities for mentoring offic-ers. The weekly meetings provide an opportunity for tracking progress, constraints and achievementsand monitoring performance of each officer, and therefore the business entity. Residential training isundertaken annually covering facilitation skills, a review of the business processes and commercial aspects. Training aims to impart management skills to the entrepreneurial officers.From the next season, COs will be remunerated on a monthly basis, and based on the amount of fruits delivered. Since payment will be based on amount of produce sold to the processors, with in-creased income as the motive, it is envisaged that the entrepreneurial officer will only ensure maxi-mized outreach and optimal performance. From the last season’s deliveries, a commercial payment scheme would have earned twice the salary based on the season’s deliveries.
3.3.4 Challenges and LessonsInitially farmers considered the commercialization fee charged as extra taxation on their profits.However through group discussions, this was resolved and farmers see it as a necessary fee in the supply relationship with processors. The processors have not fully appreciated the service providedby the program, mainly because brokers still supply more volumes than the groups. Currently, the groups only supply about 10% of the processors’ needs. Finding and retaining commercial officers isa key challenge, especially after introducing the commercialization approach. This is mainly becauseKenyan education system glorifies employment with a guaranteed salary, rather than self employ-ment. As a result, the business is recruiting officers from beyond the District.
3.3.5 Conclusion The previous AVOPP program led to improved incomes to farmers. Due to increased incomes andactivities in the sector, attitudes towards avocado farming is slowly changing, with farmers acknowl-edging its potential as a business enterprise. As a result, orchard management has improved in exist-ing farms, grafting old non-commercial trees is on going and those with farm capacities are plantingmore trees.The introduction of a more organized, fair and transparent channel of marketing farmers produce hascreated a level playing ground for doing business. Brokers, who a few months ago were buying pro-duce at one shilling per kg, were forced to increase prices to three shillings. As more and more farm-ers join the business program, brokers will be forced to improve prices, thus improving the overall business structure.
48
BREAK-OUT SESSION FOUR: SECTOR COORDINATION AND POLICY FORMULATION
PRESENTERS:
1. Bridget Carrington - Role of Coffee Apex Committee in Influencing Policy.
2. J.K. Wanjama. - Agriculture Policy Formulation.
3. Jane Ngige - The role of Kenya Flower Council incoordinating, regulating and lobbying for the flower sector.

4 BREAK-OUT SESSION FOUR: Sector Coordination And Policy Formulation4.0 INTRODUCTIONBy Anthony GetambuCoordination within a sector is a strategic response to the problems that arise from inter-organization-al dependencies within the sector. Given the increasing importance and the advantages to be gained through value chain coordination, the challenge to industry development is how to select the appropri-ate coordination mechanism to manage organizational interdependencies. A coordination mechanism is a set of methods used to manage these interdependences.Among the roles and responsibilities of a sector coordinating mechanism is that of influencing policy.A policy can be thought of as a set of instructions from policy makers to policy implementers that spell out both goals and means for achieving them. It is now widely recognized that development of any sector is dependent on a conducive and enabling policy and regulatory environment. In this break-out session, presentations are made on two themes; sector coordination and policy for-mulation. Bridget Carrington makes a presentation on sector coordination while Jane Ngige presents a case study of the role Kenya Flower Council plays in coordinating, regulating and lobbying for the flower sector. The final presentation on policy formulation is by J.K. Wanjama.In her presentation, Bridget Carrington explains that the design of the GOK/World Bank Value Chain Based Matching Grant Fund Project requires that an Apex Committee be formed comprising of key players along the entire coffee value chain to;
• act as the coordinating body to convene all sector forums along the value chain; • act as the principal body to develop consensus between various sector entities to help imple-ment industry-wide strategies;• to serve as a central body within the context of Matching Grant Fund Project to approve project concepts prepared by operators and• to seek and obtain clarification of the immediate and long term policies of the Government ofKenya, with respect to the Coffee Sector and make recommendations from the perspective of theCoffee Sector as a whole.
This last role is meant to lobby and influence government to provide a conducive environment for thecoffee sector to develop and grow. Specifically, the Apex Committee would provide the needed supportin the policy reform advocacy process within the country and promote the public-private dialogue and partnership in resolving policy issues. Bridget explains that the Apex Committee has made some achievements especially by bringing to-gether all the players in the coffee value chain for the first time. Common issues have been identifiedand some myths and untruths easily dispelled. At least at this level, some mistrust between key value chain players has been reduced. On the policy front, the Apex Committee has made presentation to the government especially regarding the so called “second window”. However, the extent of its success in influencing national policy is highly dependent on government recognition and the sustainability ofthe Apex Committee after the Matching Grant Fund Project comes to an end. The issue of sector coordination is further expounded by Jane Ngige who presents a case of the KenyaFlower Council. The council started in 1996 by a group of growers who realized that both local andinternational industry policy direction was posed to become the most significant determinant of mar-ket access, viability and economic growth in the face of globalization. They visualized that addressingthese issues could only be tackled from a united front (sector coordination). To date, the association has about 50 members whose main objective is to build technical capacity, to ensure compliance as propelled by business obligations as well as to Kenyan national statutes
49
Finally, Dr. Wanjama talks about policy formulation process and starts by giving a historical back-ground against which most agricultural policies are formulated. He states that most existing laws in agriculture are formulated by the government to introduce new commodities and regulations to con-trol production and marketing of various commodities and utilization of resources for agriculture. In almost all cases, there are no consultations with affected persons during development of laws.According to Dr. Wanjama, policy formulation today seeks to change old policies to separate com-mercial and regulatory roles within the same industry. He believes the role of government in policy formulation remains facilitative especially facilitating stakeholder consultation and legislation of acts of Parliament to formalize the policies. Where a policy involves a commodity based industry, for ex-ample, coffee industry, those involved in the entire value chain must be involved (including farmers,millers, marketing agents, roasters and exporters).Finally, using the case of coffee, Dr. Wanjama highlights the process of policy formulation starting withidentification of constraints to be addressed by the new policy to formulation of an act of Parliamentor a Sessional Paper. He however concludes that policy change following the normal route of draftingbills and taking them to Parliament for debate to become law may take many years. Instead, an um-brella legislation establishing a body under which all the regulatory functions will fall is proposed.After the presentations, many issues on sector coordination and policy formulations arise. The majorissue on sector coordination relates to sustainability of structures such as the Coffee Apex Committeeafter the Matching Grant Fund Project comes to an end. On policy formulation, the major issue relatesto strategies available to the private sector to influence policy change especially if such a change isthreatening the interests of the government in a given sector.
4.1 Role of Coffee Apex Committee in Influencing Policy By Bridget Carrington
4.1.1 BackgroundKenya accounts for less than 1% of world’s coffee production. However, Kenyan coffee is world re-nowned for its high quality. It is used by major roasters to blend with coffee from other origins to im-prove their quality and spice up their final products. Today, it is sold as a single origin gourmet coffeein many occasions. At the end of 1970s, Kenya was producing more than 100,000 tonnes of coffee per year with revenuesof about $500 million, which represented a little under 10% of GDP. Production peaked in 1987/88 season, but fell thereafter into serious decline to near collapse with annual crop now barely reaching orsurpassing 50,000 metric tonnes. Reasons for the collapse in the sector are multiple ranging from the collapse of the International Cof-fee Organization’s quota systems in 1989, expanded production by other producing countries such as Brazil, entry of Vietnam into the coffee world to become the world’s second largest producer withina decade. This lead to a market glut coupled with very depressed prices at the beginning of 1990s.Internally, the industry suffered principally from inefficiency within the cooperative sector, lack of extension services, reduction in use of inputs and reduced husbandry, as well as from mismanagement and corruption.The liberalization process began in early 90s with end of the pool system of payment and auctionprice being changed from Kenya shillings to Dollars, in theory to allow all farmers control over the exchange rate of their sale proceeds. Later the sector saw the liberalization of milling with the entry of two commercial millers (Socfinaf and Thika Coffee Mills) and removal of the marketing function of Coffee Board of Kenya, leaving it with the role of regulator. The Coffee Act of 2002 paved way for moreliberalization but was never really implemented to its fullest.
50

The Finance Bill of 2005 paved way for an alternative to the auction, enabling farmers to seek buyersdirectly, but the rules to allow for this in practice were not legalized until July 2006. The status todayis that direct sales will be allowed through newly licensed marketing agents, whose applications (67 in total) are now under consideration at Coffee Board of Kenya. Nevertheless, the higher auction or world prices of the last few years added to farmers now receiving a higher percentage of their sales proceeds a lot quicker leading to a certain amount of hope for the future. As long as the transition to full liberalization is managed carefully so that farmers can decide how, when, to whom and at what price they sell their coffee, Kenya should be able to retain and growits position in the global coffee market.
4.1.2 World Bank Value Chain AnalysisThe World Bank’s sponsored Value Chain Analysis of Kenyan Coffee Sector finalized in 2004 highlight-ed major problems facing the coffee industry. At grass root level, it identified the farmer as having poorlabour skills, the high costs of transportation and inputs, inefficient and outdated systems practicedat cooperative levels, delays in payments to farmers and high cost of electricity as being major causes for collapse of the industry. It also highlighted the fact that farmers were ignorant of what happened to their coffee after it left their possession, leading to mistrust of dealers believed to be profiting at the farmer’s expense. Lack of information and feedback was deemed to prevent farmers from having ideas of the true value of their product or any incentive to look towards quality improvement.
4.1.3 Formation of the Coffee Apex CommitteeThe government through the Ministry of Trade and Industry with assistance from the World Bank isimplementing the Value Chain Based Matching Grant Fund Project as part of its Economic Recovery Strategy for Wealth and Employment Creation, 2003-2007. This project focuses on coffee, cotton andpyrethrum value chains.As a first step in project implementation, sector organizations in the value chains were required to con-vene to form an APEX Committee comprising of key players along the entire value chain. With assist-ance from the World Bank, the key players in the coffee sector met and appointed seven representativesthat formed The Coffee Apex Committee as follows:
• Two members representing small-holder farmers (cooperatives)• Two members representing coffee growers’ associations (Estates).• One member representing coffee millers.• One member representing coffee roasters and packers.• One member representing coffee exporters.
Besides taking the lead in preparation of industry-wide strategy that reflects issues identified by thevalue chain analysis and vision, objectives and goals of the industry, the Coffee Apex Committee hasthe following responsibilities:
• Act as the coordinating body to convene all sector forums along the value chain;• Act as the principal body to develop consensus between various sector entities to help imple-ment industry-wide strategies.• Serve as a central body within the context of Matching Grant Fund Project toapprove project concepts prepared by operators.
4.1.3.1 VisionThe Vision of the Apex Committee is to position Kenya as the leading producer of high quality coffee.
51

4.1.3.2 Mission StatementThe Mission Statement is to promote sustainable production of quality coffee for the benefit of allstakeholders, especially farmers, through the integration of the industry, supported by clear govern-ment policies.
On November 30th, 2005 during the consultative workshop, the Apex Committee members and other coffee sector stakeholders met in Nairobi to discuss a draft outline of the Strategic Plan. At the work-shop, participants determined the strategic directions and objectives of the coffee sector since it wasclear that certain strengths, weaknesses, opportunities and threats were common to different parts ofthe coffee value chain. The Apex committee was able to identify certain strategic priorities to addresswithin its strategic plan which would have a significant impact on achieving both its vision and mis-sion.These priorities were varied and included; kick-starting the rehabilitation of production, improvinghusbandry and quality, enhancing efficient payments to farmers, negotiating preferential tariffs (e.g.KPLC), improving market information systems, promoting Kenyan brands and increasing local con-sumption. It was envisaged that pilot projects established under the World Bank Matching Grant Fund would concentrate on addressing these priorities, which would lead to visible and measurable results on a local level.
4.1.3.3 Strategic IssuesAs the driving force for the Apex Committee, certain strategic directions were identified to focus onthe five-year plan of the coffee sector 2005-2010. They were as follows:
• Seek and obtain clarification of the immediate and long term policies of the government withrespect to the Coffee Sector and make recommendations from the perspective of the sector as awhole.• Facilitate improved and sustainable livelihoods for coffee growers by motivating them to pro-duce more quality coffee.• Pursue full liberalization of the sector through amending legislation where necessary.• Establish an effective, educational and informative network and training programme for allplayers in the Kenyan coffee industry.• Highlight to all relevant and responsible authorities the infrastructural needs of the coffee sec-tor and determine actions to be taken to ensure that the needs are addressed.• Promote the market image of Kenyan coffee and facilitate added value through increased localconsumption.• Capitalize on the formation of the Apex Committee to achieve more complete coordination of all sectors of the coffee industry in Kenya.• Establish a private sector-based quality certification body, and work with others to develop anacceptable certification program for Kenya coffee producers taking into consideration the needsof smallholder producers.
The Apex Committee has identified the following four major areas of focus:• Policy Reform and Implementation – the committee will provide needed support in the policy reform advocacy process within the country and promote the public-private dialogue and part-nership in resolving policy issues. Apex will lobby for recognition as a representative of all the private sector stakeholders of the coffee industry.• Grower and Business Support Development – Apex Committee will work through national and private chapters in implementing programmes and activities that focus on producers and improving the environment in which they operate so as to produce high quality coffee. Nationalcoordination between the private and public sector will help in synchronization of efforts and insynergy building.
52

• Development of Markets and Market Information Systems – The committee will promote im-provement of the marketing systems, especially improvement of price discovery mechanisms, market information, promotion and communication.• Research and Technology Transfer – The committee will work closely with Coffee ResearchFoundation and other public national organizations to ensure that research is market driven and disseminated comprehensively to the entire value chain.
All the above will be done in such a way that there is capacity building and institutional development at all levels of the value chain. Apex Committee will coordinate and promote the capacity required to support activities along the coffee chain. At all levels, building of local capacity and efficient systemswill ensure sustainability and achievement of goals. Unfortunately, the mandate of the Apex committee is to carry out its role at a limited pilot level. How-ever, the success of these carefully and strategically chosen projects, each supported by at least two players in the value chain, will be measured and used to identify initiatives required on an industry-wide basis. The Apex Committee brought all the players in the coffee value chain around the table for the firsttime. Common issues were easily found and some myths easily dispelled, and at this level, some of the distrust has disappeared. Capacity building at grass root level is of essence and although this committee was brought together with a clear mandate, it sees its potential role as being much greater and feels that it is the ideal instrument to partner the donor community. It is ideally placed to appeal to the Kenyan coffee farmers. And because it comprise of all coffee players, it is genuinely concerned with the declineand stagnation of the industry and is well placed to partner the donor community in bringing about revitalization from bottom upwards. Equally, in a climate of liberalization, the private sector through the Apex committee sees its role as piv-otal in influencing the direction of the industry going forward. To lobby as the whole value chain lendsmuch more weight to the argument. However, the extent of its success in influencing national policy ishighly dependent on the willingness of the policy makers themselves to recognize the important role it can play in directing the industry and to take note of its strategic objectives and act upon this for the good of all.
4.2 AGRICULTURE POLICY FORMULATION By J.K. Wanjama
4.2.1 IntroductionOver the years, the government has enacted many laws that govern agriculture in Kenya. At the same time, government ministries have been split so that several ministries implement these laws. Thereare over 130 pieces of legislation that govern agriculture, 60 within the agriculture sector regulating various commodities and functions. Most of these are old and prohibitive to rapid development in the sector yet the Economic Recovery Strategy for Wealth and Employment Creation of 2003, identifiedagriculture as one of the key sectors for reviving the economy. Existing laws in agriculture were formulated by the Government to introduce new commodities and regulations to control production and marketing of various commodities and utilization of resources for agriculture. In almost all cases, there were no consultations with the affected persons during thedevelopment of laws.
4.2.2 Purpose for the PolicyThere is need to change most of the existing policies to make them relevant to today’s agriculture and tothe global trends. For major agricultural commodities, the government has had control of production, processing and marketing while at the same time regulating the respective industries. 53

Policy formulation today therefore, seeks to change old policies to separate commercial and regulatory roles within the same industry. New policy should seek to have the government relinquish commercial activities and leave the private sector to carry them out and where possible let the regulatory role be car-ried out by the industry itself. It will seek to bring about liberalization in order to bring on board other players to increase investment and competitiveness in the various commodities or service delivery. 4.2.3 Who should be involvedThe government still has a big role in policy formulation, especially in facilitating stakeholder consulta-tions, helping to build teams for purpose of drafting and in accelerating the process. The stakeholderswill include all those persons affected by the policy both in public and private sectors. Where a policyinvolves a commodity based industry, for example, coffee industry, those involved in the entire valuechain must be involved ( farmers, millers, marketing agents, roasters and exporters).Policies that require legislation of an Act of Parliament require formulation of a Bill that is tabled in Par-liament for debate. Government Bills originate from government ministries, through the Cabinet before the Attorney General can publish them.
4.2.4 Process of policy formulationPolicy formulation today will start with clear identification of the constraints that should be addressedby the new policy. The affected persons must be involved in identifying the constraints which is bestdone through consultative meetings and throughout the policy formulation process. Cabinet approves the policy that should go to parliament as a Bill or Sessional Paper. Parliament there-fore gets involved in formulation of an Act or Sessional paper.
4.2.5 The Case for Coffee4.2.5.1 Problems in the industryCoffee industry has a big potential for expansion. However, since 1987/88 when production was about130,000 metric tons, production has declined to a low of about 50, 000 metric tons. The problems re-sponsible for this drastic decline are spread along the entire value chain and include;
• Poor returns to growers resulting from poor production that is not linked to the market and poor credit facilities for growers.• Research is poorly funded making development of new technologies very slow.• Old inefficient processing technologies are expensive to growers while they have been deniedopportunities for value addition.• Local roasters take only about 4% of the total production because coffee drinking has never beenwell promoted locally.• Coffee marketing has over the years been limited to auction sale at the Nairobi Coffee Exchangewith prices that have been very dicey giving growers very low returns.• The Auction system has not been competitive because no marketing skills are employed beyondprovision of samples and catalogue showing the cup quality.• Although Kenyan coffee is reputed for its high cup quality, little has been done to promote it bothlocally and abroad.• The Coffee Act 2001 was intended to liberalize the coffee industry and empower the growers in order to realize greater returns from their coffee. However, the same Act contained restrictionsthat made the grower unable to market their own coffee.• The Coffee (General) Rules, 2002 that govern the handling of coffee through the value chain is not in harmony with the Act making it necessary to amend both the Rules and the Act.• The Coffee Board of Kenya (CBK) derives its income from the 1% levy that it receives from thesale of coffee in the auction. This levy is too little for a body that has over 70 staffs. On the otherhand, Tea Board of Kenya which operates very efficiently has less than half the staff of CBK.
54

4.2.5.2 The Process of Changing the Policy in Coffee• The Minister for Agriculture appointed a Taskforce in June 2003 to gather information on chang-es the coffee stakeholders needed in the sub-sector.• The Taskforce presented its findings and recommendations to the minister and technical staff of the Ministry of Agriculture and Coffee Board of Kenya in September, 2003.• A one day stakeholders’ workshop was held on 23rd January 2004 to discuss the report and rec-ommendations of the Taskforce. • After some discussions in the government circles, an inter-ministerial committee was formed inAugust 2004 to develop a concept paper on improvement of the coffee industry. This was done andthe concept paper was discussed by Cabinet in December of the same year. Cabinet approved the recommendations of the concept and directed that they be implemented. Among the recommen-dations were: - opening of direct marketing of coffee, amendment to the Coffee Act 2001, actuali-zation of the Coffee Development Fund, review of Coffee Board and Kenya Planters CooperativeUnion (KPCU), strengthening of extension service and capacity building of cooperative societies in coffee.• Most of the above recommendations have been implemented. The comprehensive coffee amend-ment Bill is awaiting publication, while the more urgent amendments were carried in the Finance Act 2005.• Coffee Rules were amended and gazetted in a Legal Notice published on 21st July 2006, to takecare of the changes introduced by the amendments to the Coffee Act, including the direct market-ing of coffee.
4.2.6 Future Policy Formulation ProcessSRA ApproachExperience has shown that parliament cannot debate five Bills from one sector in one year. As a result,Acts that need to be reviewed, amended or repealed would take many years. It has also been shown that an Act may require another review after only a few years as in the case of Coffee and Sugar Acts that werereviewed in 2001 and are currently under review. In order to cope with many policy reviews and to avoid involving parliament with every little amendment that may be required, an umbrella legislation has been proposed. This Consolidated legislation proposesto repeal commodity and regulatory legislations and create four bodies under which all the regulatory functions will fall. The new bodies include:-
• Agricultural development Board• Livestock Development Board• Agriculture and livestock Regulatory Board• Agricultural Research Organization
It is proposed that policy changes that may require discussion by concerned stakeholders be published by the minister through a legal notice long rather than the tedious process of taking every little proposal for change to parliament.
4.3 Kenya Flower Council: Sector Coordination And Policy Formulation By Jane Ngige
4.3.1 Background InformationFloriculture began in a small way in the 1970’s with significant production throughout the 90’s. In 1996,a group of growers realized that both local and international industry policy direction was posed to become the most significant determinant of market access, viability and economic growth in the face ofglobalization. They visualized that addressing these issues could only be possible through a united front,hence the formation of the Kenya Flower Council.
55
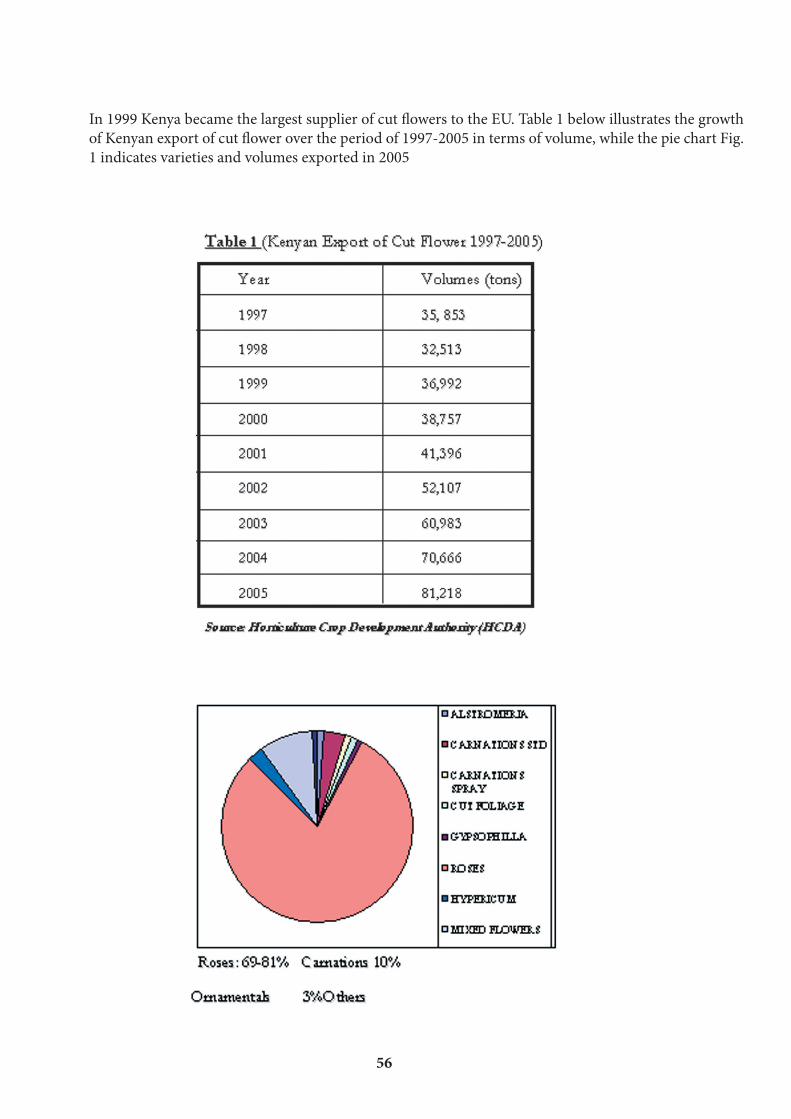
56
In 1999 Kenya became the largest supplier of cut flowers to the EU. Table 1 below illustrates the growthof Kenyan export of cut flower over the period of 1997-2005 in terms of volume, while the pie chart Fig.1 indicates varieties and volumes exported in 2005
As the Association celebrates its 10th anniversary, it remains resolute in its objective of building tech-nical capacity to ensure compliance as propelled by business obligations and to Kenyan national stat-utes. It draws its mandate from a constituency of about 50 members who collectively produce between 60-70% of the total exports. Currently, Kenya is the number one exporter to the EU, with a 31% of imports market share, worth 18 billion in 2005. In 2004, the industry earned 22 billion. The revenueerosion has been blamed on weakening of the dollar against a strong Kenyan shilling. Most of the flowers (65%) are marketed through auctions in Holland, while 23% is marketed through supermarketmultiples in the UK. Another 7% is destined for Germany. The French market consumes 3% and thebalance is exported to the USA, Japan, South Africa and the Middle East. Kenya Flower Council is a strong national association, guided by a common vision of growth of flori-culture industry under conducive socio-economic and political environment. Its mission is to be the lead organization in the provision of advisory, self regulation and promotional services to the floricul-ture industry.
4.3.2 Main Objectives • Promote floriculture industry self regulation.• Enhance recognition of KFC and its code of practice locally and abroad.• Pursue the development of a conducive policy environment for the floriculture industry.• Capacity building for members and communities.• Broaden the membership base.
To implement the objectives, the organization adopted a strategy of active participation in determina-tion and implementation of policies governing sustainable development of the Kenyan Floriculture sector.
4.3.3 Key Activities4.3.3.1 Industry Self Regulation The Council developed and constantly updates a members’ own Code of Practice, which stipulatesguidelines on technical, social and environmental requirements that all members subscribe to. The Code has successfully woven together a cohesive and viable association that has been instrumentalin building a commendable non-traditional export commodity, which constitutes 8% of the coun-try’s foreign exchange earnings. Being rural based, the industry has emerged as a significant conduitfor wealth distribution in addition to rural development, particularly through infrastructure (roads and telecommunications), health, education, security, water and sanitation and in water harvesting projects. This success of the industry has been attributed mainly to the ability of growers to effectively and col-lectively respond to market requirements in terms of compliance to both the private market standards as well as statutory market demands, adoption of cutting edge technology, investments, skills, market-ing prowess not withstanding. The industry had also earned support from the government in terms ofresponding to industry needs, and in creating an enticing environment for foreign direct investors.
4.3.3.2 Development of Kenya Flower Council Code of Practice The Kenya Flower Council Code of Practice current 7th Edition is accreditation to EurepGAP, in whichthe Kenya Flower Council Code was the first National Scheme to acquire the status worldwide. Dis-cussions to obtain similar status with other leading market labels such as the MPS of Holland, FLP of Germany as well as the International Fair Flowers and Plants (FFP) are underway.
57

4.3.3.3 Highlights of the Kenya Flower Council Code of PracticeThe Kenya Flower Council Code provides specific guidelines on the following key aspects of produc-tion:
• Health and safety of workers in all aspects of provision of a safe working environment in terms of personal protective equipment and working instructions.• General worker welfare which covers wages, housing, safe transportation, medical, provision, leave, maternity leave and other terms and conditions of employment.• Other major workers’ welfare includes workers’ committee, gender and equity, health and safety committees.• Good agricultural practices (GAP) including all the recommendations of EurepGAP.• Crop protection strategy including integrated pest management.• Training of all farm staff on safe use of pesticides, health and safety, and first aid.• Transportation, storage and disposal of obsolete pesticides.• Protection of the natural environment which include water, air, land and wildlife.• Proper record and documentation of all aspects in crop production and post harvest. • Export of cut flowers whilst ensuring traceability of all activities.
The code also embraces local Government legislations which affect the industry in one way or the other,and investors are expected to comply with all the legal and statutory legislation that relates to their ac-tivities.
4.3.3.4 LobbyingThe Kenya Flower Council continuously engages in lobbying the Government for an enabling environ-ment in terms of incentives such as reduction of taxes, security, and maintenance of road and com-munications infrastructure. This has resulted on one hand, in a sustained investor presence in Kenya,while on the other, the creation of a well endowed human resource capacity, now finding employmentin other flower growing countries in the region.
4.3.4 Industry Promotions On behalf of growers, Kenya Flower Council promotes the industry at international trade exhibitions such as the Annual International Hortifair in Amsterdam. For the first time, in 2005, the Council inconjunction with the Fresh Produce Exporters Association, and with financial support from the USAIDKenya Horticulture Development Program, the Council was able to promote the small scale growers and summer flowers in their stand. In 2006, the two associations, under the same arrangements, exhib-ited Kenyan flowers in Miami, resulting in increased business for Kenyan growers.
4.3.5 Capacity BuildingBetween 2002 and 2004, with funds from DFID, Kenya Flower Council implemented a project for small scale growers focusing on safe use of pesticides. In addition to training farmers, this project yielded a Code of Practice for the target group, which was also translated into Kiswahili. This is an importanttool in the current paradigm of supporting small scale growers in building capacity to export flowers,by ensuring capacity to adhere to market standards such as EurepGAP. Currently, a technical assist-ance project from CBI Holland, will conclude a 4 year program, whereby 13 companies will attend the Hortifair 2006 in Holland, primarily for a trade networking event as well as an experience of the biggest international flower fair. It is expected that they will not only return home with concrete orders, but alsowith a sense of global competition for a fastidious market. The small scale support initiative is a deliber-ate effort by Kenya Flower Council to ensure inclusiveness of the small scale growers and to encourageself regulation as a means of sustaining market access at national level.
58

4.3.6 Lessons LearntThe private sector has a key role in determining creation of national wealth. It has a responsibility toidentify ways and means of achieving such a status, high cost of the process not withstanding.
4.3.7 ChallengesThe rapid expansion referred to earlier has given way to stability and consolidation where main focusis maintenance. There is need to emphasize improvement of the supply chain performance, particularlyin mitigating against quality loss and addressing the non-technical standards on social accountability and environmental stewardship, as stipulated in international and local statutes. Adherence to these multiple and dynamic standards is expensive and time consuming, but is an absolute necessity to ward off negative publicity hence sustain market access, whilst ensuring healthy and congenial working con-ditions on the farms. At the global level, as January 2008 draws near, there is a real concern amongst growers about the direction of WTO talks, which could invoke import duties on Kenyan flowers in the EU. Concern isdeepened by the speed at which the Economic Partnership Agreement (EPA) negotiation between the Eastern and Southern African (ESA) countries and the EU as the Lome Convention comes to an end at the end of 2007. The outcome is crucial since Kenya has been locked out of the Everything But Arms(EBAS) regional trade protocol as it is not one of the least developing countries, a status enjoyed by neighboring countries, in which case, a situation of investor relocation is imminent. Out of this realiza-tion, some of these countries are already preparing for such a scenario by developing incentives, such as tax holidays and subsidized flight, which will no doubt, lure flower growers.
4.3.8 ConclusionsKenya is a model destination for flowers, endowed with natural resources, ideal climatic conditions,strategic geographic positioning, complimented by an extensive road and communications infrastruc-ture, driven by private investments, supplemented by a vibrant, well educated and productive labour force. However, the industry requires support, through enabling policies that will address competitive-ness at national level. The industry also requires a strong Research and Development component toaddress supply chain constraints, especially in post harvest handling that will enhance productivity, through improving efficiency, diversifying products and ensuring compliance to both public and pri-vate market requirements. It is also prudent to ensure that small scale producers are not marginalized from an opportunity to improve their livelihoods through trade and not aid. To achieve this, programs such as the CBI project should be encouraged and supported by ensuring that markets are diversifiedand segmented as products are diversified.
59
PLENARY SESSION TWO Conference Synthesis and Remarks from the
Global Donor Committee
By Jim Tanburn

5 PLENARY SESSION TWO: Conference Synthesis And Remarks From The Global Donor Committee
Jim TanburnDonor Committee for Enterprise DevelopmentOverall Objectives and Rationale of the Donor Committee
• To coordinate donor agendas, approaches• To share successful experiences and lessons learned in the field• To benchmark approaches/instruments and agree on jointly defined standards• To avoid duplication of activities• To build staff and practitioner capacity
The Paris Declaration on Aid Effectiveness puts increasing emphasis on donor harmonization; DCEDwork aims at further substantiating this in the technical field of enterprise development.Committee’s modes of workingThe committee was formed in 1979 as the informal “Committee of Donor Agencies for Small Enter-prise Development”. But since 2005, it has moved towards more substantial operations including more formal structures;
• Co-chairs complemented by Executive Committee• Secretariat with part-time Coordinator• Membership fee to finance Secretariat activitiesTechnical work through working groups, currently on• Business Enabling Environment• Linkages and Value Chains
Increasing focus on services to members (through Secretariat)• Knowledge management, websites, newsletter• Support to members, country coordination groupsCommittee’s most active members• Bilateral agencies currently active in the Committee include Governments of Australia, Austria, Canada, Denmark, France, Germany, Netherlands, Norway, Sweden, Switzerland, UK, and USA• Multi-lateral agencies currently active include the European Commission, FAO, IFAD, ILO, OECD-DAC, UNCTAD, UNDP, UNIDO, World Bank Group
Some activities of the Committee• International and regional Conferences: e.g. Cairo Conference on business environment reform of 2005 which attracted 300 people from 29 donor agencies• Participatory definition of best practice for donors: e.g. Guiding Principles: “Business Develop-ment Services for Small Enterprises” (Blue Book), 2001• Knowledge management, websites such as the home site: www.Enterprise-Development.org, oracle database for BDS, value chains, making markets work for the poor www.BDSknowledge.org or the database on BE reform www.BusinessEnvironment.org or monthly newsletter etc.
Future agenda of the Committee• New modes of operation, e.g. benchmarking / peer reviews• Address new topics flexibly, e.g. ‘SWAps for PSD’• New Secretariat with more services, outreach; Committee represented in other forums • Reach new donors as members• Link more to country level donor groups
60

Some personal observations• HQs develop policies and strategies• Many agencies are now decentralized• So what is the relationship between HQ policies and what happens in the field?• HQs depend on field colleagues for case study material• But field staff also need to be aware ‘which way the wind is blowing’
The good news• Growing interest in funding private sector development (PSD) – eg OECD DAC, UK, AusAID• Some have extensive references to SED – eg Commission for Africa• Practitioners have embraced key principles of PSD and competitiveness• New donors – eg Bill and Melinda Gates Foundation $30m on Value Chain development. Emerging donors eg in Europe, believe PSD is important• Changing trade agreements, world markets can provoke strong demand for help from Govern-ments and associations• Convergence of competitiveness and poverty• Larger companies are very interested e.g HP Micro-Enterprise Acceleration Institute, Unilever / Oxfam joint study in Indonesia, Shell and others funding Investment Climate Facility
The not-so-good news• Little attention to measuring impacts or achieving scale; ‘champions’ lack cases• Traditional interventions dressed up in progressive language• Some recent evaluations not very positive; targeted approaches perceived to have mixed impacts• Growing belief that “all growth is good for the poor”• Perception that targeted approaches are not effective, and may do more harm than good (per-verse incentives etc.)• Some confusion over the alternatives• Trend towards budget support to recipient governments leaves multi-stakeholder PSD without obvious home• Also trend toward reform of the overall business environment: “level playing field”
Other sources of demand• From private companies, for matching grant schemes (PPPs, African Enterprise• Challenge Fund etc.)• From communities, via participatory approaches (LED, clusters etc.)• From governments / associations, as a result of benchmarking?
What to do about it? Towards an agenda for actionMany donors are looking for:
• Scale / volume• Assurance of results• Compliance with ‘current thinking’ (including a fit within current categories)• Capacity to deliver
How to influence current thinking• Think about USP – e.g. convergence of pro-poor, competitiveness.• Choose forum to reach thought leaders: Journals + events can be a useful trigger• Publish case studies which are compelling, convincing and credible / have a slogan, a story and statistics• Use websites of Committee to publish substantive case studies
61
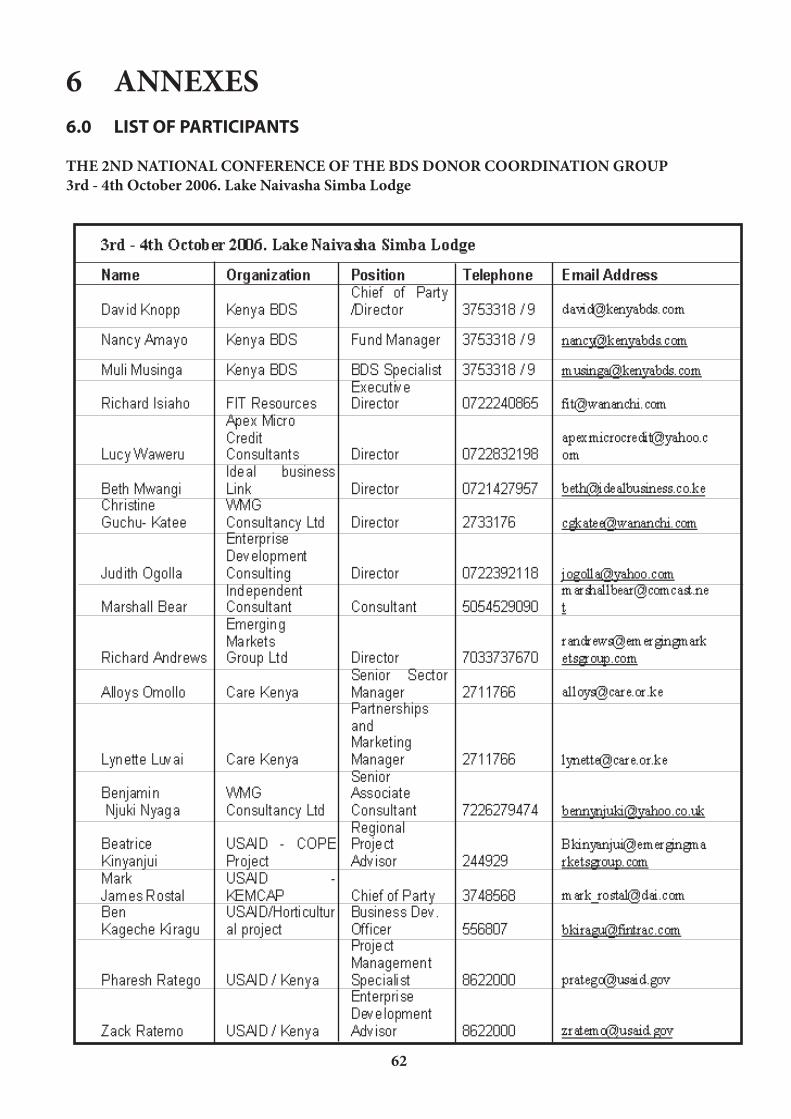
6 ANNEXES6.0 LIST OF PARTICIPANTS
THE 2ND NATIONAL CONFERENCE OF THE BDS DONOR COORDINATION GROUP3rd - 4th October 2006. Lake Naivasha Simba Lodge
62