Decentralization, Local Government Elections and Voter Turnout in


REPORT ON THE 2012 LOCAL GOVERNMENT ELECTIONS
Councils with Elections undertaken by NSW Electoral Commission
Albury City Council
Armidale Dumaresq Council
Ashfield Council
Auburn City Council
Ballina Shire Council
Balranald Shire Council
Bankstown City Council
Bathurst Regional Council
Bega Valley Shire Council
Bellingen Shire Council
Berrigan Shire Council
Blacktown City Council
Bland Shire Council
Blayney Shire Council
Blue Mountains City Council
Bogan Shire Council
Bombala Council
Boorowa Council
Bourke Shire Council
Brewarrina Shire Council
Broken Hill City Council
Burwood Council
Byron Shire Council
Cabonne Shire Council
Camden Council
Campbelltown City Council
City of Canada Bay Council
Canterbury City Council
Carrathool Shire Council
Central Darling Shire Council
Clarence Valley Council
Cobar Shire Council
Conargo Shire Council
Coolamon Shire Council
Cooma-Monaro Shire
Council
Coonamble Shire Council
Cootamundra Shire Council
Corowa Shire Council
Cowra Shire Council
Deniliquin Council
Dubbo City Council
Dungog Shire Council
Eurobodalla Shire Council
Forbes Shire Council
Gilgandra Shire Council
Glen Innes Severn Council
Gloucester Shire Council
Gosford City Council
Goulburn Mulwaree Council
Great Lakes Council
Greater Hume Shire Council
Greater Taree City Council
Griffith City Council
Gundagai Shire Council
Guyra Shire Council
Gwydir Shire Council
Harden Shire Council
Hawkesbury City Council
Hay Shire Council
Holroyd City Council
The Council of the Shire of
Hornsby
The Council of the
Municipality of Hunters Hill
Hurstville City Council
Inverell Shire Council
Jerilderie Shire Council
Junee Shire Council
The Council of the
Municipality of Kiama
Kogarah City Council
Ku-ring-gai Council
Kyogle Council
Lachlan Shire Council
Leeton Shire Council
Leichhardt Municipal
Council
Lismore City Council
City of Lithgow Council
Liverpool City Council
Liverpool Plains Shire Council
Lockhart Shire Council
Manly Council
Marrickville Council
Mid-Western Regional
Council
Moree Plains Shire Council
Mosman Municipal Council
Murray Shire Council
Murrumbidgee Shire Council
Muswellbrook Shire Council
Nambucca Shire Council
Narrabri Shire Council
Narrandera Shire Council
Narromine Shire Council
North Sydney Council
Oberon Council
Orange City Council
Palerang Council
Parkes Shire Council
Parramatta City Council
Pittwater Council
Port Macquarie-Hastings
Council
Queanbeyan City Council
Randwick City Council
Richmond Valley Council
Rockdale City Council
Ryde City Council
Singleton Council
Snowy River Shire Council
Strathfield Municipal Council
Council of the City of Sydney
Tamworth Regional Council
Temora Shire Council
Tenterfield Shire Council
The Hills Shire Council
Tumbarumba Shire Council
Tumut Shire Council
Tweed Shire Council
Upper Hunter Shire Council
Upper Lachlan Shire Council
Uralla Shire Council
Urana Shire Council
Wagga Wagga City Council
The Council of the Shire of
Wakool
Walcha Council
Walgett Shire Council
Warren Shire Council
Warringah Council
Warrumbungle Shire Council
Waverley Council
Weddin Shire Council
Wellington Council
Wentworth Shire Council
Willoughby City Council
Wingecarribee Shire Council
Wollondilly Shire Council
Woollahra Municipal Council
Wyong Shire Council
Yass Valley Council
Young Shire Council
REPORT ON THE 2012 LOCAL GOVERNMENT ELECTIONS
1
Foreword
I am pleased to present to the NSW Parliament, and the NSW Government, the NSW
Electoral Commission’s report on the conduct of the 2012 Local Government
Elections.
In our 2008 report I stated that it is our goal that if councils could choose, they would
select the NSWEC to conduct their elections. I’m pleased to report that after
legislative change allowed councils a choice as to who would provide their elections
in 2012, the overwhelming majority of councils (92%), chose the NSW Electoral
Commission.
In previous evidence to the Committee I said that I saw issues with councils
conducting their elections. My main concern centred on the fact that then the
Electoral Commissioner was accountable for the Local Government elections.
Councils conducting their elections would create blurred accountability. The
amendments introduced in 2011 made it clear that the General Manager of each
council was accountable for the elections unless the council resolved that the
Electoral Commissioner was to conduct the elections in which case the Electoral
Commissioner was accountable. This addressed my previous concern. I fully support
the principle that councils have a choice as to who conducts their elections. Where
councils choose to conduct their elections the Electoral Commissioner is not
accountable for the outcome. This was a major shift in policy and, in my view, it
worked well at the 2012 elections. The challenges posed by the new arrangements
are both exciting and full of potential for the Commission.
There were practical challenges in implementing this legislative change. Councils
had up to 30 November 2011 to determine whether they wished to conduct their
own election or to appoint the NSWEC. The deferment of the decision date to the
end of November put a number of key preparations behind schedule principally
because quotations for the provision of certain goods and services could not be
finalised until the number of councils requiring the NSWEC’s services was known. The
time to consult with councils on the establishment of Regional Returning Officers for
example, was compressed as a result.
It’s perhaps not widely understood that although the NSWEC did not provide
election services to all councils, it was required to provide some services to all
councils within NSW regardless of who was conducting the councils' elections. These
services were in the main electoral roll products. This added another layer of
complexity to the conduct of the elections which other providers did not experience.
Also, the NSW Election Funding Authority provided candidate information sessions to
all councils as all candidates needed to comply with the legal requirements for
election and campaign funding regardless of how the election in which they were
participating was being delivered.
Many lessons were learnt from the 2008 Local Government Elections which the
NSWEC addressed in the 2012 elections. The NSW Electoral Commission adopted as
many of the Committee’s 2008 recommendations that it could without being
dependent on legislative change. One of these was the Service Charter. This was
very well received by General Managers as it was an excellent tool for
REPORT ON THE 2012 LOCAL GOVERNMENT ELECTIONS
2
communicating the services to be provided and managing expectations about
levels of service.
There are two important measures of the NSWEC’s performance in conducting the
2012 Local Government Elections: its performance against the targets set down in
the NSWEC’s ‘Service Charter’ and secondly, its response to the recommendations of
the Joint Standing Committee’s Inquiry into the 2008 Local Government Elections. As
our report shows, the NSWEC performed very well against the service standards and
targets in the Service Charter; matching and exceeding in most cases, the targets
set. Our response to the recommendations of the 2008 Inquiry also demonstrates a
responsiveness and commitment to accountability and performance.
The report covers our performance conducting the 2012 Local Government Elections
and uses the format recommended by the 2008 Inquiry. Each area indicated as of
interest to the Joint Standing Committee has been addressed. Fortunately, overall
this aligned well as with the Terms of Reference of the 2013 Inquiry. The two terms of
reference not envisaged in the 2008 recommendation have been addressed as
separate items. Issues to be considered for the conduct of future elections are
outlined also.
I’m proud of all aspects of the Commission’s performance. The overall cost of the
elections was reduced from $25.9m in 2008 to $23.4m in 2012. There were substantial
efficiencies achieved on big expenditure items such as ballot papers and using the
Regional Returning Officer model. In terms of electoral administrative practices, the
Sydney Town Hall initiative proved a success combining access to the democratic
process for voters out of their council area (but able to vote at the Sydney Town
Hall), as well more efficient and streamlined processes for voting. It’s also pleasing to
be able to report that SmartRoll, the automatic enrolment process, has now passed
into ‘business as usual’ operations and continues to be very well received by
electors.
It was disappointing not to be able to introduce internet and phone voting (iVote)
for the 2012 Local Government Elections. The unavailability of iVote was poorly
received also by electors with disabilities and their advocacy groups. iVote responds
to electors’ needs for greater convenience and ‘customer service’ in voting and
electoral administration. Electors are disadvantaged in council elections as there is
no provision for ‘absent vote’. If electors are out of their council area they are
unable to vote if they haven’t organised postal vote or voted at a pre-poll centre.
The option of using the ‘Sydney Town Hall’ initiative throughout NSW is another way
of enabling ‘absent electors’ to vote but is not scalable to offer as a universal
solution to the lack of absent voting. On the other hand, universal postal voting or
iVote do offer such a solution.
Previously, the NSWEC had recommended the adoption of universal postal voting to
overcome the concern about the cost of conducting the 2008 elections. Universal
postal voting also enables citizens absent from the council area to vote in a relatively
simple manner. The Commission maintains that this option has a number of
advantages for NSW. It is a model that has been proven in a number of other
jurisdictions as effective.
I would like to thank all staff involved in providing the 2012 Local Government
Elections and to thank electors, councils, candidates, registered political parties and
REPORT ON THE 2012 LOCAL GOVERNMENT ELECTIONS
3
other stakeholders for their participation in this important event. I look forward to
building on our achievements and carrying these forward into the 2016 Local
Government Elections.
Colin Barry
Electoral Commissioner
REPORT ON THE 2012 LOCAL GOVERNMENT ELECTIONS
4
About this Report
The content of this report is based upon the format proposed in Recommendation 2
of the Joint Standing Committee on Electoral Matters’ (JSCEM) Inquiry into the 2008
Local Government Elections.i It also addresses separately those specific Terms of
Reference for the inquiry into the 2012 Local Government Elections not covered by
this format.
The report is set out in three parts. The first part sets out the NSWEC’s conduct of the
2012 Local Government Elections, the services provided and our performance
against the service targets in the ‘2012 Local Government Elections Service Charter
for NSW Councils’.
The second part reports on the elections conducted for individual councils including
results, details of the electoral services provided and successful candidates.
The third part provides copies of the survey reports prepared by independent social
research companies on the experience of electors and the surveys conducted by
the NSWEC.
To assist the JSCEM, the following table cross references the content area sought in
future reports from the NSWEC as per the recommendations of the 2008 Inquiry plus
those terms of reference for the Inquiry into the 2012 Local Government Elections
which are not covered in the 2008 recommended format.ii
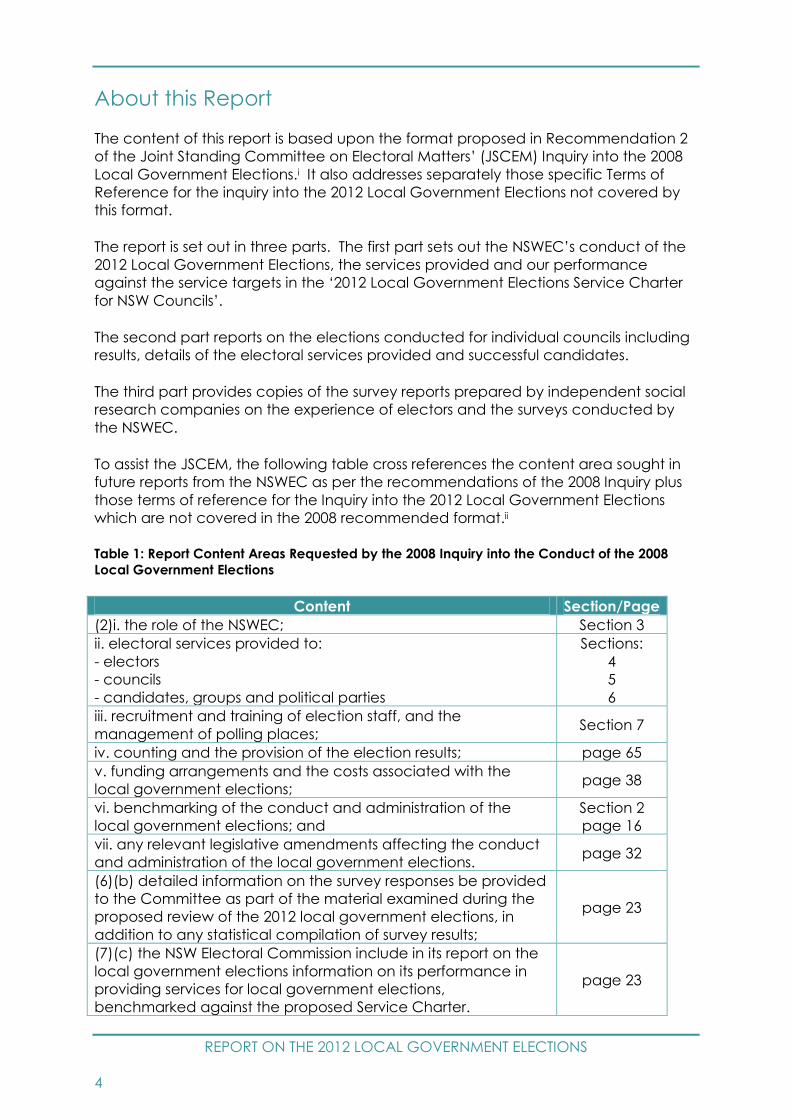
Table 1: Report Content Areas Requested by the 2008 Inquiry into the Conduct of the 2008
Local Government Elections
Content Section/Page
(2)i. the role of the NSWEC; Section 3
ii. electoral services provided to:
- electors
- councils
- candidates, groups and political parties
Sections:
4
5
6
iii. recruitment and training of election staff, and the
management of polling places; Section 7
iv. counting and the provision of the election results; page 65
v. funding arrangements and the costs associated with the
local government elections; page 38
vi. benchmarking of the conduct and administration of the
local government elections; and
Section 2
page 16
vii. any relevant legislative amendments affecting the conduct
and administration of the local government elections. page 32
(6)(b) detailed information on the survey responses be provided
to the Committee as part of the material examined during the
proposed review of the 2012 local government elections, in
addition to any statistical compilation of survey results;
page 23
(7)(c) the NSW Electoral Commission include in its report on the
local government elections information on its performance in
providing services for local government elections,
benchmarked against the proposed Service Charter.
page 23

REPORT ON THE 2012 LOCAL GOVERNMENT ELECTIONS
5
(15)(b) report on any initiatives undertaken by the NSW Electoral
Commission toward improving counting and publication of
results in the Commission’s next report on the local government
elections in 2012.
page 68
Table 2: Terms of Reference Inquiry into the Conduct of the 2012 Local Government Elections
Reference Section/Page
(a) the costs of the elections; page 38
(b) the experience of councils that conducted their own
elections;
Section 8,
page 95
(c) possible legislative changes to improve the efficiency of and
participation in Local Government elections;
Section 9,
page 98
(d) non-residential voting in Local Government elections; and page 59
(e) the impact of requirements under the Election Funding,
Expenditure and Disclosures Act 1981 on participation by
candidates in Local Government elections and possible
legislative changes to remove any barriers to participation; and
Section 8,
page 95
(f) any other related matter. not
applicable
End Notes
i Parliament of New South Wales, Joint Standing Committee on Electoral Matters, 2008 Local Government Elections, Report No. 3/54 –
June 2010, pps11-12.
ii Resolution passed 21 November 2012, Minutes No 19, Item 5
The Joint Standing Committee on Electoral Matters is to inquire into and report on the September 2012 Local Government elections
with particular reference to:
(a) the costs of the elections;
(b) the experience of councils that conducted their own elections;
(c) possible legislative changes to improve the efficiency of and participation in Local Government elections;
(d) non-residential voting in Local Government elections;
(e) the impact of requirements under the Election Funding, Expenditure and Disclosures Act 1981 on participation by
candidates in Local Government elections and possible legislative changes to remove any barriers to participation; and
(f) any other related matter.
The Committee is to report on the outcome of its inquiry by 30 June 2013.

REPORT ON THE 2012 LOCAL GOVERNMENT ELECTIONS
Contents
6
Contents
Foreword .......................................................................................................................................................... 1 About this Report .................................................................................................................................................... 4
Part 1
Section 1: Local Government Elections Snapshot ...................................................................................... 13
Election Timetable .................................................................................................................................................. 15
Section 2: 2012 Local Government Elections - NSW Electoral Commission’s Performance ................... 16
Response to the Inquiry into the 2008 Local Government Elections ............................................................. 16 2012 Local Government Elections - Service Charter sets Service Standards .............................................. 23
NSWEC meets Service Commitments for Electors .................................................................................. 24 NSWEC meets Service Commitments for General Managers ............................................................... 26 NSWEC meets majority of Service Commitments for Candidates and Political Parties ..................... 28
Participation and Informality Rates ..................................................................................................................... 30
Section 3: Local Government Elections and the NSW Electoral Commission .......................................... 31
NSWEC Involvement in Local Government Elections ...................................................................................... 31 2012 Local Government Elections - Legislative Reforms ................................................................................. 32
Local Government (Shellharbour and Wollongong Elections) Act 2011 – In force 10 May 2011 ...... 33 Local Government Amendment (Elections) Act 2011 – In force 27 June 2011 .................................. 33 Local Government (General) Amendment (Election Procedures) Regulation 2012 - In force from 24
February 2012. ............................................................................................................................................ 33 Local Government Amendment (Elections) Act 2012 - In force from 11 April 2012. .......................... 34 Local Government Amendment Act 2012 - In force from 4 April 2012. ............................................... 34
2012 Local Government Elections – General Communication Strategy ..................................................... 34
Statutory Advertising ................................................................................................................................. 35 Media Communications Strategy ............................................................................................................ 35 NSWEC Website www.elections.nsw.gov.au .......................................................................................... 36 Consultation with NSW Councils and the NSW Government ................................................................ 37
2012 Local Government Elections - Financial Arrangements ........................................................................ 37
Funding of Local Government Elections ................................................................................................. 37 No advance payment from councils and no deferral of payment for councils ................................ 37
Council Costing Model for the 2012 Local Government Elections ............................................................... 38
Metropolitan and Rural Pricing ................................................................................................................ 39
Major Budget Components .................................................................................................................................. 39
2012 Local Government Elections - Communication Campaign ........................................................ 40 Pursuing Efficiencies .................................................................................................................................. 41 Braille Voting .............................................................................................................................................. 42

REPORT ON THE 2012 LOCAL GOVERNMENT ELECTIONS
Contents
7
Section 4: 2012 Local Government Elections - Electoral Services for Electors ......................................... 43
Ensuring Equal Access to Democracy within the Community ....................................................................... 43
Services for Vision Impaired Electors ........................................................................................................ 43 Community Education Programme......................................................................................................... 43
Enrolment ................................................................................................................................................................. 49 Elector Enquiry Centre ........................................................................................................................................... 49 New Forms of Voting .............................................................................................................................................. 50 Arrangements for Voting before Election Day ................................................................................................. 50
Postal Voting .............................................................................................................................................. 50 Registered General Postal Voters ............................................................................................................ 51 Pre-Poll Voting ............................................................................................................................................ 51 Declared Institutions .................................................................................................................................. 51 Sydney Town Hall ....................................................................................................................................... 51
Voting on Election Day - Ordinary Polling .......................................................................................................... 52
Assistance to Electors When Voting ......................................................................................................... 52 Information on Candidates ...................................................................................................................... 52
Non-voters and Issuing of Penalty Notices ........................................................................................................ 53 Feedback from Electors ........................................................................................................................................ 54
Section 5: 2012 Local Government Elections - Electoral Services for Councils ....................................... 55
Mayoral Elections ................................................................................................................................................... 56 Constitutional Referenda ...................................................................................................................................... 56 Council Polls ............................................................................................................................................................ 57
Uncontested Elections .............................................................................................................................. 57
By–elections ............................................................................................................................................................. 58 Deferred Elections .................................................................................................................................................. 58 Redistribution of Council Ward Boundaries ....................................................................................................... 58
Ward Adjustment ....................................................................................................................................... 58 Abolition of Wards ..................................................................................................................................... 58 Local Government Boundary Alteration ................................................................................................. 59
Residential and Non-residential Electoral Rolls ................................................................................................. 59
Non-Residential Roll for Council of the City of Sydney .......................................................................... 60 Arrangements for Councils not using the NSWEC .................................................................................. 62
Council Liaison ........................................................................................................................................................ 62 Polling Places for Council Elections ..................................................................................................................... 62 Councils share Returning Officers........................................................................................................................ 63
Measuring success of the Regional Returning Officer Model ............................................................... 64
Returning Officers’ Offices .................................................................................................................................... 64 Council Services ..................................................................................................................................................... 65
The Counting Timeframe .......................................................................................................................... 65
REPORT ON THE 2012 LOCAL GOVERNMENT ELECTIONS
Contents
8
Vote Counting ........................................................................................................................................................ 65
Method of Election - Mayor ...................................................................................................................... 65 Method of Election - Councillor ............................................................................................................... 67 Councillor Elections ................................................................................................................................... 68
Proportional Representation Computer Count Data Entry System ............................................................... 68
Councillor Computer Count ..................................................................................................................... 68 Local Computer Count ............................................................................................................................. 70
Counting of Ballot Papers Election Night Counts ............................................................................................. 70
Polling Places ............................................................................................................................................. 70 Returning Officer’s office .......................................................................................................................... 71 NSWEC Virtual Tally Room ......................................................................................................................... 71 Referenda and Polls .................................................................................................................................. 71 Declaration of Election Results ................................................................................................................. 71 Recounts ..................................................................................................................................................... 72 Results of Referenda .................................................................................................................................. 73 Poll Results ................................................................................................................................................... 75
Feedback from Council General Managers ..................................................................................................... 75
Section 6: Electoral Services for Candidates, Groups and Political Parties .............................................. 76
Candidates.............................................................................................................................................................. 76 Registration of Political Parties ............................................................................................................................. 76 Information for Registered Political Parties, Candidates and Groups .......................................................... 76
Registered Political Parties ........................................................................................................................ 76 Candidate Information Seminars ............................................................................................................. 77 Candidate Information Kit ........................................................................................................................ 77 Candidate Enquiry and Help Desk .......................................................................................................... 77 Assistance with New Funding Disclosure Requirements ........................................................................ 77
Nominating as a Candidate ................................................................................................................................ 78
Candidate for “Popularly Elected” Mayor ............................................................................................. 79 Candidates for Councillor Positions ......................................................................................................... 79
Nomination Process ............................................................................................................................................... 79 Draw for Position on Ballot Paper ........................................................................................................................ 80 Provision of the List of Electors to Candidates................................................................................................... 80 Assistance with Registration and Distribution of Electoral Material ............................................................... 80 Scrutineers ................................................................................................................................................................ 80
Complaints and Allegations concerning Electoral Offences ............................................................... 81 Offences by candidates, groups and parties ........................................................................................ 81 Eligibility of candidates ............................................................................................................................. 81
Feedback from Candidates and Registered Political Parties ........................................................................ 81
Section 7: 2012 Local Government Elections - Support for Election Staff and Election Administration . 82
Recruitment of Election Staff ................................................................................................................................ 83
Recruitment of Returning Officer Support Officers and Returning Officers ......................................... 83 Recruitment of Office Assistants and Polling Place Officials ................................................................. 83
REPORT ON THE 2012 LOCAL GOVERNMENT ELECTIONS
Contents
9
Determination of Staff Numbers .......................................................................................................................... 84 Returning Officer Support Officers ...................................................................................................................... 86 Returning Officers ................................................................................................................................................... 86 Training of Election Staff ........................................................................................................................................ 86
Returning Officer Support Officer Training Programme ......................................................................... 87
Operational Support of Election Staff ................................................................................................................. 89
Handbooks, Manuals and Resources ...................................................................................................... 89 Procurement of Equipment and Materials .............................................................................................. 90 Telecommunications and Computer Support Services ......................................................................... 91 Web Based Payroll ..................................................................................................................................... 92 Supplier Arrangements .............................................................................................................................. 92 Collection of Materials Post Election ....................................................................................................... 92 Workplace Safety ...................................................................................................................................... 92
Feedback from Election Staff............................................................................................................................... 93
Impartial Conduct of the Election ........................................................................................................... 93 Training ........................................................................................................................................................ 94 Workplace Safety ...................................................................................................................................... 94
Section 8: Terms of Reference Inquiry into the Conduct of the 2012 Local Government Elections ....... 95
Terms of Reference (b) ‘the experience of councils that conducted their own elections’..................... 95 Terms of Reference (e) ‘the impact of requirements under the Election Funding, Expenditure and
Disclosures Act 1981 on participation by candidates in Local Government elections and possible
legislative changes to remove any barriers to participation’ ........................................................................ 96
Proposals for Consideration ...................................................................................................................... 96
Section 9: Future Directions ........................................................................................................................... 98
Proposed Legislative Changes ............................................................................................................................ 98
Universal Postal Voting .............................................................................................................................. 98 The Benefits of Internet and Telephone Voting be considered ............................................................ 99 Meeting the Needs of Electors with Disabilities ...................................................................................... 99 Other Legislative Amendments ................................................................................................................ 99 Candidate Information Sheets ............................................................................................................... 100
Funding Model for Future Council Elections .................................................................................................... 100
List of Tables ...................................................................................................................................................... 103
Part 2
Comparison across Councils with NSWEC conducted Elections. ................................................................. 105 Individual Council Reports ................................................................................................................................ 107
Albury City Council Report ................................................................................................................................. 108 Armidale Dumaresq Council Report ................................................................................................................. 113 Ashfield Council Report ....................................................................................................................................... 117 Auburn City Council Report ............................................................................................................................... 123 Ballina Shire Council Report ............................................................................................................................... 129 Balranald Shire Council Report .......................................................................................................................... 134 Bankstown City Council Report ......................................................................................................................... 138 Bathurst Regional Council Report ..................................................................................................................... 144

REPORT ON THE 2012 LOCAL GOVERNMENT ELECTIONS
Contents
10
Bega Valley Shire Council Report ..................................................................................................................... 149 Bellingen Shire Council Report ........................................................................................................................... 154 Berrigan Shire Council Report ............................................................................................................................ 159 Blacktown City Council Report .......................................................................................................................... 163 Bland Shire Council Report ................................................................................................................................. 169 Blayney Shire Council Report ............................................................................................................................. 173 Blue Mountains City Council Report ................................................................................................................. 177 Bogan Shire Council Report ............................................................................................................................... 183 Bombala Council Report .................................................................................................................................... 187 Boorowa Council Report .................................................................................................................................... 191 Bourke Shire Council Report ............................................................................................................................... 195 Brewarrina Shire Council Report ........................................................................................................................ 199 Broken Hill City Council Report........................................................................................................................... 203 Burwood Council Report ..................................................................................................................................... 208 Byron Shire Council Report ................................................................................................................................. 213 Cabonne Shire Council Report .......................................................................................................................... 218 Camden Council Report .................................................................................................................................... 222 Campbelltown City Council Report ................................................................................................................. 227 City of Canada Bay Council Report ................................................................................................................. 233 Canterbury City Council Report ........................................................................................................................ 238 Carrathool Shire Council Report ........................................................................................................................ 244 Central Darling Shire Council Report ................................................................................................................ 248 Clarence Valley Council Report ........................................................................................................................ 253 Cobar Shire Council Report ................................................................................................................................ 257 Conargo Shire Council Report ........................................................................................................................... 260 Coolamon Shire Council Report ........................................................................................................................ 264 Cooma-Monaro Shire Council Report .............................................................................................................. 268 Coonamble Shire Council Report ..................................................................................................................... 272 Cootamundra Shire Council Report ................................................................................................................. 276 Corowa Shire Council Report............................................................................................................................. 280 Cowra Shire Council Report ............................................................................................................................... 283 Deniliquin Council Report ................................................................................................................................... 287 Dubbo City Council Report ................................................................................................................................ 290 Dungog Shire Council Report ............................................................................................................................ 295 Eurobodalla Shire Council Report ..................................................................................................................... 300 Forbes Shire Council Report ............................................................................................................................... 306 Gilgandra Shire Council Report ......................................................................................................................... 310 Glen Innes Severn Council Report .................................................................................................................... 314 Gloucester Shire Council Report ....................................................................................................................... 318 Gosford City Council Report .............................................................................................................................. 322 Goulburn Mulwaree Council Report ................................................................................................................. 326 Great Lakes Council Report ............................................................................................................................... 330 Greater Hume Shire Council Report ................................................................................................................. 335 Greater Taree City Council Report ................................................................................................................... 340 Griffith City Council Report ................................................................................................................................. 345 Gundagai Shire Council Report......................................................................................................................... 350 Guyra Shire Council Report ................................................................................................................................ 354 Gwydir Shire Council Report .............................................................................................................................. 358 Harden Shire Council Report .............................................................................................................................. 362 Hawkesbury City Council Report ....................................................................................................................... 366 Hay Shire Council Report .................................................................................................................................... 371 Holroyd City Council Report ............................................................................................................................... 375 The Council of the Shire of Hornsby Report ..................................................................................................... 381 The Council of the Municipality of Hunters Hill Report ................................................................................... 387 Hurstville City Council Report ............................................................................................................................. 392 Inverell Shire Council Report ............................................................................................................................... 398 Jerilderie Shire Council Report ........................................................................................................................... 402 Junee Shire Council Report ................................................................................................................................ 406 The Council of the Municipality of Kiama Report ........................................................................................... 410 Kogarah City Council Report ............................................................................................................................. 414 Ku-ring-gai Council Report ................................................................................................................................. 420 Kyogle Council Report ........................................................................................................................................ 426 Lachlan Shire Council Report ............................................................................................................................. 431 Leeton Shire Council Report ............................................................................................................................... 436
REPORT ON THE 2012 LOCAL GOVERNMENT ELECTIONS
Contents
11
Leeton Shire Council By-election Report ......................................................................................................... 439 Leichhardt Municipal Council Report............................................................................................................... 442 Lismore City Council Report ............................................................................................................................... 448 City of Lithgow Council Report .......................................................................................................................... 454 Liverpool City Council Report ............................................................................................................................ 459 Liverpool Plains Shire Council Report ................................................................................................................ 465 Lockhart Shire Council Report ............................................................................................................................ 469 Manly Council Report .......................................................................................................................................... 474 Marrickville Council Report ................................................................................................................................. 479 Mid-Western Regional Council Report ............................................................................................................. 485 Moree Plains Shire Council Report .................................................................................................................... 489 Mosman Municipal Council Report .................................................................................................................. 493 Murray Shire Council Report ............................................................................................................................... 498 Murrumbidgee Shire Council Report ................................................................................................................ 502 Muswellbrook Shire Council Report ................................................................................................................... 507 Nambucca Shire Council Report ...................................................................................................................... 511 Narrabri Shire Council Report ............................................................................................................................. 515 Narrandera Shire Council Report ...................................................................................................................... 519 Narromine Shire Council Report ........................................................................................................................ 521 North Sydney Council Report ............................................................................................................................. 525 Oberon Council Report ....................................................................................................................................... 531 Orange City Council Report............................................................................................................................... 534 Palerang Council Report .................................................................................................................................... 539 Parkes Shire Council Report ................................................................................................................................ 543 Parramatta City Council Report ........................................................................................................................ 547 Pittwater Council Report ..................................................................................................................................... 553 Port Macquarie-Hastings Council Report ........................................................................................................ 558 Queanbeyan City Council Report .................................................................................................................... 563 Randwick City Council Report ........................................................................................................................... 568 Richmond Valley Council Report ...................................................................................................................... 574 Rockdale City Council Report ........................................................................................................................... 578 Ryde City Council Report ................................................................................................................................... 584 Singleton Council Report .................................................................................................................................... 590 Snowy River Shire Council Report ...................................................................................................................... 595 Strathfield Municipal Council Report ................................................................................................................ 599 Council of the City of Sydney Report ............................................................................................................... 604 Tamworth Regional Council Report .................................................................................................................. 609 Temora Shire Council Report .............................................................................................................................. 613 Tenterfield Shire Council Report ........................................................................................................................ 617 The Hills Shire Council Report .............................................................................................................................. 622 Tumbarumba Shire Council Report ................................................................................................................... 628 Tumut Shire Council Report ................................................................................................................................ 632 Tweed Shire Council Report ............................................................................................................................... 636 Upper Hunter Shire Council Report ................................................................................................................... 641 Upper Lachlan Shire Council Report................................................................................................................. 645 Uralla Shire Council Report ................................................................................................................................. 649 Urana Shire Council Report ................................................................................................................................ 654 Wagga Wagga City Council Report ................................................................................................................ 659 The Council of the Shire of Wakool Report ...................................................................................................... 664 Walcha Council Report ....................................................................................................................................... 669 Walgett Shire Council Report ............................................................................................................................. 674 Warren Shire Council Report .............................................................................................................................. 678 Warringah Council Report .................................................................................................................................. 681 Warrumbungle Shire Council Report ................................................................................................................ 687 Waverley Council Report .................................................................................................................................... 691 Weddin Shire Council Report ............................................................................................................................. 697 Wellington Council Report .................................................................................................................................. 701 Wentworth Shire Council Report ....................................................................................................................... 705 Willoughby City Council Report ......................................................................................................................... 709 Wingecarribee Shire Council Report ................................................................................................................ 715 Wollondilly Shire Council Report ........................................................................................................................ 720 Woollahra Municipal Council Report ............................................................................................................... 726 Wyong Shire Council Report .............................................................................................................................. 732 Yass Valley Council Report ................................................................................................................................. 737

REPORT ON THE 2012 LOCAL GOVERNMENT ELECTIONS
Contents
12
Young Shire Council Report................................................................................................................................ 741
Part 3
Appendices .................................................................................................................................................................
................................................................................................................................................................................. 745
Appendix A: 2012 Local Government Elections Councils utilising the NSW Electoral Commission to
provide their Elections ......................................................................................................................................... 746 Appendix B: 2012 Local Government Elections NSWEC Service Charter .................................................. 747 Appendix C: 2012 Local Government Elections Elector Enquiry Centre and Enrolment Enquiries ....... 759 Appendix D: 2012 Local Government Elections Councils Administering their Elections and
Participation in the Sydney Town Hall Initiative. ............................................................................................. 763 Appendix E: 2012 Local Government Elections - Elections per Council .................................................... 764 Appendix F: 2012 Local Government Elections - Councils with Mayoral Elections .................................. 768 Appendix G: 2012 Local Government Elections Referenda and Polls ....................................................... 769 Appendix H: 2012 Local Government Elections Non-resident Enrolment numbers by Council ............. 773 Appendix I: 2012 Local Government Elections Regions, Stand Alone Elections and Location of
Returning Officers ................................................................................................................................................. 774 Appendix J: 2012 Local Government Elections Political Parties Registered and Participating ............. 777 Appendix K: 2012 Local Government Elections Attendance at Candidate Seminars ........................... 779 Appendix L: 2012 Local Government Elections Languages spoken by Election Officials ...................... 781 Appendix M: 2012 Local Government Elections Electors Satisfaction Study ............................................ 785 Appendix N: 2012 Local Government Elections Survey of Electors at Sydney Town Hall ....................... 875
REPORT ON THE 2012 LOCAL GOVERNMENT ELECTIONS
Part 1
13
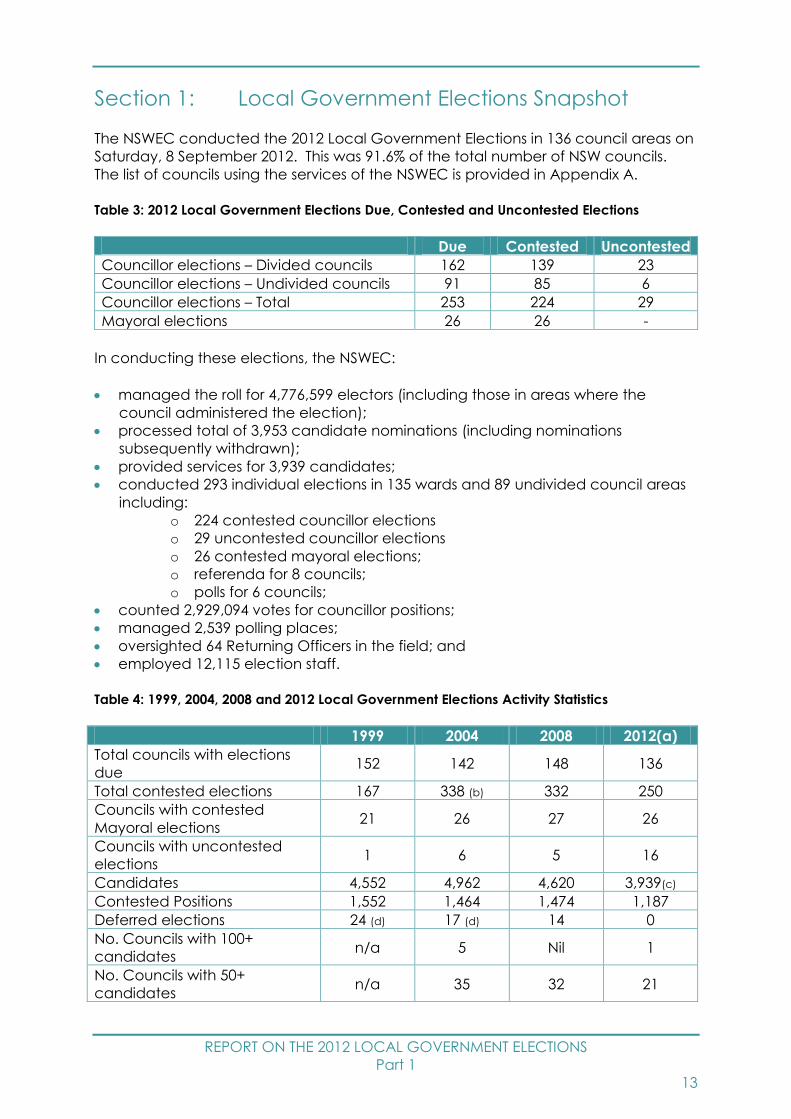
Section 1: Local Government Elections Snapshot
The NSWEC conducted the 2012 Local Government Elections in 136 council areas on
Saturday, 8 September 2012. This was 91.6% of the total number of NSW councils.
The list of councils using the services of the NSWEC is provided in Appendix A.
Table 3: 2012 Local Government Elections Due, Contested and Uncontested Elections
Due Contested Uncontested
Councillor elections – Divided councils 162 139 23
Councillor elections – Undivided councils 91 85 6
Councillor elections – Total 253 224 29
Mayoral elections 26 26 -
In conducting these elections, the NSWEC:
managed the roll for 4,776,599 electors (including those in areas where the
council administered the election);
processed total of 3,953 candidate nominations (including nominations
subsequently withdrawn);
provided services for 3,939 candidates;
conducted 293 individual elections in 135 wards and 89 undivided council areas
including:
o 224 contested councillor elections
o 29 uncontested councillor elections
o 26 contested mayoral elections;
o referenda for 8 councils;
o polls for 6 councils;
counted 2,929,094 votes for councillor positions;
managed 2,539 polling places;
oversighted 64 Returning Officers in the field; and
employed 12,115 election staff.
Table 4: 1999, 2004, 2008 and 2012 Local Government Elections Activity Statistics
1999 2004 2008 2012(a)
Total councils with elections
due 152 142 148 136
Total contested elections 167 338 (b) 332 250
Councils with contested
Mayoral elections 21 26 27 26
Councils with uncontested
elections 1 6 5 16
Candidates 4,552 4,962 4,620 3,939(c)
Contested Positions 1,552 1,464 1,474 1,187
Deferred elections 24 (d) 17 (d) 14 0
No. Councils with 100+
candidates n/a 5 Nil 1
No. Councils with 50+
candidates n/a 35 32 21
REPORT ON THE 2012 LOCAL GOVERNMENT ELECTIONS
Part 1
14
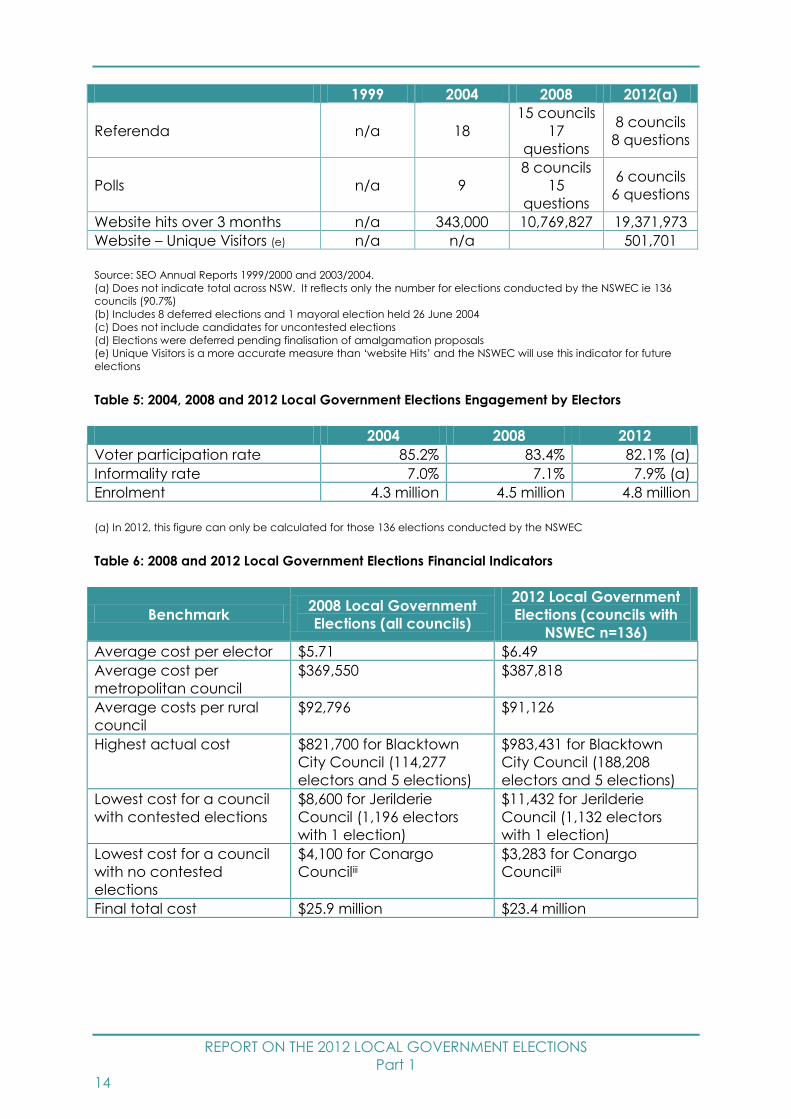
1999 2004 2008 2012(a)
Referenda n/a 18
15 councils
17
questions
8 councils
8 questions
Polls n/a 9
8 councils
15
questions
6 councils
6 questions
Website hits over 3 months n/a 343,000 10,769,827 19,371,973
Website – Unique Visitors (e) n/a n/a 501,701
Source: SEO Annual Reports 1999/2000 and 2003/2004.
(a) Does not indicate total across NSW. It reflects only the number for elections conducted by the NSWEC ie 136
councils (90.7%)
(b) Includes 8 deferred elections and 1 mayoral election held 26 June 2004
(c) Does not include candidates for uncontested elections
(d) Elections were deferred pending finalisation of amalgamation proposals
(e) Unique Visitors is a more accurate measure than ‘website Hits’ and the NSWEC will use this indicator for future
elections
Table 5: 2004, 2008 and 2012 Local Government Elections Engagement by Electors
2004 2008 2012
Voter participation rate 85.2% 83.4% 82.1% (a)
Informality rate 7.0% 7.1% 7.9% (a)
Enrolment 4.3 million 4.5 million 4.8 million
(a) In 2012, this figure can only be calculated for those 136 elections conducted by the NSWEC
Table 6: 2008 and 2012 Local Government Elections Financial Indicators
Benchmark 2008 Local Government
Elections (all councils)
2012 Local Government
Elections (councils with
NSWEC n=136)
Average cost per elector $5.71 $6.49
Average cost per
metropolitan council
$369,550 $387,818
Average costs per rural
council
$92,796 $91,126
Highest actual cost $821,700 for Blacktown
City Council (114,277
electors and 5 elections)
$983,431 for Blacktown
City Council (188,208
electors and 5 elections)
Lowest cost for a council
with contested elections
$8,600 for Jerilderie
Council (1,196 electors
with 1 election)
$11,432 for Jerilderie
Council (1,132 electors
with 1 election)
Lowest cost for a council
with no contested
elections
$4,100 for Conargo
Counciliii
$3,283 for Conargo
Counciliii
Final total cost $25.9 million $23.4 million
REPORT ON THE 2012 LOCAL GOVERNMENT ELECTIONS
Part 1
15
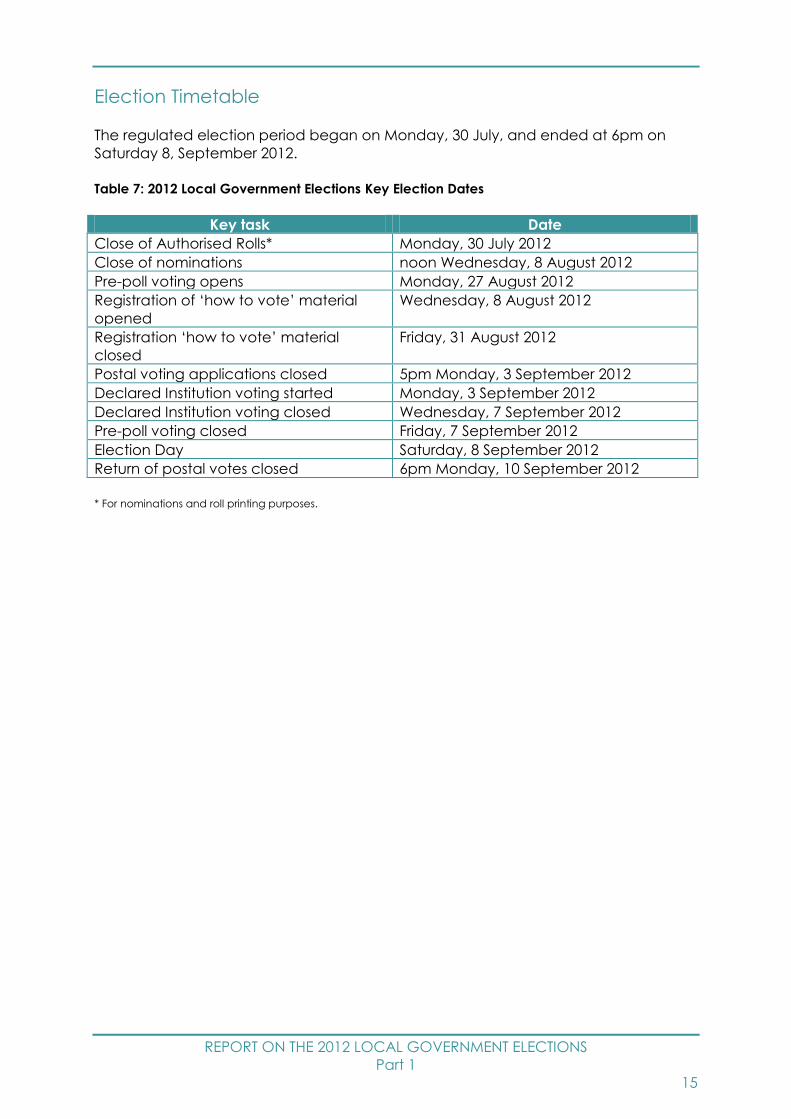
Election Timetable
The regulated election period began on Monday, 30 July, and ended at 6pm on
Saturday 8, September 2012.
Table 7: 2012 Local Government Elections Key Election Dates
Key task Date
Close of Authorised Rolls* Monday, 30 July 2012
Close of nominations noon Wednesday, 8 August 2012
Pre-poll voting opens Monday, 27 August 2012
Registration of ‘how to vote’ material
opened
Wednesday, 8 August 2012
Registration ‘how to vote’ material
closed
Friday, 31 August 2012
Postal voting applications closed 5pm Monday, 3 September 2012
Declared Institution voting started Monday, 3 September 2012
Declared Institution voting closed Wednesday, 7 September 2012
Pre-poll voting closed Friday, 7 September 2012
Election Day Saturday, 8 September 2012
Return of postal votes closed 6pm Monday, 10 September 2012
* For nominations and roll printing purposes.
REPORT ON THE 2012 LOCAL GOVERNMENT ELECTIONS
Part 1
16
Section 2: 2012 Local Government Elections - NSW
Electoral Commission’s Performance
The 2008 Local Government Elections provided a baseline for future elections in
terms of election costs, feedback from stakeholders, service standards and a
consistent and documented performance measurement methodology.
As part of the NSWEC’s commitment to provide high quality, value for money
services for the 2012 Local Government Elections, we measured our performance
against the 2008 elections. Drawing comparisons between different Local
Government elections within NSW is not straightforward due to the lack of
comparative data, different definitions and different methodologies used for
calculating key measures, for example, participation rates. Unfortunately, the 2011
legislative changes have meant some comparisons to 2008 data are more difficult as
in 2008 the NSWEC conducted elections for all councils whereas in 2012 it did not. It
is also difficult to benchmark performance between Electoral Commissions across
Australia on key indicators such as timeliness for declaration of results and the cost of
elections as the arrangements for Local Government elections differ across
jurisdictions. Only NSW requires full attendance voting for Local Government
elections with the other States and Territories using either full postal voting or a mix of
postal and attendance voting.
Important measures of the NSWEC’s performance in conducting the 2012 Local
Government Elections are:
response to the recommendations of the Joint Standing Committee’s Inquiry into
the 2008 Local Government Elections;
performance against the targets set down in the NSWEC’s ‘Service Charter’; and
feedback by stakeholders through surveys of electors, General Managers,
registered political parties, candidates, media representatives and election staff.
Response to the Inquiry into the 2008 Local Government Elections
The Joint Standing Committee on Electoral Matters’ Report on the 2008 Local
Government Elections produced 16 recommendations. Of these, six required
legislative action before the NSWEC could implement these directions.
Where possible, the NSWEC adopted the intent of the recommendations even
though legislative amendment was required but not achieved. For example,
Recommendation 2 sought amendment of the Local Government Act 1993 to
address the content and timing of the report on the conduct of the Local
Government elections. The NSWEC has voluntarily adopted the format and
schedule proposed.
The Committee’s recommendations and the NSWEC’s response to each are set out
below.
REPORT ON THE 2012 LOCAL GOVERNMENT ELECTIONS
Part 1
17
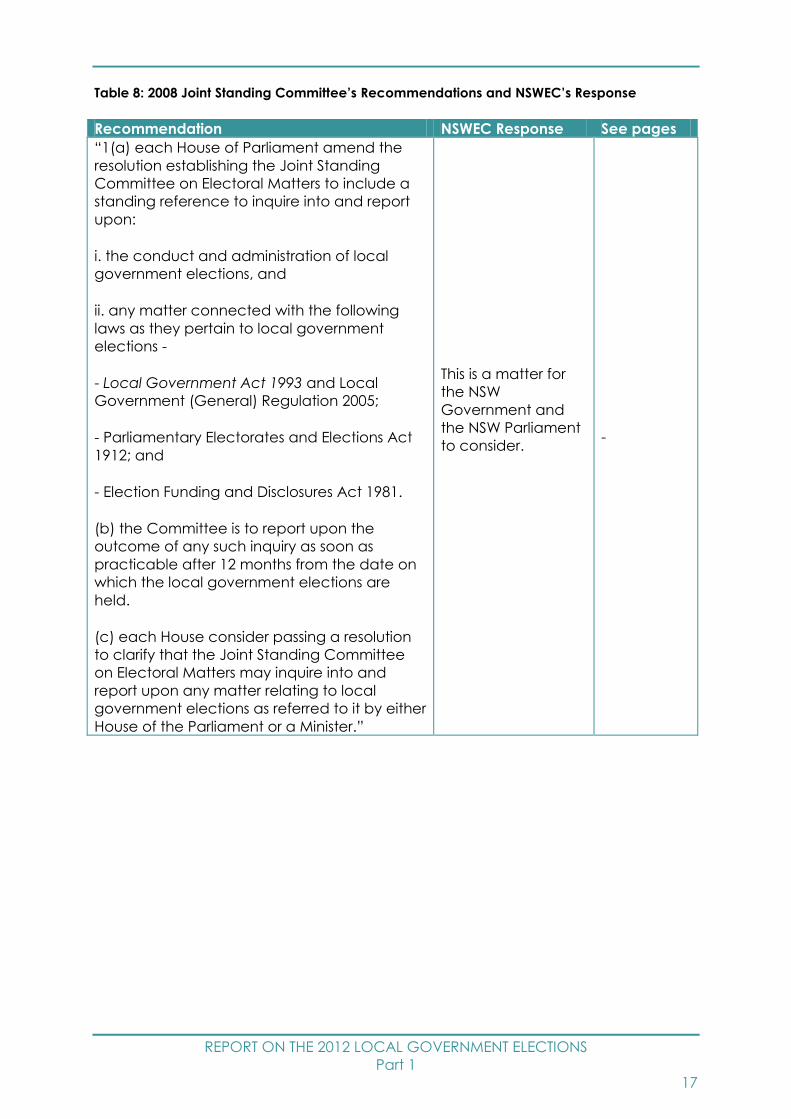
Table 8: 2008 Joint Standing Committee’s Recommendations and NSWEC’s Response
Recommendation NSWEC Response See pages
“1(a) each House of Parliament amend the
resolution establishing the Joint Standing
Committee on Electoral Matters to include a
standing reference to inquire into and report
upon:
i. the conduct and administration of local
government elections, and
ii. any matter connected with the following
laws as they pertain to local government
elections -
- Local Government Act 1993 and Local
Government (General) Regulation 2005;
- Parliamentary Electorates and Elections Act
1912; and
- Election Funding and Disclosures Act 1981.
(b) the Committee is to report upon the
outcome of any such inquiry as soon as
practicable after 12 months from the date on
which the local government elections are
held.
(c) each House consider passing a resolution
to clarify that the Joint Standing Committee
on Electoral Matters may inquire into and
report upon any matter relating to local
government elections as referred to it by either
House of the Parliament or a Minister.”
This is a matter for
the NSW
Government and
the NSW Parliament
to consider.
-
REPORT ON THE 2012 LOCAL GOVERNMENT ELECTIONS
Part 1
18
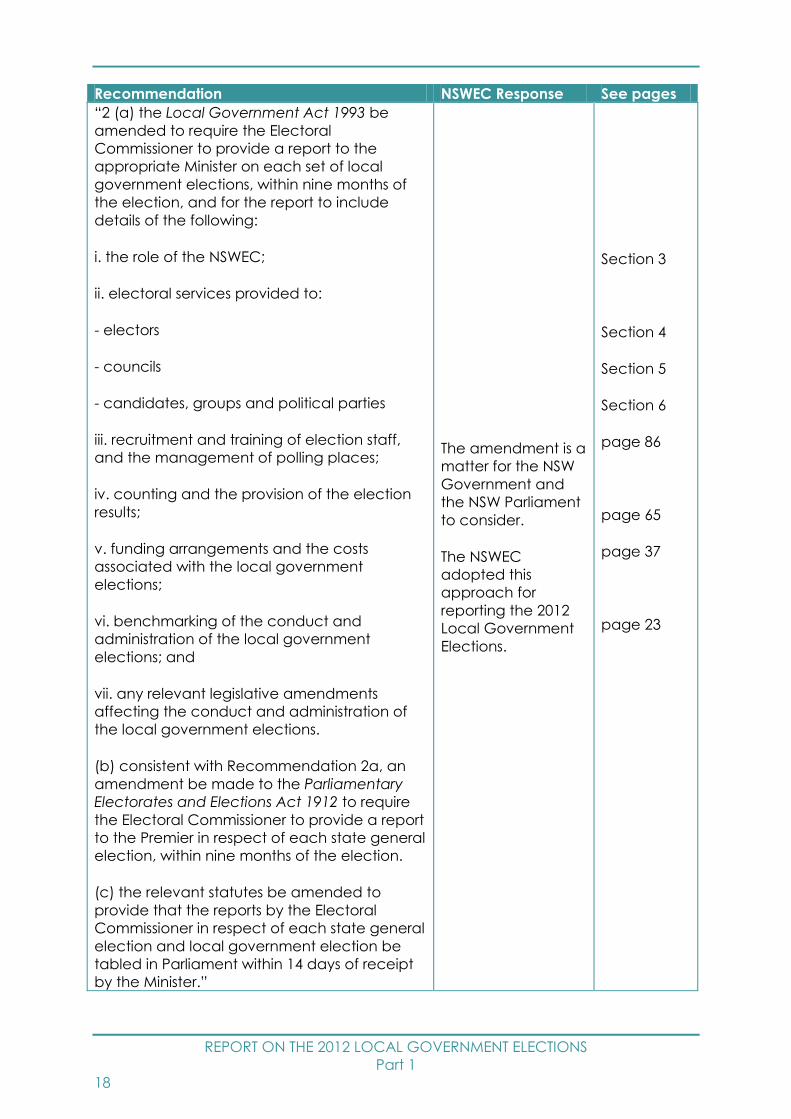
Recommendation NSWEC Response See pages
“2 (a) the Local Government Act 1993 be
amended to require the Electoral
Commissioner to provide a report to the
appropriate Minister on each set of local
government elections, within nine months of
the election, and for the report to include
details of the following:
i. the role of the NSWEC;
ii. electoral services provided to:
- electors
- councils
- candidates, groups and political parties
iii. recruitment and training of election staff,
and the management of polling places;
iv. counting and the provision of the election
results;
v. funding arrangements and the costs
associated with the local government
elections;
vi. benchmarking of the conduct and
administration of the local government
elections; and
vii. any relevant legislative amendments
affecting the conduct and administration of
the local government elections.
(b) consistent with Recommendation 2a, an
amendment be made to the Parliamentary
Electorates and Elections Act 1912 to require
the Electoral Commissioner to provide a report
to the Premier in respect of each state general
election, within nine months of the election.
(c) the relevant statutes be amended to
provide that the reports by the Electoral
Commissioner in respect of each state general
election and local government election be
tabled in Parliament within 14 days of receipt
by the Minister.”
The amendment is a
matter for the NSW
Government and
the NSW Parliament
to consider.
The NSWEC
adopted this
approach for
reporting the 2012
Local Government
Elections.
Section 3
Section 4
Section 5
Section 6
page 86
page 65
page 37
page 23

REPORT ON THE 2012 LOCAL GOVERNMENT ELECTIONS
Part 1
19
Recommendation NSWEC Response See pages
“3. The Joint Standing Committee on Electoral
Matters externally review the operation of the
full cost recovery model for the 2012 local
government general elections and, in light of
the findings of that review, consider the
necessity for engaging consultants to conduct
any subsequent external reviews of the
model.”
Supported but a
decision for the
JSCEM.
An evaluation
needs to cover all
council elections
including those
conducted by
councils or their
agents.
Information
on the
NSWEC’s
costing is at
page 38
“4. The NSW Electoral Commissioner ensure
that detailed information about the budgeted
and actual costs for the 2012 local
government elections be provided to all
council General Managers. Such detailed
information should provide explanations as to
what each line item covers, and how it has
been calculated and allocated.”
Information
provided to General
Managers May
2012.
page 38
“5. The Committee recommends that a higher
proportion of the NSW Government’s
advertising budget be spent advertising the
next local government election in the fortnight
preceding polling day.”
The NSW
Government does
not fund advertising
for Local
Government
elections.
The NSWEC added
internet advertising
and social media
communications
included to increase
awareness of the
2012 Local
Government
Elections.
page 40
REPORT ON THE 2012 LOCAL GOVERNMENT ELECTIONS
Part 1
20
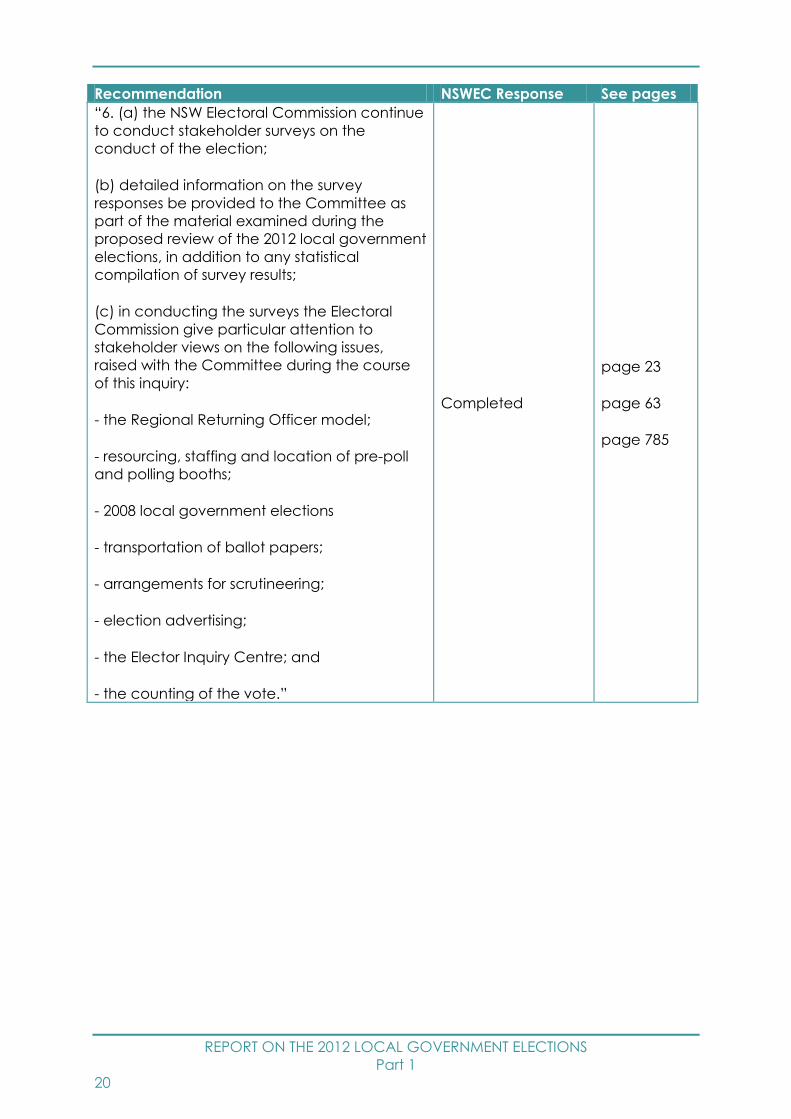
Recommendation NSWEC Response See pages
“6. (a) the NSW Electoral Commission continue
to conduct stakeholder surveys on the
conduct of the election;
(b) detailed information on the survey
responses be provided to the Committee as
part of the material examined during the
proposed review of the 2012 local government
elections, in addition to any statistical
compilation of survey results;
(c) in conducting the surveys the Electoral
Commission give particular attention to
stakeholder views on the following issues,
raised with the Committee during the course
of this inquiry:
- the Regional Returning Officer model;
- resourcing, staffing and location of pre-poll
and polling booths;
- 2008 local government elections
- transportation of ballot papers;
- arrangements for scrutineering;
- election advertising;
- the Elector Inquiry Centre; and
- the counting of the vote.”
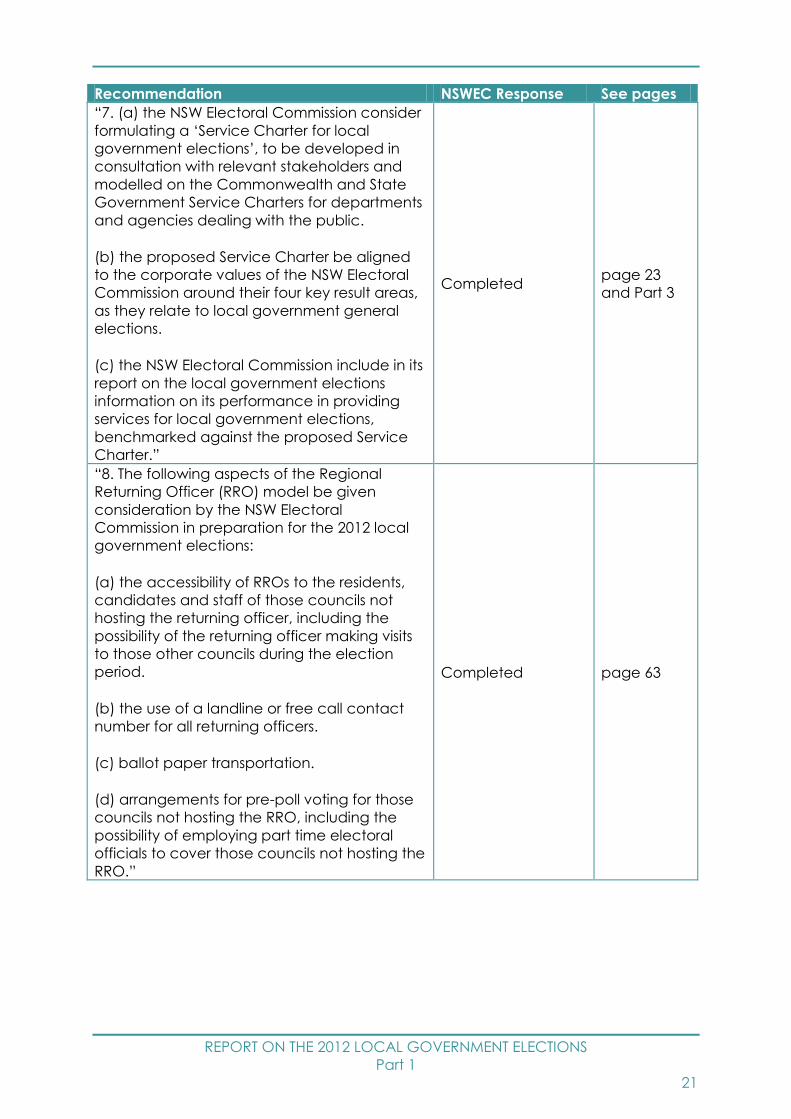
Completed
page 23
page 63
page 785
REPORT ON THE 2012 LOCAL GOVERNMENT ELECTIONS
Part 1
21
Recommendation NSWEC Response See pages
“7. (a) the NSW Electoral Commission consider
formulating a ‘Service Charter for local
government elections’, to be developed in
consultation with relevant stakeholders and
modelled on the Commonwealth and State
Government Service Charters for departments
and agencies dealing with the public.
(b) the proposed Service Charter be aligned
to the corporate values of the NSW Electoral
Commission around their four key result areas,
as they relate to local government general
elections.
(c) the NSW Electoral Commission include in its
report on the local government elections
information on its performance in providing
services for local government elections,
benchmarked against the proposed Service
Charter.”
Completed page 23
and Part 3
“8. The following aspects of the Regional
Returning Officer (RRO) model be given
consideration by the NSW Electoral
Commission in preparation for the 2012 local
government elections:
(a) the accessibility of RROs to the residents,
candidates and staff of those councils not
hosting the returning officer, including the
possibility of the returning officer making visits
to those other councils during the election
period.
(b) the use of a landline or free call contact
number for all returning officers.
(c) ballot paper transportation.
(d) arrangements for pre-poll voting for those
councils not hosting the RRO, including the
possibility of employing part time electoral
officials to cover those councils not hosting the
RRO.”
Completed page 63
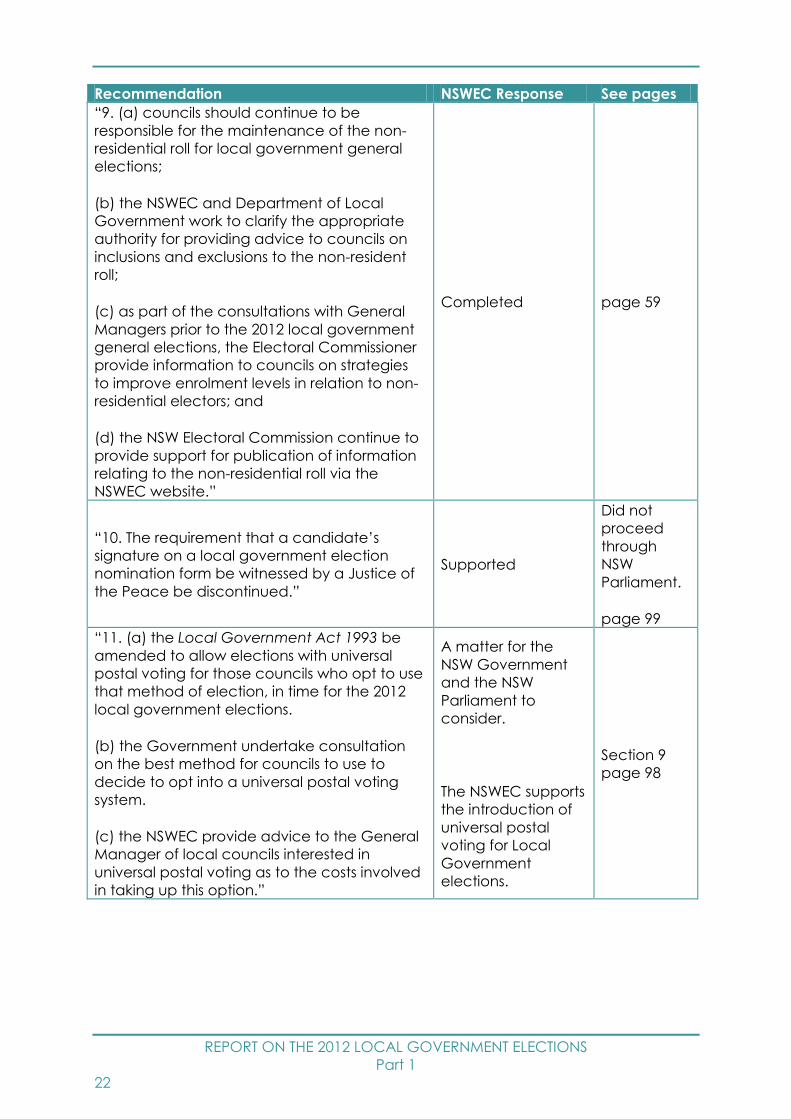
REPORT ON THE 2012 LOCAL GOVERNMENT ELECTIONS
Part 1
22
Recommendation NSWEC Response See pages
“9. (a) councils should continue to be
responsible for the maintenance of the non-
residential roll for local government general
elections;
(b) the NSWEC and Department of Local
Government work to clarify the appropriate
authority for providing advice to councils on
inclusions and exclusions to the non-resident
roll;
(c) as part of the consultations with General
Managers prior to the 2012 local government
general elections, the Electoral Commissioner
provide information to councils on strategies
to improve enrolment levels in relation to non-
residential electors; and
(d) the NSW Electoral Commission continue to
provide support for publication of information
relating to the non-residential roll via the
NSWEC website.”
Completed page 59
“10. The requirement that a candidate’s
signature on a local government election
nomination form be witnessed by a Justice of
the Peace be discontinued.”
Supported
Did not
proceed
through
NSW
Parliament.
page 99
“11. (a) the Local Government Act 1993 be
amended to allow elections with universal
postal voting for those councils who opt to use
that method of election, in time for the 2012
local government elections.
(b) the Government undertake consultation
on the best method for councils to use to
decide to opt into a universal postal voting
system.
(c) the NSWEC provide advice to the General
Manager of local councils interested in
universal postal voting as to the costs involved
in taking up this option.”
A matter for the
NSW Government
and the NSW
Parliament to
consider.
The NSWEC supports
the introduction of
universal postal
voting for Local
Government
elections.
Section 9
page 98
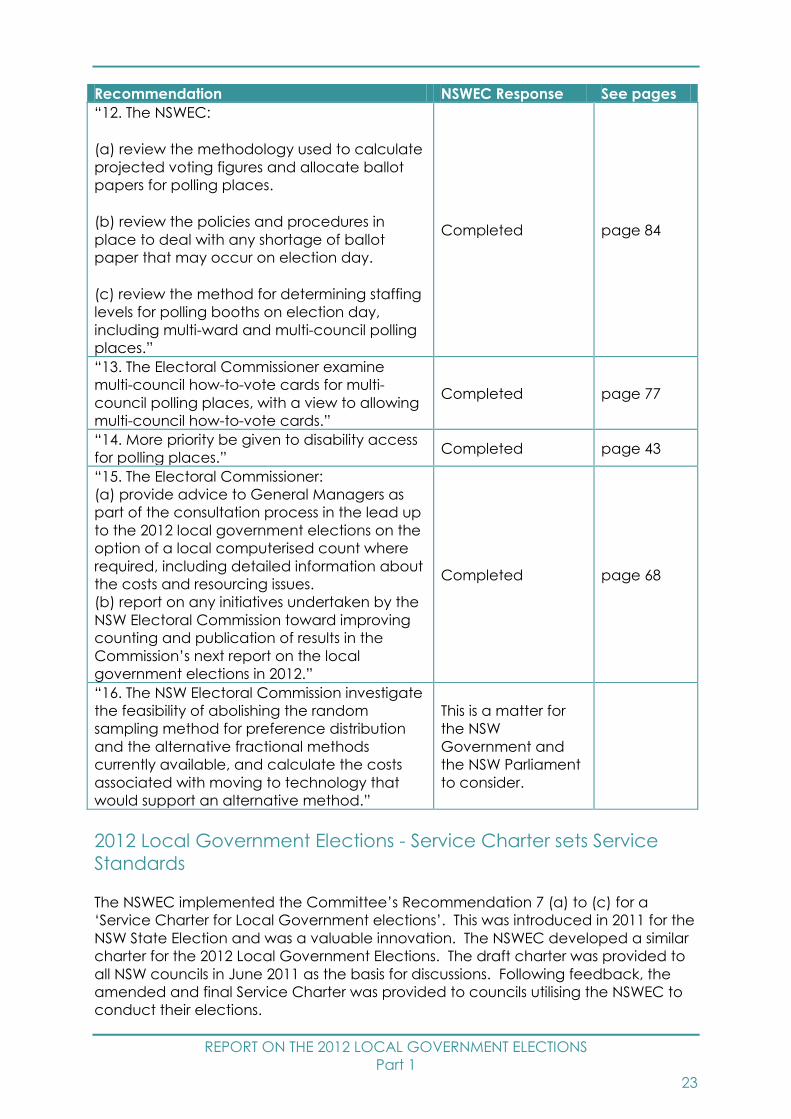
REPORT ON THE 2012 LOCAL GOVERNMENT ELECTIONS
Part 1
23
Recommendation NSWEC Response See pages
“12. The NSWEC:
(a) review the methodology used to calculate
projected voting figures and allocate ballot
papers for polling places.
(b) review the policies and procedures in
place to deal with any shortage of ballot
paper that may occur on election day.
(c) review the method for determining staffing
levels for polling booths on election day,
including multi-ward and multi-council polling
places.”
Completed page 84
“13. The Electoral Commissioner examine
multi-council how-to-vote cards for multi-
council polling places, with a view to allowing
multi-council how-to-vote cards.”
Completed page 77
“14. More priority be given to disability access
for polling places.” Completed page 43
“15. The Electoral Commissioner:
(a) provide advice to General Managers as
part of the consultation process in the lead up
to the 2012 local government elections on the
option of a local computerised count where
required, including detailed information about
the costs and resourcing issues.
(b) report on any initiatives undertaken by the
NSW Electoral Commission toward improving
counting and publication of results in the
Commission’s next report on the local
government elections in 2012.”
Completed page 68
“16. The NSW Electoral Commission investigate
the feasibility of abolishing the random
sampling method for preference distribution
and the alternative fractional methods
currently available, and calculate the costs
associated with moving to technology that
would support an alternative method.”
This is a matter for
the NSW
Government and
the NSW Parliament
to consider.
2012 Local Government Elections - Service Charter sets Service
Standards
The NSWEC implemented the Committee’s Recommendation 7 (a) to (c) for a
‘Service Charter for Local Government elections’. This was introduced in 2011 for the
NSW State Election and was a valuable innovation. The NSWEC developed a similar
charter for the 2012 Local Government Elections. The draft charter was provided to
all NSW councils in June 2011 as the basis for discussions. Following feedback, the
amended and final Service Charter was provided to councils utilising the NSWEC to
conduct their elections.
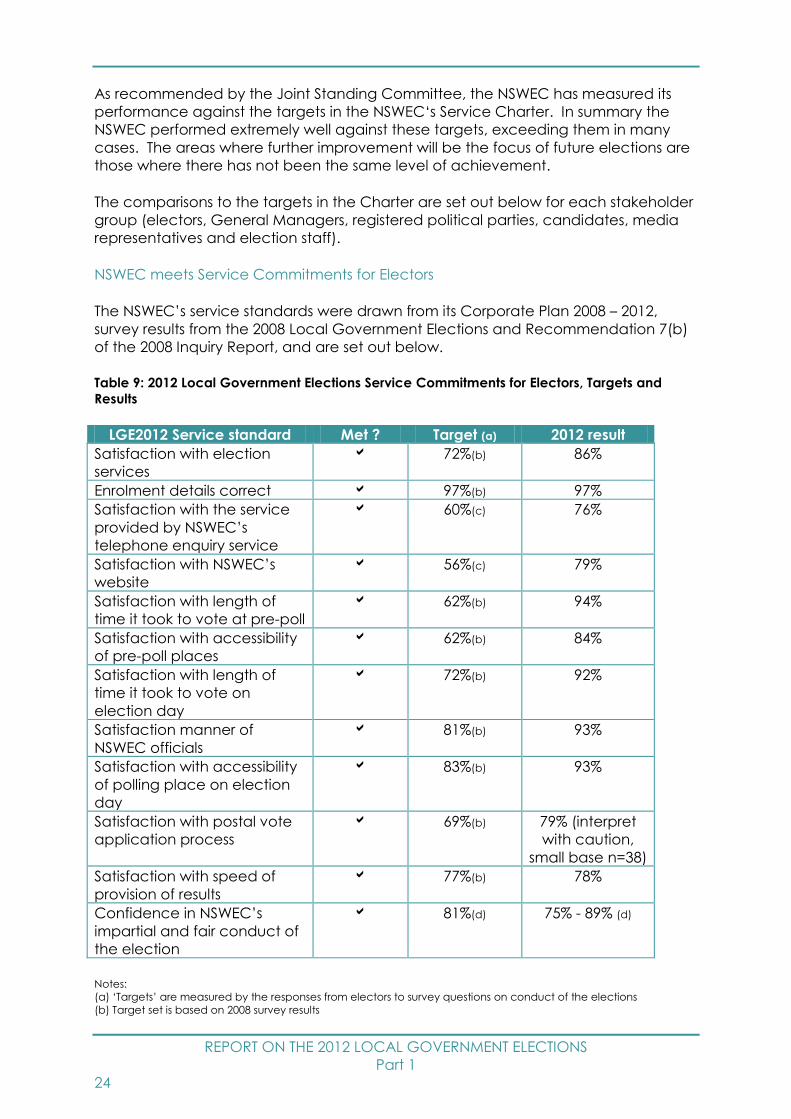
REPORT ON THE 2012 LOCAL GOVERNMENT ELECTIONS
Part 1
24
As recommended by the Joint Standing Committee, the NSWEC has measured its
performance against the targets in the NSWEC‘s Service Charter. In summary the
NSWEC performed extremely well against these targets, exceeding them in many
cases. The areas where further improvement will be the focus of future elections are
those where there has not been the same level of achievement.
The comparisons to the targets in the Charter are set out below for each stakeholder
group (electors, General Managers, registered political parties, candidates, media
representatives and election staff).
NSWEC meets Service Commitments for Electors
The NSWEC’s service standards were drawn from its Corporate Plan 2008 – 2012,
survey results from the 2008 Local Government Elections and Recommendation 7(b)
of the 2008 Inquiry Report, and are set out below.
Table 9: 2012 Local Government Elections Service Commitments for Electors, Targets and
Results
LGE2012 Service standard Met ? Target (a) 2012 result
Satisfaction with election
services
72%(b) 86%
Enrolment details correct 97%(b) 97%
Satisfaction with the service
provided by NSWEC’s
telephone enquiry service
60%(c) 76%
Satisfaction with NSWEC’s
website
56%(c) 79%
Satisfaction with length of
time it took to vote at pre-poll
62%(b) 94%
Satisfaction with accessibility
of pre-poll places
62%(b) 84%
Satisfaction with length of
time it took to vote on
election day
72%(b) 92%
Satisfaction manner of
NSWEC officials
81%(b) 93%
Satisfaction with accessibility
of polling place on election
day
83%(b) 93%
Satisfaction with postal vote
application process
69%(b) 79% (interpret
with caution,
small base n=38)
Satisfaction with speed of
provision of results
77%(b) 78%
Confidence in NSWEC’s
impartial and fair conduct of
the election
81%(d) 75% - 89% (d)
Notes:
(a) ‘Targets’ are measured by the responses from electors to survey questions on conduct of the elections
(b) Target set is based on 2008 survey results
REPORT ON THE 2012 LOCAL GOVERNMENT ELECTIONS
Part 1
25
(c) Target set is based on 2011 survey results as no available 2008 figure
(d) Range of responses from two independently conducted surveys
Survey Feedback from Electors
The NSWEC established two independent surveys of electors. One covered general
electoral issues and the other, the specific initiative trialled at Sydney Town Hall for
automatic processing of roll mark off and issue of ballot papers. The former survey
was representative of the general NSW elector population and provided indicative
comparisons between councils where the elections were conducted by the NSWEC
and those conducted by the council or their agent. Copies of the reports of these
two surveys are in Part 3.
Key Survey Findings
Overall the satisfaction with voting services was high and its noteworthy that this was
the case for all key voter groups – 87% of culturally and diverse communities, 89% of
indigenous voters, 83% of voters with a vision impairment. There was also no
significant difference whether respondents had voted early or on election day.
Most electors still preferred hardcopy information about the election although
younger voters were more positive about online and phone sources. Four in five
were satisfied with the website.
Those who contacted the phone enquiry service were more likely to be new voters,
those who had just turned 18, those who did not have correct electoral roll details or
who were voting before election day.
There were high levels of satisfaction with pre-poll voting (location 82%, accessibility
84%, time taken to vote 94% and helpfulness of staff 88%). Satisfaction with
information provided about pre-poll voting was not as high (54% positive and 23%
critical).
There were very high levels of satisfaction with convenience of the polling place
(92%), ease of entering and leaving the polling place (92%), polling place layout
(94%), ease of voting (91%), ballot paper instructions (83%) and time spent at polling
place (91%).
Voters in NSWEC conducted elections were more likely to be satisfied with the overall
experience of election officials than voters from councils where the elections were
not conducted by the NSWEC (89% compared to 84%).
Four in five electors were satisfied with the assistance provided by election officials at
polling places with only 3% critical.
Although internet and telephone voting was available in the 2011 State Election and
subsequent by-elections, iVote was not provided in the 2012 Local Government
Elections. Electors were asked if they would use this type of voting if it was available.
44% of voters would consider using iVote in the future with younger voters overall
more inclined to consider online voting than older voters (84% of those aged under
35 years compared to 60% of those aged 35 years and over). Those who were less
likely to consider online voting were more likely not to have used the NSWEC’s
REPORT ON THE 2012 LOCAL GOVERNMENT ELECTIONS
Part 1
26
website. Indigenous voters were more likely to prefer attendance voting and less
likely to consider and prefer online voting. Electors in regional areas were also less
likely to prefer online voting. This may have more to do with the quality of their
internet service as they were also less likely to want to receive electoral information
by email alerts.
Of the 31% of electors not willing to vote online, the main reasons given were privacy
concerns/not being computer literate, no internet access, fear of results
manipulation and concerns about hacking and viruses.
Satisfaction with voting initiatives at Sydney Town Hall (these reforms are outlined
from page 51):
86% of voters were satisfied with voting with more than half (56%) very satisfied;
there was a strong correlation between satisfaction and time taken to vote. The
proportion of those ‘very satisfied’ declined from 100% amongst those who only
waited 5 minutes to 40% for those who waited over 20 minutes. Even so, ‘very
dissatisfied’ ratings were only 6% of the total.
93% of voters were satisfied with the ease of voting with women slightly more
positive than men;
satisfaction with computerised ‘self-check off’ was high (93%). Satisfaction
correlated strongly with age with 87% of younger voters (18-24 years) ‘very
satisfied’ compared to 57% of those 55 years and over;
of the total sample of 180, only 9 were dissatisfied with computerised ‘self-check
off’. The reported reasons were security and privacy then ‘the system being
difficult to use’; and
satisfaction with using the docket to collect the ballot paper was high (95%).
Extending the Initiative:
88% thought the new process was better than the traditional process. Only 2%
thought the new process was worse than the old. Results were relatively
consistent across council area, age and gender; and
89% supported using this process in other polling places and only 7% disagreed.
Disagreement was higher amongst those aged 35-54 years than any other age
group. Reasons for not wishing to use the system in future ranged from wanting
the whole system computerised to wanting a person to do the checking off.
NSWEC meets Service Commitments for General Managers
The NSWEC’s service standards for General Managers were drawn also from its
Corporate Plan 2008 – 2012 and survey results from the 2008 Local Government
Elections. These were:
useful, accessible and timely information on election services and the electoral
system applying to Local Government elections;
timely, clear instructions on the rules of the elections such as how to register
electoral material;
efficient electoral services provided by trained and courteous election staff;
appropriate assistance with enquiries;
efficient nominations process;
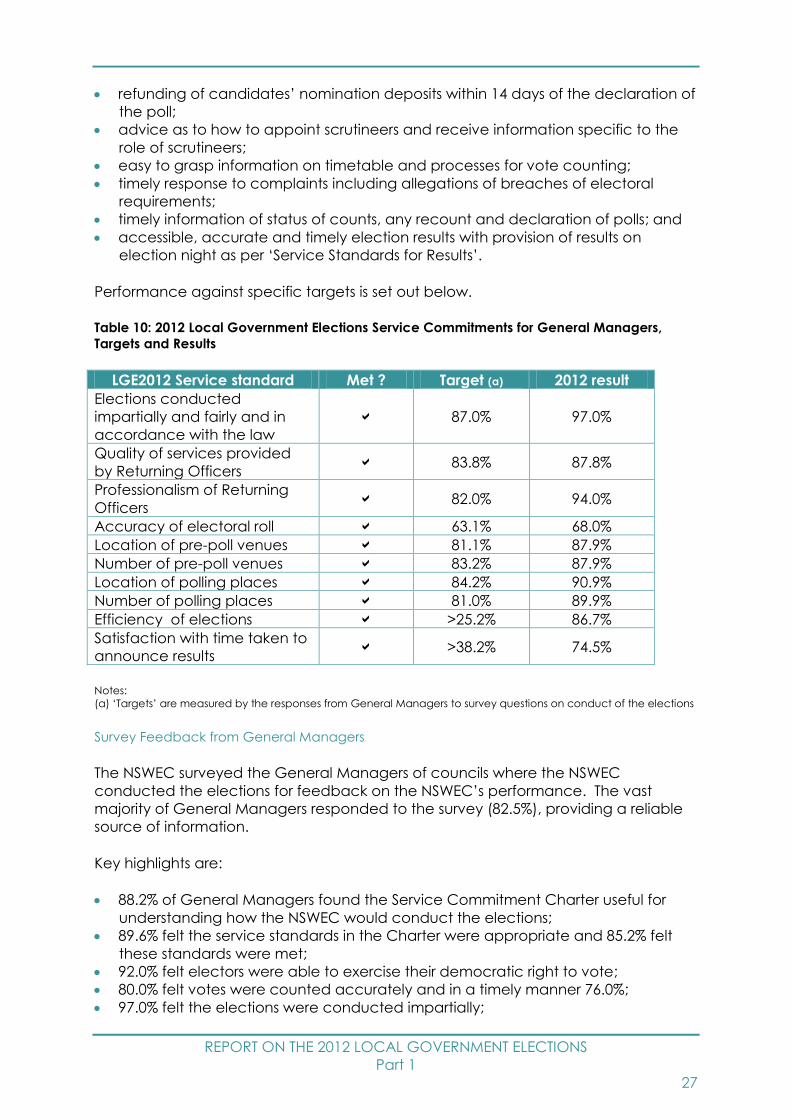
REPORT ON THE 2012 LOCAL GOVERNMENT ELECTIONS
Part 1
27
refunding of candidates’ nomination deposits within 14 days of the declaration of
the poll;
advice as to how to appoint scrutineers and receive information specific to the
role of scrutineers;
easy to grasp information on timetable and processes for vote counting;
timely response to complaints including allegations of breaches of electoral
requirements;
timely information of status of counts, any recount and declaration of polls; and
accessible, accurate and timely election results with provision of results on
election night as per ‘Service Standards for Results’.
Performance against specific targets is set out below.
Table 10: 2012 Local Government Elections Service Commitments for General Managers,
Targets and Results
LGE2012 Service standard Met ? Target (a) 2012 result
Elections conducted
impartially and fairly and in
accordance with the law
87.0% 97.0%
Quality of services provided
by Returning Officers 83.8% 87.8%
Professionalism of Returning
Officers 82.0% 94.0%
Accuracy of electoral roll 63.1% 68.0%
Location of pre-poll venues 81.1% 87.9%
Number of pre-poll venues 83.2% 87.9%
Location of polling places 84.2% 90.9%
Number of polling places 81.0% 89.9%
Efficiency of elections >25.2% 86.7%
Satisfaction with time taken to
announce results >38.2% 74.5%
Notes:
(a) ‘Targets’ are measured by the responses from General Managers to survey questions on conduct of the elections
Survey Feedback from General Managers
The NSWEC surveyed the General Managers of councils where the NSWEC
conducted the elections for feedback on the NSWEC’s performance. The vast
majority of General Managers responded to the survey (82.5%), providing a reliable
source of information.
Key highlights are:
88.2% of General Managers found the Service Commitment Charter useful for
understanding how the NSWEC would conduct the elections;
89.6% felt the service standards in the Charter were appropriate and 85.2% felt
these standards were met;
92.0% felt electors were able to exercise their democratic right to vote;
80.0% felt votes were counted accurately and in a timely manner 76.0%;
97.0% felt the elections were conducted impartially;

REPORT ON THE 2012 LOCAL GOVERNMENT ELECTIONS
Part 1
28
95.0% felt the outcomes of the elections were made available appropriately;
93.1% felt the council received regular and timely updates of progress on
preparations for the elections;
98.0% felt they received within reasonable timeframes, responses to enquiries and
correspondence;
85.0% were satisfied with the NSWEC’s advertising and 88.1% were satisfied with
the information on the NSWEC’s website;
87.8% felt council had received adequate information on preparation of the non-
residents roll;
91.9% felt there was adequate consultation on the number of polling places and
91.8% on the location of these polling places;
91.9% felt the NSWEC provided capable, informed and competent officials and
87.9% felt their Returning Officer was up to the task;
38.5% felt the results were declared sooner than in 2008; and
86.7% were satisfied with the efficiency of the NSWEC’s conduct of the elections
The areas where the NSWEC was seen to have performed less satisfactorily were in
raising awareness of the elections and securing participation, and preparation of the
electoral roll. Comments by the General Managers also acknowledged the cost
effectiveness of Returning Officers having more than one set of council elections to
administer but felt that this meant that results could be delayed for their council.
NSWEC meets majority of Service Commitments for Candidates and Political Parties
The response rate from candidates and registered political parties is low (11.4% of
candidates). The risk is that the results are unlikely to be representative of the wider
group of candidates.
Table 11: 2012 Local Government Elections Service Commitments for Candidates and Political
Parties, Targets and Results
LGE2012 Service standard Met ? Target (a) 2012 result
Satisfaction with electoral
services provided 76.7% 82.8%
Elections conducted impartially
and fairly and in accordance
with the law
91.4%
88.7%
Candidates
76.9% RPPs
Information for election funding
and disclosure requirements 84.7%
74.2%
Candidates
53.8% RPPs
Information provided by Enquiry
and Help Desk 80.6% 94.0%
Local count results 87.5% 78.6%
NSWEC’s website 72.2% 87.9%
Confirm candidate details on
website Supply
capacity 87.9%
Candidate information sheets
placed on website Supply
capacity 90.9%
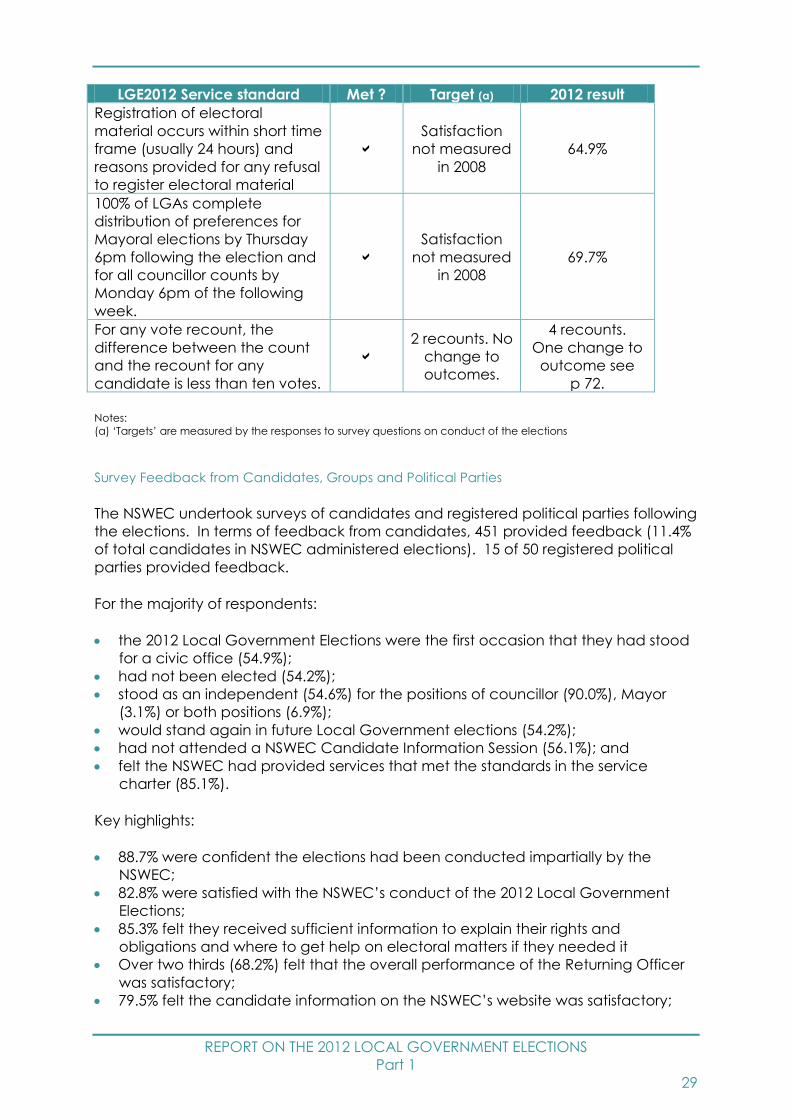
REPORT ON THE 2012 LOCAL GOVERNMENT ELECTIONS
Part 1
29
LGE2012 Service standard Met ? Target (a) 2012 result
Registration of electoral
material occurs within short time
frame (usually 24 hours) and
reasons provided for any refusal
to register electoral material
Satisfaction
not measured
in 2008
64.9%
100% of LGAs complete
distribution of preferences for
Mayoral elections by Thursday
6pm following the election and
for all councillor counts by
Monday 6pm of the following
week.
Satisfaction
not measured
in 2008
69.7%
For any vote recount, the
difference between the count
and the recount for any
candidate is less than ten votes.
2 recounts. No
change to
outcomes.
4 recounts.
One change to
outcome see
p 72.
Notes:
(a) ‘Targets’ are measured by the responses to survey questions on conduct of the elections
Survey Feedback from Candidates, Groups and Political Parties
The NSWEC undertook surveys of candidates and registered political parties following
the elections. In terms of feedback from candidates, 451 provided feedback (11.4%
of total candidates in NSWEC administered elections). 15 of 50 registered political
parties provided feedback.
For the majority of respondents:
the 2012 Local Government Elections were the first occasion that they had stood
for a civic office (54.9%);
had not been elected (54.2%);
stood as an independent (54.6%) for the positions of councillor (90.0%), Mayor
(3.1%) or both positions (6.9%);
would stand again in future Local Government elections (54.2%);
had not attended a NSWEC Candidate Information Session (56.1%); and
felt the NSWEC had provided services that met the standards in the service
charter (85.1%).
Key highlights:
88.7% were confident the elections had been conducted impartially by the
NSWEC;
82.8% were satisfied with the NSWEC’s conduct of the 2012 Local Government
Elections;
85.3% felt they received sufficient information to explain their rights and
obligations and where to get help on electoral matters if they needed it
Over two thirds (68.2%) felt that the overall performance of the Returning Officer
was satisfactory;
79.5% felt the candidate information on the NSWEC’s website was satisfactory;
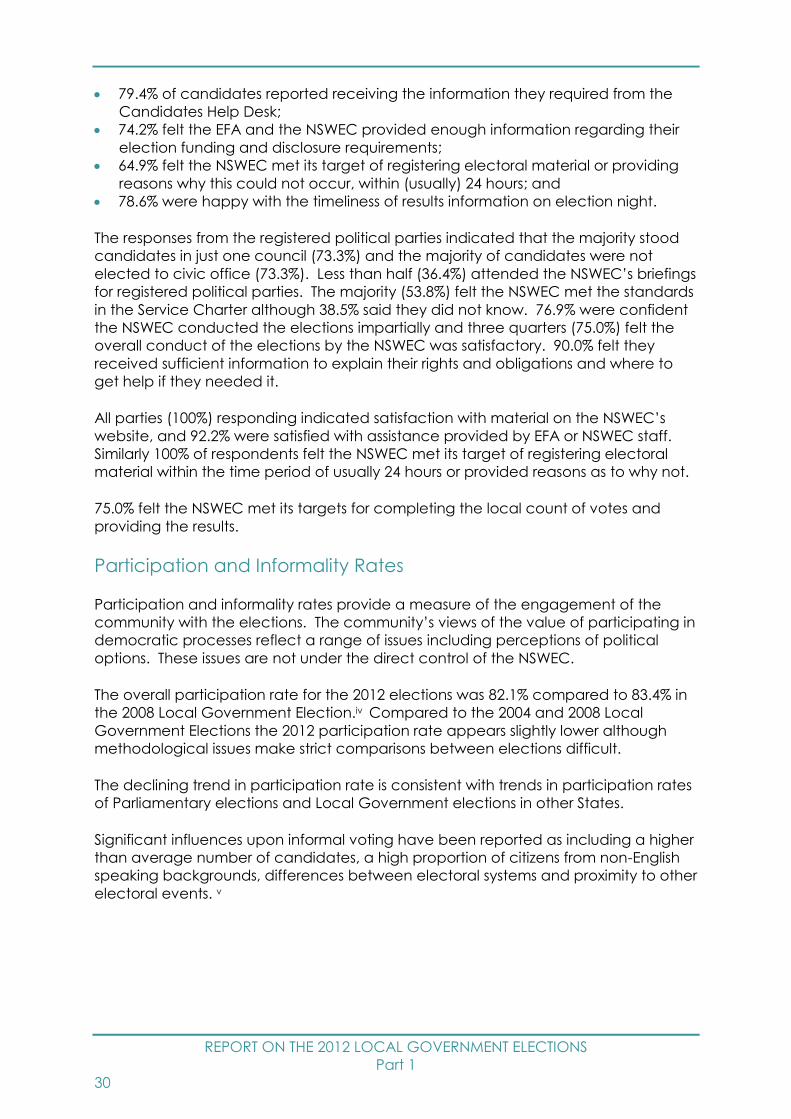
REPORT ON THE 2012 LOCAL GOVERNMENT ELECTIONS
Part 1
30
79.4% of candidates reported receiving the information they required from the
Candidates Help Desk;
74.2% felt the EFA and the NSWEC provided enough information regarding their
election funding and disclosure requirements;
64.9% felt the NSWEC met its target of registering electoral material or providing
reasons why this could not occur, within (usually) 24 hours; and
78.6% were happy with the timeliness of results information on election night.
The responses from the registered political parties indicated that the majority stood
candidates in just one council (73.3%) and the majority of candidates were not
elected to civic office (73.3%). Less than half (36.4%) attended the NSWEC’s briefings
for registered political parties. The majority (53.8%) felt the NSWEC met the standards
in the Service Charter although 38.5% said they did not know. 76.9% were confident
the NSWEC conducted the elections impartially and three quarters (75.0%) felt the
overall conduct of the elections by the NSWEC was satisfactory. 90.0% felt they
received sufficient information to explain their rights and obligations and where to
get help if they needed it.
All parties (100%) responding indicated satisfaction with material on the NSWEC’s
website, and 92.2% were satisfied with assistance provided by EFA or NSWEC staff.
Similarly 100% of respondents felt the NSWEC met its target of registering electoral
material within the time period of usually 24 hours or provided reasons as to why not.
75.0% felt the NSWEC met its targets for completing the local count of votes and
providing the results.
Participation and Informality Rates
Participation and informality rates provide a measure of the engagement of the
community with the elections. The community’s views of the value of participating in
democratic processes reflect a range of issues including perceptions of political
options. These issues are not under the direct control of the NSWEC.
The overall participation rate for the 2012 elections was 82.1% compared to 83.4% in
the 2008 Local Government Election.iv Compared to the 2004 and 2008 Local
Government Elections the 2012 participation rate appears slightly lower although
methodological issues make strict comparisons between elections difficult.
The declining trend in participation rate is consistent with trends in participation rates
of Parliamentary elections and Local Government elections in other States.
Significant influences upon informal voting have been reported as including a higher
than average number of candidates, a high proportion of citizens from non-English
speaking backgrounds, differences between electoral systems and proximity to other
electoral events. v

REPORT ON THE 2012 LOCAL GOVERNMENT ELECTIONS
Part 1
31
Section 3: Local Government Elections and the NSW
Electoral Commission
The key requirement of the NSWEC is that it delivers impartial elections in
accordance with the law whereby voter participation is maximised and informal
voting minimised.
The NSWEC is responsible for:
conducting elections and by-elections for the Parliament of New South Wales;
conducting elections for Local Government councils (where the council has
selected the NSWEC);
conducting elections for registered clubs, statutory boards and State registered
industrial organisations;
preparing the New South Wales electoral roll in conjunction with the Australian
Electoral Commission;
providing administrative support to the Election Funding Authority;
providing advice to the Premier on issues affecting the conduct of parliamentary
elections, including administrative issues requiring legislative remedy;
contributing to public understanding and awareness of elections and electoral
matters; and
reporting to the NSW Parliament on the NSWEC’s activities.
The NSW Electoral Commissioner is responsible to the NSW Parliament. The Joint
Standing Committee on Electoral Matters oversights the NSWEC and conducts
inquiries into the conduct of State General and Local Government elections.
The reports provided by the NSWEC to the NSW Parliament are available for public
scrutiny. The NSWEC reports on the conduct of elections to the NSW Parliament, the
Premier and, in the case of Local Government elections, to the Minister for Local
Government and councils. The NSWEC’s website www.elections.nsw.gov.au provides
copies of these reports.
NSWEC Involvement in Local Government Elections
Local councils are the clients for the provision of electoral services for Local
Government elections.vi The parameters for the conduct of Local Government
elections are set down in legislation (the Local Government Act 1993), Regulation
(Part 11 of the Local Government (General) Regulation 2005) and policy decisions
that give effect to the legislative and regulatory provisions. The Local Government
Act 1993 requires Local Government elections in NSW to be conducted on a four
yearly basis with election day to be the second Saturday in September.
The NSWEC (then the State Electoral Office) was first involved in the conduct of Local
Government elections and polls in 1987 following assent to the Local Government
(Elections) Amendment Act 1987 which transferred responsibility for council elections
from the (then) Town and Shire Clerks to the NSW Electoral Commissioner.
This change occurred to facilitate consistency of interpretation and administration of
electoral laws; to ensure greater uniformity with State election procedures; to utilise

REPORT ON THE 2012 LOCAL GOVERNMENT ELECTIONS
Part 1
32
the expertise of the NSWEC and to raise the awareness in the community of the
importance of Local Government elections. These changes were initiated by a
growing awareness of the difficult position of Town and Shire Clerks responsible to
elected officials for the conduct of elections whose outcomes potentially could
affect these elected officials. In addition, the tensions inherent in requiring elected
representatives to oversight the issuing of non-voting penalty notices were
recognised.
The 1987 and 1991 elections were conducted using Town and Shire Clerks as
Returning Officers under the direction of the Electoral Commissioner. At the 1987
elections, counts were conducted manually and completed count sheets faxed to
the State Electoral Office for checking. These checks revealed a number of counts
were wrong as a result of incorrect interpretation of rules applicable to the counting
system.
From 1995 onwards independent Returning Officers were appointed, however,
elections were conducted from council premises with a heavy reliance upon council
resources supporting the Returning Officers. Formal training of Returning Officers was
minimal on the basis that Returning Officers would be supported by council staff.
While this worked well in a number of locations, in other Local Government Areas
there were reports of security issues; inadequate office space; interference by
council staff; and occasions of council staff over-riding State Electoral Office
directives. As a result the integrity of the elections was called into question in some
areas of NSW.
The next major changes to the conduct of Local Government elections in NSW
occurred in 2012.
2012 Local Government Elections - Legislative Reforms
Legislative change giving councils the choice of administering their own elections or
using the NSW Electoral Commission made the 2012 Local Government Elections
markedly different to those of earlier elections.
The following Acts and Regulations made amendments impacting on the conduct of
the 2012 Local Government Elections and regulation of election campaign finances:
Local Government (Shellharbour and Wollongong Elections) Act 2011
Local Government (General) Amendment (Electoral Commissioner) Regulation
2011
Local Government (General) Amendment (Elections) Regulation 2011
Local Government (General) (Election Procedures) Regulation 2012
Local Government Amendment Act 2012
Local Government Amendment (Elections) Act 2012
Local Government (General) (Narrabri Elections) Regulation 2012
Election Funding, Expenditure and Disclosures Amendment Act 2012
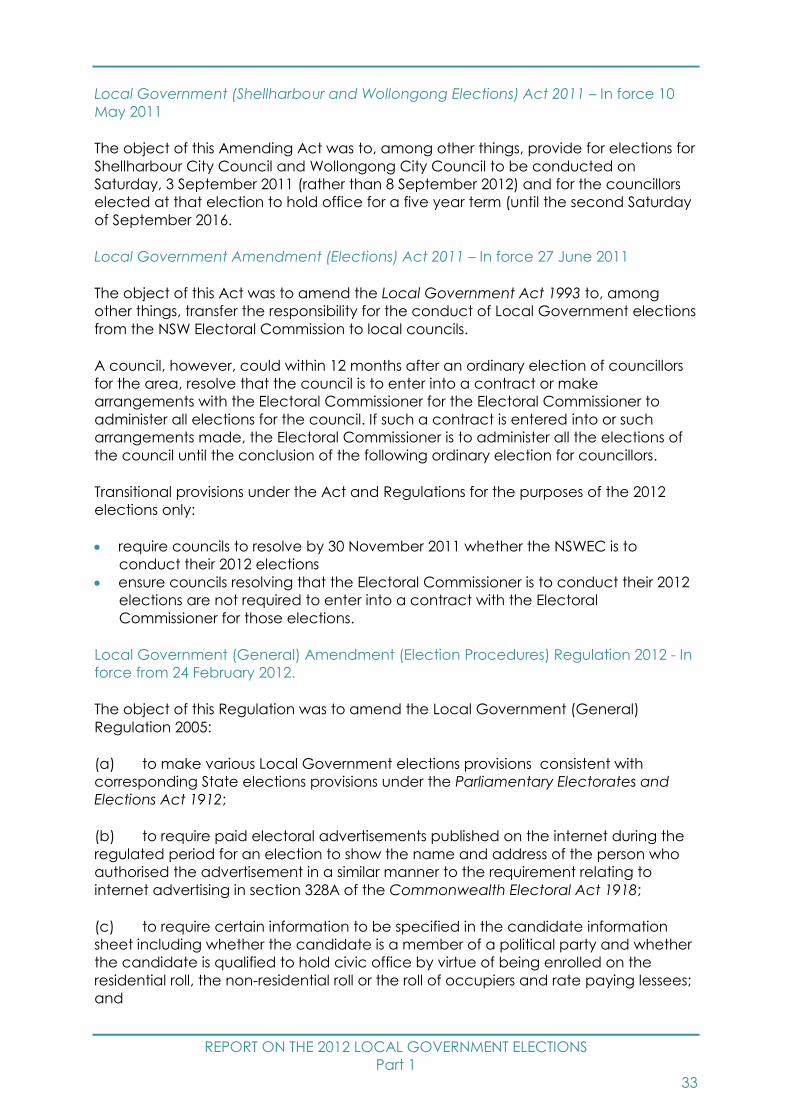
REPORT ON THE 2012 LOCAL GOVERNMENT ELECTIONS
Part 1
33
Local Government (Shellharbour and Wollongong Elections) Act 2011 – In force 10
May 2011
The object of this Amending Act was to, among other things, provide for elections for
Shellharbour City Council and Wollongong City Council to be conducted on
Saturday, 3 September 2011 (rather than 8 September 2012) and for the councillors
elected at that election to hold office for a five year term (until the second Saturday
of September 2016.
Local Government Amendment (Elections) Act 2011 – In force 27 June 2011
The object of this Act was to amend the Local Government Act 1993 to, among
other things, transfer the responsibility for the conduct of Local Government elections
from the NSW Electoral Commission to local councils.
A council, however, could within 12 months after an ordinary election of councillors
for the area, resolve that the council is to enter into a contract or make
arrangements with the Electoral Commissioner for the Electoral Commissioner to
administer all elections for the council. If such a contract is entered into or such
arrangements made, the Electoral Commissioner is to administer all the elections of
the council until the conclusion of the following ordinary election for councillors.
Transitional provisions under the Act and Regulations for the purposes of the 2012
elections only:
require councils to resolve by 30 November 2011 whether the NSWEC is to
conduct their 2012 elections
ensure councils resolving that the Electoral Commissioner is to conduct their 2012
elections are not required to enter into a contract with the Electoral
Commissioner for those elections.
Local Government (General) Amendment (Election Procedures) Regulation 2012 - In
force from 24 February 2012.
The object of this Regulation was to amend the Local Government (General)
Regulation 2005:
(a) to make various Local Government elections provisions consistent with
corresponding State elections provisions under the Parliamentary Electorates and
Elections Act 1912;
(b) to require paid electoral advertisements published on the internet during the
regulated period for an election to show the name and address of the person who
authorised the advertisement in a similar manner to the requirement relating to
internet advertising in section 328A of the Commonwealth Electoral Act 1918;
(c) to require certain information to be specified in the candidate information
sheet including whether the candidate is a member of a political party and whether
the candidate is qualified to hold civic office by virtue of being enrolled on the
residential roll, the non-residential roll or the roll of occupiers and rate paying lessees;
and
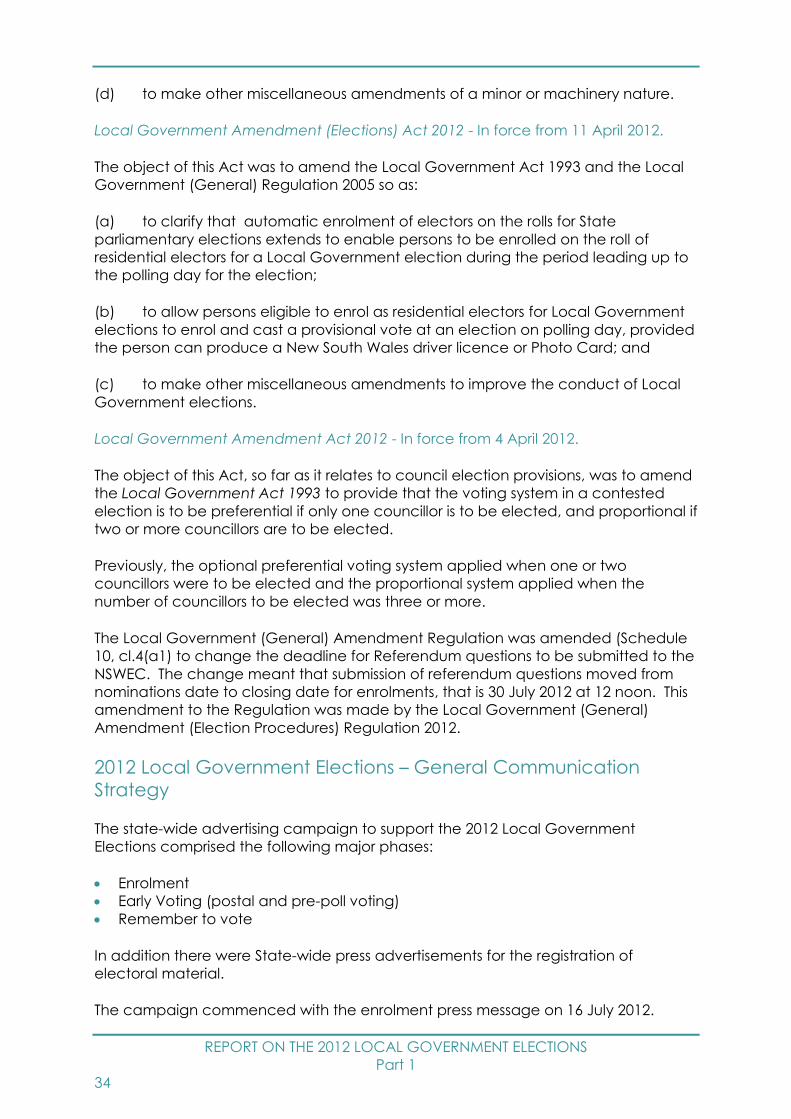
REPORT ON THE 2012 LOCAL GOVERNMENT ELECTIONS
Part 1
34
(d) to make other miscellaneous amendments of a minor or machinery nature.
Local Government Amendment (Elections) Act 2012 - In force from 11 April 2012.
The object of this Act was to amend the Local Government Act 1993 and the Local
Government (General) Regulation 2005 so as:
(a) to clarify that automatic enrolment of electors on the rolls for State
parliamentary elections extends to enable persons to be enrolled on the roll of
residential electors for a Local Government election during the period leading up to
the polling day for the election;
(b) to allow persons eligible to enrol as residential electors for Local Government
elections to enrol and cast a provisional vote at an election on polling day, provided
the person can produce a New South Wales driver licence or Photo Card; and
(c) to make other miscellaneous amendments to improve the conduct of Local
Government elections.
Local Government Amendment Act 2012 - In force from 4 April 2012.
The object of this Act, so far as it relates to council election provisions, was to amend
the Local Government Act 1993 to provide that the voting system in a contested
election is to be preferential if only one councillor is to be elected, and proportional if
two or more councillors are to be elected.
Previously, the optional preferential voting system applied when one or two
councillors were to be elected and the proportional system applied when the
number of councillors to be elected was three or more.
The Local Government (General) Amendment Regulation was amended (Schedule
10, cl.4(a1) to change the deadline for Referendum questions to be submitted to the
NSWEC. The change meant that submission of referendum questions moved from
nominations date to closing date for enrolments, that is 30 July 2012 at 12 noon. This
amendment to the Regulation was made by the Local Government (General)
Amendment (Election Procedures) Regulation 2012.
2012 Local Government Elections – General Communication
Strategy
The state-wide advertising campaign to support the 2012 Local Government
Elections comprised the following major phases:
Enrolment
Early Voting (postal and pre-poll voting)
Remember to vote
In addition there were State-wide press advertisements for the registration of
electoral material.
The campaign commenced with the enrolment press message on 16 July 2012.
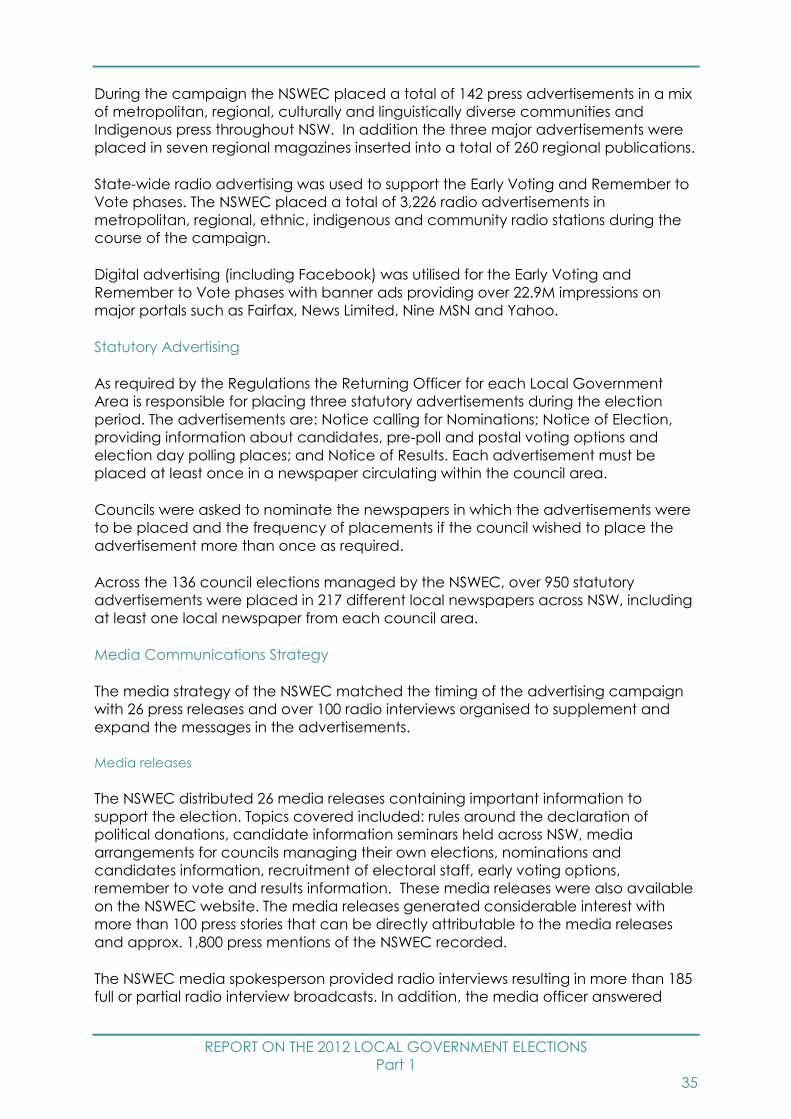
REPORT ON THE 2012 LOCAL GOVERNMENT ELECTIONS
Part 1
35
During the campaign the NSWEC placed a total of 142 press advertisements in a mix
of metropolitan, regional, culturally and linguistically diverse communities and
Indigenous press throughout NSW. In addition the three major advertisements were
placed in seven regional magazines inserted into a total of 260 regional publications.
State-wide radio advertising was used to support the Early Voting and Remember to
Vote phases. The NSWEC placed a total of 3,226 radio advertisements in
metropolitan, regional, ethnic, indigenous and community radio stations during the
course of the campaign.
Digital advertising (including Facebook) was utilised for the Early Voting and
Remember to Vote phases with banner ads providing over 22.9M impressions on
major portals such as Fairfax, News Limited, Nine MSN and Yahoo.
Statutory Advertising
As required by the Regulations the Returning Officer for each Local Government
Area is responsible for placing three statutory advertisements during the election
period. The advertisements are: Notice calling for Nominations; Notice of Election,
providing information about candidates, pre-poll and postal voting options and
election day polling places; and Notice of Results. Each advertisement must be
placed at least once in a newspaper circulating within the council area.
Councils were asked to nominate the newspapers in which the advertisements were
to be placed and the frequency of placements if the council wished to place the
advertisement more than once as required.
Across the 136 council elections managed by the NSWEC, over 950 statutory
advertisements were placed in 217 different local newspapers across NSW, including
at least one local newspaper from each council area.
Media Communications Strategy
The media strategy of the NSWEC matched the timing of the advertising campaign
with 26 press releases and over 100 radio interviews organised to supplement and
expand the messages in the advertisements.
Media releases
The NSWEC distributed 26 media releases containing important information to
support the election. Topics covered included: rules around the declaration of
political donations, candidate information seminars held across NSW, media
arrangements for councils managing their own elections, nominations and
candidates information, recruitment of electoral staff, early voting options,
remember to vote and results information. These media releases were also available
on the NSWEC website. The media releases generated considerable interest with
more than 100 press stories that can be directly attributable to the media releases
and approx. 1,800 press mentions of the NSWEC recorded.
The NSWEC media spokesperson provided radio interviews resulting in more than 185
full or partial radio interview broadcasts. In addition, the media officer answered
REPORT ON THE 2012 LOCAL GOVERNMENT ELECTIONS
Part 1
36
hundreds of direct media enquiries providing information, assistance and official
comment as appropriate.
Letters to the editor
Where required, letters to the editor were drafted with the majority published within a
week of the original story allowing the NSWEC to convey important information, and
counter errors and misinformation unedited, directly to voters.
Social media
Social media was used to support the election utilising the NSWEC’s existing
Facebook and Twitter accounts.
Approximately 90 planned posts were made during the election period with the
intent of placing a morning and afternoon post Monday to Friday. Facebook posts
were mirrored on Twitter. The first post was 9 July with final election related post
being on 17 September. Posts coincided with the phases of the election providing
information and reminders linking to the NSWEC website. In addition to the planned
posts there were numerous posts in response to questions and posts from the public.
The NSWEC uses the NSWEC website as its principal tool of communication.
In addition to direct communications provided through newsletters and
presentations, we utilised advertising and media interactions to increase awareness
of the elections and to reach groups typically underrepresented in the democratic
process.
NSWEC Website www.elections.nsw.gov.au
The councils and the NSW Division of Local Government were asked to set up links
from their websites to that of the NSWEC to assist local voters and candidates.
The NSWEC’s website was heavily utilised with over half a million unique visitors
(501,701) over the three months July – September 2012. The pages most utilised
were:
Local Government Elections 2012 Homepage
Pre-poll voting centres
Polling places
Council pages
Postal voting
Working at the election
Candidate and Parties
Council Profiles
Enrol and Vote
Election Information
Election results
A quarter of visits (25.2%) made were from mobile devices including tablets.

REPORT ON THE 2012 LOCAL GOVERNMENT ELECTIONS
Part 1
37
Consultation with NSW Councils and the NSW Government
In 2011 the NSW Electoral Commission visited every council scheduled to have an
election. The legislative changes and the NSWEC’s Service Charter provided the
basis for these meetings. This liaison was maintained with all councils utilising the
services of the NSWEC and for certain other services, such as electoral rolls, with all
councils regardless of the arrangements for conducting their elections.
The NSWEC also provided regular briefings to the NSW Premier, the Minster for Local
Government and the Division of Local Government on the planning and preparation
for the elections.
2012 Local Government Elections - Financial Arrangements
Funding of Local Government Elections
The sources of funding for Local Government elections and the cost of conducting
them have been controversial issues. Unlike the State General Elections and State
by-elections, the NSWEC is not funded by the NSW Government for conducting Local
Government elections. The legislation as it stood at the time of the 2012 Local
Government Elections required councils to pay the cost of conducting the elections.
The reality is a little more complicated. While the NSW Government does not provide
direct funding for the Local Government elections, certain activities such as
enrolment and non-voting services also utilised in Local Government elections, are
funded through the appropriation made to the NSWEC by the NSW Parliament. For
the 2012 elections, the cost of maintaining the NSW electoral roll and operating
SmartRoll the annual cost was in excess of $6 million. In addition, all costs associated
with the acquisition, maintenance and development of the NSWEC’s computerised
election systems were met by the NSW Government. Finally, the NSW Treasury
provides an advance to cover preparation for the elections which is repaid following
recoupment of expenses from councils.
The funding arrangements established for the 2012 Local Government Elections with
NSW Treasury involved the NSW Government providing an advance to the NSWEC
based upon estimates of the total cost of the elections. The NSWEC repays the
advance following invoicing of councils. The advance enables the NSWEC to
commence the planning and preparation for the elections including the hiring and
training of staff. The funding provision put in place for the 2012 elections was for a
facility of $29.6 million. The actual expenditure on direct costs came in significantly
lower at $21.032 million, due to both a smaller number of councils serviced and lower
than expected election cost overall.
No advance payment from councils and no deferral of payment for councils
The NSWEC did not seek an advance payment from councils towards the conduct
of the 2012 Local Government Elections. Final invoices were issued when the NSWEC
was in receipt of all supplier invoices at the end of January 2013.

REPORT ON THE 2012 LOCAL GOVERNMENT ELECTIONS
Part 1
38
In 2008, NSW Treasury established an arrangement whereby councils could pay their
election costs over two years. This arrangement was not put in place for the 2012
elections.
Council Costing Model for the 2012 Local Government Elections
The NSWEC undertook a comprehensive budget estimation process of identifying
and calculating estimated costs for individual council expenses. The broad process
for developing the budget for the 2012 Local Government Elections and individual
council budgets involved four major stages.
First, all 2012 Local Government Elections projects and associated activities were
identified and quantified.
Secondly, the budget estimates were developed using a 'zero based' or 'bottom-up'
budget methodology involving itemising volume and unit costs for each project, the
tasks for each month and identifying the financial years 2011/12 and 2012/13 which
were impacted.
Thirdly, substantive testing of these budget items and their estimated costs was
undertaken using the most reliable cost schedule available, that is the 2011 State
General Election.
Fourthly, allocation of the costs for each project to individual councils was
completed using the applicable methodology for the activity involved in each
project. The three methodologies applied were either:
cost per elector;
actual costs incurred in specific council areas; and/or
allocation for Regional Returning Officer based on elector numbers.
This enabled equitable sharing of overheads applicable to all councils separately
from costs specific to each council.
The model included an administration fee which covered an allocation of NSWEC
head office costs including the cost of NSWEC permanent staff. The charge basis
was derived as a result of a review undertaken by an independent body. For
uncontested elections, costs were not incurred from the date it was known that the
election would be uncontested.
All councils using the NSWEC to conduct their elections received a ‘Council Budget
Estimate Scope Summary’ setting out the details for each line item of anticipated
expenditure and deliverables. This budget and payment schedule was provided to
councils by the end of May 2012 as committed in the NSWEC’s Service Charter. In
addition, each council received a detailed account of what was entailed in each
project included in the services provided and charged to councils.
At an aggregated level this process also provides benchmarks covering:
total cost of the Local Government elections;
average cost per elector;

REPORT ON THE 2012 LOCAL GOVERNMENT ELECTIONS
Part 1
39
average cost per metropolitan, regional and rural council;
highest and lowest costs for different types of elections (contested and
uncontested); and
expenditure base for each council.
Metropolitan and Rural Pricing
The Commission has analysed the charge rates to the state based on a breakdown
of the three categories of metropolitan, regional and rural councils. The metropolitan
councils were cheaper to service at $6.21 an elector rising to $6.53 per elector for
regional and $7.30 per elector for rural councils.
Major Budget Components
The major expenditure items of elections are salaries, rent for office accommodation
and polling places, the communication campaign and ballot paper production.
In the 2012 Local Government Elections almost four-fifths of the budget (79.5%) was
composed of seven expenditure items of which the largest was salaries. The major
cost items and their proportional contribution to the total 2012 Local Government
Elections budget are shown below.
Table 12: 2012 Local Government Elections, Major Expenditure Items
Expenditure Item $M % Total
Expend
Election official salaries 10.764 51.3
Logistics 1.700 8.1
Returning Officer accommodation 1.543 7.3
Communication campaign 1.390 6.6
Vote counting and Results 0.850 4.0
Polling Place hire 0.759 3.6
Call Centre 0.508 2.4
Information Technology support 0.451 2.1
Enrolment expenses 0.444 2.1
Other costs 2.625 12.5
Total Direct Costs 21.034 100.0
Staffing made up 51.3% of the total budget expenditure. Staffing of an election is
always a major expenditure item with the largest component being polling place
staff (Polling Place Managers, Deputy Polling Place Managers and Polling Staff). The
composition of the total expenditure for election official wages for 2012 Local
Government Elections is set out below.
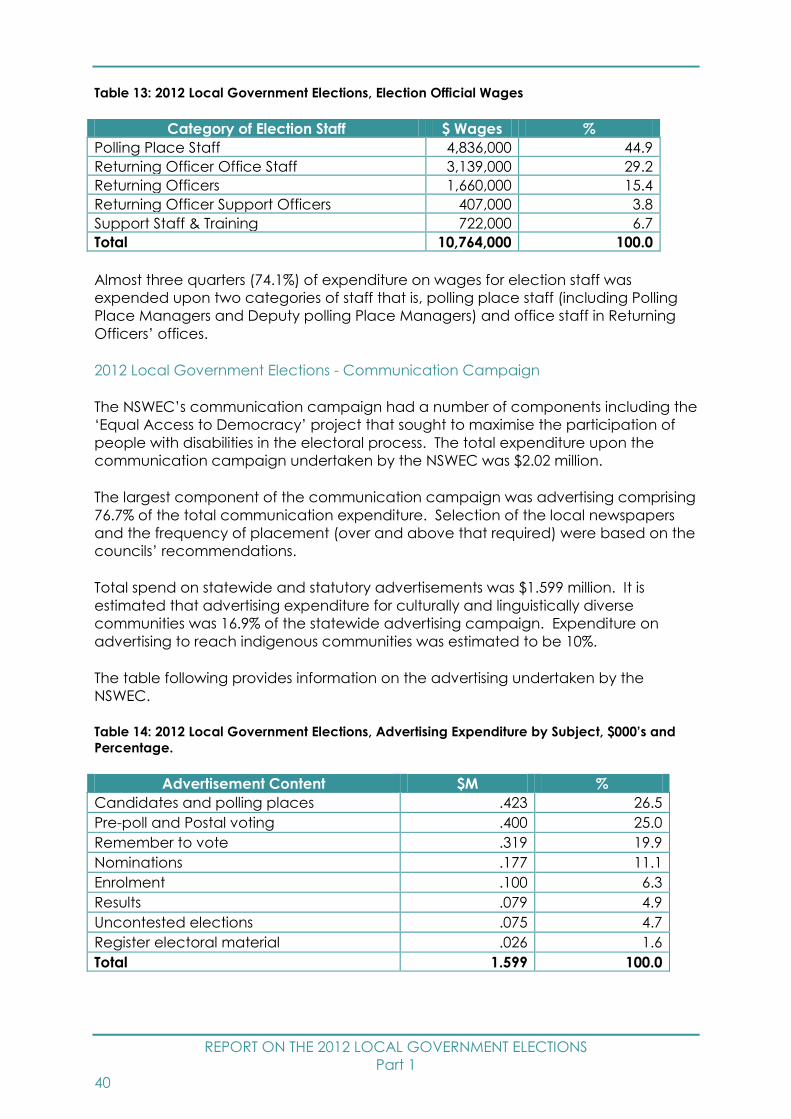
REPORT ON THE 2012 LOCAL GOVERNMENT ELECTIONS
Part 1
40
Table 13: 2012 Local Government Elections, Election Official Wages
Category of Election Staff $ Wages %
Polling Place Staff 4,836,000 44.9
Returning Officer Office Staff 3,139,000 29.2
Returning Officers 1,660,000 15.4
Returning Officer Support Officers 407,000 3.8
Support Staff & Training 722,000 6.7
Total 10,764,000 100.0
Almost three quarters (74.1%) of expenditure on wages for election staff was
expended upon two categories of staff that is, polling place staff (including Polling
Place Managers and Deputy polling Place Managers) and office staff in Returning
Officers’ offices.
2012 Local Government Elections - Communication Campaign
The NSWEC’s communication campaign had a number of components including the
‘Equal Access to Democracy’ project that sought to maximise the participation of
people with disabilities in the electoral process. The total expenditure upon the
communication campaign undertaken by the NSWEC was $2.02 million.
The largest component of the communication campaign was advertising comprising
76.7% of the total communication expenditure. Selection of the local newspapers
and the frequency of placement (over and above that required) were based on the
councils’ recommendations.
Total spend on statewide and statutory advertisements was $1.599 million. It is
estimated that advertising expenditure for culturally and linguistically diverse
communities was 16.9% of the statewide advertising campaign. Expenditure on
advertising to reach indigenous communities was estimated to be 10%.
The table following provides information on the advertising undertaken by the
NSWEC.
Table 14: 2012 Local Government Elections, Advertising Expenditure by Subject, $000’s and
Percentage.
Advertisement Content $M %
Candidates and polling places .423 26.5
Pre-poll and Postal voting .400 25.0
Remember to vote .319 19.9
Nominations .177 11.1
Enrolment .100 6.3
Results .079 4.9
Uncontested elections .075 4.7
Register electoral material .026 1.6
Total 1.599 100.0

REPORT ON THE 2012 LOCAL GOVERNMENT ELECTIONS
Part 1
41
Additional communication about the elections occurred through the media
activities of the NSWEC. It was not possible however to disaggregate the media
financial data across the above content areas.
Pursuing Efficiencies
The NSWEC undertook a rigorous programme to secure efficiencies in services being
provided and charged to councils. There were a number of areas where significant
savings were possible.
The Commission reviewed its administrative charge out rate for conducting the 2012
Local Government Elections through an independent assessment. The charge
represents the portion of the NSWEC’s head office costs to be recouped. With
productivity improvements it was possible to reduce the hourly charge out rate from
$195 per hour (2008) to $175 (2012). This charge is allocated across councils on a
‘per elector’ basis with the rate discounted for those councils where there are
uncontested elections.
One of the major expenditure items for the 2008 Local Government Elections was the
cost of production of ballot papers ($2.468 million). The NSWEC reduced this cost
significantly in 2012 by an open tender process, more detailed tender specifications
and a different, co-management process. The total cost was $1,022,652. Taking into
account the quantity of ballot papers produced in 2008 (9.0 million) compared to 6.6
million in 2012, the unit cost in 2012 is approximately 56% of the 2008 cost (without
adjustments to factors such as CPI changes). Based on the same quantity from 2008,
the cost savings of producing ballot papers in 2012 exceeds $1.0 million.
The NSWEC altered its approach to the processing of payroll and superannuation
transactions. Instead of being outsourced as in 2008, these activities were
undertaken in-house. The removal of multiple handling of forms, other paperwork
and enquiries produced significant savings.
Due to the number of council elections the NSWEC conducted we were able to offer
a Shared Returning Officer model for the Local Government Elections in 2012
following the successful rollout in 2008. This option was selected by an increased
number of councils this election. Councils which chose to share a Returning Officer’s
Office enjoyed substantial cost savings. Larger councils typically have lower per unit
operating costs and the sharing concept delivered similar benefit to the smaller
councils. Average cost across the state, by Local Government Area, of costs under
each of the stand alone and shared model are shown below.
Table 15: 2012 Local Government Elections Average Cost per Elector of Returning Officer
Regional and Stand Alone Operations
Elector Range Stand alone Regional Saving Saving %
15,001 to 30,000 $3.46 $2.68 $0.78 29.1%
30,001 to 45,000 $2.10 $1.82 $0.28 15.5%
Regardless of the size of the councils as measured by number of electors, sharing a
Returning Officer provides a less expensive option for the council. This saving
increases with the size of the council.
REPORT ON THE 2012 LOCAL GOVERNMENT ELECTIONS
Part 1
42
The Returning Office model includes the costs for the Returning Officer salary, Office
staff and the premises rental and operating cost.
Braille Voting
In 2008, the cost of Braille ballot papers was $24,862 for 52 voters (excluding staff time
in organising and providing Braille voting services and those election information and
materials routinely prepared for blind and low vision electors). The cost per
registered Braille ballot paper applicant was $478.
In 2012, the average cost of producing each Braille ballot paper was $195. There
were a total of 13 accepted applications for Braille ballot papers.
REPORT ON THE 2012 LOCAL GOVERNMENT ELECTIONS
Part 1
43
Section 4: 2012 Local Government Elections - Electoral
Services for Electors
Ensuring Equal Access to Democracy within the Community
The strategies employed were:
addressing the needs of people from regional and remote areas, people with
disabilities, people from culturally and linguistically diverse backgrounds and
young people;
engaging with Aboriginal communities; and
utilising emerging technologies or preferred communications to engage these
groups.
Services for Vision Impaired Electors
In 2012, a total of 13 electors registered to vote using Braille ballot papers. Of this
total, 2 voted on election day while the remaining 11 electors utilised the Braille
postal voting option. No requests for pre-poll voting were received. As in 2008,
Braille ballot papers were provided with the NSWEC working closely with Vision
Australia.
Applications for Braille ballot papers were taken by the NSWEC between 9am
Monday, 9 July and 5pm Wednesday, 8 August 2012. An application could be
verbal or written and either taken by phone, fax or email. Braille ballot papers were
prepared for postal, pre-poll or ordinary voting and were counted in the same way
as other (non-Braille) ballot papers. Contracted Braille was used for the ballot
papers.
In addition to this service, the NSWEC also provided on its website an audio brochure
called ‘Braille Voting at Local Government Elections’ for those electors with visual
disabilities and a radio advertisement for Braille Voting was placed through the RPH
Australia radio reading network. The NSWEC’s call centre was available to read
printed material such as candidate information sheets to those with vision difficulties.
As for the 2008 Local Government Elections, the NSWEC surveyed the experiences
and views of electors who used Braille ballot papers for voting. Only four Braille
voters responded. While too small a sample to rely upon, there was a common
preference for the NSWEC to provide electronically assisted voting as at the 2011
State Election.
Community Education Programme
The NSWEC undertook a community education programme to support the 2012
Local Government Elections. This consisted of information for the general public and
information to meet the needs of electors with disabilities, culturally and linguistically
diverse communities, Aboriginal and Torres Strait Islander communities and lastly
information provided for Returning Officers and election officials.

REPORT ON THE 2012 LOCAL GOVERNMENT ELECTIONS
Part 1
44
Table 16: 2012 Local Government Elections Information Distribution to the General Public
Material Content Distribution Website
Local Government
(Council) Elections
Information Brochure
Double sided A4,
general election
information and
Instructions for Voting.
In English PDF, HTML,
RTF, AUSLAN, audio and
Braille or Audio CD on
request.
Hard copies to AEC
for information stalls
and sessions.
E-copy provided to
AEC.
To organisations on
request.
On
website
Returning
Officer
intranet
LG.452 – Method of
Voting Poster
Large A1 poster with
instructions for voting
and assistance
available at the polling
place
Two per voting
centre.
A1 size
No
Local Government
Election information
and materials for
Information stalls and
sessions for the
community
With the Australian
Electoral Commission
(AEC), material
provided for AEC stalls
and sessions:
Three information stalls
at Notre Dame and
Australian Catholic
Universities
Information sessions at
MDSI, Campelltown;
MRC Liverpool and
Arabic Women’s
Association in Lakemba.
NSWEC provided:
Relevant sample
ballot papers and
ward maps for the
council area;
Enrolment brochures;
Three Elections
brochures;
Instructions for Voting
in various languages;
Local Government
Election Information
brochures;
Posters;
Council specific
voting information;
Information session
outline and props;
Phone briefing for
AEC officers.
No
Information Session
Lalor Park
NSWEC presentation on
enrolment and voting
for local community.
As above
Election Poster A poster reminding
people of date of Local
Request from
community
No

REPORT ON THE 2012 LOCAL GOVERNMENT ELECTIONS
Part 1
45
Government election
and that voting is
compulsory
organisation.
Electronic copy
provided for their
own printing.
Provision of information
to organisations and
individual electors
Various information and
materials provided on
request.
On request. No
Table 17: 2012 Local Government Elections Information Distribution to Electors from Culturally
and Linguistically Diverse Backgrounds
Material Content Distribution Website
Local Government
Election New
Four newsletters:
1. General election
information
2. Enrolment
3. Early voting
4. Voting on election
day
In English, Arabic,
Chinese and
Vietnamese
Via Community
Relations Commission’s
EmailLink and
Community Education
mailing lists.
On website
Work at Elections
Brochure
A5 brochure to
encourage
multilingual people to
apply to work at the
elections
Community Relations
Commission’s EmailLink
No
LG.453 (A) –
Multilingual Voters
Guide –
Instructions for
Voting
Booklet - Instructions
for Voting in English,
Large print English and
20 languages
1 booklet per voting
centre.
See below
LG.453 (B) –
Instructions for
Voting
Single sheet
Instructions for Voting
in specified
languages.
For 15 high CALD
areas.
25, 50 or 100 per polling
place of main
languages in the 15
identified high CALD
areas.
Yes – 20
languages
on website
“I speak
[language]”
stickers
Stickers for bi-lingual
and multilingual staff
to wear. Main
languages to high
CALD districts only.
ROs from other districts
could print their own.
A sheet of 10 stickers in
main languages to
each polling place in
high CALD areas.
Full set on RO intranet.
No
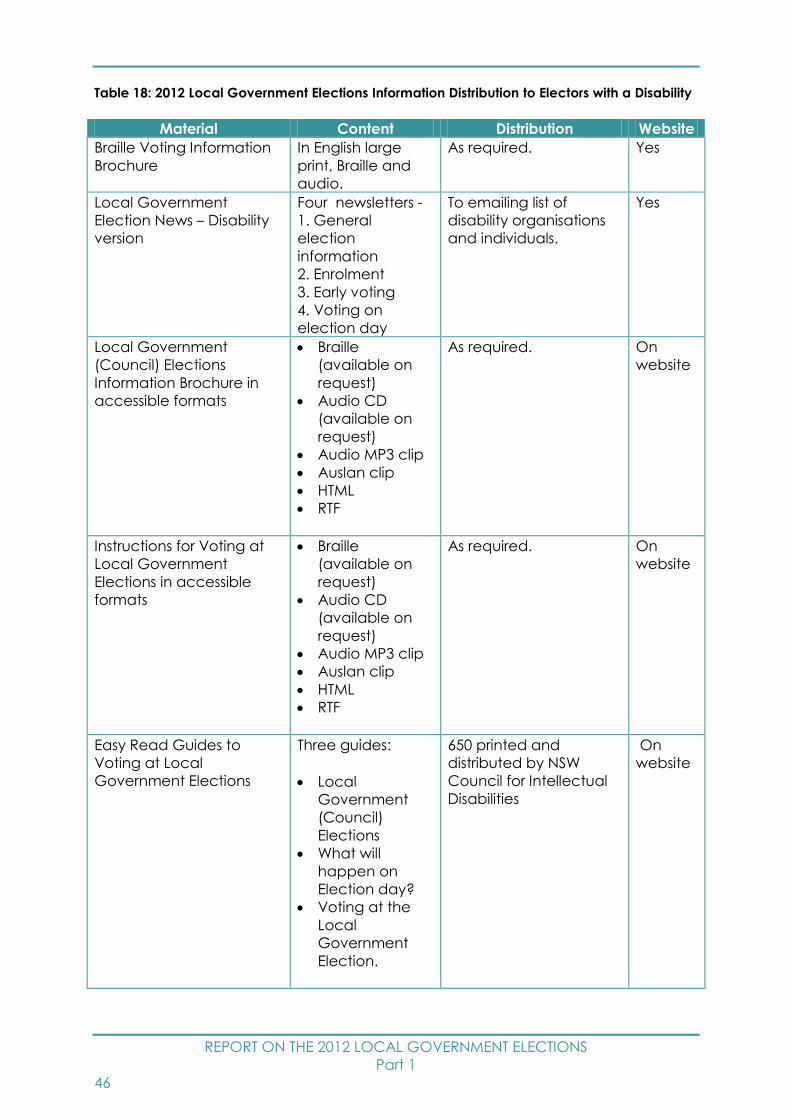
REPORT ON THE 2012 LOCAL GOVERNMENT ELECTIONS
Part 1
46
Table 18: 2012 Local Government Elections Information Distribution to Electors with a Disability
Material Content Distribution Website
Braille Voting Information
Brochure
In English large
print, Braille and
audio.
As required. Yes
Local Government
Election News – Disability
version
Four newsletters -
1. General
election
information
2. Enrolment
3. Early voting
4. Voting on
election day
To emailing list of
disability organisations
and individuals.
Yes
Local Government
(Council) Elections
Information Brochure in
accessible formats
Braille
(available on
request)
Audio CD
(available on
request)
Audio MP3 clip
Auslan clip
HTML
RTF
As required. On
website
Instructions for Voting at
Local Government
Elections in accessible
formats
Braille
(available on
request)
Audio CD
(available on
request)
Audio MP3 clip
Auslan clip
HTML
RTF
As required. On
website
Easy Read Guides to
Voting at Local
Government Elections
Three guides:
Local
Government
(Council)
Elections
What will
happen on
Election day?
Voting at the
Local
Government
Election.
650 printed and
distributed by NSW
Council for Intellectual
Disabilities
On
website

REPORT ON THE 2012 LOCAL GOVERNMENT ELECTIONS
Part 1
47
Table 19: 2012 Local Government Elections Information Distribution chains to Aboriginal and
Torres Strait Islander Electors (including stalls and presentations)
Material Content Distribution Website
Local Government
Election News – ATSI
version
Four newsletters:
1. General election
information
2. Enrolment
3. Early voting
4. Voting on election day
Electronically and in
hard copy through
IEPP
On
website
Work at Elections
Brochure
ATSI version
A5 brochure to
encourage people, with
focus on ATSI, to apply to
work at the LG election
Small print run and
electronic copy for
distribution through
IEPP
No
Electoral Awareness
Officer (EAO)
programme
Programme run by IEPP,
endorsed and supported
by NSWEC.
NSWEC provided an
information guide, council
specific information,
identification lanyards and
posters, authorisation letter
and attended a phone
briefing
11 EAOs employed at
high ATSI polling
places.
No
LG.453 (B) –
Instructions for
Voting (customised
ATSI version)
Single sheet Instructions for
Voting in Aboriginal
colours with Aboriginal
and Torres Strait Islander
flags
2000 provided for
election day.
No
Poster for polling
places in high ATSI
areas
A2 Poster in Aboriginal
colours, with flags and
50th anniversary of
Indigenous vote logo and
voting messages
46 posters sent to
Returning Officers in
high ATSI areas for
display at identified
polling places
No
Local Government
Election information
and materials for
Information stalls
and sessions for the
community
NSWEC provided
information and materials
to IEPP to support them in
providing information
sessions and information
stalls for the Aboriginal
and Torres Strait Islander
community
NSWEC provided:
Enrolment
brochures
Three Elections
brochures
Instructions for
Voting LG Election
Information
brochures
Posters and banners
LG Information
session outline
No
Yabun Australia Day Stall to provide information NSWEC provided n/a
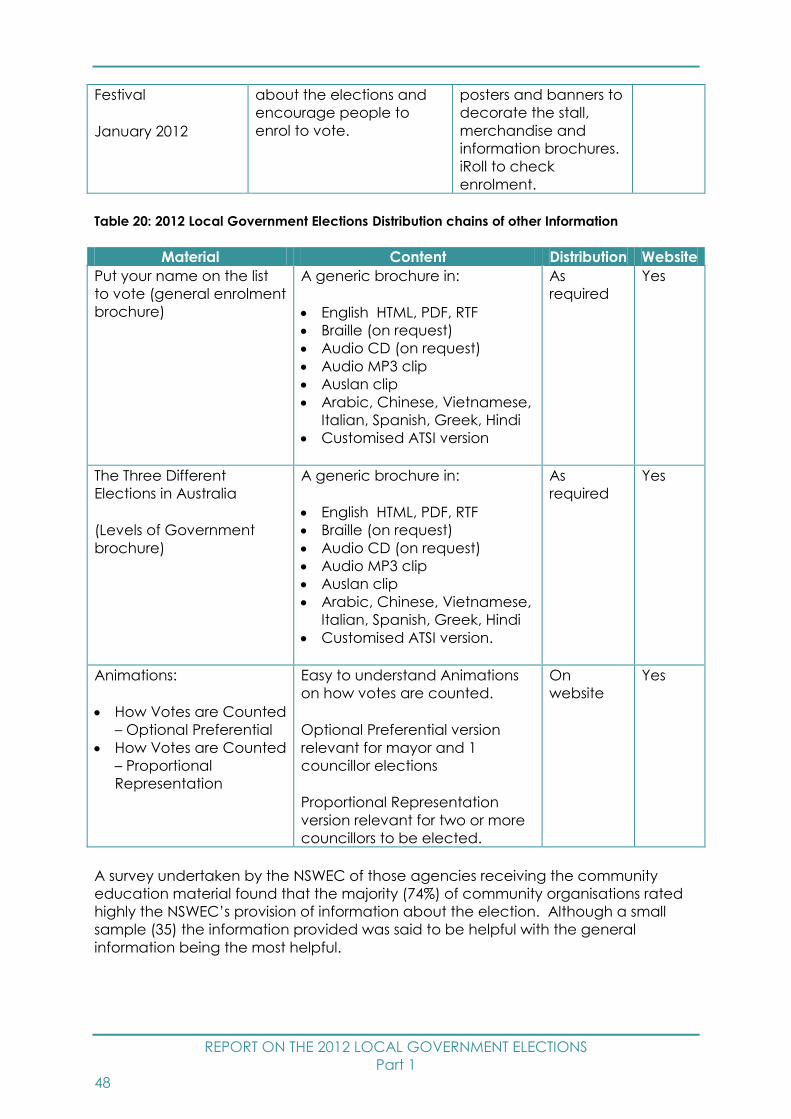
REPORT ON THE 2012 LOCAL GOVERNMENT ELECTIONS
Part 1
48
Festival
January 2012
about the elections and
encourage people to
enrol to vote.
posters and banners to
decorate the stall,
merchandise and
information brochures.
iRoll to check
enrolment.
Table 20: 2012 Local Government Elections Distribution chains of other Information
Material Content Distribution Website
Put your name on the list
to vote (general enrolment
brochure)
A generic brochure in:
English HTML, PDF, RTF
Braille (on request)
Audio CD (on request)
Audio MP3 clip
Auslan clip
Arabic, Chinese, Vietnamese,
Italian, Spanish, Greek, Hindi
Customised ATSI version
As
required
Yes
The Three Different
Elections in Australia
(Levels of Government
brochure)
A generic brochure in:
English HTML, PDF, RTF
Braille (on request)
Audio CD (on request)
Audio MP3 clip
Auslan clip
Arabic, Chinese, Vietnamese,
Italian, Spanish, Greek, Hindi
Customised ATSI version.
As
required
Yes
Animations:
How Votes are Counted
– Optional Preferential
How Votes are Counted
– Proportional
Representation
Easy to understand Animations
on how votes are counted.
Optional Preferential version
relevant for mayor and 1
councillor elections
Proportional Representation
version relevant for two or more
councillors to be elected.
On
website
Yes
A survey undertaken by the NSWEC of those agencies receiving the community
education material found that the majority (74%) of community organisations rated
highly the NSWEC’s provision of information about the election. Although a small
sample (35) the information provided was said to be helpful with the general
information being the most helpful.
REPORT ON THE 2012 LOCAL GOVERNMENT ELECTIONS
Part 1
49
Enrolment
In NSW enrolment and voting is compulsory for people who are:
18 years of age or older;
Australian citizens (or a British subject on an Australian electoral roll on 25 January
1984); and
Living at their present address for at least the last month.
(The NSWEC provided enrolment services for all councils including those councils
administering their elections. This is addressed in the section ‘Services to Councils’).
Automatic enrolment (or SmartRoll), a programme to directly enrol eligible electors
or to change enrolment of electors who have changed address, has been in
operation since 2010. By the time of the preparation of printed rolls at the end of July
2012 over 450,000 electors had been notified that the NSWEC would be making or
changing their enrolment. Of this number 140,000 were new enrolees, that is enrolled
for the first time or removed from the roll on a past occasion. The statewide roll was
slightly under 4.8 million electors.vii The comparable figure of the 2011 NSW State
Election was 4.63 million.
The NSWEC promoted enrolment through its advertising campaigns and other
communication strategies during the election period. Advertisements were featured
in press and radio in metropolitan, regional, rural areas and in Aboriginal and
community language press and radio using community languages covering 76% of
culturally and linguistically diverse language speakers.
The management of electoral rolls is outlined in greater detail in Section 5 ‘Electoral
Services for Councils’.
Elector Enquiry Centre
The NSWEC established an Elector Enquiry Centre to ensure that relevant, timely and
specific information was available to all electors and to decrease the number of
telephone enquiries made to councils. The Elector Enquiry Centre provided a 1300
number to ensure that people in non-metropolitan areas would be able to obtain
information at the same call rate as metropolitan electors.
The Elector Enquiry Centre was operational from Monday, 6 August to Friday, 14
September 2012 with peak usage coinciding with NSWEC advertising campaign and
closeness of the elections. The day before election day recorded the highest
number of calls. Unlike the 2008 elections, call volumes dropped markedly in the
week following election day.
The Elector Enquiry Centre was very well utilised but less so than in 2008. In 2008,
106,955 calls were made to the Elector Enquiry Centre during its operating period. In
contrast the total number of calls in 2012 was 73,334. The number of calls for each
council is shown in the individual council reports.
The NSWEC has been working to increase the information and ease of use of its
website as this is increasingly a more convenient form of communication for the

REPORT ON THE 2012 LOCAL GOVERNMENT ELECTIONS
Part 1
50
majority of electors. It was expected that this trend to greater use of the internet
would be accompanied by a reduction in use of the call centre.
New Forms of Voting
The Parliamentary Electorates and Elections Act 1912 was amended in 2012 to allow
voters for the first time at the 2011 State General Election to ‘enrol and vote’ at either
pre-poll or election day. Electors upon provision of appropriate proof of identity
(NSW photo driver licence or proof of age card) were able to cast a declaration
vote at pre-poll or on election day in a polling place if their name did not appear on
the Authorised Roll or if they had changed addresses and had not updated their
details before the elections. Declaration votes are those where ballot papers are
cast in envelopes bearing the electors’ declaration of eligibility, such declarations
being scrutinised for validity before being accepted into the count.
The State ‘enrol and vote’ amendments were subsequently mirrored in Local
Government legislation and available for the first time in at the 2012 Local
Government Elections. This was a major change from the 2008 Local Government
Elections
Arrangements for Voting before Election Day
The NSWEC provided a variety of voting services for electors unable to vote on
election day, including arrangements for:
Postal voting;
Pre-poll voting; and
Declared Institution voting.
Postal Voting
The NSWEC implemented a centralised postal voting centre similar to that
introduced for the 2011 State Election. All postal vote applications were processed
at the centre and postal vote ballot packs were sent directly to the elector. Electors
could utilise an online facility on the NSWEC’s website. Forms could be submitted
electronically from 2 July 2012. For electors who did not have access to the internet,
the form was available from the Returning Officer’s office or mailed upon request.
Registered political parties proposing to distribute their own postal vote applications
to constituents were urged to check with the NSWEC regarding their version of the
application form to ensure it complied with changed legislation.
Postal vote applications had to be received by the Returning Officer by no later than
5pm, Monday 5 September 2012. Completed postal declarations and ballot papers
had to be received by the Returning Officer no later than 6pm, Monday 10
September 2012 in order to be eligible to be included in the count.
Of the total votes cast for councillor positions in the 2012 Local Government
Elections, 102,806 or 3.5% were made as postal votes. This appears less than the
134,802 or 3.8% postal votes returned in the 2008 Local Government Elections,
however the 2012 figures only represent elections conducted by the NSWEC.
REPORT ON THE 2012 LOCAL GOVERNMENT ELECTIONS
Part 1
51
Registered General Postal Voters
The number of general postal voters was 57,319.
Pre-Poll Voting
Pre-poll locations were available in every council area where an election was
conducted by the NSWEC, typically at Returning Officers’ offices or any other
additional locations appointed within the council area. In a major change from the
2008 elections, electors could also vote pre-poll at the Sydney Town Hall. The details
of the pre-poll voting locations and times of operation were available from the
Returning Officer, the NSWEC website or the Elector Enquiry Centre.
There were 254 pre-poll centres throughout NSW of which 61.8% (157) were
wheelchair accessible and 37.8% (96) were accessible with assistance. Of the total
votes cast for councillor positions in the 2012 Local Government Elections, 383,405 or
13.1% were made as pre-poll or Declared Institution votes.
Declared Institutions
Election officials visited the Declared Institutions during the statutory period from
Monday, 27 August 2012 to Wednesday, 5 September 2012 to take votes. Scrutineers
were invited to attend. The procedure for voting was the same as for pre-poll voting.
Sydney Town Hall
Many electors forget that absent votes cannot be issued at Local Government
elections and that the Sydney Town Hall is not a polling place for those out of their
local area, unlike State elections. Hence many ‘out of area’ electors go to the
Sydney Town Hall expecting to be able to vote and are turned away. Following
amendments made to the Local Government legislation the NSWEC provided a new
service to assist electors from any part of NSW who either work or visit the city, to vote
at the Sydney Town Hall during the pre-poll period or on election day.
The NSWEC operated Sydney Town Hall as a statewide pre-poll venue and as a
polling place on election day issuing ordinary votes for all councils whose elections
were conducted by the NSWEC. The opportunity to be part of the Sydney Town Hall
initiative was extended to Councils administering their elections. Of these 14 councils
six accepted the offer (see Appendix D: 2012 Local Government Elections Councils
Administering their Elections and Participation in the Sydney Town Hall Initiative.).
Each council using the facility was charged according to the number of votes taken
for their council. As the City of Sydney Council provided the venue at no cost,
councils’ costs were confined principally to staffing costs. The charges were shown
as a separate line item on the invoice.
It was estimated that up to 20,000 electors would vote at the Sydney Town Hall and it
was anticipated that half would be out of City Of Sydney Council voters. This
estimate was exceeded with a total of 30,561 electors using this polling centre.
Almost two thirds (19,121) voted at the Sydney Town Hall during the pre-poll period
and 11,440 on election day. There were 1,169 enrolment votes in the pre-poll period
and 947 on election day.
REPORT ON THE 2012 LOCAL GOVERNMENT ELECTIONS
Part 1
52
In addition to this new service, the NSWEC established a ‘self-service computer mark-
off’ for the roll. Following successful mark off the roll, electors were issued with a
docket which contained their details, council area and ward and listed the ballot
papers they were to receive. When provided to an Issuing Officer, the docket was
exchanged for the ballot papers and the elector voted as usual.
All votes were initially counted at the Sydney Town Hall, the results entered into the
computer system and pre-poll votes results phoned through to the various Returning
Officers on the Sunday. All ordinary issued ballot papers and declaration votes were
then couriered to Returning Officers.
This initiative was evaluated by the NSWEC using field interviews of electors
undertaken on election day. The satisfaction of voters has been reported earlier in
this section, however the evaluation also revealed that:
28% were repeat Sydney Town Hall voters who live locally and middle aged (35 –
54 years);
greatest reason for voting at Sydney Town Hall was ‘convenience to home’ (39%);
second most common reason was ‘outside of Local Government Area’ (33%);
and
those voting at Sydney Town Hall and ‘out of their LGA’ were more likely to be
younger (18 – 24 years) and women.
Voting on Election Day - Ordinary Polling
The legislation does not provide for absent voting at Local Government elections.viii
On election day an elector could vote at:
undivided council area – at any polling place within the council area in which
the elector was enrolled; or
divided council area (with wards) – at any polling place within the ward in which
the elector was enrolled; or
designated multi-ward polling place or multi-council polling place; or
multi-area polling place such as Sydney Town Hall.
Polling places were open on election day from 8am until 6pm.
The number of votes taken as ordinary votes on election day was 2,149,904 (or 73.6%
of the total votes counted of 2,922,536).
Assistance to Electors When Voting
Assistance was provided to electors during voting if an election official was satisfied
that the elector was unable to vote without help. In addition, an elector can
nominate any person, except a candidate, to assist them for example, an
interpreter.
Information on Candidates
For electors seeking information on candidates, the polling places were able to
provide access to the Candidate Information Sheets provided by candidates. These
REPORT ON THE 2012 LOCAL GOVERNMENT ELECTIONS
Part 1
53
were available also on the NSWEC and council websites and were available for
public inspection in the Returning Officer’s office from noon on nomination day and
at the pre-poll office(s). Information on the policies of candidates is not provided by
the Commission (unless included by candidates on their Candidate Information
Sheets). The website directed those seeking such information to the candidates.
Non-voters and Issuing of Penalty Notices
The NSWEC has an obligation under the Local Government Act 1993 to issue penalty
notices to electors who failed to vote in Local Government elections and who did
not have a valid reason for not voting.
Under the Local Government Act 1993, legitimate reasons for not voting include:
Death;
Absence from the area on polling day;
Ineligibility to vote;
Religious reasons prevent attendance at a polling booth; and
Other reason acceptable to the Electoral Commissioner.
The process of identifying non-voters entails the NSWEC scanning the roll marked with
the names of those electors who have voted to identify those who appear not to
have been marked off the roll and not voted. Using this initial list, the NSWEC
identifies those electors who are deceased, moved interstate or very elderly and
those who provided an excuse for not voting. This process ensures that the issuing of
penalty notices is targeted to those who appear not to have valid reasons as to why
they did not vote. The penalty notice provides recipients with the options of:
Advising, in writing, their reason for not voting;
Claiming they did vote and providing details of where they voted;
Paying the penalty; or
Applying for the matter to be heard by a Court.
The penalty for not voting in a Local Government election is $55.
Across NSW 587,021electors failed to vote at the 2012 Local Government Elections or
12.9% as a percentage of the total NSW electoral roll (based on 136 councils not all
council as in 2008).ix
The six councils in 2012 with the lowest non-voter rate against enrolment were:
Weddin Shire Council 7.9%
Temora Shire Council 8.3%
Blayney Shire Council 9.0%
City of Lithgow Council 9.2%
Harden Shire Council 9.2%
Cabonne Shire Council 9.2%
The five councils in 2012 with the highest non-voter rate included:
The Council of the Shire of Wakool 37.1% Note only one ward contested

REPORT ON THE 2012 LOCAL GOVERNMENT ELECTIONS
Part 1
54
Council of the City of Sydney 25.5%
Brewarrina Shire Council 24.9%
Urana Shire Council 24.9% Note only one ward contested
Walgett Shire Council 24.8%
Reminder notices were issued to electors who did not reply to the initial notice or
who provided an insufficient reason for failure to vote. Matters which were
outstanding, or for which an unacceptable reply had been received, are referred to
State Debt Recovery Office for enforcement. The State Debt Recovery Office follows
up matters after three attempts by the NSWEC.
The revenue from non-voting fines is not provided to the NSWEC. The State Debt
Recovery Office forwards these revenues to the NSW Government’s Consolidated
Fund.
Analysis of the reasons provided by non-voters as to why they did not vote in the
2012 Local Government Elections showed that the most common reason provided
was that the elector was out of the area, followed by illness or caring for someone.
Feedback from Electors
The key findings from the surveys of electors were provided in Section 2 in the
discussion about the NSWEC’s performance against its Service Charter. There is a
wealth of further information contained in the survey reports provided in Part 3.
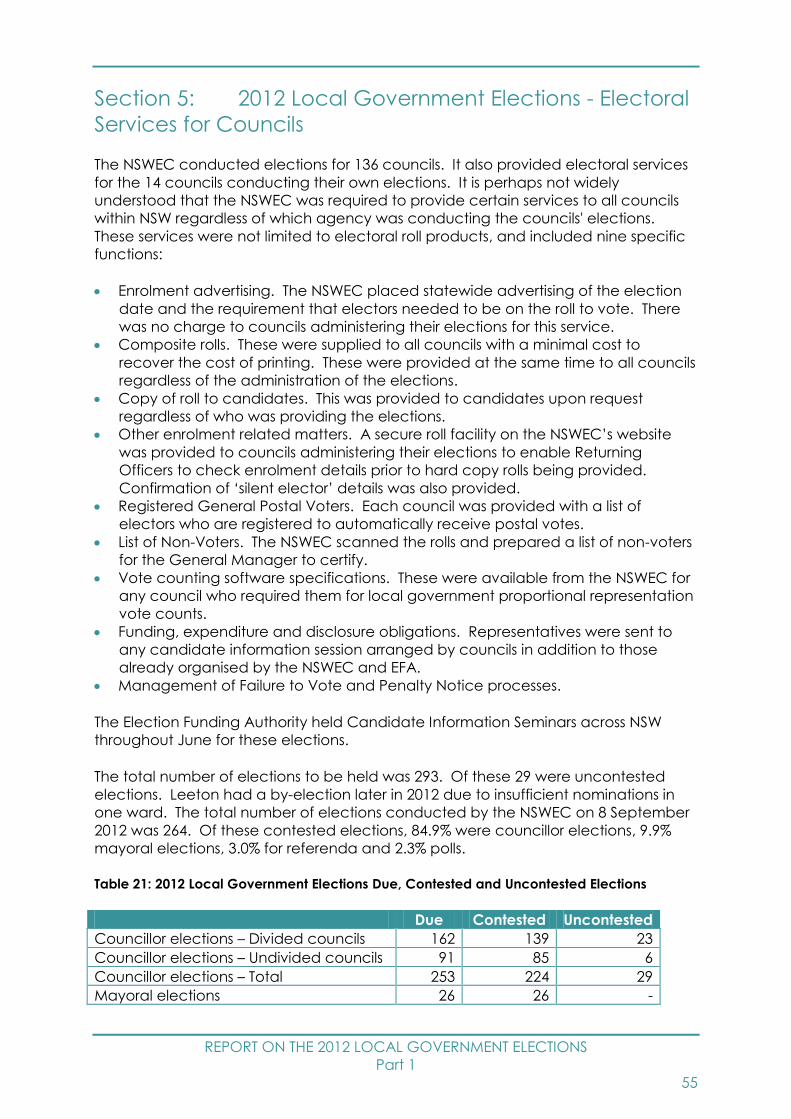
REPORT ON THE 2012 LOCAL GOVERNMENT ELECTIONS
Part 1
55
Section 5: 2012 Local Government Elections - Electoral
Services for Councils
The NSWEC conducted elections for 136 councils. It also provided electoral services
for the 14 councils conducting their own elections. It is perhaps not widely
understood that the NSWEC was required to provide certain services to all councils
within NSW regardless of which agency was conducting the councils' elections.
These services were not limited to electoral roll products, and included nine specific
functions:
Enrolment advertising. The NSWEC placed statewide advertising of the election
date and the requirement that electors needed to be on the roll to vote. There
was no charge to councils administering their elections for this service.
Composite rolls. These were supplied to all councils with a minimal cost to
recover the cost of printing. These were provided at the same time to all councils
regardless of the administration of the elections.
Copy of roll to candidates. This was provided to candidates upon request
regardless of who was providing the elections.
Other enrolment related matters. A secure roll facility on the NSWEC’s website
was provided to councils administering their elections to enable Returning
Officers to check enrolment details prior to hard copy rolls being provided.
Confirmation of ‘silent elector’ details was also provided.
Registered General Postal Voters. Each council was provided with a list of
electors who are registered to automatically receive postal votes.
List of Non-Voters. The NSWEC scanned the rolls and prepared a list of non-voters
for the General Manager to certify.
Vote counting software specifications. These were available from the NSWEC for
any council who required them for local government proportional representation
vote counts.
Funding, expenditure and disclosure obligations. Representatives were sent to
any candidate information session arranged by councils in addition to those
already organised by the NSWEC and EFA.
Management of Failure to Vote and Penalty Notice processes.
The Election Funding Authority held Candidate Information Seminars across NSW
throughout June for these elections.
The total number of elections to be held was 293. Of these 29 were uncontested
elections. Leeton had a by-election later in 2012 due to insufficient nominations in
one ward. The total number of elections conducted by the NSWEC on 8 September
2012 was 264. Of these contested elections, 84.9% were councillor elections, 9.9%
mayoral elections, 3.0% for referenda and 2.3% polls.
Table 21: 2012 Local Government Elections Due, Contested and Uncontested Elections
Due Contested Uncontested
Councillor elections – Divided councils 162 139 23
Councillor elections – Undivided councils 91 85 6
Councillor elections – Total 253 224 29
Mayoral elections 26 26 -
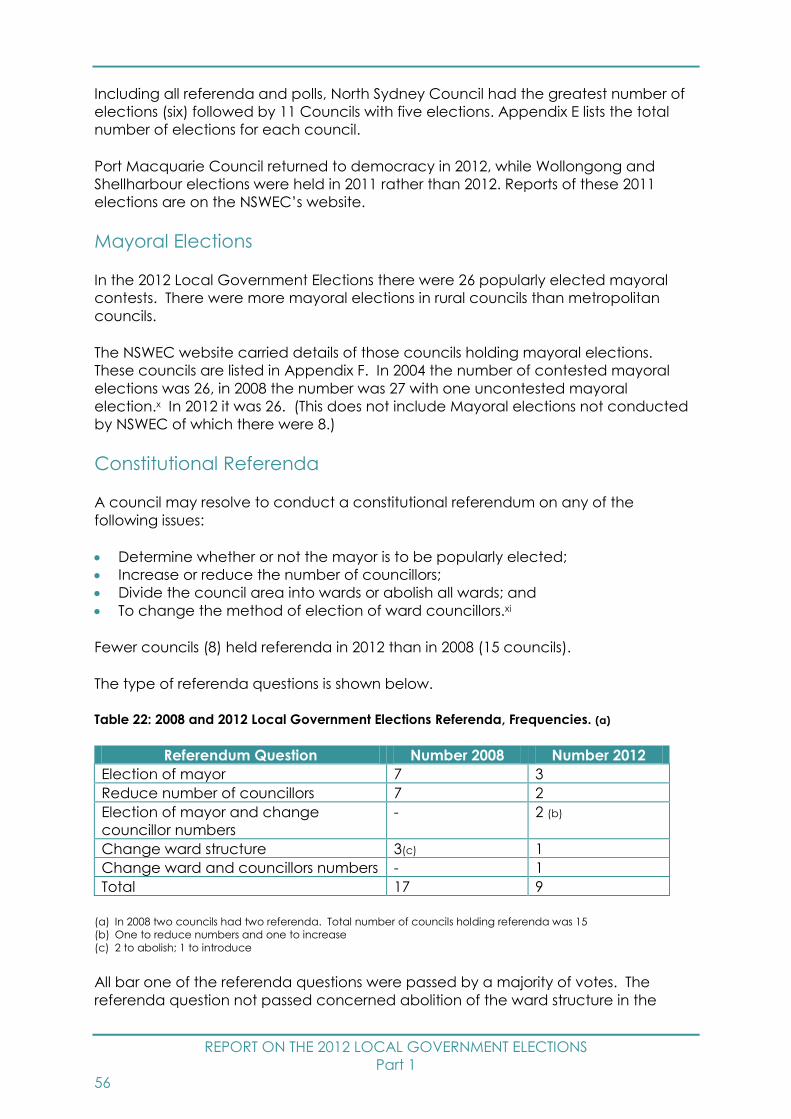
REPORT ON THE 2012 LOCAL GOVERNMENT ELECTIONS
Part 1
56
Including all referenda and polls, North Sydney Council had the greatest number of
elections (six) followed by 11 Councils with five elections. Appendix E lists the total
number of elections for each council.
Port Macquarie Council returned to democracy in 2012, while Wollongong and
Shellharbour elections were held in 2011 rather than 2012. Reports of these 2011
elections are on the NSWEC’s website.
Mayoral Elections
In the 2012 Local Government Elections there were 26 popularly elected mayoral
contests. There were more mayoral elections in rural councils than metropolitan
councils.
The NSWEC website carried details of those councils holding mayoral elections.
These councils are listed in Appendix F. In 2004 the number of contested mayoral
elections was 26, in 2008 the number was 27 with one uncontested mayoral
election.x In 2012 it was 26. (This does not include Mayoral elections not conducted
by NSWEC of which there were 8.)
Constitutional Referenda
A council may resolve to conduct a constitutional referendum on any of the
following issues:
Determine whether or not the mayor is to be popularly elected;
Increase or reduce the number of councillors;
Divide the council area into wards or abolish all wards; and
To change the method of election of ward councillors.xi
Fewer councils (8) held referenda in 2012 than in 2008 (15 councils).
The type of referenda questions is shown below.
Table 22: 2008 and 2012 Local Government Elections Referenda, Frequencies. (a)
Referendum Question Number 2008 Number 2012
Election of mayor 7 3
Reduce number of councillors 7 2
Election of mayor and change
councillor numbers
- 2 (b)
Change ward structure 3(c) 1
Change ward and councillors numbers - 1
Total 17 9
(a) In 2008 two councils had two referenda. Total number of councils holding referenda was 15
(b) One to reduce numbers and one to increase
(c) 2 to abolish; 1 to introduce
All bar one of the referenda questions were passed by a majority of votes. The
referenda question not passed concerned abolition of the ward structure in the

REPORT ON THE 2012 LOCAL GOVERNMENT ELECTIONS
Part 1
57
Walcha Local Government Area. The results of the 2012 referenda are available on
the NSWEC’s website.
Council Polls
Six councils held a poll. In contrast to 2008, there was just one poll question per
council. The poll questions concerned a wide range of issues with half concerning
possible changes to the council’s name, followed by matters such as support for
coal seam gas exploration, council amalgamation and retention of a local hospital.
The councils conducting a poll were:
Bega Valley Shire Council
Burwood Council
Lismore City Council
Mosman Municipal Council
Strathfield Municipal Council
Warrumbungle Shire Council
See Appendix G for poll questions by council.
Uncontested Elections
Eight councils had a match between the number of positions and the number of
candidates. These councils were:
Carrathool Shire Council
Cobar Shire Council
Conargo Shire Council
Corowa Shire Council
Deniliquin Council
Narrandera Shire Council
Oberon Council
Warren Shire Council
In 10 wards the number of nominations received for the position of councillor was
equal to the number of available positions. These wards included:
Dungog Shire Council – B Ward
Greater Hume Shire Council – East Ward and North Ward
Lockhart Shire Council – C Ward
Murrumbidgee Shire Council – East Ward
Urana Shire Council – B Ward and C Ward
The Council of the Shire of Wakool – B Ward and C Ward
Walcha Council – D Ward
All candidates who nominated for the above positions were declared elected on
Saturday, 8 September 2012.
Those councils with insufficient candidates are addressed under ‘By-elections’ below.

REPORT ON THE 2012 LOCAL GOVERNMENT ELECTIONS
Part 1
58
By–elections
One council, Leeton Shire Council, received insufficient nominations for the number
of vacancies resulting in a by-election held 8 December 2012.
Deferred Elections
There were no councils with deferred elections due to being under administration.
Wollongong and Shellharbour Councils’ elections will be held in 2016 as legislation
was passed to enable the term of appointment from the election in 2011 to be five
years rather than four.
Redistribution of Council Ward Boundaries
Section 211 of the Local Government Act 1993 requires councils to keep ward
boundaries under review. Councils were required to submit to the NSWEC finalised
ward boundaries by 31 December 2012. 24 councils submitted ward changes. For
the 2008 elections, 34 councils submitted changes.
Councils submitting ward boundary alteration proposals and ward name changes
also needed do so by the 31 December 2012. The changes and the councils
affected are listed below.
Ward Adjustment
Bankstown City Council
The Council of the City of Botany Bay
Central Darling Shire Council
Cessnock City Council
Dungog Shire Council
Holroyd City Council
Kogarah City Council
Kyogle Council
Lachlan Shire Council
Lockhart Shire Council
Maitland City Council
Marrickville Council
Parramatta City Council
Uralla Shire Council
Wollondilly Shire Council
Abolition of Wards
Cabonne Shire Council
Guyra Shire Council
Leeton Shire Council
Mosman Municipal Council
Singleton Council
Weddin Shire Council
REPORT ON THE 2012 LOCAL GOVERNMENT ELECTIONS
Part 1
59
Local Government Boundary Alteration
Canterbury City Council
Hurstville City Council
Residential and Non-residential Electoral Rolls
A key service provided to all councils not just for those for whom the NSWEC
conducted the elections, was the management of the electoral roll.
The roll of electors for each council area or ward is a composite roll, comprising:
Residential roll; and
Non-residential roll.
Electors for council elections include residents as well as ratepayers who may reside
outside the Local Government Area. The Local Government Act 1993 prohibits a
person voting more than once in one area, however, an individual can vote once in
one council as a resident and vote again in another council area as a rate payer.
The NSWEC prepared the residential roll for each council area or ward, including
those councils who did not have their elections conducted by the NSWEC. All
electors enrolled on the Commonwealth/State electoral roll as at 6pm Monday 30
July 2012 appeared on the appropriate council roll for the 2012 Local Government
Elections.
The non-residential roll is made up of the roll of non-residential electors and the roll of
occupiers and rate paying lessees. The non-residential roll lapses after each
election. Inclusion on the non-residential roll of electors is available to electors who
pay rates to the council on property they own but do not occupy, as well as people
who occupy or lease property. The Local Government Act 1993 sections 299 and
300, assigns the responsibility for the compilation and maintenance of the non-
residential roll of electors to the General Manager other than the Council of the City
of Sydney. Voting is not compulsory for electors on the non-residential roll (except
City of Sydney where voting is compulsory).
The 2008 Joint Standing Committee’s report outlined key recommendations to assist
in the conduct of future Local Government elections. One of the recommendations
was in relation to providing information to councils on strategies to improve
enrolment levels to non-residential electors. During the year the Commission actively
engaged and consulted with councils regarding legislation covering the non-
residential roll application process to ensure that unnecessary complexities are
eliminated and the process is made less onerous and more consistent.
As part of the consultation process the Commission provided information to councils
(including those that chose not to utilise our election services) on strategies to
improve enrolment levels to non-residential electors including:
provision of a 2012 non-residential roll application form template that councils
were encouraged to customise and prominently display on their website for
downloading and printing by potential applicants;

REPORT ON THE 2012 LOCAL GOVERNMENT ELECTIONS
Part 1
60
provision of a computer system to allow council officers to directly enter General
Manager confirmed enrollees into the electoral roll system;
provision of enrolment qualifications on our website;
contacting councils conducting their own elections to advise them of certain
provisions in the Local Government Act 1993 that calls for them to provide the
final confirmation of each of the non-residential rolls for their area or wards
(where divided). The Commission provided these councils with a web based
electoral roll look up facility to assist with this final confirmation process;
scheduling of generic national, state and local press advertising regarding the
non-residential roll; and
assist Local Government authorities with non-residential roll maintenance
processes for the 2012 Local Government Elections.
The non-residential roll for all councils contained 3,178 electors at the close of rolls
6pm, Monday 30 July 2012. The council with the largest non-residential roll was
Council of the City of Sydney with 1,709 enrolments, that is 53.8% of the total NSW
non-residential roll, followed by Eurobodalla Council with 11.8% (376). Those councils
with a non-residential roll and the number of electors are provided in Appendix H.
Of the total number of councils having elections (both councils with elections being
conducted by the NSWEC and those not), 32 did not have any enrolments on their
non-residential roll in the 2012 Local Government Elections.
Both the residential and non-residential rolls for the 2012 elections closed at 6pm on
Monday, 30 July 2012.
The survey of General Managers undertaken by the NSWEC revealed that 87.8% felt
that they received adequate information from the NSWEC on how to prepare the
non-residential roll. Concerns raised were about the overall arrangements for non-
residential rolls with a number feeling that this should not be a responsibility of the
council or that certain provisions made no sense (for example, that only one person
would vote even though a couple may own a property in a different council area).
One comment captures the many issues involved in non-residential rolls:
Prior to the next election the Council will write to every potential
property which may be eligible to apply for someone to be entered
into the non-resident roll. I believe that he(sic) NSWEC has
adequate processes in place but there does seem to be a
reluctance from some eligible non-residents to actually make the
effort to nominate for the roll.
Respondent to the survey of General Managers on the conduct of
the elections, September 2012.
Non-Residential Roll for Council of the City of Sydney
The Electoral Commissioner is required to prepare and certify the non-residential rolls
as prescribed in the City of Sydney Act 1988 (section 18A).
The right to be included in the Council of the City of Sydney non-residential roll
applies to owners of rateable land in the council area, and rate paying lessees and
occupiers of rateable land in the council area whose primary place of residence is

REPORT ON THE 2012 LOCAL GOVERNMENT ELECTIONS
Part 1
61
NSW. Anyone seeking enrolment on the non-residential roll must be eligible to be on
a parliamentary electoral roll and be eligible to vote for either the NSW Legislative
Assembly or the Federal House of Representatives.
An elector on the Council of the City of Sydney’s residential roll cannot be on the
non-residential roll and an individual or nominee claimant can only be enrolled on
the non-residential roll once. In contrast to the arrangements for other councils, if an
elector on the non-residential roll fails to vote, a fine may apply.
There had been a decline of 58.1% between 1999 and 2004 in the number of electors
on the Council of the City of Sydney’s non-residential roll. This decline continued in
the 2008 Local Government Elections despite increased efforts to boost enrolment.
The continued decline prompted the NSWEC and the Council of the City of Sydney
to undertake additional efforts to ensure awareness of the right to be included on
this roll.
In March 2012 the Council sought information on how the Commission intended to
ensure all eligible voters were informed and encouraged to take up their right to be
enrolled on the non-residential roll for the 2012 Local Government Elections.
Our strategies included:
an Elector Enquiry Centre using experienced operators from the SmartRoll call
centre to assist electors;
City of Sydney specific non-residential roll advertisements placed in the national
and local press notifying readers of the elections and the potential for eligible
people to vote as non-residents;
advertising in free metropolitan newspapers directs readers to a call-to-action
Facebook page that includes a simple video calling for those eligible to enrol for
the non-residential roll;
mailing a call-to-action package of application forms, reply-paid envelopes and
information to in excess of 80,000 potential electors using Council’s individual or
corporate ratepayer information and segments of the NSW Department of Fair
Trading’s database;
contacting 125 Property Managing Agents to request email contact with a
further approximately 5,700 potential electors;
non-residential roll enrolment page for the Council of the City of Sydney provided
on our website; and
information provided to various interested stakeholders, such as the NSW Business
Council and Living Sydney Lobby Group, to communicate to their respective
clients.
These efforts saw an increase of 331.6% in the number of enrolments from the 2008
Local Government Elections and halted the decline noted above.
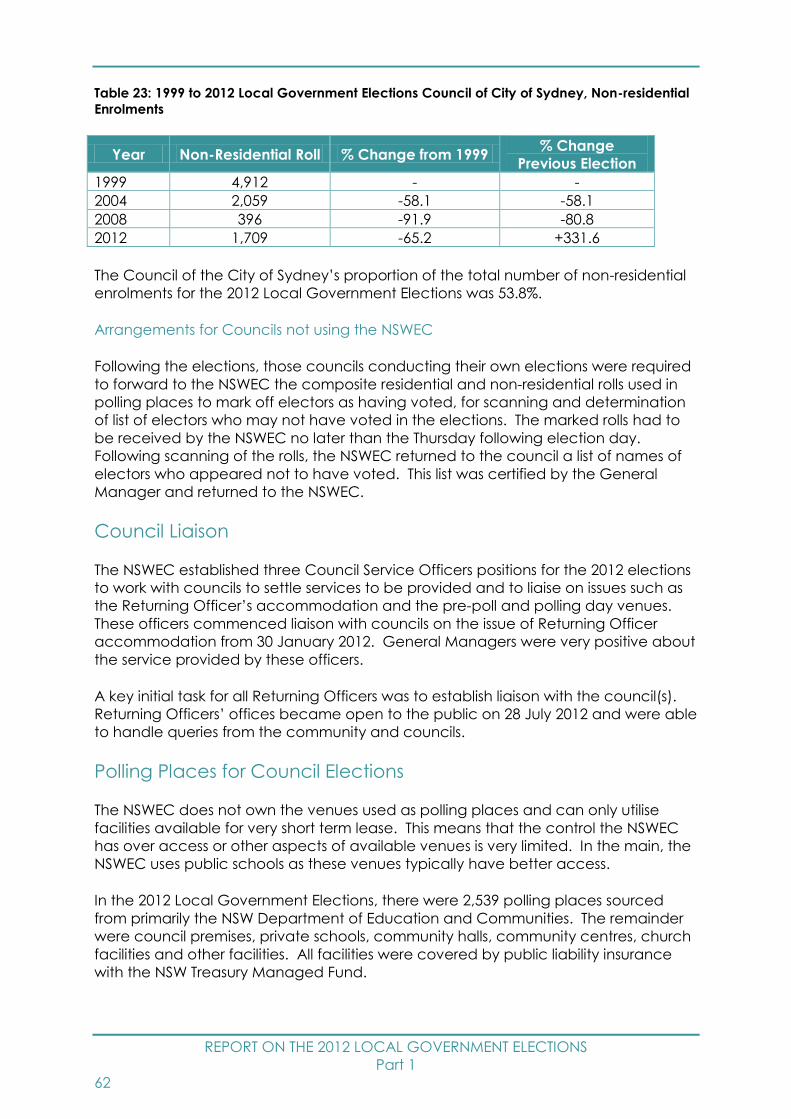
REPORT ON THE 2012 LOCAL GOVERNMENT ELECTIONS
Part 1
62
Table 23: 1999 to 2012 Local Government Elections Council of City of Sydney, Non-residential
Enrolments
Year Non-Residential Roll % Change from 1999 % Change
Previous Election
1999 4,912 - -
2004 2,059 -58.1 -58.1
2008 396 -91.9 -80.8
2012 1,709 -65.2 +331.6
The Council of the City of Sydney’s proportion of the total number of non-residential
enrolments for the 2012 Local Government Elections was 53.8%.
Arrangements for Councils not using the NSWEC
Following the elections, those councils conducting their own elections were required
to forward to the NSWEC the composite residential and non-residential rolls used in
polling places to mark off electors as having voted, for scanning and determination
of list of electors who may not have voted in the elections. The marked rolls had to
be received by the NSWEC no later than the Thursday following election day.
Following scanning of the rolls, the NSWEC returned to the council a list of names of
electors who appeared not to have voted. This list was certified by the General
Manager and returned to the NSWEC.
Council Liaison
The NSWEC established three Council Service Officers positions for the 2012 elections
to work with councils to settle services to be provided and to liaise on issues such as
the Returning Officer’s accommodation and the pre-poll and polling day venues.
These officers commenced liaison with councils on the issue of Returning Officer
accommodation from 30 January 2012. General Managers were very positive about
the service provided by these officers.
A key initial task for all Returning Officers was to establish liaison with the council(s).
Returning Officers’ offices became open to the public on 28 July 2012 and were able
to handle queries from the community and councils.
Polling Places for Council Elections
The NSWEC does not own the venues used as polling places and can only utilise
facilities available for very short term lease. This means that the control the NSWEC
has over access or other aspects of available venues is very limited. In the main, the
NSWEC uses public schools as these venues typically have better access.
In the 2012 Local Government Elections, there were 2,539 polling places sourced
from primarily the NSW Department of Education and Communities. The remainder
were council premises, private schools, community halls, community centres, church
facilities and other facilities. All facilities were covered by public liability insurance
with the NSW Treasury Managed Fund.
REPORT ON THE 2012 LOCAL GOVERNMENT ELECTIONS
Part 1
63
In recognition that there is no absent voting in Local Government elections, there
was provision for some polling places to issue votes for a larger area, such as:
Sydney Town Hall being a polling place for other councils;
Principal polling places to issue votes for all wards of the council;
Multi ward polling places located close to ward boundaries to issue votes for both
the ward(s) in which it was located as well as the ward(s) it adjoined; and
Multi council polling places where a single premise served as a polling place for
two or more council areas.
Prior to finalising polling places, the NSWEC wrote to General Managers to seek
comment on the proposed polling places, staffing and the projected number of
votes.
Councils share Returning Officers
In the 2008 Local Government Elections, Regional Returning Officers were introduced
for small councils in rural and remote locations. This arrangement worked well and
was extended to more councils including some metropolitan councils in 2012.
Overall, there were more regions in 2012 (34) than in 2008 (30) and the size of regions
was smaller. Thirty councils each had a Returning Officer who was not conducting
elections for other councils.
In 2008, there were two regions each with seven councils. In 2012, the two largest
regions each had four councils.
A number of factors were analysed to determine the regions including:
number of electors per Local Government Area;
size of Local Government Area;
geography of Local Government Area;
previous regions used and how well they worked at the 2008 Local Government
Elections;
analysis of contiguous Local Government Area boundaries;
feedback from councils following visits and subsequent discussions, relating to
regional Returning Officers’ Offices;
analysis of the Returning Officer workload and feasibility of conducting multiple
council elections simultaneously;
the number, size and complexity of elections created by the formation of a
region; and
availability of Returning Officers to service the region.
78% of General Managers who shared a Returning Officer in 2008 indicated in survey
responses that they were prepared to share a Returning Officer at future elections;
and 75% of General Managers indicated they were either neutral, satisfied or very
satisfied that the benefits they were expecting from sharing a Returning Officer had
been delivered.
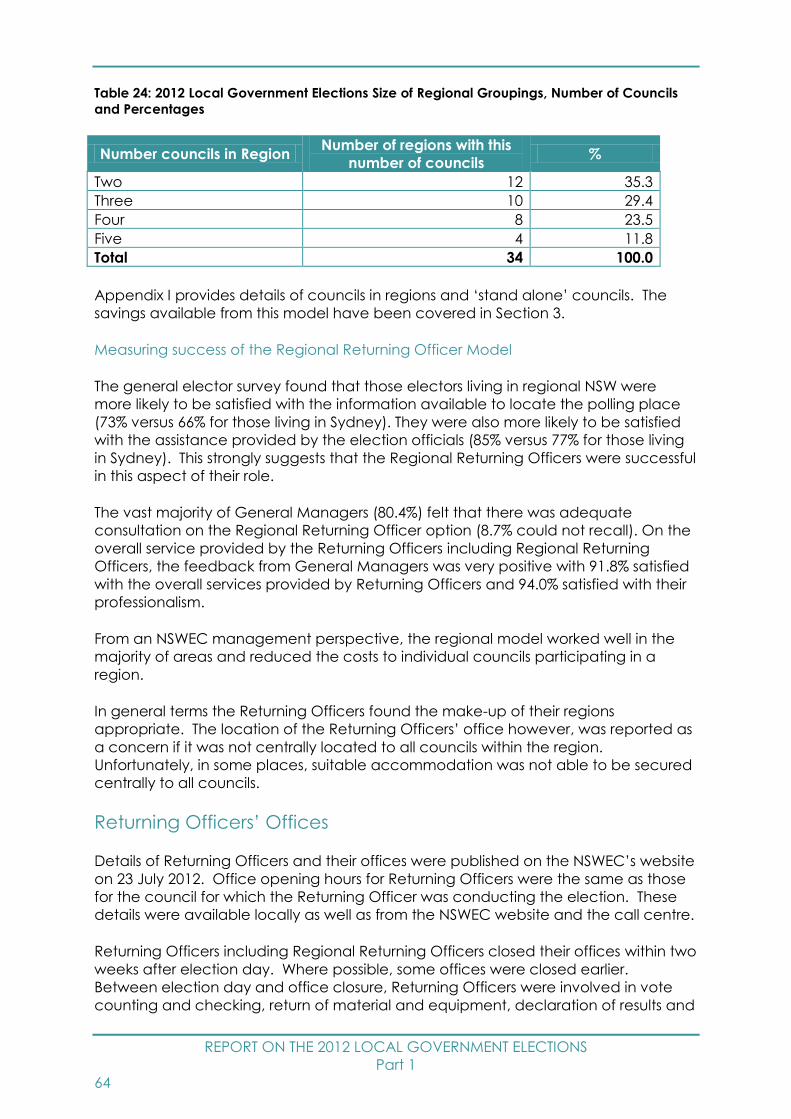
REPORT ON THE 2012 LOCAL GOVERNMENT ELECTIONS
Part 1
64
Table 24: 2012 Local Government Elections Size of Regional Groupings, Number of Councils
and Percentages
Number councils in Region Number of regions with this
number of councils %
Two 12 35.3
Three 10 29.4
Four 8 23.5
Five 4 11.8
Total 34 100.0
Appendix I provides details of councils in regions and ‘stand alone’ councils. The
savings available from this model have been covered in Section 3.
Measuring success of the Regional Returning Officer Model
The general elector survey found that those electors living in regional NSW were
more likely to be satisfied with the information available to locate the polling place
(73% versus 66% for those living in Sydney). They were also more likely to be satisfied
with the assistance provided by the election officials (85% versus 77% for those living
in Sydney). This strongly suggests that the Regional Returning Officers were successful
in this aspect of their role.
The vast majority of General Managers (80.4%) felt that there was adequate
consultation on the Regional Returning Officer option (8.7% could not recall). On the
overall service provided by the Returning Officers including Regional Returning
Officers, the feedback from General Managers was very positive with 91.8% satisfied
with the overall services provided by Returning Officers and 94.0% satisfied with their
professionalism.
From an NSWEC management perspective, the regional model worked well in the
majority of areas and reduced the costs to individual councils participating in a
region.
In general terms the Returning Officers found the make-up of their regions
appropriate. The location of the Returning Officers’ office however, was reported as
a concern if it was not centrally located to all councils within the region.
Unfortunately, in some places, suitable accommodation was not able to be secured
centrally to all councils.
Returning Officers’ Offices
Details of Returning Officers and their offices were published on the NSWEC’s website
on 23 July 2012. Office opening hours for Returning Officers were the same as those
for the council for which the Returning Officer was conducting the election. These
details were available locally as well as from the NSWEC website and the call centre.
Returning Officers including Regional Returning Officers closed their offices within two
weeks after election day. Where possible, some offices were closed earlier.
Between election day and office closure, Returning Officers were involved in vote
counting and checking, return of material and equipment, declaration of results and
REPORT ON THE 2012 LOCAL GOVERNMENT ELECTIONS
Part 1
65
administrative matters such as obtaining outstanding personnel information for
payment of polling place staff.
Council Services
Some councils undertook on their own accord a number of activities to support the
Local Government elections.
In the survey of General Managers 63 (56.3%) indicated that their council had
provided activities to support the elections. These were primarily providing
information or seminars on the role of Mayors/Councillors and advertising referenda
and polls.
Accepting candidate nomination forms and deposits was undertaken by some
councils. Of those General Managers who responded to the survey 44.0% had
undertaken this particular service with the majority (88.9%) reporting no difficulties.
The Counting Timeframe
The NSWEC provided councils with a ‘count schedule’ of when it was planned to
complete the count and declare all elections as follows:
Saturday, 8 September 2012:
Preliminary results from each polling place progressively online from 6.30pm including
poll and referenda questions along with pre-poll, postal and Declared Institution
votes.
Sunday, 9 September 2012:
Check count to confirm results.
Monday, 10 September – Tuesday, 11 September 2012:
All Mayoral counts to be completed.
Sunday, 9 September – Friday, 14 September 2012:
Distribution of preferences, poll and referenda counts to be completed.
Friday 14 September 2012:
Counting to conclude.
Vote Counting
Method of Election - Mayor
The method of election in a Mayoral election is optional preferential.
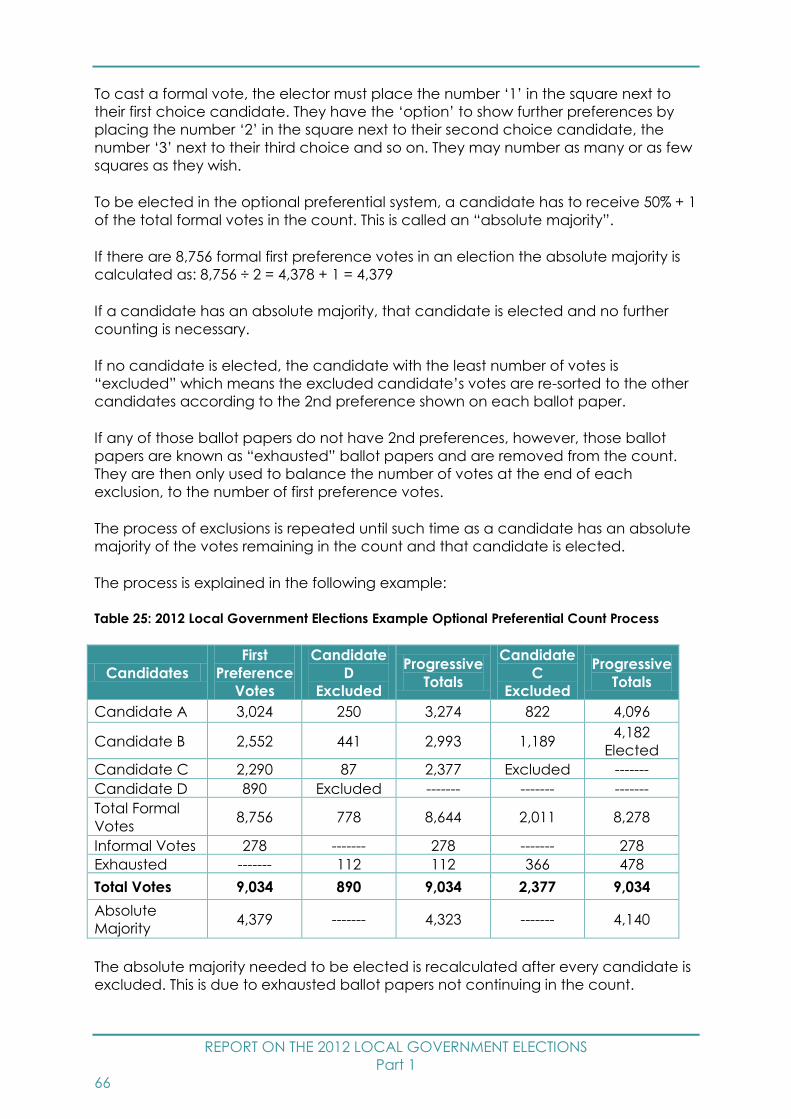
REPORT ON THE 2012 LOCAL GOVERNMENT ELECTIONS
Part 1
66
To cast a formal vote, the elector must place the number ‘1’ in the square next to
their first choice candidate. They have the ‘option’ to show further preferences by
placing the number ‘2’ in the square next to their second choice candidate, the
number ‘3’ next to their third choice and so on. They may number as many or as few
squares as they wish.
To be elected in the optional preferential system, a candidate has to receive 50% + 1
of the total formal votes in the count. This is called an “absolute majority”.
If there are 8,756 formal first preference votes in an election the absolute majority is
calculated as: 8,756 ÷ 2 = 4,378 + 1 = 4,379
If a candidate has an absolute majority, that candidate is elected and no further
counting is necessary.
If no candidate is elected, the candidate with the least number of votes is
“excluded” which means the excluded candidate’s votes are re-sorted to the other
candidates according to the 2nd preference shown on each ballot paper.
If any of those ballot papers do not have 2nd preferences, however, those ballot
papers are known as “exhausted” ballot papers and are removed from the count.
They are then only used to balance the number of votes at the end of each
exclusion, to the number of first preference votes.
The process of exclusions is repeated until such time as a candidate has an absolute
majority of the votes remaining in the count and that candidate is elected.
The process is explained in the following example:
Table 25: 2012 Local Government Elections Example Optional Preferential Count Process
Candidates
First
Preference
Votes
Candidate
D
Excluded
Progressive
Totals
Candidate
C
Excluded
Progressive
Totals
Candidate A 3,024 250 3,274 822 4,096
Candidate B 2,552 441 2,993 1,189 4,182
Elected
Candidate C 2,290 87 2,377 Excluded -------
Candidate D 890 Excluded ------- ------- -------
Total Formal
Votes 8,756 778 8,644 2,011 8,278
Informal Votes 278 ------- 278 ------- 278
Exhausted ------- 112 112 366 478
Total Votes 9,034 890 9,034 2,377 9,034
Absolute
Majority 4,379 ------- 4,323 ------- 4,140
The absolute majority needed to be elected is recalculated after every candidate is
excluded. This is due to exhausted ballot papers not continuing in the count.

REPORT ON THE 2012 LOCAL GOVERNMENT ELECTIONS
Part 1
67
The distribution of preferences in a Mayoral election cannot commence before
9.00am on the Tuesday following election day to ensure that all postal votes are
included following the deadline for receipt of postal votes at 6.00pm on the Monday
following election day.
Where a Mayor is elected by the electors, this result must be determined before
counting in the Councillor count can be finalised. Any first preferences on the
Councillor ballot paper for the person elected as Mayor are disregarded and any
subsequent preferences are reduced by one, i.e. a 2nd preference becomes a 1st
preference; a 3rd preference becomes a 2nd preference, and so on.
The distribution of preferences in the Mayoral election was conducted in the
Returning Officer’s office. All Mayoral counts were completed in the week following
election day.
Method of Election - Councillor
The method of election in a Councillor election is proportional representation. The
method is similar to that used in State elections for the Legislative Council.
To be elected a candidate generally must gain a quota of the formal votes. The
quota cannot be worked out until the total number of formal first preference votes is
known. Once the first preference count has taken place and informal ballot papers
are removed the quota is calculated:
Quota = (total number of formal votes ÷ one more than the number of vacancies) +
1
For example, if there are 12,000 formal votes and 5 vacancies to be filled, the quota
is:
12,000 formal votes ÷ 6 = 2,000 + 1 = 2,001.
In this example, a candidate needs at least 2001 votes to be elected.
The count is conducted by distributing votes according to the choices shown on the
ballot paper. When candidates reach a quota and are elected, their surplus or extra
votes above the quota are distributed to the remaining candidates.
Candidates with the lowest number of votes are then excluded and their ballot
papers are redistributed according to the next choice shown. This process continues
until all the vacancies are filled.
Candidates can also be elected if the remaining number of candidates in the count
equals the number of vacant positions still to be filled.
To assist stakeholders understand this complex counting process, the NSWEC has a
graphic representation of the proportional representation count process on its
website.
REPORT ON THE 2012 LOCAL GOVERNMENT ELECTIONS
Part 1
68
Councillor Elections
Councillor elections were counted using NSWEC vote counting software either at the
Returning Officer’s office or at the Local Government Counting Centre at Riverwood
Business Park, Unit 11, 100 Belmore Road, Riverwood.
A schedule of the estimated data entry and count times was available on the
NSWEC website from August 2012.
It was made clear that the schedule could change and it was necessary to check
the count schedule for updates. The preparation of ballot papers for data entry
(that is batching) commenced on Election Sunday.
Proportional Representation Computer Count Data Entry System
In 2008 any council (metropolitan or country) with Group Voting Squares (above the
line voting) had their ballot papers sent to Riverwood for data entry. All other
councils kept their ballot papers and undertook manual counts in the Returning
Officer’s office.
In 2012 all Councillor ballot papers were data entered. Councils in the Sydney basin
sent their Councillor ballot papers to Riverwood. All other councils had their
Councillor ballot papers and data entered in the Returning Office Regional office.
There were 32 data entry count centres operating, that is Riverwood and 31
Returning Officer Regional offices.
Councillor Computer Count
The NSWEC is authorised under clause 351 of the Local Government (General)
Regulation to send Councillor ballot papers to a central counting office administered
by the NSWEC and counted according to arrangements approved by the NSWEC.
All Councillor ballot papers were counted using the NSWEC vote counting software
either at the Returning Officer’s office or at the Local Government Counting Centre
at Riverwood, Sydney. Table 26 and Table 27 list the counting locations.
The secure transport of ballot papers to the Riverwood counting centre was ensured
through the use of dedicated vehicles with the sealed ballot paper boxes
transported directly to the Local Government Counting Centre.
The data entry operation at Riverwood consisted of 100 clerical staff checking and
preparing the ballot papers for data entry and 200 data entry staff working over two
shifts of eight hours. Data entry started on Sunday, 9 September 2012, and finished on
Saturday, 15 September 2012. 2.2 million Councillor ballot papers were data entered
at Riverwood.
Over the 31 Regional Returning Officers’ offices clerical and data entry staff data
entered 920,000 Councillor ballot papers. Data entry started on Sunday, 9 September
2012, and the last Council finished on Sunday, 17 September 2012.

REPORT ON THE 2012 LOCAL GOVERNMENT ELECTIONS
Part 1
69
The quality assurance system for the computerised count entailed all ballot papers
being put through two data entry rounds with a comparison between the two sets of
data to identify any differences. Where there were mismatches between the data
lots, a third verification of data entry was applied to correct mismatches. Before
running each count, data entry totals were reconciled against election night polling
place figures and declaration vote figures to ensure totals were complete and
correct. As information became available, the NSWEC website was updated on
election data entry and count status.
The Local Government Counting Centre schedule was updated daily for registered
political parties, groups, candidates and councils to reflect changes to the dates of
data entry and counting times and posted on the NSWEC’s website.
The Proportional Representation Computer Count (PRCC) system is the software
program in which Councillor ballot papers are data entered. This includes:
allocating ballot papers (in batches) to Data Entry Operators for round 1 and
round 2 data entry;
Data Entry Operators undertaking round 1 and round 2 data entry;
undertaking reconciliation on those batches where round 1 and round 2 data
entry do not match; and
distribution of preferences in the count to determine the elected Councillors
Table 26: 2012 Local Government Elections Councils with councillor ballot papers computer
counted at Riverwood.
Ashfield, Burwood and Strathfield Liverpool
Auburn Manly and Mosman
Bankstown North Sydney
Blacktown Parramatta
Blue Mountains and Lithgow Pittwater
Camden and Wollondilly Randwick
Campbelltown Rockdale
Canada Bay and Hunters Hill Ryde
Canterbury Sydney
Gosford The Hills Shire Council
Hawkesbury Warringah
Holroyd Waverley
Hornsby Willoughby
Hurstville Wingecarribee
Kogarah Woollahra
Ku-ring-gai Wyong
Leichhardt and Marrickville
Returning Officers in all other councils retained their councillor ballot papers for
computer counting at the Returning Officer’s office.
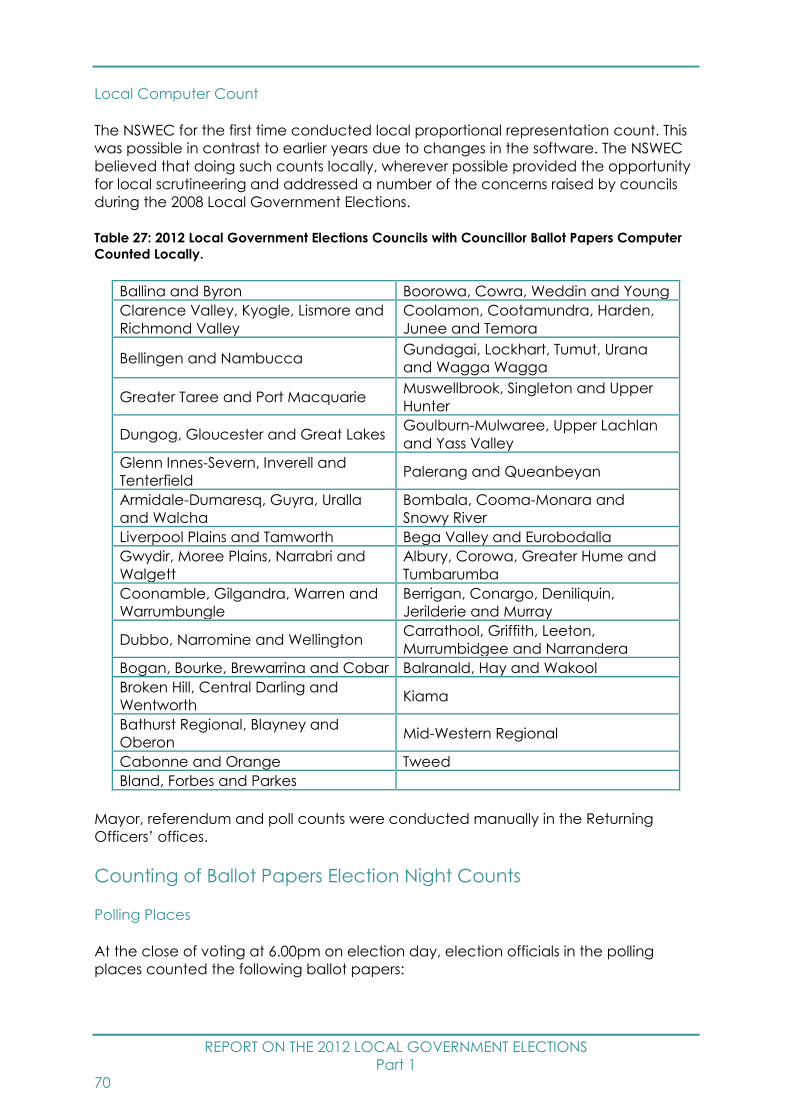
REPORT ON THE 2012 LOCAL GOVERNMENT ELECTIONS
Part 1
70
Local Computer Count
The NSWEC for the first time conducted local proportional representation count. This
was possible in contrast to earlier years due to changes in the software. The NSWEC
believed that doing such counts locally, wherever possible provided the opportunity
for local scrutineering and addressed a number of the concerns raised by councils
during the 2008 Local Government Elections.
Table 27: 2012 Local Government Elections Councils with Councillor Ballot Papers Computer
Counted Locally.
Ballina and Byron Boorowa, Cowra, Weddin and Young
Clarence Valley, Kyogle, Lismore and
Richmond Valley
Coolamon, Cootamundra, Harden,
Junee and Temora
Bellingen and Nambucca Gundagai, Lockhart, Tumut, Urana
and Wagga Wagga
Greater Taree and Port Macquarie Muswellbrook, Singleton and Upper
Hunter
Dungog, Gloucester and Great Lakes Goulburn-Mulwaree, Upper Lachlan
and Yass Valley
Glenn Innes-Severn, Inverell and
Tenterfield Palerang and Queanbeyan
Armidale-Dumaresq, Guyra, Uralla
and Walcha
Bombala, Cooma-Monara and
Snowy River
Liverpool Plains and Tamworth Bega Valley and Eurobodalla
Gwydir, Moree Plains, Narrabri and
Walgett
Albury, Corowa, Greater Hume and
Tumbarumba
Coonamble, Gilgandra, Warren and
Warrumbungle
Berrigan, Conargo, Deniliquin,
Jerilderie and Murray
Dubbo, Narromine and Wellington Carrathool, Griffith, Leeton,
Murrumbidgee and Narrandera
Bogan, Bourke, Brewarrina and Cobar Balranald, Hay and Wakool
Broken Hill, Central Darling and
Wentworth Kiama
Bathurst Regional, Blayney and
Oberon Mid-Western Regional
Cabonne and Orange Tweed
Bland, Forbes and Parkes
Mayor, referendum and poll counts were conducted manually in the Returning
Officers’ offices.
Counting of Ballot Papers Election Night Counts
Polling Places
At the close of voting at 6.00pm on election day, election officials in the polling
places counted the following ballot papers:
REPORT ON THE 2012 LOCAL GOVERNMENT ELECTIONS
Part 1
71
Mayor – if there was a Mayoral election, the first preference votes for each
candidate and the informal ballot papers were counted and recorded.
Councillor - the first preference votes for each candidate and, where applicable,
the first preference votes for each group marked in its group voting square were
counted and recorded.
Referendum or Poll – if there was a Referendum or Poll the Yes, No and informal
ballot papers were counted and recorded.
Returning Officer’s office
At 6.00pm on election day election officials in the Returning Officer’s office counted
the Mayor, Councillor, Referendum and Poll ballot papers for the following vote
types:
Pre-poll
Postal
Declared Institutions
All election night counts were verified the next day by a ‘check count’ at the
Returning Officers’ offices. Available postal, pre-poll, Declared Institution, silent and
section votes were included in this count as well.
Declaration vote counts continued on Sunday and Monday.
NSWEC Virtual Tally Room
All totals for Mayor, Councillor, Referendum and Poll ballot papers were posted
progressively on election night on the NSWEC website www.votensw.info. Check
count figures were updated progressively on the website on the days after election
day. The final distribution of preferences for Mayor and Councillor, and the final
results for Referenda and Polls, were progressively placed on the website in the week
after election day.
This was possible through the previous introduction of a virtual tally room as
requested by the NSW Local Government and Shires’ Associations.
Referenda and Polls
Counts for Referenda and Polls were finalised after all Mayoral and Councillor counts
had been completed.
Referendum and Poll counts were conducted in the Returning Officer’s office.
Declaration of Election Results
Uncontested elections were declared on 8 September 2012.

REPORT ON THE 2012 LOCAL GOVERNMENT ELECTIONS
Part 1
72
First preference results for every candidate were provided to councils on election
night. Declaration of results occurred after candidates were given 24 hours to
consider whether to seek a recount.
Returning Officers provided the Declaration of Poll forms to the Electoral
Commissioner, the General Manager of the Council, the Director-General, Division of
Local Government, Department of Premier and Cabinet and the Secretary of the
Local Government and Shires’ Associations of NSW. The results were also placed in
newspapers throughout NSW and on the NSW Electoral Commission’s websites.
Recounts
There were four recounts at the September 2012 Local Government Elections.
In each case the recount was requested, and paid for, by the candidate. In each
case the recount request was based on the closeness of the result. No recounts
were ordered by the Electoral Commissioner.
Following notification from the NSWEC that results were available candidates had 24
hours to request a recount. The recount request was required in writing and the
deposit paid ($45.00 per 100 ballot papers). The recount involved reading the ‘ballot
paper markings’ report from PRCC against the ballot paper to ensure the accuracy
of the data entry. If there was a change to any candidate’s preference the
computer count was run again and the candidates declared elected. No further
opportunity existed for a candidate to request another recount.
Eurobodalla Mayoral ballot papers were counted initially and recounted manually.
Table 28: 2012 Local Government Elections Recounts of Ballot Papers
Council Cost $ Position Date and Outcome
Eurobodalla $10,234.35 Mayor
Saturday 15/ Sunday
16 September
No change
Gloucester $1,510.65 Councillor
Saturday 15
September
No change
Uralla C Ward $554.85 Councillor Friday 14 September
No change
Walcha B Ward $221.85 Councillor Friday 14 September
Change
One council, Eurobodalla, did have a greater than 10 vote difference (46 vote in
total across the Council) due to errors in the original manual count but it did not alter
the outcome of which candidate was elected.
The recount at Gloucester Council was requested by a candidate due to the
closeness of the original result. The candidate paid for the cost of the recount which
took place on Saturday, 15 September. The recount resulted in no change to the
candidates elected in the original count.

REPORT ON THE 2012 LOCAL GOVERNMENT ELECTIONS
Part 1
73
The original count for Uralla C ward resulted in two candidates having an equal
number of votes (220 votes each) for the third and last elected position.
Under the legislation the candidate with the most number of votes at the previous
distribution is declared elected. At the previous distribution one candidate had 201
votes and the other had 192 votes. Therefore the candidate with 201 votes at that
distribution was the candidate to be elected.
The unsuccessful candidate requested a recount and, due to the random
distribution of preferences under the proportional representation system, was elected
at the recount by two votes.
In the case of the Walcha B Ward recount, the change is assessed as a result of the
nature of the voting system and the count process that applies. Specifically, there is
always the chance with proportional representation voting of a change in the
number of votes received by different candidates due to the random selection of
ballot papers that occurs throughout this type of a count.
In the 2008 Local Government Elections two recounts were undertaken and 12 in
2004.xii
Results of Referenda
Eight referenda questions were put to voters. Seven were successful. The results for
each council with a referendum are show below.
Table 29: 2012 Local Government Elections, Councils with Successful Referenda
Council Question Endorsed
Narrabri Shire Council Do you favour the number of Narrabri
Shire councillors being reduced from
twelve (12) to nine (9)?
Yes
North Sydney Council Currently North Sydney Council has
four wards and 12 councillors (three
per ward), plus the popularly elected
mayor, elected for a four year term.
Do you favour a reduction in the
number of wards from four to three
and the number of councillors from
13 to 10, inclusive of the popularly
elected mayor? If there is majority
support for the proposal, the changes
will take effect from the 2016
election.
Yes
Orange City Council The Mayor of Orange is currently
elected each year by the 12
Councillors. Do you approve of the
direct election of the Mayor by the
voters of Orange, for a four year
term?
Yes
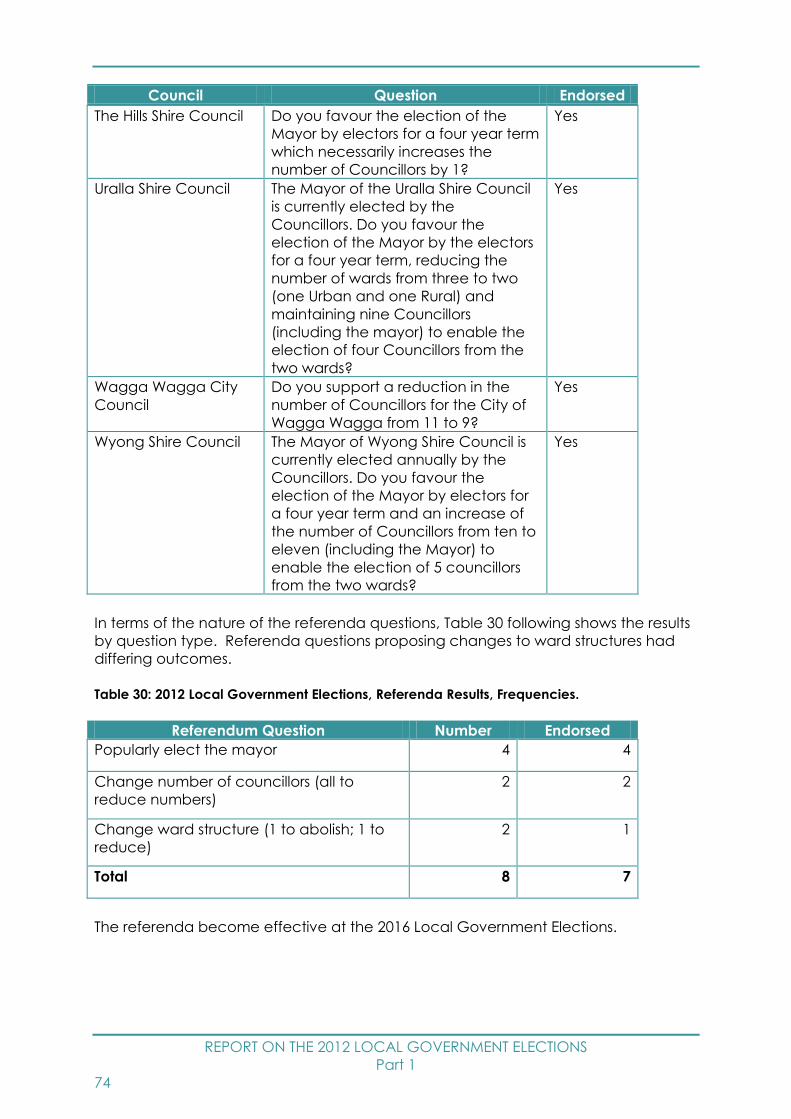
REPORT ON THE 2012 LOCAL GOVERNMENT ELECTIONS
Part 1
74
Council Question Endorsed
The Hills Shire Council Do you favour the election of the
Mayor by electors for a four year term
which necessarily increases the
number of Councillors by 1?
Yes
Uralla Shire Council The Mayor of the Uralla Shire Council
is currently elected by the
Councillors. Do you favour the
election of the Mayor by the electors
for a four year term, reducing the
number of wards from three to two
(one Urban and one Rural) and
maintaining nine Councillors
(including the mayor) to enable the
election of four Councillors from the
two wards?
Yes
Wagga Wagga City
Council
Do you support a reduction in the
number of Councillors for the City of
Wagga Wagga from 11 to 9?
Yes
Wyong Shire Council The Mayor of Wyong Shire Council is
currently elected annually by the
Councillors. Do you favour the
election of the Mayor by electors for
a four year term and an increase of
the number of Councillors from ten to
eleven (including the Mayor) to
enable the election of 5 councillors
from the two wards?
Yes
In terms of the nature of the referenda questions, Table 30 following shows the results
by question type. Referenda questions proposing changes to ward structures had
differing outcomes.
Table 30: 2012 Local Government Elections, Referenda Results, Frequencies.
Referendum Question Number Endorsed
Popularly elect the mayor 4 4
Change number of councillors (all to
reduce numbers)
2 2
Change ward structure (1 to abolish; 1 to
reduce)
2 1
Total 8 7
The referenda become effective at the 2016 Local Government Elections.
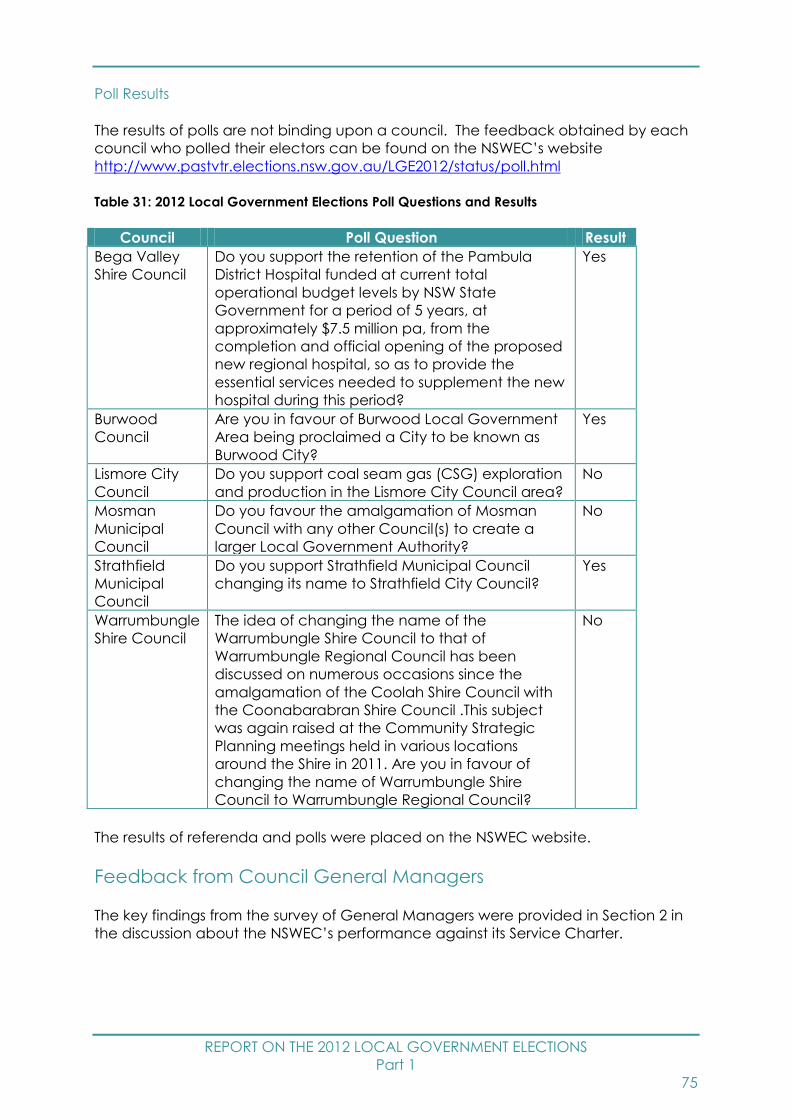
REPORT ON THE 2012 LOCAL GOVERNMENT ELECTIONS
Part 1
75
Poll Results
The results of polls are not binding upon a council. The feedback obtained by each
council who polled their electors can be found on the NSWEC’s website
http://www.pastvtr.elections.nsw.gov.au/LGE2012/status/poll.html
Table 31: 2012 Local Government Elections Poll Questions and Results
Council Poll Question Result
Bega Valley
Shire Council
Do you support the retention of the Pambula
District Hospital funded at current total
operational budget levels by NSW State
Government for a period of 5 years, at
approximately $7.5 million pa, from the
completion and official opening of the proposed
new regional hospital, so as to provide the
essential services needed to supplement the new
hospital during this period?
Yes
Burwood
Council
Are you in favour of Burwood Local Government
Area being proclaimed a City to be known as
Burwood City?
Yes
Lismore City
Council
Do you support coal seam gas (CSG) exploration
and production in the Lismore City Council area?
No
Mosman
Municipal
Council
Do you favour the amalgamation of Mosman
Council with any other Council(s) to create a
larger Local Government Authority?
No
Strathfield
Municipal
Council
Do you support Strathfield Municipal Council
changing its name to Strathfield City Council?
Yes
Warrumbungle
Shire Council
The idea of changing the name of the
Warrumbungle Shire Council to that of
Warrumbungle Regional Council has been
discussed on numerous occasions since the
amalgamation of the Coolah Shire Council with
the Coonabarabran Shire Council .This subject
was again raised at the Community Strategic
Planning meetings held in various locations
around the Shire in 2011. Are you in favour of
changing the name of Warrumbungle Shire
Council to Warrumbungle Regional Council?
No
The results of referenda and polls were placed on the NSWEC website.
Feedback from Council General Managers
The key findings from the survey of General Managers were provided in Section 2 in
the discussion about the NSWEC’s performance against its Service Charter.

REPORT ON THE 2012 LOCAL GOVERNMENT ELECTIONS
Part 1
76
Section 6: Electoral Services for Candidates, Groups
and Political Parties
Candidates
There are a number of differences between State and Local Government elections.
Most striking is the number of candidates and registered political parties who
participate.
For the 2012 Local Government Elections nearly 4,000 candidates stood for election
and 31 parties nominated candidates. This figure only reflects the number of
candidates in the elections conducted by the NSWEC. In 2008 Local Government
Elections when all elections were provided by the NSWEC, there were 4,620
candidates. In the 2011 and 2007 State General Elections, a total of 809 and 870
candidates stood for election.xiii
The majority of the candidates for the 2012 Local Government Elections were not
nominated by a registered political party and the level of support and assistance
required from the NSWEC was, as a result, that much higher. Another difference
between State and Local Government elections relates to the role played by
registered political parties. In Local Government elections registered political parties
play no role in the distribution and receipt of postal vote applications as occurs in
State general elections.
Registration of Political Parties
Parties were required to have been registered by 29 July 2011 in order to participate
in the 2012 Local Government Elections.
The political parties registered with the NSWEC as at 30 June 2012 and who were
able to participate in the 2012 Local Government Elections are set out in Appendix J.
Information for Registered Political Parties, Candidates and Groups
Registered Political Parties
Face to face briefings of registered political parties occurred over two sessions on 12
July 2012. Parties were invited on 21 May 2012 to attend and of the 52 invited, 18
parties accepted and 33 representatives. The material covered included legislative
provisions, amendments to electoral procedures, the election timetable, advertising,
website support, electoral rolls, voting, counting of votes, Returning Officer
arrangements, campaigning on election day and complaints.
In addition, ‘progress on election arrangements’ bulletins were distributed on a
regular basis. These covered matters such as enrolment, introduction of ‘enrol and
vote’ option, forms of early voting, council regions, councils running own elections,
Sydney Town Hall State-wide Pre-poll Voting Centre and Polling Place, Returning
Officers’ Offices, Polling Places, Nominations Process, Electoral Material and
Advertising.
REPORT ON THE 2012 LOCAL GOVERNMENT ELECTIONS
Part 1
77
On 25 June 2012 the NSWEC provided a link from its website to polling place data
covering polling place names, addresses, longitude/latitude data and estimated
vote projections, to assist parties plan such things as party worker allocations across
polling places.
Candidate Information Seminars
Throughout May, June and July 2012 the NSWEC conducted 66 information seminars
across NSW for people standing for election. This was twice the number of seminars
provided in 2008. Presentations at these seminars were conducted by
representatives of the NSWEC, the EFA, the Division of Local Government, Premier’s
Department and, in some locations, the council and the Australian Local
Government’s Women’s Association. The latter participated in some 50 seminars.
1,266 people attended the seminars. Appendix K provides details.
The seminars were advertised by the NSWEC in newspapers, local radio and on the
website.
Candidate Information Kit
The NSWEC developed a Candidate Information Kit to assist all candidates,
especially first time candidates, understand the election process and their
obligations. The major forms of assistance in addition to that provided by the
Returning Officer were the NSWEC website, an information kit, information seminars
and a dedicated enquiry line.
Candidate Enquiry and Help Desk
To assist candidates gather accurate and timely information on the 2012 Local
Government Elections, the NSWEC established a Candidate Enquiry and Help Desk
for the exclusive use of candidates.
The Candidate Enquiry and Help Desk was operational from 30 April 2012. The total
number of calls answered from April to September 2012 was 2,876.
The Candidate Enquiry and Help Desk remained open after the elections closing one
week later.
Assistance with New Funding Disclosure Requirements
All Local Government councillors, Members of Parliament, candidates, groups and
parties have obligations under the Election Funding and Disclosures Act 1981.
The NSWEC produced a ‘Funding and Disclosure Guide for Local Government
Candidates, Groups and Official Agents’ for candidates, groups and their official
agents regarding their obligations under the Election Funding and Disclosures Act
1981 and practical information about how to complete and lodge a disclosure form.

REPORT ON THE 2012 LOCAL GOVERNMENT ELECTIONS
Part 1
78
Nominating as a Candidate
Nominations opened on Monday, 30 July, and closed noon on Wednesday, 8 August
2012. Nominations could be lodged either at the Returning Officers’ offices in person
or by facsimile or by email or at the council chambers if the Local Government Area
was within a region. In the latter case, councils forwarded all nominations to the
regional Returning Officer. It was the candidates’ responsibility to obtain a receipt
for lodgement of their nomination.
Candidates including mayoral candidates contesting the 2012 Local Government
Elections numbered 3,939. The number of individuals standing for election was 3,804
of which 135 stood for more than one position. A complete picture requires
availability of candidates in the 14 councils not using the NSWEC to provide their
elections. (Although there are difficulties making comparisons across elections due
to the changed arrangements from 2012, the following is provided for information.
In the 1999 Local Government Elections 4,552 candidates stood and in 2004 4,962
candidates stood for election.xiv Relative to the 2004 Local Government Elections, in
2008 there were fewer candidates for slightly more positions.xv)
In each election, a number of nominations are rejected. In the 2012 Local
Government Elections ten nominations were not accepted. The councils affected
are listed below.
Table 32: 2012 Local Government Elections Rejected nominations
Council Divided Type of Election
Deniliquin Council Undivided Uncontested
Kogarah City Council West Ward Contested
Kogarah City Council West Ward Contested
Leichhardt Municipal Council Wangal/Rozelle-Lilyfield Contested
Murrumbidgee Shire Council East Ward Uncontested
The Hills Central Ward Contested
Uralla Shire Council A Ward Contested
Warrumbungle Shire Council Un-divided Contested
Willoughby City Council West Ward Contested
Willoughby City Council West Ward Contested
Roughly one third (32.8%) of individuals standing as a candidate could be elected to
fill vacant positions.
In the 2004 elections, five councils each had more than 100 candidates.xvi In 2008,
no council had more than 100 candidates although Campbelltown City Council
reached 92. In 2012 this same council was the only council with more than 100
candidates (102). Several outer suburban and one regional council drew a record
number of nominees, including:
Campbelltown City Council (102);
Auburn City Council (87);
Parramatta City Council (75);
Eurobodalla Shire Council (75);
REPORT ON THE 2012 LOCAL GOVERNMENT ELECTIONS
Part 1
79
Ryde City Council (74);
Randwick City Council (70);
Liverpool City Council (70).
Campbelltown City Council with 102 candidates received the largest number of
candidates in either a divided or undivided council. The largest total number of
candidates for a divided council was Auburn City Council with 87 candidates.
The smallest number of candidates in an undivided council was seven candidates at
Deniliquin Council and the smallest for a divided council was two candidates in The
Council of the Shire of Wakool, B Ward and C Ward. The largest number of
candidates in one ward was 47 in Auburn City Council, First Ward.
Candidate for “Popularly Elected” Mayor
In an election for mayor, a candidate had to be enrolled in the council area by
Monday, 30 July, 2012, either as a resident or non-resident elector.
In the Council of the City of Sydney, a candidate for Lord Mayor must also be a
candidate for councillor. If elected as Lord Mayor the person has to accept that
office and could not be elected as a councillor. A person could, if eligible, be a
candidate for mayor in more than one council area where the mayor was popularly
elected, and could be elected as mayor in more than one council area.
Candidates for Councillor Positions
To be eligible for election as a councillor in an area with or without wards, a person
had to be enrolled either on the resident or the non-residential roll in that council
area by Monday, 30 July 2012.
Nomination Process
Nomination forms were available from the Returning Officer, the NSWEC website and
the Candidates’ Enquiry and Help Desk. It was a candidate’s responsibility to ensure
a full and correctly completed nomination was received by the Returning Officer, by
noon Wednesday, 8 August 2012.
The Candidate Information Sheets were published on the NSWEC and council
websites and were available for public inspection in Returning Officers’ offices from
noon on nomination day, at the pre-poll voting centre during early voting and at
polling places on election day. The Candidate Information Sheets were displayed as
provided to the Returning Officer (only material considered inappropriate could be
edited). Nominations were rejected if the appropriate deposit in total had not been
received by the close of nominations.
The total of candidate nomination deposits was $0.476 million of which $0.415 million
(87.2%) was refunded to candidates. The number of refunds made was 1,783. Any
nomination deposit not refunded was forfeited to the relevant council. In 2008, the
total of candidate deposits was $0.563 million of which $0.482 million (85.6%) was
refunded to candidates. The number of refunds was 2,309.

REPORT ON THE 2012 LOCAL GOVERNMENT ELECTIONS
Part 1
80
Candidates could withdraw their nomination by providing a signed notice to the
Returning Officer before the close of nominations. 14 candidates withdrew their
nominations. The nominations of 10 candidates were rejected with the major reason
being that either the candidate or nominator was not enrolled as required.
Draw for Position on Ballot Paper
Closure of nominations was followed on Wednesday, 8 August 2012, by the draw for
position of candidates and groups (where applicable) on the ballot papers. The
official draw took place at Returning Officers’ or Regional Returning Officers’ offices.
Provision of the List of Electors to Candidates
Candidates, upon application to the Returning Officer, were entitled to receive a
copy of the list of electors for the council area or ward being contested. The NSWEC
made the list of electors available to candidates beginning Monday, 13 August 2012,
with the last one being collected on Wednesday, 4 September 2012. A total of 682
candidates requested lists.
Candidates were only entitled to use the list of electors in connection with their
candidacy for this election, and for monitoring the accuracy of information
contained on the list of electors. The NSWEC advised all candidates that there are
significant penalties for candidates using the electoral roll for purposes other than
those above.
Assistance with Registration and Distribution of Electoral Material
In the report of the 2008 Inquiry, the Parliamentary Standing Committee
recommended (Rec 13) “The Electoral Commissioner examine multi-council how-to-
vote cards for multi-council polling places, with a view to allowing multi-council how-
to-vote cards.” In response, the Electoral Commissioner did decide to register a two
sided ‘how to vote’ material based on a ‘common sense’ approach to interpreting
the legislation, namely, by treating each side of the guide as a separate ‘how to
vote’.
Registration however of multi-council ‘how to vote’ guides depended on each set of
facts. For instance, had the voting directions for 2 councils been on the same side of
the card or could not otherwise be clearly distinguished, it would likely be “non-
complying” and not able to be registered by virtue of cl.356Q(3)(a).
Applications and electoral material (including how-to-vote cards) for registration
could be lodged from noon Wednesday, 8 August 2012, until 5pm Friday, 31 August
2012.
Scrutineers
Candidates were advised of the procedure for appointing scrutineers locally, via the
website and the handbooks provided upon nomination.
REPORT ON THE 2012 LOCAL GOVERNMENT ELECTIONS
Part 1
81
Complaints and Allegations concerning Electoral Offences
The electoral legislation provides for a number of criminal offences to ensure the
integrity of State and Local Government elections. We have, however, a limited role
in prosecuting these offences, except where the legislation provides that the
Electoral Commissioner has a duty to take action in relation to a particular offence.
For instance, the Electoral Commissioner has a duty to serve penalty notices on
electors for failure to vote offences.
Offences by candidates, groups and parties
We do not have an investigatory or prosecutorial role regarding offences by
candidates, groups or parties. This is because it is essential that we maintain
community and stakeholder confidence in our impartiality. The Electoral
Commissioner must discharge his or her duties in an impartial way and there must be
no reasonable apprehension of bias, for example, if the Electoral Commissioner was
required to make an administrative decision in relation to an election while at the
same time undertaking the prosecution of one or more candidates for offences.
If we have evidence, or are provided with evidence, that a person has committed
an offence, the Electoral Commissioner may write to the person seeking an
explanation of the breach and, if possible, directing them to remedy the breach.
Depending on the explanation provided, the matter may then be referred to the
relevant law enforcement agency for further action and investigation.
It is also open to any person to approach the NSW Police Force directly to report an
alleged electoral offence.
Eligibility of candidates
Similarly, the NSWEC has no investigative powers to determine the truth or otherwise
of allegations that may affect the nomination of a candidate or their election. The
courts have found that it is not the responsibility of the NSWEC to determine issues of
eligibility for election. It is a matter for those seeking to impugn the validity of a
nomination or an election of a person to civic office to raise the issue for
determination by a court or tribunal.
Feedback from Candidates and Registered Political Parties
The key findings from the survey of candidates and political parties were provided in
Section 2 in the discussion about the NSWEC’s performance against its Service
Charter. An additional survey undertaken later in 2012 by the Election Funding
Authority specifically on the seminars to all councils to provide information on
funding and disclosure rights and obligations found:
75% of those candidates who could not attend seminars for which they had
registered to attend, reported that this was due to work commitments;
87.6% thought the material provided at the seminar was relevant to their role;
88.7% felt that the seminar covered the latest changes to the legislation; and
92.2% felt that attendance at the seminar was beneficial.
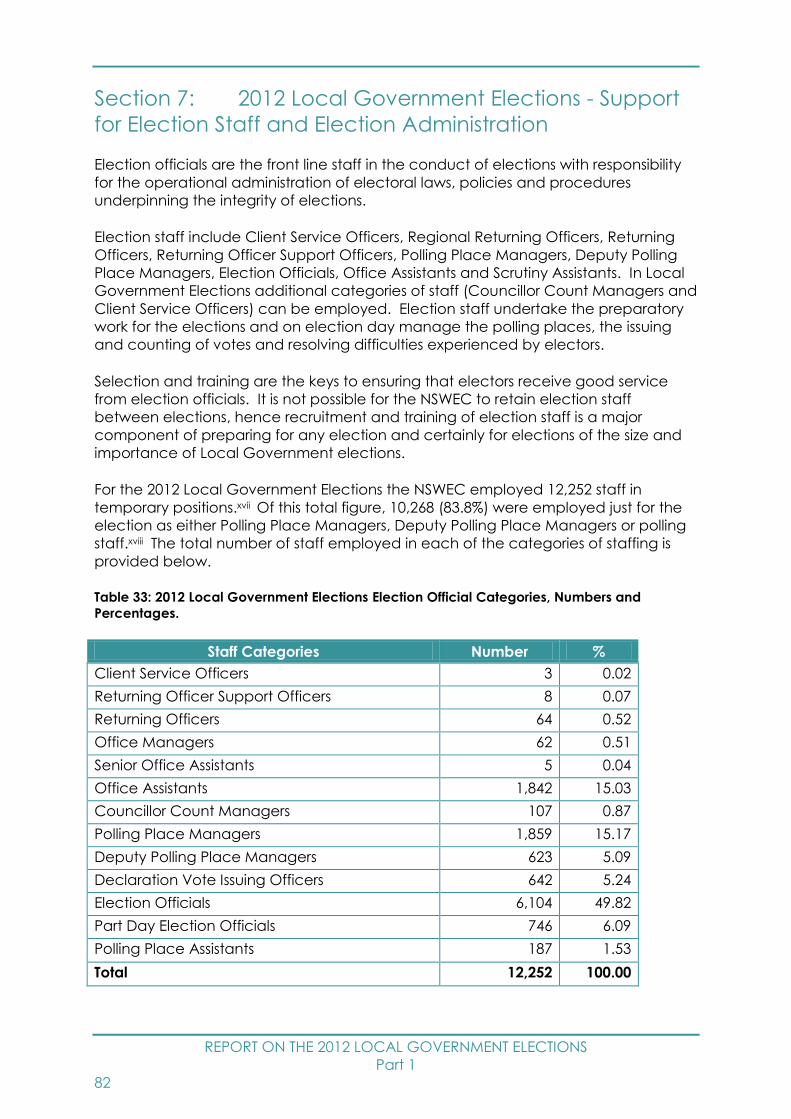
REPORT ON THE 2012 LOCAL GOVERNMENT ELECTIONS
Part 1
82
Section 7: 2012 Local Government Elections - Support
for Election Staff and Election Administration
Election officials are the front line staff in the conduct of elections with responsibility
for the operational administration of electoral laws, policies and procedures
underpinning the integrity of elections.
Election staff include Client Service Officers, Regional Returning Officers, Returning
Officers, Returning Officer Support Officers, Polling Place Managers, Deputy Polling
Place Managers, Election Officials, Office Assistants and Scrutiny Assistants. In Local
Government Elections additional categories of staff (Councillor Count Managers and
Client Service Officers) can be employed. Election staff undertake the preparatory
work for the elections and on election day manage the polling places, the issuing
and counting of votes and resolving difficulties experienced by electors.
Selection and training are the keys to ensuring that electors receive good service
from election officials. It is not possible for the NSWEC to retain election staff
between elections, hence recruitment and training of election staff is a major
component of preparing for any election and certainly for elections of the size and
importance of Local Government elections.
For the 2012 Local Government Elections the NSWEC employed 12,252 staff in
temporary positions.xvii Of this total figure, 10,268 (83.8%) were employed just for the
election as either Polling Place Managers, Deputy Polling Place Managers or polling
staff.xviii The total number of staff employed in each of the categories of staffing is
provided below.
Table 33: 2012 Local Government Elections Election Official Categories, Numbers and
Percentages.
Staff Categories Number %
Client Service Officers 3 0.02
Returning Officer Support Officers 8 0.07
Returning Officers 64 0.52
Office Managers 62 0.51
Senior Office Assistants 5 0.04
Office Assistants 1,842 15.03
Councillor Count Managers 107 0.87
Polling Place Managers 1,859 15.17
Deputy Polling Place Managers 623 5.09
Declaration Vote Issuing Officers 642 5.24
Election Officials 6,104 49.82
Part Day Election Officials 746 6.09
Polling Place Assistants 187 1.53
Total 12,252 100.00

REPORT ON THE 2012 LOCAL GOVERNMENT ELECTIONS
Part 1
83
Recruitment of Election Staff
The NSWEC, over recent election events, has sought to maintain a pool of people
who have demonstrated competency in electoral administration and a capacity to
adopt new electoral practices.
To protect the integrity of the elections and ensure separation of the conduct of the
election from those who may be seen to have an interest in the outcomes, the
Regional Returning Officer or Returning Officer could not be an employee of the
council for whom the election was being conducted. Other election officials, such
as office assistants, polling place managers and polling place staff, could be
employees of the council (provided they were on the residential electoral roll).
Recruitment processes vary between different categories of election staff.
Recruitment of election staff commenced with the Returning Officer Support Officers
and Returning Officers.
Recruitment of Returning Officer Support Officers and Returning Officers
The NSWEC has a pool of people who have been interviewed for senior election
official positions. This pool is supplemented by advertising and interviewing eligible
personnel prior to each general election to ensure sufficient geographic coverage
of Returning Officer and Office Manager positions across NSW. The recruitment
process includes a written application, face to face interview and computer skills test
prior to employment.
From this pool, Returning Officer Support Officers, Regional Returning Officers,
Returning Officers and Office Managers are selected to work at the election.
Following the election, the Returning Officer Support Officers, Returning Officers and
Office Managers undergo a performance assessment which enables informed
decision making for future training requirements and senior election official
recruitment for future elections.
Recruitment of Office Assistants and Polling Place Officials
Regional Returning Officers/Returning Officers are responsible for undertaking the
recruitment of their office staff and polling place officials. The central office of the
NSWEC provided the systems and processes to undertake recruitment.
The recruitment of office assistants and polling place staff was conducted by
contacting, through SMS or email, staff who had worked at previous elections to
encourage them to register for work through the Expression of Interest link on the
NSWEC website. In addition, an advertising and awareness campaign was
implemented through website, radio and newspaper advertisements. Applications
for employment commenced via online registration on 15 May 2012.
The Returning Officers used the Expression of Interest website to select staff for their
offices and to staff their polling places with recruitment commencing on 16 July 2013.
The criteria that applicants were required to meet were provided in the Expression of
Interest documentation. For a Polling Place Manager for example, the following
criteria had to be addressed by the applicant:
REPORT ON THE 2012 LOCAL GOVERNMENT ELECTIONS
Part 1
84
1. Customer service and communication skills (the ability to understand and convey
information in a clear, accurate and respectful manner to people of diverse
backgrounds);
2. Ability to work in a team environment (the ability to take or give direction, and
work co-operatively towards a common goal and deadline);
3. Accuracy in the completion of administrative and numerical tasks within a time
constraint (the ability in administrative, clerical and numerical roles where accuracy
and timely completion is important); and
4. Supervisory and time management experience (the ability to bring people and
tasks together to successfully complete work).
Once potential applicants were selected, the Returning Officer contacted them
and, for key positions such as Polling Place Manager, undertook interviews to
determine suitability. If successful, a letter of offer was emailed and following formal
acceptance, training materials and login to the online training facility was provided.
The turnaround time from offer to recruitment varied. All Returning Officers, including
Regional Returning Officers, were instructed to commence recruitment of Returning
Officers’ office and polling place staff from 16 July and finalise employment of staff
polling place staff by 3 August 2012.
A face to face debriefing of Returning Officers was undertaken post election.
Feedback from these sessions raised a number of opportunities for the NSWEC to
enhance the computer ‘Expression of Interest and Staffing’ system to make
recruitment of election officials more efficient.
In areas with significant culturally and linguistically diverse communities the NSWEC
sought to increase its employment of election officials with a second language. In
the 2012 Local Government Elections a total of 3,057 languages were spoken by
election officials. The full range of languages spoken by election officials and office
assistants is provided at Appendix L.
Determination of Staff Numbers
The projected ordinary votes to be taken at each polling place are used as the basis
for staffing projections with additional factors taken into account. These include:
analysis of staffing used at previous elections and subsequent performance
outcomes including complaints received regarding excessive queue times, timing
of results phoned through to the Returning Officer’s office;
results of feedback surveys from election officials about their experiences working
at the polling place, and the performance assessment of polling place
managers;
demographic changes since the last election;
deletion or addition of neighbouring polling places since the previous election;
location of the venue, for example, is it in a remote part of NSW?;
presence of higher than average numbers of electors from culturally and
linguistically diverse communities and/ or Aboriginal and Torres Strait Islander
communities; and

REPORT ON THE 2012 LOCAL GOVERNMENT ELECTIONS
Part 1
85
time and motion studies conducted by NSWEC, for example, to determine length
of time to process a declaration vote.
These variables are factored into a model which calculates the optimal number of
election staff per venue for each staffing category (Polling Place Manager,
Declaration Vote Issuing Officer, Polling Place Assistants) to assist with the vote count
post close of polls at 6pm election day.
Table 34: 2012 Local Government Elections - Determination of Staff Numbers in Polling Places.
Culturally
Linguistically
Diverse Area
Metropolitan Country-
Metropolitan Country
Ordinary Max Ordinary Max Ordinary Max Ordinary Max
Ordinary
Table
Loading
450 500 550 600 600 650 600 650
Declaration
Table
Loading
80 90 100 120 120 120 120 120
The above table sets out the loadings provided for issuing ordinary and declaration
votes per council area and the additional allowances made for characteristics such
as high percentage of electors with non-English speaking backgrounds and council
remoteness. These formulas were amended following consultation with the Returning
Officer and council to take into account for example, events that may be occurring
at the local level which impact upon the turnout of electors or changes in numbers
of polling places.
Not every polling place had every category of staff present on polling day
depending upon the number of tables for issuing ordinary and declaration votes.
Election Officials were employed for part of election day at polling places on the
basis of:
1 part day election official per polling place with 5 to 6 Ordinary Vote Issuing
Officers;
2 part day election officials per polling place with 7 or more Ordinary Issuing Vote
Officers; and
plus an additional officer where the maximum table loading (10+) is exceeded.
Council Count Managers were added to a polling place where there were more
than two contests per Local Government area and three Ordinary Issuing Officers.
Additional information officers were added to a limited number of polling places
which bordered another council area or had previously been used as a multi council
polling place particularly for a council administering their elections. In these polling
places it was felt that additional staff were necessary to assist electors who needed
explanation as to why they could not vote at that polling place.
REPORT ON THE 2012 LOCAL GOVERNMENT ELECTIONS
Part 1
86
Polling Place Assistants were added to a venue, where there were multiple contests
and the count loading per election official exceeded 750.
All polling places must have a minimum of two staff, one of whom is the Polling Place
Manager. The polling place staffing formula is based on 600 votes per issuing table
while the projected number of votes determines the number of issuing tables. The
number of tables in turn determines the level (salary) of the Polling Place Manager
and the number of issuing tables per polling place determines whether that polling
place requires a Deputy Polling Place Manager, a ballot box guard and/or enquiry
officer.
Returning Officer Support Officers
The Returning Officer Support Officers were drawn from a pool of NSWEC permanent
staff and former Returning Officers. Eight election officials provided support and
guidance to Returning Officers throughout the election period in implementation of
policies and procedures.
During the course of the election three Returning Officer Support Officers were
replaced due to ill health and personal circumstances. As a result, support for their
respective Returning Officer was allocated across the remaining Returning Officer
Support Officers. While increasing the workload of the remaining five Returning
Officer Support Officers, this was tempered by the establishment of a new Results
Team (separate from the Returning Officer Support Officers) to deal with Returning
Officer enquiries that related to the processing of Mayoral and Councillor results. This
alleviated the Returning Officer Support Officers and freed them to focus on
supporting the Returning Officers to conducting staff assessments and administration
relating to the preparation for shut down of the Regional/Returning Officers’ offices.
Planning for future elections, where possible, will have a trained pool of reserve
Returning Officer Support Officers to reduce the risk of a reduction in Returning
Officer Support Officers due to unforeseen circumstances.
Returning Officers
For the 2012 elections, 64 Returning Officer positions were filled, along with 62 Office
Manager positions and five Senior Office Assistants, to manage and run the 29 stand
alone Returning Officer offices and the 35 Regional Returning Officer offices. Part-
time employment commenced 18 June 2012 with full-time hours commencing 16
July 2012.
The Regional Returning Officer structure reduced the number of Returning Officers
required and enabled all Returning Officers to be full-time and for full services to be
provided to all councils.
Training of Election Staff
Upon acceptance of an offer of employment the applicant was required to
undertake training as preparation for election day duties.

REPORT ON THE 2012 LOCAL GOVERNMENT ELECTIONS
Part 1
87
The main purpose of training is to maintain and improve the quality of services
delivered to electors, candidates and political parties and to ensure that the
election is conducted impartially and accurately.
Training was provided by the NSWEC either centrally in the case of Returning Officers
Support Officers and Regional/Returning Officers or locally for Polling Place
Managers and other election day staff. Returning Officers were responsible for the
training of Polling Place Managers. Polling Place Managers were responsible for the
training of election day staff.
All Returning Officers received four days of training covering key elements of their
role including all processes in leading up to election day through to the close of
office. Training for groups of Returning Officers occurred over May to June 2012.
Returning Officer Support Officers received one day specific training on their role in
addition to the Returning Officer training programme. Office Managers, due to the
role they play in Returning Officers’ offices, attended two days of Returning Officer
training and were provided further training by the Returning Officer on site.
Returning Officers and Polling Place Managers were trained in the counting process,
the use of relevant software and the procedures to be followed when ballot papers
were forwarded to the NSWEC Local Government Counting Centre in Sydney.
Following are the training components for each category of election staff:
Returning Officer Support Officer Training Programme
1. Returning Officer Support Officers’ role and tools for Supporting Returning
Officers
2. Council Service Officers and their role in liaison with councils
3. Returning Officer Office Set-up
4. Returning Officer and Office Manager relationship
5. Managing Office Assistants
6. Budget
7. Nominations, Ballot Paper Draws
8. Media and Advertising
9. Scrutiny of Declaration Envelopes
10. Polling Places and Pre-poll
11. Polling Place Managers’ Training and Return of Materials by Polling Place
Managers
12. Logistics Presentation
13. Ballot Paper Proofing and Reconciliation
14. Election Management Application Computer dress rehearsals and testing
15. Decommissioning the Returning Officer’s Office
Returning Officer and Office Manager Face to Face Training Content:
1. Returning Officer Role and Management (Council Liaison, Deliveries & Office
Set Up, Media, Advertising, Voter excusing, Finance)
2. Staffing (recruitment, offering positions, employing staff, staff training and
payroll)
REPORT ON THE 2012 LOCAL GOVERNMENT ELECTIONS
Part 1
88
3. Polling Places (types of polling places, contacting venue owners ,packing
materials, dealing with scrutineers)
4. Candidates (enquiries, management, electoral roll, taking nominations, ballot
paper draw, ballot paper proofing, ballot paper allocation)
5. Electoral Material (lodgement, receipt and checking)
6. Early Voting (set up pre-poll, Declared Institutions and types of votes, postal
voting)
7. Scrutiny of declaration envelopes
8. How to conduct Polling Place Manager training
9. Return of Materials on election day from polling places
10. Election night results process
11. Counting votes
12. Post election activities
13. Staff timesheets, performance assessments, decommissioning of Returning
Officer’s office
The Returning Officer and Office Manager online training had to be completed
before face to face training. Returning Officer online training covered all the above
topics and introduced areas to be covered in the face to face training.
Polling Place Manager and Deputy Polling Place Manager Training:
The online training included content and examples followed by a quiz to test
understanding. Face to face training reinforced the online learning and provided
hands on practice of vote sorting, counting, declaration vote processing. There
were three main sections:
Polling Place Overview:
1. Election Overview
2. Council Profiles
3. Position Responsibilities
4. Checklists
Election Day:
1. Account of Ballot Papers
2. Dealing with Party Workers and Scrutineers
3. Vote Types and Determining Vote Types and issuing of votes
Election Night:
1. Reconciliation of Ballot Papers
2. Formality, Sort Rules and Counting Votes
3. Completing Results Sheets
4. Phoning Results to Returning Officers
Declaration Vote Issuing Officer Online Training:
This focused on the different vote types, determining vote type and issuing of
declaration votes.

REPORT ON THE 2012 LOCAL GOVERNMENT ELECTIONS
Part 1
89
Operational Support of Election Staff
Handbooks, Manuals and Resources
Following training, election staff were supported in the undertaking of their duties by
handbooks and manuals. In addition, Returning Officers received regular online
bulletins and information sheets plus face-to-face and phone contact from the
Returning Officer Support Officers. An intranet was set up for the use of Returning
Officers providing links to key information and electronic processes such as
nominations and groupings. All Returning Officers had access to phone support for
the use of the software for conducting a local count and the correct set up and
management of a local counting centre.
Manuals and handbooks were also produced for polling place staff, candidates,
parties and scrutineers.
Community education resources were also provided to field staff. The NSWEC’s
Community Education Officer visited each Returning Officer in the 15 high culturally
and linguistically populated areas to provide briefings on cultural awareness and
resources available to assist electors. Materials were provided also to Returning
Officers and election officials to assist them provide services to electors, particularly
electors from communities with a lower rate of engagement or more difficulties
engaging in elections. These materials are detailed below.
Table 35: 2012 Local Government Elections Materials to Returning Officers and Election
Officials
Material Content Distribution NSWEC
Intranet
Equal Access to
Democracy –
Returning Officer
Training Handout
Provides details of high CALD
and high ATSI areas, the
information resources
available to assist Returning
Officers in these areas and
some cultural and disability
awareness information
150 for Returning
Officer training
Returning
Officer
intranet
Put Yourself in their
Shoes – Cultural
and Disability
Awareness
A one page awareness
document
In all Polling Place
Manager and
Election Official
manuals and Equal
Access to
Democracy
handout for
Returning Officers
Returning
Officer
intranet
Document: High
CALD/ATSI Local
Government
Areas
Shows all client councils with
high CALD/high ATSI
Returning Officer
homepage
Returning
Officer
intranet
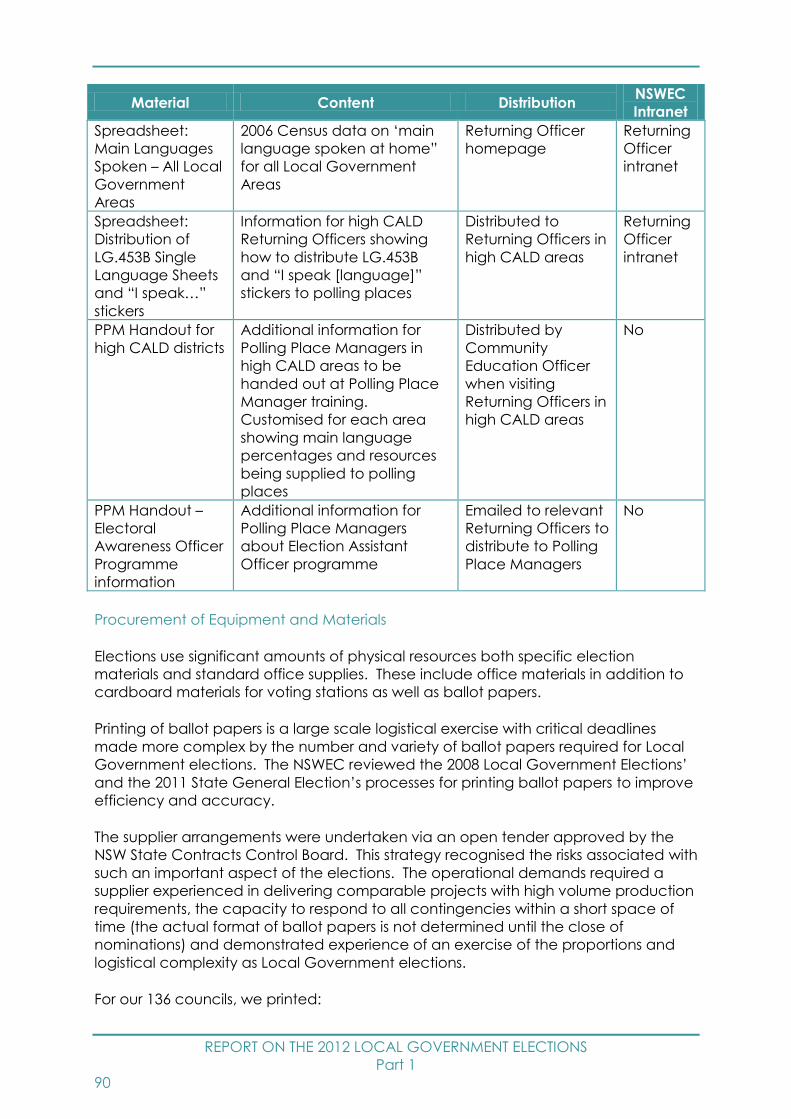
REPORT ON THE 2012 LOCAL GOVERNMENT ELECTIONS
Part 1
90
Material Content Distribution NSWEC
Intranet
Spreadsheet:
Main Languages
Spoken – All Local
Government
Areas
2006 Census data on ‘main
language spoken at home”
for all Local Government
Areas
Returning Officer
homepage
Returning
Officer
intranet
Spreadsheet:
Distribution of
LG.453B Single
Language Sheets
and “I speak…”
stickers
Information for high CALD
Returning Officers showing
how to distribute LG.453B
and “I speak [language]”
stickers to polling places
Distributed to
Returning Officers in
high CALD areas
Returning
Officer
intranet
PPM Handout for
high CALD districts
Additional information for
Polling Place Managers in
high CALD areas to be
handed out at Polling Place
Manager training.
Customised for each area
showing main language
percentages and resources
being supplied to polling
places
Distributed by
Community
Education Officer
when visiting
Returning Officers in
high CALD areas
No
PPM Handout –
Electoral
Awareness Officer
Programme
information
Additional information for
Polling Place Managers
about Election Assistant
Officer programme
Emailed to relevant
Returning Officers to
distribute to Polling
Place Managers
No
Procurement of Equipment and Materials
Elections use significant amounts of physical resources both specific election
materials and standard office supplies. These include office materials in addition to
cardboard materials for voting stations as well as ballot papers.
Printing of ballot papers is a large scale logistical exercise with critical deadlines
made more complex by the number and variety of ballot papers required for Local
Government elections. The NSWEC reviewed the 2008 Local Government Elections’
and the 2011 State General Election’s processes for printing ballot papers to improve
efficiency and accuracy.
The supplier arrangements were undertaken via an open tender approved by the
NSW State Contracts Control Board. This strategy recognised the risks associated with
such an important aspect of the elections. The operational demands required a
supplier experienced in delivering comparable projects with high volume production
requirements, the capacity to respond to all contingencies within a short space of
time (the actual format of ballot papers is not determined until the close of
nominations) and demonstrated experience of an exercise of the proportions and
logistical complexity as Local Government elections.
For our 136 councils, we printed:
REPORT ON THE 2012 LOCAL GOVERNMENT ELECTIONS
Part 1
91
1.32 million mayoral ballot papers for the 26 mayoral elections conducted;
4.67 million councillor ballot papers for the 224 councillor elections conducted;
0.16 million poll ballot papers for six polls conducted; and
0.46 million referendum ballot papers for eight referenda conducted.
In total this was 6.6 million ballot papers servicing 264 elections, polls and referenda.
Returning Officers’ offices (including regional Returning Officers’ offices) received
ballot papers required for their elections in one delivery.
The equipment and material required by field election staff included:
Office furniture for Returning Officers and staff;
Polling place materials;
Cardboard voting materials;
Election forms – manuals, forms, signage, envelopes;
Vote counting requirements;
Computer and communications equipment; and
Certified lists of electors resident in the council or wards.
The requirements for physical resources were calculated using data on:
Number of wards;
Number of electors;
Number of elections (councillor, mayor, referenda and polls);
Voting centres – Returning Officer’s office, Pre-poll, Declared Institutions, Polling
Places, Mobile Polling Centres if applicable;
Projected votes; and
Staffing levels.
Where councils used a Regional Returning Officer there were less office and material
requirements across the councils involved.
The NSWEC distributed 761,498 items to polling places and Returning Officers’ offices
(excluding copies of electoral rolls, ballot papers and iRolls) from 25 June to 6 July
2012. Purchasing of supplies sought out products using recycled products including,
for example, plastic wrap, toners, cardboard, paper and plastic in-trays. Products in
good condition were put aside for re-use in future elections. Products that cannot
be re-used and that are recyclable were recycled.
The NSWEC’s carbon footprint was halved through changes to the supply chain
model. Small cardboard packs containing all the cardboard polling equipment for
staff of a small polling place (one that took less than 1,500 votes) were designed to fit
into the back of a small car. Polling Place Managers collected the packs, as well as
other polling material during their face-to-face training. Previously a courier would
deliver the cardboard packs directly to the polling venue. This initiative meant that
courier deliveries were not required to approximately 1,000 polling places or 50% of
the State.
Telecommunications and Computer Support Services
The NSWEC provided telecommunications hardware and software systems and
information communications technology support services to all Returning Officers’

REPORT ON THE 2012 LOCAL GOVERNMENT ELECTIONS
Part 1
92
offices. Between 26 June and 13 July 2012, nearly 5,100 hardware items were
distributed and installed in Returning Officers’ offices, including desktop computers,
telephones, laptops, mobile phones, scanners and printers. The NSWEC undertook
further developments to the software ‘Election Management Application’ for the
2012 Local Government Elections. Training and user manuals to assist users of each
new module were prepared.
Returning Officers were provided with a telephone help desk to assist with any
technical or count related issues.
Web Based Payroll
The Commission altered its approach to the processing of payroll and
superannuation transactions. Instead of engaging an outsourced payroll processing
company, as in the last state wide election, these activities were undertaken in–
house using a licenced payroll software product and contract staff. The software
system was linked to the recruitment module of our Election Management
Application. The removal of multiple handling of forms, superannuation data and
enquiries produced significant savings. The cost of processing reduced 16.6% from
$28.03 to $23.37 per employee.
Supplier Arrangements
NSW Treasury Policy mandates the payment of interest to suppliers in certain
circumstances where supplier invoices are paid late. Additional weekly payment runs
were made and the Commission utilised electronic means of transmission wherever
possible. During the course of the 2012 Local Government Elections there were no
invoices paid late so as to attract the penalty of an interest payment. The average
number of days between invoice receipt and payment was seven days.
Collection of Materials Post Election
Polling Place Managers returned all voting materials to the Returning Officer on
election night. The collection of equipment, furniture and materials was followed.
Cardboard equipment (ballot boxes and voting screens) used within Returning
Officers’ offices, additional pre-poll locations and polling places were either set aside
for re-use or recycled.
Due to the legislative provisions applying to used and unused ballot papers and
other material such as certified lists, these materials were returned to the NSWEC for
security destruction. Destruction cannot occur before six months has passed since
the declaration of the results. At the time of finalising this report, destruction had not
occurred but estimates indicate the quantum of materials to be destroyed will be in
the order of 20% less than in 2008. Approximately 125 pallets of ballot papers
(around 100 tonnes) were pulped for recycling from the 2008 elections. Destruction is
planned to commence in March 2013.
Workplace Safety
The NSWEC manages the risk of injury to the large numbers of elections officials
through training, careful selection of polling places and provision of equipment and
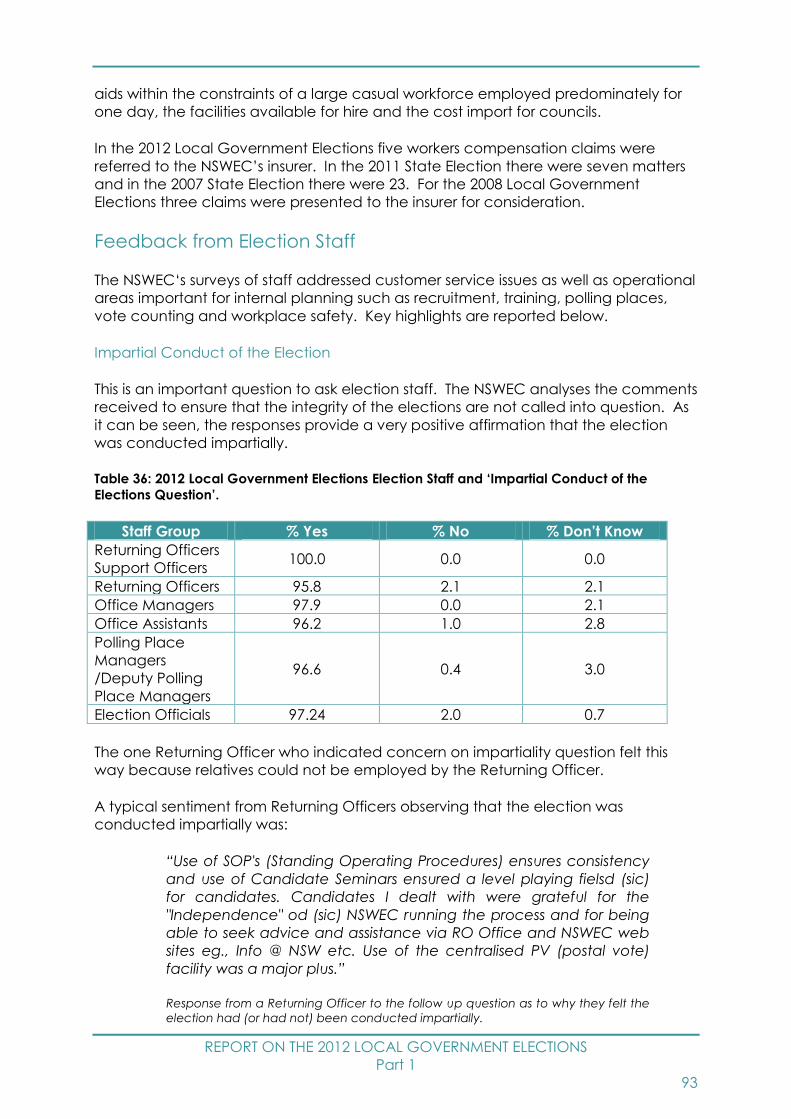
REPORT ON THE 2012 LOCAL GOVERNMENT ELECTIONS
Part 1
93
aids within the constraints of a large casual workforce employed predominately for
one day, the facilities available for hire and the cost import for councils.
In the 2012 Local Government Elections five workers compensation claims were
referred to the NSWEC’s insurer. In the 2011 State Election there were seven matters
and in the 2007 State Election there were 23. For the 2008 Local Government
Elections three claims were presented to the insurer for consideration.
Feedback from Election Staff
The NSWEC‘s surveys of staff addressed customer service issues as well as operational
areas important for internal planning such as recruitment, training, polling places,
vote counting and workplace safety. Key highlights are reported below.
Impartial Conduct of the Election
This is an important question to ask election staff. The NSWEC analyses the comments
received to ensure that the integrity of the elections are not called into question. As
it can be seen, the responses provide a very positive affirmation that the election
was conducted impartially.
Table 36: 2012 Local Government Elections Election Staff and ‘Impartial Conduct of the
Elections Question’.
Staff Group % Yes % No % Don’t Know
Returning Officers
Support Officers 100.0 0.0 0.0
Returning Officers 95.8 2.1 2.1
Office Managers 97.9 0.0 2.1
Office Assistants 96.2 1.0 2.8
Polling Place
Managers
/Deputy Polling
Place Managers
96.6 0.4 3.0
Election Officials 97.24 2.0 0.7
The one Returning Officer who indicated concern on impartiality question felt this
way because relatives could not be employed by the Returning Officer.
A typical sentiment from Returning Officers observing that the election was
conducted impartially was:
“Use of SOP's (Standing Operating Procedures) ensures consistency
and use of Candidate Seminars ensured a level playing fielsd (sic)
for candidates. Candidates I dealt with were grateful for the
"Independence" od (sic) NSWEC running the process and for being
able to seek advice and assistance via RO Office and NSWEC web
sites eg., Info @ NSW etc. Use of the centralised PV (postal vote)
facility was a major plus.”
Response from a Returning Officer to the follow up question as to why they felt the
election had (or had not) been conducted impartially.
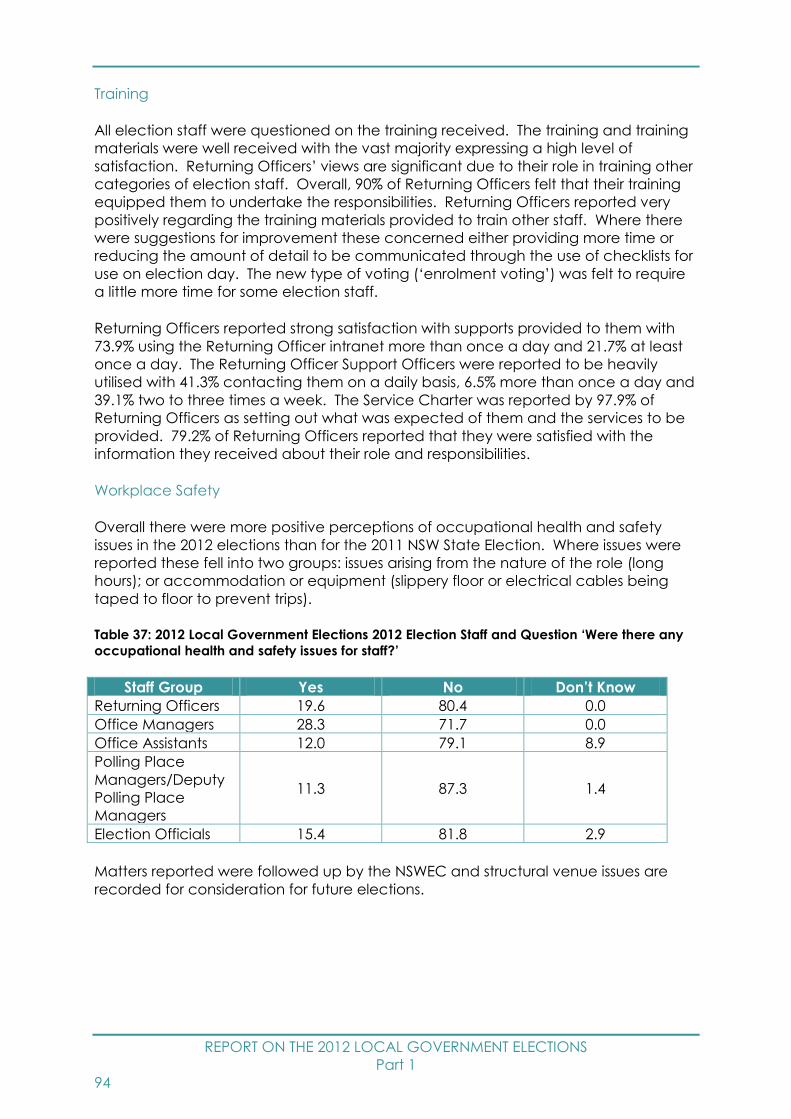
REPORT ON THE 2012 LOCAL GOVERNMENT ELECTIONS
Part 1
94
Training
All election staff were questioned on the training received. The training and training
materials were well received with the vast majority expressing a high level of
satisfaction. Returning Officers’ views are significant due to their role in training other
categories of election staff. Overall, 90% of Returning Officers felt that their training
equipped them to undertake the responsibilities. Returning Officers reported very
positively regarding the training materials provided to train other staff. Where there
were suggestions for improvement these concerned either providing more time or
reducing the amount of detail to be communicated through the use of checklists for
use on election day. The new type of voting (‘enrolment voting’) was felt to require
a little more time for some election staff.
Returning Officers reported strong satisfaction with supports provided to them with
73.9% using the Returning Officer intranet more than once a day and 21.7% at least
once a day. The Returning Officer Support Officers were reported to be heavily
utilised with 41.3% contacting them on a daily basis, 6.5% more than once a day and
39.1% two to three times a week. The Service Charter was reported by 97.9% of
Returning Officers as setting out what was expected of them and the services to be
provided. 79.2% of Returning Officers reported that they were satisfied with the
information they received about their role and responsibilities.
Workplace Safety
Overall there were more positive perceptions of occupational health and safety
issues in the 2012 elections than for the 2011 NSW State Election. Where issues were
reported these fell into two groups: issues arising from the nature of the role (long
hours); or accommodation or equipment (slippery floor or electrical cables being
taped to floor to prevent trips).
Table 37: 2012 Local Government Elections 2012 Election Staff and Question ‘Were there any
occupational health and safety issues for staff?’
Staff Group Yes No Don’t Know
Returning Officers 19.6 80.4 0.0
Office Managers 28.3 71.7 0.0
Office Assistants 12.0 79.1 8.9
Polling Place
Managers/Deputy
Polling Place
Managers
11.3 87.3 1.4
Election Officials 15.4 81.8 2.9
Matters reported were followed up by the NSWEC and structural venue issues are
recorded for consideration for future elections.
REPORT ON THE 2012 LOCAL GOVERNMENT ELECTIONS
Part 1
95
Section 8: Terms of Reference Inquiry into the Conduct
of the 2012 Local Government Elections
This section focuses on those Terms of Reference that are not covered in other parts
of the NSWEC’s report. Specifically, Terms of Reference (b) ‘the experience of
councils that conducted their own elections’; and (e) ‘the impact of requirements
under the Election Funding, Expenditure and Disclosures Act 1981 on participation by
candidates in Local Government elections and possible legislative changes to
remove any barriers to participation’.
Terms of Reference (b) ‘the experience of councils that
conducted their own elections’
From the perspective of the NSWEC, the experience of councils conducting their
elections varied. Some councils were observed to have a greater capability to
undertake their own elections. Others had a more difficult time with one council,
Narrabri Shire Council, receiving special provision after the timeframe set for
decision, to cease to undertake their elections and instead have the NSWEC
conduct them. Another council, Cessnock City Council also sought to change their
arrangements and have the NSWEC conduct their elections but was unable to do so
due to the legislative arrangements and the lateness of the timeframe.
The provision of electoral rolls was a source of tension between some councils and
the NSWEC. These councils sought a soft copy of the entire NSW roll instead of rolls
specifically for the council area. An entire soft copy of the NSW roll could not be
provided. Without ‘absent voting’ it is difficult to see how the provision of this scope
of information about individual electors across NSW was warranted. Even so, the
Enrolment Branch within the NSWEC provided as much assistance as it could by
providing telephone support and information. The NSWEC provided rolls specific to
the council area.
Criticisms have been made that the NSWEC was unhelpful to councils administering
their electionsxix by, for example, preventing access to its Candidate Information
Sessions, Returning Officer training, Candidate Help Desk, tender arrangements for
cardboard supplies (ballot boxes, voting screens), counting software and other
services. As advised by the Division of Local Government, NSW Department of
Premier and Cabinet, these decisions were made because the content was
customised to the NSWEC’s own business processes, procedures and IT systems.xx To
provide information to candidates or staff involved in elections for councils
administering their elections was opening up the risk of confusion, potential problems
and even failure for these elections as well as muddying the legal responsibilities of
the NSWEC and the council concerned. The decision to implement this risk
mitigation strategy was discussed and endorsed by the NSWEC’s Audit and Risk
Committee and advised to the NSW Government.
REPORT ON THE 2012 LOCAL GOVERNMENT ELECTIONS
Part 1
96
Terms of Reference (e) ‘the impact of requirements under the
Election Funding, Expenditure and Disclosures Act 1981 on
participation by candidates in Local Government elections and
possible legislative changes to remove any barriers to
participation’
There is no clear evidence that the obligations placed on candidates and groups at
the 2012 Local Government Elections imposed insurmountable barriers to
participation. In many instances, the reaction to the legislated obligations was more
of resistance to the imposition of the obligations rather than a genuine “barrier to
participation”. This attitude seemed to be more prevalent in council areas outside
the Sydney metropolitan area and particularly in council areas in the western parts
of the State.
It is acknowledged, however, that some of the requirements of the legislation did
present challenges for intending candidates and groups. These challenges included:
The requirement for registration of a candidate in addition to the requirement for
the registration of a group. This is seen by many as doubling registration and
doubling the compliance impost.
The appointment of a person, other than themselves, as official agent for a
candidate as difficulties are experienced in locating a person prepared to
undertake the role and obligations imposed by the legislation.
The requirement for a group to appoint an official agent in addition to the
requirement for each candidate in a group to appoint an official agent.
The requirement for a campaign account if donations received or expenditure
incurred exceed $1,000. It is regularly indicated at seminars that difficulties are
experienced at the banks with the nature of these accounts (particularly with it
being owned by one person and operated by another).
The time constraints associated with complying with these obligations and
requirements during a limited election period where the candidate/group focus
is on campaigning.
Proposals for Consideration
Any person who intends to operates as a candidate and intends to receive
political donations or incur electoral expenditure as a candidate should continue
to be required to register with the EFA as a candidate (even if a member of a
group).
Any person who operates only as a member of a group and does not intend to
operate as a candidate outside the group, i.e. receive political donations or incur
electoral expenditure as a candidate, need only register as a member of a
group.
A candidate can choose whether to appoint an official agent or be their own
official agent. There does not seem any compelling argument that a person must
appoint another person as their official agent.
Because groups are constructed of a number of members, it is considered that a
group should be required to appoint an official agent not being any member of
the group. This is to give some assurance to each member of the group that their
interests are being served by someone independent of the group (as each
REPORT ON THE 2012 LOCAL GOVERNMENT ELECTIONS
Part 1
97
member of the group is required to agree to any person appointed as the official
agent).
The $1,000 of political donations received or electoral expenditure incurred as the
threshold for the requirement for a campaign account is too low and should be
increased to $2,500. (Currently, the EFA only requires a disclosure to be audited
when political donations received or electoral expenditure incurred exceeds
$2,500.)
There should be no obligation by a person (candidate) in a group to lodge a
disclosure (as a candidate) if that person operated only as a member of a group
and did not operate as a candidate outside the group, i.e. receive political
donations or incur electoral expenditure as a candidate.

REPORT ON THE 2012 LOCAL GOVERNMENT ELECTIONS
Part 1
98
Section 9: Future Directions
The NSWEC’s role includes the provision of advice to the NSW Parliament and the
NSW Premier on issues affecting the conduct of elections including administrative
issues that require legislative change.
The NSWEC also endeavours to be a learning, developing organisation with a focus
on continuous improvement. As part of this process, the NSWEC looks at ways to
provide smarter and more efficient electoral services to all election stakeholders.
Proposed Legislative Changes
Based on the NSWEC’s experience in conducting elections generally and particularly
the 2012 Local Government Elections, the NSWEC believes that one of the critical
issues is flexibility in legislation to adapt to beneficial changes in information and
communication technology and greater choice in how electors can cast their votes
securely and in secret.
The NSWEC considers that there are a range of ways in which the need to engage
electors in the democratic process can be enhanced and puts forward the following
for consideration.
Universal Postal Voting
Voting methods for Local Government elections across Australia include:
Full attendance voting – New South Wales;
Full postal voting – South Australia and Tasmania;
Combination of attendance and postal voting – Queensland, Victoria, Western
Australia; and
Combination of attendance and mobile voting – Northern Territory.
Currently in NSW universal postal voting is not available for Local Government
elections and limited postal voting is only available as an alternative to ‘in
attendance’ voting. Availability of postal voting relies upon certain criteria being
met that is, electors will not be in NSW or within 8 kilometres of a polling booth during
polling hours on polling day. It can also be used for electors who are sick, infirm, in
advanced pregnancy, in prison, working or otherwise restricted from attending the
polling place because of religious beliefs or other preclusions.
Precedents exist for greater use of postal voting in Local Government elections. In
addition in 2008 and again in 2012, the NSWEC received feedback from many
electors, General Managers and other stakeholders regarding the need for flexibility
in the voting options including that other Australian States and Territories allow
greater use of postal voting.
The NSWEC raises for consideration the option of councils having the choice of either
attendance or postal voting, believing this option will be more convenient to electors
and more flexible for councils.
REPORT ON THE 2012 LOCAL GOVERNMENT ELECTIONS
Part 1
99
The Benefits of Internet and Telephone Voting be considered
The NSWEC’s experience in introducing internet and phone voting for eligible citizens
was very positively received.
This form of voting was first introduced at the 2011 State General Election. Previous
independent reports have documented the technical assessments as well as the
overwhelmingly positive responses of users. These reports are presented on the
NSWEC’s website.
Subsequent experience at State by-elections since iVote’s introduction at the 2011
State Election has shown that the take up of this form of voting has increased
markedly and that user satisfaction remains very high.
This form of voting has definite advantages for the conduct of Local Government
elections where there is currently no option for electors, who are out of their council
area to vote ‘absent’ as in State or Federal elections. The NSWEC believes that there
is potential to use iVote in a variety of ways within the context of Local Government
elections, including combining it with the universal postal option.
Meeting the Needs of Electors with Disabilities
The NSWEC has noted that many of those voters who used the Braille ballot papers in
the 2012 Local Government Elections have expressed a desire for the NSWEC to
incorporate electronically assisted voting into future Local Government elections.
The NSWEC will continue to examine electronic voting to assist electors with a vision
impairment cast a private and independent vote. The implementation of electronic
voting for Local Government elections is not possible without legislative change and
resourcing.
Other Legislative Amendments
Operational experience at the 2012 Local Government Elections in Returning
Officers’ offices with the Proportional Representation Counting method have
prompted a number of observations and proposals around the construction of the
ballot paper and counting.
The NSWEC believes that there seems a paradox in that a candidate can agree to
join a group, agree to a position on the ballot paper in that group but then be able
to act independently of the group when campaigning (including issuing their own
electoral material) for electors to vote for a member of the group below the line. It
would seem appropriate that candidates either run as a member of a group or as an
ungrouped candidate. Because of the manner in which electors can vote ‘Below
The Line’, the current system fundamentally provides that all candidates below the
line are ungrouped. This then carries over into counting and is by far the most
significant issue that contributes to the time required to data enter ballot papers.
The vast majority of candidates ‘Below The Line’ have little to no chance of being
elected and are solicited to join the group to enable an entitlement for a square
‘Above The Line’. In the case of Wagga Wagga there was in excess of 50
REPORT ON THE 2012 LOCAL GOVERNMENT ELECTIONS
Part 1
100
candidates with only 11 to be elected. This influx of candidates also adds
unnecessarily to nomination and campaign and finance management processing.
The NSWEC suggests that any candidate in a group cannot have a voting square
below the line. (Candidates would be listed and party affiliation shown but no voting
square.)
It would then follow that a candidate who is a member of a group cannot be in the
ungrouped category. Candidates should be required to decide whether they are
seeking election in a group or as a ungrouped candidate – not both. It is
contradictory that a candidate seeking election as part of a group of ‘like minded’
people can seek election independent of the group and run election campaigns
independent of the group.
It also follows from the above points that a group should only consist of at least half
the number to be elected. (Presently a group can consist of two or more
candidates.)
If these reforms are adopted it will simplify the ballot paper, reduce registered
electoral material and make counting easier.
The nomination fee should be increased from the current $125 to $250 to again
discourage candidates running simply to make up the numbers. This should be
coupled with a requirement for ten nominators and not the current two.
Candidate Information Sheets
The NSWEC believes that there should be adoption of Recommendation 10 from the
report of the Inquiry into the 2008 Local Government Elections to discontinue the
requirement for a candidate’s signature on a Local Government election
nomination form be witnessed by a Justice of the Peace. This measure would both
streamline processes and more closely align Local Government nomination forms
with State General election provisions. The NSWEC also believes that the
requirement for Candidate Information Sheets to be in the form of statutory
declarations should be re-considered.
Funding Model for Future Council Elections
The new contractual arrangements in place from the conclusion of the 2012 Local
Government Elections pose challenges for the NSWEC and councils. The reality is
that the provision of electoral services outside the large metropolitan areas by a
provider based in Sydney is not an economic proposition for the NSWEC.
The Commission has analysed the charge rates across NSW based on a breakdown
for three categories of councils (metropolitan, regional and rural). The metropolitan
councils were cheaper to service at $6.21 an elector rising to $6.53 per elector for
regional councils and $7.30 per elector for rural councils. The costing model utilised
to date to some extent evens out costs across NSW but this will not be possible in a
contestable model going forward and it will be uneconomic for the NSWEC to
provide election services to the smaller, more remote rural councils.

REPORT ON THE 2012 LOCAL GOVERNMENT ELECTIONS
Part 1
101
As the NSWEC is not compelled to conduct elections even if approached by a
council, this raises public policy issues around the possibility that some smaller or more
rurally located councils may not have the same access to the providers of election
services as other larger, metropolitan councils.
The NSWEC is currently analysing this situation and will raise this issue with the Joint
Standing Committee on Electoral Matters.
End Notes
iii Uncontested elections are only known at the close of nominations. Until that point, the NSWEC had been undertaking work towards
anticipated elections and incurring expenses. Costs for work undertaken to that point are charged to the council concerned.
iv In the 2008 Local Government Elections, there were 4,231,370 people on the electoral roll and 313,025 electors in uncontested
areas.
v Australian Electoral Commission, Analysis of Informal Voting House of Representatives 2007 Election, 2009.
vi In this report the term ‘client’ is used to describe the group that pays for the service provided. The term ‘stakeholder’ is used in
relation to those who have an interest in the elections.
vii Whole of state enrolment actual number was 4,776,599.
viii The number of candidates, the ward structure and the differing types of elections that can occur within one council area make it
prohibitively expensive and logistically very cumbersome to provide absent voting at each polling place throughout NSW.
ix Calculation of non-voter rate is based on councillor elections and excludes from the total elector base figure, those electors who
were not expected to vote, for example, electors in areas with uncontested elections.
x State Electoral Office, 2003/04 Annual Report, p6.
xi Section 16 of the Local Government Act 1993 provides for a referendum to be held. With regard to the latter point, ‘changing the
method of election of ward councillors’ this refers to election by the electors for the ward or, partly by the electors for the ward and
partly by the electors for the whole Local Government Area.
xii State Electoral Office, 2003/04 Annual Report, p7.
xiii NSW Electoral Commission, Report on the 2007 State Election, 2007, p4 with greater detail on p55.
xiv State Electoral Office, 2003/04 Annual Report, p6.
xv 2004: 4,962 candidates and 1,464 positions; 2008: 4,620 candidates and 1,474 positions.
xvi The councils in 2004 which had more than 100 candidates were Rockdale City Council (121), Randwick City Council (109),
Campbelltown City Council (109), Auburn Council (108) and Tweed Shire Council (106).
xvii This figure includes Client Service Officers (3), Returning Officers Support Officers (8), Returning Officers (64) but does not include
any other temporary staff at Riverwood Count Centre or additional project staff at Head Office
REPORT ON THE 2012 LOCAL GOVERNMENT ELECTIONS
Part 1
102
xviii This excludes a total of 1,984 other categories of election staff who were employed for periods longer than election day that is,
Client Service Officers (3), Returning Officer Support Officers (8), Returning Officers (64), Office Managers (62), Senior Office Assistants
(5) and Office Assistants (1,842).
xix Sutherland Shire Council, Report on the Conduct of the Election of Sutherland Shire Council 2012 Local Government Elections,
Sutherland Shire Council website.
xx NSW Department of Premier and Cabinet, Division of Local Government, Guidelines for Council Administered Elections 2012,
September 2011.
REPORT ON THE 2012 LOCAL GOVERNMENT ELECTIONS
Part 1 – List of Tables
103
List of Tables
Table 1: Report Content Areas Requested by the 2008 Inquiry into the Conduct of the
2008 Local Government Elections ......................................................................................... 4
Table 2: Terms of Reference Inquiry into the Conduct of the 2012 Local Government
Elections .................................................................................................................................... 5
Table 3: 2012 Local Government Elections Due, Contested and Uncontested
Elections .................................................................................................................................. 13
Table 4: 1999, 2004, 2008 and 2012 Local Government Elections Activity Statistics ..... 13
Table 5: 2004, 2008 and 2012 Local Government Elections Engagement by Electors 14
Table 6: 2008 and 2012 Local Government Elections Financial Indicators ................... 14
Table 7: 2012 Local Government Elections Key Election Dates ...................................... 15
Table 8: 2008 Joint Standing Committee’s Recommendations and NSWEC’s Response
.................................................................................................................................................. 17
Table 9: 2012 Local Government Elections Service Commitments for Electors, Targets
and Results .............................................................................................................................. 24
Table 10: 2012 Local Government Elections Service Commitments for General
Managers, Targets and Results ............................................................................................ 27
Table 11: 2012 Local Government Elections Service Commitments for Candidates
and Political Parties, Targets and Results ............................................................................ 28
Table 12: 2012 Local Government Elections, Major Expenditure Items.......................... 39
Table 13: 2012 Local Government Elections, Election Official Wages ........................... 40
Table 14: 2012 Local Government Elections, Advertising Expenditure by Subject,
$000’s and Percentage. ....................................................................................................... 40
Table 15: 2012 Local Government Elections Average Cost per Elector of Returning
Officer Regional and Stand Alone Operations ................................................................. 41
Table 16: 2012 Local Government Elections Information Distribution to the General
Public ....................................................................................................................................... 44
Table 17: 2012 Local Government Elections Information Distribution to Electors from
Culturally and Linguistically Diverse Backgrounds ............................................................ 45
Table 18: 2012 Local Government Elections Information Distribution to Electors with a
Disability ................................................................................................................................... 46
REPORT ON THE 2012 LOCAL GOVERNMENT ELECTIONS
Part 1 - List of Tables
104
Table 19: 2012 Local Government Elections Information Distribution chains to
Aboriginal and Torres Strait Islander Electors (including stalls and presentations) ....... 47
Table 20: 2012 Local Government Elections Distribution chains of other Information . 48
Table 21: 2012 Local Government Elections Due, Contested and Uncontested
Elections .................................................................................................................................. 55
Table 22: 2008 and 2012 Local Government Elections Referenda, Frequencies. (a) .. 56
Table 23: 1999 to 2012 Local Government Elections Council of City of Sydney, Non-
residential Enrolments ............................................................................................................ 62
Table 24: 2012 Local Government Elections Size of Regional Groupings, Number of
Councils and Percentages ................................................................................................... 64
Table 25: 2012 Local Government Elections Example Optional Preferential Count
Process ..................................................................................................................................... 66
Table 26: 2012 Local Government Elections Councils with councillor ballot papers
computer counted at Riverwood. ...................................................................................... 69
Table 27: 2012 Local Government Elections Councils with Councillor Ballot Papers
Computer Counted Locally. ................................................................................................ 70
Table 28: 2012 Local Government Elections Recounts of Ballot Papers ........................ 72
Table 29: 2012 Local Government Elections, Councils with Successful Referenda ...... 73
Table 30: 2012 Local Government Elections, Referenda Results, Frequencies. ............ 74
Table 31: 2012 Local Government Elections Poll Questions and Results ........................ 75
Table 32: 2012 Local Government Elections Rejected nominations .............................. 78
Table 33: 2012 Local Government Elections Election Official Categories, Numbers
and Percentages. .................................................................................................................. 82
Table 34: 2012 Local Government Elections - Determination of Staff Numbers in Polling
Places. ..................................................................................................................................... 85
Table 35: 2012 Local Government Elections Materials to Returning Officers and
Election Officials ..................................................................................................................... 89
Table 36: 2012 Local Government Elections Election Staff and ‘Impartial Conduct of
the Elections Question’. ........................................................................................................ 93
Table 37: 2012 Local Government Elections 2012 Election Staff and Question ‘Were
there any occupational health and safety issues for staff?’ ........................................... 94

REPORT ON THE 2012 LOCAL GOVERNMENT ELECTIONS
Part 2
105
Comparison across Councils with
NSWEC conducted Elections.
There was no difference in real terms in voter participation rate in 2012 for rural
councils as compared to metropolitan councils (rural 82.8%; metropolitan 81.8%).
The highest participation rate was recorded in Weddin Shire Council (89.1%) and the
lowest in Walgett Shire Council (68.8%).
The five councils in 2012 with the highest participation rates as a percentage of the
enrolment were:
Weddin Shire Council 89.1%
City of Lithgow Council 87.9%
Temora Shire Council 87.8%
Dubbo City Council 87.8%
Harden Shire Council 87.6%
The five councils with the lowest participation rates were:
Walgett Shire Council 68.8%
Council of the City of Sydney 69.1%
Woollahra Municipal Council 69.7%
Brewarrina Shire Council 69.9%
Central Darling Shire Council 72.3%
Note: Urana Shire Council and The Council of the Shire of Wakool had lower participation rates (63.0% and 54.5%
respectively), however both councils only had one ward with a contested election.
In every election, some votes cast are informal.xxi The proportion of informal votes
has increased somewhat from the 2008 Local Government Elections (7.9% 2012
compared to 7.1% 2008). Comparisons are difficult however as this figure relates to
only the elections conducted by the NSWEC.
Total votes in the 2012 Local Government Elections numbered 2,929,094 with formal
votes for councillor elections totalling 2,699,142 and informal votes 229,952.
Across the Councils for whom NSWEC conducted elections, formality was recorded
at 92.1% with an informality rate of 7.9%. Rural councils were more prevalent
amongst councils with higher levels of formal votes.
The five councils with the highest formality rates were:
Lockhart Shire Council 98.0%
Lachlan Shire Council 97.9%
Hay Shire Council 97.8%
Coonamble Shire Council 97.8%
Gundagai Shire Council 97.8%
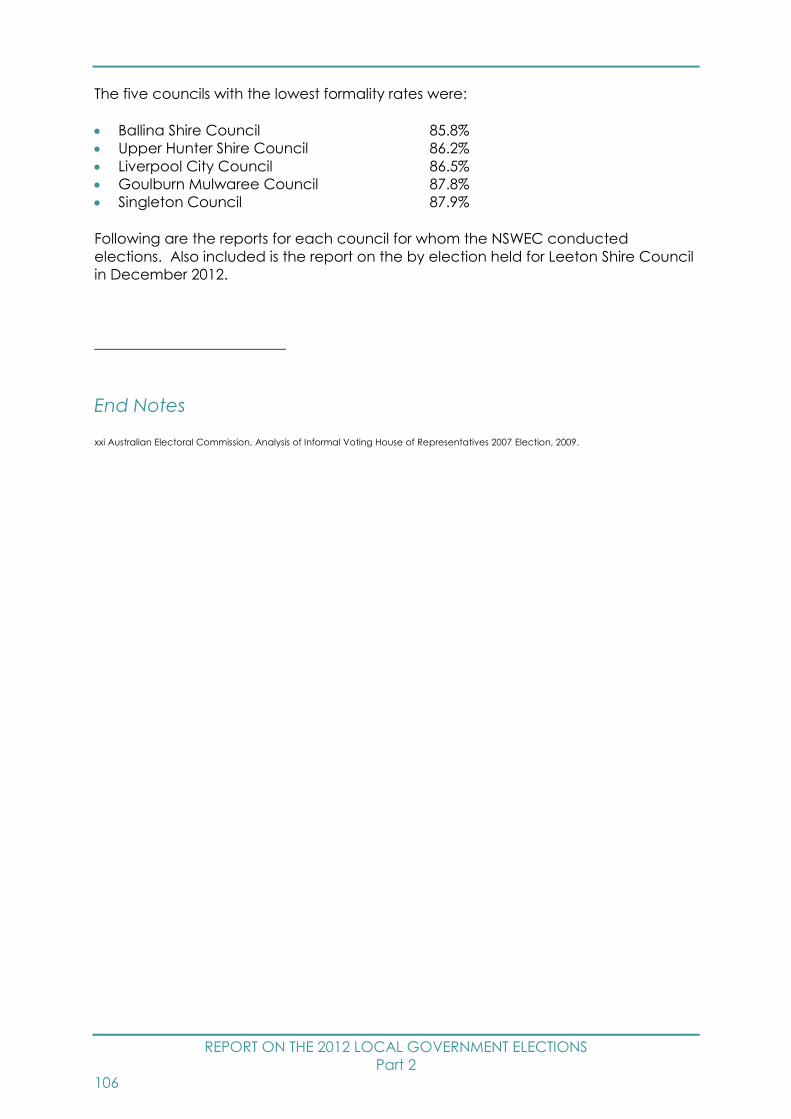
REPORT ON THE 2012 LOCAL GOVERNMENT ELECTIONS
Part 2
106
The five councils with the lowest formality rates were:
Ballina Shire Council 85.8%
Upper Hunter Shire Council 86.2%
Liverpool City Council 86.5%
Goulburn Mulwaree Council 87.8%
Singleton Council 87.9%
Following are the reports for each council for whom the NSWEC conducted
elections. Also included is the report on the by election held for Leeton Shire Council
in December 2012.
End Notes
xxi Australian Electoral Commission, Analysis of Informal Voting House of Representatives 2007 Election, 2009.

REPORT ON THE 2012 LOCAL GOVERNMENT ELECTIONS
Part 2
107
Individual
Council
Reports

REPORT ON THE 2012 LOCAL GOVERNMENT ELECTIONS
Albury City Council
108
Albury City Council Report
Election Summary
Poll declared by Friday, 14 September, 2012
Councillor elections, successful candidates
Councillor name Party Affiliation
BETTERIDGE, Daryl -
CAMERON, Darren Country Labor Party
DOCKSEY, Graham -
GLACHAN, Alice -
GOULD, Patricia -
JACKSON, Ross Albury Citizens and Ratepayers Movement
MACK, Kevin -
THURLEY, David -
VAN DE VEN, Henk -
For full details of results see website –
www.pastvtr.elections.nsw.gov.au/LGE2012/albury-city-council.html
For a breakdown of voting by Vote Type (Ordinary, Declared Institution/Pre-poll,
Postal, Provisional/Silent) see the Councillor Election page of the above website, on
the Final Results tab select 04 - Enrolment and Voting by Aggregated Vote Type
Report.
Enrolment
Total Electors 33,100
Residential roll 33,096
Non-residential roll 4
SmartRolled Electors 2,566
(30/7/11 – 30/7/12)
Participation and Informality
Participation rate 79.3%
Formal votes 24,039
Informal votes 2,203
Total votes 26,242
Informality rate 8.4%

REPORT ON THE 2012 LOCAL GOVERNMENT ELECTIONS
Albury City Council
109
Failure to Vote
Penalty Notices Issued 5,306
Rate of Failure to Vote1 16.1%
Election Costs
Total Cost of the Albury City Council 2012 Election
$203,352.00
Cost per elector
$6.17
Albury City Council Statutory Advertising Campaign Expenditure
Nominations $668.00
Candidates and polling places $4,052.00
Uncontested elections $0.00
Results $286.00
TOTAL $5,006.00
Election Services
Elector Enquiry Centre
The Elector Enquiry Centre answered 327 calls from postcodes within Albury City
Council area.
NSWEC Website
There were 3,203 unique visitors to Albury City Council election web page.
Braille Ballot Papers
No braille ballot papers were requested or printed.
Returning Officer
Karen Mills
1 Percentage of Penalty Notices Issued to Enrolment (as shown on Authorised Roll)
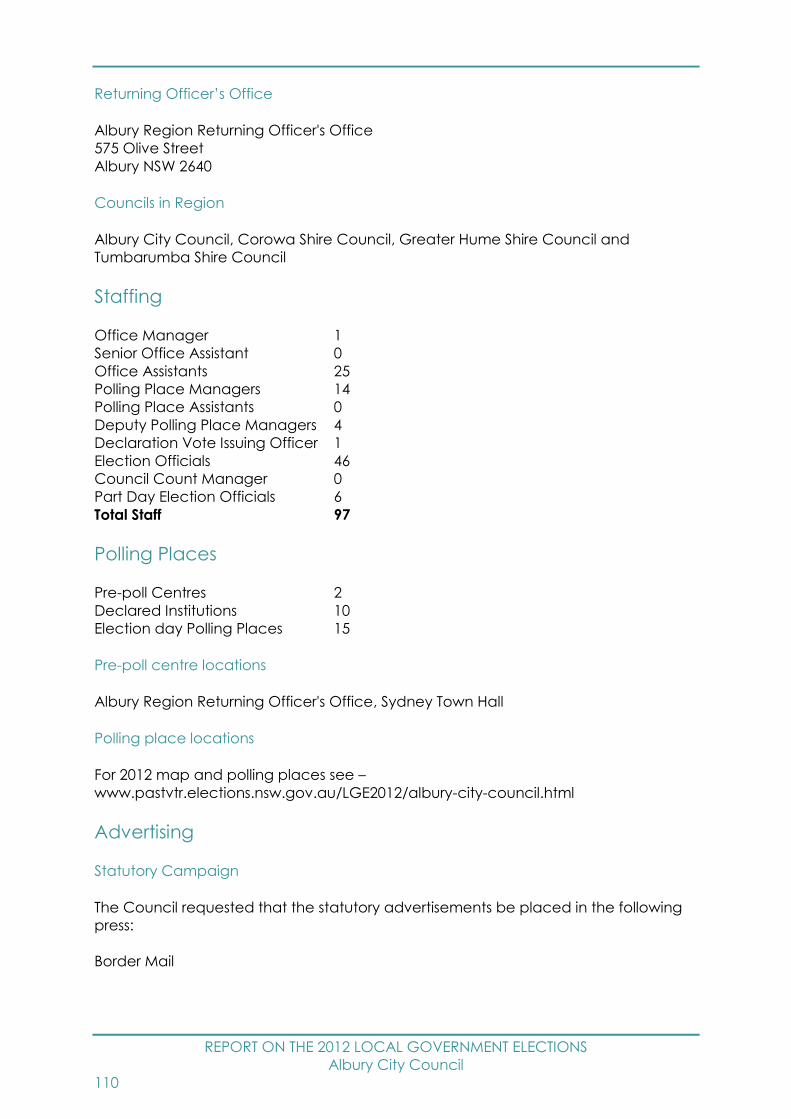
REPORT ON THE 2012 LOCAL GOVERNMENT ELECTIONS
Albury City Council
110
Returning Officer’s Office
Albury Region Returning Officer's Office
575 Olive Street
Albury NSW 2640
Councils in Region
Albury City Council, Corowa Shire Council, Greater Hume Shire Council and
Tumbarumba Shire Council
Staffing
Office Manager 1
Senior Office Assistant 0
Office Assistants 25
Polling Place Managers 14
Polling Place Assistants 0
Deputy Polling Place Managers 4
Declaration Vote Issuing Officer 1
Election Officials 46
Council Count Manager 0
Part Day Election Officials 6
Total Staff 97
Polling Places
Pre-poll Centres 2
Declared Institutions 10
Election day Polling Places 15
Pre-poll centre locations
Albury Region Returning Officer's Office, Sydney Town Hall
Polling place locations
For 2012 map and polling places see –
www.pastvtr.elections.nsw.gov.au/LGE2012/albury-city-council.html
Advertising
Statutory Campaign
The Council requested that the statutory advertisements be placed in the following
press:
Border Mail

REPORT ON THE 2012 LOCAL GOVERNMENT ELECTIONS
Albury City Council
111
Candidates
Nominations withdrawn
No Councillor nominations were withdrawn.
Councillor Candidates
Total Candidates 63
Female Candidates 18
Male Candidates 45
Names of all candidates
Councillor Candidates Party Affiliation
ALCOTT, Philip
ANGUS, Robert
BAILEY, Kelly Albury Citizens and Ratepayers Movement
BETTERIDGE, Daryl
BLOM, Gerry
BRADY, Wayne Albury Citizens and Ratepayers Movement
BROWN, Richard
CAMERON, Leanne Country Labor Party
CAMERON, Darren Country Labor Party
CAMERON, Ewen
COUSINS, Scott
COWIE, Mark
DANDO, Mark
DAVIDOVIC, Michael
DOCKSEY, Graham
DRAGE, Steve
EMMERY, John Albury Citizens and Ratepayers Movement
FARRAH, Wayne
FINLAY, Jacqui
FOWLER, Mick
FREYER, Dean
GLACHAN, Alice
GOFF, Ken
GOULD, Patricia
GOULD, David
GRANT, Gavin
GRAY, Vicki
HOGAN, Tom
HOOD, Peter
HULL, Neville
JACKSON, Ross Albury Citizens and Ratepayers Movement
JAKOVAC, Ivan
KROOGLIK, George
LARKIN, Angela
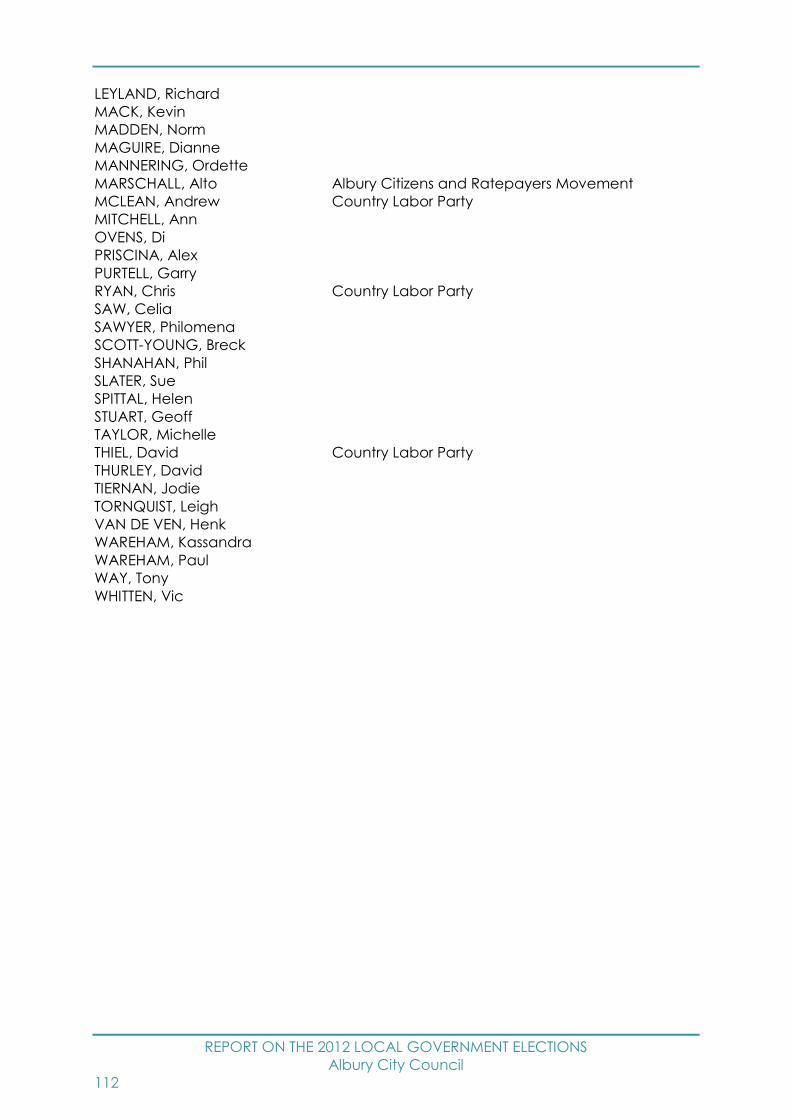
REPORT ON THE 2012 LOCAL GOVERNMENT ELECTIONS
Albury City Council
112
LEYLAND, Richard
MACK, Kevin
MADDEN, Norm
MAGUIRE, Dianne
MANNERING, Ordette
MARSCHALL, Alto Albury Citizens and Ratepayers Movement
MCLEAN, Andrew Country Labor Party
MITCHELL, Ann
OVENS, Di
PRISCINA, Alex
PURTELL, Garry
RYAN, Chris Country Labor Party
SAW, Celia
SAWYER, Philomena
SCOTT-YOUNG, Breck
SHANAHAN, Phil
SLATER, Sue
SPITTAL, Helen
STUART, Geoff
TAYLOR, Michelle
THIEL, David Country Labor Party
THURLEY, David
TIERNAN, Jodie
TORNQUIST, Leigh
VAN DE VEN, Henk
WAREHAM, Kassandra
WAREHAM, Paul
WAY, Tony
WHITTEN, Vic

REPORT ON THE 2012 LOCAL GOVERNMENT ELECTIONS
Armidale Dumaresq Council
113
Armidale Dumaresq Council Report
Election Summary
Poll declared by Saturday, 15 September, 2012
Councillor elections, successful candidates
Councillor name Party Affiliation
BAILEY, Jenny -
BEYERSDORF, Herman -
BISHOP, Laurie -
GADD, Colin -
HALLIGAN, Christopher -
MAHER, Jim -
MURAT, Andrew -
O'CONNOR, Margaret Liberal Party of Australia New South Wales Division
O'DONOHUE, Peter The Greens
RICHARDSON, Rob -
For full details of results see website –
www.pastvtr.elections.nsw.gov.au/LGE2012/armidale-dumaresq-council.html
For a breakdown of voting by Vote Type (Ordinary, Declared Institution/Pre-poll,
Postal, Provisional/Silent) see the Councillor Election page of the above website, on
the Final Results tab select 04 - Enrolment and Voting by Aggregated Vote Type
Report.
Enrolment
Total Electors 16,272
Residential roll 16,270
Non-residential roll 2
SmartRolled Electors 1,564
(30/7/11 – 30/7/12)
Participation and Informality
Participation rate 81.8%
Formal votes 12,483
Informal votes 821
Total votes 13,304
Informality rate 6.2%
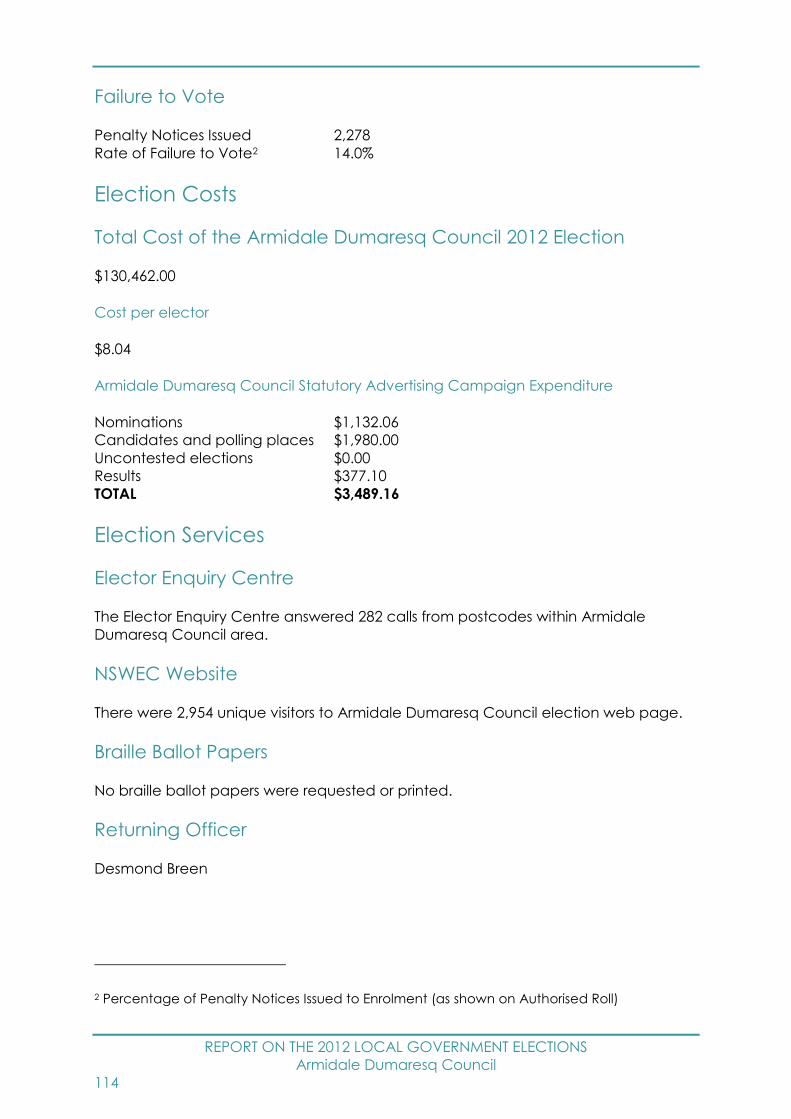
REPORT ON THE 2012 LOCAL GOVERNMENT ELECTIONS
Armidale Dumaresq Council
114
Failure to Vote
Penalty Notices Issued 2,278
Rate of Failure to Vote2 14.0%
Election Costs
Total Cost of the Armidale Dumaresq Council 2012 Election
$130,462.00
Cost per elector
$8.04
Armidale Dumaresq Council Statutory Advertising Campaign Expenditure
Nominations $1,132.06
Candidates and polling places $1,980.00
Uncontested elections $0.00
Results $377.10
TOTAL $3,489.16
Election Services
Elector Enquiry Centre
The Elector Enquiry Centre answered 282 calls from postcodes within Armidale
Dumaresq Council area.
NSWEC Website
There were 2,954 unique visitors to Armidale Dumaresq Council election web page.
Braille Ballot Papers
No braille ballot papers were requested or printed.
Returning Officer
Desmond Breen
2 Percentage of Penalty Notices Issued to Enrolment (as shown on Authorised Roll)

REPORT ON THE 2012 LOCAL GOVERNMENT ELECTIONS
Armidale Dumaresq Council
115
Returning Officer’s Office
Armidale Region Returning Officer's Office
2/206 Beardy Street
Armidale NSW 2350
Councils in Region
Armidale Dumaresq Council, Guyra Shire Council, Uralla Shire Council and Walcha
Council
Staffing
Office Manager 1
Senior Office Assistant 0
Office Assistants 30
Polling Place Managers 9
Polling Place Assistants 0
Deputy Polling Place Managers 3
Declaration Vote Issuing Officer 1
Election Officials 26
Council Count Manager 0
Part Day Election Officials 3
Total Staff 73
Polling Places
Pre-poll Centres 2
Declared Institutions 4
Election day Polling Places 10
Pre-poll centre locations
Armidale Region Returning Officer's Office, Sydney Town Hall
Polling place locations
For 2012 map and polling places see –
www.pastvtr.elections.nsw.gov.au/LGE2012/armidale-dumaresq-council.html
Advertising
Statutory Campaign
The Council requested that the statutory advertisements be placed in the following
press:
Armidale Express
Armidale Express Extra
Armidale Independent

REPORT ON THE 2012 LOCAL GOVERNMENT ELECTIONS
Armidale Dumaresq Council
116
Candidates
Nominations withdrawn
No Councillor nominations were withdrawn.
Councillor Candidates
Total Candidates 31
Female Candidates 10
Male Candidates 21
Names of all candidates
Councillor Candidates Party Affiliation
BAILEY, Jenny
BEYERSDORF, Herman
BISHOP, Laurie
ELLIS, James Liberal Party of Australia New South Wales Division
FENWICKE, David
GADD, Colin
GREAM, Kerrod Liberal Party of Australia New South Wales Division
GRIFFITH, Stephen
HALLIGAN, Christopher
HARDWICK, Anthony
HILLARD, Josephine
JOHNSON, Danjela Liberal Party of Australia New South Wales Division
KELLIHER, Taden Liberal Party of Australia New South Wales Division
KEMBERY, Vicki
MacKAY, Iain The Greens
MAHER, Jim
McCOSKER, Julia The Greens
MITCHELL, Allan
MOLESWORTH, Rick
MURAT, Andrew
O'CONNOR, Margaret Liberal Party of Australia New South Wales Division
O'DONOHUE, Peter The Greens
PIPER, Hugh
RAMSAY, Tony
RAPLEY, Jack
RICHARDSON, Rob
ROBERTS, Warren
ROBINSON, Dorothy The Greens
SCHULTZ, Pat The Greens
TAYLOR, Elva
THOMAS, Leanne
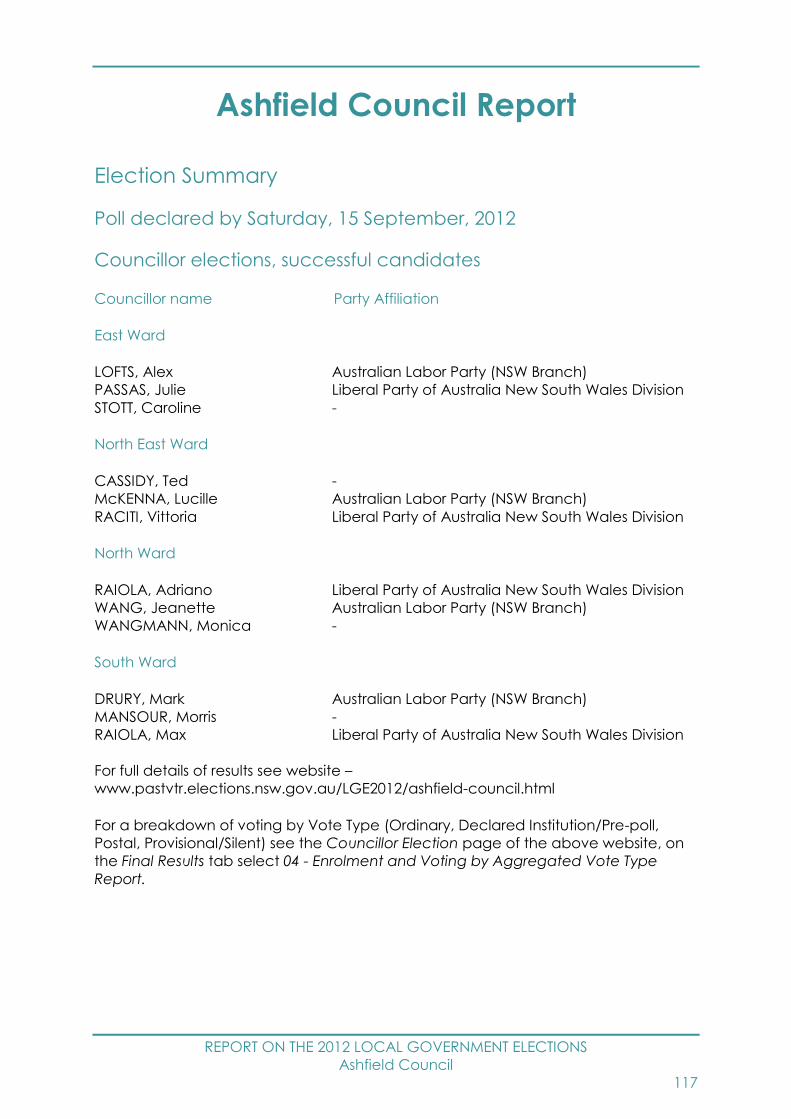
REPORT ON THE 2012 LOCAL GOVERNMENT ELECTIONS
Ashfield Council
117
Ashfield Council Report
Election Summary
Poll declared by Saturday, 15 September, 2012
Councillor elections, successful candidates
Councillor name Party Affiliation
East Ward
LOFTS, Alex Australian Labor Party (NSW Branch)
PASSAS, Julie Liberal Party of Australia New South Wales Division
STOTT, Caroline -
North East Ward
CASSIDY, Ted -
McKENNA, Lucille Australian Labor Party (NSW Branch)
RACITI, Vittoria Liberal Party of Australia New South Wales Division
North Ward
RAIOLA, Adriano Liberal Party of Australia New South Wales Division
WANG, Jeanette Australian Labor Party (NSW Branch)
WANGMANN, Monica -
South Ward
DRURY, Mark Australian Labor Party (NSW Branch)
MANSOUR, Morris -
RAIOLA, Max Liberal Party of Australia New South Wales Division
For full details of results see website –
www.pastvtr.elections.nsw.gov.au/LGE2012/ashfield-council.html
For a breakdown of voting by Vote Type (Ordinary, Declared Institution/Pre-poll,
Postal, Provisional/Silent) see the Councillor Election page of the above website, on
the Final Results tab select 04 - Enrolment and Voting by Aggregated Vote Type
Report.
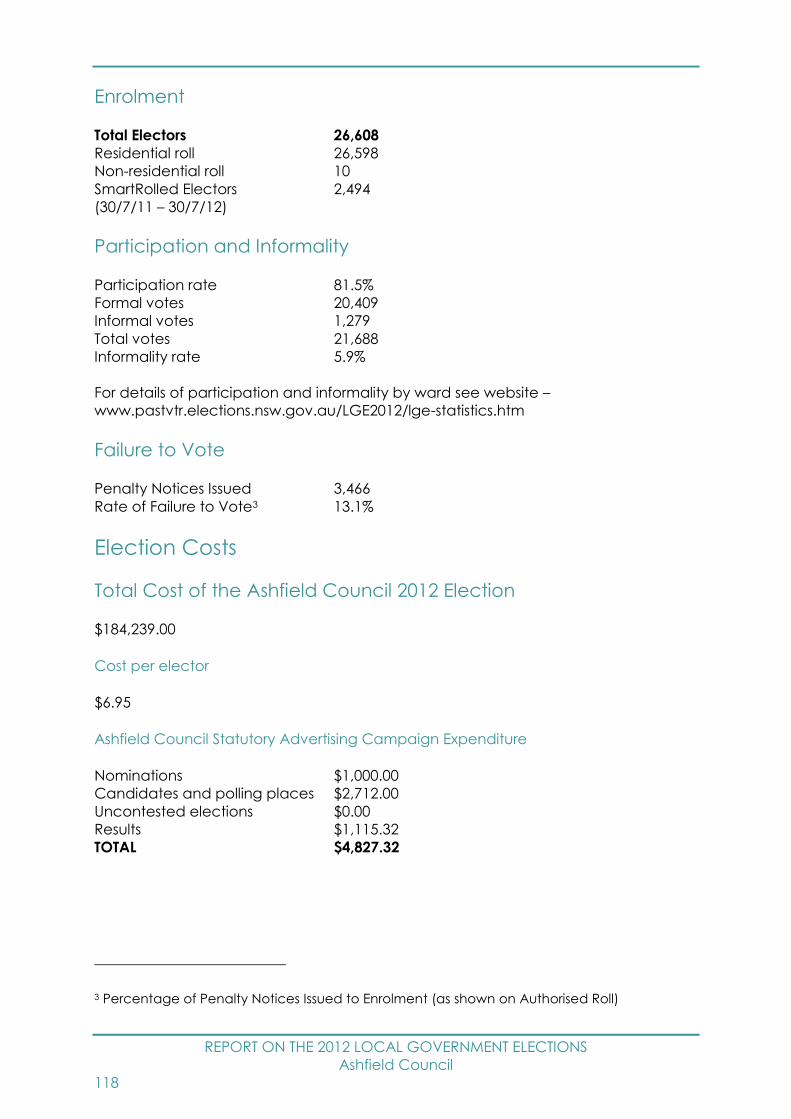
REPORT ON THE 2012 LOCAL GOVERNMENT ELECTIONS
Ashfield Council
118
Enrolment
Total Electors 26,608
Residential roll 26,598
Non-residential roll 10
SmartRolled Electors 2,494
(30/7/11 – 30/7/12)
Participation and Informality
Participation rate 81.5%
Formal votes 20,409
Informal votes 1,279
Total votes 21,688
Informality rate 5.9%
For details of participation and informality by ward see website –
www.pastvtr.elections.nsw.gov.au/LGE2012/lge-statistics.htm
Failure to Vote
Penalty Notices Issued 3,466
Rate of Failure to Vote3 13.1%
Election Costs
Total Cost of the Ashfield Council 2012 Election
$184,239.00
Cost per elector
$6.95
Ashfield Council Statutory Advertising Campaign Expenditure
Nominations $1,000.00
Candidates and polling places $2,712.00
Uncontested elections $0.00
Results $1,115.32
TOTAL $4,827.32
3 Percentage of Penalty Notices Issued to Enrolment (as shown on Authorised Roll)

REPORT ON THE 2012 LOCAL GOVERNMENT ELECTIONS
Ashfield Council
119
Election Services
Elector Enquiry Centre
The Elector Enquiry Centre answered 613 calls from postcodes within Ashfield Council
area.
NSWEC Website
There were 3,341 unique visitors to Ashfield Council election web page.
Braille Ballot Papers
No braille ballot papers were requested or printed.
Returning Officer
John Neely
Returning Officer’s Office
Burwood Region Returning Officer's Office
Burwood Council Chambers
1-17 Elsie Street
Burwood NSW 2134
Councils in Region
Ashfield Council, Burwood Council and Strathfield Municipal Council
Staffing
Office Manager 1
Senior Office Assistant 0
Office Assistants 0
Polling Place Managers 13
Polling Place Assistants 0
Deputy Polling Place Managers 5
Declaration Vote Issuing Officer 5
Election Officials 50
Council Count Manager 0
Part Day Election Officials 7
Total Staff 81
Polling Places
Pre-poll Centres 3
Declared Institutions 9
Election day Polling Places 25

REPORT ON THE 2012 LOCAL GOVERNMENT ELECTIONS
Ashfield Council
120
Pre-poll centre locations
Ashfield Pre-Poll, Burwood Region Returning Officer's Office, Sydney Town Hall
Polling place locations
For 2012 map and polling places see –
www.pastvtr.elections.nsw.gov.au/LGE2012/ashfield-council.html
Advertising
Statutory Campaign
The Council requested that the statutory advertisements be placed in the following
press:
Western Suburbs Courier
Inner West Courier
Candidates
Nominations withdrawn
One Councillor nomination was withdrawn.
Councillor Candidates
Total Candidates 52
Female Candidates 27
Male Candidates 25
East Ward Councillor Candidates
Total Candidates 12
Female Candidates 7
Male Candidates 5
North East Ward Councillor Candidates
Total Candidates 12
Female Candidates 6
Male Candidates 6
North Ward Councillor Candidates
Total Candidates 15
Female Candidates 9
Male Candidates 6

REPORT ON THE 2012 LOCAL GOVERNMENT ELECTIONS
Ashfield Council
121
South Ward Councillor Candidates
Total Candidates 13
Female Candidates 5
Male Candidates 8
Names of all candidates
Councillor Candidates Party Affiliation
East Ward
ADDERLEY, Melinda Australian Labor Party (NSW Branch)
CARRIE, Thomas Liberal Party of Australia New South Wales Division
CHAPMAN, Gregory
DE ROOY, Peter The Greens
GONSALKORALE, Dinesh Australian Labor Party (NSW Branch)
LOFTS, Alex Australian Labor Party (NSW Branch)
LOUDON, Iris The Greens
PASSAS, Julie Liberal Party of Australia New South Wales Division
RIX, Rosslyn The Greens
STOTT, Caroline
TERRAVECCHIA, Susan
TYDEMAN, Marcia Liberal Party of Australia New South Wales Division
North East Ward
CALVERT-KILBURN, Michelle The Greens
CASSIDY, Ted
CROW, Vincent Australian Labor Party (NSW Branch)
LALICH, George
LEES, Nina The Greens
LYNCH, Alex The Greens
McKENNA, Lucille Australian Labor Party (NSW Branch)
RACITI, Rosalba Liberal Party of Australia New South Wales Division
RACITI, Vittoria Liberal Party of Australia New South Wales Division
RAIOLA, Kerry Liberal Party of Australia New South Wales Division
STEPHENS, Tim Australian Labor Party (NSW Branch)
VELLA, Luigi
North Ward
COOPER, Stephen The Greens
GRAY, Cecily
KERR, Anna The Greens
LLOYD, Kerrie
MANSOUR, Philip
RAIOLA, Adriano Liberal Party of Australia New South Wales Division
RAIOLA, Giuliano Liberal Party of Australia New South Wales Division
SANTORO, Elia Liberal Party of Australia New South Wales Division
THANAPHONGSAKORN, Ausseela Australian Labor Party (NSW Branch)

REPORT ON THE 2012 LOCAL GOVERNMENT ELECTIONS
Ashfield Council
122
TUCKER, Greg Australian Labor Party (NSW Branch)
WANG, Jeanette Australian Labor Party (NSW Branch)
WANGMANN, Monica
WIGBOUT, Caroleena The Greens
YANG, Yaxi
ZHAO, Jizhen
South Ward
CARLISLE, Jo Australian Labor Party (NSW Branch)
DRURY, Mark Australian Labor Party (NSW Branch)
MAJEWSKI, Mark
MANSOUR, Cronia
MANSOUR, Morris
McPHAIL, Keiran
MOUSSA, Mark
PASSAS, Bill Liberal Party of Australia New South Wales Division
RAIOLA, Max Liberal Party of Australia New South Wales Division
RERCERETNAM, Marc
RIZCALLAH, Jeannette Liberal Party of Australia New South Wales Division
SEARLE, Rosalind Australian Labor Party (NSW Branch)
WOODWARD, Suzanne
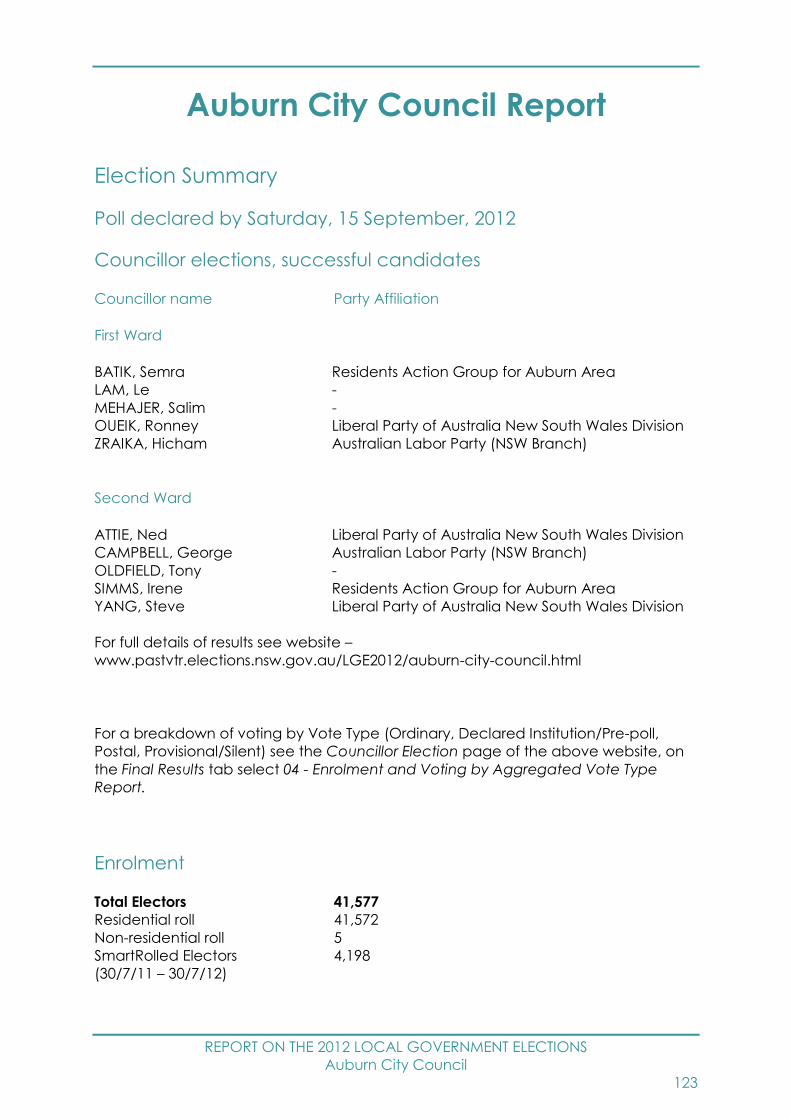
REPORT ON THE 2012 LOCAL GOVERNMENT ELECTIONS
Auburn City Council
123
Auburn City Council Report
Election Summary
Poll declared by Saturday, 15 September, 2012
Councillor elections, successful candidates
Councillor name Party Affiliation
First Ward
BATIK, Semra Residents Action Group for Auburn Area
LAM, Le -
MEHAJER, Salim -
OUEIK, Ronney Liberal Party of Australia New South Wales Division
ZRAIKA, Hicham Australian Labor Party (NSW Branch)
Second Ward
ATTIE, Ned Liberal Party of Australia New South Wales Division
CAMPBELL, George Australian Labor Party (NSW Branch)
OLDFIELD, Tony -
SIMMS, Irene Residents Action Group for Auburn Area
YANG, Steve Liberal Party of Australia New South Wales Division
For full details of results see website –
www.pastvtr.elections.nsw.gov.au/LGE2012/auburn-city-council.html
For a breakdown of voting by Vote Type (Ordinary, Declared Institution/Pre-poll,
Postal, Provisional/Silent) see the Councillor Election page of the above website, on
the Final Results tab select 04 - Enrolment and Voting by Aggregated Vote Type
Report.
Enrolment
Total Electors 41,577
Residential roll 41,572
Non-residential roll 5
SmartRolled Electors 4,198
(30/7/11 – 30/7/12)
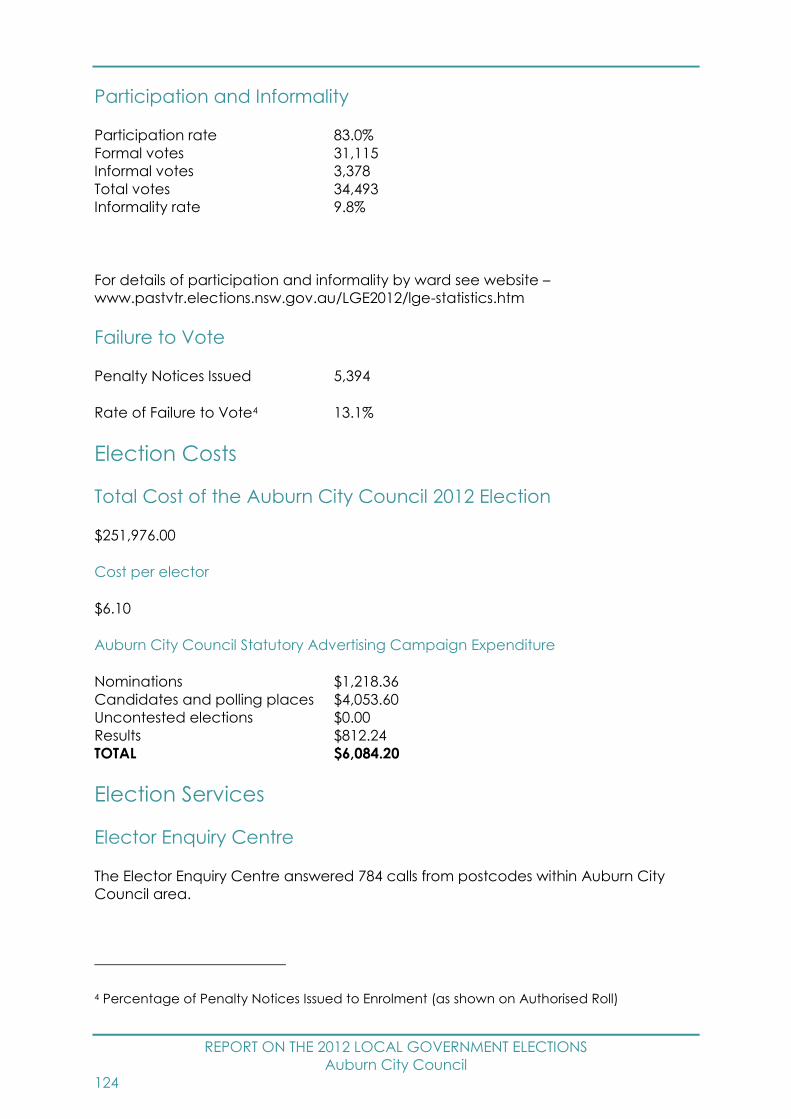
REPORT ON THE 2012 LOCAL GOVERNMENT ELECTIONS
Auburn City Council
124
Participation and Informality
Participation rate 83.0%
Formal votes 31,115
Informal votes 3,378
Total votes 34,493
Informality rate 9.8%
For details of participation and informality by ward see website –
www.pastvtr.elections.nsw.gov.au/LGE2012/lge-statistics.htm
Failure to Vote
Penalty Notices Issued 5,394
Rate of Failure to Vote4 13.1%
Election Costs
Total Cost of the Auburn City Council 2012 Election
$251,976.00
Cost per elector
$6.10
Auburn City Council Statutory Advertising Campaign Expenditure
Nominations $1,218.36
Candidates and polling places $4,053.60
Uncontested elections $0.00
Results $812.24
TOTAL $6,084.20
Election Services
Elector Enquiry Centre
The Elector Enquiry Centre answered 784 calls from postcodes within Auburn City
Council area.
4 Percentage of Penalty Notices Issued to Enrolment (as shown on Authorised Roll)

REPORT ON THE 2012 LOCAL GOVERNMENT ELECTIONS
Auburn City Council
125
NSWEC Website
There were 5,548 unique visitors to Auburn City Council election web page.
Braille Ballot Papers
No braille ballot papers were requested or printed.
Returning Officer
Kathleen Fogarty
Returning Officer’s Office
Auburn Returning Officer's Office
Old Lidcombe RSL
6 Taylor Street
Lidcombe NSW 2141
Staffing
Office Manager 0
Senior Office Assistant 1
Office Assistants 21
Polling Place Managers 13
Polling Place Assistants 0
Deputy Polling Place Managers 10
Declaration Vote Issuing Officer 13
Election Officials 79
Council Count Manager 0
Part Day Election Officials 13
Total Staff 150
Polling Places
Pre-poll Centres 3
Declared Institutions 7
Election day Polling Places 18
Pre-poll centre locations
Auburn Returning Officer's Office, Homebush Pre-Poll, Sydney Town Hall
Polling place locations
For 2012 map and polling places see –
www.pastvtr.elections.nsw.gov.au/LGE2012/auburn-city-council.html
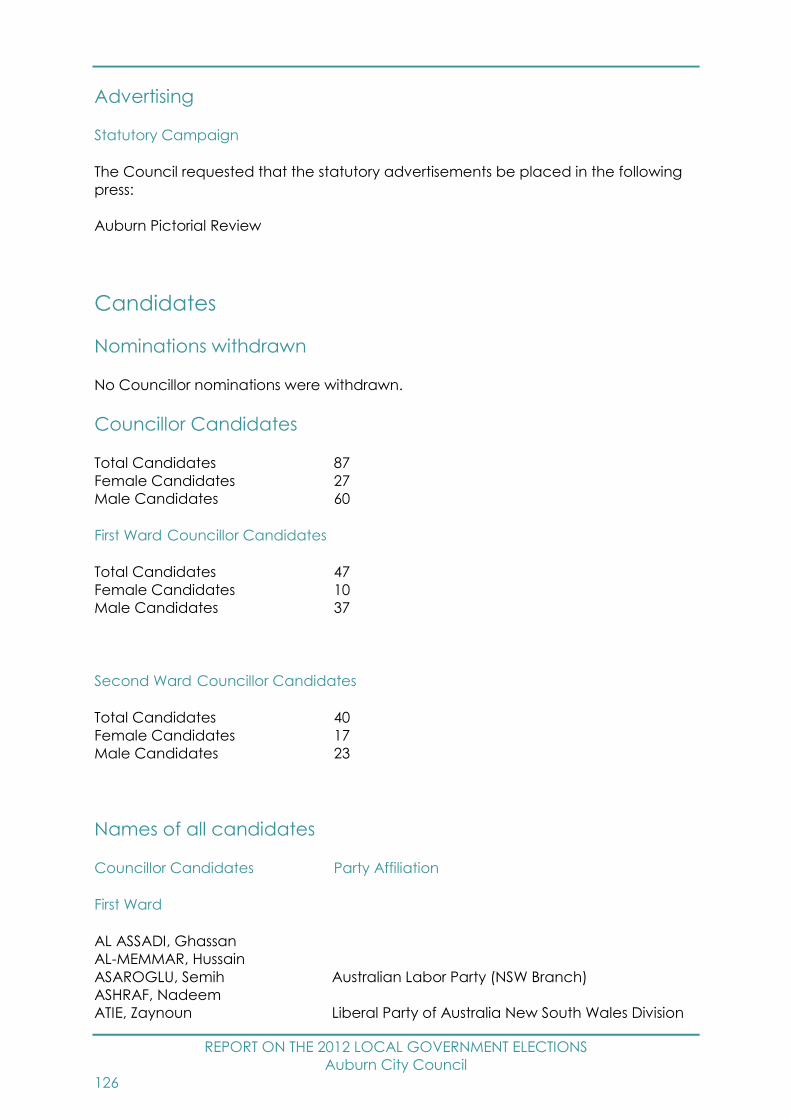
REPORT ON THE 2012 LOCAL GOVERNMENT ELECTIONS
Auburn City Council
126
Advertising
Statutory Campaign
The Council requested that the statutory advertisements be placed in the following
press:
Auburn Pictorial Review
Candidates
Nominations withdrawn
No Councillor nominations were withdrawn.
Councillor Candidates
Total Candidates 87
Female Candidates 27
Male Candidates 60
First Ward Councillor Candidates
Total Candidates 47
Female Candidates 10
Male Candidates 37
Second Ward Councillor Candidates
Total Candidates 40
Female Candidates 17
Male Candidates 23
Names of all candidates
Councillor Candidates Party Affiliation
First Ward
AL ASSADI, Ghassan
AL-MEMMAR, Hussain
ASAROGLU, Semih Australian Labor Party (NSW Branch)
ASHRAF, Nadeem
ATIE, Zaynoun Liberal Party of Australia New South Wales Division
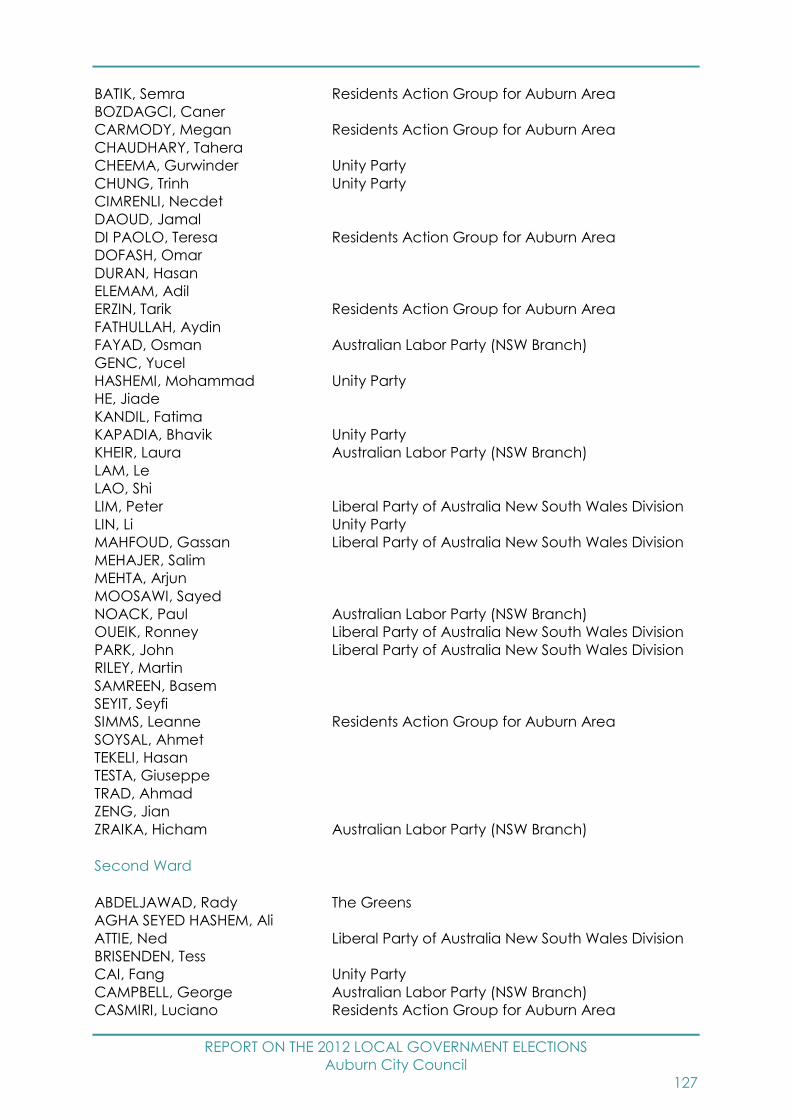
REPORT ON THE 2012 LOCAL GOVERNMENT ELECTIONS
Auburn City Council
127
BATIK, Semra Residents Action Group for Auburn Area
BOZDAGCI, Caner
CARMODY, Megan Residents Action Group for Auburn Area
CHAUDHARY, Tahera
CHEEMA, Gurwinder Unity Party
CHUNG, Trinh Unity Party
CIMRENLI, Necdet
DAOUD, Jamal
DI PAOLO, Teresa Residents Action Group for Auburn Area
DOFASH, Omar
DURAN, Hasan
ELEMAM, Adil
ERZIN, Tarik Residents Action Group for Auburn Area
FATHULLAH, Aydin
FAYAD, Osman Australian Labor Party (NSW Branch)
GENC, Yucel
HASHEMI, Mohammad Unity Party
HE, Jiade
KANDIL, Fatima
KAPADIA, Bhavik Unity Party
KHEIR, Laura Australian Labor Party (NSW Branch)
LAM, Le
LAO, Shi
LIM, Peter Liberal Party of Australia New South Wales Division
LIN, Li Unity Party
MAHFOUD, Gassan Liberal Party of Australia New South Wales Division
MEHAJER, Salim
MEHTA, Arjun
MOOSAWI, Sayed
NOACK, Paul Australian Labor Party (NSW Branch)
OUEIK, Ronney Liberal Party of Australia New South Wales Division
PARK, John Liberal Party of Australia New South Wales Division
RILEY, Martin
SAMREEN, Basem
SEYIT, Seyfi
SIMMS, Leanne Residents Action Group for Auburn Area
SOYSAL, Ahmet
TEKELI, Hasan
TESTA, Giuseppe
TRAD, Ahmad
ZENG, Jian
ZRAIKA, Hicham Australian Labor Party (NSW Branch)
Second Ward
ABDELJAWAD, Rady The Greens
AGHA SEYED HASHEM, Ali
ATTIE, Ned Liberal Party of Australia New South Wales Division
BRISENDEN, Tess
CAI, Fang Unity Party
CAMPBELL, George Australian Labor Party (NSW Branch)
CASMIRI, Luciano Residents Action Group for Auburn Area

REPORT ON THE 2012 LOCAL GOVERNMENT ELECTIONS
Auburn City Council
128
CHEN, Myra
CHOI, Young Liberal Party of Australia New South Wales Division
CHOW, Malcolm Australian Labor Party (NSW Branch)
DARIVERENLI, Mehmet Australian Labor Party (NSW Branch)
ELKHEIR, Jamal
ER, Suna
FERGUSON, Bronwyn Residents Action Group for Auburn Area
GOODWILL, Robert The Greens
HARRIS, Lisa
HUANG, Betty Liberal Party of Australia New South Wales Division
HUMADY, Talb
KALMAN, Monty The Greens
MASON, Ed Australian Labor Party (NSW Branch)
McCRORY, Anthony Residents Action Group for Auburn Area
MEHAJER, Fatima
MEHTA, Abhinav
MICHELS, Malikeh The Greens
MOESKOPS, Pieter Unity Party
NG, Conan The Greens
NGUYEN, Minh Unity Party
OLDFIELD, Tony
RAHMANI, Matin
SAVASER, Neriman Unity Party
SIMMS, Irene Residents Action Group for Auburn Area
SOUEID, Rouba
TSE, Francis
WILKINSON, Robert Residents Action Group for Auburn Area
WON, Mark Liberal Party of Australia New South Wales Division
XING, Dongyu Australian Labor Party (NSW Branch)
YANG, Steve Liberal Party of Australia New South Wales Division
YASEEN, Ahmad
YE, Rebecca Unity Party
YU, Dennis
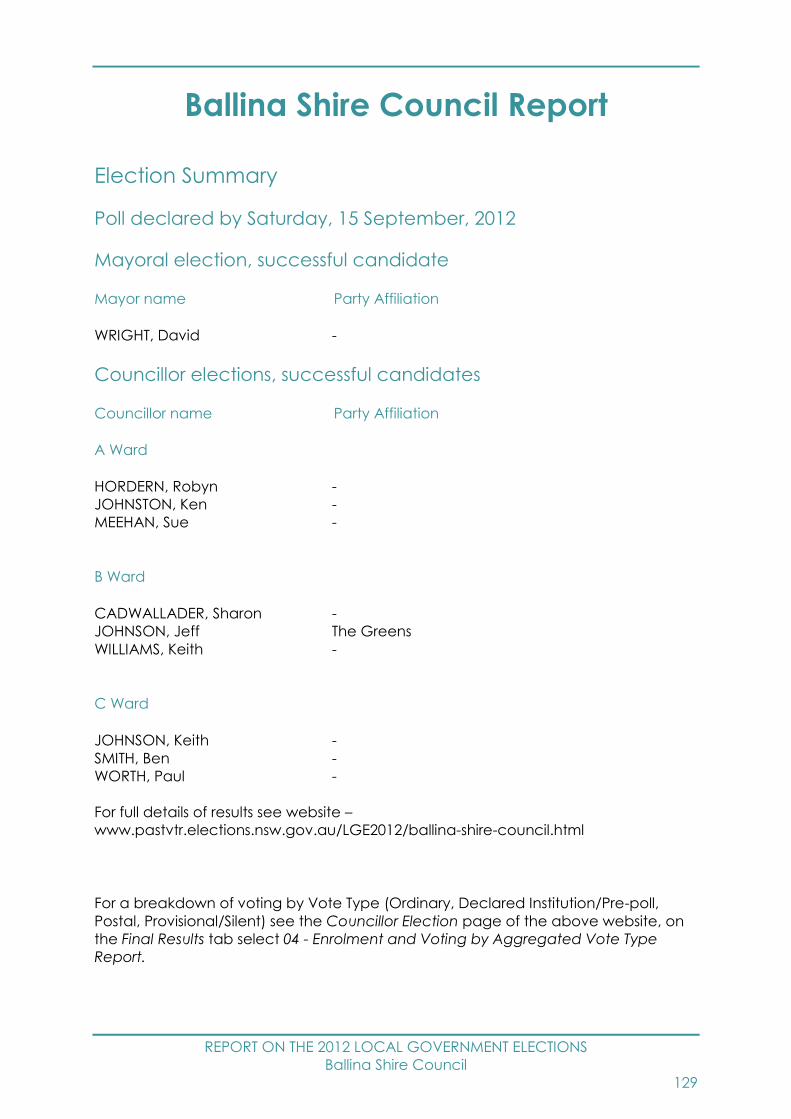
REPORT ON THE 2012 LOCAL GOVERNMENT ELECTIONS
Ballina Shire Council
129
Ballina Shire Council Report
Election Summary
Poll declared by Saturday, 15 September, 2012
Mayoral election, successful candidate
Mayor name Party Affiliation
WRIGHT, David -
Councillor elections, successful candidates
Councillor name Party Affiliation
A Ward
HORDERN, Robyn -
JOHNSTON, Ken -
MEEHAN, Sue -
B Ward
CADWALLADER, Sharon -
JOHNSON, Jeff The Greens
WILLIAMS, Keith -
C Ward
JOHNSON, Keith -
SMITH, Ben -
WORTH, Paul -
For full details of results see website –
www.pastvtr.elections.nsw.gov.au/LGE2012/ballina-shire-council.html
For a breakdown of voting by Vote Type (Ordinary, Declared Institution/Pre-poll,
Postal, Provisional/Silent) see the Councillor Election page of the above website, on
the Final Results tab select 04 - Enrolment and Voting by Aggregated Vote Type
Report.
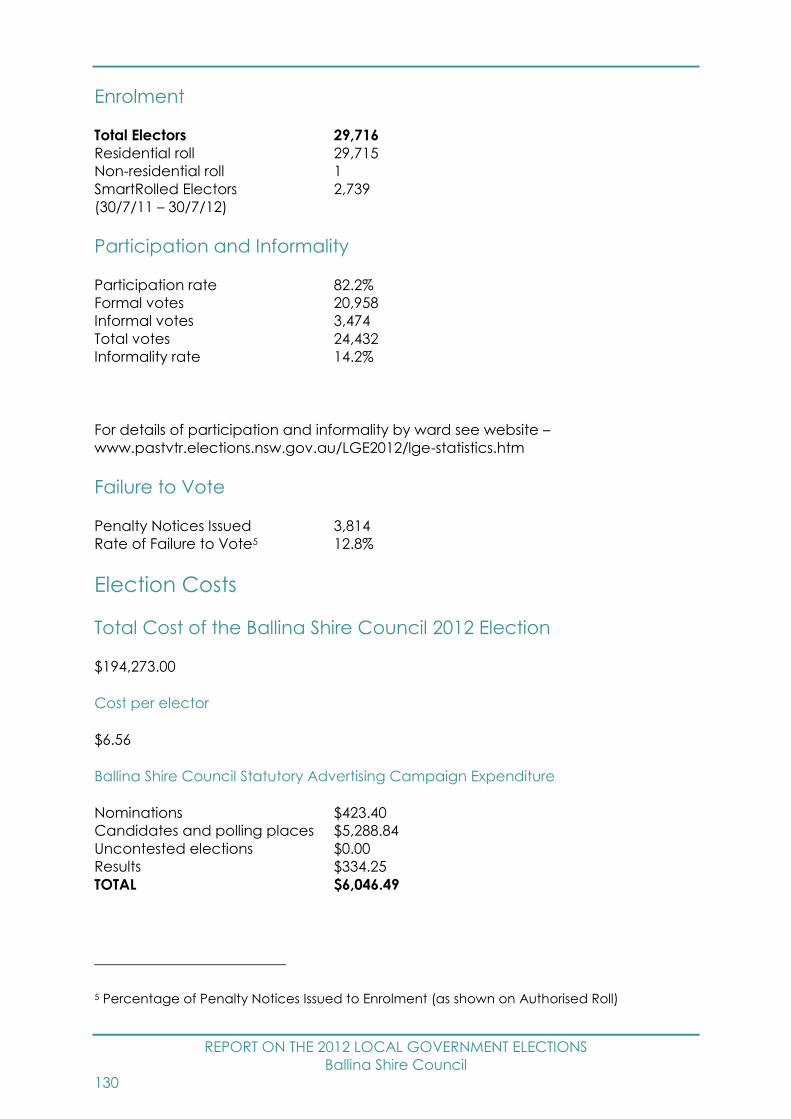
REPORT ON THE 2012 LOCAL GOVERNMENT ELECTIONS
Ballina Shire Council
130
Enrolment
Total Electors 29,716
Residential roll 29,715
Non-residential roll 1
SmartRolled Electors 2,739
(30/7/11 – 30/7/12)
Participation and Informality
Participation rate 82.2%
Formal votes 20,958
Informal votes 3,474
Total votes 24,432
Informality rate 14.2%
For details of participation and informality by ward see website –
www.pastvtr.elections.nsw.gov.au/LGE2012/lge-statistics.htm
Failure to Vote
Penalty Notices Issued 3,814
Rate of Failure to Vote5 12.8%
Election Costs
Total Cost of the Ballina Shire Council 2012 Election
$194,273.00
Cost per elector
$6.56
Ballina Shire Council Statutory Advertising Campaign Expenditure
Nominations $423.40
Candidates and polling places $5,288.84
Uncontested elections $0.00
Results $334.25
TOTAL $6,046.49
5 Percentage of Penalty Notices Issued to Enrolment (as shown on Authorised Roll)
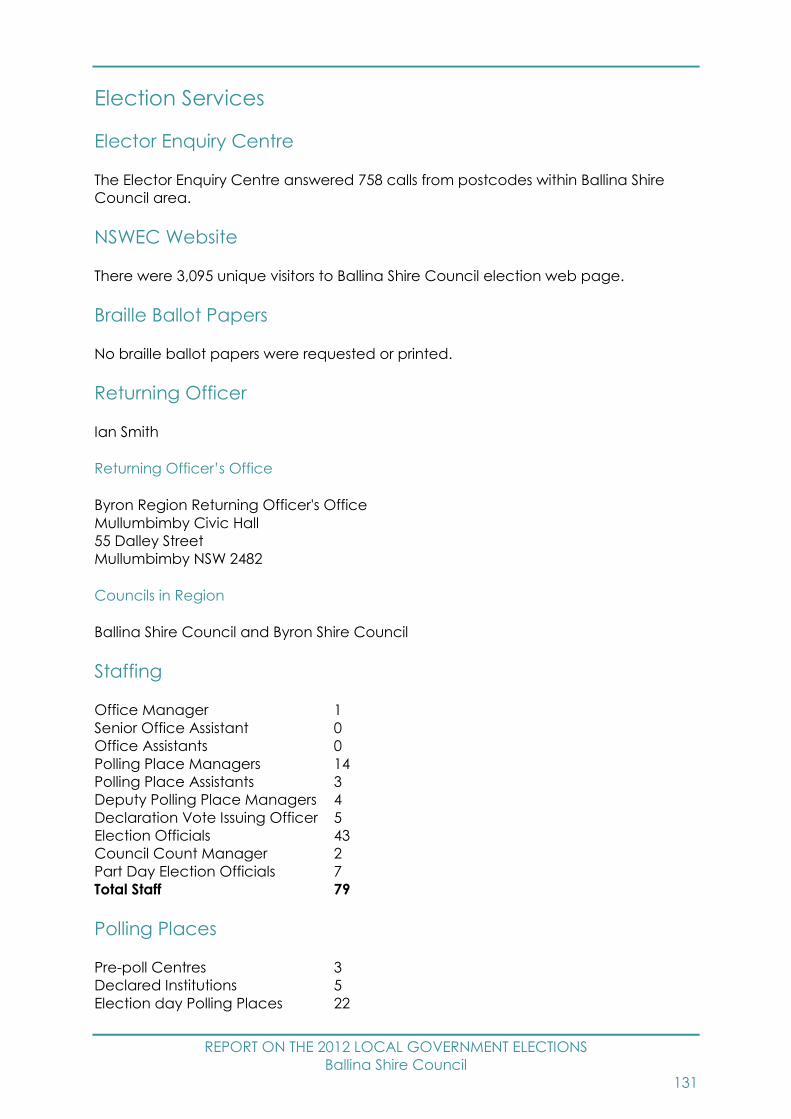
REPORT ON THE 2012 LOCAL GOVERNMENT ELECTIONS
Ballina Shire Council
131
Election Services
Elector Enquiry Centre
The Elector Enquiry Centre answered 758 calls from postcodes within Ballina Shire
Council area.
NSWEC Website
There were 3,095 unique visitors to Ballina Shire Council election web page.
Braille Ballot Papers
No braille ballot papers were requested or printed.
Returning Officer
Ian Smith
Returning Officer’s Office
Byron Region Returning Officer's Office
Mullumbimby Civic Hall
55 Dalley Street
Mullumbimby NSW 2482
Councils in Region
Ballina Shire Council and Byron Shire Council
Staffing
Office Manager 1
Senior Office Assistant 0
Office Assistants 0
Polling Place Managers 14
Polling Place Assistants 3
Deputy Polling Place Managers 4
Declaration Vote Issuing Officer 5
Election Officials 43
Council Count Manager 2
Part Day Election Officials 7
Total Staff 79
Polling Places
Pre-poll Centres 3
Declared Institutions 5
Election day Polling Places 22
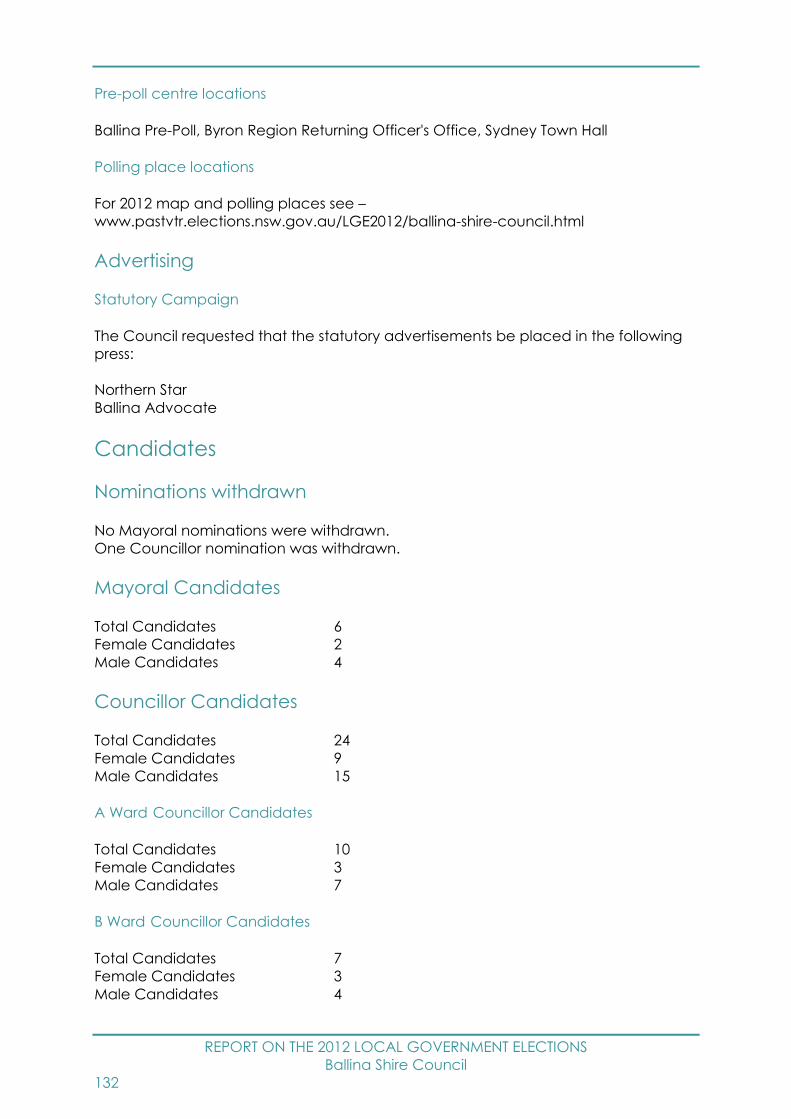
REPORT ON THE 2012 LOCAL GOVERNMENT ELECTIONS
Ballina Shire Council
132
Pre-poll centre locations
Ballina Pre-Poll, Byron Region Returning Officer's Office, Sydney Town Hall
Polling place locations
For 2012 map and polling places see –
www.pastvtr.elections.nsw.gov.au/LGE2012/ballina-shire-council.html
Advertising
Statutory Campaign
The Council requested that the statutory advertisements be placed in the following
press:
Northern Star
Ballina Advocate
Candidates
Nominations withdrawn
No Mayoral nominations were withdrawn.
One Councillor nomination was withdrawn.
Mayoral Candidates
Total Candidates 6
Female Candidates 2
Male Candidates 4
Councillor Candidates
Total Candidates 24
Female Candidates 9
Male Candidates 15
A Ward Councillor Candidates
Total Candidates 10
Female Candidates 3
Male Candidates 7
B Ward Councillor Candidates
Total Candidates 7
Female Candidates 3
Male Candidates 4
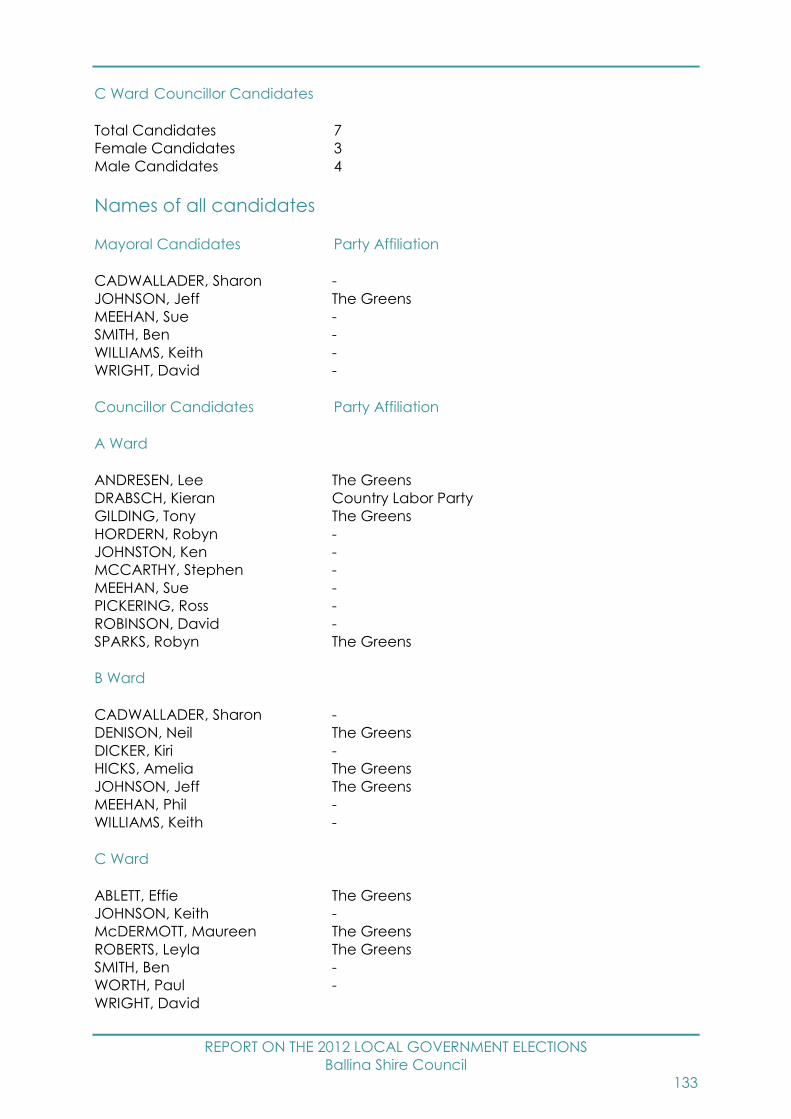
REPORT ON THE 2012 LOCAL GOVERNMENT ELECTIONS
Ballina Shire Council
133
C Ward Councillor Candidates
Total Candidates 7
Female Candidates 3
Male Candidates 4
Names of all candidates
Mayoral Candidates Party Affiliation
CADWALLADER, Sharon -
JOHNSON, Jeff The Greens
MEEHAN, Sue -
SMITH, Ben -
WILLIAMS, Keith -
WRIGHT, David -
Councillor Candidates Party Affiliation
A Ward
ANDRESEN, Lee The Greens
DRABSCH, Kieran Country Labor Party
GILDING, Tony The Greens
HORDERN, Robyn -
JOHNSTON, Ken -
MCCARTHY, Stephen -
MEEHAN, Sue -
PICKERING, Ross -
ROBINSON, David -
SPARKS, Robyn The Greens
B Ward
CADWALLADER, Sharon -
DENISON, Neil The Greens
DICKER, Kiri -
HICKS, Amelia The Greens
JOHNSON, Jeff The Greens
MEEHAN, Phil -
WILLIAMS, Keith -
C Ward
ABLETT, Effie The Greens
JOHNSON, Keith -
McDERMOTT, Maureen The Greens
ROBERTS, Leyla The Greens
SMITH, Ben -
WORTH, Paul -
WRIGHT, David
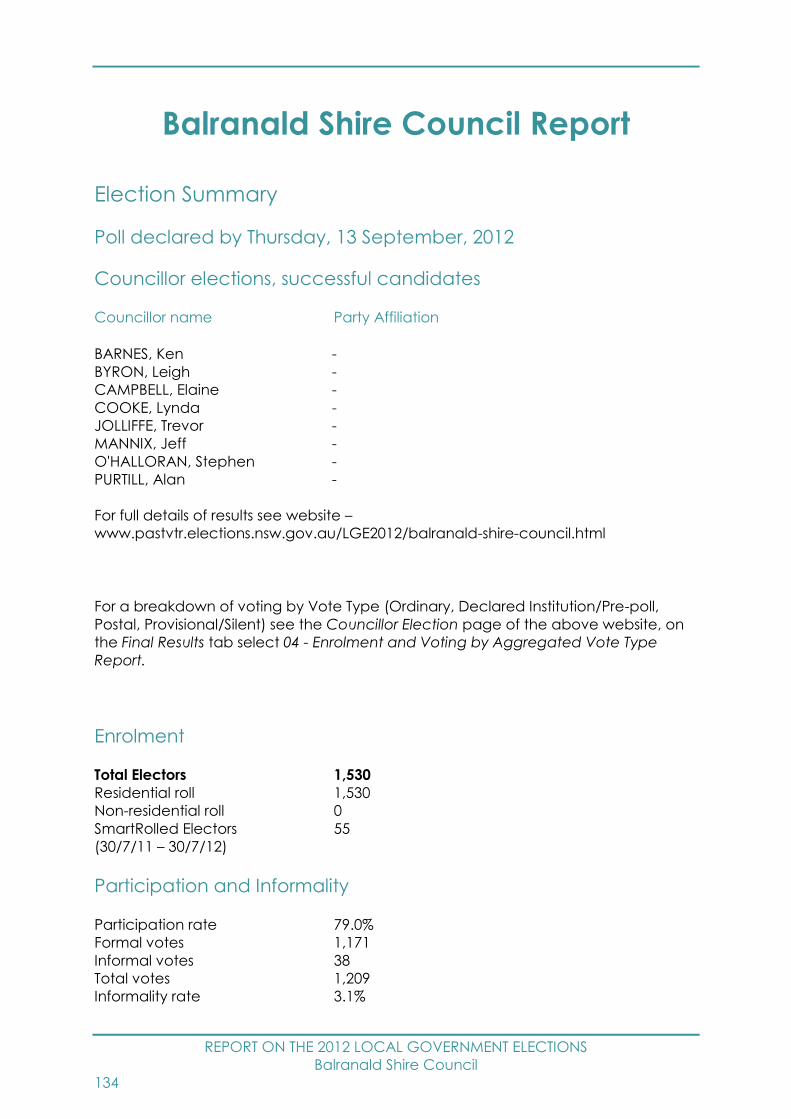
REPORT ON THE 2012 LOCAL GOVERNMENT ELECTIONS
Balranald Shire Council
134
Balranald Shire Council Report
Election Summary
Poll declared by Thursday, 13 September, 2012
Councillor elections, successful candidates
Councillor name Party Affiliation
BARNES, Ken -
BYRON, Leigh -
CAMPBELL, Elaine -
COOKE, Lynda -
JOLLIFFE, Trevor -
MANNIX, Jeff -
O'HALLORAN, Stephen -
PURTILL, Alan -
For full details of results see website –
www.pastvtr.elections.nsw.gov.au/LGE2012/balranald-shire-council.html
For a breakdown of voting by Vote Type (Ordinary, Declared Institution/Pre-poll,
Postal, Provisional/Silent) see the Councillor Election page of the above website, on
the Final Results tab select 04 - Enrolment and Voting by Aggregated Vote Type
Report.
Enrolment
Total Electors 1,530
Residential roll 1,530
Non-residential roll 0
SmartRolled Electors 55
(30/7/11 – 30/7/12)
Participation and Informality
Participation rate 79.0%
Formal votes 1,171
Informal votes 38
Total votes 1,209
Informality rate 3.1%

REPORT ON THE 2012 LOCAL GOVERNMENT ELECTIONS
Balranald Shire Council
135
Failure to Vote
Penalty Notices Issued 248
Rate of Failure to Vote6 16.3%
Election Costs
Total Cost of the Balranald Shire Council 2012 Election
$16,579.00
Cost per elector
$10.91
Balranald Shire Council Statutory Advertising Campaign Expenditure
Nominations $1,068.90
Candidates and polling places $983.37
Uncontested elections $0.00
Results $802.31
TOTAL $2,854.58
Election Services
Elector Enquiry Centre
The Elector Enquiry Centre answered 25 calls from postcodes within Balranald Shire
Council area.
NSWEC Website
There were 352 unique visitors to Balranald Shire Council election web page.
Braille Ballot Papers
No braille ballot papers were requested or printed.
Returning Officer
Peter Birnie
6 Percentage of Penalty Notices Issued to Enrolment (as shown on Authorised Roll)
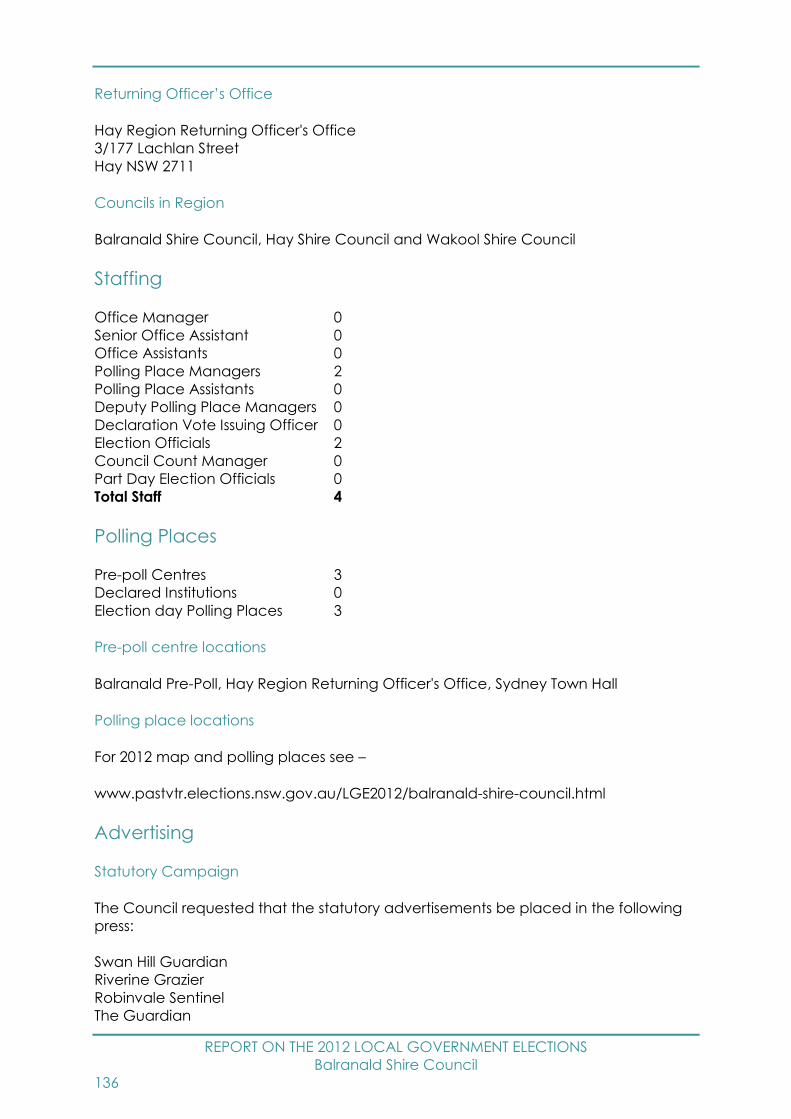
REPORT ON THE 2012 LOCAL GOVERNMENT ELECTIONS
Balranald Shire Council
136
Returning Officer’s Office
Hay Region Returning Officer's Office
3/177 Lachlan Street
Hay NSW 2711
Councils in Region
Balranald Shire Council, Hay Shire Council and Wakool Shire Council
Staffing
Office Manager 0
Senior Office Assistant 0
Office Assistants 0
Polling Place Managers 2
Polling Place Assistants 0
Deputy Polling Place Managers 0
Declaration Vote Issuing Officer 0
Election Officials 2
Council Count Manager 0
Part Day Election Officials 0
Total Staff 4
Polling Places
Pre-poll Centres 3
Declared Institutions 0
Election day Polling Places 3
Pre-poll centre locations
Balranald Pre-Poll, Hay Region Returning Officer's Office, Sydney Town Hall
Polling place locations
For 2012 map and polling places see –
www.pastvtr.elections.nsw.gov.au/LGE2012/balranald-shire-council.html
Advertising
Statutory Campaign
The Council requested that the statutory advertisements be placed in the following
press:
Swan Hill Guardian
Riverine Grazier
Robinvale Sentinel
The Guardian

REPORT ON THE 2012 LOCAL GOVERNMENT ELECTIONS
Balranald Shire Council
137
Candidates
Nominations withdrawn
No Councillor nominations were withdrawn.
Councillor Candidates
Total Candidates 11
Female Candidates 3
Male Candidates 8
Names of all candidates
Councillor Candidates Party Affiliation
BARNES, Ken -
BYRON, Leigh -
CAMPBELL, Elaine -
COOKE, Lynda -
JACKSON, John -
JOLLIFFE, Trevor -
MANNIX, Jeff -
O'HALLORAN, Stephen -
POWIS, Tina -
PURTILL, Alan -
VAARZON MOREL, Bill -
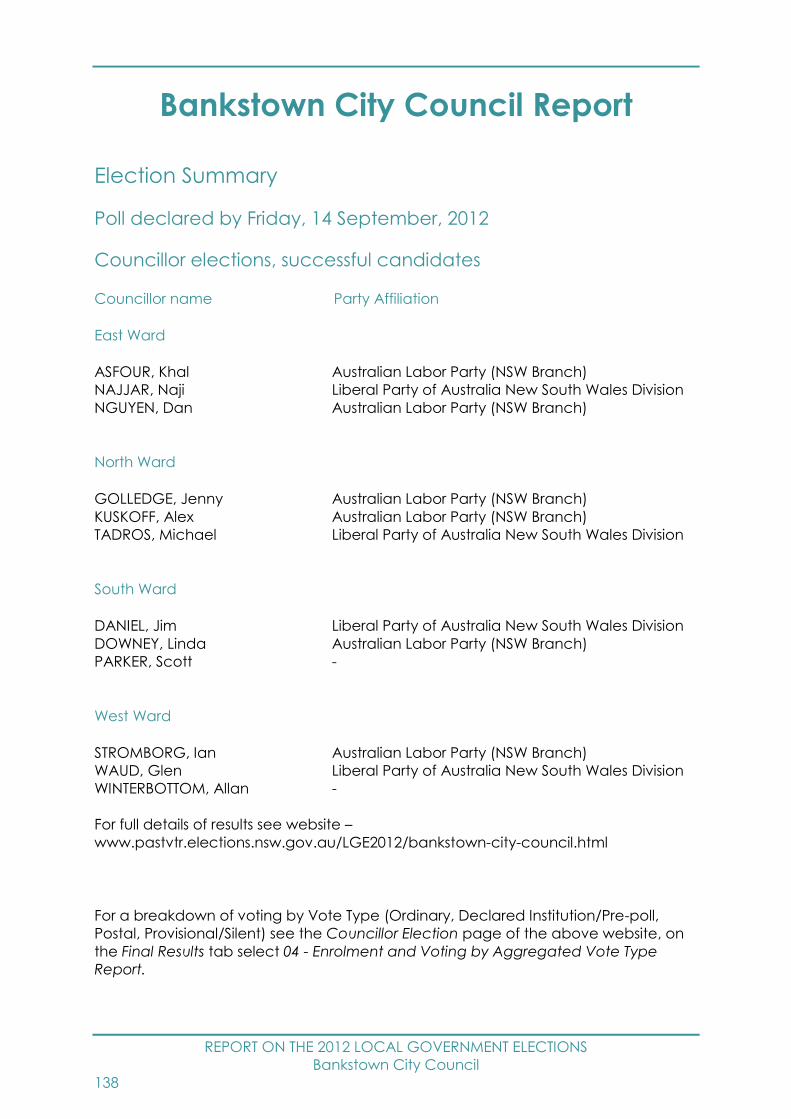
REPORT ON THE 2012 LOCAL GOVERNMENT ELECTIONS
Bankstown City Council
138
Bankstown City Council Report
Election Summary
Poll declared by Friday, 14 September, 2012
Councillor elections, successful candidates
Councillor name Party Affiliation
East Ward
ASFOUR, Khal Australian Labor Party (NSW Branch)
NAJJAR, Naji Liberal Party of Australia New South Wales Division
NGUYEN, Dan Australian Labor Party (NSW Branch)
North Ward
GOLLEDGE, Jenny Australian Labor Party (NSW Branch)
KUSKOFF, Alex Australian Labor Party (NSW Branch)
TADROS, Michael Liberal Party of Australia New South Wales Division
South Ward
DANIEL, Jim Liberal Party of Australia New South Wales Division
DOWNEY, Linda Australian Labor Party (NSW Branch)
PARKER, Scott -
West Ward
STROMBORG, Ian Australian Labor Party (NSW Branch)
WAUD, Glen Liberal Party of Australia New South Wales Division
WINTERBOTTOM, Allan -
For full details of results see website –
www.pastvtr.elections.nsw.gov.au/LGE2012/bankstown-city-council.html
For a breakdown of voting by Vote Type (Ordinary, Declared Institution/Pre-poll,
Postal, Provisional/Silent) see the Councillor Election page of the above website, on
the Final Results tab select 04 - Enrolment and Voting by Aggregated Vote Type
Report.
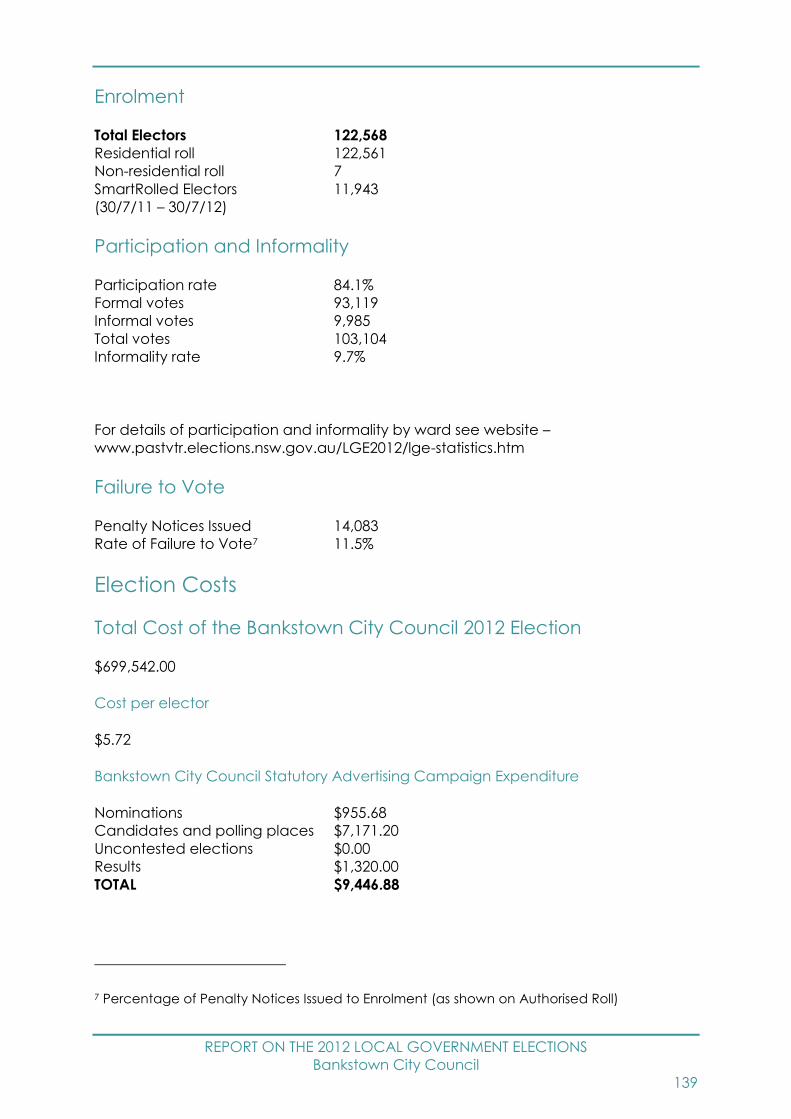
REPORT ON THE 2012 LOCAL GOVERNMENT ELECTIONS
Bankstown City Council
139
Enrolment
Total Electors 122,568
Residential roll 122,561
Non-residential roll 7
SmartRolled Electors 11,943
(30/7/11 – 30/7/12)
Participation and Informality
Participation rate 84.1%
Formal votes 93,119
Informal votes 9,985
Total votes 103,104
Informality rate 9.7%
For details of participation and informality by ward see website –
www.pastvtr.elections.nsw.gov.au/LGE2012/lge-statistics.htm
Failure to Vote
Penalty Notices Issued 14,083
Rate of Failure to Vote7 11.5%
Election Costs
Total Cost of the Bankstown City Council 2012 Election
$699,542.00
Cost per elector
$5.72
Bankstown City Council Statutory Advertising Campaign Expenditure
Nominations $955.68
Candidates and polling places $7,171.20
Uncontested elections $0.00
Results $1,320.00
TOTAL $9,446.88
7 Percentage of Penalty Notices Issued to Enrolment (as shown on Authorised Roll)

REPORT ON THE 2012 LOCAL GOVERNMENT ELECTIONS
Bankstown City Council
140
Election Services
Elector Enquiry Centre
The Elector Enquiry Centre answered 1,995 calls from postcodes within Bankstown
City Council area.
NSWEC Website
There were 9,326 unique visitors to Bankstown City Council election web page.
Braille Ballot Papers
No braille ballot papers were requested or printed.
Returning Officer
Garry Mortimer
Returning Officer’s Office
Bankstown Returning Officer's Office
Bankstown Civic Tower
Level 7, 66-72 Rickard Road
Bankstown NSW 2200
Staffing
Office Manager 1
Senior Office Assistant 0
Office Assistants 35
Polling Place Managers 44
Polling Place Assistants 0
Deputy Polling Place Managers 32
Declaration Vote Issuing Officer 39
Election Officials 243
Council Count Manager 0
Part Day Election Officials 41
Total Staff 435
Polling Places
Pre-poll Centres 2
Declared Institutions 11
Election day Polling Places 62
Pre-poll centre locations
Bankstown Returning Officer's Office, Sydney Town Hall

REPORT ON THE 2012 LOCAL GOVERNMENT ELECTIONS
Bankstown City Council
141
Polling place locations
For 2012 map and polling places see –
www.pastvtr.elections.nsw.gov.au/LGE2012/bankstown-city-council.html
Advertising
Statutory Campaign
The Council requested that the statutory advertisements be placed in the following
press:
Express
Bankstown Torch
Candidates
Nominations withdrawn
No Councillor nominations were withdrawn.
Councillor Candidates
Total Candidates 49
Female Candidates 15
Male Candidates 34
East Ward Councillor Candidates
Total Candidates 12
Female Candidates 2
Male Candidates 10
North Ward Councillor Candidates
Total Candidates 15
Female Candidates 7
Male Candidates 8
South Ward Councillor Candidates
Total Candidates 9
Female Candidates 3
Male Candidates 6
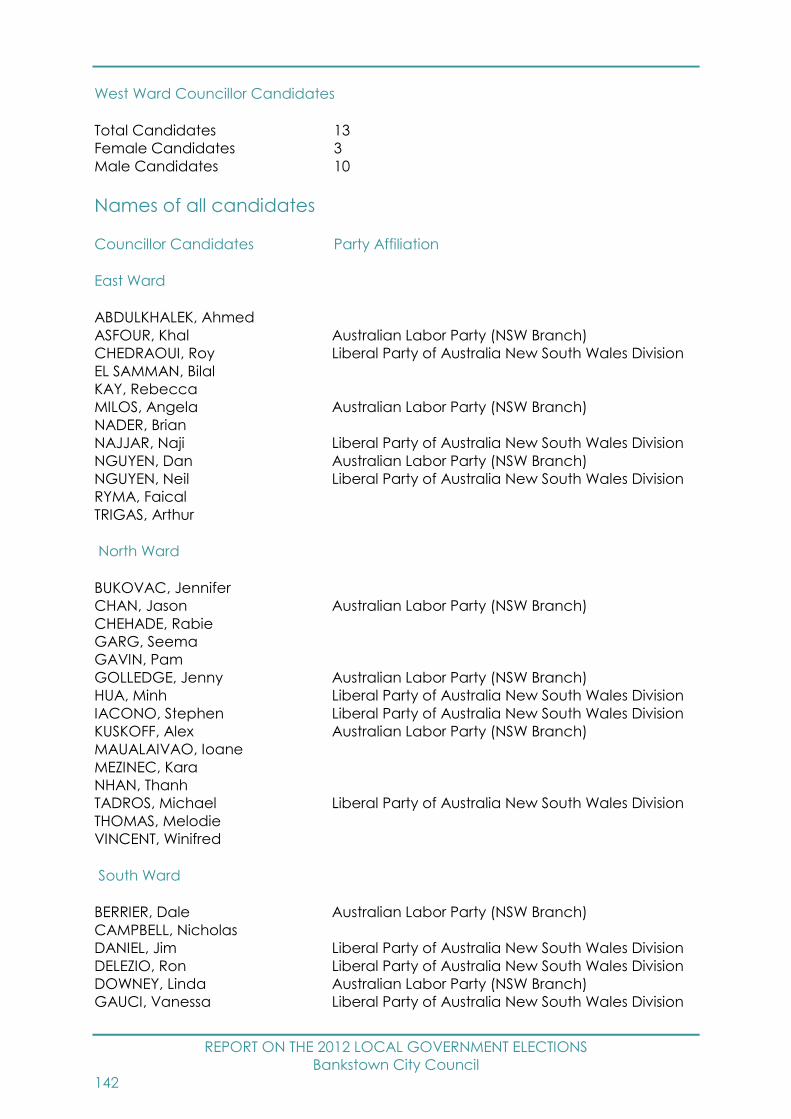
REPORT ON THE 2012 LOCAL GOVERNMENT ELECTIONS
Bankstown City Council
142
West Ward Councillor Candidates
Total Candidates 13
Female Candidates 3
Male Candidates 10
Names of all candidates
Councillor Candidates Party Affiliation
East Ward
ABDULKHALEK, Ahmed
ASFOUR, Khal Australian Labor Party (NSW Branch)
CHEDRAOUI, Roy Liberal Party of Australia New South Wales Division
EL SAMMAN, Bilal
KAY, Rebecca
MILOS, Angela Australian Labor Party (NSW Branch)
NADER, Brian
NAJJAR, Naji Liberal Party of Australia New South Wales Division
NGUYEN, Dan Australian Labor Party (NSW Branch)
NGUYEN, Neil Liberal Party of Australia New South Wales Division
RYMA, Faical
TRIGAS, Arthur
North Ward
BUKOVAC, Jennifer
CHAN, Jason Australian Labor Party (NSW Branch)
CHEHADE, Rabie
GARG, Seema
GAVIN, Pam
GOLLEDGE, Jenny Australian Labor Party (NSW Branch)
HUA, Minh Liberal Party of Australia New South Wales Division
IACONO, Stephen Liberal Party of Australia New South Wales Division
KUSKOFF, Alex Australian Labor Party (NSW Branch)
MAUALAIVAO, Ioane
MEZINEC, Kara
NHAN, Thanh
TADROS, Michael Liberal Party of Australia New South Wales Division
THOMAS, Melodie
VINCENT, Winifred
South Ward
BERRIER, Dale Australian Labor Party (NSW Branch)
CAMPBELL, Nicholas
DANIEL, Jim Liberal Party of Australia New South Wales Division
DELEZIO, Ron Liberal Party of Australia New South Wales Division
DOWNEY, Linda Australian Labor Party (NSW Branch)
GAUCI, Vanessa Liberal Party of Australia New South Wales Division
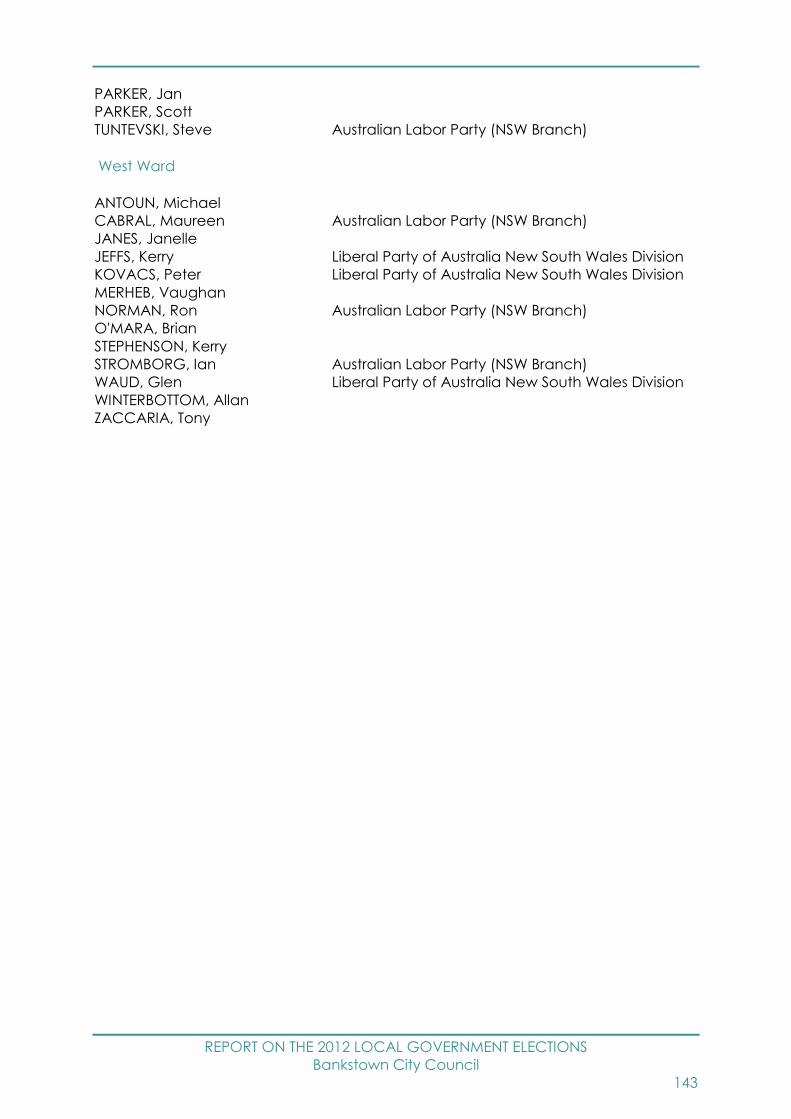
REPORT ON THE 2012 LOCAL GOVERNMENT ELECTIONS
Bankstown City Council
143
PARKER, Jan
PARKER, Scott
TUNTEVSKI, Steve Australian Labor Party (NSW Branch)
West Ward
ANTOUN, Michael
CABRAL, Maureen Australian Labor Party (NSW Branch)
JANES, Janelle
JEFFS, Kerry Liberal Party of Australia New South Wales Division
KOVACS, Peter Liberal Party of Australia New South Wales Division
MERHEB, Vaughan
NORMAN, Ron Australian Labor Party (NSW Branch)
O'MARA, Brian
STEPHENSON, Kerry
STROMBORG, Ian Australian Labor Party (NSW Branch)
WAUD, Glen Liberal Party of Australia New South Wales Division
WINTERBOTTOM, Allan
ZACCARIA, Tony
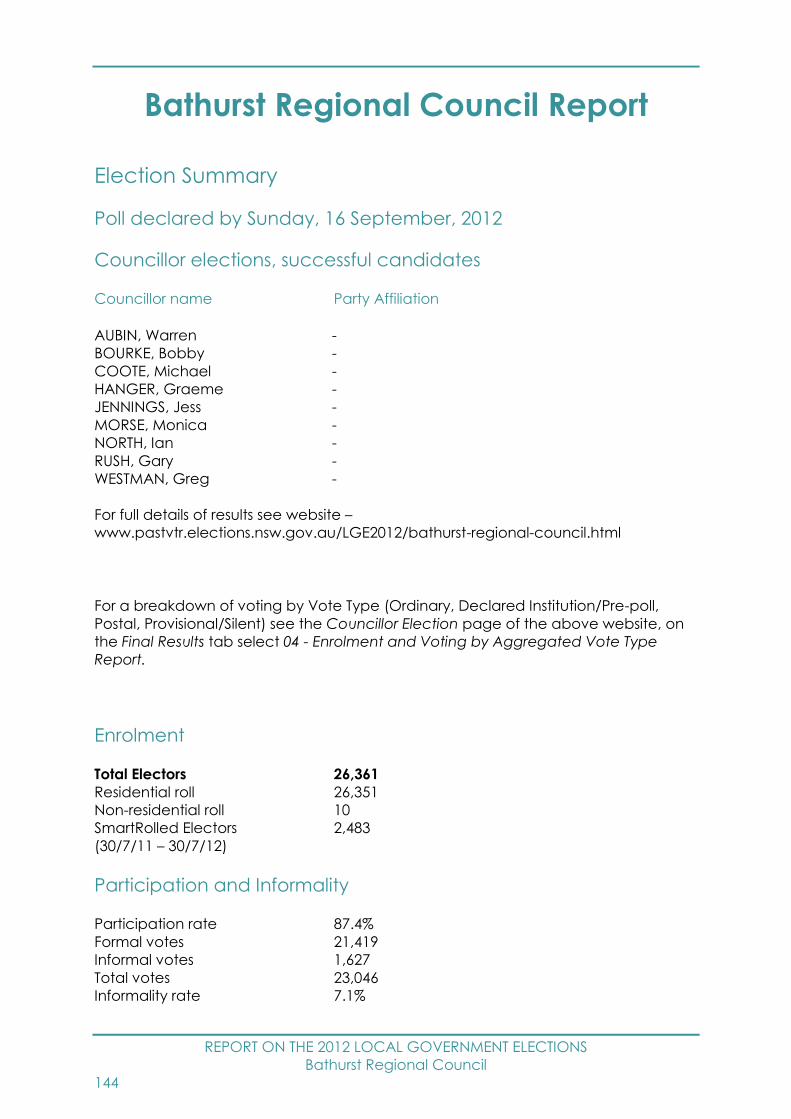
REPORT ON THE 2012 LOCAL GOVERNMENT ELECTIONS
Bathurst Regional Council
144
Bathurst Regional Council Report
Election Summary
Poll declared by Sunday, 16 September, 2012
Councillor elections, successful candidates
Councillor name Party Affiliation
AUBIN, Warren -
BOURKE, Bobby -
COOTE, Michael -
HANGER, Graeme -
JENNINGS, Jess -
MORSE, Monica -
NORTH, Ian -
RUSH, Gary -
WESTMAN, Greg -
For full details of results see website –
www.pastvtr.elections.nsw.gov.au/LGE2012/bathurst-regional-council.html
For a breakdown of voting by Vote Type (Ordinary, Declared Institution/Pre-poll,
Postal, Provisional/Silent) see the Councillor Election page of the above website, on
the Final Results tab select 04 - Enrolment and Voting by Aggregated Vote Type
Report.
Enrolment
Total Electors 26,361
Residential roll 26,351
Non-residential roll 10
SmartRolled Electors 2,483
(30/7/11 – 30/7/12)
Participation and Informality
Participation rate 87.4%
Formal votes 21,419
Informal votes 1,627
Total votes 23,046
Informality rate 7.1%
REPORT ON THE 2012 LOCAL GOVERNMENT ELECTIONS
Bathurst Regional Council
145
Failure to Vote
Penalty Notices Issued 2,528
Rate of Failure to Vote8 9.6%
Election Costs
Total Cost of the Bathurst Regional Council 2012 Election
$212,493.00
Cost per elector
$8.08
Bathurst Regional Council Statutory Advertising Campaign Expenditure
Nominations $912.00
Candidates and polling places $3,904.60
Uncontested elections $0.00
Results $342.00
TOTAL $5,158.60
Election Services
Elector Enquiry Centre
The Elector Enquiry Centre answered 184 calls from postcodes within Bathurst
Regional Council area.
NSWEC Website
There were 2,739 unique visitors to Bathurst Regional Council election web page.
Braille Ballot Papers
No braille ballot papers were requested or printed.
Returning Officer
Stuart Evennett
8 Percentage of Penalty Notices Issued to Enrolment (as shown on Authorised Roll)
REPORT ON THE 2012 LOCAL GOVERNMENT ELECTIONS
Bathurst Regional Council
146
Returning Officer’s Office
Bathurst Region Returning Officer's Office
126 Bentinck Street
Bathurst NSW 2795
Councils in Region
Bathurst Regional Council, Blayney Shire Council and Oberon Council
Staffing
Office Manager 1
Senior Office Assistant 0
Office Assistants 44
Polling Place Managers 18
Polling Place Assistants 0
Deputy Polling Place Managers 3
Declaration Vote Issuing Officer 3
Election Officials 42
Council Count Manager 0
Part Day Election Officials 3
Total Staff 114
Polling Places
Pre-poll Centres 2
Declared Institutions 6
Election day Polling Places 19
Pre-poll centre locations
Bathurst Region Returning Officer's Office, Sydney Town Hall
Polling place locations
For 2012 map and polling places see –
www.pastvtr.elections.nsw.gov.au/LGE2012/bathurst-regional-council.html
Advertising
Statutory Campaign
The Council requested that the statutory advertisements be placed in the following
press:
Western Advocate

REPORT ON THE 2012 LOCAL GOVERNMENT ELECTIONS
Bathurst Regional Council
147
Candidates
Nominations withdrawn
No Councillor nominations were withdrawn.
Councillor Candidates
Total Candidates 35
Female Candidates 12
Male Candidates 23
Names of all candidates
Councillor Candidates Party Affiliation
AUBIN, Warren -
BLANCH, Jill -
BOOTH, Alysha -
BOURKE, Bobby -
BRADBERY, Pat -
BREEN, Linda -
BREMNER, Keith -
CONOLAN, Katherine -
COOTE, Michael -
CRISP, Gordon -
DIVE, Rhys -
DUNN, Michelle -
FORDE, Mick -
FRY, Geoff -
HANGER, Graeme -
HAYSOM, Paul -
JENNINGS, Jess -
KENNEDY, Marion -
LARNACH, Derek -
LONG, Jillian -
MORSE, Monica -
MULLIGAN, Sharon -
MURRAY, Wal -
NORTH, Ian -
OASTLER, Greg -
PACKHAM, Nick -
PETERSON, George -
RICH, Lee -
RILEY, Di -
RUSH, Gary -
SHUTE, Kevin -
SMITH, Kate -
REPORT ON THE 2012 LOCAL GOVERNMENT ELECTIONS
Bathurst Regional Council
148
TANNER, Tim -
THORPE, Tony -
WESTMAN, Greg -

REPORT ON THE 2012 LOCAL GOVERNMENT ELECTIONS
Bega Valley Shire Council
149
Bega Valley Shire Council Report
Election Summary
Poll declared by Friday, 14 September, 2012
Councillor elections, successful candidates
Councillor name Party Affiliation
ALLEN, Tony -
BRITTEN, Mike -
FITZPATRICK, Russell -
HUGHES, Keith The Greens
MAWHINNEY, Ann -
McBAIN, Kristy -
SECKOLD, Liz -
TAPSCOTT, Sharon -
TAYLOR, Bill -
For full details of results see website –
www.pastvtr.elections.nsw.gov.au/LGE2012/bega-valley-shire-council.html
For a breakdown of voting by Vote Type (Ordinary, Declared Institution/Pre-poll,
Postal, Provisional/Silent) see the Councillor Election page of the above website, on
the Final Results tab select 04 - Enrolment and Voting by Aggregated Vote Type
Report.
Poll
"Do you support the retention of the Pambula District Hospital funded at current total
operational budget levels by NSW State Government for a period of 5 years, at
approximately $7.5 million pa, from the completion and official opening of the
proposed new regional hospital, so as to provide the essential services needed to
supplement the new hospital during this period?"
Yes 15,761
No 3,335

REPORT ON THE 2012 LOCAL GOVERNMENT ELECTIONS
Bega Valley Shire Council
150
Enrolment
Total Electors 24,351
Residential roll 24,344
Non-residential roll 7
SmartRolled Electors 1,466
(30/7/11 – 30/7/12)
Participation and Informality
Participation rate 81.5%
Formal votes 18,175
Informal votes 1,672
Total votes 19,847
Informality rate 8.4%
Failure to Vote
Penalty Notices Issued 3,302
Rate of Failure to Vote9 13.6%
Election Costs
Total Cost of the Bega Valley Shire Council 2012 Election
$178,926.00
Cost per elector
$7.37
Bega Valley Shire Council Statutory Advertising Campaign Expenditure
Nominations $648.00
Candidates and polling places $1,915.20
Uncontested elections $0.00
Results $556.70
TOTAL $3,119.90
9 Percentage of Penalty Notices Issued to Enrolment (as shown on Authorised Roll)
REPORT ON THE 2012 LOCAL GOVERNMENT ELECTIONS
Bega Valley Shire Council
151
Election Services
Elector Enquiry Centre
The Elector Enquiry Centre answered 415 calls from postcodes within Bega Valley
Shire Council area.
NSWEC Website
There were 1,928 unique visitors to Bega Valley Shire Council election web page.
Braille Ballot Papers
No braille ballot papers were requested or printed.
Returning Officer
Susan Flannery
Returning Officer’s Office
Bega Region Returning Officer's Office
70 Gipps Street
(Former Retravision Store)
Bega NSW 2550
Councils in Region
Bega Valley Shire Council and Eurobodalla Shire Council
Staffing
Office Manager 1
Senior Office Assistant 0
Office Assistants 51
Polling Place Managers 17
Polling Place Assistants 0
Deputy Polling Place Managers 2
Declaration Vote Issuing Officer 0
Election Officials 37
Council Count Manager 0
Part Day Election Officials 1
Total Staff 109
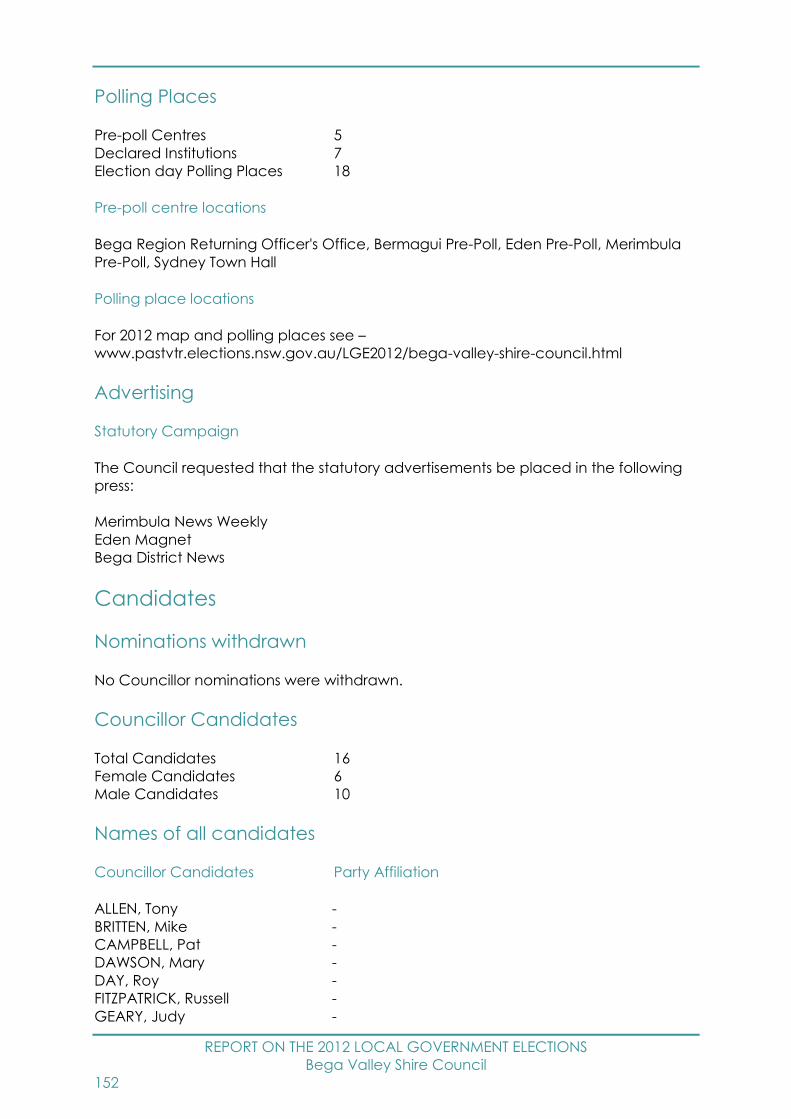
REPORT ON THE 2012 LOCAL GOVERNMENT ELECTIONS
Bega Valley Shire Council
152
Polling Places
Pre-poll Centres 5
Declared Institutions 7
Election day Polling Places 18
Pre-poll centre locations
Bega Region Returning Officer's Office, Bermagui Pre-Poll, Eden Pre-Poll, Merimbula
Pre-Poll, Sydney Town Hall
Polling place locations
For 2012 map and polling places see –
www.pastvtr.elections.nsw.gov.au/LGE2012/bega-valley-shire-council.html
Advertising
Statutory Campaign
The Council requested that the statutory advertisements be placed in the following
press:
Merimbula News Weekly
Eden Magnet
Bega District News
Candidates
Nominations withdrawn
No Councillor nominations were withdrawn.
Councillor Candidates
Total Candidates 16
Female Candidates 6
Male Candidates 10
Names of all candidates
Councillor Candidates Party Affiliation
ALLEN, Tony -
BRITTEN, Mike -
CAMPBELL, Pat -
DAWSON, Mary -
DAY, Roy -
FITZPATRICK, Russell -
GEARY, Judy -
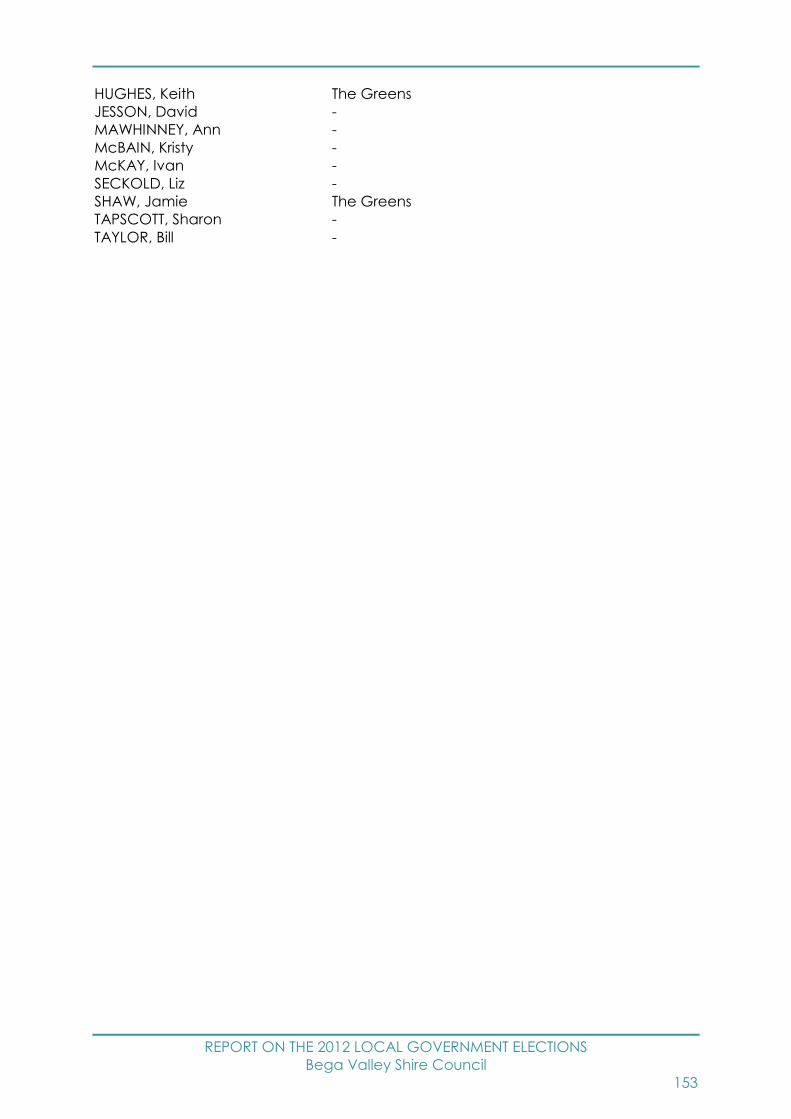
REPORT ON THE 2012 LOCAL GOVERNMENT ELECTIONS
Bega Valley Shire Council
153
HUGHES, Keith The Greens
JESSON, David -
MAWHINNEY, Ann -
McBAIN, Kristy -
McKAY, Ivan -
SECKOLD, Liz -
SHAW, Jamie The Greens
TAPSCOTT, Sharon -
TAYLOR, Bill -
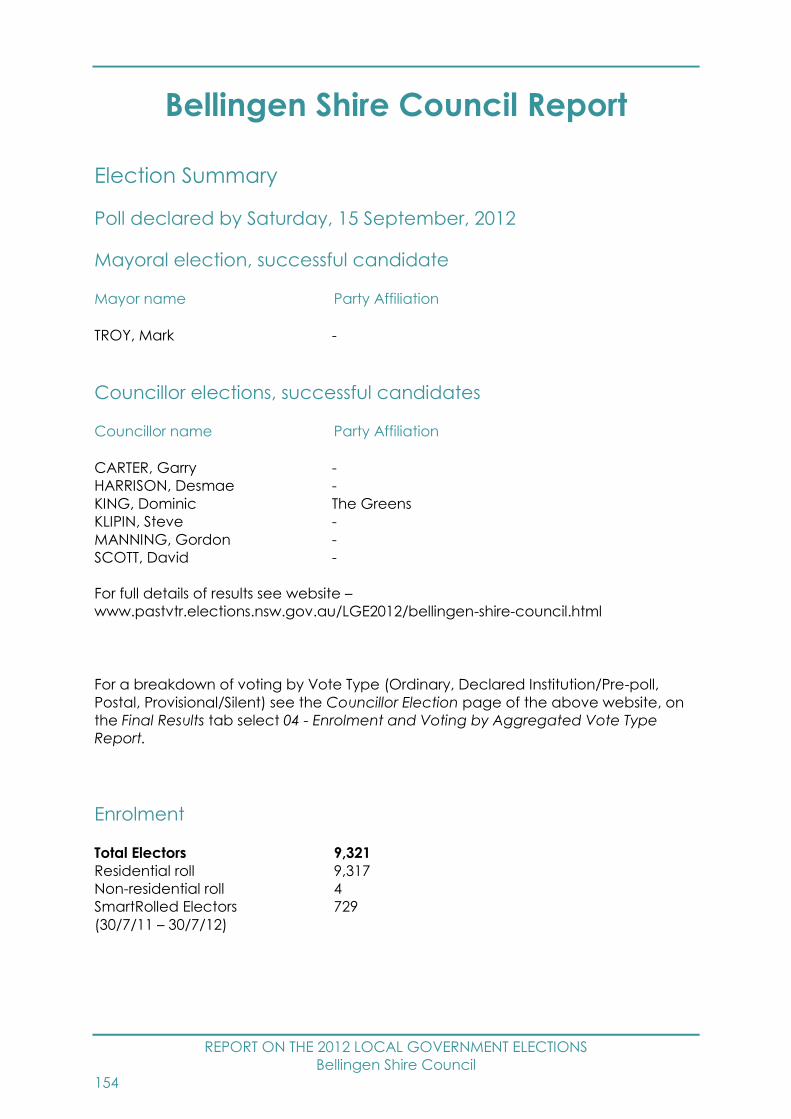
REPORT ON THE 2012 LOCAL GOVERNMENT ELECTIONS
Bellingen Shire Council
154
Bellingen Shire Council Report
Election Summary
Poll declared by Saturday, 15 September, 2012
Mayoral election, successful candidate
Mayor name Party Affiliation
TROY, Mark -
Councillor elections, successful candidates
Councillor name Party Affiliation
CARTER, Garry -
HARRISON, Desmae -
KING, Dominic The Greens
KLIPIN, Steve -
MANNING, Gordon -
SCOTT, David -
For full details of results see website –
www.pastvtr.elections.nsw.gov.au/LGE2012/bellingen-shire-council.html
For a breakdown of voting by Vote Type (Ordinary, Declared Institution/Pre-poll,
Postal, Provisional/Silent) see the Councillor Election page of the above website, on
the Final Results tab select 04 - Enrolment and Voting by Aggregated Vote Type
Report.
Enrolment
Total Electors 9,321
Residential roll 9,317
Non-residential roll 4
SmartRolled Electors 729
(30/7/11 – 30/7/12)

REPORT ON THE 2012 LOCAL GOVERNMENT ELECTIONS
Bellingen Shire Council
155
Participation and Informality
Participation rate 82.8%
Formal votes 7,259
Informal votes 459
Total votes 7,718
Informality rate 5.9%
Failure to Vote
Penalty Notices Issued 1,185
Rate of Failure to Vote10 12.7%
Election Costs
Total Cost of the Bellingen Shire Council 2012 Election
$75,459.00
Cost per elector
$8.11
Bellingen Shire Council Statutory Advertising Campaign Expenditure
Nominations $707.72
Candidates and polling places $2,393.98
Uncontested elections $0.00
Results $475.69
TOTAL $3,577.39
Election Services
Elector Enquiry Centre
The Elector Enquiry Centre answered 132 calls from postcodes within Bellingen Shire
Council area.
NSWEC Website
There were 1,070 unique visitors to Bellingen Shire Council election web page.
10 Percentage of Penalty Notices Issued to Enrolment (as shown on Authorised Roll)

REPORT ON THE 2012 LOCAL GOVERNMENT ELECTIONS
Bellingen Shire Council
156
Braille Ballot Papers
No braille ballot papers were requested or printed.
Returning Officer
Susan Mowle
Returning Officer’s Office
Nambucca Region Returning Officer's Office
1 Cooper Street
Macksville NSW 2447
Councils in Region
Bellingen Shire Council and Nambucca Shire Council
Staffing
Office Manager 1
Senior Office Assistant 0
Office Assistants 0
Polling Place Managers 8
Polling Place Assistants 2
Deputy Polling Place Managers 2
Declaration Vote Issuing Officer 1
Election Officials 17
Council Count Manager 0
Part Day Election Officials 1
Total Staff 32
Polling Places
Pre-poll Centres 3
Declared Institutions 2
Election day Polling Places 9
Pre-poll centre locations
Bellingen Pre-Poll, Nambucca Region Returning Officer's Office, Sydney Town Hall
Polling place locations
For 2012 map and polling places see –
www.pastvtr.elections.nsw.gov.au/LGE2012/bellingen-shire-council.html
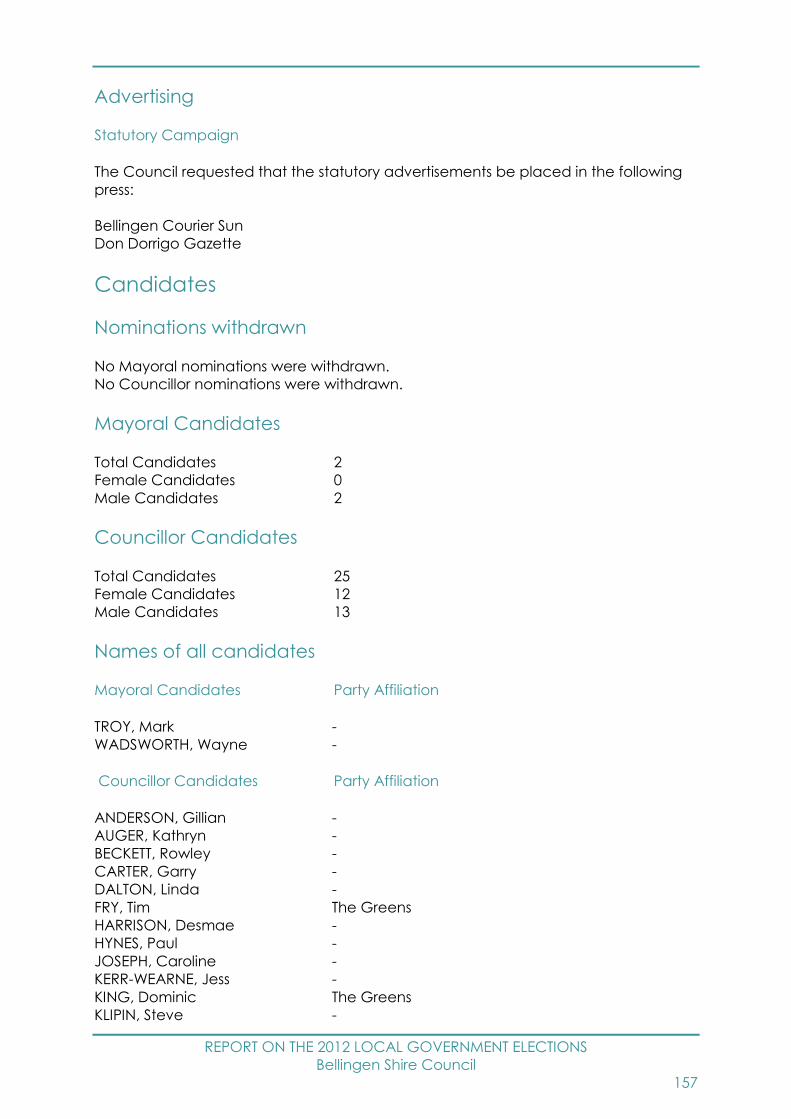
REPORT ON THE 2012 LOCAL GOVERNMENT ELECTIONS
Bellingen Shire Council
157
Advertising
Statutory Campaign
The Council requested that the statutory advertisements be placed in the following
press:
Bellingen Courier Sun
Don Dorrigo Gazette
Candidates
Nominations withdrawn
No Mayoral nominations were withdrawn.
No Councillor nominations were withdrawn.
Mayoral Candidates
Total Candidates 2
Female Candidates 0
Male Candidates 2
Councillor Candidates
Total Candidates 25
Female Candidates 12
Male Candidates 13
Names of all candidates
Mayoral Candidates Party Affiliation
TROY, Mark -
WADSWORTH, Wayne -
Councillor Candidates Party Affiliation
ANDERSON, Gillian -
AUGER, Kathryn -
BECKETT, Rowley -
CARTER, Garry -
DALTON, Linda -
FRY, Tim The Greens
HARRISON, Desmae -
HYNES, Paul -
JOSEPH, Caroline -
KERR-WEARNE, Jess -
KING, Dominic The Greens
KLIPIN, Steve -

REPORT ON THE 2012 LOCAL GOVERNMENT ELECTIONS
Bellingen Shire Council
158
MANNING, Gordon -
McPHEE, Greg -
ROSE, Debbie -
SCOTT, David -
SHAW, Kenton -
SHAW, Kim -
STOCKTON, Michelle -
TAYLOR, Bryony -
TINDALL, Gabrielle The Greens
TROY, Mark -
VERNON, Carol The Greens
WADSWORTH, Wayne -
WICKERT, Rosie -
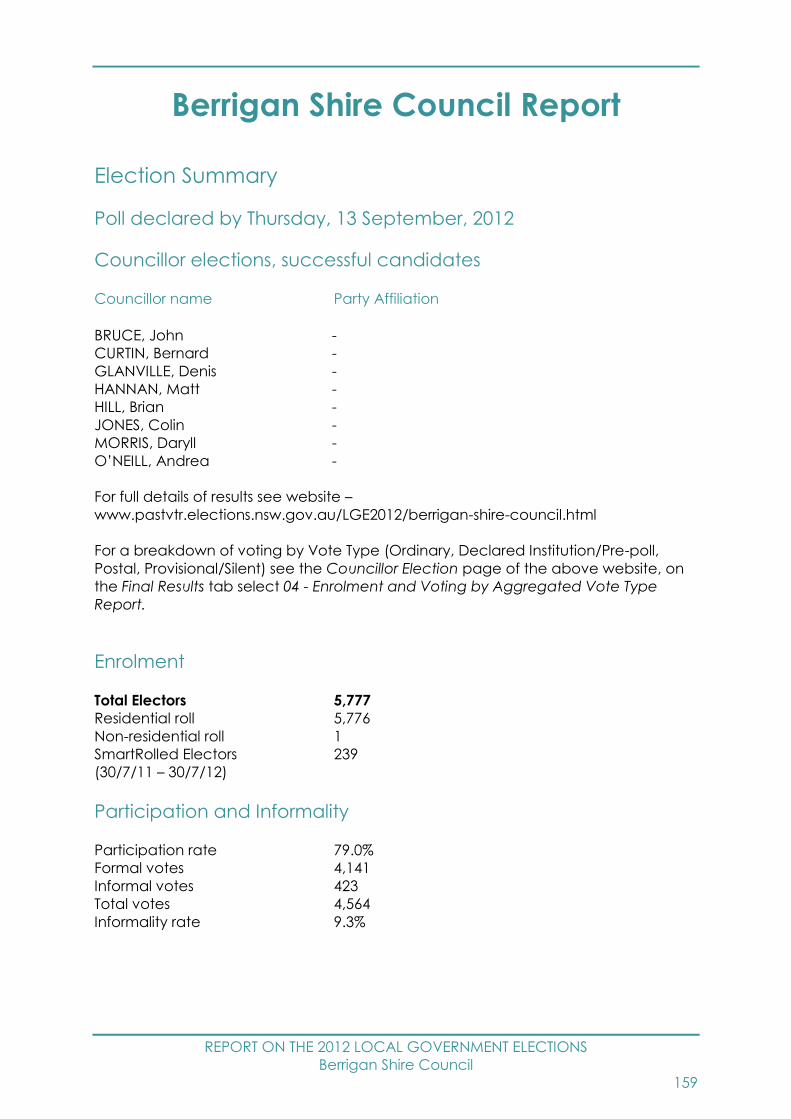
REPORT ON THE 2012 LOCAL GOVERNMENT ELECTIONS
Berrigan Shire Council
159
Berrigan Shire Council Report
Election Summary
Poll declared by Thursday, 13 September, 2012
Councillor elections, successful candidates
Councillor name Party Affiliation
BRUCE, John -
CURTIN, Bernard -
GLANVILLE, Denis -
HANNAN, Matt -
HILL, Brian -
JONES, Colin -
MORRIS, Daryll -
O’NEILL, Andrea -
For full details of results see website –
www.pastvtr.elections.nsw.gov.au/LGE2012/berrigan-shire-council.html
For a breakdown of voting by Vote Type (Ordinary, Declared Institution/Pre-poll,
Postal, Provisional/Silent) see the Councillor Election page of the above website, on
the Final Results tab select 04 - Enrolment and Voting by Aggregated Vote Type
Report.
Enrolment
Total Electors 5,777
Residential roll 5,776
Non-residential roll 1
SmartRolled Electors 239
(30/7/11 – 30/7/12)
Participation and Informality
Participation rate 79.0%
Formal votes 4,141
Informal votes 423
Total votes 4,564
Informality rate 9.3%

REPORT ON THE 2012 LOCAL GOVERNMENT ELECTIONS
Berrigan Shire Council
160
Failure to Vote
Penalty Notices Issued 939
Rate of Failure to Vote11 16.3%
Election Costs
Total Cost of the Berrigan Shire Council 2012 Election
$48,845.00
Cost per elector
$8.50
Berrigan Shire Council Statutory Advertising Campaign Expenditure
Nominations $687.52
Candidates and polling places $500.00
Uncontested elections $0.00
Results $317.85
TOTAL $1,505.37
Election Services
Elector Enquiry Centre
The Elector Enquiry Centre answered 115 calls from postcodes within Berrigan Shire
Council area.
NSWEC Website
There were 452 unique visitors to Berrigan Shire Council election web page.
Braille Ballot Papers
No braille ballot papers were requested or printed.
Returning Officer
Erin Hore
11 Percentage of Penalty Notices Issued to Enrolment (as shown on Authorised Roll)

REPORT ON THE 2012 LOCAL GOVERNMENT ELECTIONS
Berrigan Shire Council
161
Returning Officer’s Office
Berrigan Region Returning Officer's Office
Old Finley Library
54 Denison Street
Finley NSW 2713
Councils in Region
Berrigan Shire Council, Conargo Shire Council, Deniliquin Council, Jerilderie Shire
Council and Murray Shire Council
Staffing
Office Manager 1
Senior Office Assistant 0
Office Assistants 9
Polling Place Managers 4
Polling Place Assistants 0
Deputy Polling Place Managers 0
Declaration Vote Issuing Officer 0
Election Officials 8
Council Count Manager 0
Part Day Election Officials 2
Total Staff 24
Polling Places
Pre-poll Centres 2
Declared Institutions 5
Election day Polling Places 5
Pre-poll centre locations
Berrigan Region Returning Officer's Office, Sydney Town Hall
Polling place locations
For 2012 map and polling places see –
www.pastvtr.elections.nsw.gov.au/LGE2012/berrigan-shire-council.html
Advertising
Statutory Campaign
The Council requested that the statutory advertisements be placed in the following
press:
Finley Southern Riverina News
Cobram Courier

REPORT ON THE 2012 LOCAL GOVERNMENT ELECTIONS
Berrigan Shire Council
162
Candidates
Nominations withdrawn
No Councillor nominations were withdrawn.
Councillor Candidates
Total Candidates 10
Female Candidates 2
Male Candidates 8
Names of all candidates
Councillor Candidates Party Affiliation
BRUCE, John -
CURTIN, Bernard -
GLANVILLE, Denis -
HANNAN, Matt -
HILL, Brian -
JONES, Colin -
McLAURIN, Liz -
MEXTED, Gary -
MORRIS, Daryll -
O'NEILL, Andrea -

REPORT ON THE 2012 LOCAL GOVERNMENT ELECTIONS
Blacktown City Council
163
Blacktown City Council Report
Election Summary
Poll declared by Saturday, 15 September, 2012
Councillor elections, successful candidates
Councillor name Party Affiliation
Ward 1
DIAZ, Jess Liberal Party of Australia New South Wales Division
PENDLETON, Alan Australian Labor Party (NSW Branch)
SMITH, Walter Liberal Party of Australia New South Wales Division
Ward 2
HOLMES, Mark Liberal Party of Australia New South Wales Division
KELLY, Leo Australian Labor Party (NSW Branch)
ROBINSON, Len Liberal Party of Australia New South Wales Division
Ward 3
BENJAMIN, Susai Australian Labor Party (NSW Branch)
DICKENS, Russ -
SILJEG, Karlo Liberal Party of Australia New South Wales Division
Ward 4
ATALLA, Edmond Australian Labor Party (NSW Branch)
BALI, Stephen Australian Labor Party (NSW Branch)
WHITE, Isabelle Liberal Party of Australia New South Wales Division
Ward 5
BLEASDALE, Tony Australian Labor Party (NSW Branch)
DONALDSON, Jacqueline Liberal Party of Australia New South Wales Division
LOWLES, Charlie Australian Labor Party (NSW Branch)
For full details of results see website –
www.pastvtr.elections.nsw.gov.au/LGE2012/blacktown-city-council.html
For a breakdown of voting by Vote Type (Ordinary, Declared Institution/Pre-poll,
Postal, Provisional/Silent) see the Councillor Election page of the above website, on
the Final Results tab select 04 - Enrolment and Voting by Aggregated Vote Type
Report.
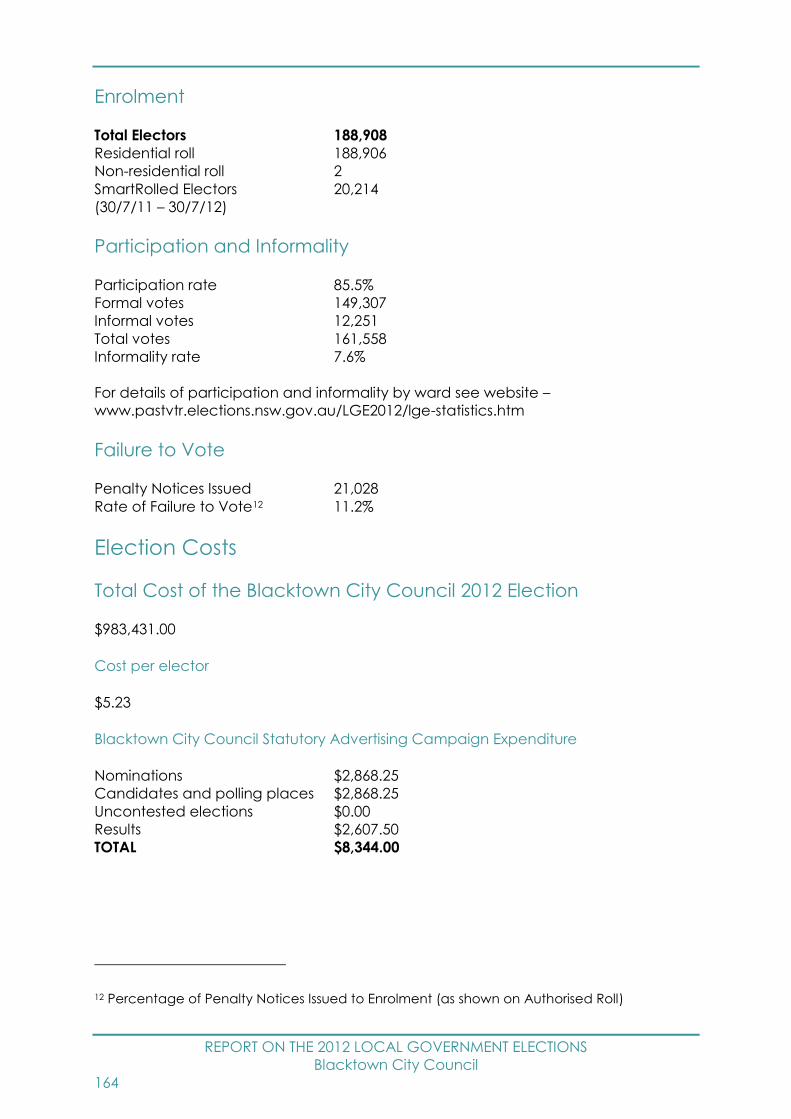
REPORT ON THE 2012 LOCAL GOVERNMENT ELECTIONS
Blacktown City Council
164
Enrolment
Total Electors 188,908
Residential roll 188,906
Non-residential roll 2
SmartRolled Electors 20,214
(30/7/11 – 30/7/12)
Participation and Informality
Participation rate 85.5%
Formal votes 149,307
Informal votes 12,251
Total votes 161,558
Informality rate 7.6%
For details of participation and informality by ward see website –
www.pastvtr.elections.nsw.gov.au/LGE2012/lge-statistics.htm
Failure to Vote
Penalty Notices Issued 21,028
Rate of Failure to Vote12 11.2%
Election Costs
Total Cost of the Blacktown City Council 2012 Election
$983,431.00
Cost per elector
$5.23
Blacktown City Council Statutory Advertising Campaign Expenditure
Nominations $2,868.25
Candidates and polling places $2,868.25
Uncontested elections $0.00
Results $2,607.50
TOTAL $8,344.00
12 Percentage of Penalty Notices Issued to Enrolment (as shown on Authorised Roll)
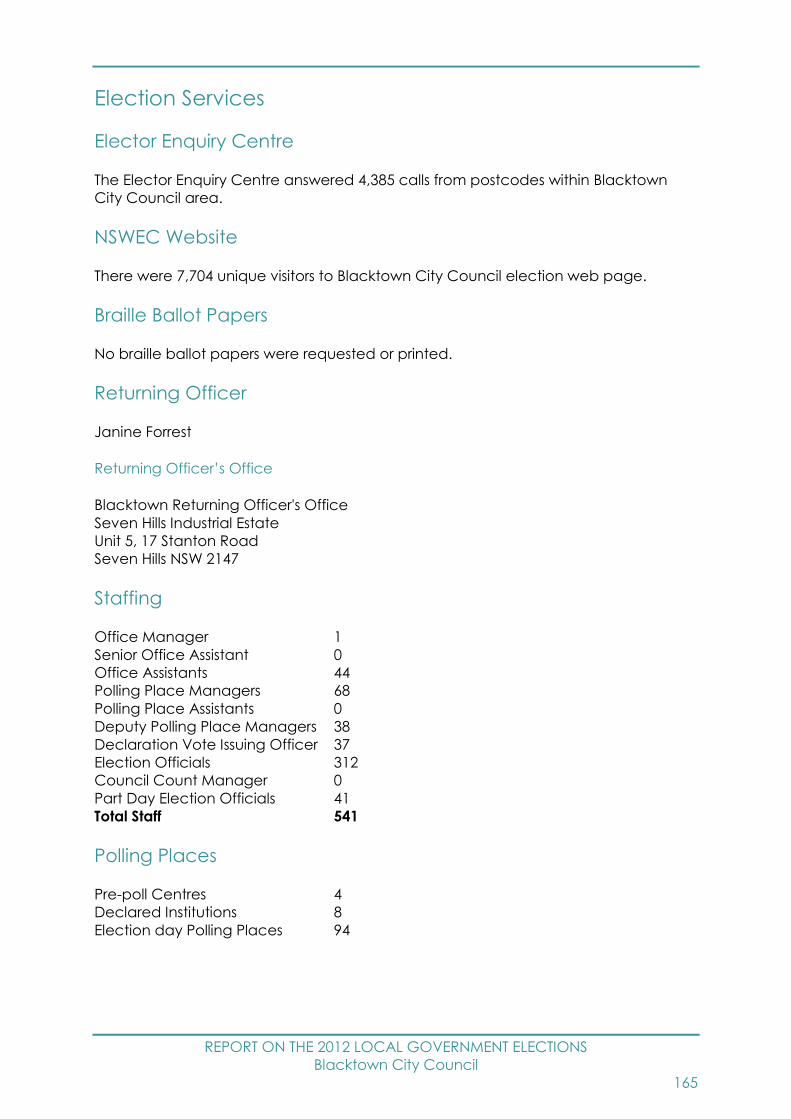
REPORT ON THE 2012 LOCAL GOVERNMENT ELECTIONS
Blacktown City Council
165
Election Services
Elector Enquiry Centre
The Elector Enquiry Centre answered 4,385 calls from postcodes within Blacktown
City Council area.
NSWEC Website
There were 7,704 unique visitors to Blacktown City Council election web page.
Braille Ballot Papers
No braille ballot papers were requested or printed.
Returning Officer
Janine Forrest
Returning Officer’s Office
Blacktown Returning Officer's Office
Seven Hills Industrial Estate
Unit 5, 17 Stanton Road
Seven Hills NSW 2147
Staffing
Office Manager 1
Senior Office Assistant 0
Office Assistants 44
Polling Place Managers 68
Polling Place Assistants 0
Deputy Polling Place Managers 38
Declaration Vote Issuing Officer 37
Election Officials 312
Council Count Manager 0
Part Day Election Officials 41
Total Staff 541
Polling Places
Pre-poll Centres 4
Declared Institutions 8
Election day Polling Places 94

REPORT ON THE 2012 LOCAL GOVERNMENT ELECTIONS
Blacktown City Council
166
Pre-poll centre locations
Blacktown Pre-Poll, Blacktown Returning Officer's Office, Mount Druitt Pre-Poll, Sydney
Town Hall
Polling place locations
For 2012 map and polling places see –
www.pastvtr.elections.nsw.gov.au/LGE2012/blacktown-city-council.html
Advertising
Statutory Campaign
The Council requested that the statutory advertisements be placed in the following
press:
Blacktown Sun
Rouse Hill Stanhope Gardens News
St Marys Star
Rouse Hill Times
Blacktown Advocate
Mt Druitt Standard
Candidates
Nominations withdrawn
No Councillor nominations were withdrawn.
Councillor Candidates
Total Candidates 63
Female Candidates 20
Male Candidates 43
Ward 1 Councillor Candidates
Total Candidates 12
Female Candidates 2
Male Candidates 10
Ward 2 Councillor Candidates
Total Candidates 12
Female Candidates 3
Male Candidates 9
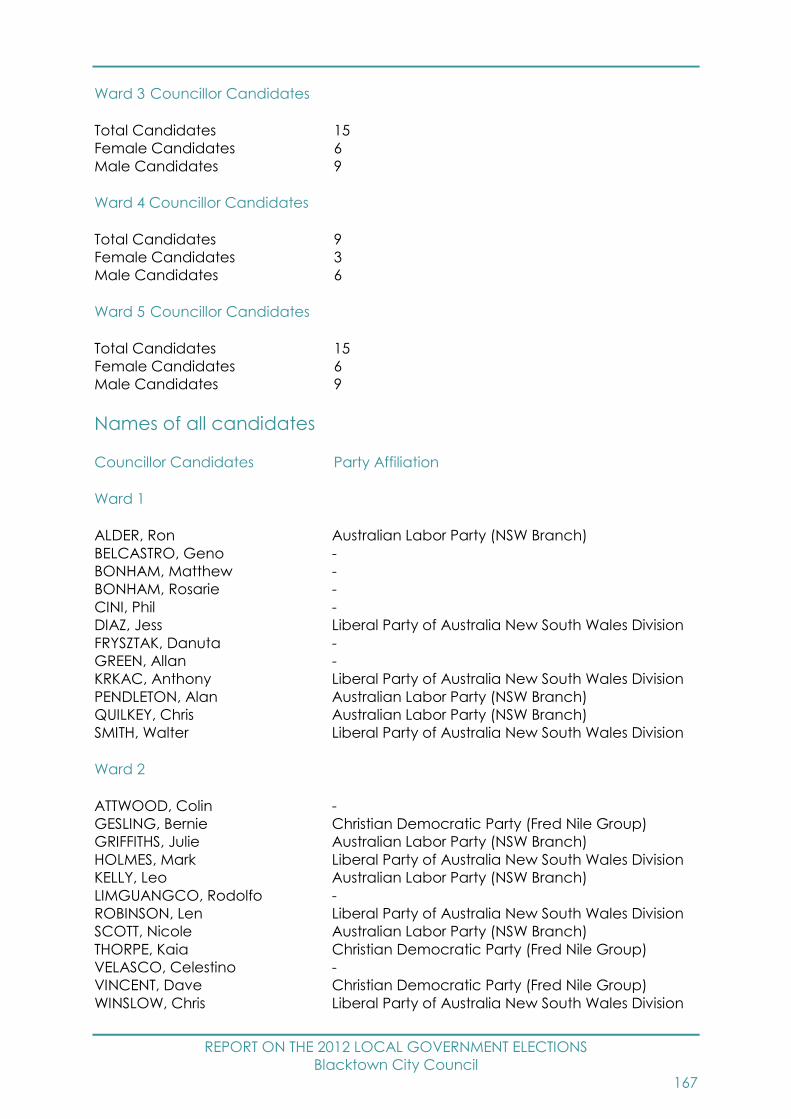
REPORT ON THE 2012 LOCAL GOVERNMENT ELECTIONS
Blacktown City Council
167
Ward 3 Councillor Candidates
Total Candidates 15
Female Candidates 6
Male Candidates 9
Ward 4 Councillor Candidates
Total Candidates 9
Female Candidates 3
Male Candidates 6
Ward 5 Councillor Candidates
Total Candidates 15
Female Candidates 6
Male Candidates 9
Names of all candidates
Councillor Candidates Party Affiliation
Ward 1
ALDER, Ron Australian Labor Party (NSW Branch)
BELCASTRO, Geno -
BONHAM, Matthew -
BONHAM, Rosarie -
CINI, Phil -
DIAZ, Jess Liberal Party of Australia New South Wales Division
FRYSZTAK, Danuta -
GREEN, Allan -
KRKAC, Anthony Liberal Party of Australia New South Wales Division
PENDLETON, Alan Australian Labor Party (NSW Branch)
QUILKEY, Chris Australian Labor Party (NSW Branch)
SMITH, Walter Liberal Party of Australia New South Wales Division
Ward 2
ATTWOOD, Colin -
GESLING, Bernie Christian Democratic Party (Fred Nile Group)
GRIFFITHS, Julie Australian Labor Party (NSW Branch)
HOLMES, Mark Liberal Party of Australia New South Wales Division
KELLY, Leo Australian Labor Party (NSW Branch)
LIMGUANGCO, Rodolfo -
ROBINSON, Len Liberal Party of Australia New South Wales Division
SCOTT, Nicole Australian Labor Party (NSW Branch)
THORPE, Kaia Christian Democratic Party (Fred Nile Group)
VELASCO, Celestino -
VINCENT, Dave Christian Democratic Party (Fred Nile Group)
WINSLOW, Chris Liberal Party of Australia New South Wales Division
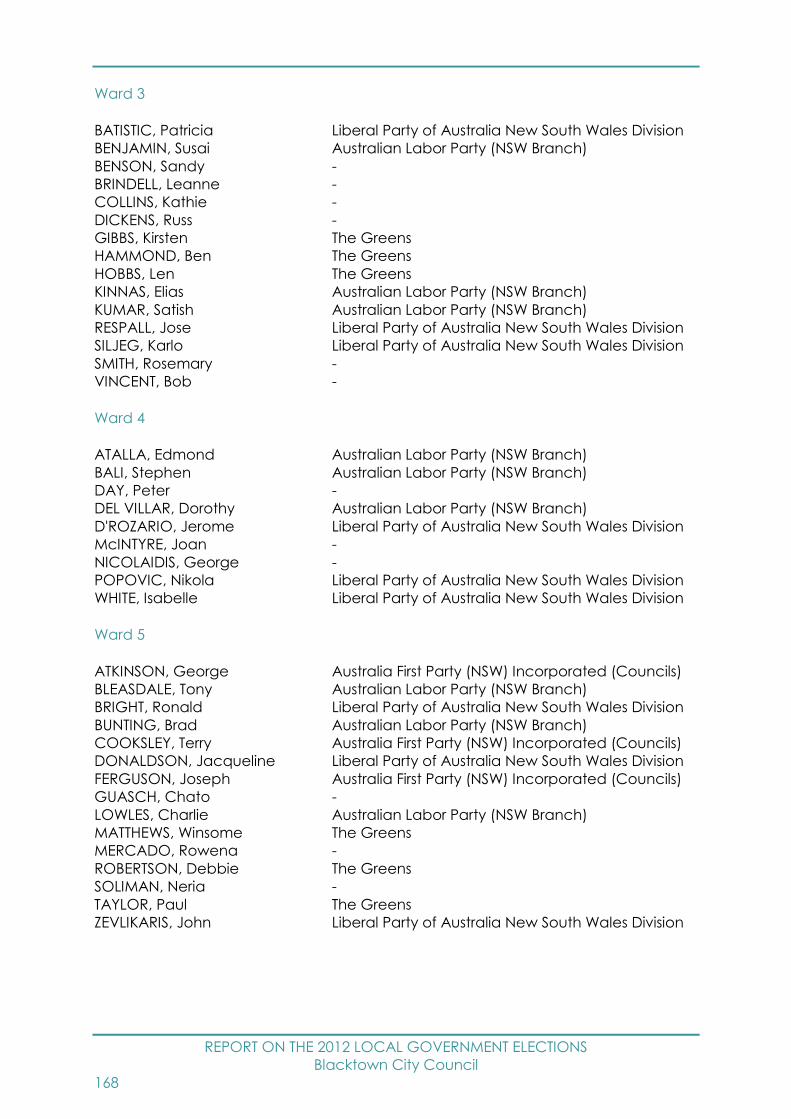
REPORT ON THE 2012 LOCAL GOVERNMENT ELECTIONS
Blacktown City Council
168
Ward 3
BATISTIC, Patricia Liberal Party of Australia New South Wales Division
BENJAMIN, Susai Australian Labor Party (NSW Branch)
BENSON, Sandy -
BRINDELL, Leanne -
COLLINS, Kathie -
DICKENS, Russ -
GIBBS, Kirsten The Greens
HAMMOND, Ben The Greens
HOBBS, Len The Greens
KINNAS, Elias Australian Labor Party (NSW Branch)
KUMAR, Satish Australian Labor Party (NSW Branch)
RESPALL, Jose Liberal Party of Australia New South Wales Division
SILJEG, Karlo Liberal Party of Australia New South Wales Division
SMITH, Rosemary -
VINCENT, Bob -
Ward 4
ATALLA, Edmond Australian Labor Party (NSW Branch)
BALI, Stephen Australian Labor Party (NSW Branch)
DAY, Peter -
DEL VILLAR, Dorothy Australian Labor Party (NSW Branch)
D'ROZARIO, Jerome Liberal Party of Australia New South Wales Division
McINTYRE, Joan -
NICOLAIDIS, George -
POPOVIC, Nikola Liberal Party of Australia New South Wales Division
WHITE, Isabelle Liberal Party of Australia New South Wales Division
Ward 5
ATKINSON, George Australia First Party (NSW) Incorporated (Councils)
BLEASDALE, Tony Australian Labor Party (NSW Branch)
BRIGHT, Ronald Liberal Party of Australia New South Wales Division
BUNTING, Brad Australian Labor Party (NSW Branch)
COOKSLEY, Terry Australia First Party (NSW) Incorporated (Councils)
DONALDSON, Jacqueline Liberal Party of Australia New South Wales Division
FERGUSON, Joseph Australia First Party (NSW) Incorporated (Councils)
GUASCH, Chato -
LOWLES, Charlie Australian Labor Party (NSW Branch)
MATTHEWS, Winsome The Greens
MERCADO, Rowena -
ROBERTSON, Debbie The Greens
SOLIMAN, Neria -
TAYLOR, Paul The Greens
ZEVLIKARIS, John Liberal Party of Australia New South Wales Division
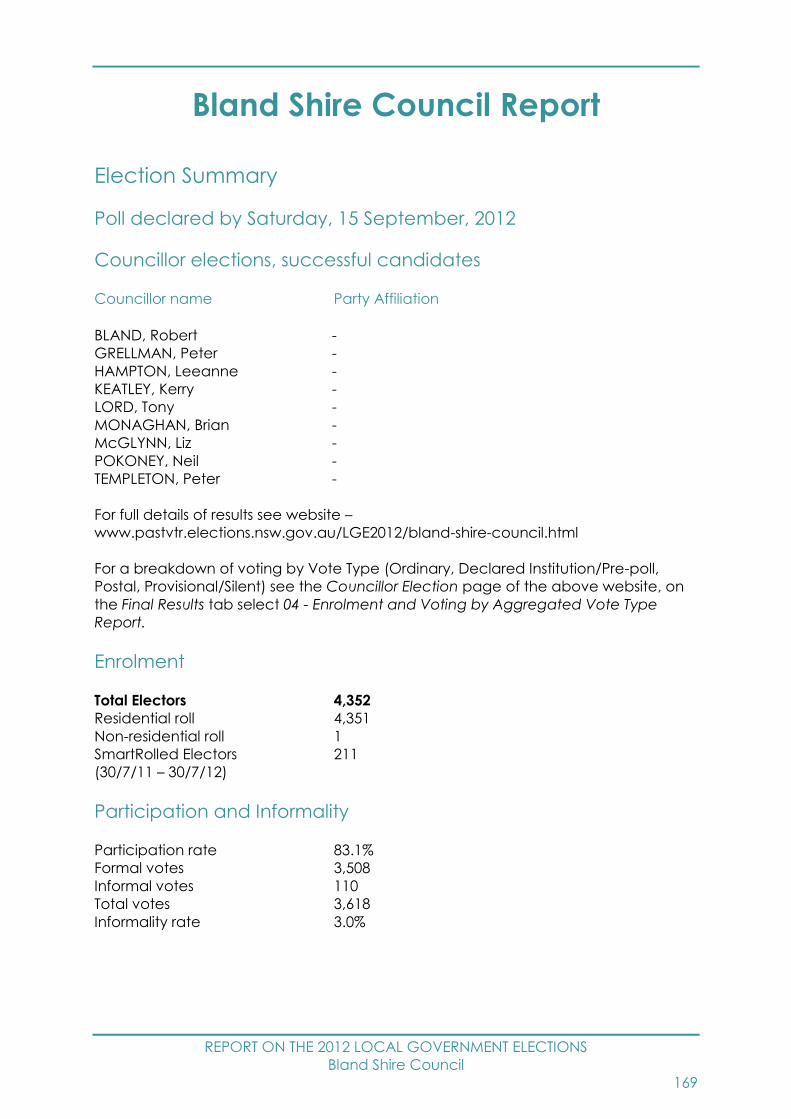
REPORT ON THE 2012 LOCAL GOVERNMENT ELECTIONS
Bland Shire Council
169
Bland Shire Council Report
Election Summary
Poll declared by Saturday, 15 September, 2012
Councillor elections, successful candidates
Councillor name Party Affiliation
BLAND, Robert -
GRELLMAN, Peter -
HAMPTON, Leeanne -
KEATLEY, Kerry -
LORD, Tony -
MONAGHAN, Brian -
McGLYNN, Liz -
POKONEY, Neil -
TEMPLETON, Peter -
For full details of results see website –
www.pastvtr.elections.nsw.gov.au/LGE2012/bland-shire-council.html
For a breakdown of voting by Vote Type (Ordinary, Declared Institution/Pre-poll,
Postal, Provisional/Silent) see the Councillor Election page of the above website, on
the Final Results tab select 04 - Enrolment and Voting by Aggregated Vote Type
Report.
Enrolment
Total Electors 4,352
Residential roll 4,351
Non-residential roll 1
SmartRolled Electors 211
(30/7/11 – 30/7/12)
Participation and Informality
Participation rate 83.1%
Formal votes 3,508
Informal votes 110
Total votes 3,618
Informality rate 3.0%

REPORT ON THE 2012 LOCAL GOVERNMENT ELECTIONS
Bland Shire Council
170
Failure to Vote
Penalty Notices Issued 480
Rate of Failure to Vote13 11.1%
Election Costs
Total Cost of the Bland Shire Council 2012 Election
$37,554.00
Cost per elector
$8.66
Bland Shire Council Statutory Advertising Campaign Expenditure
Nominations $210.00
Candidates and polling places $1,080.00
Uncontested elections $0.00
Results $168.00
TOTAL $1,458.00
Election Services
Elector Enquiry Centre
The Elector Enquiry Centre answered 102 calls from postcodes within Bland Shire
Council area.
NSWEC Website
There were 532 unique visitors to Bland Shire Council election web page.
Braille Ballot Papers
No braille ballot papers were requested or printed.
Returning Officer
Geoffrey Lark
13 Percentage of Penalty Notices Issued to Enrolment (as shown on Authorised Roll)

REPORT ON THE 2012 LOCAL GOVERNMENT ELECTIONS
Bland Shire Council
171
Returning Officer’s Office
Forbes Region Returning Officer's Office
1-5 Bandon Street
Forbes NSW 2871
Councils in Region
Bland Shire Council, Forbes Shire Council, Lachlan Shire Council and Parkes Shire
Council
Staffing
Office Manager 1
Senior Office Assistant 0
Office Assistants 0
Polling Place Managers 7
Polling Place Assistants 0
Deputy Polling Place Managers 0
Declaration Vote Issuing Officer 0
Election Officials 9
Council Count Manager 0
Part Day Election Officials 0
Total Staff 17
Polling Places
Pre-poll Centres 3
Declared Institutions 2
Election day Polling Places 8
Pre-poll centre locations
Forbes Region Returning Officer's Office, West Wyalong Pre-Poll, Sydney Town Hall
Polling place locations
For 2012 map and polling places see –
www.pastvtr.elections.nsw.gov.au/LGE2012/bland-shire-council.html
Advertising
Statutory Campaign
The Council requested that the statutory advertisements be placed in the following
press:
West Wyalong Advocate
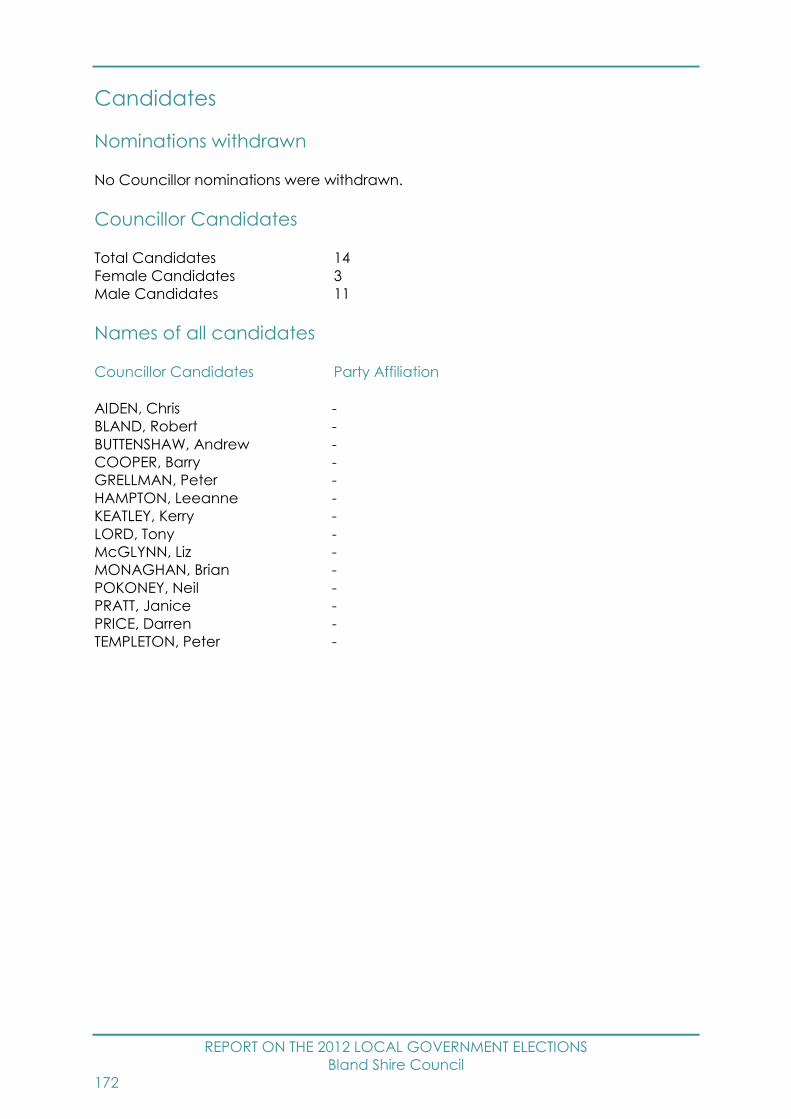
REPORT ON THE 2012 LOCAL GOVERNMENT ELECTIONS
Bland Shire Council
172
Candidates
Nominations withdrawn
No Councillor nominations were withdrawn.
Councillor Candidates
Total Candidates 14
Female Candidates 3
Male Candidates 11
Names of all candidates
Councillor Candidates Party Affiliation
AIDEN, Chris -
BLAND, Robert -
BUTTENSHAW, Andrew -
COOPER, Barry -
GRELLMAN, Peter -
HAMPTON, Leeanne -
KEATLEY, Kerry -
LORD, Tony -
McGLYNN, Liz -
MONAGHAN, Brian -
POKONEY, Neil -
PRATT, Janice -
PRICE, Darren -
TEMPLETON, Peter -

REPORT ON THE 2012 LOCAL GOVERNMENT ELECTIONS
Blayney Shire Council
173
Blayney Shire Council Report
Election Summary
Poll declared by Thursday, 13 September, 2012
Councillor elections, successful candidates
Councillor name Party Affiliation
BRADDON, Geoff -
EWIN, Allan -
FERGUSON, Scott -
KINGHAM, David -
OATES, Shane -
RADBURN, Kevin -
SOMERVAILLE, David -
For full details of results see website –
www.pastvtr.elections.nsw.gov.au/LGE2012/blayney-shire-council.html
For a breakdown of voting by Vote Type (Ordinary, Declared Institution/Pre-poll,
Postal, Provisional/Silent) see the Councillor Election page of the above website, on
the Final Results tab select 04 - Enrolment and Voting by Aggregated Vote Type
Report.
Enrolment
Total Electors 4,936
Residential roll 4,935
Non-residential roll 1
SmartRolled Electors 320
(30/7/11 – 30/7/12)
Participation and Informality
Participation rate 86.3%
Formal votes 4,062
Informal votes 199
Total votes 4,261
Informality rate 4.7%

REPORT ON THE 2012 LOCAL GOVERNMENT ELECTIONS
Blayney Shire Council
174
Failure to Vote
Penalty Notices Issued 444
Rate of Failure to Vote14 9.0%
Election Costs
Total Cost of the Blayney Shire Council 2012 Election
$44,682.00
Cost per elector
$9.07
Blayney Shire Council Statutory Advertising Campaign Expenditure
Nominations $1,299.60
Candidates and polling places $3,891.26
Uncontested elections $0.00
Results $674.99
TOTAL $5,865.85
Election Services
Elector Enquiry Centre
The Elector Enquiry Centre answered 76 calls from postcodes within Blayney Shire
Council area.
NSWEC Website
There were 854 unique visitors to Blayney Shire Council election web page.
Braille Ballot Papers
No braille ballot papers were requested or printed.
Returning Officer
Stuart Evennett
14 Percentage of Penalty Notices Issued to Enrolment (as shown on Authorised Roll)
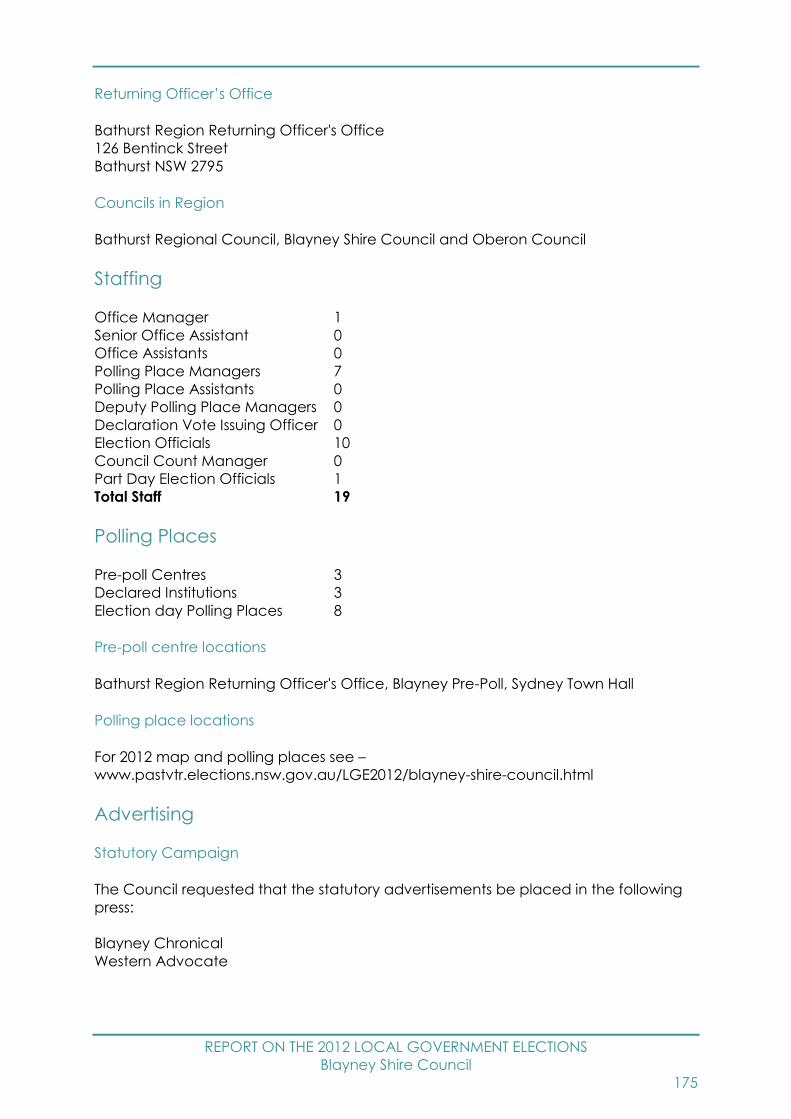
REPORT ON THE 2012 LOCAL GOVERNMENT ELECTIONS
Blayney Shire Council
175
Returning Officer’s Office
Bathurst Region Returning Officer's Office
126 Bentinck Street
Bathurst NSW 2795
Councils in Region
Bathurst Regional Council, Blayney Shire Council and Oberon Council
Staffing
Office Manager 1
Senior Office Assistant 0
Office Assistants 0
Polling Place Managers 7
Polling Place Assistants 0
Deputy Polling Place Managers 0
Declaration Vote Issuing Officer 0
Election Officials 10
Council Count Manager 0
Part Day Election Officials 1
Total Staff 19
Polling Places
Pre-poll Centres 3
Declared Institutions 3
Election day Polling Places 8
Pre-poll centre locations
Bathurst Region Returning Officer's Office, Blayney Pre-Poll, Sydney Town Hall
Polling place locations
For 2012 map and polling places see –
www.pastvtr.elections.nsw.gov.au/LGE2012/blayney-shire-council.html
Advertising
Statutory Campaign
The Council requested that the statutory advertisements be placed in the following
press:
Blayney Chronical
Western Advocate

REPORT ON THE 2012 LOCAL GOVERNMENT ELECTIONS
Blayney Shire Council
176
Candidates
Nominations withdrawn
No Councillor nominations were withdrawn.
Councillor Candidates
Total Candidates 12
Female Candidates 1
Male Candidates 11
Names of all candidates
Councillor Candidates Party Affiliation
BAULCH, Andrew -
BRADDON, Geoff -
CAMERON, Mira -
COLLINS, John -
EWIN, Allan -
FERGUSON, Scott -
HILDENBEUTEL, Peter -
KINGHAM, David -
OATES, Shane -
PINE, Bruce -
RADBURN, Kevin -
SOMERVAILLE, David -
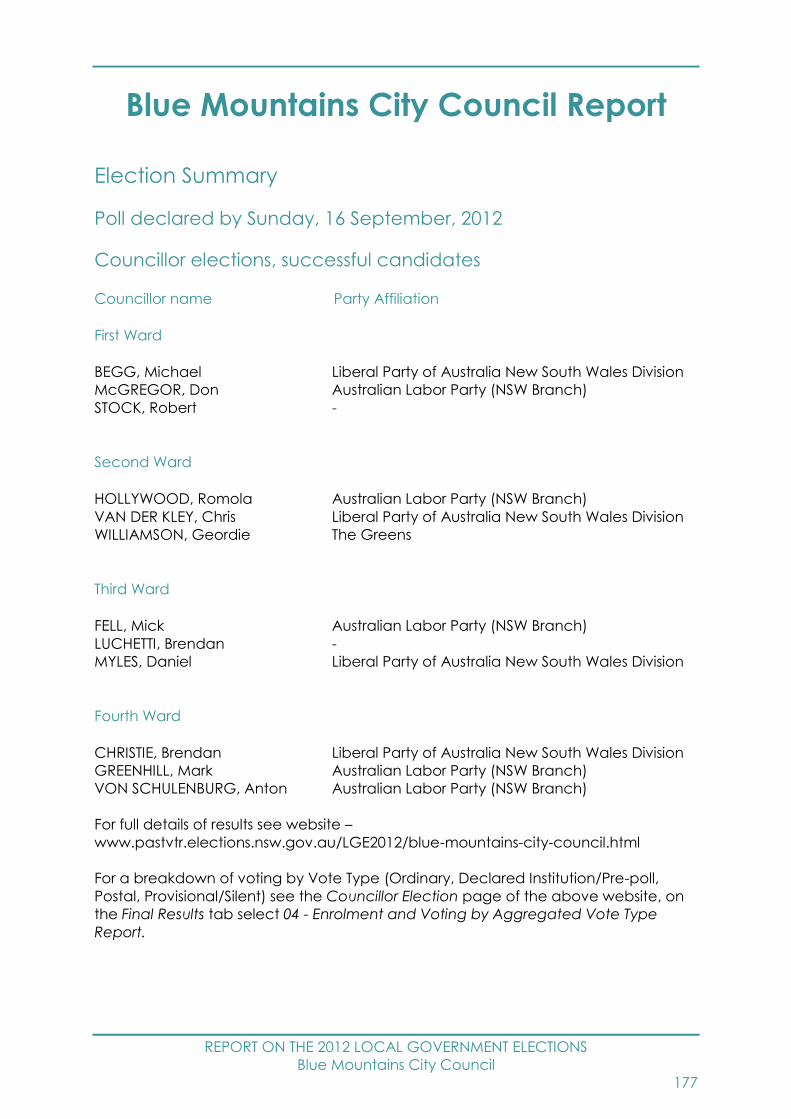
REPORT ON THE 2012 LOCAL GOVERNMENT ELECTIONS
Blue Mountains City Council
177
Blue Mountains City Council Report
Election Summary
Poll declared by Sunday, 16 September, 2012
Councillor elections, successful candidates
Councillor name Party Affiliation
First Ward
BEGG, Michael Liberal Party of Australia New South Wales Division
McGREGOR, Don Australian Labor Party (NSW Branch)
STOCK, Robert -
Second Ward
HOLLYWOOD, Romola Australian Labor Party (NSW Branch)
VAN DER KLEY, Chris Liberal Party of Australia New South Wales Division
WILLIAMSON, Geordie The Greens
Third Ward
FELL, Mick Australian Labor Party (NSW Branch)
LUCHETTI, Brendan -
MYLES, Daniel Liberal Party of Australia New South Wales Division
Fourth Ward
CHRISTIE, Brendan Liberal Party of Australia New South Wales Division
GREENHILL, Mark Australian Labor Party (NSW Branch)
VON SCHULENBURG, Anton Australian Labor Party (NSW Branch)
For full details of results see website –
www.pastvtr.elections.nsw.gov.au/LGE2012/blue-mountains-city-council.html
For a breakdown of voting by Vote Type (Ordinary, Declared Institution/Pre-poll,
Postal, Provisional/Silent) see the Councillor Election page of the above website, on
the Final Results tab select 04 - Enrolment and Voting by Aggregated Vote Type
Report.
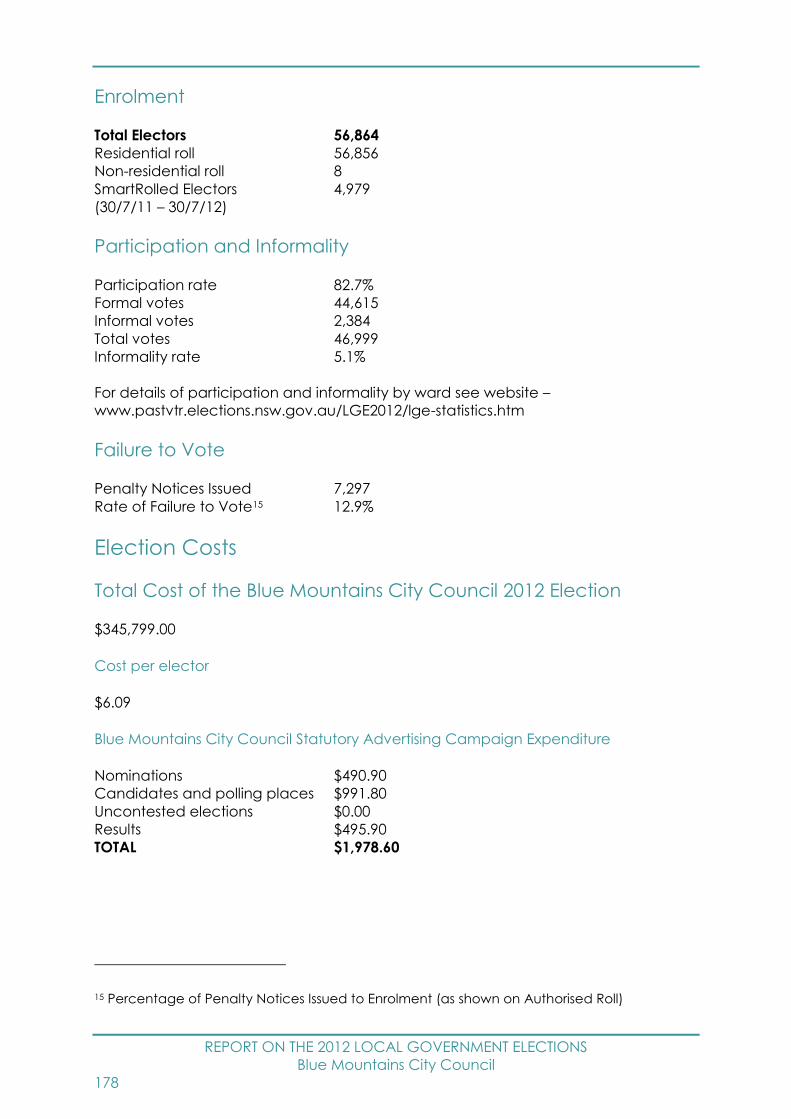
REPORT ON THE 2012 LOCAL GOVERNMENT ELECTIONS
Blue Mountains City Council
178
Enrolment
Total Electors 56,864
Residential roll 56,856
Non-residential roll 8
SmartRolled Electors 4,979
(30/7/11 – 30/7/12)
Participation and Informality
Participation rate 82.7%
Formal votes 44,615
Informal votes 2,384
Total votes 46,999
Informality rate 5.1%
For details of participation and informality by ward see website –
www.pastvtr.elections.nsw.gov.au/LGE2012/lge-statistics.htm
Failure to Vote
Penalty Notices Issued 7,297
Rate of Failure to Vote15 12.9%
Election Costs
Total Cost of the Blue Mountains City Council 2012 Election
$345,799.00
Cost per elector
$6.09
Blue Mountains City Council Statutory Advertising Campaign Expenditure
Nominations $490.90
Candidates and polling places $991.80
Uncontested elections $0.00
Results $495.90
TOTAL $1,978.60
15 Percentage of Penalty Notices Issued to Enrolment (as shown on Authorised Roll)
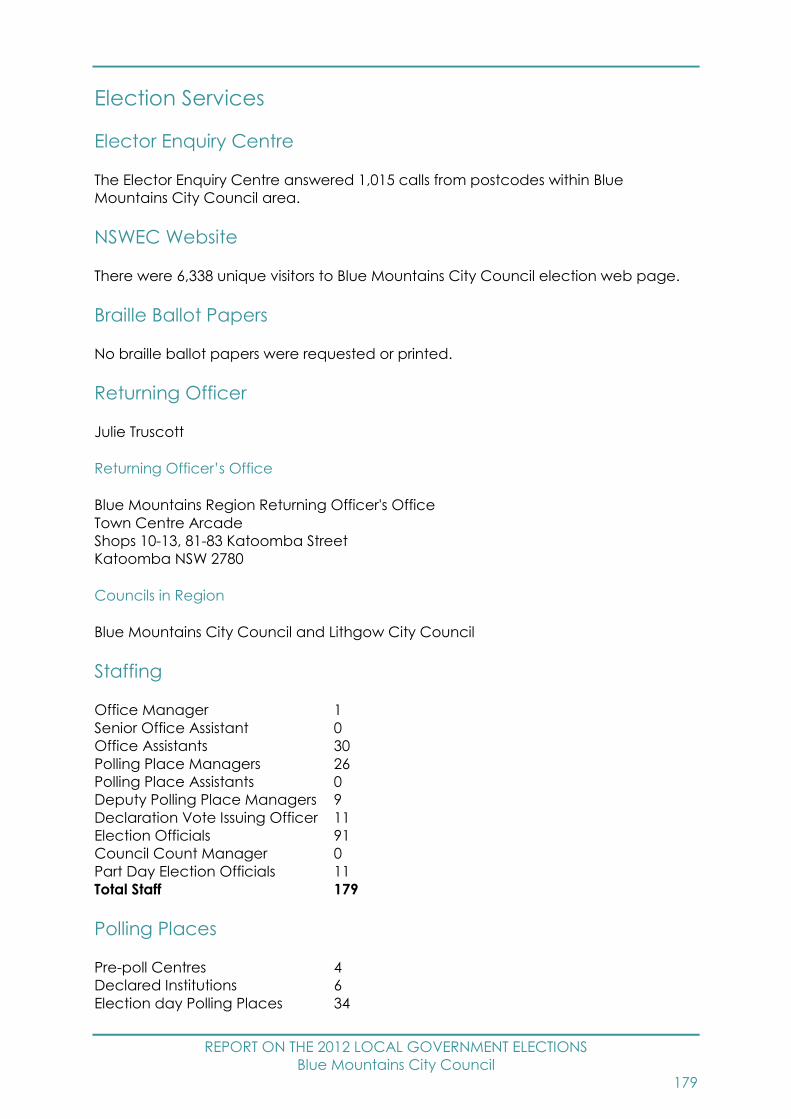
REPORT ON THE 2012 LOCAL GOVERNMENT ELECTIONS
Blue Mountains City Council
179
Election Services
Elector Enquiry Centre
The Elector Enquiry Centre answered 1,015 calls from postcodes within Blue
Mountains City Council area.
NSWEC Website
There were 6,338 unique visitors to Blue Mountains City Council election web page.
Braille Ballot Papers
No braille ballot papers were requested or printed.
Returning Officer
Julie Truscott
Returning Officer’s Office
Blue Mountains Region Returning Officer's Office
Town Centre Arcade
Shops 10-13, 81-83 Katoomba Street
Katoomba NSW 2780
Councils in Region
Blue Mountains City Council and Lithgow City Council
Staffing
Office Manager 1
Senior Office Assistant 0
Office Assistants 30
Polling Place Managers 26
Polling Place Assistants 0
Deputy Polling Place Managers 9
Declaration Vote Issuing Officer 11
Election Officials 91
Council Count Manager 0
Part Day Election Officials 11
Total Staff 179
Polling Places
Pre-poll Centres 4
Declared Institutions 6
Election day Polling Places 34
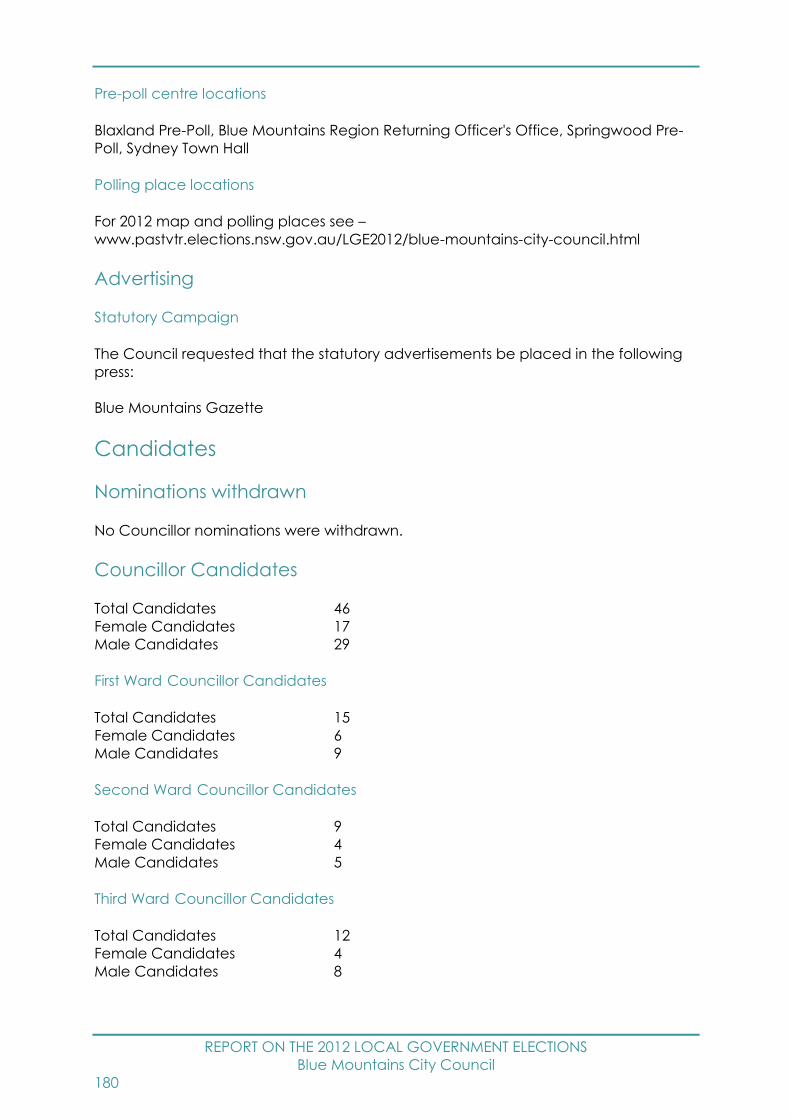
REPORT ON THE 2012 LOCAL GOVERNMENT ELECTIONS
Blue Mountains City Council
180
Pre-poll centre locations
Blaxland Pre-Poll, Blue Mountains Region Returning Officer's Office, Springwood Pre-
Poll, Sydney Town Hall
Polling place locations
For 2012 map and polling places see –
www.pastvtr.elections.nsw.gov.au/LGE2012/blue-mountains-city-council.html
Advertising
Statutory Campaign
The Council requested that the statutory advertisements be placed in the following
press:
Blue Mountains Gazette
Candidates
Nominations withdrawn
No Councillor nominations were withdrawn.
Councillor Candidates
Total Candidates 46
Female Candidates 17
Male Candidates 29
First Ward Councillor Candidates
Total Candidates 15
Female Candidates 6
Male Candidates 9
Second Ward Councillor Candidates
Total Candidates 9
Female Candidates 4
Male Candidates 5
Third Ward Councillor Candidates
Total Candidates 12
Female Candidates 4
Male Candidates 8

REPORT ON THE 2012 LOCAL GOVERNMENT ELECTIONS
Blue Mountains City Council
181
Fourth Ward Councillor Candidates
Total Candidates 10
Female Candidates 3
Male Candidates 7
Names of all candidates
Councillor Candidates Party Affiliation
First Ward
BEGG, Michael Liberal Party of Australia New South Wales Division
COX, Bruce Liberal Party of Australia New South Wales Division
DOWNES, Angela The Greens
HOARE, Brent The Greens
HODGSON, Matt Australia First Party (NSW) Incorporated (Councils)
JARVIS, Mark -
MATHEWS, Anne Australia First Party (NSW) Incorporated (Councils)
McGREGOR, Don Australian Labor Party (NSW Branch)
OLSON, Peter Liberal Party of Australia New South Wales Division
ROSS, Jenny -
ROSS, Shirley Australian Labor Party (NSW Branch)
SELKE, Belinda The Greens
SHRUBB, Sarah Australian Labor Party (NSW Branch)
SLATER, Mark Australia First Party (NSW) Incorporated (Councils)
STOCK, Robert -
Second Ward
BECKETT, James Liberal Party of Australia New South Wales Division
CARMICHAEL, Erst The Greens
HOLLYWOOD, Romola Australian Labor Party (NSW Branch)
MURAWSKI, Tim Australian Labor Party (NSW Branch)
NORDSTROM, Mitchell Liberal Party of Australia New South Wales Division
THOMPSON, Samantha Australian Labor Party (NSW Branch)
VAN DER KLEY, Chris Liberal Party of Australia New South Wales Division
WILLIAMSON, Frances The Greens
WILLIAMSON, Geordie The Greens
Third Ward
AARONSON, Michael The Greens
ATKINS, Graeme -
COWPER, Kim Australian Labor Party (NSW Branch)
FELL, Mick Australian Labor Party (NSW Branch)
GREENAWAY, Sarah-Jane Australian Labor Party (NSW Branch)
HUNDT, Mikayla Liberal Party of Australia New South Wales Division
LUCHETTI, Brendan -
McDONALD, Alex Liberal Party of Australia New South Wales Division
MOALEM, Darryn -
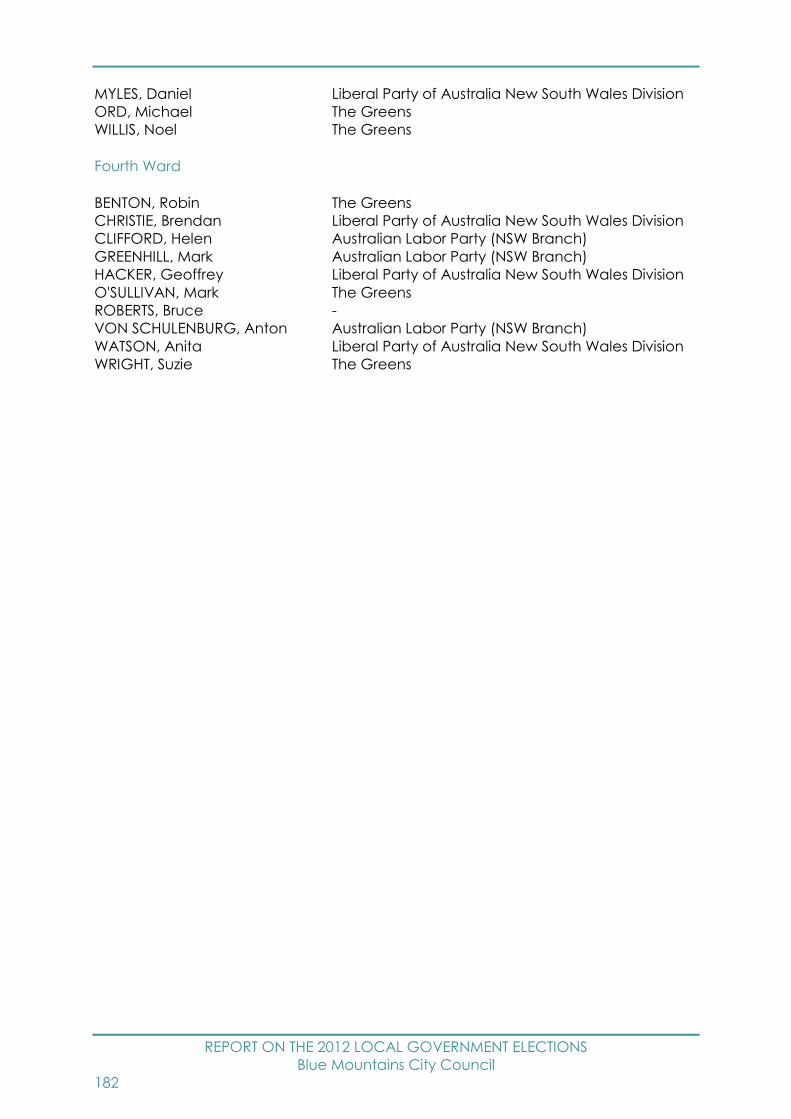
REPORT ON THE 2012 LOCAL GOVERNMENT ELECTIONS
Blue Mountains City Council
182
MYLES, Daniel Liberal Party of Australia New South Wales Division
ORD, Michael The Greens
WILLIS, Noel The Greens
Fourth Ward
BENTON, Robin The Greens
CHRISTIE, Brendan Liberal Party of Australia New South Wales Division
CLIFFORD, Helen Australian Labor Party (NSW Branch)
GREENHILL, Mark Australian Labor Party (NSW Branch)
HACKER, Geoffrey Liberal Party of Australia New South Wales Division
O'SULLIVAN, Mark The Greens
ROBERTS, Bruce -
VON SCHULENBURG, Anton Australian Labor Party (NSW Branch)
WATSON, Anita Liberal Party of Australia New South Wales Division
WRIGHT, Suzie The Greens

REPORT ON THE 2012 LOCAL GOVERNMENT ELECTIONS
Bogan Shire Council
183
Bogan Shire Council Report
Election Summary
Poll declared by Thursday, 13 September, 2012
Councillor elections, successful candidates
Councillor name Party Affiliation
DEACON, Greg -
DONALD, Ray -
DOUGLAS, Jodi -
DUTTON, Danny -
GRIFFITHS, Hazel -
HAMPSTEAD, Jim -
McLAUGHLIN, Elaine -
NEILL, Glen -
RYAN, Kevin -
For full details of results see website –
www.pastvtr.elections.nsw.gov.au/LGE2012/bogan-shire-council.html
For a breakdown of voting by Vote Type (Ordinary, Declared Institution/Pre-poll,
Postal, Provisional/Silent) see the Councillor Election page of the above website, on
the Final Results tab select 04 - Enrolment and Voting by Aggregated Vote Type
Report.
Enrolment
Total Electors 1,991
Residential roll 1,989
Non-residential roll 2
SmartRolled Electors 157
(30/7/11 – 30/7/12)
Participation and Informality
Participation rate 80.6%
Formal votes 1,565
Informal votes 39
Total votes 1,604
Informality rate 2.4%
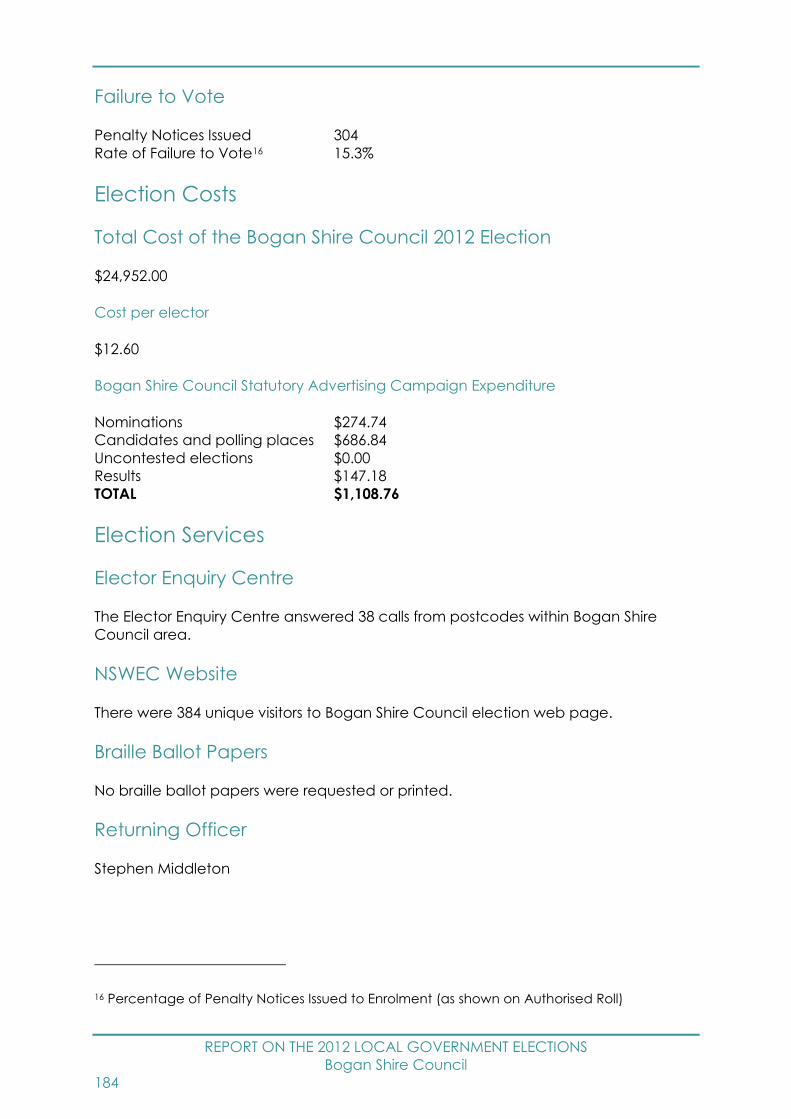
REPORT ON THE 2012 LOCAL GOVERNMENT ELECTIONS
Bogan Shire Council
184
Failure to Vote
Penalty Notices Issued 304
Rate of Failure to Vote16 15.3%
Election Costs
Total Cost of the Bogan Shire Council 2012 Election
$24,952.00
Cost per elector
$12.60
Bogan Shire Council Statutory Advertising Campaign Expenditure
Nominations $274.74
Candidates and polling places $686.84
Uncontested elections $0.00
Results $147.18
TOTAL $1,108.76
Election Services
Elector Enquiry Centre
The Elector Enquiry Centre answered 38 calls from postcodes within Bogan Shire
Council area.
NSWEC Website
There were 384 unique visitors to Bogan Shire Council election web page.
Braille Ballot Papers
No braille ballot papers were requested or printed.
Returning Officer
Stephen Middleton
16 Percentage of Penalty Notices Issued to Enrolment (as shown on Authorised Roll)
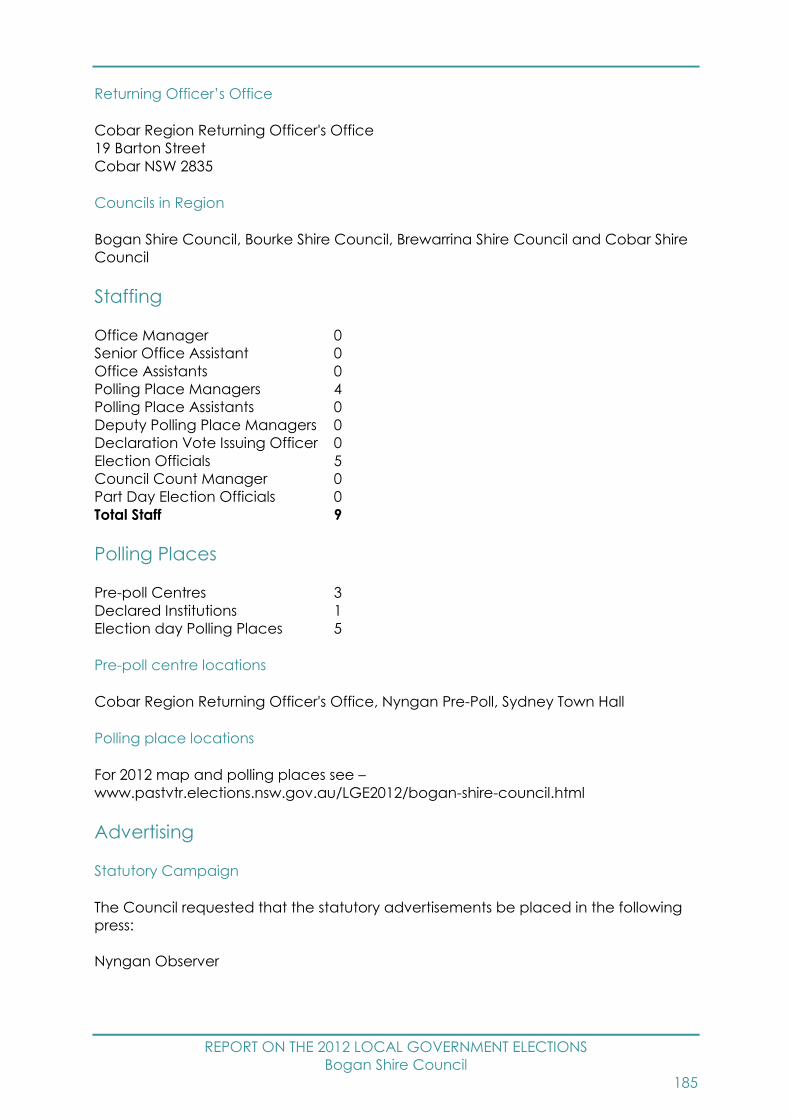
REPORT ON THE 2012 LOCAL GOVERNMENT ELECTIONS
Bogan Shire Council
185
Returning Officer’s Office
Cobar Region Returning Officer's Office
19 Barton Street
Cobar NSW 2835
Councils in Region
Bogan Shire Council, Bourke Shire Council, Brewarrina Shire Council and Cobar Shire
Council
Staffing
Office Manager 0
Senior Office Assistant 0
Office Assistants 0
Polling Place Managers 4
Polling Place Assistants 0
Deputy Polling Place Managers 0
Declaration Vote Issuing Officer 0
Election Officials 5
Council Count Manager 0
Part Day Election Officials 0
Total Staff 9
Polling Places
Pre-poll Centres 3
Declared Institutions 1
Election day Polling Places 5
Pre-poll centre locations
Cobar Region Returning Officer's Office, Nyngan Pre-Poll, Sydney Town Hall
Polling place locations
For 2012 map and polling places see –
www.pastvtr.elections.nsw.gov.au/LGE2012/bogan-shire-council.html
Advertising
Statutory Campaign
The Council requested that the statutory advertisements be placed in the following
press:
Nyngan Observer
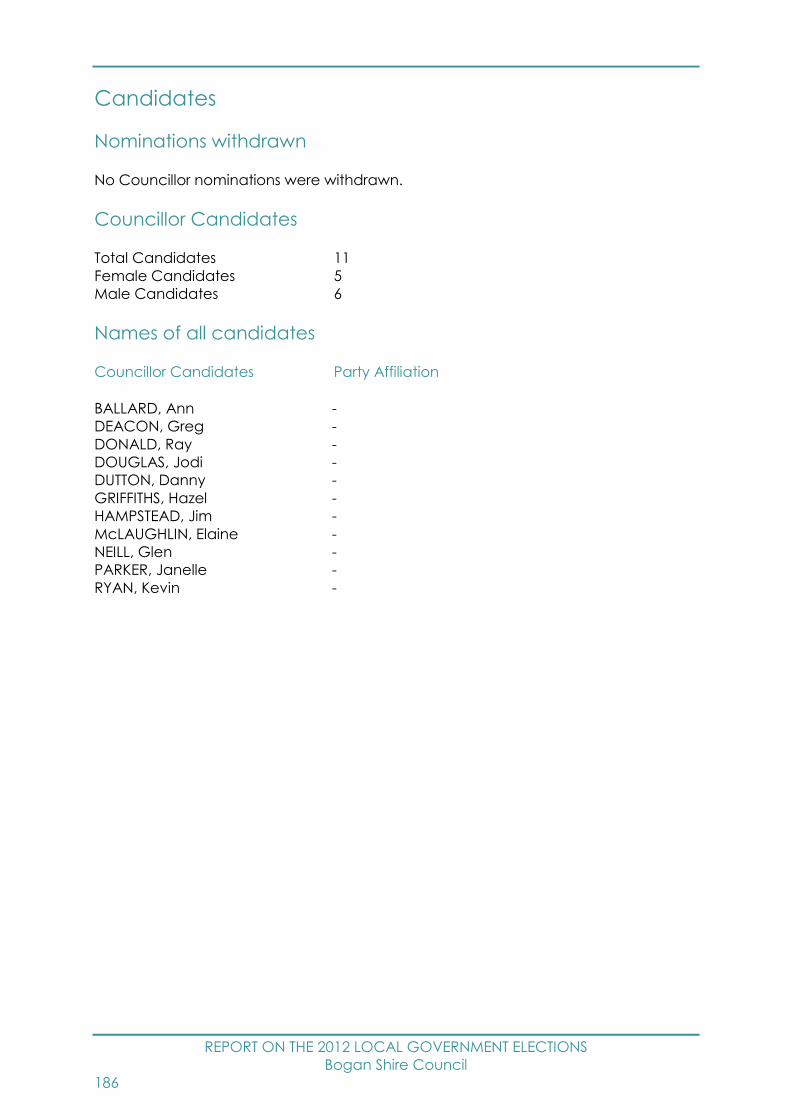
REPORT ON THE 2012 LOCAL GOVERNMENT ELECTIONS
Bogan Shire Council
186
Candidates
Nominations withdrawn
No Councillor nominations were withdrawn.
Councillor Candidates
Total Candidates 11
Female Candidates 5
Male Candidates 6
Names of all candidates
Councillor Candidates Party Affiliation
BALLARD, Ann -
DEACON, Greg -
DONALD, Ray -
DOUGLAS, Jodi -
DUTTON, Danny -
GRIFFITHS, Hazel -
HAMPSTEAD, Jim -
McLAUGHLIN, Elaine -
NEILL, Glen -
PARKER, Janelle -
RYAN, Kevin -
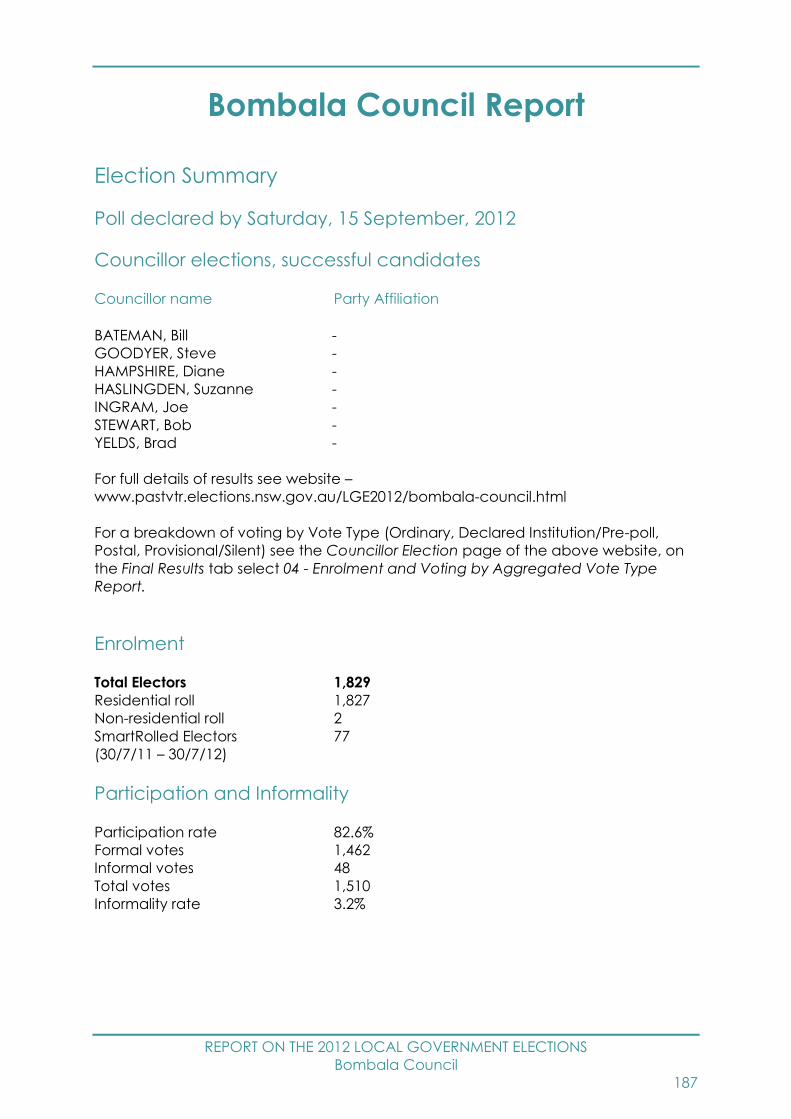
REPORT ON THE 2012 LOCAL GOVERNMENT ELECTIONS
Bombala Council
187
Bombala Council Report
Election Summary
Poll declared by Saturday, 15 September, 2012
Councillor elections, successful candidates
Councillor name Party Affiliation
BATEMAN, Bill -
GOODYER, Steve -
HAMPSHIRE, Diane -
HASLINGDEN, Suzanne -
INGRAM, Joe -
STEWART, Bob -
YELDS, Brad -
For full details of results see website –
www.pastvtr.elections.nsw.gov.au/LGE2012/bombala-council.html
For a breakdown of voting by Vote Type (Ordinary, Declared Institution/Pre-poll,
Postal, Provisional/Silent) see the Councillor Election page of the above website, on
the Final Results tab select 04 - Enrolment and Voting by Aggregated Vote Type
Report.
Enrolment
Total Electors 1,829
Residential roll 1,827
Non-residential roll 2
SmartRolled Electors 77
(30/7/11 – 30/7/12)
Participation and Informality
Participation rate 82.6%
Formal votes 1,462
Informal votes 48
Total votes 1,510
Informality rate 3.2%
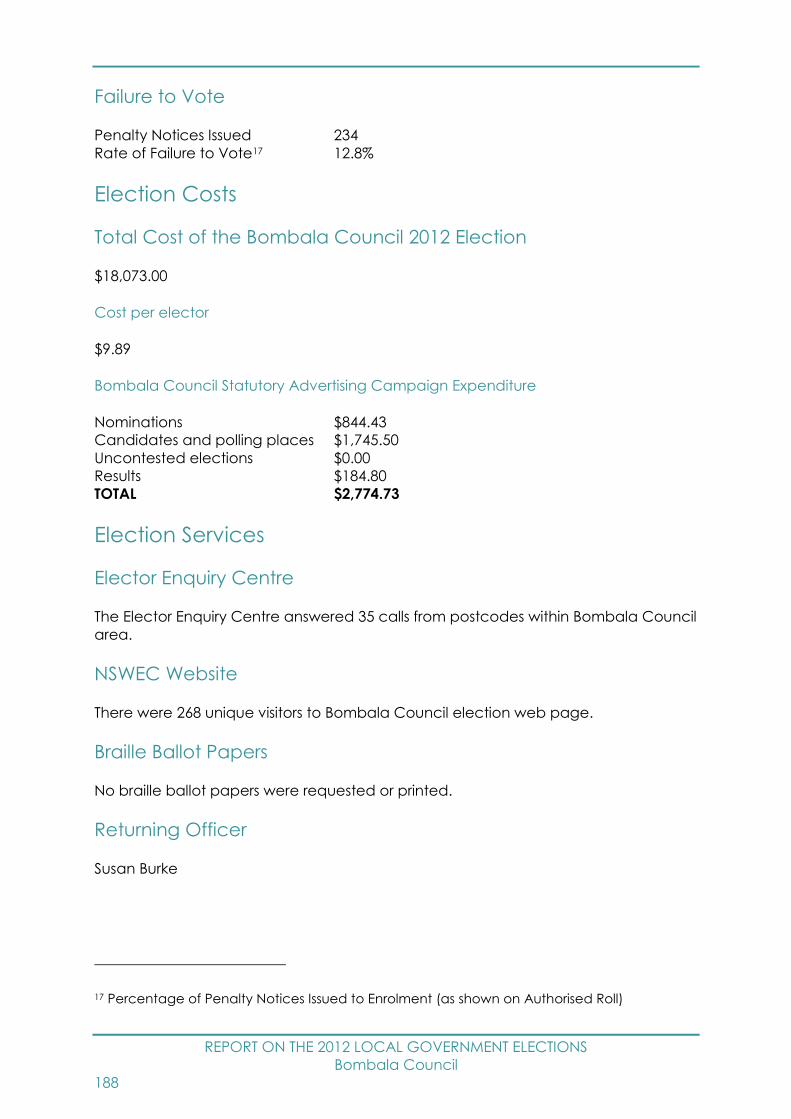
REPORT ON THE 2012 LOCAL GOVERNMENT ELECTIONS
Bombala Council
188
Failure to Vote
Penalty Notices Issued 234
Rate of Failure to Vote17 12.8%
Election Costs
Total Cost of the Bombala Council 2012 Election
$18,073.00
Cost per elector
$9.89
Bombala Council Statutory Advertising Campaign Expenditure
Nominations $844.43
Candidates and polling places $1,745.50
Uncontested elections $0.00
Results $184.80
TOTAL $2,774.73
Election Services
Elector Enquiry Centre
The Elector Enquiry Centre answered 35 calls from postcodes within Bombala Council
area.
NSWEC Website
There were 268 unique visitors to Bombala Council election web page.
Braille Ballot Papers
No braille ballot papers were requested or printed.
Returning Officer
Susan Burke
17 Percentage of Penalty Notices Issued to Enrolment (as shown on Authorised Roll)
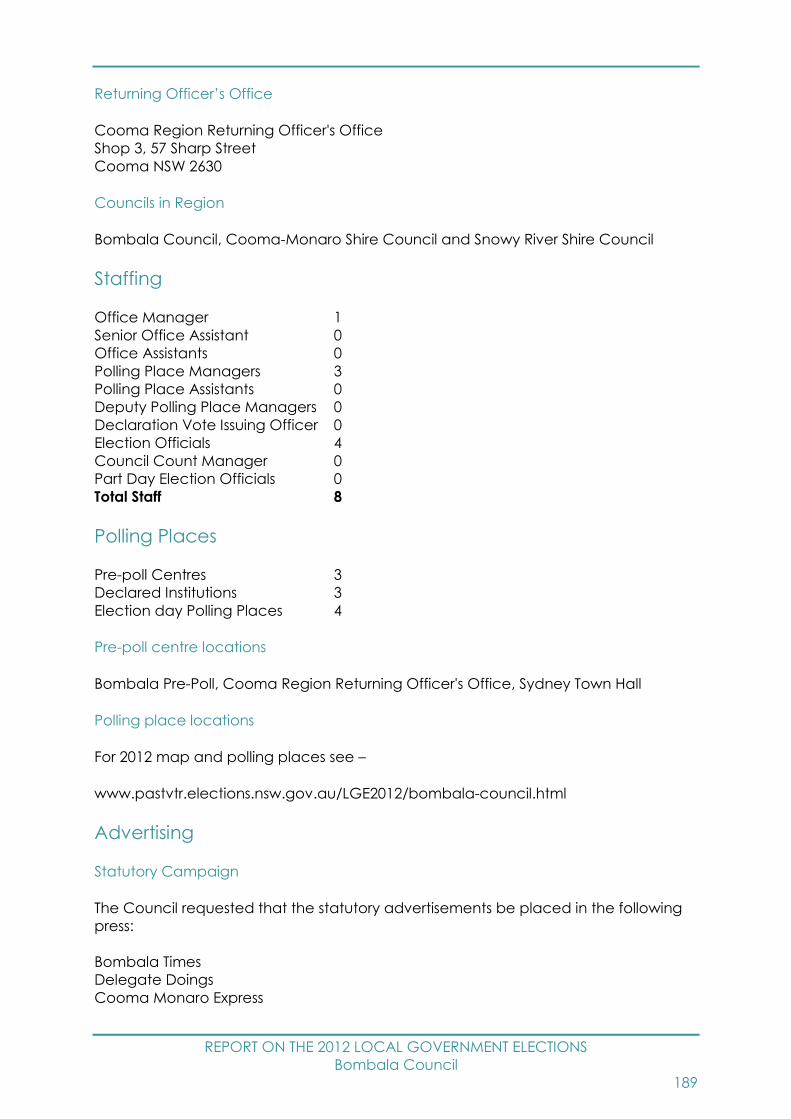
REPORT ON THE 2012 LOCAL GOVERNMENT ELECTIONS
Bombala Council
189
Returning Officer’s Office
Cooma Region Returning Officer's Office
Shop 3, 57 Sharp Street
Cooma NSW 2630
Councils in Region
Bombala Council, Cooma-Monaro Shire Council and Snowy River Shire Council
Staffing
Office Manager 1
Senior Office Assistant 0
Office Assistants 0
Polling Place Managers 3
Polling Place Assistants 0
Deputy Polling Place Managers 0
Declaration Vote Issuing Officer 0
Election Officials 4
Council Count Manager 0
Part Day Election Officials 0
Total Staff 8
Polling Places
Pre-poll Centres 3
Declared Institutions 3
Election day Polling Places 4
Pre-poll centre locations
Bombala Pre-Poll, Cooma Region Returning Officer's Office, Sydney Town Hall
Polling place locations
For 2012 map and polling places see –
www.pastvtr.elections.nsw.gov.au/LGE2012/bombala-council.html
Advertising
Statutory Campaign
The Council requested that the statutory advertisements be placed in the following
press:
Bombala Times
Delegate Doings
Cooma Monaro Express
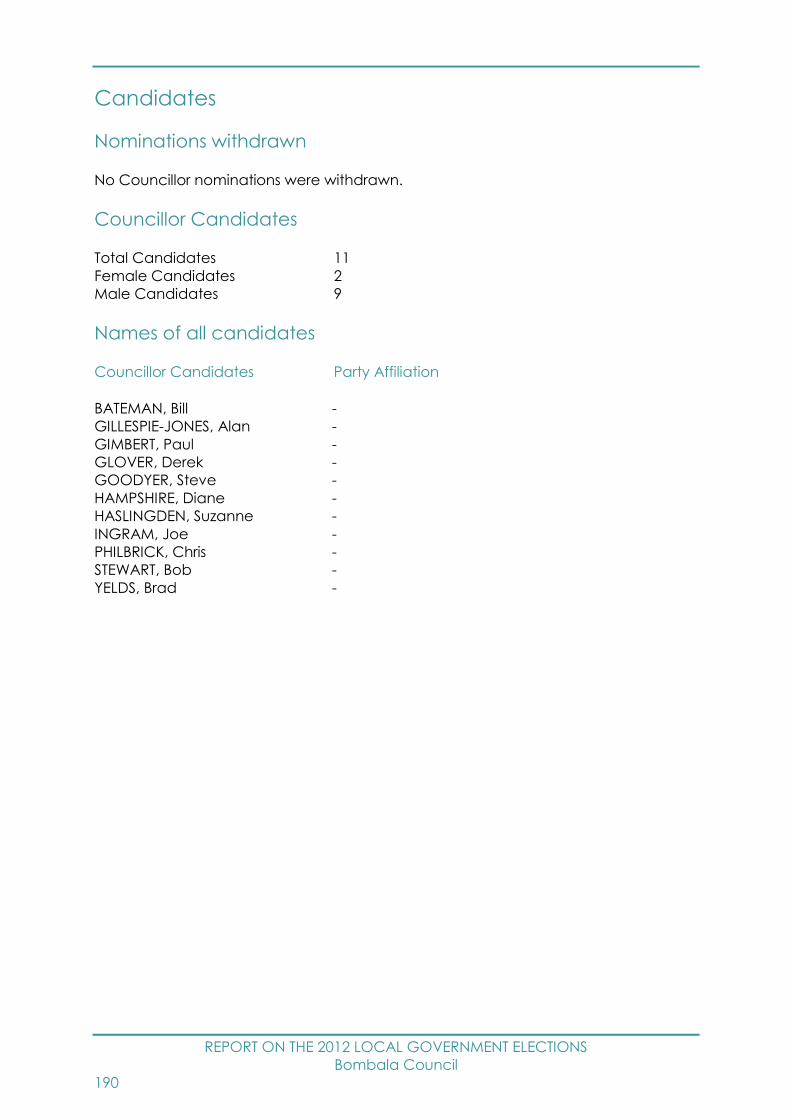
REPORT ON THE 2012 LOCAL GOVERNMENT ELECTIONS
Bombala Council
190
Candidates
Nominations withdrawn
No Councillor nominations were withdrawn.
Councillor Candidates
Total Candidates 11
Female Candidates 2
Male Candidates 9
Names of all candidates
Councillor Candidates Party Affiliation
BATEMAN, Bill -
GILLESPIE-JONES, Alan -
GIMBERT, Paul -
GLOVER, Derek -
GOODYER, Steve -
HAMPSHIRE, Diane -
HASLINGDEN, Suzanne -
INGRAM, Joe -
PHILBRICK, Chris -
STEWART, Bob -
YELDS, Brad -
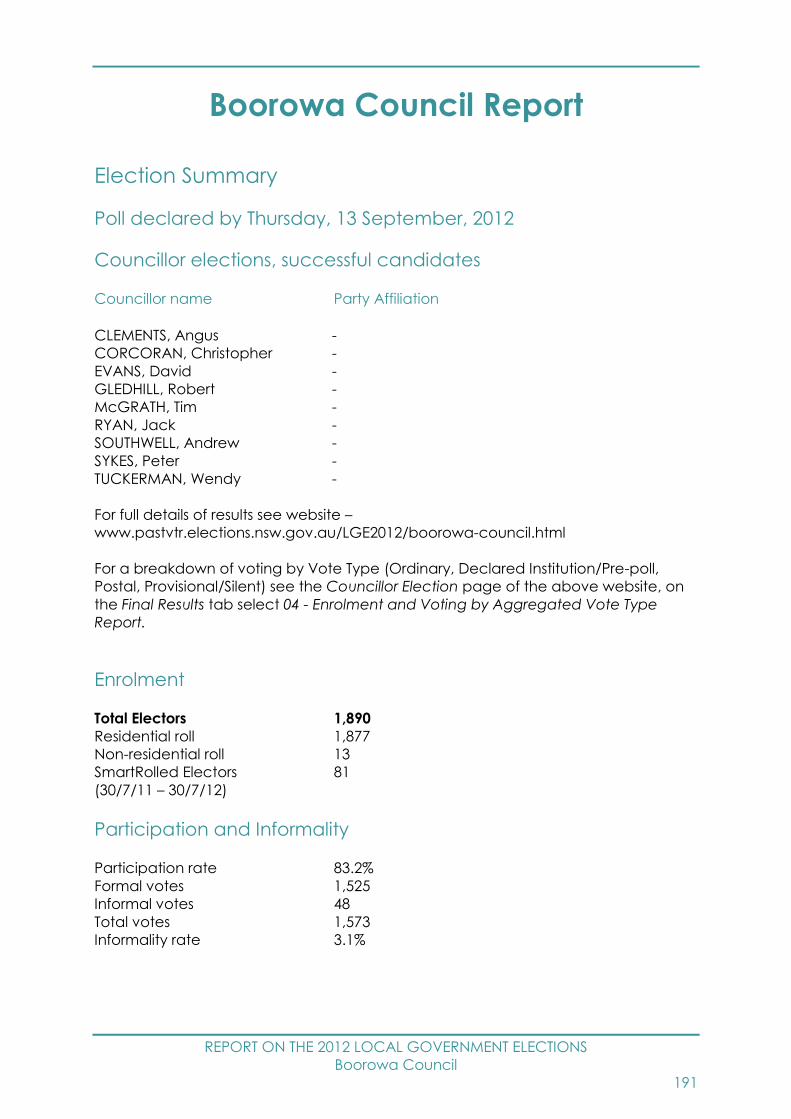
REPORT ON THE 2012 LOCAL GOVERNMENT ELECTIONS
Boorowa Council
191
Boorowa Council Report
Election Summary
Poll declared by Thursday, 13 September, 2012
Councillor elections, successful candidates
Councillor name Party Affiliation
CLEMENTS, Angus -
CORCORAN, Christopher -
EVANS, David -
GLEDHILL, Robert -
McGRATH, Tim -
RYAN, Jack -
SOUTHWELL, Andrew -
SYKES, Peter -
TUCKERMAN, Wendy -
For full details of results see website –
www.pastvtr.elections.nsw.gov.au/LGE2012/boorowa-council.html
For a breakdown of voting by Vote Type (Ordinary, Declared Institution/Pre-poll,
Postal, Provisional/Silent) see the Councillor Election page of the above website, on
the Final Results tab select 04 - Enrolment and Voting by Aggregated Vote Type
Report.
Enrolment
Total Electors 1,890
Residential roll 1,877
Non-residential roll 13
SmartRolled Electors 81
(30/7/11 – 30/7/12)
Participation and Informality
Participation rate 83.2%
Formal votes 1,525
Informal votes 48
Total votes 1,573
Informality rate 3.1%

REPORT ON THE 2012 LOCAL GOVERNMENT ELECTIONS
Boorowa Council
192
Failure to Vote
Penalty Notices Issued 199
Rate of Failure to Vote18 10.6%
Election Costs
Total Cost of the Boorowa Council 2012 Election
$17,670.00
Cost per elector
$9.38
Boorowa Council Statutory Advertising Campaign Expenditure
Nominations $516.90
Candidates and polling places $1,249.20
Uncontested elections $0.00
Results $107.69
TOTAL $1,873.79
Election Services
Elector Enquiry Centre
The Elector Enquiry Centre answered 32 calls from postcodes within Boorowa Council
area.
NSWEC Website
There were 429 unique visitors to Boorowa Council election web page.
Braille Ballot Papers
No braille ballot papers were requested or printed.
Returning Officer
Mary Moffitt
18 Percentage of Penalty Notices Issued to Enrolment (as shown on Authorised Roll)

REPORT ON THE 2012 LOCAL GOVERNMENT ELECTIONS
Boorowa Council
193
Returning Officer’s Office
Young Region Returning Officer's Office
Young Town Hall
189-205 Boorowa Street
Young NSW 2594
Councils in Region
Boorowa Council, Cowra Shire Council, Weddin Shire Council and Young Shire
Council
Staffing
Office Manager 1
Senior Office Assistant 0
Office Assistants 0
Polling Place Managers 4
Polling Place Assistants 0
Deputy Polling Place Managers 0
Declaration Vote Issuing Officer 0
Election Officials 5
Council Count Manager 0
Part Day Election Officials 0
Total Staff 10
Polling Places
Pre-poll Centres 3
Declared Institutions 2
Election day Polling Places 5
Pre-poll centre locations
Boorowa Pre-Poll, Young Region Returning Officer's Office, Sydney Town Hall
Polling place locations
For 2012 map and polling places see –
www.pastvtr.elections.nsw.gov.au/LGE2012/boorowa-council.html
Advertising
Statutory Campaign
The Council requested that the statutory advertisements be placed in the following
press:
Boorowa News
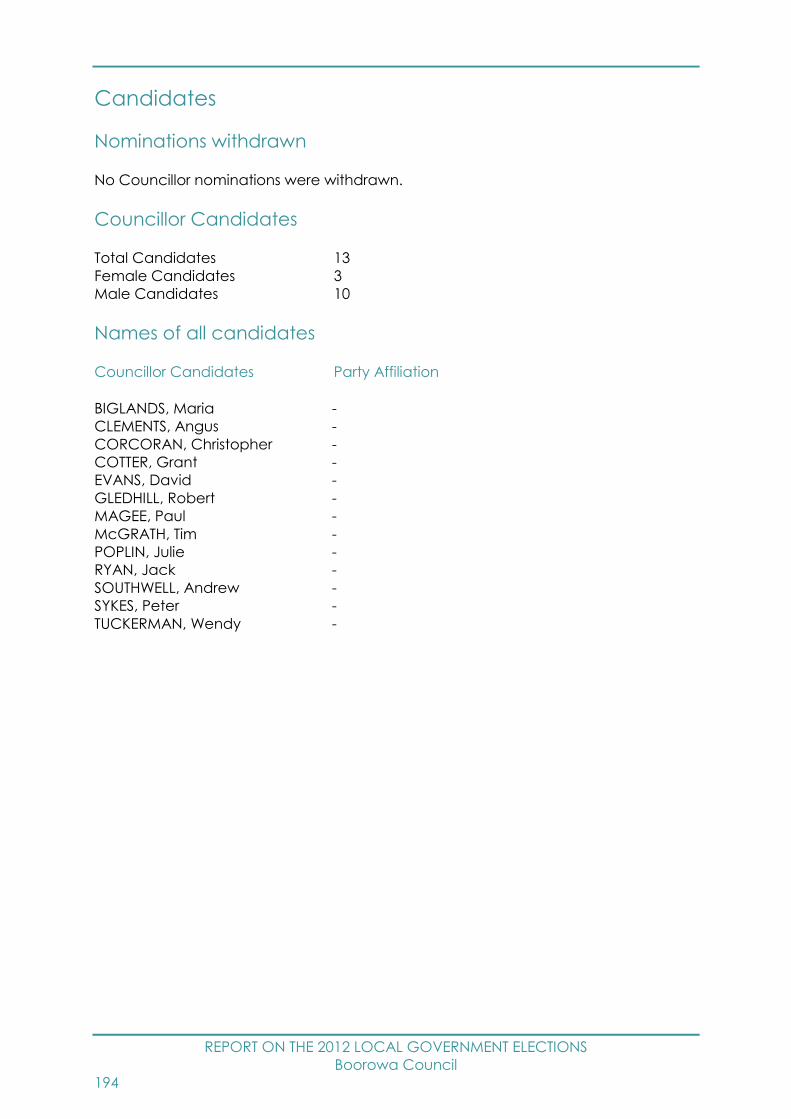
REPORT ON THE 2012 LOCAL GOVERNMENT ELECTIONS
Boorowa Council
194
Candidates
Nominations withdrawn
No Councillor nominations were withdrawn.
Councillor Candidates
Total Candidates 13
Female Candidates 3
Male Candidates 10
Names of all candidates
Councillor Candidates Party Affiliation
BIGLANDS, Maria -
CLEMENTS, Angus -
CORCORAN, Christopher -
COTTER, Grant -
EVANS, David -
GLEDHILL, Robert -
MAGEE, Paul -
McGRATH, Tim -
POPLIN, Julie -
RYAN, Jack -
SOUTHWELL, Andrew -
SYKES, Peter -
TUCKERMAN, Wendy -

REPORT ON THE 2012 LOCAL GOVERNMENT ELECTIONS
Bourke Shire Council
195
Bourke Shire Council Report
Election Summary
Poll declared by Thursday, 13 September, 2012
Councillor elections, successful candidates
Councillor name Party Affiliation
BARTLEY, Victor -
BENNETT, Jack -
BROWN, Sarah -
DAVIS, Sally -
DORRINGTON, Cec -
FORD, Lachlan -
HOLLMAN, Barry -
JOHNSON, Stuart -
LEWIS, Andrew -
STUTSEL, Bob -
For full details of results see website –
www.pastvtr.elections.nsw.gov.au/LGE2012/bourke-shire-council.html
For a breakdown of voting by Vote Type (Ordinary, Declared Institution/Pre-poll,
Postal, Provisional/Silent) see the Councillor Election page of the above website, on
the Final Results tab select 04 - Enrolment and Voting by Aggregated Vote Type
Report.
Enrolment
Total Electors 1,804
Residential roll 1,804
Non-residential roll 0
SmartRolled Electors 180
(30/7/11 – 30/7/12)
Participation and Informality
Participation rate 74.8%
Formal votes 1,282
Informal votes 68
Total votes 1,350
Informality rate 5.0%

REPORT ON THE 2012 LOCAL GOVERNMENT ELECTIONS
Bourke Shire Council
196
Failure to Vote
Penalty Notices Issued 372
Rate of Failure to Vote19 20.7%
Election Costs
Total Cost of the Bourke Shire Council 2012 Election
$23,546.00
Cost per elector
$13.10
Bourke Shire Council Statutory Advertising Campaign Expenditure
Nominations $250.80
Candidates and polling places $897.60
Uncontested elections $0.00
Results $105.60
TOTAL $1,254.00
Election Services
Elector Enquiry Centre
The Elector Enquiry Centre answered 20 calls from postcodes within Bourke Shire
Council area.
NSWEC Website
There were 391 unique visitors to Bourke Shire Council election web page.
Braille Ballot Papers
No braille ballot papers were requested or printed.
Returning Officer
Stephen Middleton
19 Percentage of Penalty Notices Issued to Enrolment (as shown on Authorised Roll)

REPORT ON THE 2012 LOCAL GOVERNMENT ELECTIONS
Bourke Shire Council
197
Returning Officer’s Office
Cobar Region Returning Officer's Office
19 Barton Street
Cobar NSW 2835
Councils in Region
Bogan Shire Council, Bourke Shire Council, Brewarrina Shire Council and Cobar Shire
Council
Staffing
Office Manager 0
Senior Office Assistant 0
Office Assistants 0
Polling Place Managers 4
Polling Place Assistants 0
Deputy Polling Place Managers 0
Declaration Vote Issuing Officer 0
Election Officials 5
Council Count Manager 0
Part Day Election Officials 0
Total Staff 9
Polling Places
Pre-poll Centres 3
Declared Institutions 0
Election day Polling Places 5
Pre-poll centre locations
Bourke Pre-Poll, Cobar Region Returning Officer's Office, Sydney Town Hall
Polling place locations
For 2012 map and polling places see –
www.pastvtr.elections.nsw.gov.au/LGE2012/bourke-shire-council.html
Advertising
Statutory Campaign
The Council requested that the statutory advertisements be placed in the following
press:
Bourke Western Herald

REPORT ON THE 2012 LOCAL GOVERNMENT ELECTIONS
Bourke Shire Council
198
Candidates
Nominations withdrawn
No Councillor nominations were withdrawn.
Councillor Candidates
Total Candidates 11
Female Candidates 2
Male Candidates 9
Names of all candidates
Councillor Candidates Party Affiliation
BARTLEY, Victor -
BENNETT, Jack -
BROWN, Sarah -
DAVIS, Sally -
DORRINGTON, Cec -
FERGUSON, Alistair -
FORD, Lachlan -
HOLLMAN, Barry -
JOHNSON, Stuart -
LEWIS, Andrew -
STUTSEL, Bob -
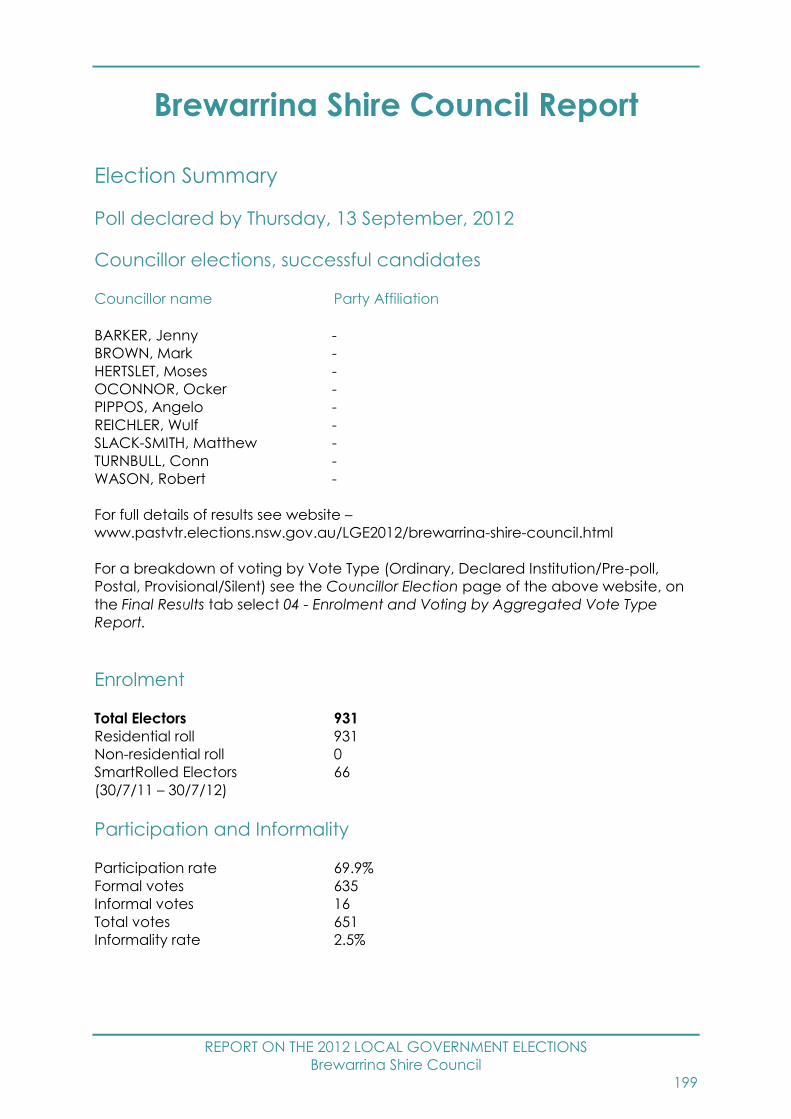
REPORT ON THE 2012 LOCAL GOVERNMENT ELECTIONS
Brewarrina Shire Council
199
Brewarrina Shire Council Report
Election Summary
Poll declared by Thursday, 13 September, 2012
Councillor elections, successful candidates
Councillor name Party Affiliation
BARKER, Jenny -
BROWN, Mark -
HERTSLET, Moses -
OCONNOR, Ocker -
PIPPOS, Angelo -
REICHLER, Wulf -
SLACK-SMITH, Matthew -
TURNBULL, Conn -
WASON, Robert -
For full details of results see website –
www.pastvtr.elections.nsw.gov.au/LGE2012/brewarrina-shire-council.html
For a breakdown of voting by Vote Type (Ordinary, Declared Institution/Pre-poll,
Postal, Provisional/Silent) see the Councillor Election page of the above website, on
the Final Results tab select 04 - Enrolment and Voting by Aggregated Vote Type
Report.
Enrolment
Total Electors 931
Residential roll 931
Non-residential roll 0
SmartRolled Electors 66
(30/7/11 – 30/7/12)
Participation and Informality
Participation rate 69.9%
Formal votes 635
Informal votes 16
Total votes 651
Informality rate 2.5%

REPORT ON THE 2012 LOCAL GOVERNMENT ELECTIONS
Brewarrina Shire Council
200
Failure to Vote
Penalty Notices Issued 231
Rate of Failure to Vote20 24.9%
Election Costs
Total Cost of the Brewarrina Shire Council 2012 Election
$14,771.00
Cost per elector
$15.93
Brewarrina Shire Council Statutory Advertising Campaign Expenditure
Nominations $250.80
Candidates and polling places $408.00
Uncontested elections $0.00
Results $102.00
TOTAL $760.80
Election Services
Elector Enquiry Centre
The Elector Enquiry Centre answered 12 calls from postcodes within Brewarrina Shire
Council area.
NSWEC Website
There were 256 unique visitors to Brewarrina Shire Council election web page.
Braille Ballot Papers
No braille ballot papers were requested or printed.
Returning Officer
Stephen Middleton
20 Percentage of Penalty Notices Issued to Enrolment (as shown on Authorised Roll)

REPORT ON THE 2012 LOCAL GOVERNMENT ELECTIONS
Brewarrina Shire Council
201
Returning Officer’s Office
Cobar Region Returning Officer's Office
19 Barton Street
Cobar NSW 2835
Councils in Region
Bogan Shire Council, Bourke Shire Council, Brewarrina Shire Council and Cobar Shire
Council
Staffing
Office Manager 0
Senior Office Assistant 0
Office Assistants 0
Polling Place Managers 3
Polling Place Assistants 0
Deputy Polling Place Managers 0
Declaration Vote Issuing Officer 0
Election Officials 3
Council Count Manager 0
Part Day Election Officials 0
Total Staff 6
Polling Places
Pre-poll Centres 3
Declared Institutions 0
Election day Polling Places 4
Pre-poll centre locations
Brewarrina Pre-Poll, Cobar Region Returning Officer's Office, Sydney Town Hall
Polling place locations
For 2012 map and polling places see –
www.pastvtr.elections.nsw.gov.au/LGE2012/brewarrina-shire-council.html
Advertising
Statutory Campaign
The Council requested that the statutory advertisements be placed in the following
press:
Bourke Western Herald
Brewarrina News

REPORT ON THE 2012 LOCAL GOVERNMENT ELECTIONS
Brewarrina Shire Council
202
Candidates
Nominations withdrawn
No Councillor nominations were withdrawn.
Councillor Candidates
Total Candidates 10
Female Candidates 1
Male Candidates 9
Names of all candidates
Councillor Candidates Party Affiliation
BARKER, Jenny -
BROWN, Mark -
HERTSLET, Moses -
NEALE, Wayne -
OCONNOR, Ocker -
PIPPOS, Angelo -
REICHLER, Wulf -
SLACK-SMITH, Matthew -
TURNBULL, Conn -
WASON, Robert -
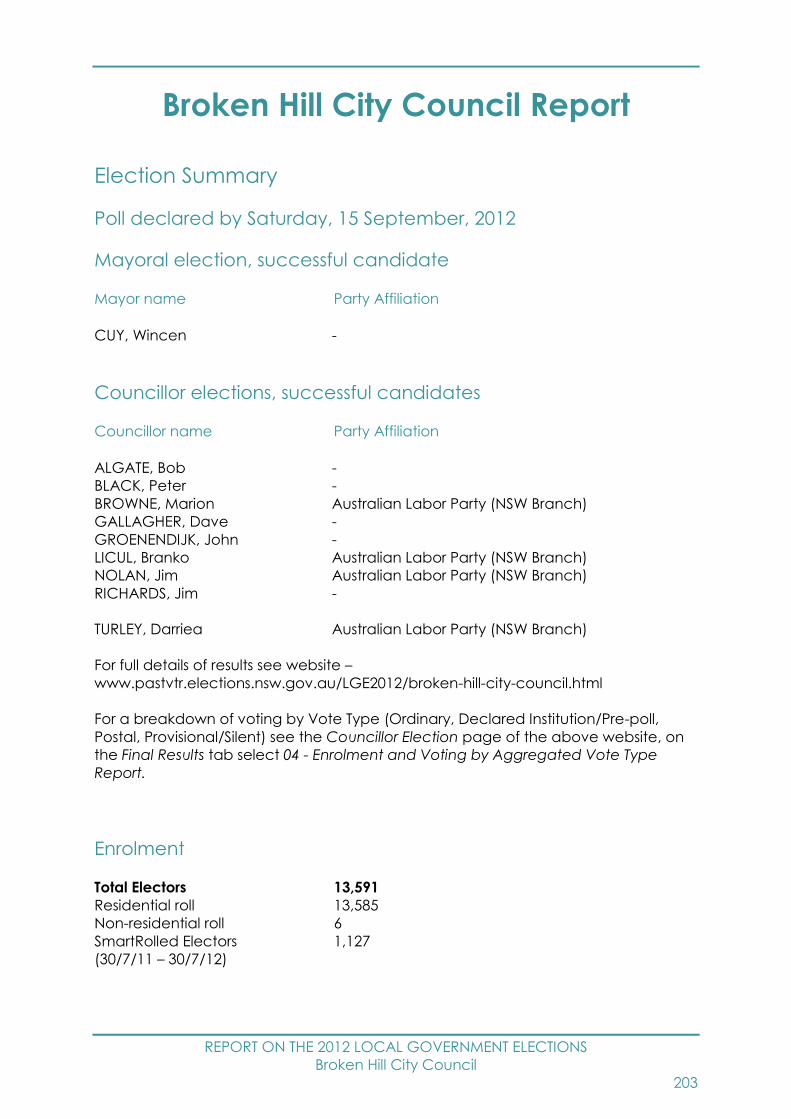
REPORT ON THE 2012 LOCAL GOVERNMENT ELECTIONS
Broken Hill City Council
203
Broken Hill City Council Report
Election Summary
Poll declared by Saturday, 15 September, 2012
Mayoral election, successful candidate
Mayor name Party Affiliation
CUY, Wincen -
Councillor elections, successful candidates
Councillor name Party Affiliation
ALGATE, Bob -
BLACK, Peter -
BROWNE, Marion Australian Labor Party (NSW Branch)
GALLAGHER, Dave -
GROENENDIJK, John -
LICUL, Branko Australian Labor Party (NSW Branch)
NOLAN, Jim Australian Labor Party (NSW Branch)
RICHARDS, Jim -
TURLEY, Darriea Australian Labor Party (NSW Branch)
For full details of results see website –
www.pastvtr.elections.nsw.gov.au/LGE2012/broken-hill-city-council.html
For a breakdown of voting by Vote Type (Ordinary, Declared Institution/Pre-poll,
Postal, Provisional/Silent) see the Councillor Election page of the above website, on
the Final Results tab select 04 - Enrolment and Voting by Aggregated Vote Type
Report.
Enrolment
Total Electors 13,591
Residential roll 13,585
Non-residential roll 6
SmartRolled Electors 1,127
(30/7/11 – 30/7/12)
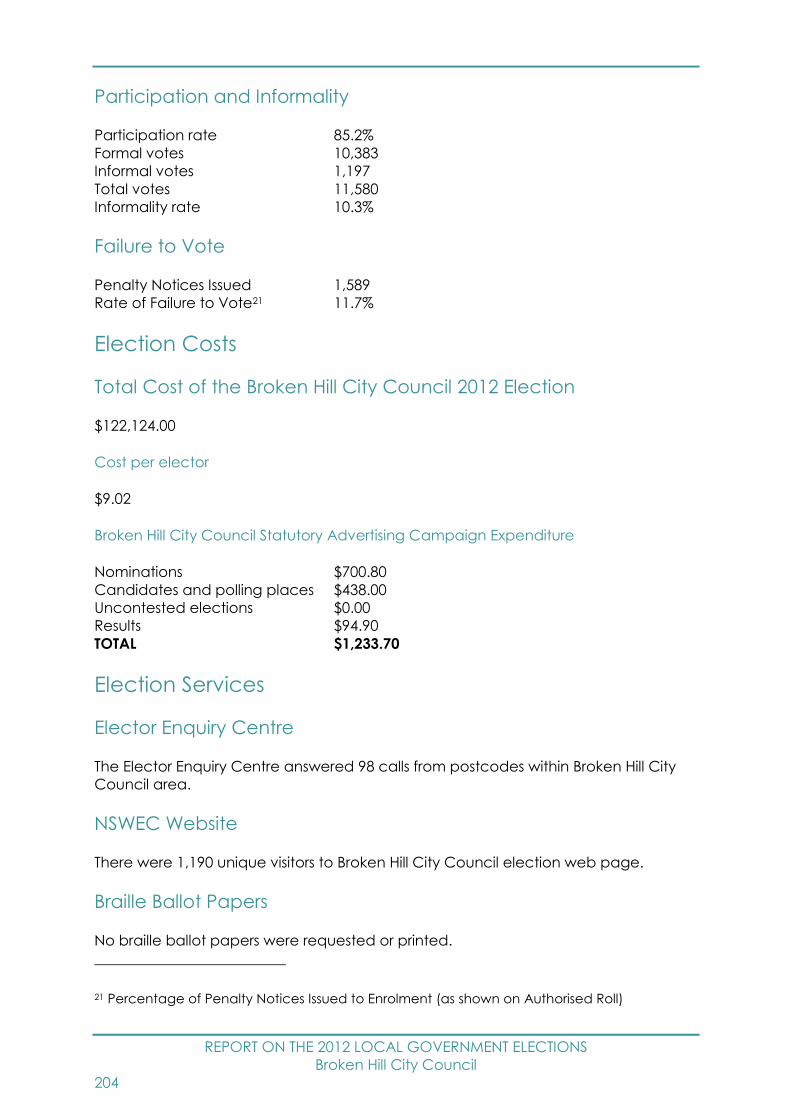
REPORT ON THE 2012 LOCAL GOVERNMENT ELECTIONS
Broken Hill City Council
204
Participation and Informality
Participation rate 85.2%
Formal votes 10,383
Informal votes 1,197
Total votes 11,580
Informality rate 10.3%
Failure to Vote
Penalty Notices Issued 1,589
Rate of Failure to Vote21 11.7%
Election Costs
Total Cost of the Broken Hill City Council 2012 Election
$122,124.00
Cost per elector
$9.02
Broken Hill City Council Statutory Advertising Campaign Expenditure
Nominations $700.80
Candidates and polling places $438.00
Uncontested elections $0.00
Results $94.90
TOTAL $1,233.70
Election Services
Elector Enquiry Centre
The Elector Enquiry Centre answered 98 calls from postcodes within Broken Hill City
Council area.
NSWEC Website
There were 1,190 unique visitors to Broken Hill City Council election web page.
Braille Ballot Papers
No braille ballot papers were requested or printed.
21 Percentage of Penalty Notices Issued to Enrolment (as shown on Authorised Roll)

REPORT ON THE 2012 LOCAL GOVERNMENT ELECTIONS
Broken Hill City Council
205
Returning Officer
Darren Flowers
Returning Officer’s Office
Broken Hill Region Returning Officer's Office
37-39 Oxide Street
Broken Hill NSW 2880
Councils in Region
Broken Hill City Council, Central Darling Shire Council and Wentworth Shire Council
Staffing
Office Manager 1
Senior Office Assistant 0
Office Assistants 19
Polling Place Managers 7
Polling Place Assistants 4
Deputy Polling Place Managers 0
Declaration Vote Issuing Officer 1
Election Officials 17
Council Count Manager 3
Part Day Election Officials 2
Total Staff 54
Polling Places
Pre-poll Centres 2
Declared Institutions 3
Election day Polling Places 8
Pre-poll centre locations
Broken Hill Region Returning Officer's Office, Sydney Town Hall
Polling place locations
For 2012 map and polling places see –
www.pastvtr.elections.nsw.gov.au/LGE2012/broken-hill-city-council.html
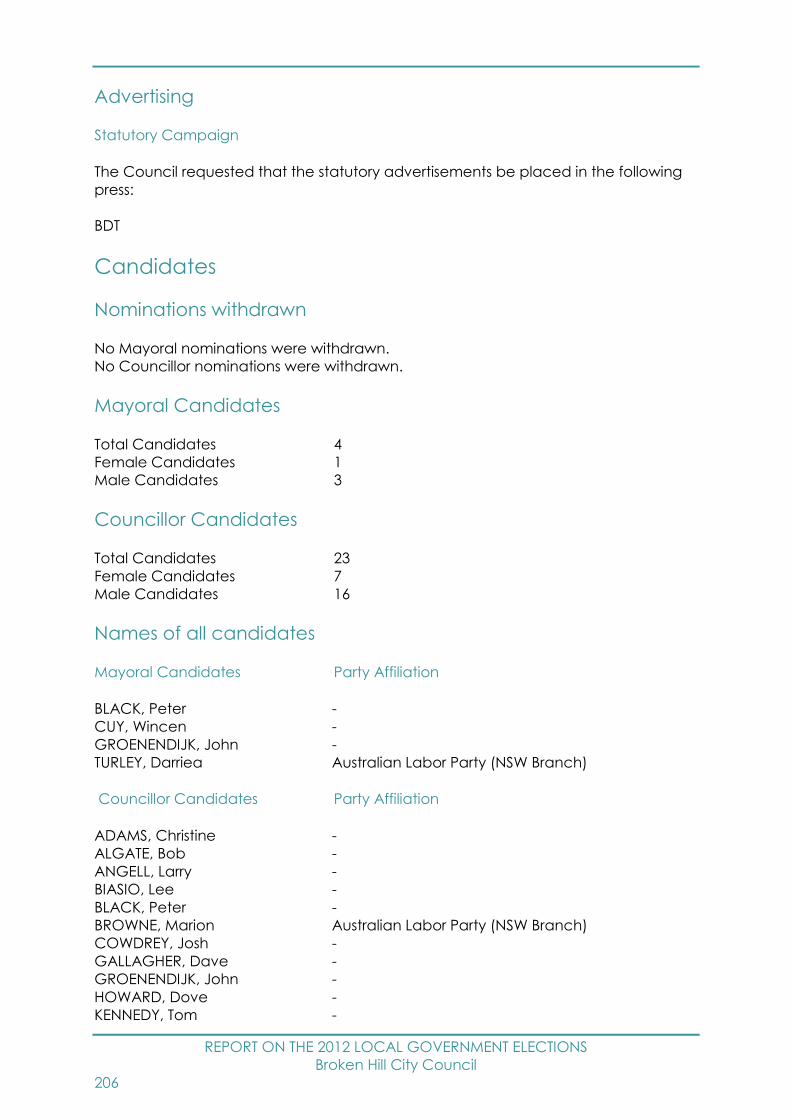
REPORT ON THE 2012 LOCAL GOVERNMENT ELECTIONS
Broken Hill City Council
206
Advertising
Statutory Campaign
The Council requested that the statutory advertisements be placed in the following
press:
BDT
Candidates
Nominations withdrawn
No Mayoral nominations were withdrawn.
No Councillor nominations were withdrawn.
Mayoral Candidates
Total Candidates 4
Female Candidates 1
Male Candidates 3
Councillor Candidates
Total Candidates 23
Female Candidates 7
Male Candidates 16
Names of all candidates
Mayoral Candidates Party Affiliation
BLACK, Peter -
CUY, Wincen -
GROENENDIJK, John -
TURLEY, Darriea Australian Labor Party (NSW Branch)
Councillor Candidates Party Affiliation
ADAMS, Christine -
ALGATE, Bob -
ANGELL, Larry -
BIASIO, Lee -
BLACK, Peter -
BROWNE, Marion Australian Labor Party (NSW Branch)
COWDREY, Josh -
GALLAGHER, Dave -
GROENENDIJK, John -
HOWARD, Dove -
KENNEDY, Tom -
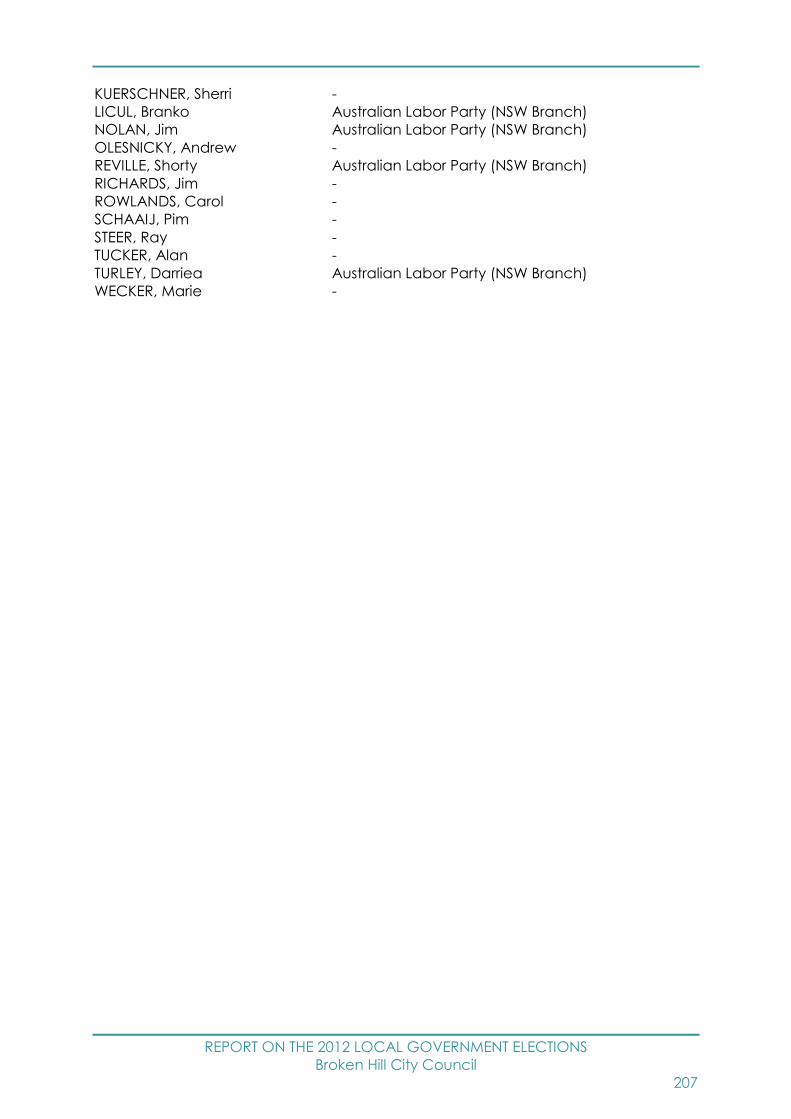
REPORT ON THE 2012 LOCAL GOVERNMENT ELECTIONS
Broken Hill City Council
207
KUERSCHNER, Sherri -
LICUL, Branko Australian Labor Party (NSW Branch)
NOLAN, Jim Australian Labor Party (NSW Branch)
OLESNICKY, Andrew -
REVILLE, Shorty Australian Labor Party (NSW Branch)
RICHARDS, Jim -
ROWLANDS, Carol -
SCHAAIJ, Pim -
STEER, Ray -
TUCKER, Alan -
TURLEY, Darriea Australian Labor Party (NSW Branch)
WECKER, Marie -

REPORT ON THE 2012 LOCAL GOVERNMENT ELECTIONS
Burwood Council
208
Burwood Council Report
Election Summary
Poll declared by Saturday, 15 September, 2012
Mayoral election, successful candidate
Mayor name Party Affiliation
FAKER, John Australian Labor Party (NSW Branch)
Councillor elections, successful candidates
Councillor name Party Affiliation
DEANS, Sally Australian Labor Party (NSW Branch)
DOUEIHI, Tony Liberal Party of Australia New South Wales Division
FURNEAUX-COOK, Lesley Burwood Community Voice
MANNAH, George Australian Labor Party (NSW Branch)
TAUNTON, Justin Liberal Party of Australia New South Wales Division
WONG, Ernest Australian Labor Party (NSW Branch)
For full details of results see website –
www.pastvtr.elections.nsw.gov.au/LGE2012/burwood-council.html
For a breakdown of voting by Vote Type (Ordinary, Declared Institution/Pre-poll,
Postal, Provisional/Silent) see the Councillor Election page of the above website, on
the Final Results tab select 04 - Enrolment and Voting by Aggregated Vote Type
Report.
Poll
"Are you in favour of Burwood Local Government Area being proclaimed a City to
be known as Burwood City?"
Yes 8,931
No 6,476
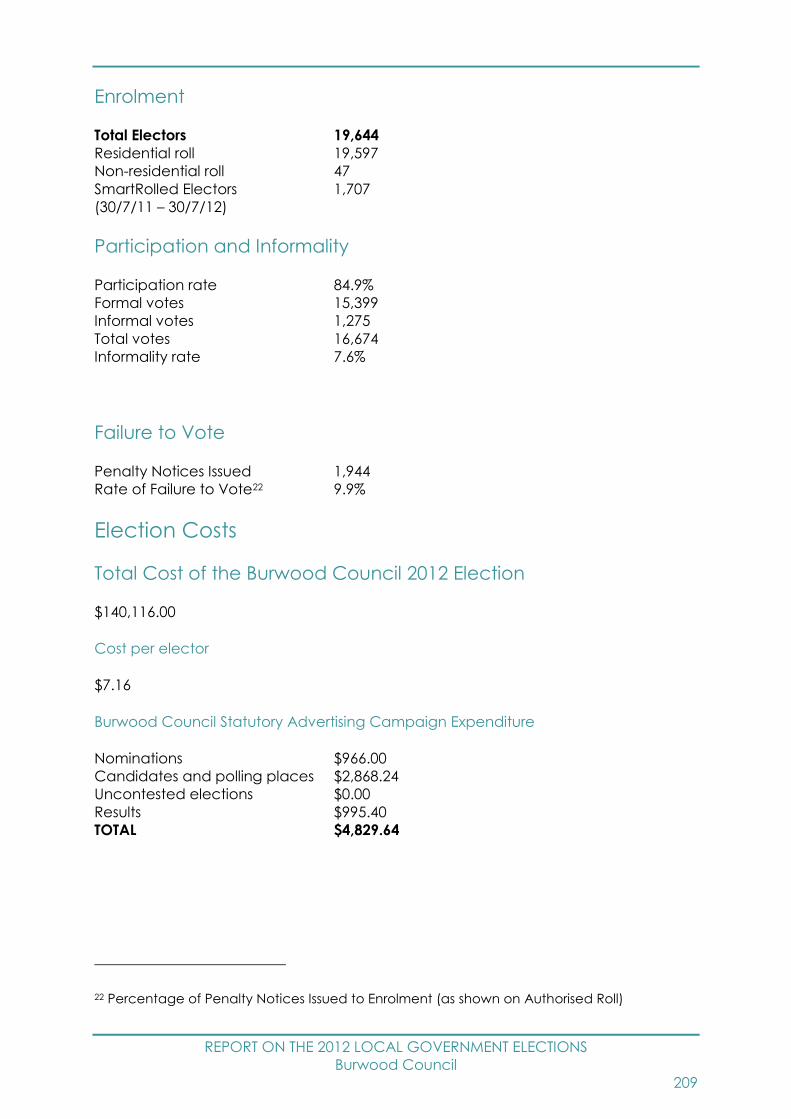
REPORT ON THE 2012 LOCAL GOVERNMENT ELECTIONS
Burwood Council
209
Enrolment
Total Electors 19,644
Residential roll 19,597
Non-residential roll 47
SmartRolled Electors 1,707
(30/7/11 – 30/7/12)
Participation and Informality
Participation rate 84.9%
Formal votes 15,399
Informal votes 1,275
Total votes 16,674
Informality rate 7.6%
Failure to Vote
Penalty Notices Issued 1,944
Rate of Failure to Vote22 9.9%
Election Costs
Total Cost of the Burwood Council 2012 Election
$140,116.00
Cost per elector
$7.16
Burwood Council Statutory Advertising Campaign Expenditure
Nominations $966.00
Candidates and polling places $2,868.24
Uncontested elections $0.00
Results $995.40
TOTAL $4,829.64
22 Percentage of Penalty Notices Issued to Enrolment (as shown on Authorised Roll)
REPORT ON THE 2012 LOCAL GOVERNMENT ELECTIONS
Burwood Council
210
Election Services
Elector Enquiry Centre
The Elector Enquiry Centre answered 638 calls from postcodes within Burwood
Council area.
NSWEC Website
There were 2,300 unique visitors to Burwood Council election web page.
Braille Ballot Papers
Four braille ballot papers were requested or printed.
Returning Officer
John Neely
Returning Officer’s Office
Burwood Region Returning Officer's Office
Burwood Council Chambers
1-17 Elsie Street
Burwood NSW 2134
Councils in Region
Ashfield Council, Burwood Council and Strathfield Municipal Council
Staffing
Office Manager 1
Senior Office Assistant 0
Office Assistants 34
Polling Place Managers 8
Polling Place Assistants 11
Deputy Polling Place Managers 4
Declaration Vote Issuing Officer 4
Election Officials 38
Council Count Manager 3
Part Day Election Officials 5
Total Staff 108
Polling Places
Pre-poll Centres 2
Declared Institutions 4
Election day Polling Places 9
REPORT ON THE 2012 LOCAL GOVERNMENT ELECTIONS
Burwood Council
211
Pre-poll centre locations
Burwood Region Returning Officer's Office, Sydney Town Hall
Polling place locations
For 2012 map and polling places see –
www.pastvtr.elections.nsw.gov.au/LGE2012/burwood-council.html
Advertising
Statutory Campaign
The Council requested that the statutory advertisements be placed in the following
press:
Inner West Courier
Candidates
Nominations withdrawn
No Mayoral nominations were withdrawn.
No Councillor nominations were withdrawn.
Mayoral Candidates
Total Candidates 4
Female Candidates 1
Male Candidates 3
Councillor Candidates
Total Candidates 23
Female Candidates 10
Male Candidates 13
Names of all candidates
Mayoral Candidates Party Affiliation
FAKER, John Australian Labor Party (NSW Branch)
FURNEAUX-COOK, Lesley Burwood Community Voice
TAUNTON, Justin Liberal Party of Australia New South Wales Division
WEILEY, David -

REPORT ON THE 2012 LOCAL GOVERNMENT ELECTIONS
Burwood Council
212
Councillor Candidates Party Affiliation
BEEKMAN, Tony Burwood Community Voice
BUCKLEY, Ken Burwood Community Voice
BURNS, Pamela -
CACCIOLA, Gaetano Australian Labor Party (NSW Branch)
DEANS, Sally Australian Labor Party (NSW Branch)
DIXIT, Raj Liberal Party of Australia New South Wales Division
DOUEIHI, Tony Liberal Party of Australia New South Wales Division
EASSON, Louise Australian Labor Party (NSW Branch)
ENTWISLE, Tim Burwood Community Voice
FAKER, John Australian Labor Party (NSW Branch)
FURNEAUX-COOK, Lesley Burwood Community Voice
GRAY, Christopher Australian Labor Party (NSW Branch)
LIANG, Henson Liberal Party of Australia New South Wales Division
MANNAH, George Australian Labor Party (NSW Branch)
SCLANDERS, Rhonda Burwood Community Voice
SOCHAN, Bea Burwood Community Voice
SUNG, Suk Liberal Party of Australia New South Wales Division
TAUNTON, Justin Liberal Party of Australia New South Wales Division
TURCO, Angela -
WEILEY, David -
WEILEY, Vanessa -
WONG, Ernest Australian Labor Party (NSW Branch)
YU, Ellen Liberal Party of Australia New South Wales Division
REPORT ON THE 2012 LOCAL GOVERNMENT ELECTIONS
Byron Shire Council
213
Byron Shire Council Report
Election Summary
Poll declared by Thursday, 13 September, 2012
Mayoral election, successful candidate
Mayor name Party Affiliation
RICHARDSON, Simon The Greens
Councillor elections, successful candidates
Councillor name Party Affiliation
CAMERON, Basil Our Sustainable Future
CUBIS, Chris -
DEY, Duncan The Greens
HUNTER, Alan -
IBRAHIM, Sol -
SPOONER, Paul -
WANCHAP, Rose The Greens
WOODS, Diane -
For full details of results see website –
www.pastvtr.elections.nsw.gov.au/LGE2012/byron-shire-council.html
For a breakdown of voting by Vote Type (Ordinary, Declared Institution/Pre-poll,
Postal, Provisional/Silent) see the Councillor Election page of the above website, on
the Final Results tab select 04 - Enrolment and Voting by Aggregated Vote Type
Report.
Enrolment
Total Electors 21,740
Residential roll 21,681
Non-residential roll 59
SmartRolled Electors 1,993
(30/7/11 – 30/7/12)
REPORT ON THE 2012 LOCAL GOVERNMENT ELECTIONS
Byron Shire Council
214
Participation and Informality
Participation rate 75.8%
Formal votes 15,578
Informal votes 903
Total votes 16,481
Informality rate 5.5%
Failure to Vote
Penalty Notices Issued 4,469
Rate of Failure to Vote23 20.7%
Election Costs
Total Cost of the Byron Shire Council 2012 Election
$140,851.00
Cost per elector
$6.51
Byron Shire Council Statutory Advertising Campaign Expenditure
Nominations $904.50
Candidates and polling places $2,409.88
Uncontested elections $0.00
Results $86.00
TOTAL $3,400.38
Election Services
Elector Enquiry Centre
The Elector Enquiry Centre answered 328 calls from postcodes within Byron Shire
Council area.
NSWEC Website
There were 2,345 unique visitors to Byron Shire Council election web page.
23 Percentage of Penalty Notices Issued to Enrolment (as shown on Authorised Roll)
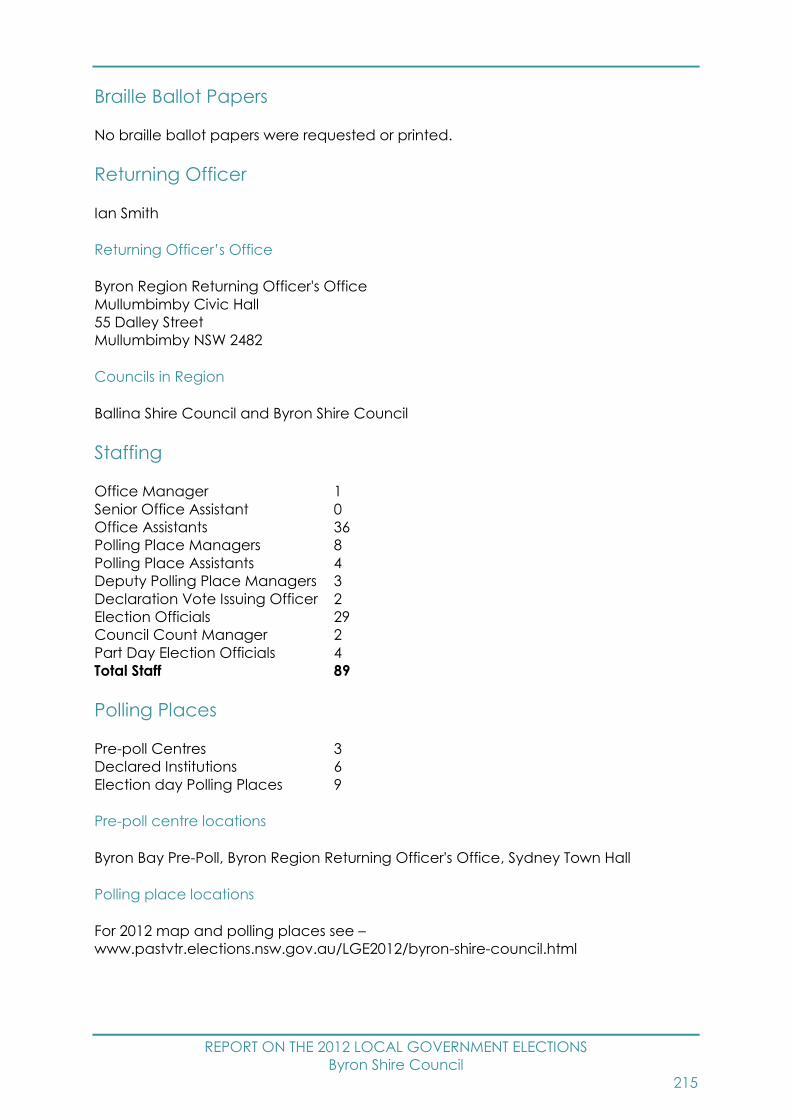
REPORT ON THE 2012 LOCAL GOVERNMENT ELECTIONS
Byron Shire Council
215
Braille Ballot Papers
No braille ballot papers were requested or printed.
Returning Officer
Ian Smith
Returning Officer’s Office
Byron Region Returning Officer's Office
Mullumbimby Civic Hall
55 Dalley Street
Mullumbimby NSW 2482
Councils in Region
Ballina Shire Council and Byron Shire Council
Staffing
Office Manager 1
Senior Office Assistant 0
Office Assistants 36
Polling Place Managers 8
Polling Place Assistants 4
Deputy Polling Place Managers 3
Declaration Vote Issuing Officer 2
Election Officials 29
Council Count Manager 2
Part Day Election Officials 4
Total Staff 89
Polling Places
Pre-poll Centres 3
Declared Institutions 6
Election day Polling Places 9
Pre-poll centre locations
Byron Bay Pre-Poll, Byron Region Returning Officer's Office, Sydney Town Hall
Polling place locations
For 2012 map and polling places see –
www.pastvtr.elections.nsw.gov.au/LGE2012/byron-shire-council.html

REPORT ON THE 2012 LOCAL GOVERNMENT ELECTIONS
Byron Shire Council
216
Advertising
Statutory Campaign
The Council requested that the statutory advertisements be placed in the following
press:
Byron Shire Echo
Byron Shire News
Candidates
Nominations withdrawn
No Mayoral nominations were withdrawn.
No Councillor nominations were withdrawn.
Mayoral Candidates
Total Candidates 6
Female Candidates 2
Male Candidates 4
Councillor Candidates
Total Candidates 29
Female Candidates 12
Male Candidates 17
Names of all candidates
Mayoral Candidates Party Affiliation
CAMERON, Basil Our Sustainable Future
IBRAHIM, Sol -
MORGAN, -
RICHARDSON, Simon The Greens
SUGARMAN, Jack -
WOODS, Diane -
Councillor Candidates Party Affiliation
ARROWSMITH, Paul Our Sustainable Future
BEATSON, Jim The Greens
BROMLEY, Cherie -
CAMERON, Basil Our Sustainable Future
CUBIS, Chris -
DEY, Duncan The Greens
EADY, Mira -
GEARY, Syd -

REPORT ON THE 2012 LOCAL GOVERNMENT ELECTIONS
Byron Shire Council
217
GORR, Amanda -
HALLINAN, Mandy Our Sustainable Future
HAMMOND, Donna -
HART, Tony Our Sustainable Future
HOCKING, Clare The Greens
HUNTER, Alan -
IBRAHIM, Sol -
KHONG, Rhonda The Greens
KOLBE, Karin -
LYNCH, Laurie -
MACKAY, Bill -
MARTIN, Jeannette -
MORIARTY, Michael -
MURRAY, Michael -
PRESTON, Philip -
RICHARDSON, Simon The Greens
SARGEANT, Rebecca -
SPOONER, Paul -
WANCHAP, Rose The Greens
WODISKE, Bradley -
WOODS, Diane -
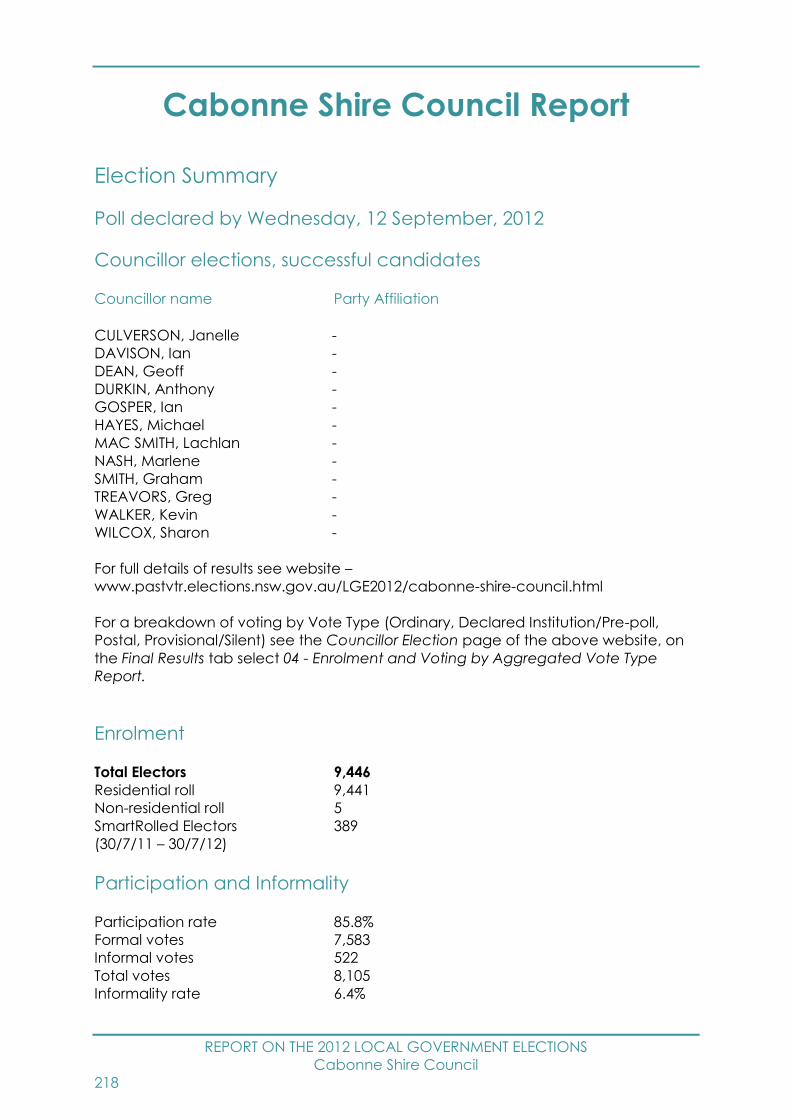
REPORT ON THE 2012 LOCAL GOVERNMENT ELECTIONS
Cabonne Shire Council
218
Cabonne Shire Council Report
Election Summary
Poll declared by Wednesday, 12 September, 2012
Councillor elections, successful candidates
Councillor name Party Affiliation
CULVERSON, Janelle -
DAVISON, Ian -
DEAN, Geoff -
DURKIN, Anthony -
GOSPER, Ian -
HAYES, Michael -
MAC SMITH, Lachlan -
NASH, Marlene -
SMITH, Graham -
TREAVORS, Greg -
WALKER, Kevin -
WILCOX, Sharon -
For full details of results see website –
www.pastvtr.elections.nsw.gov.au/LGE2012/cabonne-shire-council.html
For a breakdown of voting by Vote Type (Ordinary, Declared Institution/Pre-poll,
Postal, Provisional/Silent) see the Councillor Election page of the above website, on
the Final Results tab select 04 - Enrolment and Voting by Aggregated Vote Type
Report.
Enrolment
Total Electors 9,446
Residential roll 9,441
Non-residential roll 5
SmartRolled Electors 389
(30/7/11 – 30/7/12)
Participation and Informality
Participation rate 85.8%
Formal votes 7,583
Informal votes 522
Total votes 8,105
Informality rate 6.4%

REPORT ON THE 2012 LOCAL GOVERNMENT ELECTIONS
Cabonne Shire Council
219
Failure to Vote
Penalty Notices Issued 870
Rate of Failure to Vote24 9.2%
Election Costs
Total Cost of the Cabonne Shire Council 2012 Election
$71,820.00
Cost per elector
$7.63
Cabonne Shire Council Statutory Advertising Campaign Expenditure
Nominations $829.85
Candidates and polling places $1,919.03
Uncontested elections $0.00
Results $518.66
TOTAL $3,267.54
Election Services
Elector Enquiry Centre
The Elector Enquiry Centre answered 246 calls from postcodes within Cabonne Shire
Council area.
NSWEC Website
There were 1,897 unique visitors to Cabonne Shire Council election web page.
Braille Ballot Papers
No braille ballot papers were requested or printed.
Returning Officer
Ross Baker
24 Percentage of Penalty Notices Issued to Enrolment (as shown on Authorised Roll)
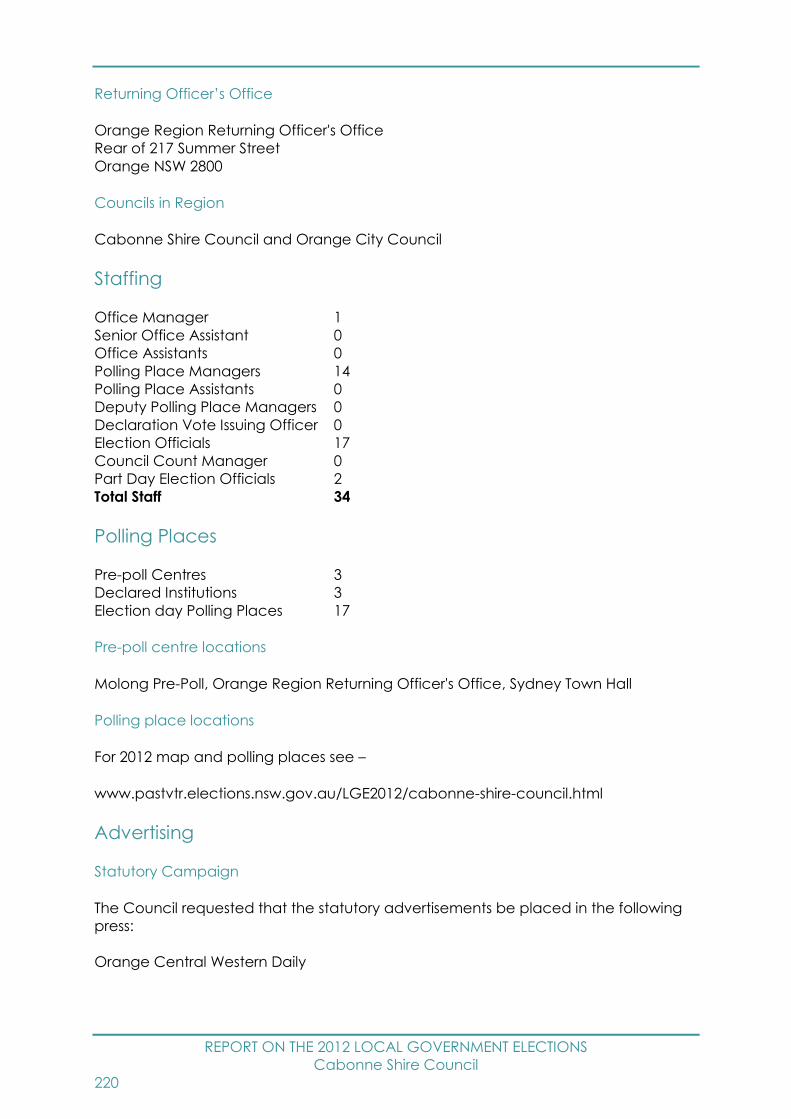
REPORT ON THE 2012 LOCAL GOVERNMENT ELECTIONS
Cabonne Shire Council
220
Returning Officer’s Office
Orange Region Returning Officer's Office
Rear of 217 Summer Street
Orange NSW 2800
Councils in Region
Cabonne Shire Council and Orange City Council
Staffing
Office Manager 1
Senior Office Assistant 0
Office Assistants 0
Polling Place Managers 14
Polling Place Assistants 0
Deputy Polling Place Managers 0
Declaration Vote Issuing Officer 0
Election Officials 17
Council Count Manager 0
Part Day Election Officials 2
Total Staff 34
Polling Places
Pre-poll Centres 3
Declared Institutions 3
Election day Polling Places 17
Pre-poll centre locations
Molong Pre-Poll, Orange Region Returning Officer's Office, Sydney Town Hall
Polling place locations
For 2012 map and polling places see –
www.pastvtr.elections.nsw.gov.au/LGE2012/cabonne-shire-council.html
Advertising
Statutory Campaign
The Council requested that the statutory advertisements be placed in the following
press:
Orange Central Western Daily
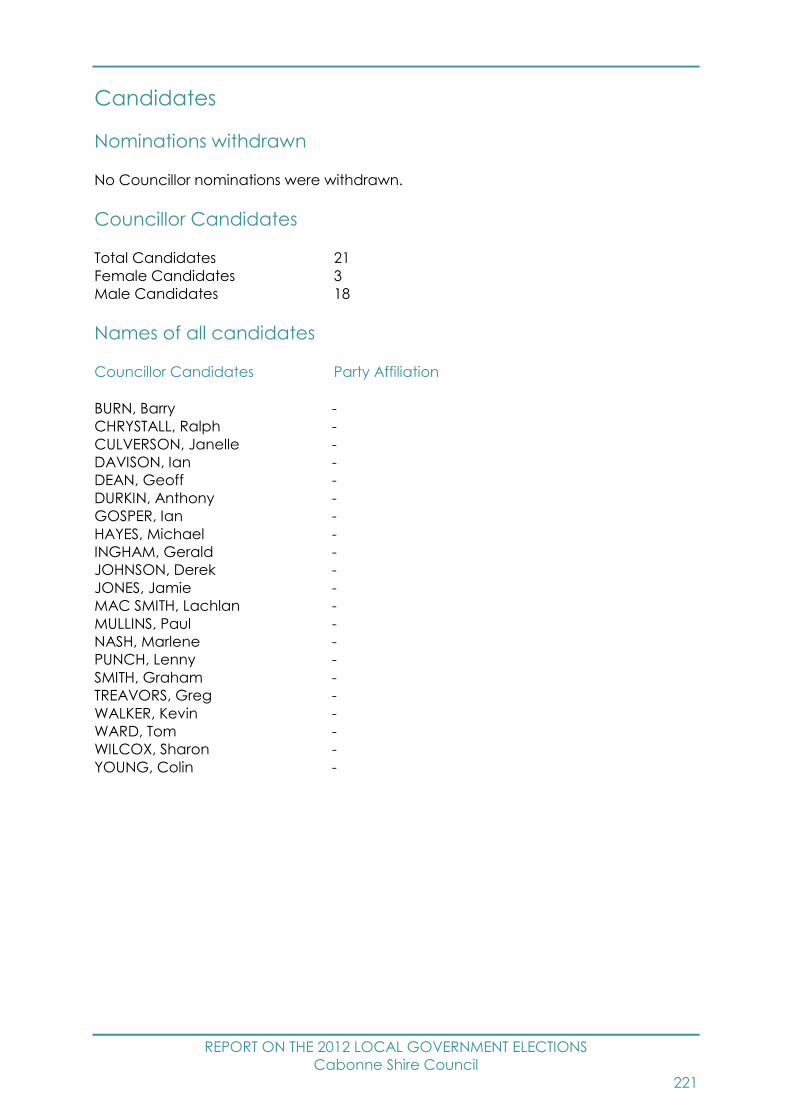
REPORT ON THE 2012 LOCAL GOVERNMENT ELECTIONS
Cabonne Shire Council
221
Candidates
Nominations withdrawn
No Councillor nominations were withdrawn.
Councillor Candidates
Total Candidates 21
Female Candidates 3
Male Candidates 18
Names of all candidates
Councillor Candidates Party Affiliation
BURN, Barry -
CHRYSTALL, Ralph -
CULVERSON, Janelle -
DAVISON, Ian -
DEAN, Geoff -
DURKIN, Anthony -
GOSPER, Ian -
HAYES, Michael -
INGHAM, Gerald -
JOHNSON, Derek -
JONES, Jamie -
MAC SMITH, Lachlan -
MULLINS, Paul -
NASH, Marlene -
PUNCH, Lenny -
SMITH, Graham -
TREAVORS, Greg -
WALKER, Kevin -
WARD, Tom -
WILCOX, Sharon -
YOUNG, Colin -
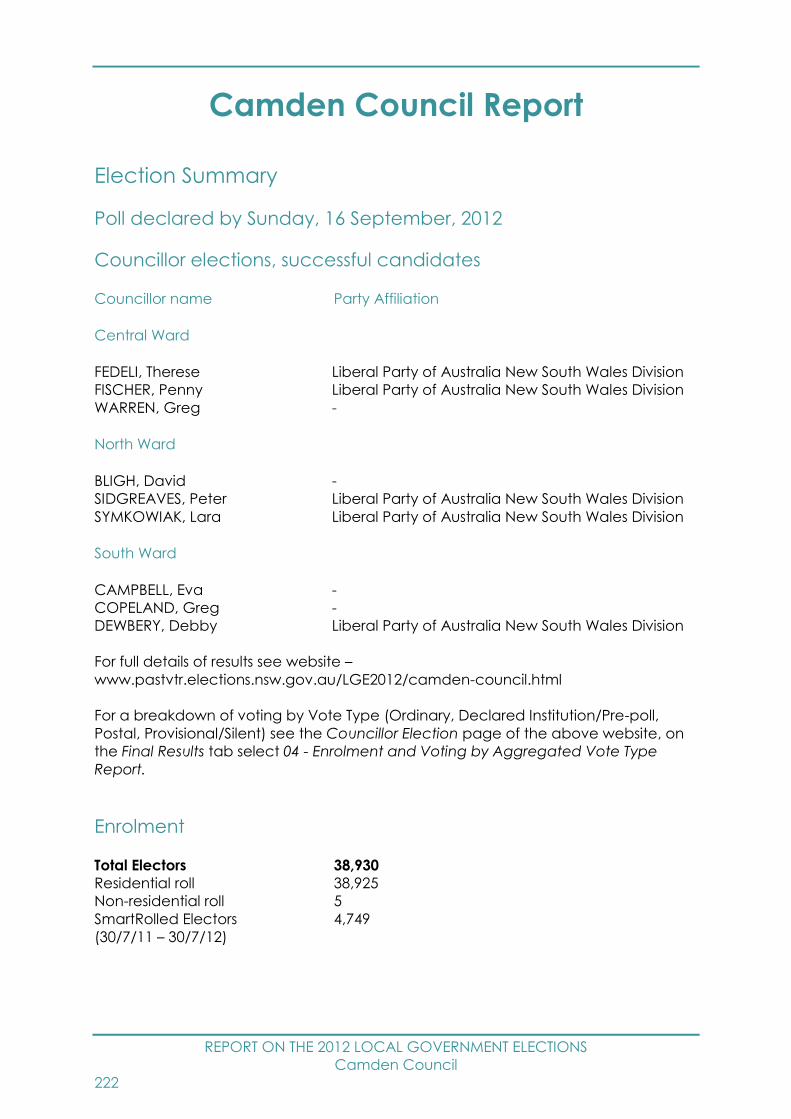
REPORT ON THE 2012 LOCAL GOVERNMENT ELECTIONS
Camden Council
222
Camden Council Report
Election Summary
Poll declared by Sunday, 16 September, 2012
Councillor elections, successful candidates
Councillor name Party Affiliation
Central Ward
FEDELI, Therese Liberal Party of Australia New South Wales Division
FISCHER, Penny Liberal Party of Australia New South Wales Division
WARREN, Greg -
North Ward
BLIGH, David -
SIDGREAVES, Peter Liberal Party of Australia New South Wales Division
SYMKOWIAK, Lara Liberal Party of Australia New South Wales Division
South Ward
CAMPBELL, Eva -
COPELAND, Greg -
DEWBERY, Debby Liberal Party of Australia New South Wales Division
For full details of results see website –
www.pastvtr.elections.nsw.gov.au/LGE2012/camden-council.html
For a breakdown of voting by Vote Type (Ordinary, Declared Institution/Pre-poll,
Postal, Provisional/Silent) see the Councillor Election page of the above website, on
the Final Results tab select 04 - Enrolment and Voting by Aggregated Vote Type
Report.
Enrolment
Total Electors 38,930
Residential roll 38,925
Non-residential roll 5
SmartRolled Electors 4,749
(30/7/11 – 30/7/12)

REPORT ON THE 2012 LOCAL GOVERNMENT ELECTIONS
Camden Council
223
Participation and Informality
Participation rate 87.1%
Formal votes 31,075
Informal votes 2,828
Total votes 33,903
Informality rate 8.3%
For details of participation and informality by ward see website –
www.pastvtr.elections.nsw.gov.au/LGE2012/lge-statistics.htm
Failure to Vote
Penalty Notices Issued 3,871
Rate of Failure to Vote25 10.0%
Election Costs
Total Cost of the Camden Council 2012 Election
$232,675.00
Cost per elector
$5.99
Camden Council Statutory Advertising Campaign Expenditure
Nominations $385.09
Candidates and polling places $3,080.70
Uncontested elections $0.00
Results $144.41
TOTAL $3,610.20
Election Services
Elector Enquiry Centre
The Elector Enquiry Centre answered 550 calls from postcodes within Camden
Council area.
NSWEC Website
There were 2,954 unique visitors to Camden Council election web page.
25 Percentage of Penalty Notices Issued to Enrolment (as shown on Authorised Roll)

REPORT ON THE 2012 LOCAL GOVERNMENT ELECTIONS
Camden Council
224
Braille Ballot Papers
No braille ballot papers were requested or printed.
Returning Officer
Paul Sweeney
Returning Officer’s Office
Camden Region Returning Officer's Office
The Undercroft, Camden Civic Centre
40 Oxley Street
Camden NSW 2570
Councils in Region
Camden Council and Wollondilly Shire Council
Staffing
Office Manager 1
Senior Office Assistant 0
Office Assistants 26
Polling Place Managers 17
Polling Place Assistants 0
Deputy Polling Place Managers 8
Declaration Vote Issuing Officer 8
Election Officials 67
Council Count Manager 0
Part Day Election Officials 10
Total Staff 137
Polling Places
Pre-poll Centres 2
Declared Institutions 0
Election day Polling Places 27
Pre-poll centre locations
Camden Region Returning Officer's Office, Sydney Town Hall
Polling place locations
For 2012 map and polling places see –
www.pastvtr.elections.nsw.gov.au/LGE2012/camden-council.html

REPORT ON THE 2012 LOCAL GOVERNMENT ELECTIONS
Camden Council
225
Advertising
Statutory Campaign
The Council requested that the statutory advertisements be placed in the following
press:
Camden/Narellan Advertiser
Camden Chronicle
Macarthur Advertiser
Candidates
Nominations withdrawn
No Councillor nominations were withdrawn.
Councillor Candidates
Total Candidates 47
Female Candidates 21
Male Candidates 26
Central Ward Councillor Candidates
Total Candidates 12
Female Candidates 6
Male Candidates 6
North Ward Councillor Candidates
Total Candidates 15
Female Candidates 6
Male Candidates 9
South Ward Councillor Candidates
Total Candidates 20
Female Candidates 9
Male Candidates 11
Names of all candidates
Councillor Candidates Party Affiliation
Central Ward
CAGNEY, Cindy -
EATON, Andrew Liberal Party of Australia New South Wales Division
EDWARDS, Coral -

REPORT ON THE 2012 LOCAL GOVERNMENT ELECTIONS
Camden Council
226
FEDELI, Therese Liberal Party of Australia New South Wales Division
FENECH, Theresa -
FISCHER, Penny Liberal Party of Australia New South Wales Division
GATT, Alison -
LUCK, Mark -
O'FLYNN, Anthony -
SWEENEY, Kevin -
WARREN, Greg -
ZAPPIA, Domenic -
North Ward
BLIGH, David -
FUNNELL, David -
HATZISAVAS, Koula -
HERBERT, Grant -
JOHNSON, Peter -
McLEAN, Linda -
McLEAN, Peter -
NOLAN, Steven -
NORTHEY, Ray -
RILEY, Jim Liberal Party of Australia New South Wales Division
SAROS, Deanne -
SIDGREAVES, Peter Liberal Party of Australia New South Wales Division
SYMKOWIAK, Lara Liberal Party of Australia New South Wales Division
VUMBACA, Frances -
WARREN, Simone -
South Ward
ANDERSON, Fred -
CAGNEY, Dave -
CAMPBELL, Eva -
COPELAND, Greg -
DEWBERY, Debby Liberal Party of Australia New South Wales Division
DOUGLAS, Briony -
DUNSHEA, Katrina -
FAIRBAIRN, Cheryl -
GLYNN, Elyse -
HEANEY, Andrew -
MADDOCK, Keith -
MORRISON, Michael Liberal Party of Australia New South Wales Division
MOSS, Ashleigh -
NOVEK, Carina -
PERIN, Richard -
STEEL, Richard -
TURNER, Maryann -
VENESS, John -
WHITE, Alan -
WINTON, Ken Liberal Party of Australia New South Wales Division

REPORT ON THE 2012 LOCAL GOVERNMENT ELECTIONS
Campbelltown City Council
227
Campbelltown City Council Report
Election Summary
Poll declared by Saturday, 15 September, 2012
Councillor elections, successful candidates
Councillor name Party Affiliation
BORG, Fred Totally Locally Committed Party
BRTICEVIC, George Australian Labor Party (NSW Branch)
CHANTHIVONG, Anoulack Australian Labor Party (NSW Branch)
DOBSON, Sue Community Service "Environment" Save
Campbelltown Koalas
GLYNN, Wal Australian Labor Party (NSW Branch)
GREISS, George Liberal Party of Australia New South Wales Division
HAWKER, Paul Liberal Party of Australia New South Wales Division
KOLKMAN, Rudi Australian Labor Party (NSW Branch)
LAKE, Paul Community First Team
LOUND, Darcy Totally Locally Committed Party
MATHESON, Alana Liberal Party of Australia New South Wales Division
MEAD, Clinton Liberal Democratic Party
OATES, Meg Australian Labor Party (NSW Branch)
ROWELL, Ted Liberal Party of Australia New South Wales Division
THOMPSON, Bob Bob Thompson's Independent Team
For full details of results see website –
www.pastvtr.elections.nsw.gov.au/LGE2012/campbelltown-city-council.html
For a breakdown of voting by Vote Type (Ordinary, Declared Institution/Pre-poll,
Postal, Provisional/Silent) see the Councillor Election page of the above website, on
the Final Results tab select 04 - Enrolment and Voting by Aggregated Vote Type
Report.
Enrolment
Total Electors 97,031
Residential roll 97,021
Non-residential roll 10
SmartRolled Electors 10,975
(30/7/11 – 30/7/12)

REPORT ON THE 2012 LOCAL GOVERNMENT ELECTIONS
Campbelltown City Council
228
Participation and Informality
Participation rate 84.6%
Formal votes 74,316
Informal votes 7,765
Total votes 82,081
Informality rate 9.5%
Failure to Vote
Penalty Notices Issued 12,246
Rate of Failure to Vote26 12.7%
Election Costs
Total Cost of the Campbelltown City Council 2012 Election
$553,687.00
Cost per elector
$5.72
Campbelltown City Council Statutory Advertising Campaign Expenditure
Nominations $2,863.54
Candidates and polling places $7,735.25
Uncontested elections $0.00
Results $1,431.77
TOTAL $12,030.56
Election Services
Elector Enquiry Centre
The Elector Enquiry Centre answered 1,193 calls from postcodes within
Campbelltown City Council area.
NSWEC Website
There were 4,316 unique visitors to Campbelltown City Council election web page.
Braille Ballot Papers
No braille ballot papers were requested or printed.
26 Percentage of Penalty Notices Issued to Enrolment (as shown on Authorised Roll)
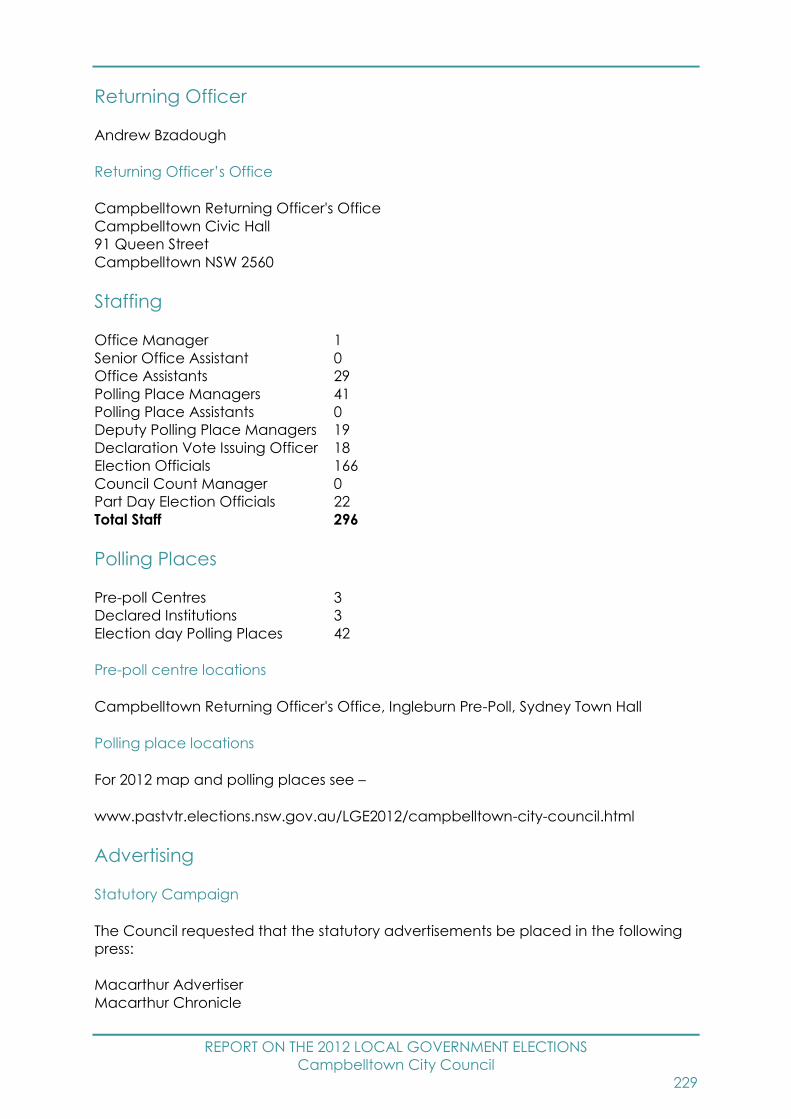
REPORT ON THE 2012 LOCAL GOVERNMENT ELECTIONS
Campbelltown City Council
229
Returning Officer
Andrew Bzadough
Returning Officer’s Office
Campbelltown Returning Officer's Office
Campbelltown Civic Hall
91 Queen Street
Campbelltown NSW 2560
Staffing
Office Manager 1
Senior Office Assistant 0
Office Assistants 29
Polling Place Managers 41
Polling Place Assistants 0
Deputy Polling Place Managers 19
Declaration Vote Issuing Officer 18
Election Officials 166
Council Count Manager 0
Part Day Election Officials 22
Total Staff 296
Polling Places
Pre-poll Centres 3
Declared Institutions 3
Election day Polling Places 42
Pre-poll centre locations
Campbelltown Returning Officer's Office, Ingleburn Pre-Poll, Sydney Town Hall
Polling place locations
For 2012 map and polling places see –
www.pastvtr.elections.nsw.gov.au/LGE2012/campbelltown-city-council.html
Advertising
Statutory Campaign
The Council requested that the statutory advertisements be placed in the following
press:
Macarthur Advertiser
Macarthur Chronicle

REPORT ON THE 2012 LOCAL GOVERNMENT ELECTIONS
Campbelltown City Council
230
Candidates
Nominations withdrawn
No Councillor nominations were withdrawn.
Councillor Candidates
Total Candidates 102
Female Candidates 30
Male Candidates 72
Names of all candidates
Councillor Candidates Party Affiliation
ANIS, Mary Christian Democratic Party (Fred Nile Group)
ANIS, Sarah Christian Democratic Party (Fred Nile Group)
ANTUNOVIC, Steve -
ASSAL, Michael Christian Democratic Party (Fred Nile Group)
BESHAY, Marina Liberal Party of Australia New South Wales Division
BORG, Athina Totally Locally Committed Party
BORG, Fred Totally Locally Committed Party
BRASSIL, Greg -
BROADBRIDGE, Colin Christian Democratic Party (Fred Nile Group)
BRTICEVIC, George Australian Labor Party (NSW Branch)
BURRASTON, Rhett -
CASAS, Alan -
CHANTHIVONG, Anoulack Australian Labor Party (NSW Branch)
CHEW, John Liberal Party of Australia New South Wales Division
CHOPPING, Cathy Community First Team
COCKER, Brad Community Service "Environment" Save
Campbelltown Koalas
COLLINS, Trent -
COTTER, Josh Liberal Party of Australia New South Wales Division
CUNNINGHAM, Bob Bob Thompson's Independent Team
CUNNINGHAM, Keith Liberal Party of Australia New South Wales Division
DOBSON, Sue Community Service "Environment" Save
Campbelltown Koalas
DRAPER, Tammy -
EDWARDS, Mandy -
ELLIOTT-HALLS, Samantha Australian Democrats (NSW Division)
FALIA, Michael -
FORD, Roger Bob Thompson's Independent Team
FOSTER, Julie Totally Locally Committed Party
FRUEAN, Mal Australian Labor Party (NSW Branch)
FUENTES, Julio Bob Thompson's Independent Team
GALIELL, Tofick -
GEORGE, Ralph Liberal Party of Australia New South Wales Division

REPORT ON THE 2012 LOCAL GOVERNMENT ELECTIONS
Campbelltown City Council
231
GHALY, Mina Community Service "Environment" Save
Campbelltown Koalas
GLYNN, Wal Australian Labor Party (NSW Branch)
GOUHAR, Sara Christian Democratic Party (Fred Nile Group)
GREISS, George Liberal Party of Australia New South Wales Division
HANNA, Isaac Christian Democratic Party (Fred Nile Group)
HAWKER, Paul Liberal Party of Australia New South Wales Division
HURTADO, Sandra Community Service "Environment" Save
Campbelltown Koalas
ISLAM, Muhammed -
JARRAH, Taufik Community Service "Environment" Save
Campbelltown Koalas
KADIR, Robert Totally Locally Committed Party
KELLY, Iain Community First Team
KELLY, Kevin Australian Labor Party (NSW Branch)
KHAN, Tamrez -
KOLKMAN, Rudi Australian Labor Party (NSW Branch)
KOZMAN, Fady Christian Democratic Party (Fred Nile Group)
LAKE, Paul Community First Team
LAUL, Brian Totally Locally Committed Party
LAWS, Robert Liberal Party of Australia New South Wales Division
LAY, Rosalina Community Service "Environment" Save
Campbelltown Koalas
LLOYD, Katrina Liberal Democratic Party
LOUND, Darcy Totally Locally Committed Party
LUNA, Nusrat -
MAHER, Jessica -
MANNS, Terry Community First Team
MANOTO, Rey Australian Labor Party (NSW Branch)
MARANTZ, Cherie Totally Locally Committed Party
MATHESON, Alana Liberal Party of Australia New South Wales Division
McKAY, Allan Totally Locally Committed Party
MEAD, Clinton Liberal Democratic Party
MEAD, Dian Liberal Democratic Party
MELVILLE, Alex Liberal Party of Australia New South Wales Division
MORCOMB, Alan Bob Thompson's Independent Team
MORRISON, Warren Totally Locally Committed Party
MULLANE, Michael Bob Thompson's Independent Team
OATES, Meg Australian Labor Party (NSW Branch)
PAREEZER, Jennifer -
PARNHAM, Anne Community First Team
PERUMAL, Adrian -
POTTS, Gary -
RAHMAN, Syed -
RAMSAY, John Christian Democratic Party (Fred Nile Group)
RAMSAY, Sarah Christian Democratic Party (Fred Nile Group)
REDONDO, Chris Bob Thompson's Independent Team
RIXON, Brett Community Service "Environment" Save
Campbelltown Koalas
ROSE, Kimberley -
ROUEN, Nicholas Liberal Democratic Party
ROUEN, Sam Liberal Democratic Party

REPORT ON THE 2012 LOCAL GOVERNMENT ELECTIONS
Campbelltown City Council
232
ROUEN, Timothy Liberal Democratic Party
ROWELL, Ted Liberal Party of Australia New South Wales Division
SARAO, Jaspal -
SARKER, Abul -
SCOPE, Joe Community Service "Environment" Save
Campbelltown Koalas
SHORTLAND, Darryl Totally Locally Committed Party
SIMPSON, Gerald Community First Team
SINGH, Raj Bob Thompson's Independent Team
SMITHERS, Wayne Community Service "Environment" Save
Campbelltown Koalas
STANLEY, Bill -
STEWART, Ian Totally Locally Committed Party
STEWART, Stephen Community First Team
TABLANTE, Enrico Community Service "Environment" Save
Campbelltown Koalas
THOMPSON, Bob Bob Thompson's Independent Team
THOMPSON, Jason Bob Thompson's Independent Team
TOTH, Carole -
TOTH, Gabor -
TREE, Teresa Community First Team
TURNER, Les Totally Locally Committed Party
TURVEY, Michael Liberal Democratic Party
USOPE, Linda Community First Team
WHITE, Gareth Liberal Democratic Party
WOOD, Annamaria Community First Team
YOUNG, Kristi -
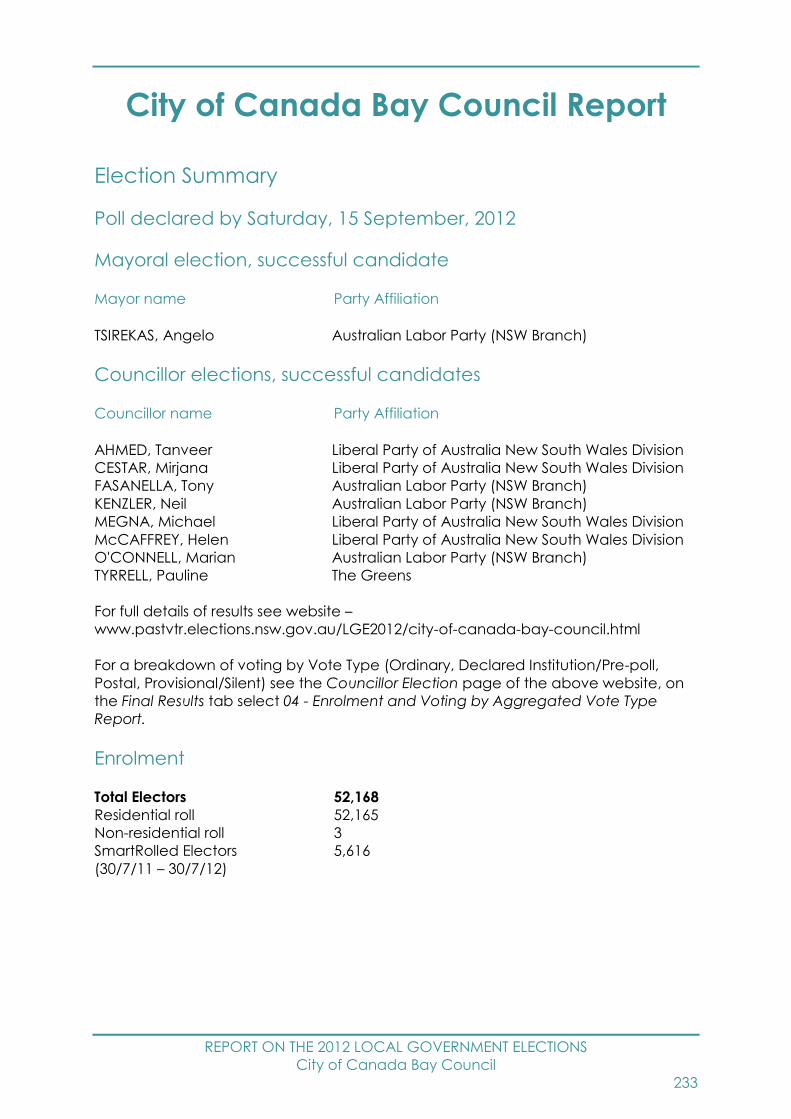
REPORT ON THE 2012 LOCAL GOVERNMENT ELECTIONS
City of Canada Bay Council
233
City of Canada Bay Council Report
Election Summary
Poll declared by Saturday, 15 September, 2012
Mayoral election, successful candidate
Mayor name Party Affiliation
TSIREKAS, Angelo Australian Labor Party (NSW Branch)
Councillor elections, successful candidates
Councillor name Party Affiliation
AHMED, Tanveer Liberal Party of Australia New South Wales Division
CESTAR, Mirjana Liberal Party of Australia New South Wales Division
FASANELLA, Tony Australian Labor Party (NSW Branch)
KENZLER, Neil Australian Labor Party (NSW Branch)
MEGNA, Michael Liberal Party of Australia New South Wales Division
McCAFFREY, Helen Liberal Party of Australia New South Wales Division
O'CONNELL, Marian Australian Labor Party (NSW Branch)
TYRRELL, Pauline The Greens
For full details of results see website –
www.pastvtr.elections.nsw.gov.au/LGE2012/city-of-canada-bay-council.html
For a breakdown of voting by Vote Type (Ordinary, Declared Institution/Pre-poll,
Postal, Provisional/Silent) see the Councillor Election page of the above website, on
the Final Results tab select 04 - Enrolment and Voting by Aggregated Vote Type
Report.
Enrolment
Total Electors 52,168
Residential roll 52,165
Non-residential roll 3
SmartRolled Electors 5,616
(30/7/11 – 30/7/12)

REPORT ON THE 2012 LOCAL GOVERNMENT ELECTIONS
City of Canada Bay Council
234
Participation and Informality
Participation rate 82.2%
Formal votes 40,070
Informal votes 2,819
Total votes 42,889
Informality rate 6.6%
Failure to Vote
Penalty Notices Issued 6,970
Rate of Failure to Vote27 13.4%
Election Costs
Total Cost of the City of Canada Bay Council 2012 Election
$337,743.00
Cost per elector
$6.49
City of Canada Bay Council Statutory Advertising Campaign Expenditure
Nominations $2,544.72
Candidates and polling places $3,099.20
Uncontested elections $0.00
Results $1,550.64
TOTAL $7,194.56
Election Services
Elector Enquiry Centre
The Elector Enquiry Centre answered 1,054 calls from postcodes within City of
Canada Bay Council area.
NSWEC Website
There were 4,485 unique visitors to City of Canada Bay Council election web page.
Braille Ballot Papers
One braille ballot papers were requested or printed.
27 Percentage of Penalty Notices Issued to Enrolment (as shown on Authorised Roll)
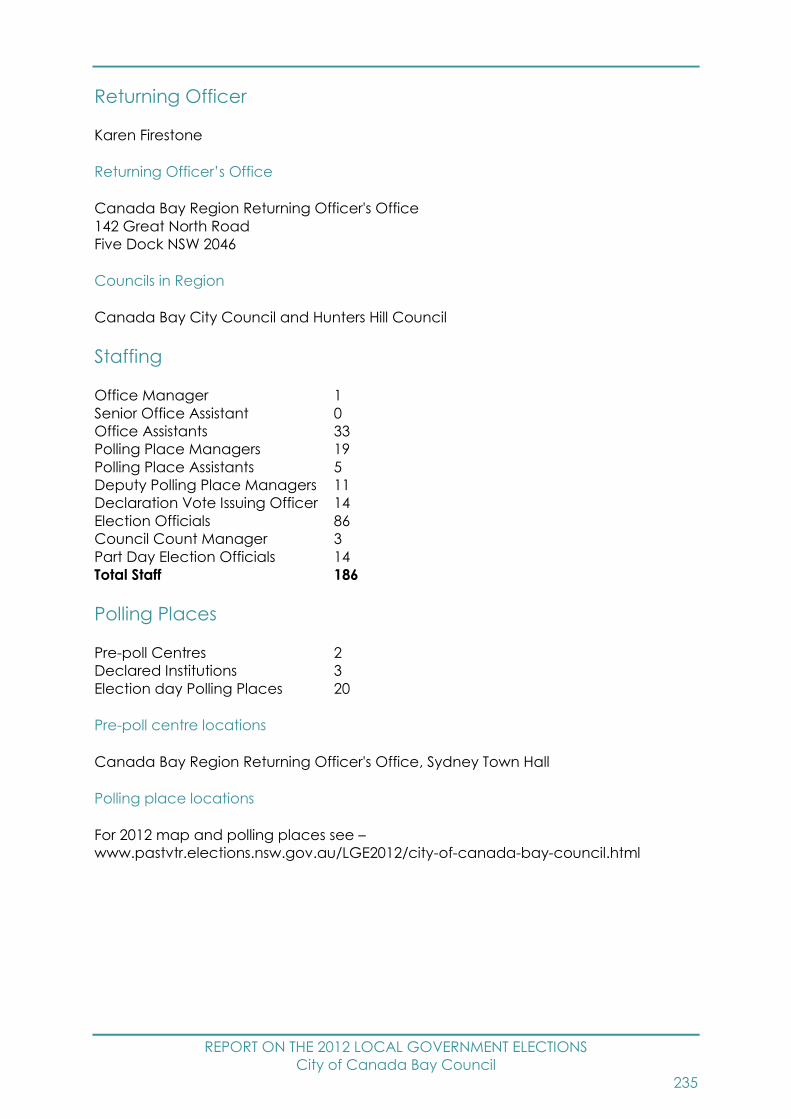
REPORT ON THE 2012 LOCAL GOVERNMENT ELECTIONS
City of Canada Bay Council
235
Returning Officer
Karen Firestone
Returning Officer’s Office
Canada Bay Region Returning Officer's Office
142 Great North Road
Five Dock NSW 2046
Councils in Region
Canada Bay City Council and Hunters Hill Council
Staffing
Office Manager 1
Senior Office Assistant 0
Office Assistants 33
Polling Place Managers 19
Polling Place Assistants 5
Deputy Polling Place Managers 11
Declaration Vote Issuing Officer 14
Election Officials 86
Council Count Manager 3
Part Day Election Officials 14
Total Staff 186
Polling Places
Pre-poll Centres 2
Declared Institutions 3
Election day Polling Places 20
Pre-poll centre locations
Canada Bay Region Returning Officer's Office, Sydney Town Hall
Polling place locations
For 2012 map and polling places see –
www.pastvtr.elections.nsw.gov.au/LGE2012/city-of-canada-bay-council.html
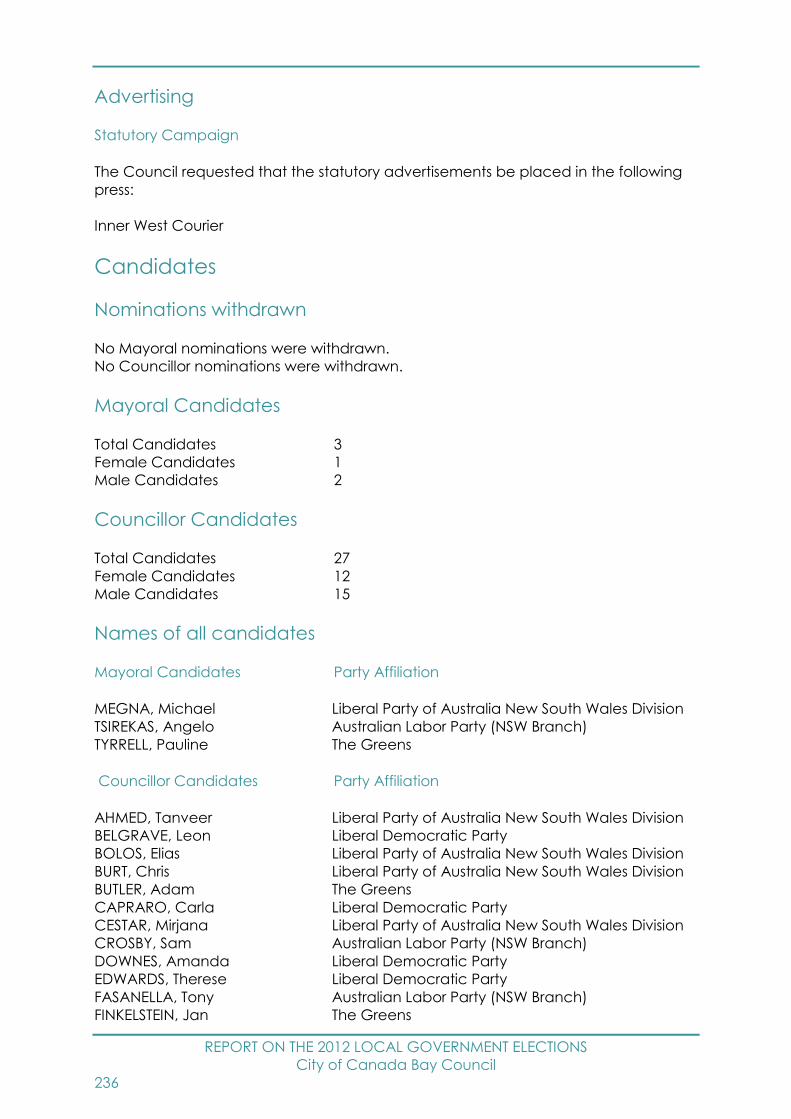
REPORT ON THE 2012 LOCAL GOVERNMENT ELECTIONS
City of Canada Bay Council
236
Advertising
Statutory Campaign
The Council requested that the statutory advertisements be placed in the following
press:
Inner West Courier
Candidates
Nominations withdrawn
No Mayoral nominations were withdrawn.
No Councillor nominations were withdrawn.
Mayoral Candidates
Total Candidates 3
Female Candidates 1
Male Candidates 2
Councillor Candidates
Total Candidates 27
Female Candidates 12
Male Candidates 15
Names of all candidates
Mayoral Candidates Party Affiliation
MEGNA, Michael Liberal Party of Australia New South Wales Division
TSIREKAS, Angelo Australian Labor Party (NSW Branch)
TYRRELL, Pauline The Greens
Councillor Candidates Party Affiliation
AHMED, Tanveer Liberal Party of Australia New South Wales Division
BELGRAVE, Leon Liberal Democratic Party
BOLOS, Elias Liberal Party of Australia New South Wales Division
BURT, Chris Liberal Party of Australia New South Wales Division
BUTLER, Adam The Greens
CAPRARO, Carla Liberal Democratic Party
CESTAR, Mirjana Liberal Party of Australia New South Wales Division
CROSBY, Sam Australian Labor Party (NSW Branch)
DOWNES, Amanda Liberal Democratic Party
EDWARDS, Therese Liberal Democratic Party
FASANELLA, Tony Australian Labor Party (NSW Branch)
FINKELSTEIN, Jan The Greens
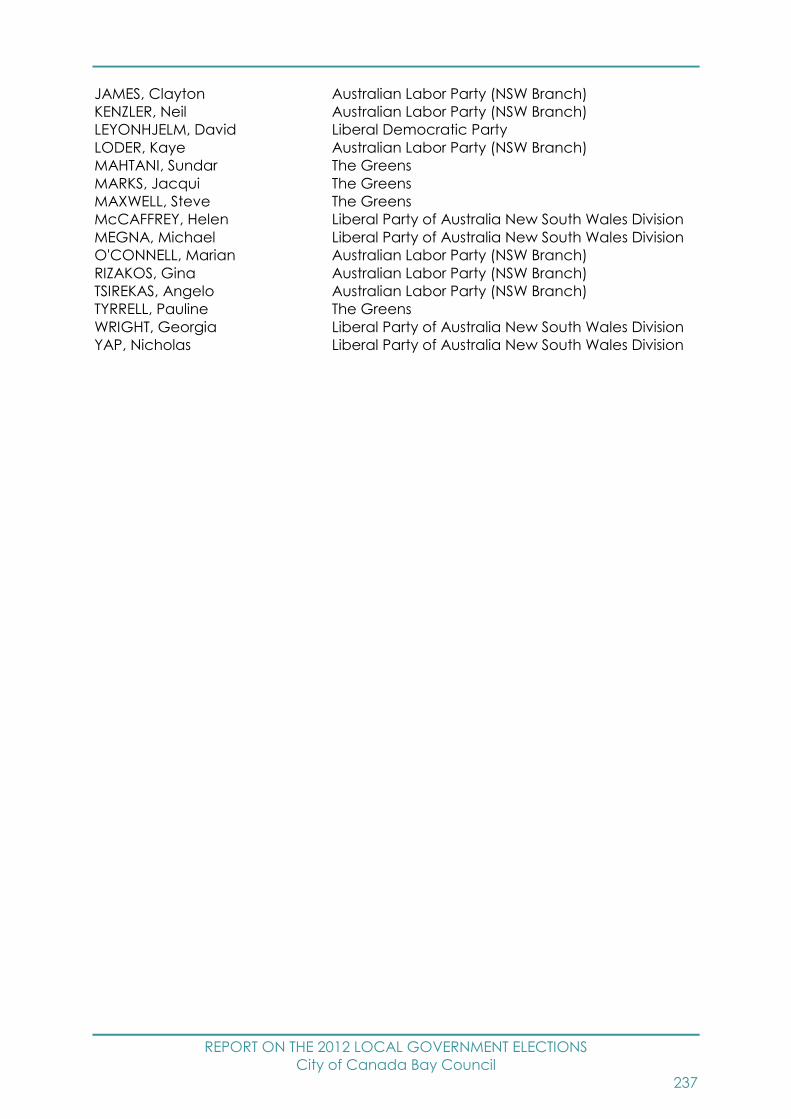
REPORT ON THE 2012 LOCAL GOVERNMENT ELECTIONS
City of Canada Bay Council
237
JAMES, Clayton Australian Labor Party (NSW Branch)
KENZLER, Neil Australian Labor Party (NSW Branch)
LEYONHJELM, David Liberal Democratic Party
LODER, Kaye Australian Labor Party (NSW Branch)
MAHTANI, Sundar The Greens
MARKS, Jacqui The Greens
MAXWELL, Steve The Greens
McCAFFREY, Helen Liberal Party of Australia New South Wales Division
MEGNA, Michael Liberal Party of Australia New South Wales Division
O'CONNELL, Marian Australian Labor Party (NSW Branch)
RIZAKOS, Gina Australian Labor Party (NSW Branch)
TSIREKAS, Angelo Australian Labor Party (NSW Branch)
TYRRELL, Pauline The Greens
WRIGHT, Georgia Liberal Party of Australia New South Wales Division
YAP, Nicholas Liberal Party of Australia New South Wales Division
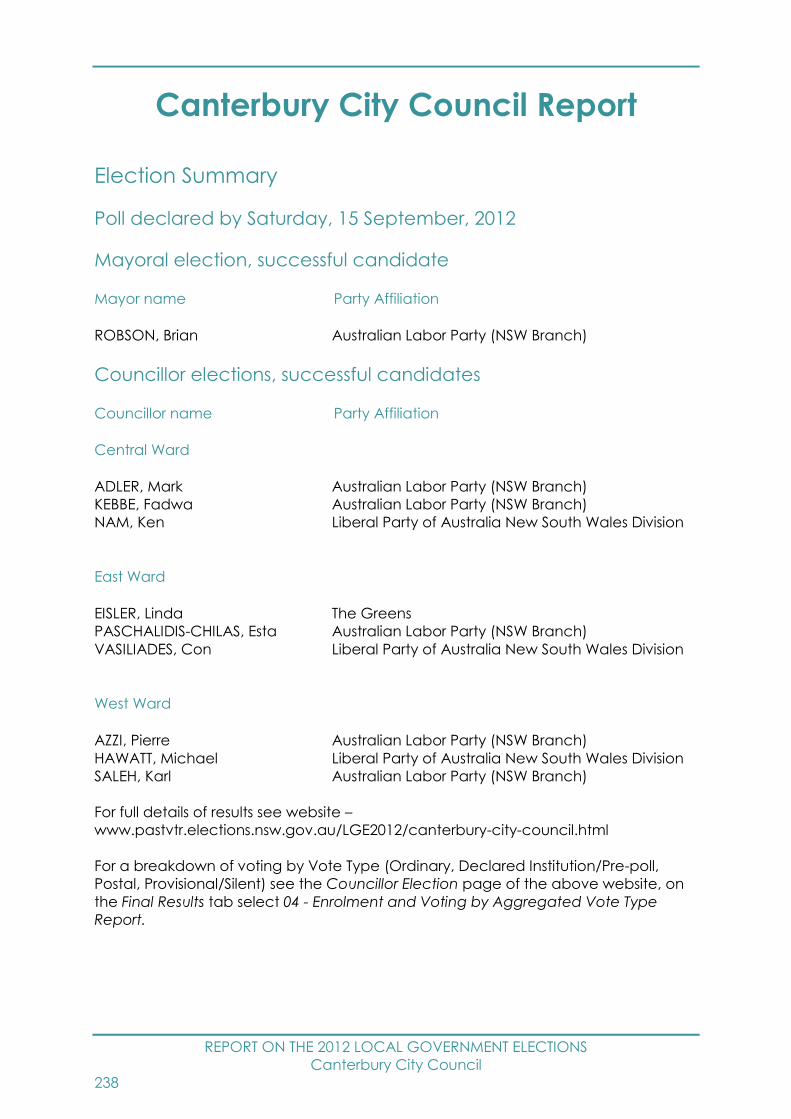
REPORT ON THE 2012 LOCAL GOVERNMENT ELECTIONS
Canterbury City Council
238
Canterbury City Council Report
Election Summary
Poll declared by Saturday, 15 September, 2012
Mayoral election, successful candidate
Mayor name Party Affiliation
ROBSON, Brian Australian Labor Party (NSW Branch)
Councillor elections, successful candidates
Councillor name Party Affiliation
Central Ward
ADLER, Mark Australian Labor Party (NSW Branch)
KEBBE, Fadwa Australian Labor Party (NSW Branch)
NAM, Ken Liberal Party of Australia New South Wales Division
East Ward
EISLER, Linda The Greens
PASCHALIDIS-CHILAS, Esta Australian Labor Party (NSW Branch)
VASILIADES, Con Liberal Party of Australia New South Wales Division
West Ward
AZZI, Pierre Australian Labor Party (NSW Branch)
HAWATT, Michael Liberal Party of Australia New South Wales Division
SALEH, Karl Australian Labor Party (NSW Branch)
For full details of results see website –
www.pastvtr.elections.nsw.gov.au/LGE2012/canterbury-city-council.html
For a breakdown of voting by Vote Type (Ordinary, Declared Institution/Pre-poll,
Postal, Provisional/Silent) see the Councillor Election page of the above website, on
the Final Results tab select 04 - Enrolment and Voting by Aggregated Vote Type
Report.
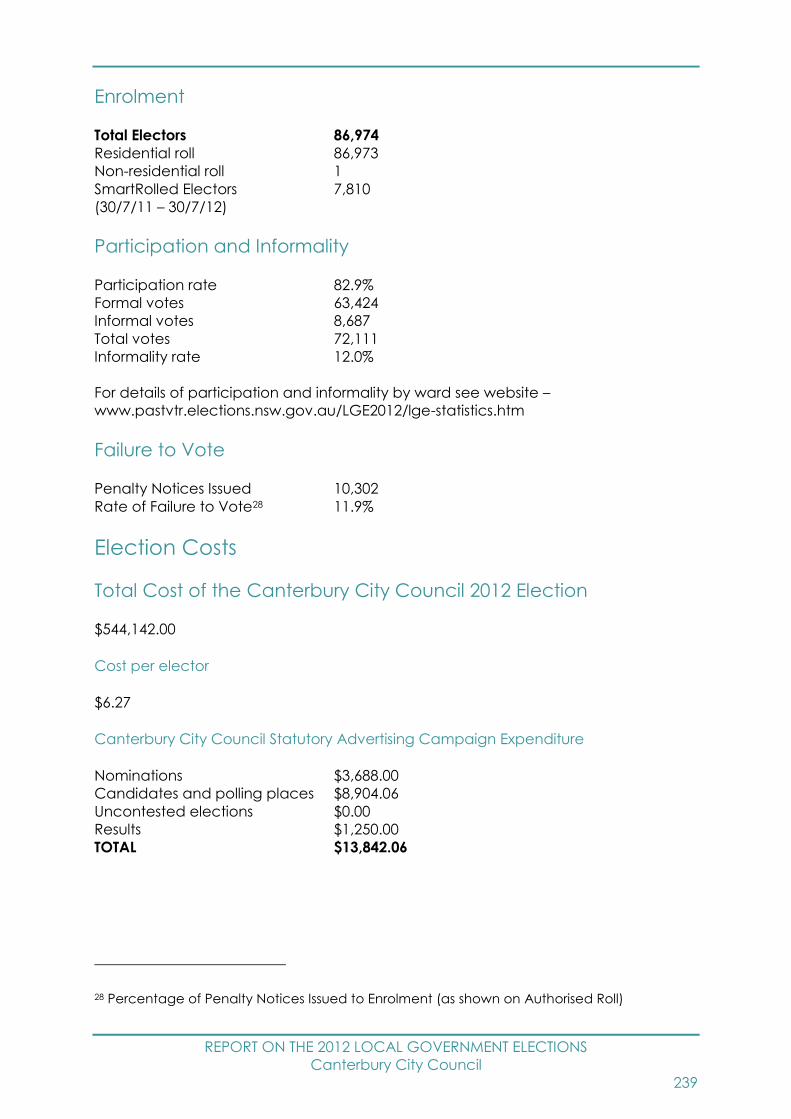
REPORT ON THE 2012 LOCAL GOVERNMENT ELECTIONS
Canterbury City Council
239
Enrolment
Total Electors 86,974
Residential roll 86,973
Non-residential roll 1
SmartRolled Electors 7,810
(30/7/11 – 30/7/12)
Participation and Informality
Participation rate 82.9%
Formal votes 63,424
Informal votes 8,687
Total votes 72,111
Informality rate 12.0%
For details of participation and informality by ward see website –
www.pastvtr.elections.nsw.gov.au/LGE2012/lge-statistics.htm
Failure to Vote
Penalty Notices Issued 10,302
Rate of Failure to Vote28 11.9%
Election Costs
Total Cost of the Canterbury City Council 2012 Election
$544,142.00
Cost per elector
$6.27
Canterbury City Council Statutory Advertising Campaign Expenditure
Nominations $3,688.00
Candidates and polling places $8,904.06
Uncontested elections $0.00
Results $1,250.00
TOTAL $13,842.06
28 Percentage of Penalty Notices Issued to Enrolment (as shown on Authorised Roll)
REPORT ON THE 2012 LOCAL GOVERNMENT ELECTIONS
Canterbury City Council
240
Election Services
Elector Enquiry Centre
The Elector Enquiry Centre answered 1,377 calls from postcodes within Canterbury
City Council area.
NSWEC Website
There were 6,746 unique visitors to Canterbury City Council election web page.
Braille Ballot Papers
One braille ballot papers were requested or printed.
Returning Officer
Ray Pozzato
Returning Officer’s Office
Canterbury Returning Officer's Office
Shop 3-5, 300-306 Canterbury Road
Canterbury NSW 2193
Staffing
Office Manager 1
Senior Office Assistant 0
Office Assistants 20
Polling Place Managers 34
Polling Place Assistants 3
Deputy Polling Place Managers 26
Declaration Vote Issuing Officer 19
Election Officials 181
Council Count Manager 4
Part Day Election Officials 21
Total Staff 309
Polling Places
Pre-poll Centres 2
Declared Institutions 3
Election day Polling Places 42
Pre-poll centre locations
Canterbury Returning Officer's Office, Sydney Town Hall
REPORT ON THE 2012 LOCAL GOVERNMENT ELECTIONS
Canterbury City Council
241
Polling place locations
For 2012 map and polling places see –
www.pastvtr.elections.nsw.gov.au/LGE2012/canterbury-city-council.html
Advertising
Statutory Campaign
The Council requested that the statutory advertisements be placed in the following
press:
Torch
Valley Times
Canterbury Bankstown Express
Candidates
Nominations withdrawn
No Mayoral nominations were withdrawn.
One Councillor nomination was withdrawn.
Mayoral Candidates
Total Candidates 6
Female Candidates 3
Male Candidates 3
Councillor Candidates
Total Candidates 47
Female Candidates 16
Male Candidates 31
Central Ward Councillor Candidates
Total Candidates 21
Female Candidates 8
Male Candidates 13
East Ward Councillor Candidates
Total Candidates 14
Female Candidates 5
Male Candidates 9

REPORT ON THE 2012 LOCAL GOVERNMENT ELECTIONS
Canterbury City Council
242
West Ward Councillor Candidates
Total Candidates 12
Female Candidates 3
Male Candidates 9
Names of all candidates
Mayoral Candidates Party Affiliation
CON, Maria -
EISLER, Linda The Greens
HAWATT, Michael Liberal Party of Australia New South Wales Division
KUNIANSKY, Joanne -
ROBSON, Brian Australian Labor Party (NSW Branch)
TAYLOR, James -
Councillor Candidates Party Affiliation
Central Ward
ADJIMAN, Carlos The Greens
ADLER, Mark Australian Labor Party (NSW Branch)
CHEN, Gengxing Liberal Party of Australia New South Wales Division
COLLET, Francois -
CON, Maria -
FOUNTAIN, Cerelia -
GAYLA, Marifi -
HICK, Paul The Greens
KEBBE, Fadwa Australian Labor Party (NSW Branch)
LAM, Floris Unity Party
LIU, James -
LOGIOTATOS, Melina -
MADIRAZZA, Philip Liberal Party of Australia New South Wales Division
NAM, Ken Liberal Party of Australia New South Wales Division
NGUYEN, Trong -
PENICKA-SMITH, Melanie The Greens
POPAL, Fahim -
SIMONE, Phillip -
TOIAIVAO, Leilagi Unity Party
WRIGHT, Dolores Australian Labor Party (NSW Branch)
ZENG, Zi Unity Party
East Ward
BOUSAMRA, George Australian Labor Party (NSW Branch)
EISLER, Linda The Greens
ERREY, Jo The Greens
FITZGERALD, Paul The Greens
GIANNACOPOULOS, Harry -
NADDAF, Joe Liberal Party of Australia New South Wales Division

REPORT ON THE 2012 LOCAL GOVERNMENT ELECTIONS
Canterbury City Council
243
PAMBRIS, Sam Australian Labor Party (NSW Branch)
PARRILLO, Geraldine Liberal Party of Australia New South Wales Division
PASCHALIDIS-CHILAS, Esta Australian Labor Party (NSW Branch)
SANTAMARIA, Anthony -
TAYLOR, James -
VASILIADES, Con Liberal Party of Australia New South Wales Division
WEIR, Robert -
ZAFIRIOU, Vera -
West Ward
AZZI, Pierre Australian Labor Party (NSW Branch)
BOBBIN, Gordon -
GHABBAR, Sanaa The Greens
HAWATT, Michael Liberal Party of Australia New South Wales Division
JARVIE, James Liberal Party of Australia New South Wales Division
ROBSON, Brian Australian Labor Party (NSW Branch)
ROMANAKIS, Soula -
SALEH, Karl Australian Labor Party (NSW Branch)
STAIKOS, Spyros -
STELZER, Glen The Greens
THORNTHWAITE, Wendy The Greens
VASILIADES, William Liberal Party of Australia New South Wales Division
REPORT ON THE 2012 LOCAL GOVERNMENT ELECTIONS
Carrathool Shire Council
244
Carrathool Shire Council Report
Election Summary
Uncontested - Poll declared by Saturday, 8 September, 2012
Councillor elections, successful candidates
Councillor name Party Affiliation
A Ward
ARMSTRONG, Mick -
JARDINE, Darryl -
B Ward
CAMPBELL, Russell -
MERRYLEES, Margaret -
C Ward
CAUGHEY, Jim -
KITE, William -
D Ward
FENSOM, David -
PETERS, Geoff -
E Ward
CASHMERE, Vince -
LAIRD, Peter -
Enrolment
Total Electors 1,859
Residential roll 1,859
Non-residential roll 0
SmartRolled Electors 91
(30/7/11 – 30/7/12)
REPORT ON THE 2012 LOCAL GOVERNMENT ELECTIONS
Carrathool Shire Council
245
Election Costs
Total Cost of the Carrathool Shire Council 2012 Election
$5,362.00
Cost per elector
$2.89
Carrathool Shire Council Statutory Advertising Campaign Expenditure
Nominations $1,281.51
Candidates and polling places $0.00
Uncontested elections $973.06
Results $0.00
TOTAL $2,254.57
Election Services
Elector Enquiry Centre
The Elector Enquiry Centre answered 22 calls from postcodes within Carrathool Shire
Council area.
NSWEC Website
There were 243 unique visitors to Carrathool Shire Council election web page.
Braille Ballot Papers
No braille ballot papers were requested.
Returning Officer
Matthew Farley
Returning Officer’s Office
Leeton Region Returning Officer's Office
18-22 Kurrajong Avenue
Leeton NSW 2705
Councils in Region
Carrathool Shire Council, Griffith City Council, Leeton Shire Council, Murrumbidgee
Shire Council and Narrandera Shire Council
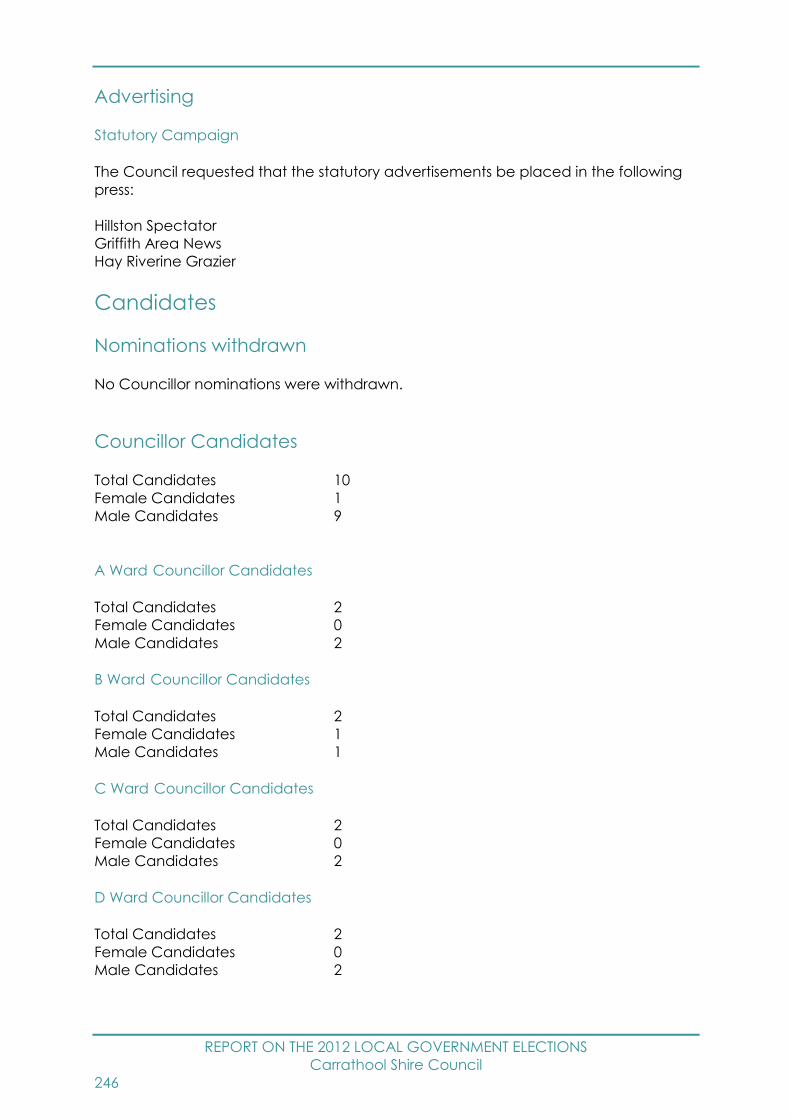
REPORT ON THE 2012 LOCAL GOVERNMENT ELECTIONS
Carrathool Shire Council
246
Advertising
Statutory Campaign
The Council requested that the statutory advertisements be placed in the following
press:
Hillston Spectator
Griffith Area News
Hay Riverine Grazier
Candidates
Nominations withdrawn
No Councillor nominations were withdrawn.
Councillor Candidates
Total Candidates 10
Female Candidates 1
Male Candidates 9
A Ward Councillor Candidates
Total Candidates 2
Female Candidates 0
Male Candidates 2
B Ward Councillor Candidates
Total Candidates 2
Female Candidates 1
Male Candidates 1
C Ward Councillor Candidates
Total Candidates 2
Female Candidates 0
Male Candidates 2
D Ward Councillor Candidates
Total Candidates 2
Female Candidates 0
Male Candidates 2
REPORT ON THE 2012 LOCAL GOVERNMENT ELECTIONS
Carrathool Shire Council
247
E Ward Councillor Candidates
Total Candidates 2
Female Candidates 0
Male Candidates 2

REPORT ON THE 2012 LOCAL GOVERNMENT ELECTIONS
Central Darling Shire Council
248
Central Darling Shire Council Report
Election Summary
Poll declared by Saturday, 15 September, 2012
Councillor elections, successful candidates
Councillor name Party Affiliation
A Ward
LIVERSIDGE, Honor -
SAMMON, Eamon -
SULLIVAN, Peter -
B Ward
LINNETT, Clive -
LONGFELLOW, Ray -
STANDLEY, Dennis -
C Ward
ASTILL, Garry -
LOONEY, Lorraine -
PAGE, Ron -
For full details of results see website –
www.pastvtr.elections.nsw.gov.au/LGE2012/central-darling-shire-council.html
For a breakdown of voting by Vote Type (Ordinary, Declared Institution/Pre-poll,
Postal, Provisional/Silent) see the Councillor Election page of the above website, on
the Final Results tab select 04 - Enrolment and Voting by Aggregated Vote Type
Report.
Enrolment
Total Electors 1,186
Residential roll 1,144
Non-residential roll 42
SmartRolled Electors 58
(30/7/11 – 30/7/12)
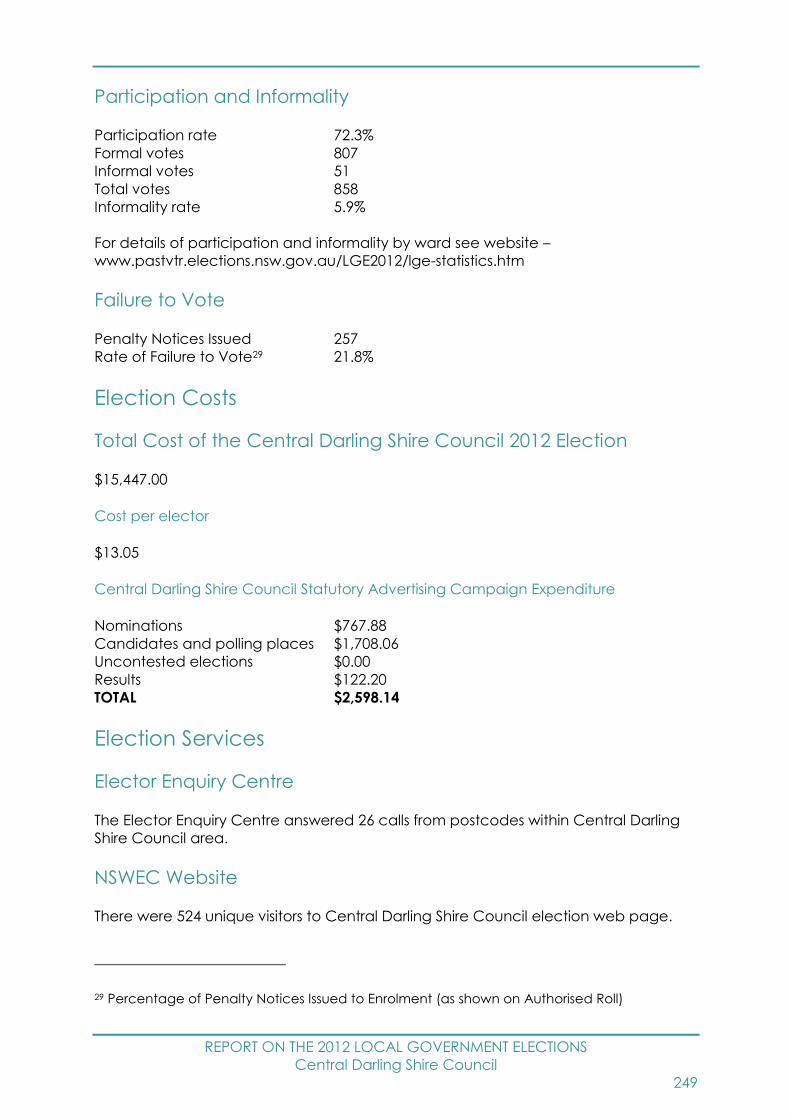
REPORT ON THE 2012 LOCAL GOVERNMENT ELECTIONS
Central Darling Shire Council
249
Participation and Informality
Participation rate 72.3%
Formal votes 807
Informal votes 51
Total votes 858
Informality rate 5.9%
For details of participation and informality by ward see website –
www.pastvtr.elections.nsw.gov.au/LGE2012/lge-statistics.htm
Failure to Vote
Penalty Notices Issued 257
Rate of Failure to Vote29 21.8%
Election Costs
Total Cost of the Central Darling Shire Council 2012 Election
$15,447.00
Cost per elector
$13.05
Central Darling Shire Council Statutory Advertising Campaign Expenditure
Nominations $767.88
Candidates and polling places $1,708.06
Uncontested elections $0.00
Results $122.20
TOTAL $2,598.14
Election Services
Elector Enquiry Centre
The Elector Enquiry Centre answered 26 calls from postcodes within Central Darling
Shire Council area.
NSWEC Website
There were 524 unique visitors to Central Darling Shire Council election web page.
29 Percentage of Penalty Notices Issued to Enrolment (as shown on Authorised Roll)
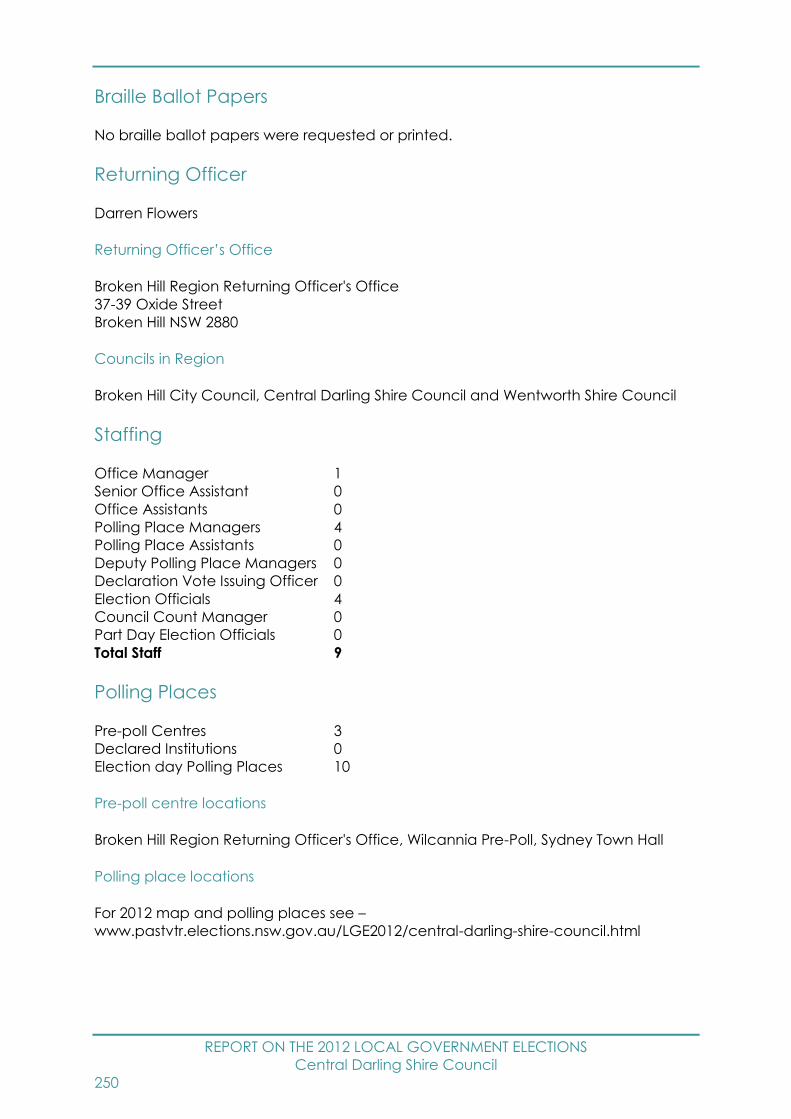
REPORT ON THE 2012 LOCAL GOVERNMENT ELECTIONS
Central Darling Shire Council
250
Braille Ballot Papers
No braille ballot papers were requested or printed.
Returning Officer
Darren Flowers
Returning Officer’s Office
Broken Hill Region Returning Officer's Office
37-39 Oxide Street
Broken Hill NSW 2880
Councils in Region
Broken Hill City Council, Central Darling Shire Council and Wentworth Shire Council
Staffing
Office Manager 1
Senior Office Assistant 0
Office Assistants 0
Polling Place Managers 4
Polling Place Assistants 0
Deputy Polling Place Managers 0
Declaration Vote Issuing Officer 0
Election Officials 4
Council Count Manager 0
Part Day Election Officials 0
Total Staff 9
Polling Places
Pre-poll Centres 3
Declared Institutions 0
Election day Polling Places 10
Pre-poll centre locations
Broken Hill Region Returning Officer's Office, Wilcannia Pre-Poll, Sydney Town Hall
Polling place locations
For 2012 map and polling places see –
www.pastvtr.elections.nsw.gov.au/LGE2012/central-darling-shire-council.html
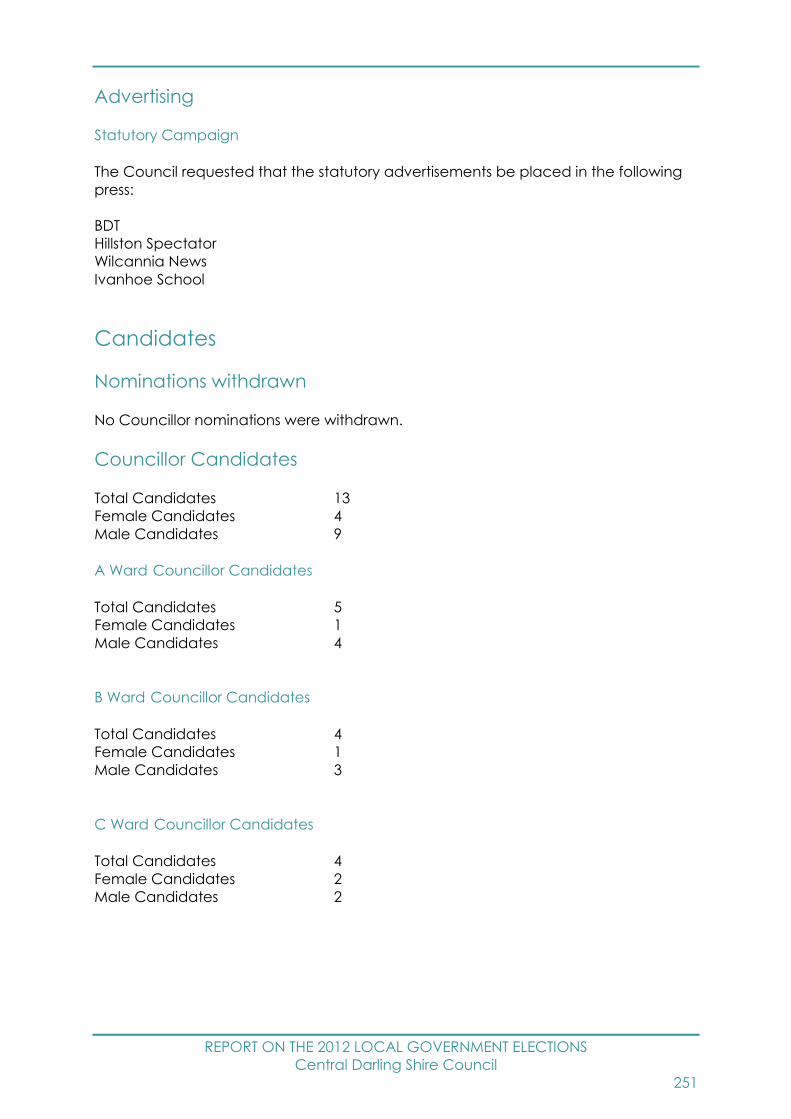
REPORT ON THE 2012 LOCAL GOVERNMENT ELECTIONS
Central Darling Shire Council
251
Advertising
Statutory Campaign
The Council requested that the statutory advertisements be placed in the following
press:
BDT
Hillston Spectator
Wilcannia News
Ivanhoe School
Candidates
Nominations withdrawn
No Councillor nominations were withdrawn.
Councillor Candidates
Total Candidates 13
Female Candidates 4
Male Candidates 9
A Ward Councillor Candidates
Total Candidates 5
Female Candidates 1
Male Candidates 4
B Ward Councillor Candidates
Total Candidates 4
Female Candidates 1
Male Candidates 3
C Ward Councillor Candidates
Total Candidates 4
Female Candidates 2
Male Candidates 2
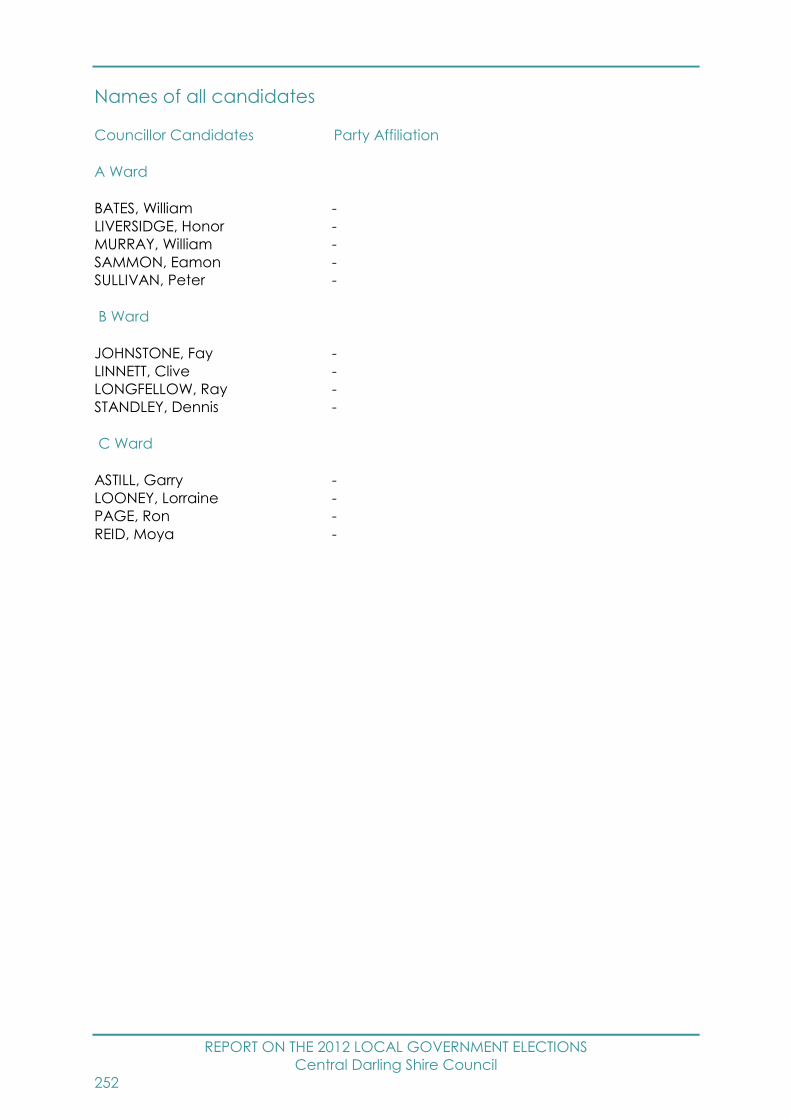
REPORT ON THE 2012 LOCAL GOVERNMENT ELECTIONS
Central Darling Shire Council
252
Names of all candidates
Councillor Candidates Party Affiliation
A Ward
BATES, William -
LIVERSIDGE, Honor -
MURRAY, William -
SAMMON, Eamon -
SULLIVAN, Peter -
B Ward
JOHNSTONE, Fay -
LINNETT, Clive -
LONGFELLOW, Ray -
STANDLEY, Dennis -
C Ward
ASTILL, Garry -
LOONEY, Lorraine -
PAGE, Ron -
REID, Moya -
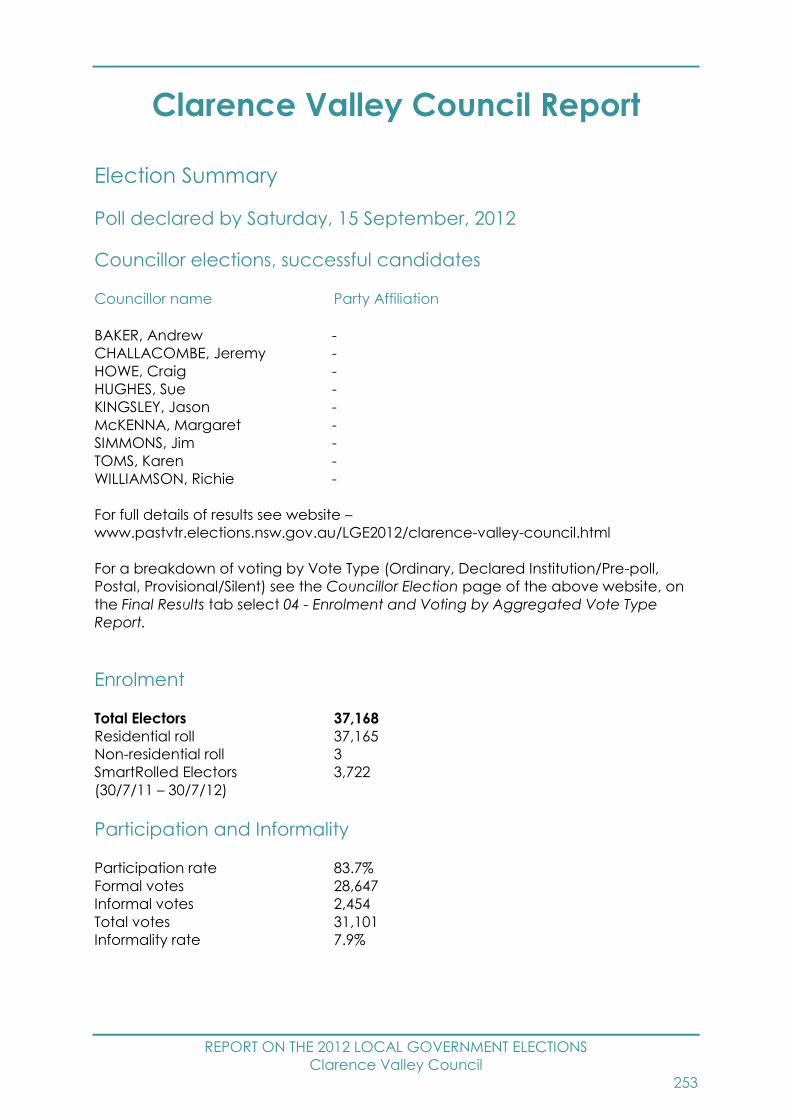
REPORT ON THE 2012 LOCAL GOVERNMENT ELECTIONS
Clarence Valley Council
253
Clarence Valley Council Report
Election Summary
Poll declared by Saturday, 15 September, 2012
Councillor elections, successful candidates
Councillor name Party Affiliation
BAKER, Andrew -
CHALLACOMBE, Jeremy -
HOWE, Craig -
HUGHES, Sue -
KINGSLEY, Jason -
McKENNA, Margaret -
SIMMONS, Jim -
TOMS, Karen -
WILLIAMSON, Richie -
For full details of results see website –
www.pastvtr.elections.nsw.gov.au/LGE2012/clarence-valley-council.html
For a breakdown of voting by Vote Type (Ordinary, Declared Institution/Pre-poll,
Postal, Provisional/Silent) see the Councillor Election page of the above website, on
the Final Results tab select 04 - Enrolment and Voting by Aggregated Vote Type
Report.
Enrolment
Total Electors 37,168
Residential roll 37,165
Non-residential roll 3
SmartRolled Electors 3,722
(30/7/11 – 30/7/12)
Participation and Informality
Participation rate 83.7%
Formal votes 28,647
Informal votes 2,454
Total votes 31,101
Informality rate 7.9%

REPORT ON THE 2012 LOCAL GOVERNMENT ELECTIONS
Clarence Valley Council
254
Failure to Vote
Penalty Notices Issued 4,606
Rate of Failure to Vote30 12.4%
Election Costs
Total Cost of the Clarence Valley Council 2012 Election
$235,268.00
Cost per elector
$6.35
Clarence Valley Council Statutory Advertising Campaign Expenditure
Nominations $1,571.79
Candidates and polling places $1,423.43
Uncontested elections $0.00
Results $314.62
TOTAL $3,309.84
Election Services
Elector Enquiry Centre
The Elector Enquiry Centre answered 465 calls from postcodes within Clarence Valley
Council area.
NSWEC Website
There were 2,522 unique visitors to Clarence Valley Council election web page.
Braille Ballot Papers
No braille ballot papers were requested or printed.
Returning Officer
Clifford Mitchell
30 Percentage of Penalty Notices Issued to Enrolment (as shown on Authorised Roll)

REPORT ON THE 2012 LOCAL GOVERNMENT ELECTIONS
Clarence Valley Council
255
Returning Officer’s Office
Clarence Region Returning Officer's Office
15 Prince Street
Grafton NSW 2460
Councils in Region
Clarence Valley Council, Kyogle Council, Lismore City Council and Richmond Valley
Council
Staffing
Office Manager 1
Senior Office Assistant 0
Office Assistants 73
Polling Place Managers 31
Polling Place Assistants 0
Deputy Polling Place Managers 2
Declaration Vote Issuing Officer 2
Election Officials 59
Council Count Manager 0
Part Day Election Officials 8
Total Staff 176
Polling Places
Pre-poll Centres 3
Declared Institutions 9
Election day Polling Places 32
Pre-poll centre locations
Clarence Region Returning Officer's Office, Maclean Pre-Poll, Sydney Town Hall
Polling place locations
For 2012 map and polling places see –
www.pastvtr.elections.nsw.gov.au/LGE2012/clarence-valley-council.html
Advertising
Statutory Campaign
The Council requested that the statutory advertisements be placed in the following
press:
Don Dorrigo Gazette
Daily Examiner
Grafton Clarence Valley Review
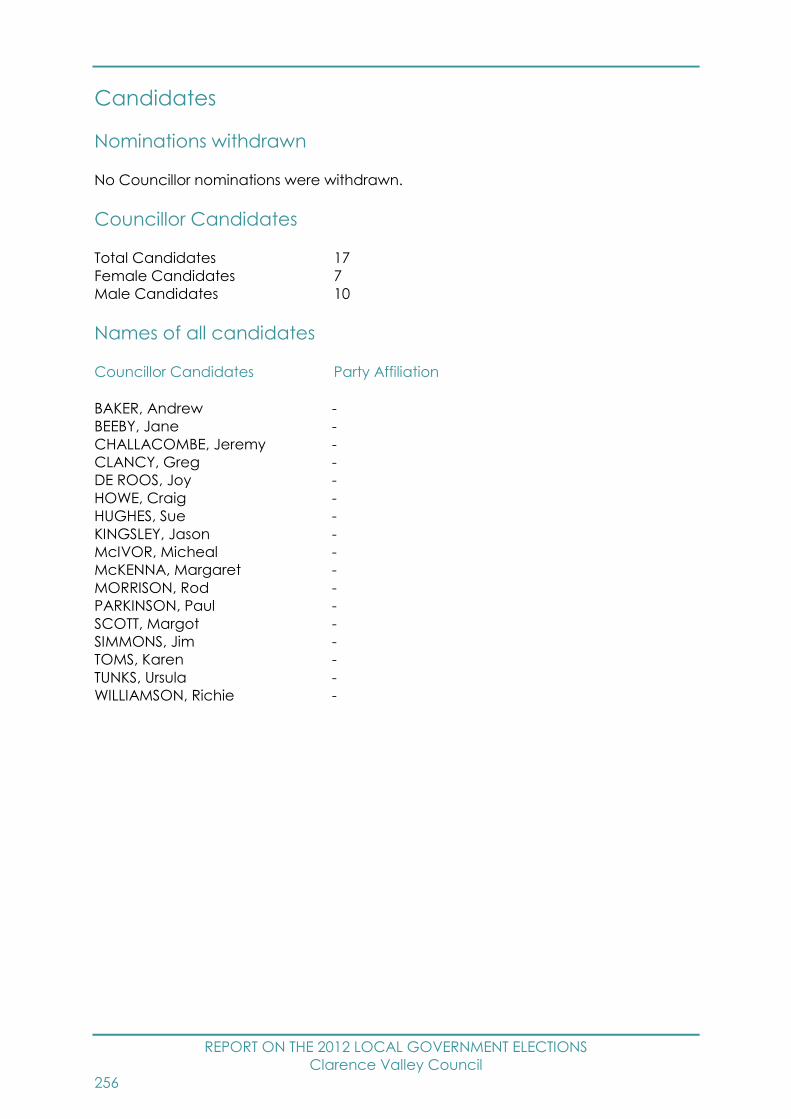
REPORT ON THE 2012 LOCAL GOVERNMENT ELECTIONS
Clarence Valley Council
256
Candidates
Nominations withdrawn
No Councillor nominations were withdrawn.
Councillor Candidates
Total Candidates 17
Female Candidates 7
Male Candidates 10
Names of all candidates
Councillor Candidates Party Affiliation
BAKER, Andrew -
BEEBY, Jane -
CHALLACOMBE, Jeremy -
CLANCY, Greg -
DE ROOS, Joy -
HOWE, Craig -
HUGHES, Sue -
KINGSLEY, Jason -
McIVOR, Micheal -
McKENNA, Margaret -
MORRISON, Rod -
PARKINSON, Paul -
SCOTT, Margot -
SIMMONS, Jim -
TOMS, Karen -
TUNKS, Ursula -
WILLIAMSON, Richie -
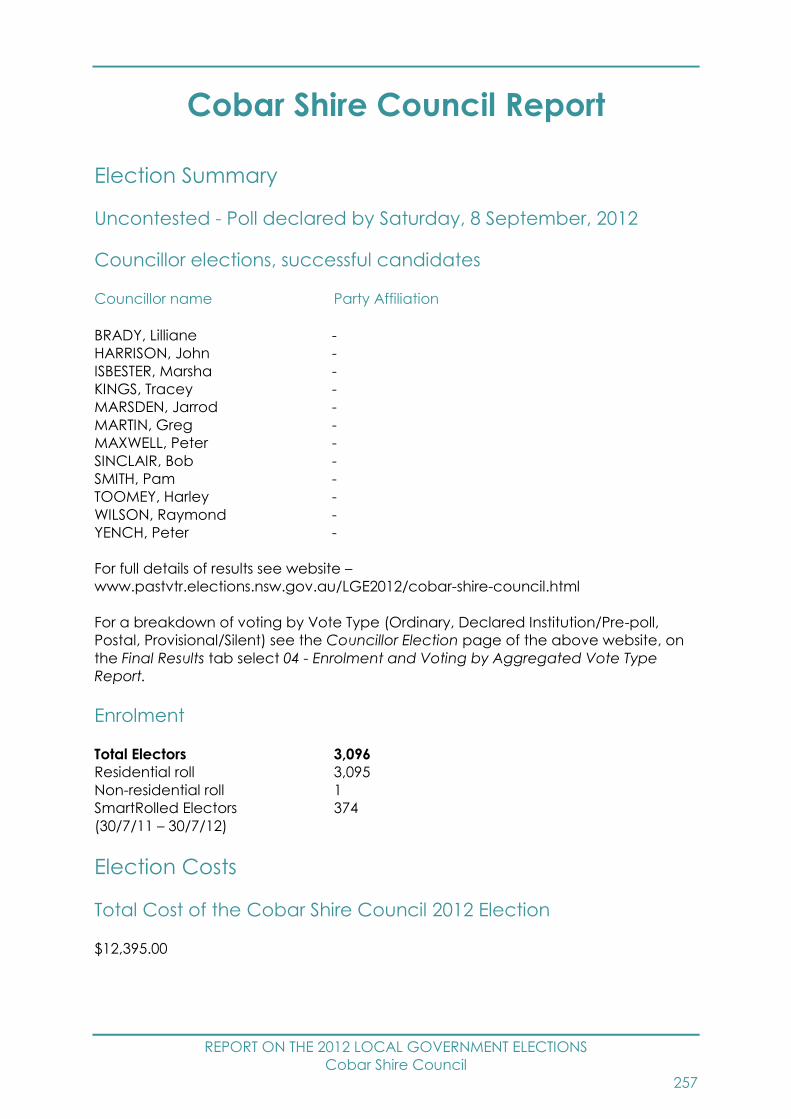
REPORT ON THE 2012 LOCAL GOVERNMENT ELECTIONS
Cobar Shire Council
257
Cobar Shire Council Report
Election Summary
Uncontested - Poll declared by Saturday, 8 September, 2012
Councillor elections, successful candidates
Councillor name Party Affiliation
BRADY, Lilliane -
HARRISON, John -
ISBESTER, Marsha -
KINGS, Tracey -
MARSDEN, Jarrod -
MARTIN, Greg -
MAXWELL, Peter -
SINCLAIR, Bob -
SMITH, Pam -
TOOMEY, Harley -
WILSON, Raymond -
YENCH, Peter -
For full details of results see website –
www.pastvtr.elections.nsw.gov.au/LGE2012/cobar-shire-council.html
For a breakdown of voting by Vote Type (Ordinary, Declared Institution/Pre-poll,
Postal, Provisional/Silent) see the Councillor Election page of the above website, on
the Final Results tab select 04 - Enrolment and Voting by Aggregated Vote Type
Report.
Enrolment
Total Electors 3,096
Residential roll 3,095
Non-residential roll 1
SmartRolled Electors 374
(30/7/11 – 30/7/12)
Election Costs
Total Cost of the Cobar Shire Council 2012 Election
$12,395.00

REPORT ON THE 2012 LOCAL GOVERNMENT ELECTIONS
Cobar Shire Council
258
Cost per elector
$4.01
Cobar Shire Council Statutory Advertising Campaign Expenditure
Nominations $345.90
Candidates and polling places $0.00
Uncontested elections $234.56
Results $0.00
TOTAL $580.46
Election Services
Elector Enquiry Centre
The Elector Enquiry Centre answered 5 calls from postcodes within Cobar Shire
Council area.
NSWEC Website
There were 294 unique visitors to Cobar Shire Council election web page.
Braille Ballot Papers
No braille ballot papers were requested or printed.
Returning Officer
Stephen Middleton
Returning Officer’s Office
Cobar Region Returning Officer's Office
19 Barton Street
Cobar NSW 2835
Councils in Region
Bogan Shire Council, Bourke Shire Council, Brewarrina Shire Council and Cobar Shire
Council
REPORT ON THE 2012 LOCAL GOVERNMENT ELECTIONS
Cobar Shire Council
259
Advertising
Statutory Campaign
The Council requested that the statutory advertisements be placed in the following
press:
Cobar Weekly
Cobar Age
Candidates
Nominations withdrawn
No Councillor nominations were withdrawn.
Councillor Candidates
Total Candidates 12
Female Candidates 4
Male Candidates 8
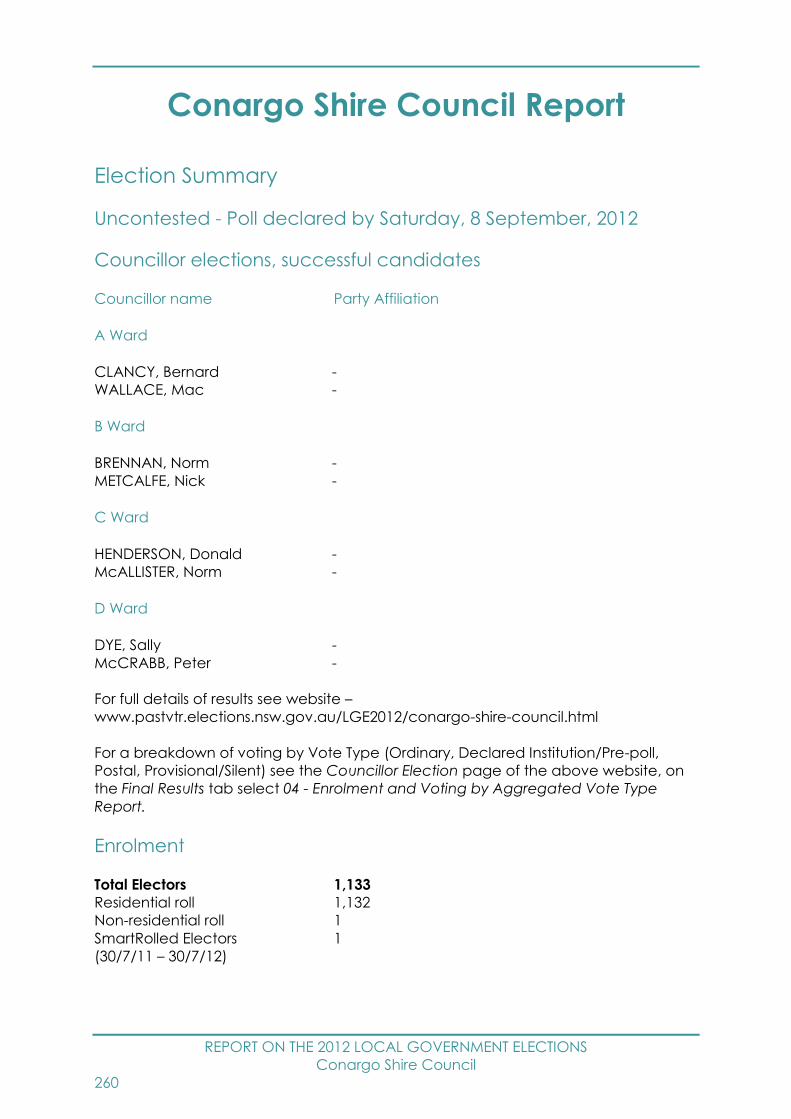
REPORT ON THE 2012 LOCAL GOVERNMENT ELECTIONS
Conargo Shire Council
260
Conargo Shire Council Report
Election Summary
Uncontested - Poll declared by Saturday, 8 September, 2012
Councillor elections, successful candidates
Councillor name Party Affiliation
A Ward
CLANCY, Bernard -
WALLACE, Mac -
B Ward
BRENNAN, Norm -
METCALFE, Nick -
C Ward
HENDERSON, Donald -
McALLISTER, Norm -
D Ward
DYE, Sally -
McCRABB, Peter -
For full details of results see website –
www.pastvtr.elections.nsw.gov.au/LGE2012/conargo-shire-council.html
For a breakdown of voting by Vote Type (Ordinary, Declared Institution/Pre-poll,
Postal, Provisional/Silent) see the Councillor Election page of the above website, on
the Final Results tab select 04 - Enrolment and Voting by Aggregated Vote Type
Report.
Enrolment
Total Electors 1,133
Residential roll 1,132
Non-residential roll 1
SmartRolled Electors 1
(30/7/11 – 30/7/12)

REPORT ON THE 2012 LOCAL GOVERNMENT ELECTIONS
Conargo Shire Council
261
Election Costs
Total Cost of the Conargo Shire Council 2012 Election
$3,283.00
Cost per elector
$2.91
Conargo Shire Council Statutory Advertising Campaign Expenditure
Nominations $952.52
Candidates and polling places $0.00
Uncontested elections $798.60
Results $0.00
TOTAL $1,751.12
Election Services
Elector Enquiry Centre
The Elector Enquiry Centre answered 3 calls from postcodes within Conargo Shire
Council area.
NSWEC Website
There were 160 unique visitors to Conargo Shire Council election web page.
Braille Ballot Papers
No braille ballot papers were requested.
Returning Officer
Erin Hore
Returning Officer’s Office
Berrigan Region Returning Officer's Office
Old Finley Library
54 Denison Street
Finley NSW 2713
Councils in Region
Berrigan Shire Council, Conargo Shire Council, Deniliquin Council, Jerilderie Shire
Council and Murray Shire Council
REPORT ON THE 2012 LOCAL GOVERNMENT ELECTIONS
Conargo Shire Council
262
Pre-poll centre locations
Berrigan Region Returning Officer's Office, Sydney Town Hall
Polling place locations
For 2012 map and polling places see –
www.pastvtr.elections.nsw.gov.au/LGE2012/conargo-shire-council.html
Advertising
Statutory Campaign
The Council requested that the statutory advertisements be placed in the following
press:
Deniliquin Pastoral Times
Finley Southern Riverina News
Hay Riverine Grazier
Candidates
Nominations withdrawn
No Councillor nominations were withdrawn.
Councillor Candidates
Total Candidates 8
Female Candidates 1
Male Candidates 7
A Ward Councillor Candidates
Total Candidates 2
Female Candidates 0
Male Candidates 2
B Ward Councillor Candidates
Total Candidates 2
Female Candidates 0
Male Candidates 2
C Ward Councillor Candidates
Total Candidates 2
Female Candidates 0
Male Candidates 2

REPORT ON THE 2012 LOCAL GOVERNMENT ELECTIONS
Conargo Shire Council
263
D Ward Councillor Candidates
Total Candidates 2
Female Candidates 1
Male Candidates 1
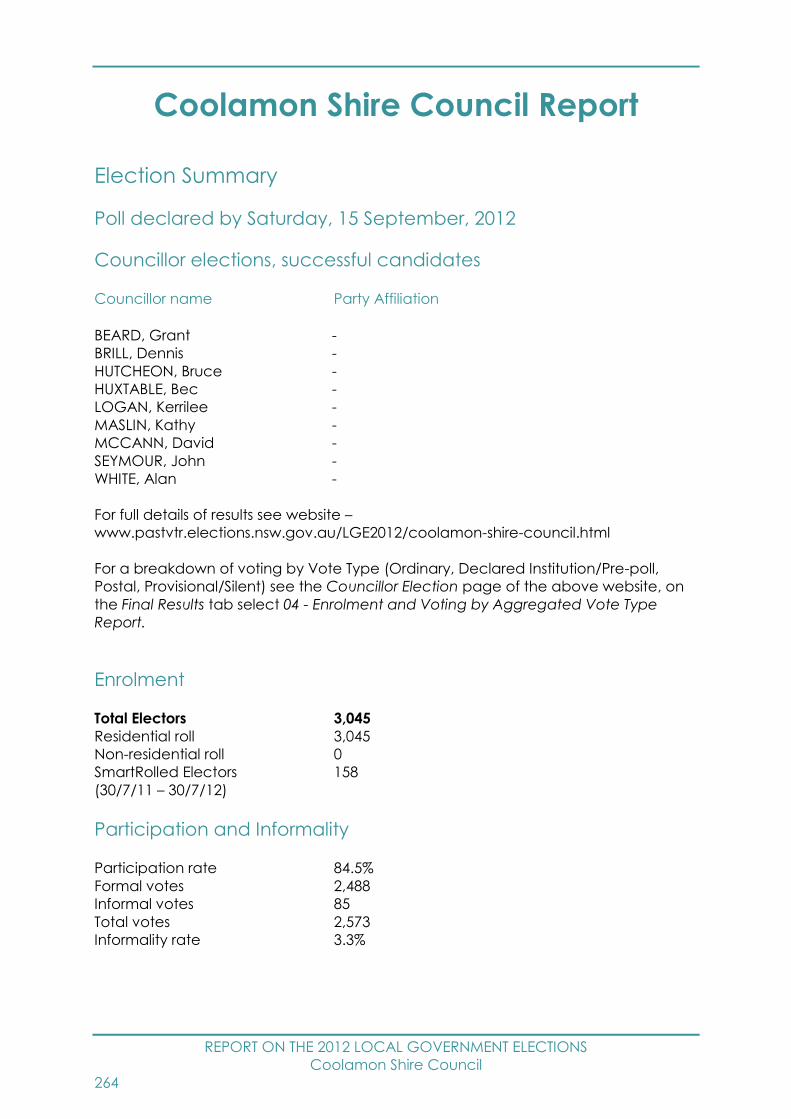
REPORT ON THE 2012 LOCAL GOVERNMENT ELECTIONS
Coolamon Shire Council
264
Coolamon Shire Council Report
Election Summary
Poll declared by Saturday, 15 September, 2012
Councillor elections, successful candidates
Councillor name Party Affiliation
BEARD, Grant -
BRILL, Dennis -
HUTCHEON, Bruce -
HUXTABLE, Bec -
LOGAN, Kerrilee -
MASLIN, Kathy -
MCCANN, David -
SEYMOUR, John -
WHITE, Alan -
For full details of results see website –
www.pastvtr.elections.nsw.gov.au/LGE2012/coolamon-shire-council.html
For a breakdown of voting by Vote Type (Ordinary, Declared Institution/Pre-poll,
Postal, Provisional/Silent) see the Councillor Election page of the above website, on
the Final Results tab select 04 - Enrolment and Voting by Aggregated Vote Type
Report.
Enrolment
Total Electors 3,045
Residential roll 3,045
Non-residential roll 0
SmartRolled Electors 158
(30/7/11 – 30/7/12)
Participation and Informality
Participation rate 84.5%
Formal votes 2,488
Informal votes 85
Total votes 2,573
Informality rate 3.3%

REPORT ON THE 2012 LOCAL GOVERNMENT ELECTIONS
Coolamon Shire Council
265
Failure to Vote
Penalty Notices Issued 313
Rate of Failure to Vote31 10.3%
Election Costs
Total Cost of the Coolamon Shire Council 2012 Election
$27,182.00
Cost per elector
$8.96
Coolamon Shire Council Statutory Advertising Campaign Expenditure
Nominations $859.42
Candidates and polling places $2,351.46
Uncontested elections $0.00
Results $250.00
TOTAL $3,460.88
Election Services
Elector Enquiry Centre
The Elector Enquiry Centre answered 60 calls from postcodes within Coolamon Shire
Council area.
NSWEC Website
There were 594 unique visitors to Coolamon Shire Council election web page.
Braille Ballot Papers
No braille ballot papers were requested or printed.
Returning Officer
Alan Salmon
31 Percentage of Penalty Notices Issued to Enrolment (as shown on Authorised Roll)
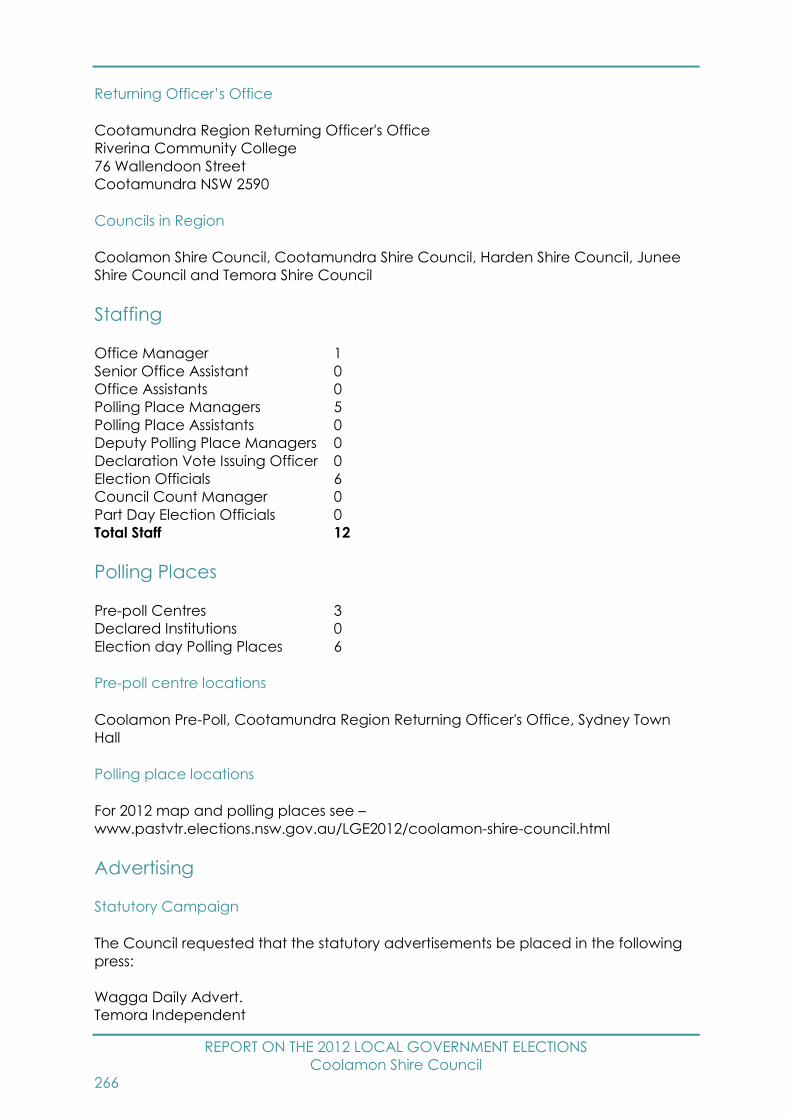
REPORT ON THE 2012 LOCAL GOVERNMENT ELECTIONS
Coolamon Shire Council
266
Returning Officer’s Office
Cootamundra Region Returning Officer's Office
Riverina Community College
76 Wallendoon Street
Cootamundra NSW 2590
Councils in Region
Coolamon Shire Council, Cootamundra Shire Council, Harden Shire Council, Junee
Shire Council and Temora Shire Council
Staffing
Office Manager 1
Senior Office Assistant 0
Office Assistants 0
Polling Place Managers 5
Polling Place Assistants 0
Deputy Polling Place Managers 0
Declaration Vote Issuing Officer 0
Election Officials 6
Council Count Manager 0
Part Day Election Officials 0
Total Staff 12
Polling Places
Pre-poll Centres 3
Declared Institutions 0
Election day Polling Places 6
Pre-poll centre locations
Coolamon Pre-Poll, Cootamundra Region Returning Officer's Office, Sydney Town
Hall
Polling place locations
For 2012 map and polling places see –
www.pastvtr.elections.nsw.gov.au/LGE2012/coolamon-shire-council.html
Advertising
Statutory Campaign
The Council requested that the statutory advertisements be placed in the following
press:
Wagga Daily Advert.
Temora Independent

REPORT ON THE 2012 LOCAL GOVERNMENT ELECTIONS
Coolamon Shire Council
267
Candidates
Nominations withdrawn
No Councillor nominations were withdrawn.
Councillor Candidates
Total Candidates 13
Female Candidates 5
Male Candidates 8
Names of all candidates
Councillor Candidates Party Affiliation
BEARD, Grant -
BRILL, Dennis -
CRUIKSHANK, Catherine -
HAYES, Matthew -
HUTCHEON, Bruce -
HUXTABLE, Bec -
LOGAN, Kerrilee -
MASLIN, Kathy -
MCCANN, David -
MENZIES, Megan -
SEYMOUR, John -
SMITH, John -
WHITE, Alan -
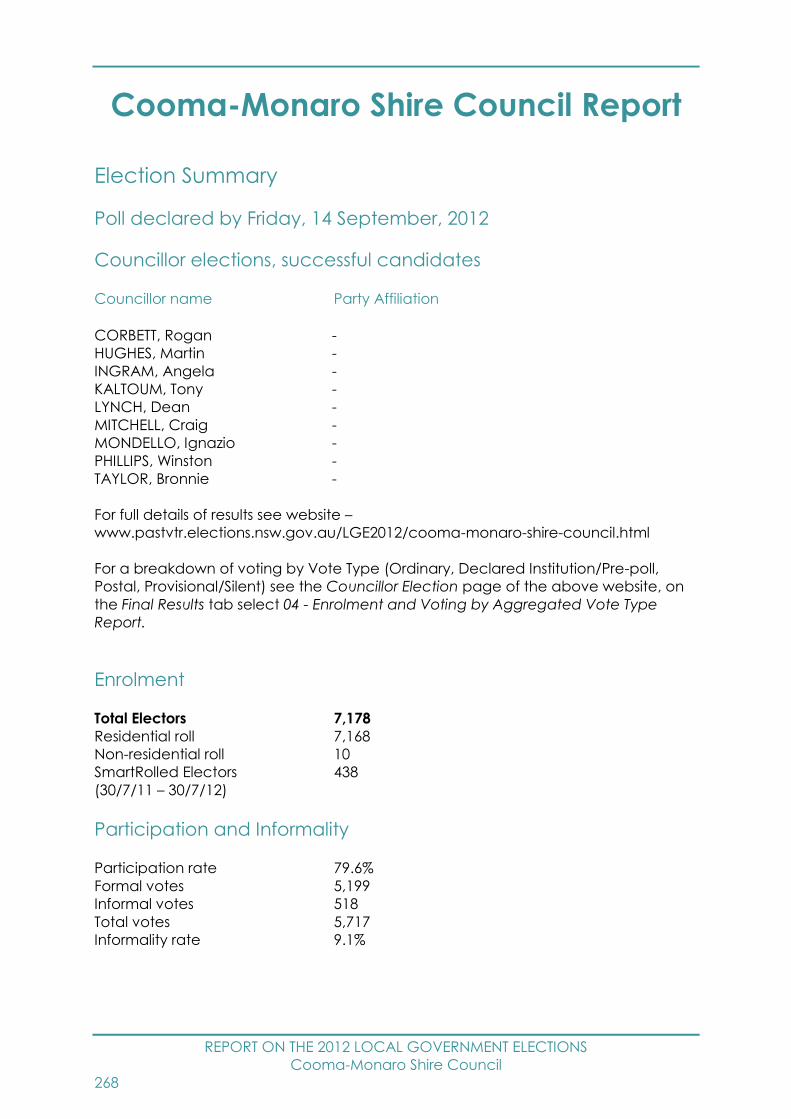
REPORT ON THE 2012 LOCAL GOVERNMENT ELECTIONS
Cooma-Monaro Shire Council
268
Cooma-Monaro Shire Council Report
Election Summary
Poll declared by Friday, 14 September, 2012
Councillor elections, successful candidates
Councillor name Party Affiliation
CORBETT, Rogan -
HUGHES, Martin -
INGRAM, Angela -
KALTOUM, Tony -
LYNCH, Dean -
MITCHELL, Craig -
MONDELLO, Ignazio -
PHILLIPS, Winston -
TAYLOR, Bronnie -
For full details of results see website –
www.pastvtr.elections.nsw.gov.au/LGE2012/cooma-monaro-shire-council.html
For a breakdown of voting by Vote Type (Ordinary, Declared Institution/Pre-poll,
Postal, Provisional/Silent) see the Councillor Election page of the above website, on
the Final Results tab select 04 - Enrolment and Voting by Aggregated Vote Type
Report.
Enrolment
Total Electors 7,178
Residential roll 7,168
Non-residential roll 10
SmartRolled Electors 438
(30/7/11 – 30/7/12)
Participation and Informality
Participation rate 79.6%
Formal votes 5,199
Informal votes 518
Total votes 5,717
Informality rate 9.1%

REPORT ON THE 2012 LOCAL GOVERNMENT ELECTIONS
Cooma-Monaro Shire Council
269
Failure to Vote
Penalty Notices Issued 1,166
Rate of Failure to Vote32 16.3%
Election Costs
Total Cost of the Cooma-Monaro Shire Council 2012 Election
$62,261.00
Cost per elector
$8.71
Cooma-Monaro Shire Council Statutory Advertising Campaign Expenditure
Nominations $888.34
Candidates and polling places $198.00
Uncontested elections $0.00
Results $99.00
TOTAL $1,185.34
Election Services
Elector Enquiry Centre
The Elector Enquiry Centre answered 127 calls from postcodes within Cooma-Monaro
Shire Council area.
NSWEC Website
There were 1,354 unique visitors to Cooma-Monaro Shire Council election web page.
Braille Ballot Papers
No braille ballot papers were requested or printed.
Returning Officer
Susan Burke
32 Percentage of Penalty Notices Issued to Enrolment (as shown on Authorised Roll)
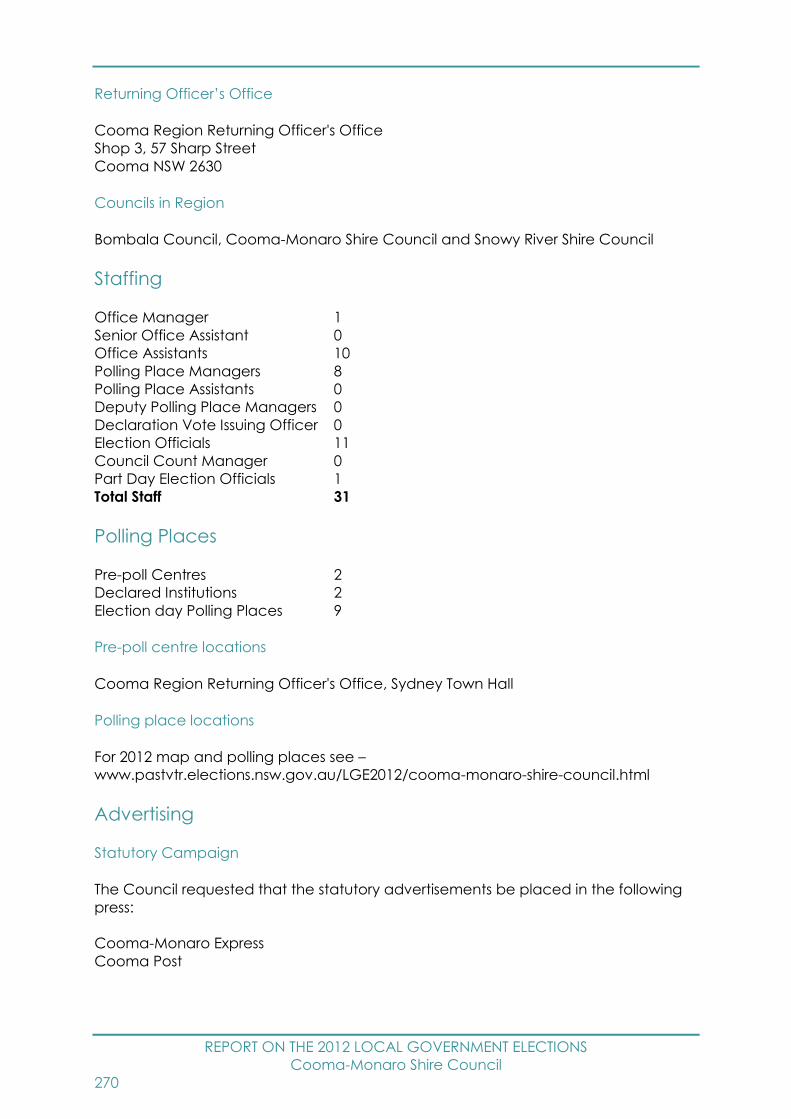
REPORT ON THE 2012 LOCAL GOVERNMENT ELECTIONS
Cooma-Monaro Shire Council
270
Returning Officer’s Office
Cooma Region Returning Officer's Office
Shop 3, 57 Sharp Street
Cooma NSW 2630
Councils in Region
Bombala Council, Cooma-Monaro Shire Council and Snowy River Shire Council
Staffing
Office Manager 1
Senior Office Assistant 0
Office Assistants 10
Polling Place Managers 8
Polling Place Assistants 0
Deputy Polling Place Managers 0
Declaration Vote Issuing Officer 0
Election Officials 11
Council Count Manager 0
Part Day Election Officials 1
Total Staff 31
Polling Places
Pre-poll Centres 2
Declared Institutions 2
Election day Polling Places 9
Pre-poll centre locations
Cooma Region Returning Officer's Office, Sydney Town Hall
Polling place locations
For 2012 map and polling places see –
www.pastvtr.elections.nsw.gov.au/LGE2012/cooma-monaro-shire-council.html
Advertising
Statutory Campaign
The Council requested that the statutory advertisements be placed in the following
press:
Cooma-Monaro Express
Cooma Post

REPORT ON THE 2012 LOCAL GOVERNMENT ELECTIONS
Cooma-Monaro Shire Council
271
Candidates
Nominations withdrawn
No Councillor nominations were withdrawn.
Councillor Candidates
Total Candidates 16
Female Candidates 2
Male Candidates 14
Names of all candidates
Councillor Candidates Party Affiliation
ALLEN, Steve -
CORBETT, Rogan -
HUGHES, Martin -
INGRAM, Angela -
KALTOUM, Tony -
KAY, Glynn -
LLOYD, Will -
LYNCH, Dean -
MITCHELL, Craig -
MONDELLO, Ignazio -
PERKINS, John -
PHILLIPS, Winston -
STARRS, Denis -
TAYLOR, Bronnie -
THALER, Andrew -
TURNER, David -
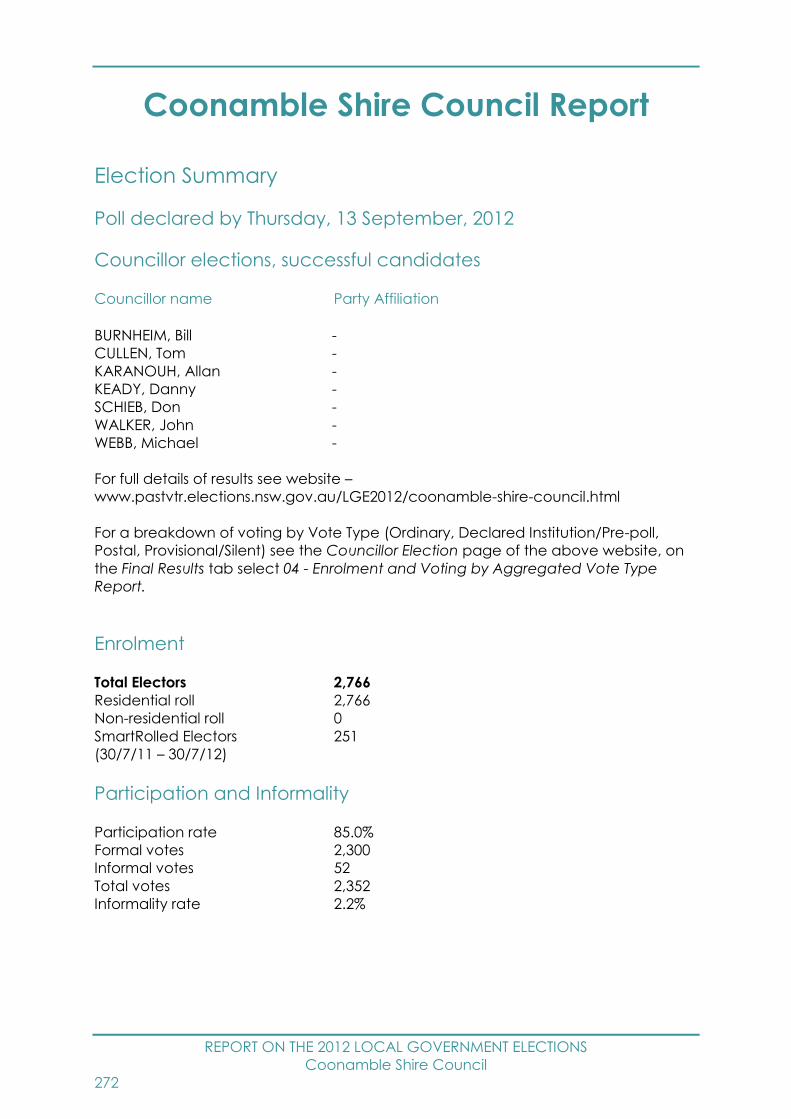
REPORT ON THE 2012 LOCAL GOVERNMENT ELECTIONS
Coonamble Shire Council
272
Coonamble Shire Council Report
Election Summary
Poll declared by Thursday, 13 September, 2012
Councillor elections, successful candidates
Councillor name Party Affiliation
BURNHEIM, Bill -
CULLEN, Tom -
KARANOUH, Allan -
KEADY, Danny -
SCHIEB, Don -
WALKER, John -
WEBB, Michael -
For full details of results see website –
www.pastvtr.elections.nsw.gov.au/LGE2012/coonamble-shire-council.html
For a breakdown of voting by Vote Type (Ordinary, Declared Institution/Pre-poll,
Postal, Provisional/Silent) see the Councillor Election page of the above website, on
the Final Results tab select 04 - Enrolment and Voting by Aggregated Vote Type
Report.
Enrolment
Total Electors 2,766
Residential roll 2,766
Non-residential roll 0
SmartRolled Electors 251
(30/7/11 – 30/7/12)
Participation and Informality
Participation rate 85.0%
Formal votes 2,300
Informal votes 52
Total votes 2,352
Informality rate 2.2%

REPORT ON THE 2012 LOCAL GOVERNMENT ELECTIONS
Coonamble Shire Council
273
Failure to Vote
Penalty Notices Issued 343
Rate of Failure to Vote33 12.4%
Election Costs
Total Cost of the Coonamble Shire Council 2012 Election
$24,448.00
Cost per elector
$8.86
Coonamble Shire Council Statutory Advertising Campaign Expenditure
Nominations $258.95
Candidates and polling places $665.02
Uncontested elections $0.00
Results $203.31
TOTAL $1,127.28
Election Services
Elector Enquiry Centre
The Elector Enquiry Centre answered 25 calls from postcodes within Coonamble Shire
Council area.
NSWEC Website
There were 563 unique visitors to Coonamble Shire Council election web page.
Braille Ballot Papers
No braille ballot papers were requested or printed.
Returning Officer
Helen Murray
33 Percentage of Penalty Notices Issued to Enrolment (as shown on Authorised Roll)
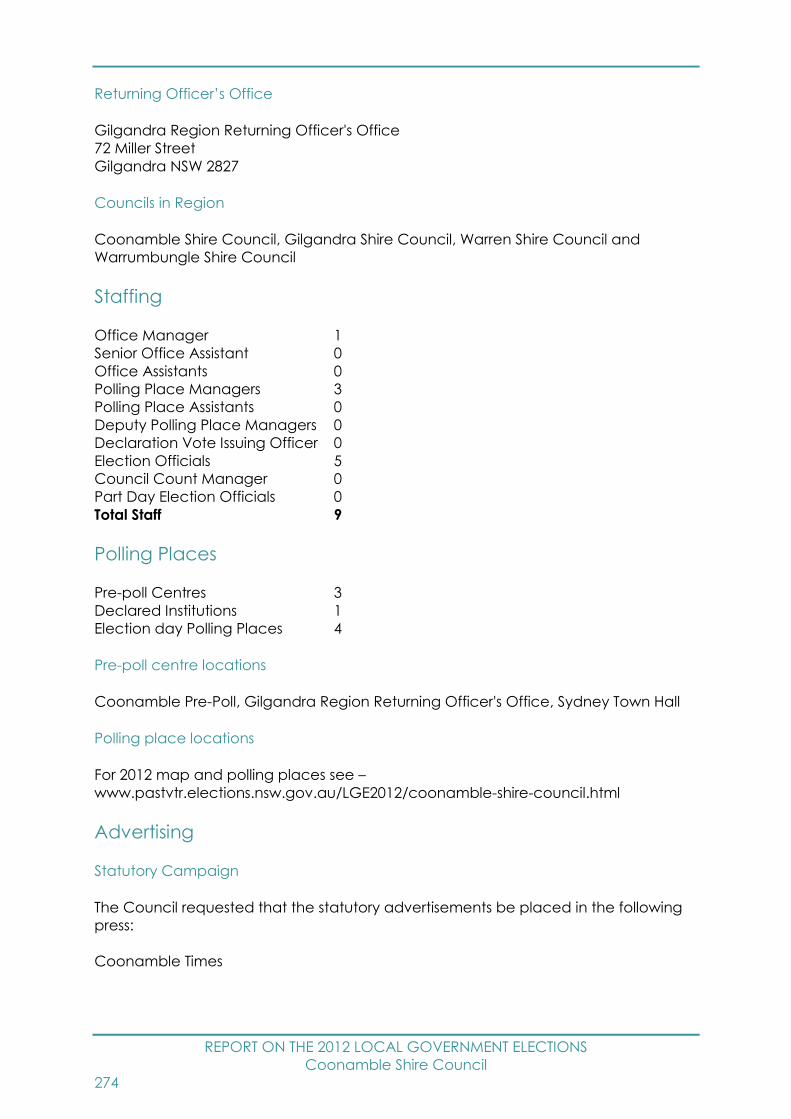
REPORT ON THE 2012 LOCAL GOVERNMENT ELECTIONS
Coonamble Shire Council
274
Returning Officer’s Office
Gilgandra Region Returning Officer's Office
72 Miller Street
Gilgandra NSW 2827
Councils in Region
Coonamble Shire Council, Gilgandra Shire Council, Warren Shire Council and
Warrumbungle Shire Council
Staffing
Office Manager 1
Senior Office Assistant 0
Office Assistants 0
Polling Place Managers 3
Polling Place Assistants 0
Deputy Polling Place Managers 0
Declaration Vote Issuing Officer 0
Election Officials 5
Council Count Manager 0
Part Day Election Officials 0
Total Staff 9
Polling Places
Pre-poll Centres 3
Declared Institutions 1
Election day Polling Places 4
Pre-poll centre locations
Coonamble Pre-Poll, Gilgandra Region Returning Officer's Office, Sydney Town Hall
Polling place locations
For 2012 map and polling places see –
www.pastvtr.elections.nsw.gov.au/LGE2012/coonamble-shire-council.html
Advertising
Statutory Campaign
The Council requested that the statutory advertisements be placed in the following
press:
Coonamble Times

REPORT ON THE 2012 LOCAL GOVERNMENT ELECTIONS
Coonamble Shire Council
275
Candidates
Nominations withdrawn
No Councillor nominations were withdrawn.
Councillor Candidates
Total Candidates 13
Female Candidates 0
Male Candidates 13
Names of all candidates
Councillor Candidates Party Affiliation
BURNHEIM, Bill -
COHEN, Adam -
CULLEN, Tom -
KARANOUH, Allan -
KEADY, Danny -
MOPPETT, Peter -
ROBINSON, Adam -
SCHIEB, Don -
WALKER, John -
WARE, Bob -
WEBB, Michael -
WHEELHOUSE, Paul -
WHITE, Noel -
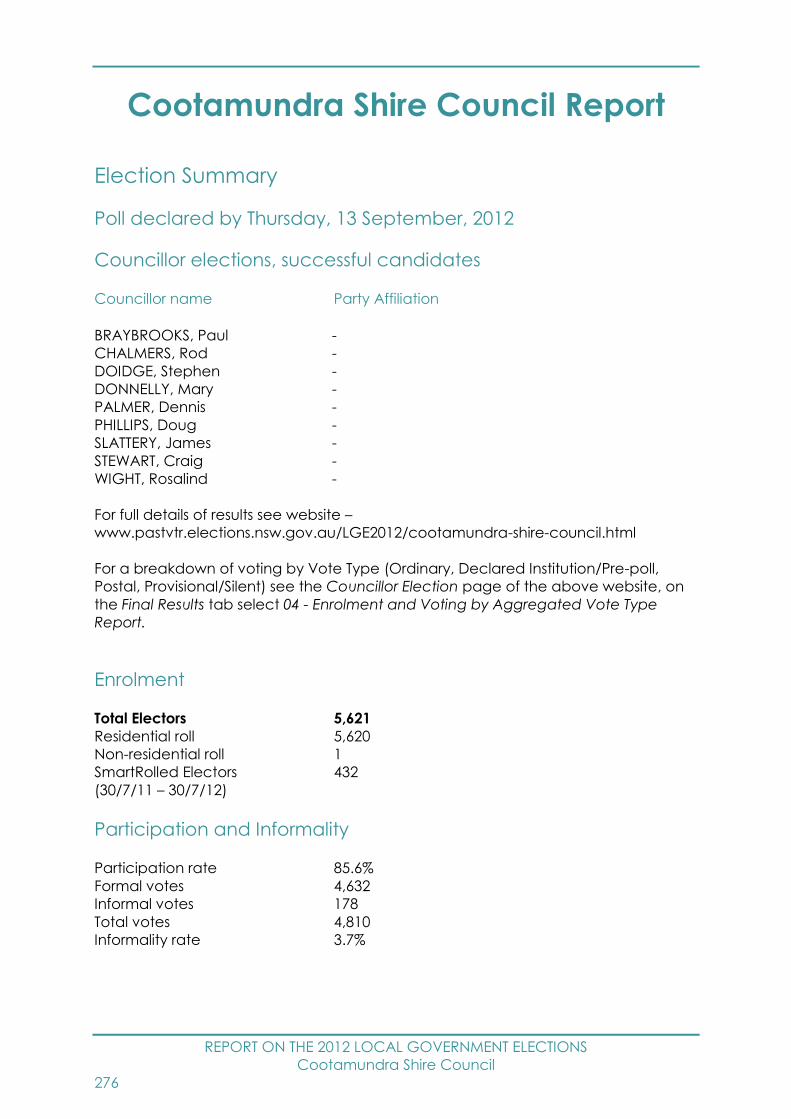
REPORT ON THE 2012 LOCAL GOVERNMENT ELECTIONS
Cootamundra Shire Council
276
Cootamundra Shire Council Report
Election Summary
Poll declared by Thursday, 13 September, 2012
Councillor elections, successful candidates
Councillor name Party Affiliation
BRAYBROOKS, Paul -
CHALMERS, Rod -
DOIDGE, Stephen -
DONNELLY, Mary -
PALMER, Dennis -
PHILLIPS, Doug -
SLATTERY, James -
STEWART, Craig -
WIGHT, Rosalind -
For full details of results see website –
www.pastvtr.elections.nsw.gov.au/LGE2012/cootamundra-shire-council.html
For a breakdown of voting by Vote Type (Ordinary, Declared Institution/Pre-poll,
Postal, Provisional/Silent) see the Councillor Election page of the above website, on
the Final Results tab select 04 - Enrolment and Voting by Aggregated Vote Type
Report.
Enrolment
Total Electors 5,621
Residential roll 5,620
Non-residential roll 1
SmartRolled Electors 432
(30/7/11 – 30/7/12)
Participation and Informality
Participation rate 85.6%
Formal votes 4,632
Informal votes 178
Total votes 4,810
Informality rate 3.7%

REPORT ON THE 2012 LOCAL GOVERNMENT ELECTIONS
Cootamundra Shire Council
277
Failure to Vote
Penalty Notices Issued 556
Rate of Failure to Vote34 9.9%
Election Costs
Total Cost of the Cootamundra Shire Council 2012 Election
$43,693.00
Cost per elector
$7.79
Cootamundra Shire Council Statutory Advertising Campaign Expenditure
Nominations $687.46
Candidates and polling places $1,898.68
Uncontested elections $0.00
Results $170.94
TOTAL $2,757.08
Election Services
Elector Enquiry Centre
The Elector Enquiry Centre answered 57 calls from postcodes within Cootamundra
Shire Council area.
NSWEC Website
There were 626 unique visitors to Cootamundra Shire Council election web page.
Braille Ballot Papers
No braille ballot papers were requested or printed.
Returning Officer
Alan Salmon
34 Percentage of Penalty Notices Issued to Enrolment (as shown on Authorised Roll)
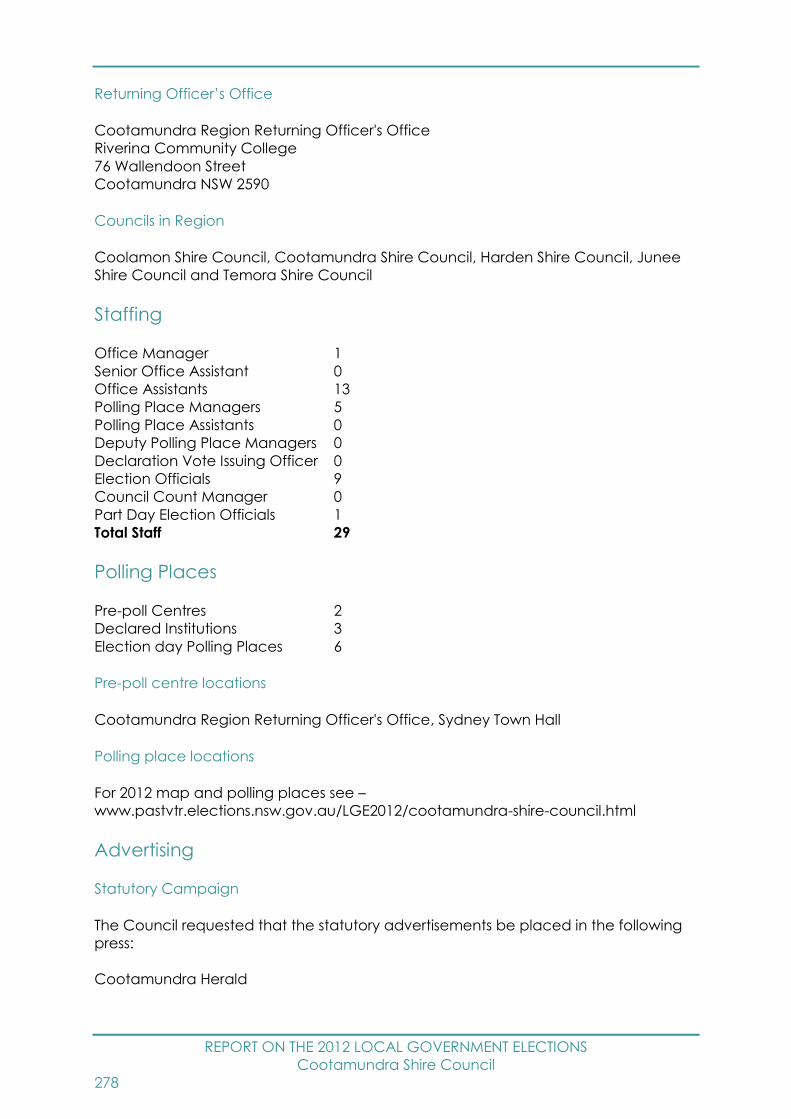
REPORT ON THE 2012 LOCAL GOVERNMENT ELECTIONS
Cootamundra Shire Council
278
Returning Officer’s Office
Cootamundra Region Returning Officer's Office
Riverina Community College
76 Wallendoon Street
Cootamundra NSW 2590
Councils in Region
Coolamon Shire Council, Cootamundra Shire Council, Harden Shire Council, Junee
Shire Council and Temora Shire Council
Staffing
Office Manager 1
Senior Office Assistant 0
Office Assistants 13
Polling Place Managers 5
Polling Place Assistants 0
Deputy Polling Place Managers 0
Declaration Vote Issuing Officer 0
Election Officials 9
Council Count Manager 0
Part Day Election Officials 1
Total Staff 29
Polling Places
Pre-poll Centres 2
Declared Institutions 3
Election day Polling Places 6
Pre-poll centre locations
Cootamundra Region Returning Officer's Office, Sydney Town Hall
Polling place locations
For 2012 map and polling places see –
www.pastvtr.elections.nsw.gov.au/LGE2012/cootamundra-shire-council.html
Advertising
Statutory Campaign
The Council requested that the statutory advertisements be placed in the following
press:
Cootamundra Herald

REPORT ON THE 2012 LOCAL GOVERNMENT ELECTIONS
Cootamundra Shire Council
279
Candidates
Nominations withdrawn
No Councillor nominations were withdrawn.
Councillor Candidates
Total Candidates 11
Female Candidates 2
Male Candidates 9
Names of all candidates
Councillor Candidates Party Affiliation
BRAYBROOKS, Paul -
CHALMERS, Rod -
DOIDGE, Stephen -
DONNELLY, Mary -
GREWAL, Brian -
PALMER, Dennis -
PARDY, Nicholas -
PHILLIPS, Doug -
SLATTERY, James -
STEWART, Craig -
WIGHT, Rosalind -
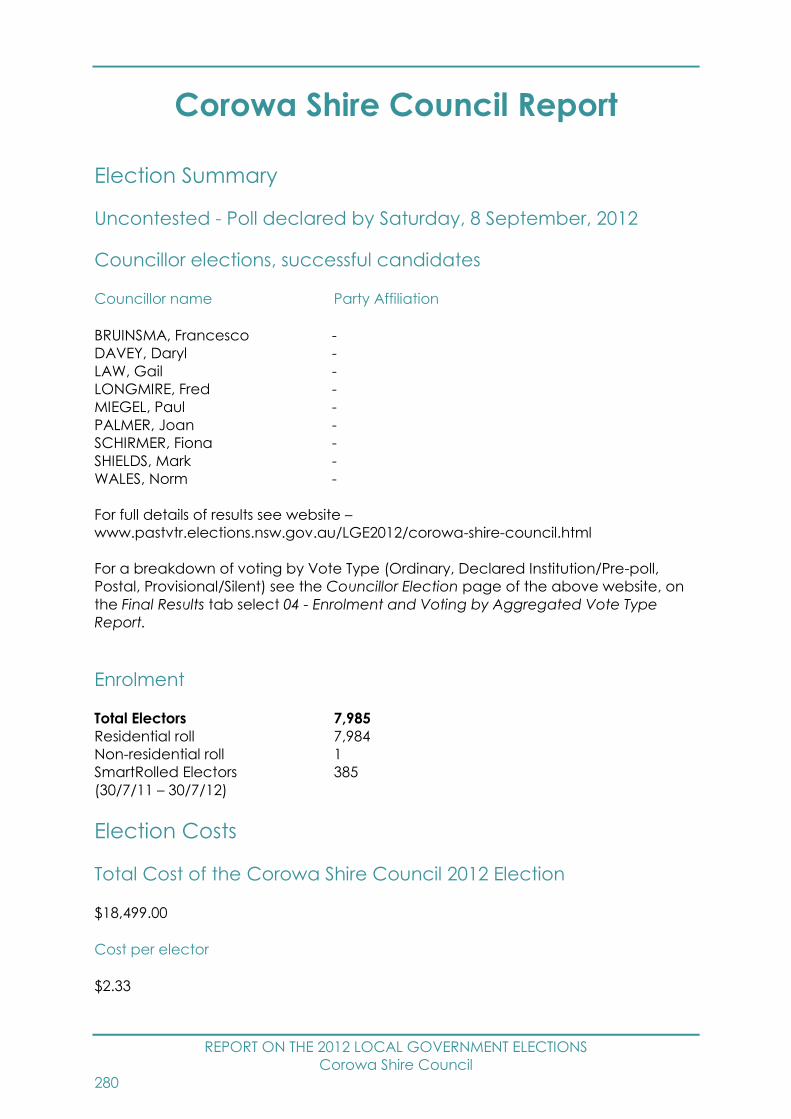
REPORT ON THE 2012 LOCAL GOVERNMENT ELECTIONS
Corowa Shire Council
280
Corowa Shire Council Report
Election Summary
Uncontested - Poll declared by Saturday, 8 September, 2012
Councillor elections, successful candidates
Councillor name Party Affiliation
BRUINSMA, Francesco -
DAVEY, Daryl -
LAW, Gail -
LONGMIRE, Fred -
MIEGEL, Paul -
PALMER, Joan -
SCHIRMER, Fiona -
SHIELDS, Mark -
WALES, Norm -
For full details of results see website –
www.pastvtr.elections.nsw.gov.au/LGE2012/corowa-shire-council.html
For a breakdown of voting by Vote Type (Ordinary, Declared Institution/Pre-poll,
Postal, Provisional/Silent) see the Councillor Election page of the above website, on
the Final Results tab select 04 - Enrolment and Voting by Aggregated Vote Type
Report.
Enrolment
Total Electors 7,985
Residential roll 7,984
Non-residential roll 1
SmartRolled Electors 385
(30/7/11 – 30/7/12)
Election Costs
Total Cost of the Corowa Shire Council 2012 Election
$18,499.00
Cost per elector
$2.33
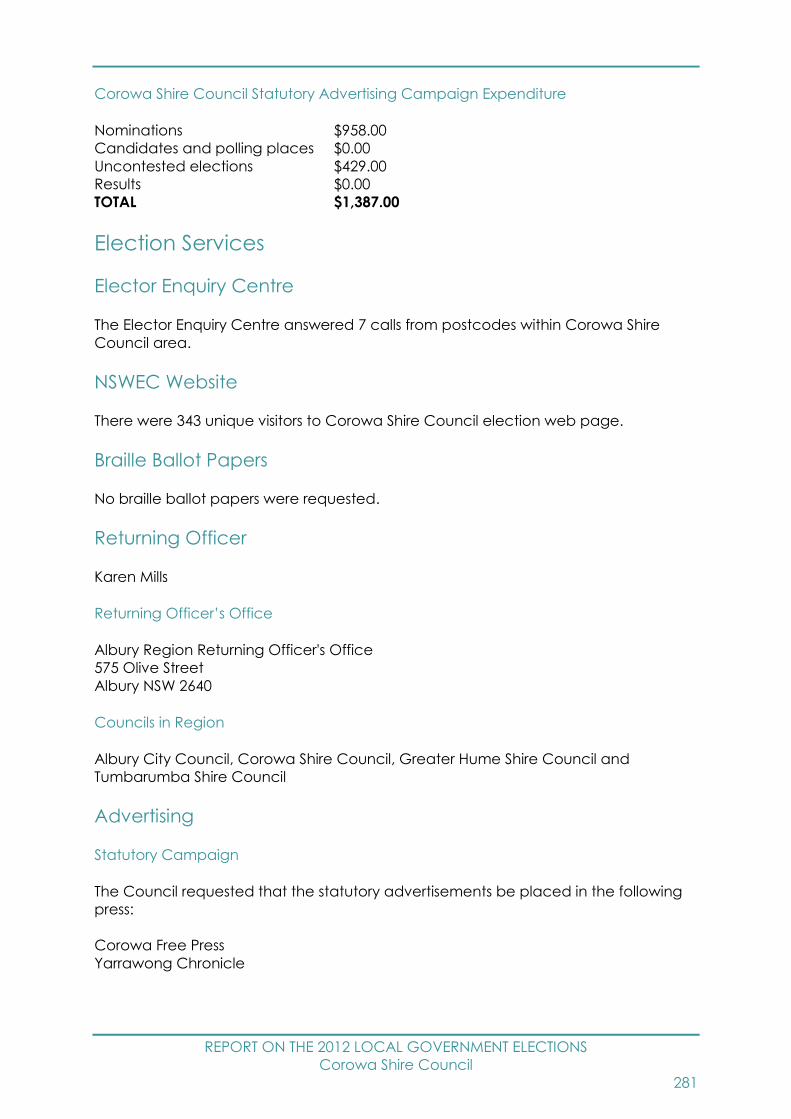
REPORT ON THE 2012 LOCAL GOVERNMENT ELECTIONS
Corowa Shire Council
281
Corowa Shire Council Statutory Advertising Campaign Expenditure
Nominations $958.00
Candidates and polling places $0.00
Uncontested elections $429.00
Results $0.00
TOTAL $1,387.00
Election Services
Elector Enquiry Centre
The Elector Enquiry Centre answered 7 calls from postcodes within Corowa Shire
Council area.
NSWEC Website
There were 343 unique visitors to Corowa Shire Council election web page.
Braille Ballot Papers
No braille ballot papers were requested.
Returning Officer
Karen Mills
Returning Officer’s Office
Albury Region Returning Officer's Office
575 Olive Street
Albury NSW 2640
Councils in Region
Albury City Council, Corowa Shire Council, Greater Hume Shire Council and
Tumbarumba Shire Council
Advertising
Statutory Campaign
The Council requested that the statutory advertisements be placed in the following
press:
Corowa Free Press
Yarrawong Chronicle
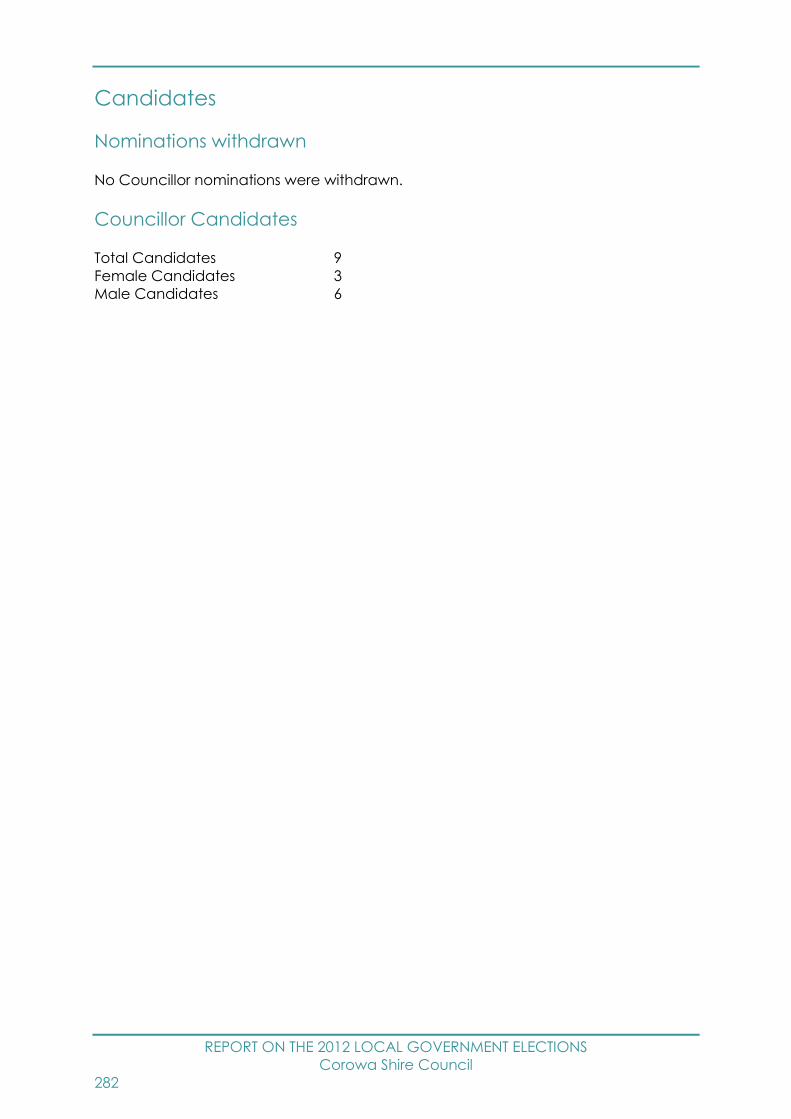
REPORT ON THE 2012 LOCAL GOVERNMENT ELECTIONS
Corowa Shire Council
282
Candidates
Nominations withdrawn
No Councillor nominations were withdrawn.
Councillor Candidates
Total Candidates 9
Female Candidates 3
Male Candidates 6

REPORT ON THE 2012 LOCAL GOVERNMENT ELECTIONS
Cowra Shire Council
283
Cowra Shire Council Report
Election Summary
Poll declared by Saturday, 15 September, 2012
Councillor elections, successful candidates
Councillor name Party Affiliation
BROWN, Ian -
FAGAN, Ruth -
MALLON, Jack -
MAYNES, Sue -
MILLER, Bruce -
SMITH, Judi -
WALSH, Raymond -
WEST, Bill -
WRIGHT, Peter -
For full details of results see website –
www.pastvtr.elections.nsw.gov.au/LGE2012/cowra-shire-council.html
For a breakdown of voting by Vote Type (Ordinary, Declared Institution/Pre-poll,
Postal, Provisional/Silent) see the Councillor Election page of the above website, on
the Final Results tab select 04 - Enrolment and Voting by Aggregated Vote Type
Report.
Enrolment
Total Electors 9,218
Residential roll 9,217
Non-residential roll 1
SmartRolled Electors 705
(30/7/11 – 30/7/12)
Participation and Informality
Participation rate 83.1%
Formal votes 7,268
Informal votes 396
Total votes 7,664
Informality rate 5.2%

REPORT ON THE 2012 LOCAL GOVERNMENT ELECTIONS
Cowra Shire Council
284
Failure to Vote
Penalty Notices Issued 1,260
Rate of Failure to Vote35 13.7%
Election Costs
Total Cost of the Cowra Shire Council 2012 Election
$75,160.00
Cost per elector
$8.18
Cowra Shire Council Statutory Advertising Campaign Expenditure
Nominations $366.30
Candidates and polling places $651.20
Uncontested elections $0.00
Results $162.00
TOTAL $1,179.50
Election Services
Elector Enquiry Centre
The Elector Enquiry Centre answered 114 calls from postcodes within Cowra Shire
Council area.
NSWEC Website
There were 1,138 unique visitors to Cowra Shire Council election web page.
Braille Ballot Papers
No braille ballot papers were requested or printed.
Returning Officer
Mary Moffitt
35 Percentage of Penalty Notices Issued to Enrolment (as shown on Authorised Roll)
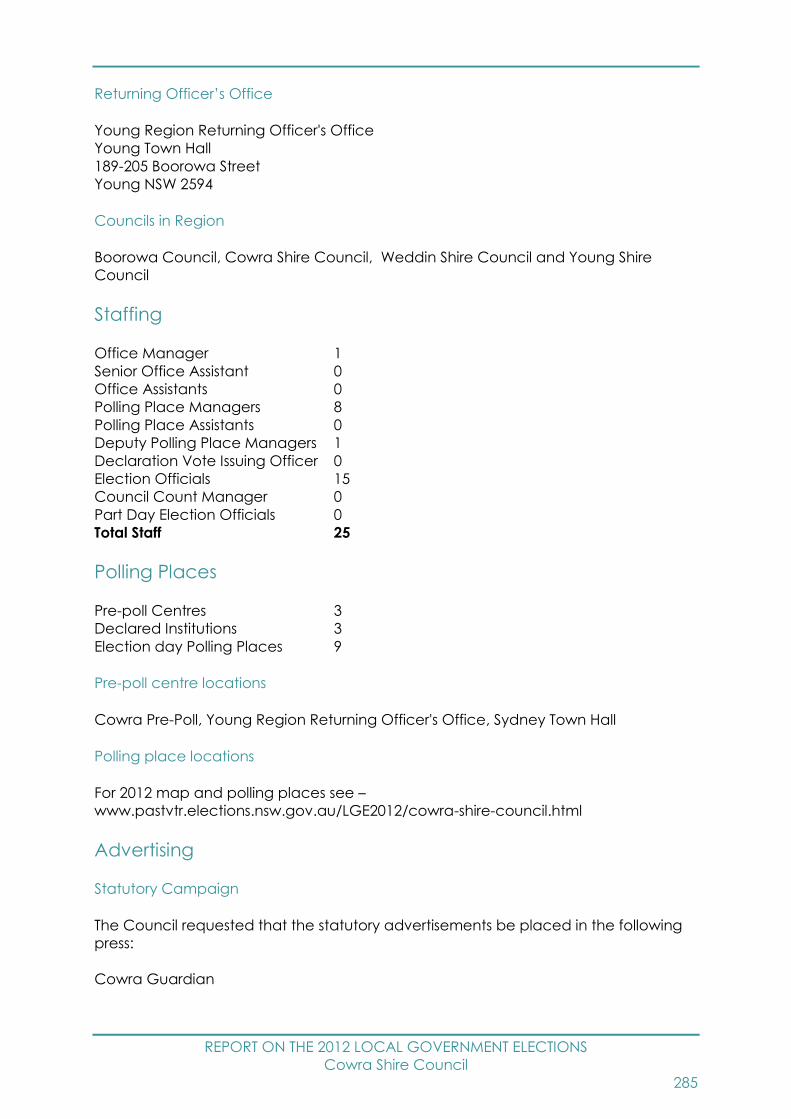
REPORT ON THE 2012 LOCAL GOVERNMENT ELECTIONS
Cowra Shire Council
285
Returning Officer’s Office
Young Region Returning Officer's Office
Young Town Hall
189-205 Boorowa Street
Young NSW 2594
Councils in Region
Boorowa Council, Cowra Shire Council, Weddin Shire Council and Young Shire
Council
Staffing
Office Manager 1
Senior Office Assistant 0
Office Assistants 0
Polling Place Managers 8
Polling Place Assistants 0
Deputy Polling Place Managers 1
Declaration Vote Issuing Officer 0
Election Officials 15
Council Count Manager 0
Part Day Election Officials 0
Total Staff 25
Polling Places
Pre-poll Centres 3
Declared Institutions 3
Election day Polling Places 9
Pre-poll centre locations
Cowra Pre-Poll, Young Region Returning Officer's Office, Sydney Town Hall
Polling place locations
For 2012 map and polling places see –
www.pastvtr.elections.nsw.gov.au/LGE2012/cowra-shire-council.html
Advertising
Statutory Campaign
The Council requested that the statutory advertisements be placed in the following
press:
Cowra Guardian

REPORT ON THE 2012 LOCAL GOVERNMENT ELECTIONS
Cowra Shire Council
286
Candidates
Nominations withdrawn
No Councillor nominations were withdrawn.
Councillor Candidates
Total Candidates 13
Female Candidates 3
Male Candidates 10
Names of all candidates
Councillor Candidates Party Affiliation
BRIDGES, Robert -
BROWN, Ian -
COX, David -
FAGAN, Ruth -
GEE, Larry -
MALLON, Jack -
MAYNES, Sue -
MILLER, Bruce -
RYAN, Tony -
SMITH, Judi -
WALSH, Raymond -
WEST, Bill -
WRIGHT, Peter -

REPORT ON THE 2012 LOCAL GOVERNMENT ELECTIONS
Deniliquin Council
287
Deniliquin Council Report
Election Summary
Uncontested - Poll declared by Saturday, 8 September, 2012
Councillor elections, successful candidates
Councillor name Party Affiliation
CONNELL, Peter -
FOGARTY, Pat -
HALL, Ashley -
HOWLEY, Andrew -
RENWICK, Lindsay -
SHAND, Jeff -
TAYLOR, Sue -
For full details of results see website –
www.pastvtr.elections.nsw.gov.au/LGE2012/deniliquin-council.html
For a breakdown of voting by Vote Type (Ordinary, Declared Institution/Pre-poll,
Postal, Provisional/Silent) see the Councillor Election page of the above website, on
the Final Results tab select 04 - Enrolment and Voting by Aggregated Vote Type
Report.
Enrolment
Total Electors 5,178
Residential roll 5,177
Non-residential roll 1
SmartRolled Electors 399
(30/7/11 – 30/7/12)
Election Costs
Total Cost of the Deniliquin Council 2012 Election
$14,853.00
Cost per elector
$2.88
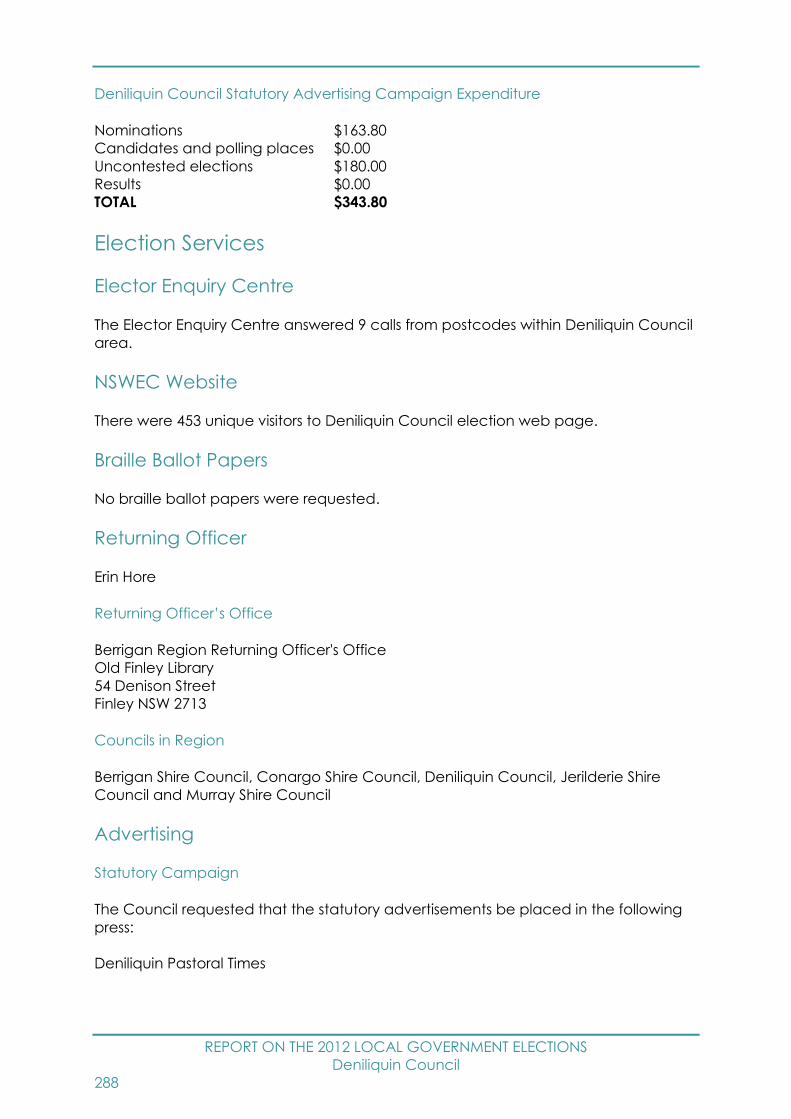
REPORT ON THE 2012 LOCAL GOVERNMENT ELECTIONS
Deniliquin Council
288
Deniliquin Council Statutory Advertising Campaign Expenditure
Nominations $163.80
Candidates and polling places $0.00
Uncontested elections $180.00
Results $0.00
TOTAL $343.80
Election Services
Elector Enquiry Centre
The Elector Enquiry Centre answered 9 calls from postcodes within Deniliquin Council
area.
NSWEC Website
There were 453 unique visitors to Deniliquin Council election web page.
Braille Ballot Papers
No braille ballot papers were requested.
Returning Officer
Erin Hore
Returning Officer’s Office
Berrigan Region Returning Officer's Office
Old Finley Library
54 Denison Street
Finley NSW 2713
Councils in Region
Berrigan Shire Council, Conargo Shire Council, Deniliquin Council, Jerilderie Shire
Council and Murray Shire Council
Advertising
Statutory Campaign
The Council requested that the statutory advertisements be placed in the following
press:
Deniliquin Pastoral Times
REPORT ON THE 2012 LOCAL GOVERNMENT ELECTIONS
Deniliquin Council
289
Candidates
Nominations withdrawn
No Councillor nominations were withdrawn.
Councillor Candidates
Total Candidates 7
Female Candidates 2
Male Candidates 5
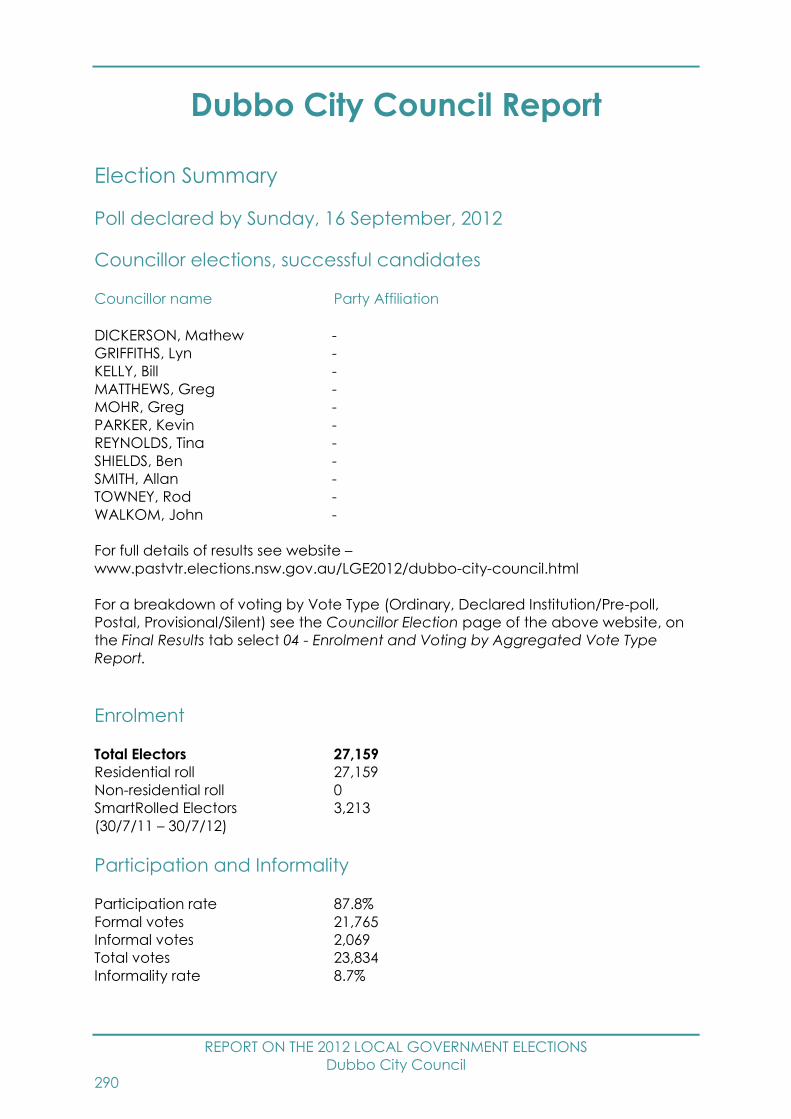
REPORT ON THE 2012 LOCAL GOVERNMENT ELECTIONS
Dubbo City Council
290
Dubbo City Council Report
Election Summary
Poll declared by Sunday, 16 September, 2012
Councillor elections, successful candidates
Councillor name Party Affiliation
DICKERSON, Mathew -
GRIFFITHS, Lyn -
KELLY, Bill -
MATTHEWS, Greg -
MOHR, Greg -
PARKER, Kevin -
REYNOLDS, Tina -
SHIELDS, Ben -
SMITH, Allan -
TOWNEY, Rod -
WALKOM, John -
For full details of results see website –
www.pastvtr.elections.nsw.gov.au/LGE2012/dubbo-city-council.html
For a breakdown of voting by Vote Type (Ordinary, Declared Institution/Pre-poll,
Postal, Provisional/Silent) see the Councillor Election page of the above website, on
the Final Results tab select 04 - Enrolment and Voting by Aggregated Vote Type
Report.
Enrolment
Total Electors 27,159
Residential roll 27,159
Non-residential roll 0
SmartRolled Electors 3,213
(30/7/11 – 30/7/12)
Participation and Informality
Participation rate 87.8%
Formal votes 21,765
Informal votes 2,069
Total votes 23,834
Informality rate 8.7%

REPORT ON THE 2012 LOCAL GOVERNMENT ELECTIONS
Dubbo City Council
291
Failure to Vote
Penalty Notices Issued 2,656
Rate of Failure to Vote36 9.8%
Election Costs
Total Cost of the Dubbo City Council 2012 Election
$195,838.00
Cost per elector
$7.24
Dubbo City Council Statutory Advertising Campaign Expenditure
Nominations $1,818.00
Candidates and polling places $2,454.30
Uncontested elections $0.00
Results $424.20
TOTAL $4,696.50
Election Services
Elector Enquiry Centre
The Elector Enquiry Centre answered 328 calls from postcodes within Dubbo City
Council area.
NSWEC Website
There were 3,860 unique visitors to Dubbo City Council election web page.
Braille Ballot Papers
No braille ballot papers were requested or printed.
Returning Officer
Katherine Reid
36 Percentage of Penalty Notices Issued to Enrolment (as shown on Authorised Roll)

REPORT ON THE 2012 LOCAL GOVERNMENT ELECTIONS
Dubbo City Council
292
Returning Officer’s Office
Dubbo Region Returning Officer's Office
108 Macquarie Street
Dubbo NSW 2830
Councils in Region
Dubbo City Council, Narromine Shire Council and Wellington Council
Staffing
Office Manager 1
Senior Office Assistant 0
Office Assistants 32
Polling Place Managers 13
Polling Place Assistants 0
Deputy Polling Place Managers 3
Declaration Vote Issuing Officer 3
Election Officials 37
Council Count Manager 0
Part Day Election Officials 6
Total Staff 95
Polling Places
Pre-poll Centres 2
Declared Institutions 7
Election day Polling Places 14
Pre-poll centre locations
Dubbo Region Returning Officer's Office, Sydney Town Hall
Polling place locations
For 2012 map and polling places see –
www.pastvtr.elections.nsw.gov.au/LGE2012/dubbo-city-council.html
Advertising
Statutory Campaign
The Council requested that the statutory advertisements be placed in the following
press:
Daily Liberal

REPORT ON THE 2012 LOCAL GOVERNMENT ELECTIONS
Dubbo City Council
293
Candidates
Nominations withdrawn
No Councillor nominations were withdrawn.
Councillor Candidates
Total Candidates 53
Female Candidates 20
Male Candidates 33
Names of all candidates
Councillor Candidates Party Affiliation
ANDERSON, Jack -
CATELOTTI, Mick -
CATELOTTI, Nikki -
CATON, Laurie -
COLLESS, Shirley -
CUBBY, Amy -
DAVEY, Scott -
DICKERSON, Mathew -
DICKSON, Deb -
ELLIS, Nathan -
GIBB, Jo -
GIBBS, Peter -
GORDON, John -
GREENAWAY, Anne -
GRIFFITHS, Lyn -
HARRIS, Chris -
JONES, Carle -
KELLY, Bill -
KELLY, Jim -
KELLY, Mick -
LYONS, Adam -
MATTHEWS, Greg -
MATTHEWS, Rhonda -
MAWBEY, Wayne -
McCARTHY, Debbie -
McDONALD, Wayne -
McKINNON, Barry -
MOHR, Greg -
MUTTON, Richard -
NEILSON, Cindy -
O'LEARY, Peter -
PARKER, Kevin -
POISSON, Rorque -
RABBETT, Neil -
REPORT ON THE 2012 LOCAL GOVERNMENT ELECTIONS
Dubbo City Council
294
REYNOLDS, Tina -
SALT, Robert -
SAYERS, Inesita -
SEE, Cecil -
SETON, Nicki -
SHIELDS, Ben -
SHIPP, Kellie -
SHOOTER, Laura -
SHOOTER, Nathan -
SKORDALES, Peter -
SMITH, Allan -
SOMMERVILLE, Maryann -
STAIT, Gavin -
TOWNEY, Rod -
WALKOM, John -
WHEELER, Warrick -
WILSON, Keneicha -
WILSON, Shirley -
WRIGHT, Jacqui -

REPORT ON THE 2012 LOCAL GOVERNMENT ELECTIONS
Dungog Shire Council
295
Dungog Shire Council Report
Election Summary
Poll declared by Wednesday, 12 September, 2012
Councillor elections, successful candidates
Councillor name Party Affiliation
A Ward
BALE, Neville -
FARROW, Stephen -
NORMAN, Tracy -
B Ward - Uncontested
JOHNSTON, Harold -
KNUDSEN, Nancy -
McKENZIE, Tony -
C Ward
BOOTH, Robert -
BOWDEN, Linda -
WALL, Glenn -
For full details of results see website –
www.pastvtr.elections.nsw.gov.au/LGE2012/dungog-shire-council.html
For a breakdown of voting by Vote Type (Ordinary, Declared Institution/Pre-poll,
Postal, Provisional/Silent) see the Councillor Election page of the above website, on
the Final Results tab select 04 - Enrolment and Voting by Aggregated Vote Type
Report.
Enrolment
Total Electors 6,391
Residential roll 6,391
Non-residential roll 0
SmartRolled Electors 422
(30/7/11 – 30/7/12)
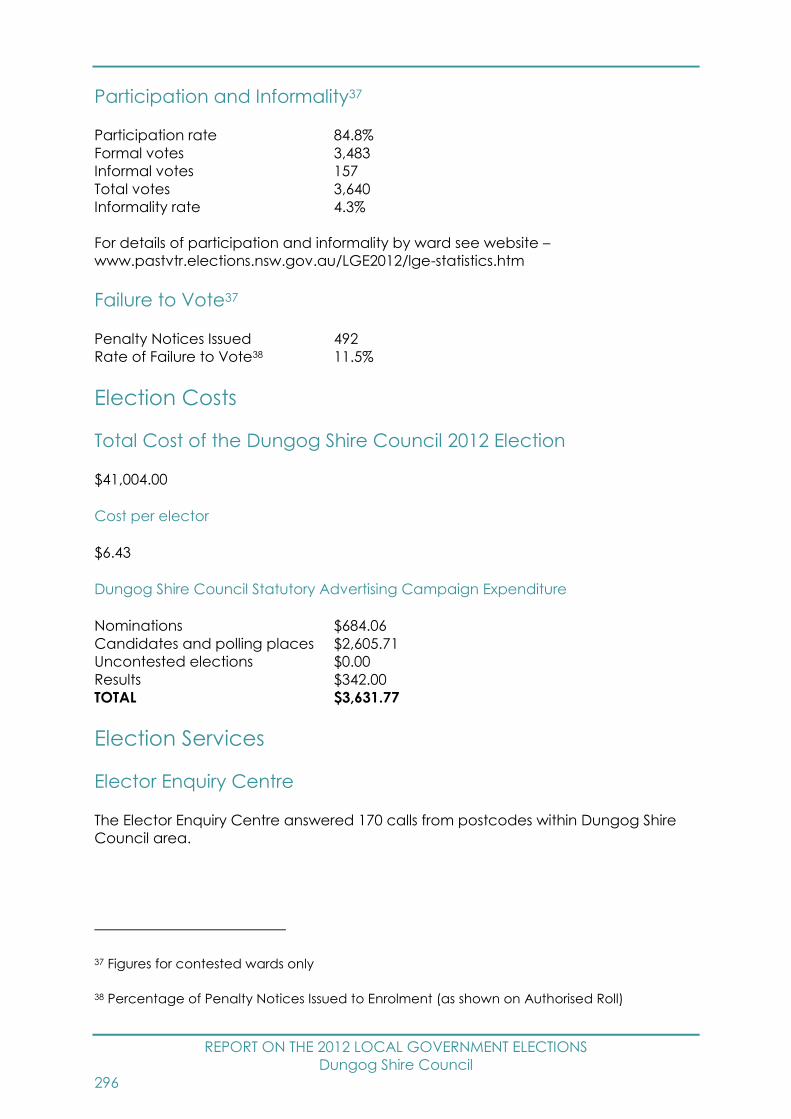
REPORT ON THE 2012 LOCAL GOVERNMENT ELECTIONS
Dungog Shire Council
296
Participation and Informality37
Participation rate 84.8%
Formal votes 3,483
Informal votes 157
Total votes 3,640
Informality rate 4.3%
For details of participation and informality by ward see website –
www.pastvtr.elections.nsw.gov.au/LGE2012/lge-statistics.htm
Failure to Vote37
Penalty Notices Issued 492
Rate of Failure to Vote38 11.5%
Election Costs
Total Cost of the Dungog Shire Council 2012 Election
$41,004.00
Cost per elector
$6.43
Dungog Shire Council Statutory Advertising Campaign Expenditure
Nominations $684.06
Candidates and polling places $2,605.71
Uncontested elections $0.00
Results $342.00
TOTAL $3,631.77
Election Services
Elector Enquiry Centre
The Elector Enquiry Centre answered 170 calls from postcodes within Dungog Shire
Council area.
37 Figures for contested wards only
38 Percentage of Penalty Notices Issued to Enrolment (as shown on Authorised Roll)
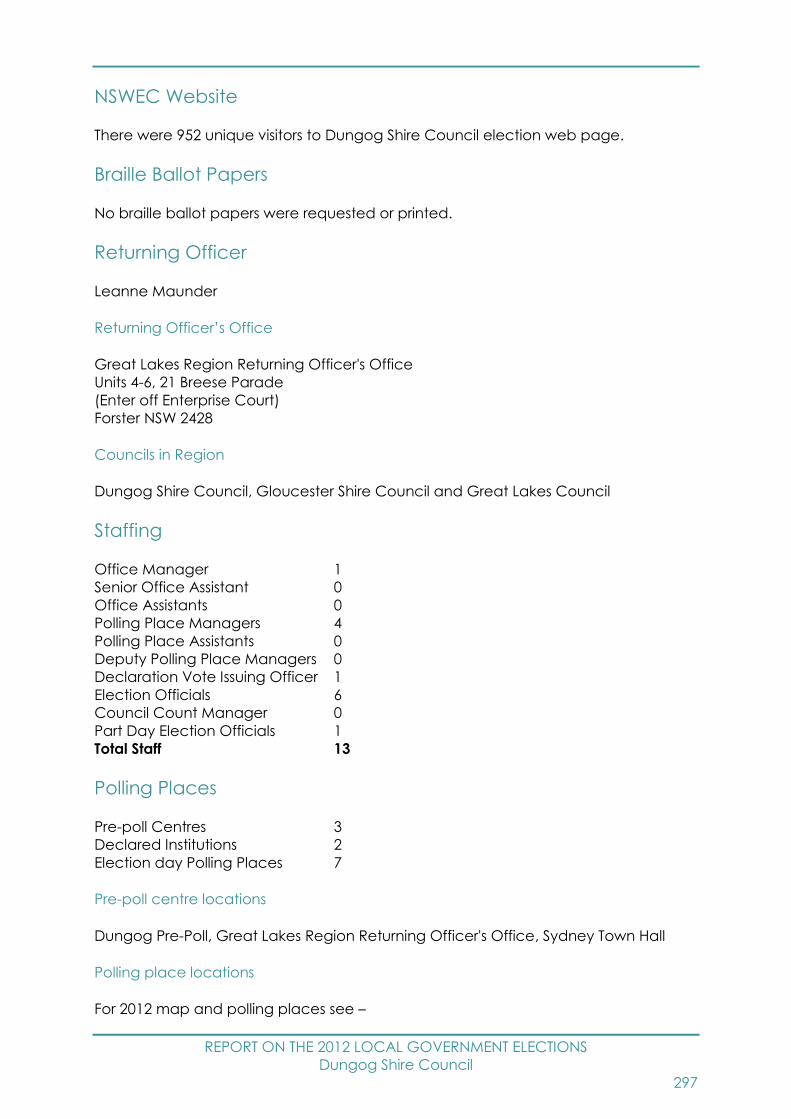
REPORT ON THE 2012 LOCAL GOVERNMENT ELECTIONS
Dungog Shire Council
297
NSWEC Website
There were 952 unique visitors to Dungog Shire Council election web page.
Braille Ballot Papers
No braille ballot papers were requested or printed.
Returning Officer
Leanne Maunder
Returning Officer’s Office
Great Lakes Region Returning Officer's Office
Units 4-6, 21 Breese Parade
(Enter off Enterprise Court)
Forster NSW 2428
Councils in Region
Dungog Shire Council, Gloucester Shire Council and Great Lakes Council
Staffing
Office Manager 1
Senior Office Assistant 0
Office Assistants 0
Polling Place Managers 4
Polling Place Assistants 0
Deputy Polling Place Managers 0
Declaration Vote Issuing Officer 1
Election Officials 6
Council Count Manager 0
Part Day Election Officials 1
Total Staff 13
Polling Places
Pre-poll Centres 3
Declared Institutions 2
Election day Polling Places 7
Pre-poll centre locations
Dungog Pre-Poll, Great Lakes Region Returning Officer's Office, Sydney Town Hall
Polling place locations
For 2012 map and polling places see –

REPORT ON THE 2012 LOCAL GOVERNMENT ELECTIONS
Dungog Shire Council
298
www.pastvtr.elections.nsw.gov.au/LGE2012/dungog-shire-council.html
Advertising
Statutory Campaign
The Council requested that the statutory advertisements be placed in the following
press:
Maitland Mercury
Dungog Chronicle
Candidates
Nominations withdrawn
No Councillor nominations were withdrawn.
Councillor Candidates
Total Candidates 11
Female Candidates 4
Male Candidates 7
A Ward Councillor Candidates
Total Candidates 4
Female Candidates 2
Male Candidates 2
B Ward Councillor Candidates
Total Candidates 3
Female Candidates 1
Male Candidates 2
C Ward Councillor Candidates
Total Candidates 4
Female Candidates 1
Male Candidates 3
Names of all candidates
Councillor Candidates Party Affiliation
A Ward
BALE, Neville -
FARROW, Stephen -
REPORT ON THE 2012 LOCAL GOVERNMENT ELECTIONS
Dungog Shire Council
299
LEWIS, Jennifer -
NORMAN, Tracy -
C Ward
BOOTH, Robert -
BOWDEN, Linda -
ROUSE, Dave -
WALL, Glenn -
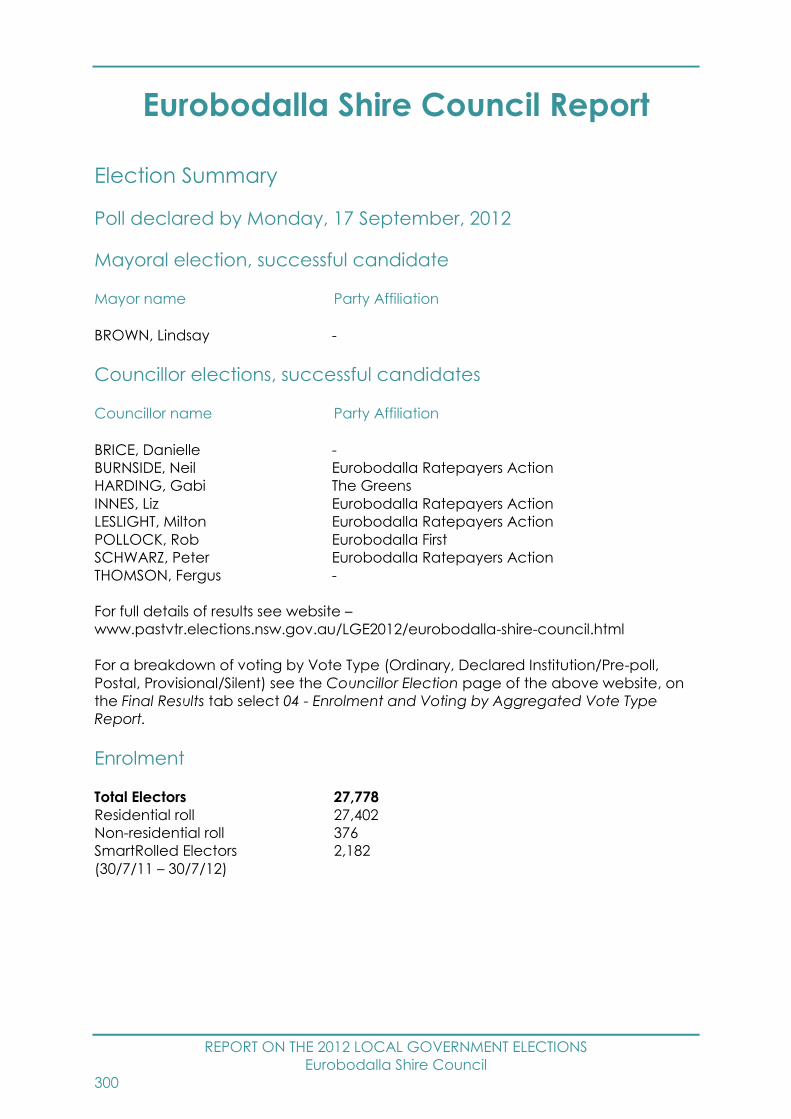
REPORT ON THE 2012 LOCAL GOVERNMENT ELECTIONS
Eurobodalla Shire Council
300
Eurobodalla Shire Council Report
Election Summary
Poll declared by Monday, 17 September, 2012
Mayoral election, successful candidate
Mayor name Party Affiliation
BROWN, Lindsay -
Councillor elections, successful candidates
Councillor name Party Affiliation
BRICE, Danielle -
BURNSIDE, Neil Eurobodalla Ratepayers Action
HARDING, Gabi The Greens
INNES, Liz Eurobodalla Ratepayers Action
LESLIGHT, Milton Eurobodalla Ratepayers Action
POLLOCK, Rob Eurobodalla First
SCHWARZ, Peter Eurobodalla Ratepayers Action
THOMSON, Fergus -
For full details of results see website –
www.pastvtr.elections.nsw.gov.au/LGE2012/eurobodalla-shire-council.html
For a breakdown of voting by Vote Type (Ordinary, Declared Institution/Pre-poll,
Postal, Provisional/Silent) see the Councillor Election page of the above website, on
the Final Results tab select 04 - Enrolment and Voting by Aggregated Vote Type
Report.
Enrolment
Total Electors 27,778
Residential roll 27,402
Non-residential roll 376
SmartRolled Electors 2,182
(30/7/11 – 30/7/12)

REPORT ON THE 2012 LOCAL GOVERNMENT ELECTIONS
Eurobodalla Shire Council
301
Participation and Informality
Participation rate 82.2%
Formal votes 20,391
Informal votes 2,434
Total votes 22,825
Informality rate 10.7%
Failure to Vote
Penalty Notices Issued 3,365
Rate of Failure to Vote39 12.2%
Election Costs
Total Cost of the Eurobodalla Shire Council 2012 Election
$206,928.00
Cost per elector
$7.48
Eurobodalla Shire Council Statutory Advertising Campaign Expenditure
Nominations $2,539.80
Candidates and polling places $4,565.88
Uncontested elections $0.00
Results $1,098.20
TOTAL $8,203.88
Election Services
Elector Enquiry Centre
The Elector Enquiry Centre answered 567 calls from postcodes within Eurobodalla
Shire Council area.
NSWEC Website
There were 3,645 unique visitors to Eurobodalla Shire Council election web page.
Braille Ballot Papers
No braille ballot papers were requested or printed.
39 Percentage of Penalty Notices Issued to Enrolment (as shown on Authorised Roll)
REPORT ON THE 2012 LOCAL GOVERNMENT ELECTIONS
Eurobodalla Shire Council
302
Returning Officer
Susan Flannery
Returning Officer’s Office
Bega Region Returning Officer's Office
70 Gipps Street
(Former Retravision Store)
Bega NSW 2550
Councils in Region
Bega Valley Shire Council and Eurobodalla Shire Council
Staffing
Office Manager 1
Senior Office Assistant 0
Office Assistants 0
Polling Place Managers 17
Polling Place Assistants 9
Deputy Polling Place Managers 2
Declaration Vote Issuing Officer 1
Election Officials 36
Council Count Manager 3
Part Day Election Officials 5
Total Staff 74
Polling Places
Pre-poll Centres 5
Declared Institutions 9
Election day Polling Places 18
Pre-poll centre locations
Batemans Bay Pre-Poll, Bega Region Returning Officer's Office, Moruya Pre-Poll,
Narooma Pre-Poll, Sydney Town Hall
Polling place locations
For 2012 map and polling places see –
www.pastvtr.elections.nsw.gov.au/LGE2012/eurobodalla-shire-council.html
REPORT ON THE 2012 LOCAL GOVERNMENT ELECTIONS
Eurobodalla Shire Council
303
Advertising
Statutory Campaign
The Council requested that the statutory advertisements be placed in the following
press:
Bay Post
Eurobodalla Independent
Moruya Examiner
Narooma News
Candidates
Nominations withdrawn
No Mayoral nominations were withdrawn.
No Councillor nominations were withdrawn.
Mayoral Candidates
Total Candidates 21
Female Candidates 6
Male Candidates 15
Councillor Candidates
Total Candidates 54
Female Candidates 20
Male Candidates 34
Names of all candidates
Mayoral Candidates Party Affiliation
BISHOP, Glenda -
BROWN, Allan -
BROWN, Lindsay -
BURNSIDE, Neil Eurobodalla Ratepayers Action
CAMERON, Michele Eurobodalla Ratepayers Action
CONSTABLE, Phil -
CREED, April Eurobodalla Ratepayers Action
GIFFORD, Ron Eurobodalla Ratepayers Action
HARDING, Gabi The Greens
HARRISON, Tubby Eurobodalla Ratepayers Action
INNES, Liz Eurobodalla Ratepayers Action
KARNY-WINTERS, Orit -
KOWAL, Chris -
LESLIGHT, Milton Eurobodalla Ratepayers Action
MORTON, Alan -
REPORT ON THE 2012 LOCAL GOVERNMENT ELECTIONS
Eurobodalla Shire Council
304
POLLOCK, Rob Eurobodalla First
SCHWARZ, Peter Eurobodalla Ratepayers Action
SCOBIE, Graham -
SMITH, Gary Eurobodalla Ratepayers Action
THOMSON, Fergus -
VARDON, Chris -
Councillor Candidates Party Affiliation
BAILEY, Gary -
BEASHEL, Michael Eurobodalla Ratepayers Action
BISHOP, Glenda -
BRICE, Danielle -
BROWN, Allan -
BROWN, Lindsay -
BURNSIDE, Neil Eurobodalla Ratepayers Action
BUSSA, Gerald -
CAMERON, Michele Eurobodalla Ratepayers Action
CARUANA, Janet -
CARUANA, Paul -
CHALLENDER, Ann Eurobodalla First
CLOUT, John Eurobodalla Ratepayers Action
CONSTABLE, Phil -
CORNALL, John Eurobodalla First
CREED, April Eurobodalla Ratepayers Action
DIXON, Paul -
DOUGLAS, Will The Greens
EVANS, Joanne -
FIELD, Dan -
GIATRAS, Harry -
GIFFORD, Ron Eurobodalla Ratepayers Action
GOLDMAN, Alison -
HACKETT, Emily -
HARDING, Gabi The Greens
HARRISON, Tubby Eurobodalla Ratepayers Action
HASTIE, Brian -
INNES, Liz Eurobodalla Ratepayers Action
KARNY-WINTERS, Orit -
KOWAL, Chris -
LAW, Robbie Eurobodalla Ratepayers Action
LESLIGHT, Milton Eurobodalla Ratepayers Action
LONG, Tashe -
MANNING, Maureen -
MILLIKEN, Catherine -
MORTON, Alan -
PERGER, Margaret The Greens
POLLOCK, Rob Eurobodalla First
POTTS, Joe Eurobodalla Ratepayers Action
REID, Janette -
ROGERS, Damien -
RYAN, Peter Eurobodalla Ratepayers Action
REPORT ON THE 2012 LOCAL GOVERNMENT ELECTIONS
Eurobodalla Shire Council
305
SCHWARZ, Peter Eurobodalla Ratepayers Action
SCOBIE, Graham -
SHEPHEARD, Jenny Eurobodalla Ratepayers Action
SIMON, Les -
SMITH, Gary Eurobodalla Ratepayers Action
THOMSON, Fergus -
ULRICHSEN, Ange -
VARDON, Chris Eurobodalla First
WELLARD, Michelle The Greens
WILKINS, Peter Eurobodalla Ratepayers Action
WILLIAMS, Anthony -
ZAMMIT, Tyron -
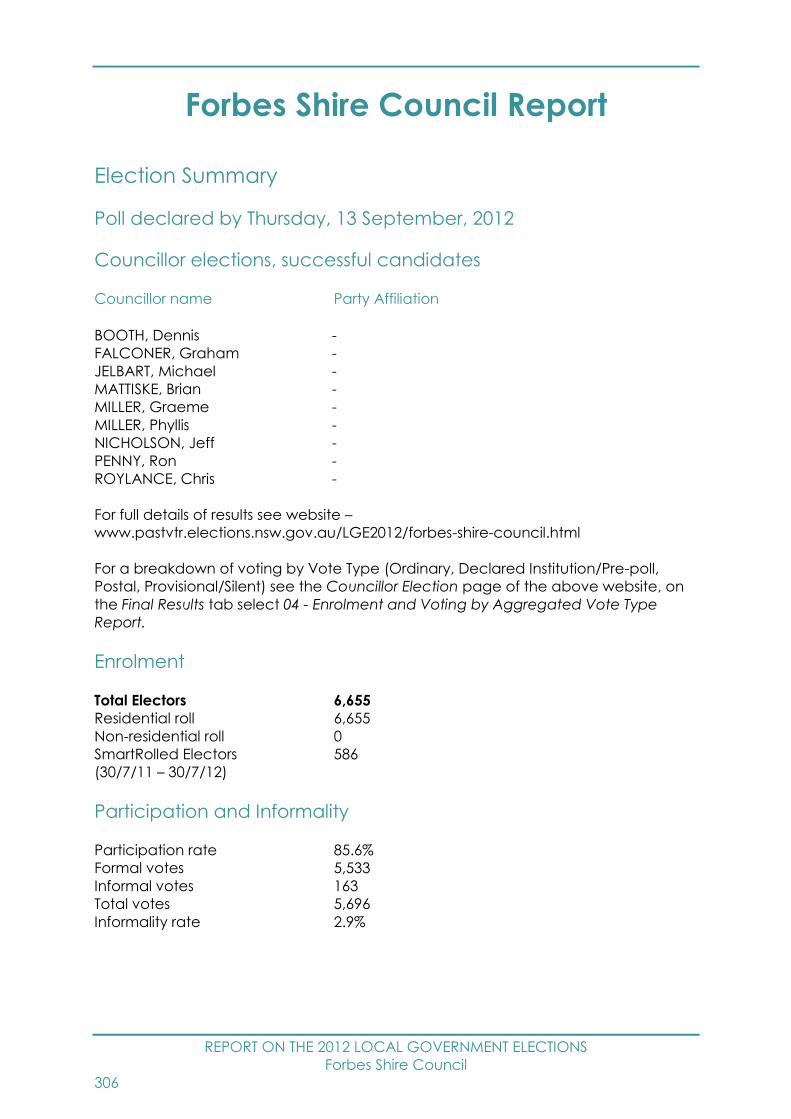
REPORT ON THE 2012 LOCAL GOVERNMENT ELECTIONS
Forbes Shire Council
306
Forbes Shire Council Report
Election Summary
Poll declared by Thursday, 13 September, 2012
Councillor elections, successful candidates
Councillor name Party Affiliation
BOOTH, Dennis -
FALCONER, Graham -
JELBART, Michael -
MATTISKE, Brian -
MILLER, Graeme -
MILLER, Phyllis -
NICHOLSON, Jeff -
PENNY, Ron -
ROYLANCE, Chris -
For full details of results see website –
www.pastvtr.elections.nsw.gov.au/LGE2012/forbes-shire-council.html
For a breakdown of voting by Vote Type (Ordinary, Declared Institution/Pre-poll,
Postal, Provisional/Silent) see the Councillor Election page of the above website, on
the Final Results tab select 04 - Enrolment and Voting by Aggregated Vote Type
Report.
Enrolment
Total Electors 6,655
Residential roll 6,655
Non-residential roll 0
SmartRolled Electors 586
(30/7/11 – 30/7/12)
Participation and Informality
Participation rate 85.6%
Formal votes 5,533
Informal votes 163
Total votes 5,696
Informality rate 2.9%

REPORT ON THE 2012 LOCAL GOVERNMENT ELECTIONS
Forbes Shire Council
307
Failure to Vote
Penalty Notices Issued 710
Rate of Failure to Vote40 10.7%
Election Costs
Total Cost of the Forbes Shire Council 2012 Election
$53,408.00
Cost per elector
$8.04
Forbes Shire Council Statutory Advertising Campaign Expenditure
Nominations $475.64
Candidates and polling places $1,008.00
Uncontested elections $0.00
Results $182.00
TOTAL $1,665.64
Election Services
Elector Enquiry Centre
The Elector Enquiry Centre answered 64 calls from postcodes within Forbes Shire
Council area.
NSWEC Website
There were 1,263 unique visitors to Forbes Shire Council election web page.
Braille Ballot Papers
No braille ballot papers were requested or printed.
Returning Officer
Geoffrey Lark
40 Percentage of Penalty Notices Issued to Enrolment (as shown on Authorised Roll)
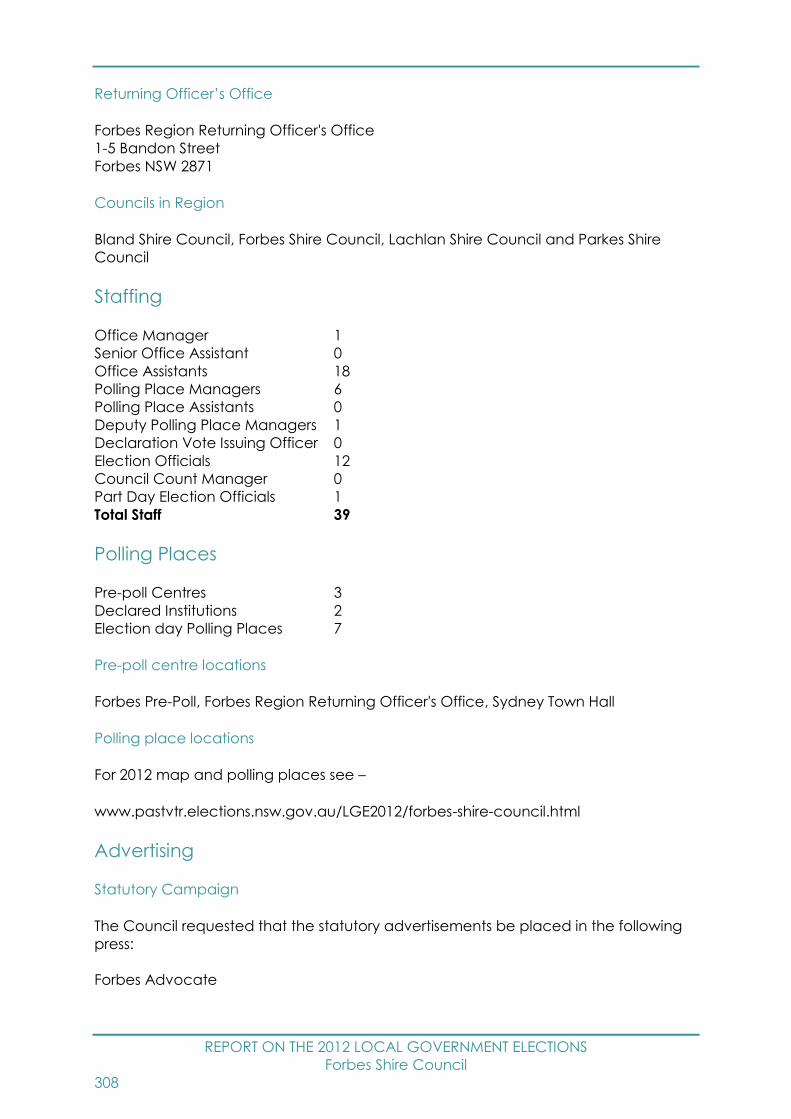
REPORT ON THE 2012 LOCAL GOVERNMENT ELECTIONS
Forbes Shire Council
308
Returning Officer’s Office
Forbes Region Returning Officer's Office
1-5 Bandon Street
Forbes NSW 2871
Councils in Region
Bland Shire Council, Forbes Shire Council, Lachlan Shire Council and Parkes Shire
Council
Staffing
Office Manager 1
Senior Office Assistant 0
Office Assistants 18
Polling Place Managers 6
Polling Place Assistants 0
Deputy Polling Place Managers 1
Declaration Vote Issuing Officer 0
Election Officials 12
Council Count Manager 0
Part Day Election Officials 1
Total Staff 39
Polling Places
Pre-poll Centres 3
Declared Institutions 2
Election day Polling Places 7
Pre-poll centre locations
Forbes Pre-Poll, Forbes Region Returning Officer's Office, Sydney Town Hall
Polling place locations
For 2012 map and polling places see –
www.pastvtr.elections.nsw.gov.au/LGE2012/forbes-shire-council.html
Advertising
Statutory Campaign
The Council requested that the statutory advertisements be placed in the following
press:
Forbes Advocate
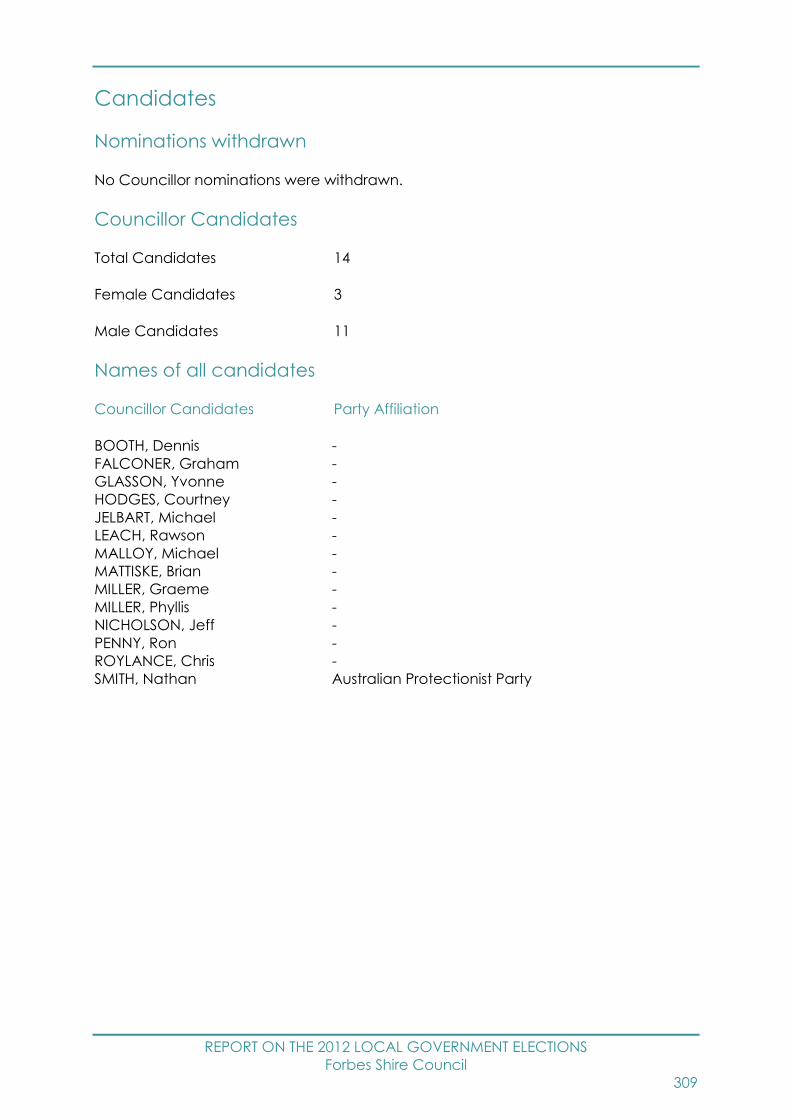
REPORT ON THE 2012 LOCAL GOVERNMENT ELECTIONS
Forbes Shire Council
309
Candidates
Nominations withdrawn
No Councillor nominations were withdrawn.
Councillor Candidates
Total Candidates 14
Female Candidates 3
Male Candidates 11
Names of all candidates
Councillor Candidates Party Affiliation
BOOTH, Dennis -
FALCONER, Graham -
GLASSON, Yvonne -
HODGES, Courtney -
JELBART, Michael -
LEACH, Rawson -
MALLOY, Michael -
MATTISKE, Brian -
MILLER, Graeme -
MILLER, Phyllis -
NICHOLSON, Jeff -
PENNY, Ron -
ROYLANCE, Chris -
SMITH, Nathan Australian Protectionist Party

REPORT ON THE 2012 LOCAL GOVERNMENT ELECTIONS
Gilgandra Shire Council
310
Gilgandra Shire Council Report
Election Summary
Poll declared by Wednesday, 12 September, 2012
Councillor elections, successful candidates
Councillor name Party Affiliation
BAKER, Susan -
BATTEN, Doug -
CHAPMAN, Chris -
COLLISON, John -
HORAN, Stephen -
JOHNSON, Gina -
McGRATH, Laurie -
PEART, Gregory -
WALKER, Ash -
For full details of results see website –
www.pastvtr.elections.nsw.gov.au/LGE2012/gilgandra-shire-council.html
For a breakdown of voting by Vote Type (Ordinary, Declared Institution/Pre-poll,
Postal, Provisional/Silent) see the Councillor Election page of the above website, on
the Final Results tab select 04 - Enrolment and Voting by Aggregated Vote Type
Report.
Enrolment
Total Electors 3,188
Residential roll 3,188
Non-residential roll 0
SmartRolled Electors 213
(30/7/11 – 30/7/12)
Participation and Informality
Participation rate 85.6%
Formal votes 2,625
Informal votes 105
Total votes 2,730
Informality rate 3.8%

REPORT ON THE 2012 LOCAL GOVERNMENT ELECTIONS
Gilgandra Shire Council
311
Failure to Vote
Penalty Notices Issued 352
Rate of Failure to Vote41 11.1%
Election Costs
Total Cost of the Gilgandra Shire Council 2012 Election
$27,571.00
Cost per elector
$8.66
Gilgandra Shire Council Statutory Advertising Campaign Expenditure
Nominations $190.74
Candidates and polling places $302.94
Uncontested elections $0.00
Results $151.47
TOTAL $645.15
Election Services
Elector Enquiry Centre
The Elector Enquiry Centre answered 50 calls from postcodes within Gilgandra Shire
Council area.
NSWEC Website
There were 526 unique visitors to Gilgandra Shire Council election web page.
Braille Ballot Papers
No braille ballot papers were requested or printed.
Returning Officer
Helen Murray
41 Percentage of Penalty Notices Issued to Enrolment (as shown on Authorised Roll)
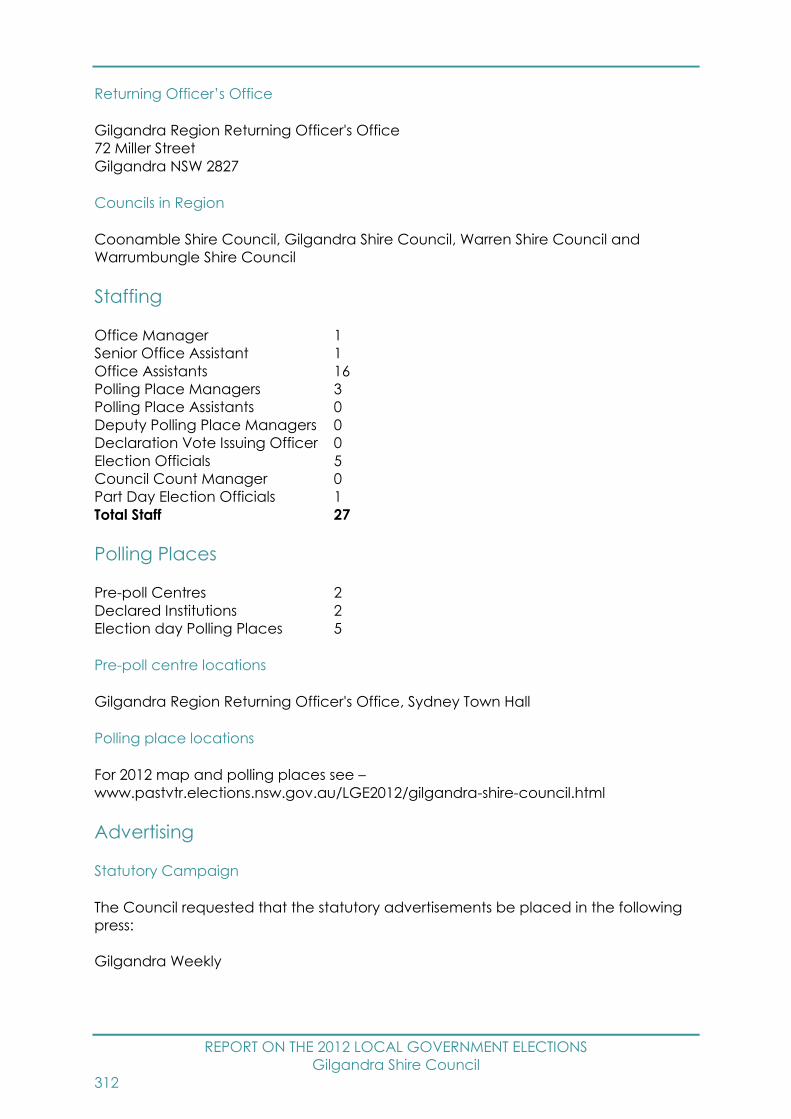
REPORT ON THE 2012 LOCAL GOVERNMENT ELECTIONS
Gilgandra Shire Council
312
Returning Officer’s Office
Gilgandra Region Returning Officer's Office
72 Miller Street
Gilgandra NSW 2827
Councils in Region
Coonamble Shire Council, Gilgandra Shire Council, Warren Shire Council and
Warrumbungle Shire Council
Staffing
Office Manager 1
Senior Office Assistant 1
Office Assistants 16
Polling Place Managers 3
Polling Place Assistants 0
Deputy Polling Place Managers 0
Declaration Vote Issuing Officer 0
Election Officials 5
Council Count Manager 0
Part Day Election Officials 1
Total Staff 27
Polling Places
Pre-poll Centres 2
Declared Institutions 2
Election day Polling Places 5
Pre-poll centre locations
Gilgandra Region Returning Officer's Office, Sydney Town Hall
Polling place locations
For 2012 map and polling places see –
www.pastvtr.elections.nsw.gov.au/LGE2012/gilgandra-shire-council.html
Advertising
Statutory Campaign
The Council requested that the statutory advertisements be placed in the following
press:
Gilgandra Weekly

REPORT ON THE 2012 LOCAL GOVERNMENT ELECTIONS
Gilgandra Shire Council
313
Candidates
Nominations withdrawn
No Councillor nominations were withdrawn.
Councillor Candidates
Total Candidates 13
Female Candidates 4
Male Candidates 9
Names of all candidates
Councillor Candidates Party Affiliation
BAKER, Susan -
BATTEN, Doug -
BUNTER, Amber -
CHAPMAN, Chris -
CLOUTEN, Doug -
COLLISON, John -
GORDON, Daniel -
HOLLAND, Pamela -
HORAN, Stephen -
JOHNSON, Gina -
McGRATH, Laurie -
PEART, Gregory -
WALKER, Ash -

REPORT ON THE 2012 LOCAL GOVERNMENT ELECTIONS
Glen Innes Severn Council
314
Glen Innes Severn Council Report
Election Summary
Poll declared by Thursday, 13 September, 2012
Councillor elections, successful candidates
Councillor name Party Affiliation
GRAHAM, James -
NEWMAN, Dianne -
PARSONS, Andrew -
PRICE, Colin -
QUINN, Graeme -
SCHERF, Michael -
SCHUMACHER, Malcolm -
For full details of results see website –
www.pastvtr.elections.nsw.gov.au/LGE2012/glen-innes-severn-council.html
For a breakdown of voting by Vote Type (Ordinary, Declared Institution/Pre-poll,
Postal, Provisional/Silent) see the Councillor Election page of the above website, on
the Final Results tab select 04 - Enrolment and Voting by Aggregated Vote Type
Report.
Enrolment
Total Electors 6,533
Residential roll 6,530
Non-residential roll 3
SmartRolled Electors 420
(30/7/11 – 30/7/12)
Participation and Informality
Participation rate 82.8%
Formal votes 5,158
Informal votes 252
Total votes 5,410
Informality rate 4.7%
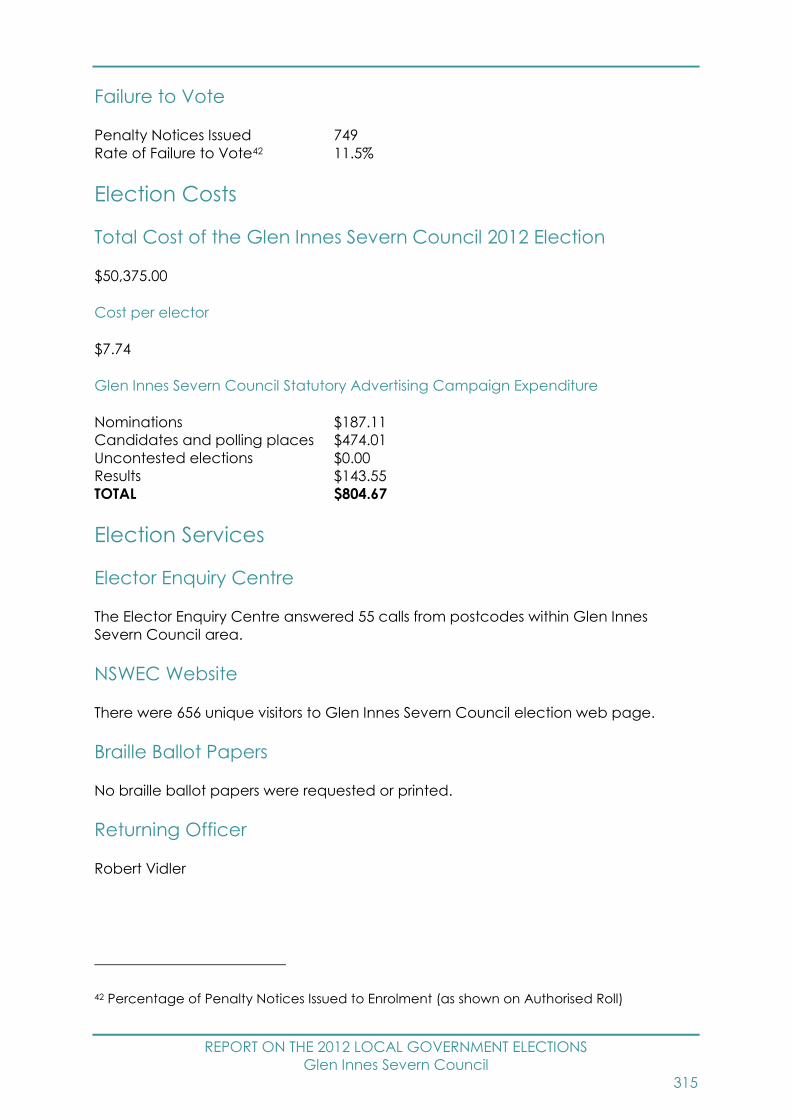
REPORT ON THE 2012 LOCAL GOVERNMENT ELECTIONS
Glen Innes Severn Council
315
Failure to Vote
Penalty Notices Issued 749
Rate of Failure to Vote42 11.5%
Election Costs
Total Cost of the Glen Innes Severn Council 2012 Election
$50,375.00
Cost per elector
$7.74
Glen Innes Severn Council Statutory Advertising Campaign Expenditure
Nominations $187.11
Candidates and polling places $474.01
Uncontested elections $0.00
Results $143.55
TOTAL $804.67
Election Services
Elector Enquiry Centre
The Elector Enquiry Centre answered 55 calls from postcodes within Glen Innes
Severn Council area.
NSWEC Website
There were 656 unique visitors to Glen Innes Severn Council election web page.
Braille Ballot Papers
No braille ballot papers were requested or printed.
Returning Officer
Robert Vidler
42 Percentage of Penalty Notices Issued to Enrolment (as shown on Authorised Roll)

REPORT ON THE 2012 LOCAL GOVERNMENT ELECTIONS
Glen Innes Severn Council
316
Returning Officer’s Office
Glen Innes Region Returning Officer's Office
Glen Innes Town Hall
265 Grey Street
Glen Innes NSW 2370
Councils in Region
Glen Innes Severn Council, Inverell Shire Council and Tenterfield Shire Council
Staffing
Office Manager 0
Senior Office Assistant 1
Office Assistants 17
Polling Place Managers 7
Polling Place Assistants 0
Deputy Polling Place Managers 0
Declaration Vote Issuing Officer 1
Election Officials 12
Council Count Manager 0
Part Day Election Officials 2
Total Staff 40
Polling Places
Pre-poll Centres 2
Declared Institutions 2
Election day Polling Places 8
Pre-poll centre locations
Glen Innes Region Returning Officer's Office, Sydney Town Hall
Polling place locations
For 2012 map and polling places see –
www.pastvtr.elections.nsw.gov.au/LGE2012/glen-innes-severn-council.html
Advertising
Statutory Campaign
The Council requested that the statutory advertisements be placed in the following
press:
Glen Innes Examiner

REPORT ON THE 2012 LOCAL GOVERNMENT ELECTIONS
Glen Innes Severn Council
317
Candidates
Nominations withdrawn
No Councillor nominations were withdrawn.
Councillor Candidates
Total Candidates 11
Female Candidates 3
Male Candidates 8
Names of all candidates
Councillor Candidates Party Affiliation
CURTIS, Rosemary -
GRAHAM, James -
LOWIEN, Jeff -
NEWMAN, Dianne -
PARSONS, Andrew -
PRICE, Colin -
QUINN, Graeme -
SCHERF, Michael -
SCHUMACHER, Malcolm -
SERVICE, David -
SPEED, Janelle -
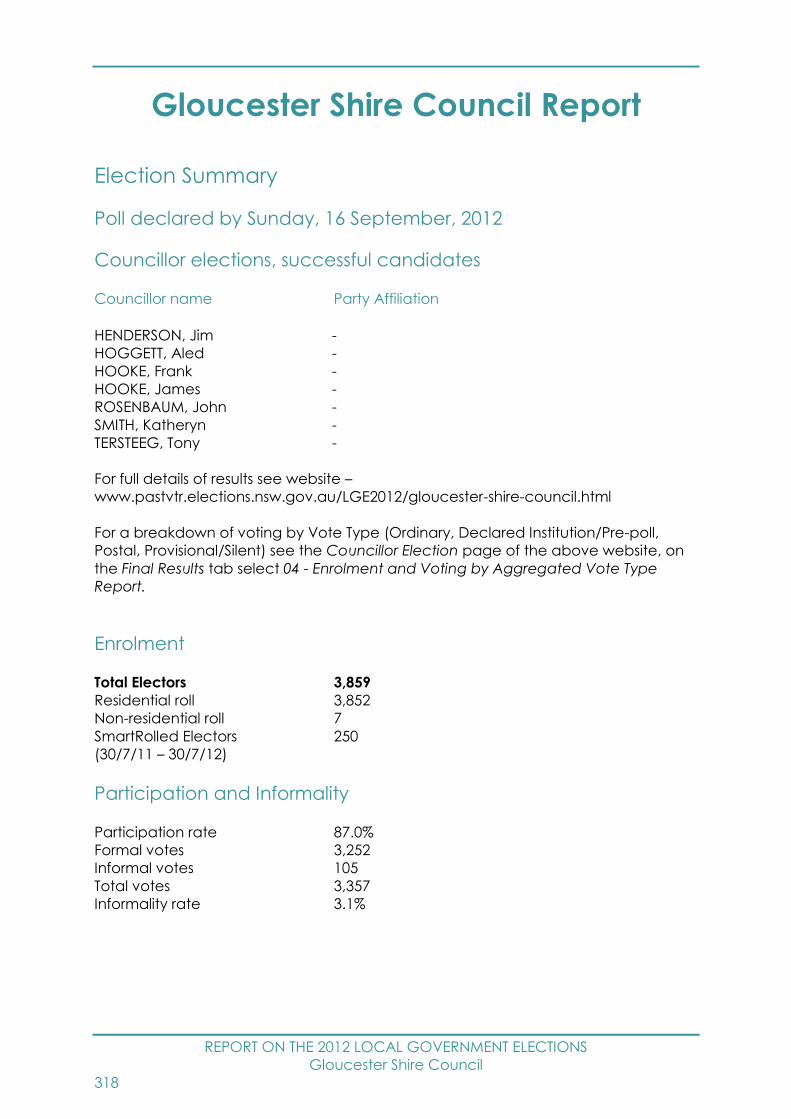
REPORT ON THE 2012 LOCAL GOVERNMENT ELECTIONS
Gloucester Shire Council
318
Gloucester Shire Council Report
Election Summary
Poll declared by Sunday, 16 September, 2012
Councillor elections, successful candidates
Councillor name Party Affiliation
HENDERSON, Jim -
HOGGETT, Aled -
HOOKE, Frank -
HOOKE, James -
ROSENBAUM, John -
SMITH, Katheryn -
TERSTEEG, Tony -
For full details of results see website –
www.pastvtr.elections.nsw.gov.au/LGE2012/gloucester-shire-council.html
For a breakdown of voting by Vote Type (Ordinary, Declared Institution/Pre-poll,
Postal, Provisional/Silent) see the Councillor Election page of the above website, on
the Final Results tab select 04 - Enrolment and Voting by Aggregated Vote Type
Report.
Enrolment
Total Electors 3,859
Residential roll 3,852
Non-residential roll 7
SmartRolled Electors 250
(30/7/11 – 30/7/12)
Participation and Informality
Participation rate 87.0%
Formal votes 3,252
Informal votes 105
Total votes 3,357
Informality rate 3.1%

REPORT ON THE 2012 LOCAL GOVERNMENT ELECTIONS
Gloucester Shire Council
319
Failure to Vote
Penalty Notices Issued 367
Rate of Failure to Vote43 9.5%
Election Costs
Total Cost of the Gloucester Shire Council 2012 Election
$25,011.00
Cost per elector
$6.49
Gloucester Shire Council Statutory Advertising Campaign Expenditure
Nominations $344.81
Candidates and polling places $623.26
Uncontested elections $0.00
Results $107.11
TOTAL $1,075.18
Election Services
Elector Enquiry Centre
The Elector Enquiry Centre answered 66 calls from postcodes within Gloucester Shire
Council area.
NSWEC Website
There were 559 unique visitors to Gloucester Shire Council election web page.
Braille Ballot Papers
No braille ballot papers were requested or printed.
Returning Officer
Leanne Maunder
43 Percentage of Penalty Notices Issued to Enrolment (as shown on Authorised Roll)
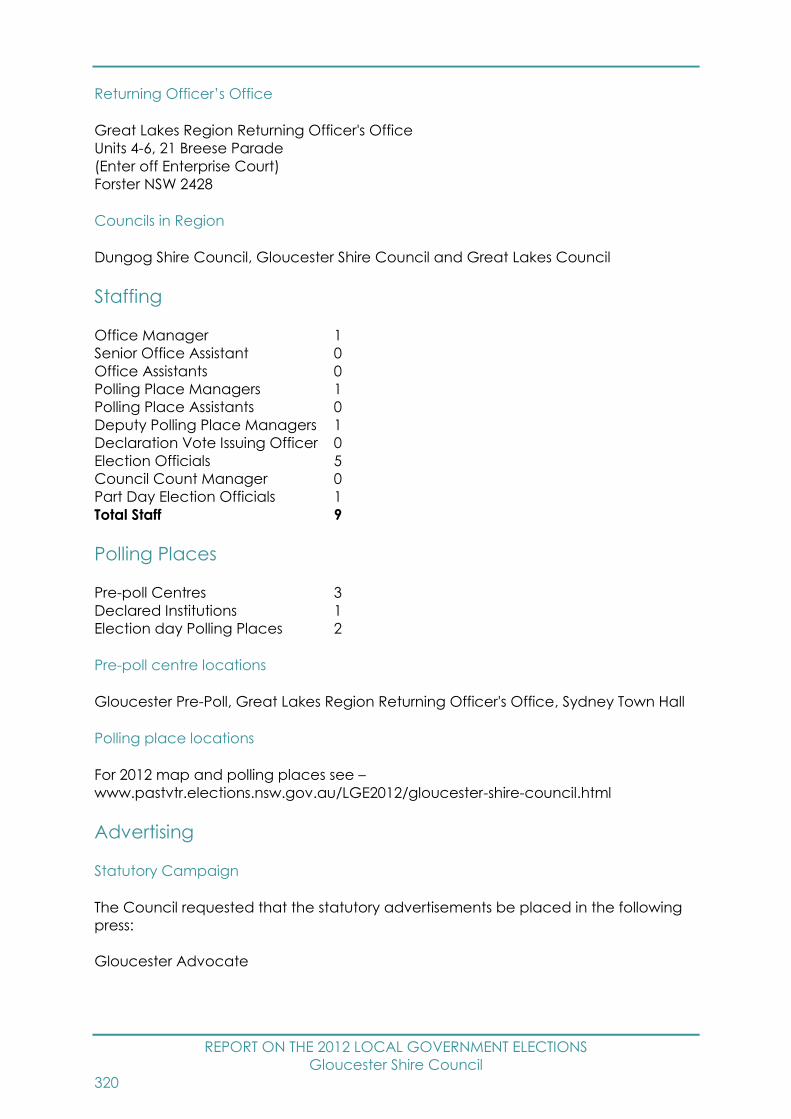
REPORT ON THE 2012 LOCAL GOVERNMENT ELECTIONS
Gloucester Shire Council
320
Returning Officer’s Office
Great Lakes Region Returning Officer's Office
Units 4-6, 21 Breese Parade
(Enter off Enterprise Court)
Forster NSW 2428
Councils in Region
Dungog Shire Council, Gloucester Shire Council and Great Lakes Council
Staffing
Office Manager 1
Senior Office Assistant 0
Office Assistants 0
Polling Place Managers 1
Polling Place Assistants 0
Deputy Polling Place Managers 1
Declaration Vote Issuing Officer 0
Election Officials 5
Council Count Manager 0
Part Day Election Officials 1
Total Staff 9
Polling Places
Pre-poll Centres 3
Declared Institutions 1
Election day Polling Places 2
Pre-poll centre locations
Gloucester Pre-Poll, Great Lakes Region Returning Officer's Office, Sydney Town Hall
Polling place locations
For 2012 map and polling places see –
www.pastvtr.elections.nsw.gov.au/LGE2012/gloucester-shire-council.html
Advertising
Statutory Campaign
The Council requested that the statutory advertisements be placed in the following
press:
Gloucester Advocate
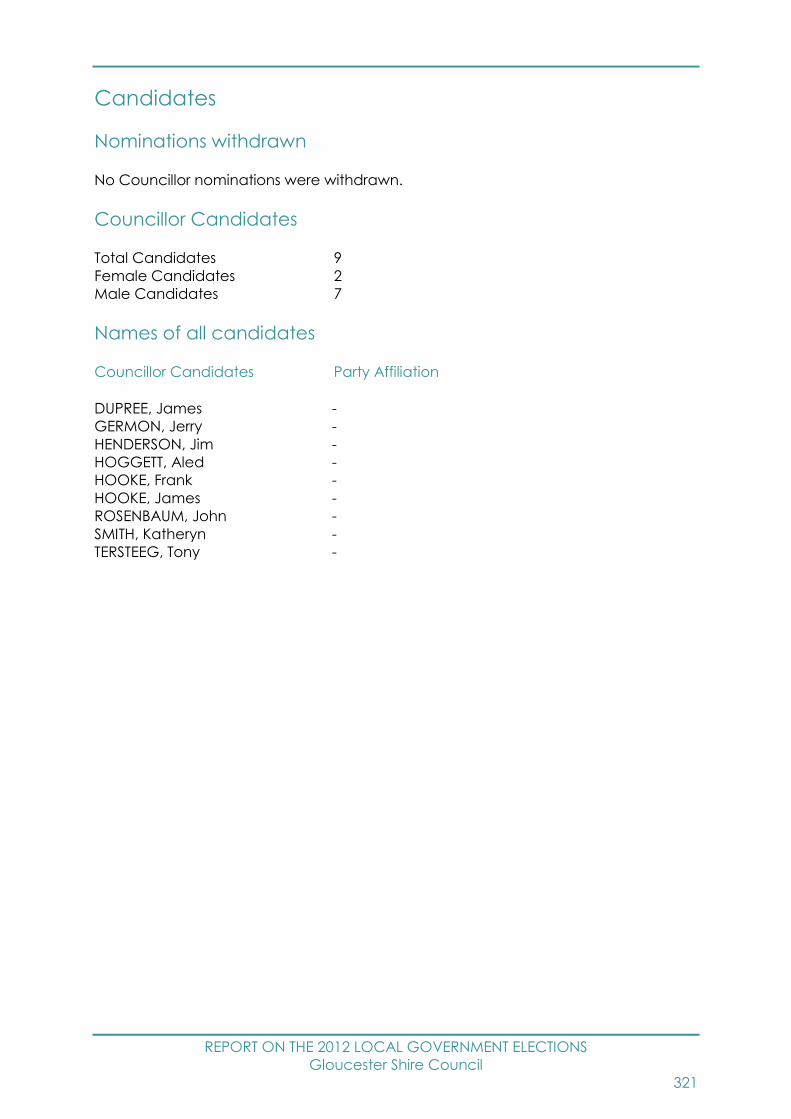
REPORT ON THE 2012 LOCAL GOVERNMENT ELECTIONS
Gloucester Shire Council
321
Candidates
Nominations withdrawn
No Councillor nominations were withdrawn.
Councillor Candidates
Total Candidates 9
Female Candidates 2
Male Candidates 7
Names of all candidates
Councillor Candidates Party Affiliation
DUPREE, James -
GERMON, Jerry -
HENDERSON, Jim -
HOGGETT, Aled -
HOOKE, Frank -
HOOKE, James -
ROSENBAUM, John -
SMITH, Katheryn -
TERSTEEG, Tony -

REPORT ON THE 2012 LOCAL GOVERNMENT ELECTIONS
Gosford City Council
322
Gosford City Council Report
Election Summary
Poll declared by Monday, 17 September, 2012
Councillor elections, successful candidates
Councillor name Party Affiliation
BOCKING, Deanna Liberal Party of Australia New South Wales Division
BOWLES, Gabby -
BURKE, Chris Liberal Party of Australia New South Wales Division
DOYLE, Craig -
MACFADYEN, Jim Australian Labor Party (NSW Branch)
MORRIS, Hillary The Greens
McKINNA, Lawrie -
SCOTT, Vicki Australian Labor Party (NSW Branch)
STRICKSON, Jeff Liberal Party of Australia New South Wales Division
WARD, Bob Liberal Party of Australia New South Wales Division
For full details of results see website –
www.pastvtr.elections.nsw.gov.au/LGE2012/gosford-city-council.html
For a breakdown of voting by Vote Type (Ordinary, Declared Institution/Pre-poll,
Postal, Provisional/Silent) see the Councillor Election page of the above website, on
the Final Results tab select 04 - Enrolment and Voting by Aggregated Vote Type
Report.
Enrolment
Total Electors 119,887
Residential roll 119,884
Non-residential roll 3
SmartRolled Electors 12,786
(30/7/11 – 30/7/12)
Participation and Informality
Participation rate 81.5%
Formal votes 90,610
Informal votes 7,094
Total votes 97,704
Informality rate 7.3%

REPORT ON THE 2012 LOCAL GOVERNMENT ELECTIONS
Gosford City Council
323
Failure to Vote
Penalty Notices Issued 15,960
Rate of Failure to Vote44 13.3%
Election Costs
Total Cost of the Gosford City Council 2012 Election
$671,836.00
Cost per elector
$5.61
Gosford City Council Statutory Advertising Campaign Expenditure
Nominations $1,093.66
Candidates and polling places $2,421.98
Uncontested elections $0.00
Results $1,093.66
TOTAL $4,609.30
Election Services
Elector Enquiry Centre
The Elector Enquiry Centre answered 2,504 calls from postcodes within Gosford City
Council area.
NSWEC Website
There were 7,992 unique visitors to Gosford City Council election web page.
Braille Ballot Papers
One braille ballot papers were requested or printed.
Returning Officer
Peter Smith
44 Percentage of Penalty Notices Issued to Enrolment (as shown on Authorised Roll)
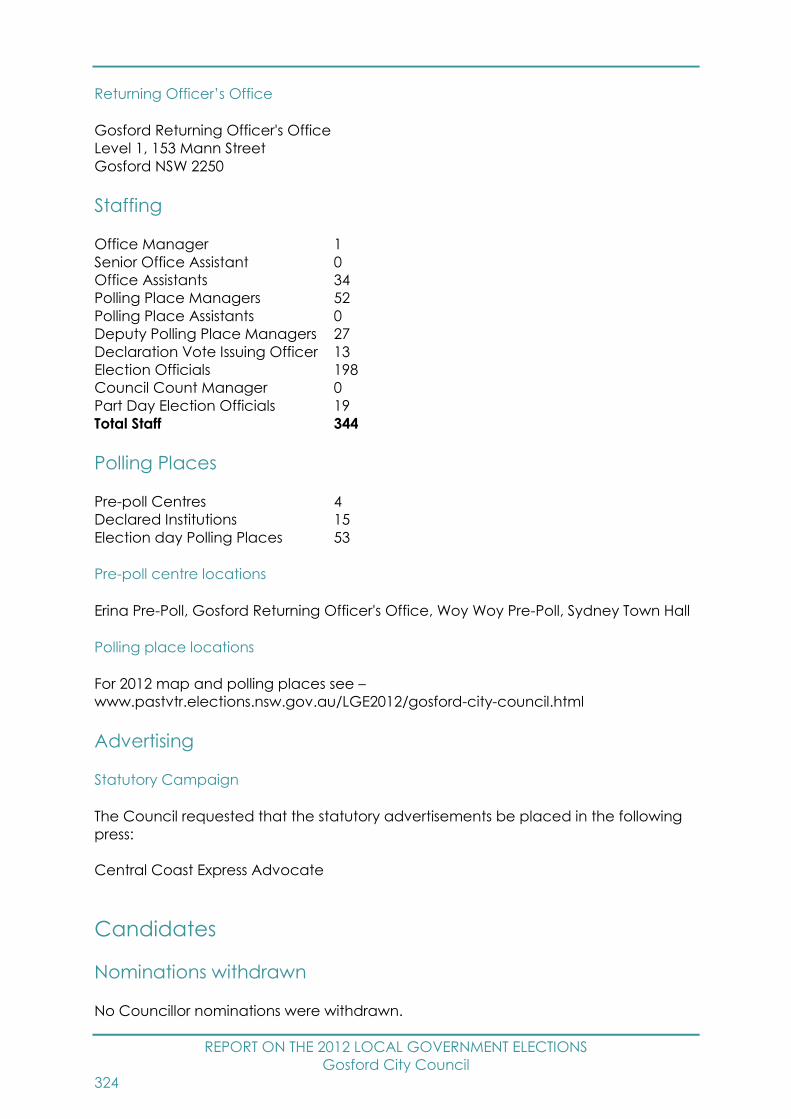
REPORT ON THE 2012 LOCAL GOVERNMENT ELECTIONS
Gosford City Council
324
Returning Officer’s Office
Gosford Returning Officer's Office
Level 1, 153 Mann Street
Gosford NSW 2250
Staffing
Office Manager 1
Senior Office Assistant 0
Office Assistants 34
Polling Place Managers 52
Polling Place Assistants 0
Deputy Polling Place Managers 27
Declaration Vote Issuing Officer 13
Election Officials 198
Council Count Manager 0
Part Day Election Officials 19
Total Staff 344
Polling Places
Pre-poll Centres 4
Declared Institutions 15
Election day Polling Places 53
Pre-poll centre locations
Erina Pre-Poll, Gosford Returning Officer's Office, Woy Woy Pre-Poll, Sydney Town Hall
Polling place locations
For 2012 map and polling places see –
www.pastvtr.elections.nsw.gov.au/LGE2012/gosford-city-council.html
Advertising
Statutory Campaign
The Council requested that the statutory advertisements be placed in the following
press:
Central Coast Express Advocate
Candidates
Nominations withdrawn
No Councillor nominations were withdrawn.
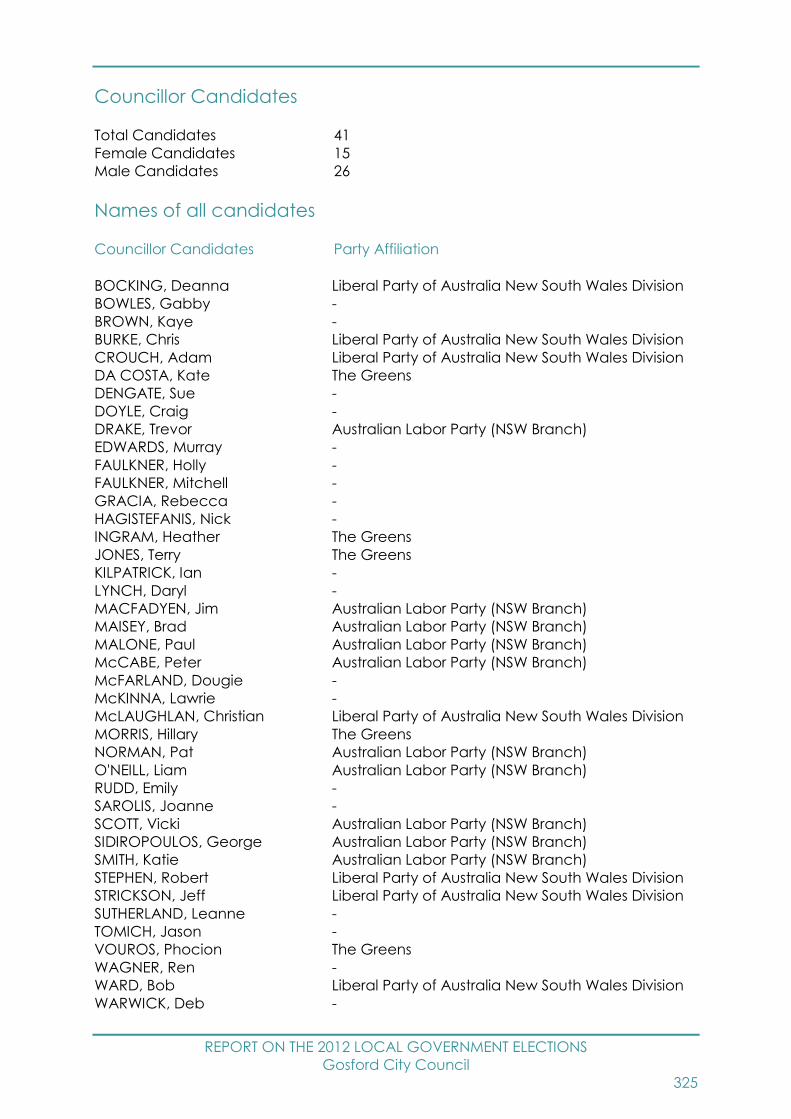
REPORT ON THE 2012 LOCAL GOVERNMENT ELECTIONS
Gosford City Council
325
Councillor Candidates
Total Candidates 41
Female Candidates 15
Male Candidates 26
Names of all candidates
Councillor Candidates Party Affiliation
BOCKING, Deanna Liberal Party of Australia New South Wales Division
BOWLES, Gabby -
BROWN, Kaye -
BURKE, Chris Liberal Party of Australia New South Wales Division
CROUCH, Adam Liberal Party of Australia New South Wales Division
DA COSTA, Kate The Greens
DENGATE, Sue -
DOYLE, Craig -
DRAKE, Trevor Australian Labor Party (NSW Branch)
EDWARDS, Murray -
FAULKNER, Holly -
FAULKNER, Mitchell -
GRACIA, Rebecca -
HAGISTEFANIS, Nick -
INGRAM, Heather The Greens
JONES, Terry The Greens
KILPATRICK, Ian -
LYNCH, Daryl -
MACFADYEN, Jim Australian Labor Party (NSW Branch)
MAISEY, Brad Australian Labor Party (NSW Branch)
MALONE, Paul Australian Labor Party (NSW Branch)
McCABE, Peter Australian Labor Party (NSW Branch)
McFARLAND, Dougie -
McKINNA, Lawrie -
McLAUGHLAN, Christian Liberal Party of Australia New South Wales Division
MORRIS, Hillary The Greens
NORMAN, Pat Australian Labor Party (NSW Branch)
O'NEILL, Liam Australian Labor Party (NSW Branch)
RUDD, Emily -
SAROLIS, Joanne -
SCOTT, Vicki Australian Labor Party (NSW Branch)
SIDIROPOULOS, George Australian Labor Party (NSW Branch)
SMITH, Katie Australian Labor Party (NSW Branch)
STEPHEN, Robert Liberal Party of Australia New South Wales Division
STRICKSON, Jeff Liberal Party of Australia New South Wales Division
SUTHERLAND, Leanne -
TOMICH, Jason -
VOUROS, Phocion The Greens
WAGNER, Ren -
WARD, Bob Liberal Party of Australia New South Wales Division
WARWICK, Deb -
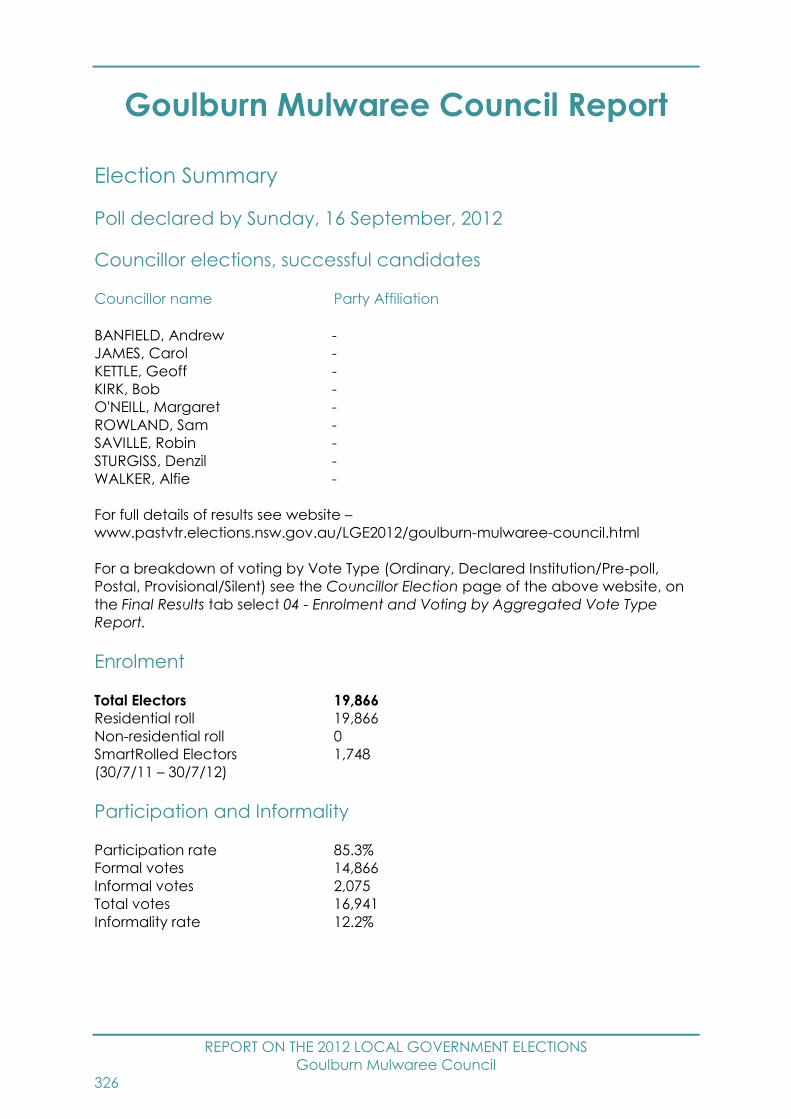
REPORT ON THE 2012 LOCAL GOVERNMENT ELECTIONS
Goulburn Mulwaree Council
326
Goulburn Mulwaree Council Report
Election Summary
Poll declared by Sunday, 16 September, 2012
Councillor elections, successful candidates
Councillor name Party Affiliation
BANFIELD, Andrew -
JAMES, Carol -
KETTLE, Geoff -
KIRK, Bob -
O'NEILL, Margaret -
ROWLAND, Sam -
SAVILLE, Robin -
STURGISS, Denzil -
WALKER, Alfie -
For full details of results see website –
www.pastvtr.elections.nsw.gov.au/LGE2012/goulburn-mulwaree-council.html
For a breakdown of voting by Vote Type (Ordinary, Declared Institution/Pre-poll,
Postal, Provisional/Silent) see the Councillor Election page of the above website, on
the Final Results tab select 04 - Enrolment and Voting by Aggregated Vote Type
Report.
Enrolment
Total Electors 19,866
Residential roll 19,866
Non-residential roll 0
SmartRolled Electors 1,748
(30/7/11 – 30/7/12)
Participation and Informality
Participation rate 85.3%
Formal votes 14,866
Informal votes 2,075
Total votes 16,941
Informality rate 12.2%
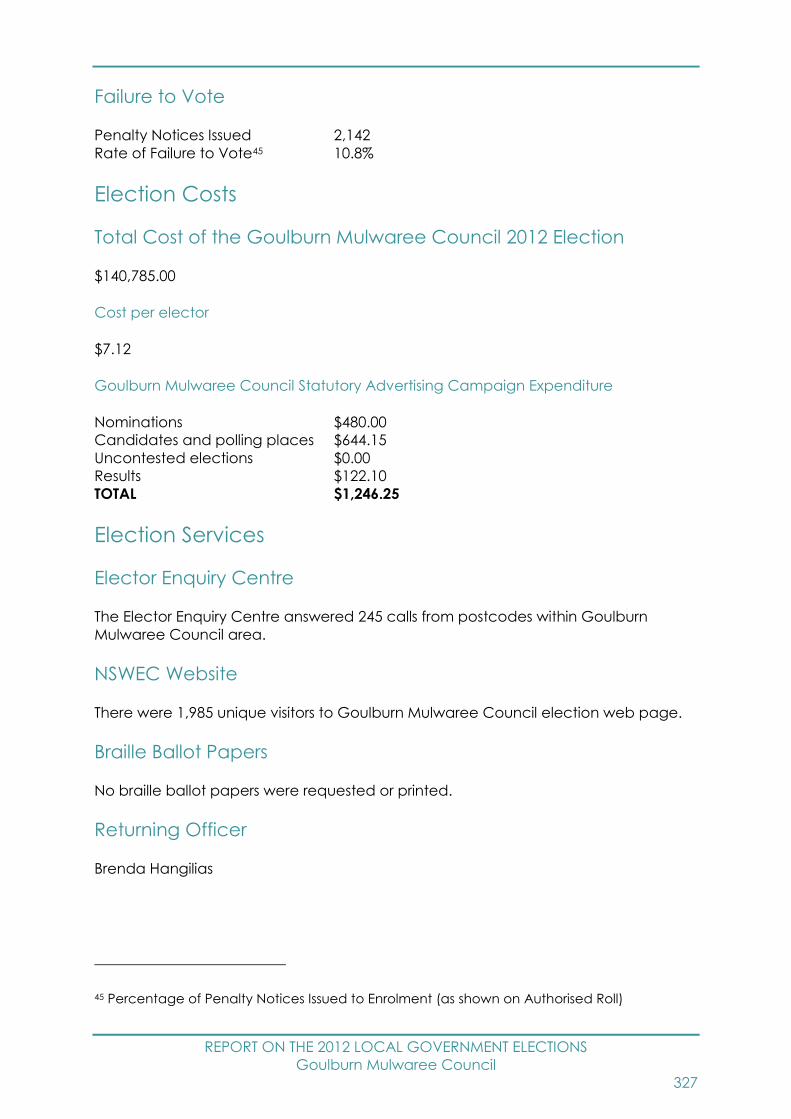
REPORT ON THE 2012 LOCAL GOVERNMENT ELECTIONS
Goulburn Mulwaree Council
327
Failure to Vote
Penalty Notices Issued 2,142
Rate of Failure to Vote45 10.8%
Election Costs
Total Cost of the Goulburn Mulwaree Council 2012 Election
$140,785.00
Cost per elector
$7.12
Goulburn Mulwaree Council Statutory Advertising Campaign Expenditure
Nominations $480.00
Candidates and polling places $644.15
Uncontested elections $0.00
Results $122.10
TOTAL $1,246.25
Election Services
Elector Enquiry Centre
The Elector Enquiry Centre answered 245 calls from postcodes within Goulburn
Mulwaree Council area.
NSWEC Website
There were 1,985 unique visitors to Goulburn Mulwaree Council election web page.
Braille Ballot Papers
No braille ballot papers were requested or printed.
Returning Officer
Brenda Hangilias
45 Percentage of Penalty Notices Issued to Enrolment (as shown on Authorised Roll)

REPORT ON THE 2012 LOCAL GOVERNMENT ELECTIONS
Goulburn Mulwaree Council
328
Returning Officer’s Office
Goulburn Region Returning Officer's Office
104 Clinton Street
Goulburn NSW 2580
Councils in Region
Goulburn Mulwaree Council, Upper Lachlan Shire Council and Yass Valley Council
Staffing
Office Manager 1
Senior Office Assistant 0
Office Assistants 28
Polling Place Managers 11
Polling Place Assistants 0
Deputy Polling Place Managers 3
Declaration Vote Issuing Officer 1
Election Officials 32
Council Count Manager 0
Part Day Election Officials 2
Total Staff 78
Polling Places
Pre-poll Centres 2
Declared Institutions 5
Election day Polling Places 12
Pre-poll centre locations
Goulburn Region Returning Officer's Office, Sydney Town Hall
Polling place locations
For 2012 map and polling places see –
www.pastvtr.elections.nsw.gov.au/LGE2012/goulburn-mulwaree-council.html
Advertising
Statutory Campaign
The Council requested that the statutory advertisements be placed in the following
press:
Goulburn Post

REPORT ON THE 2012 LOCAL GOVERNMENT ELECTIONS
Goulburn Mulwaree Council
329
Candidates
Nominations withdrawn
No Councillor nominations were withdrawn.
Councillor Candidates
Total Candidates 18
Female Candidates 3
Male Candidates 15
Names of all candidates
Councillor Candidates Party Affiliation
BANFIELD, Andrew -
DILLON, Nina -
JAMES, Carol -
KETTLE, Geoff -
KIRK, Bob -
LUCAS, Roger -
McALISTER, Frank -
O'NEILL, Margaret -
ORCHARD, Richard -
PENNING, Neil -
PETERSON, Geoff -
ROWLAND, Sam -
SAVILLE, Robin -
SHEPHERD, Jason -
STRASSER, Les -
STURGISS, Denzil -
THISTLETON, Andrew -
WALKER, Alfie -

REPORT ON THE 2012 LOCAL GOVERNMENT ELECTIONS
Great Lakes Council
330
Great Lakes Council Report
Election Summary
Poll declared by Sunday, 16 September, 2012
Councillor elections, successful candidates
Councillor name Party Affiliation
GILL, Linda -
HUTCHINSON, Karen -
MORWITCH, Jim -
McCASKIE, Carol -
McWILLIAMS, Jan -
ROBERTS, Len -
SUMMERS, Tony -
VAUGHAN, Leigh -
WEATE, John Australian Labor Party (NSW Branch)
For full details of results see website –
www.pastvtr.elections.nsw.gov.au/LGE2012/great-lakes-council.html
For a breakdown of voting by Vote Type (Ordinary, Declared Institution/Pre-poll,
Postal, Provisional/Silent) see the Councillor Election page of the above website, on
the Final Results tab select 04 - Enrolment and Voting by Aggregated Vote Type
Report.
Enrolment
Total Electors 27,492
Residential roll 27,479
Non-residential roll 13
SmartRolled Electors 2,459
(30/7/11 – 30/7/12)
Participation and Informality
Participation rate 82.9%
Formal votes 21,261
Informal votes 1,539
Total votes 22,800
Informality rate 6.8%

REPORT ON THE 2012 LOCAL GOVERNMENT ELECTIONS
Great Lakes Council
331
Failure to Vote
Penalty Notices Issued 3,267
Rate of Failure to Vote46 11.9%
Election Costs
Total Cost of the Great Lakes Council 2012 Election
$206,347.00
Cost per elector
$7.52
Great Lakes Council Statutory Advertising Campaign Expenditure
Nominations $1,840.94
Candidates and polling places $2,803.94
Uncontested elections $0.00
Results $1,754.72
TOTAL $6,399.60
Election Services
Elector Enquiry Centre
The Elector Enquiry Centre answered 413 calls from postcodes within Great Lakes
Council area.
NSWEC Website
There were 2,110 unique visitors to Great Lakes Council election web page.
Braille Ballot Papers
No braille ballot papers were requested or printed.
Returning Officer
Leanne Maunder
46 Percentage of Penalty Notices Issued to Enrolment (as shown on Authorised Roll)

REPORT ON THE 2012 LOCAL GOVERNMENT ELECTIONS
Great Lakes Council
332
Returning Officer’s Office
Great Lakes Region Returning Officer's Office
Units 4-6, 21 Breese Parade
(Enter off Enterprise Court)
Forster NSW 2428
Councils in Region
Dungog Shire Council, Gloucester Shire Council and Great Lakes Council
Staffing
Office Manager 1
Senior Office Assistant 0
Office Assistants 31
Polling Place Managers 21
Polling Place Assistants 0
Deputy Polling Place Managers 1
Declaration Vote Issuing Officer 3
Election Officials 40
Council Count Manager 0
Part Day Election Officials 3
Total Staff 100
Polling Places
Pre-poll Centres 3
Declared Institutions 9
Election day Polling Places 22
Pre-poll centre locations
Forster Pre-Poll, Great Lakes Region Returning Officer's Office, Sydney Town Hall
Polling place locations
For 2012 map and polling places see –
www.pastvtr.elections.nsw.gov.au/LGE2012/great-lakes-council.html
Advertising
Statutory Campaign
The Council requested that the statutory advertisements be placed in the following
press:
Forster Great Lakes Advocate
Myall Coast NOTA
Dungog Chronicle
Gloucester Advocate
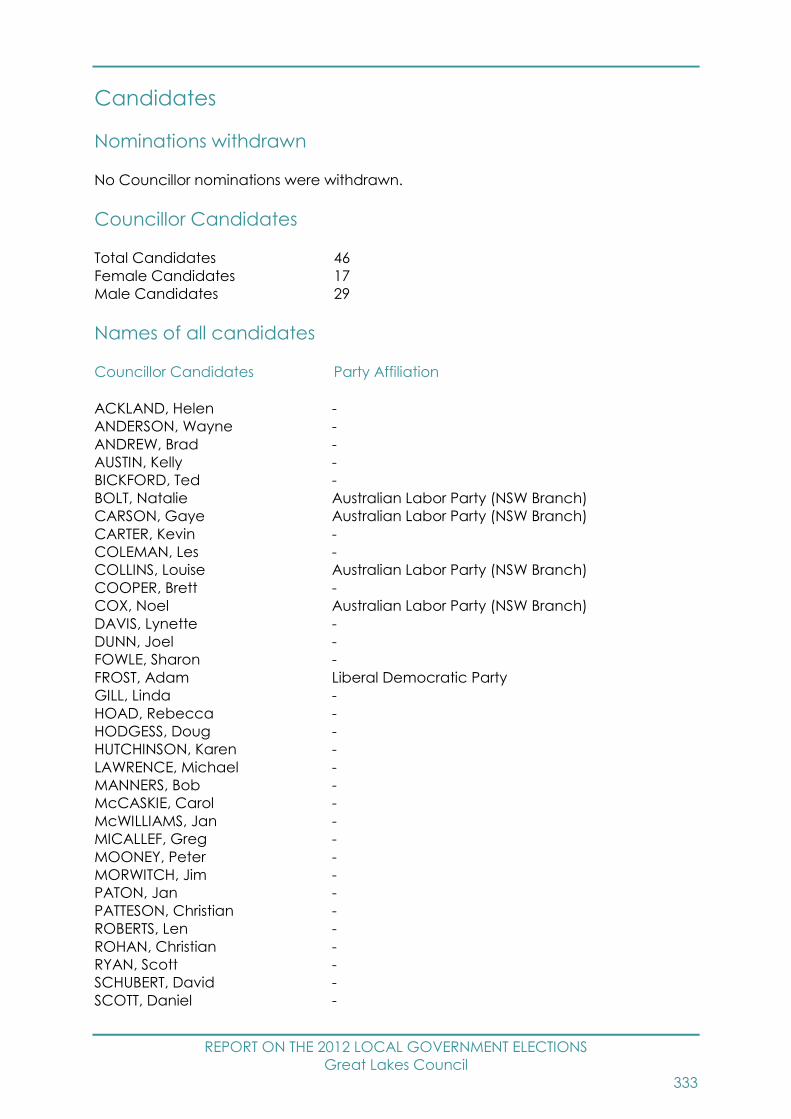
REPORT ON THE 2012 LOCAL GOVERNMENT ELECTIONS
Great Lakes Council
333
Candidates
Nominations withdrawn
No Councillor nominations were withdrawn.
Councillor Candidates
Total Candidates 46
Female Candidates 17
Male Candidates 29
Names of all candidates
Councillor Candidates Party Affiliation
ACKLAND, Helen -
ANDERSON, Wayne -
ANDREW, Brad -
AUSTIN, Kelly -
BICKFORD, Ted -
BOLT, Natalie Australian Labor Party (NSW Branch)
CARSON, Gaye Australian Labor Party (NSW Branch)
CARTER, Kevin -
COLEMAN, Les -
COLLINS, Louise Australian Labor Party (NSW Branch)
COOPER, Brett -
COX, Noel Australian Labor Party (NSW Branch)
DAVIS, Lynette -
DUNN, Joel -
FOWLE, Sharon -
FROST, Adam Liberal Democratic Party
GILL, Linda -
HOAD, Rebecca -
HODGESS, Doug -
HUTCHINSON, Karen -
LAWRENCE, Michael -
MANNERS, Bob -
McCASKIE, Carol -
McWILLIAMS, Jan -
MICALLEF, Greg -
MOONEY, Peter -
MORWITCH, Jim -
PATON, Jan -
PATTESON, Christian -
ROBERTS, Len -
ROHAN, Christian -
RYAN, Scott -
SCHUBERT, David -
SCOTT, Daniel -
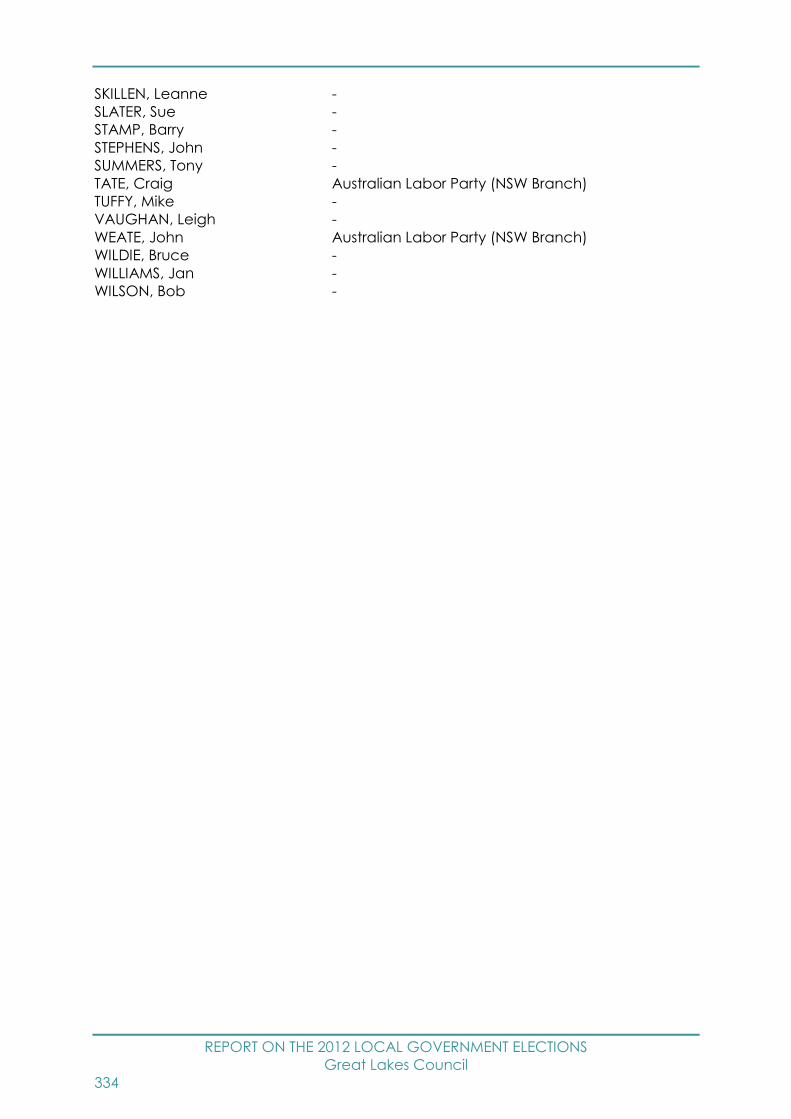
REPORT ON THE 2012 LOCAL GOVERNMENT ELECTIONS
Great Lakes Council
334
SKILLEN, Leanne -
SLATER, Sue -
STAMP, Barry -
STEPHENS, John -
SUMMERS, Tony -
TATE, Craig Australian Labor Party (NSW Branch)
TUFFY, Mike -
VAUGHAN, Leigh -
WEATE, John Australian Labor Party (NSW Branch)
WILDIE, Bruce -
WILLIAMS, Jan -
WILSON, Bob -
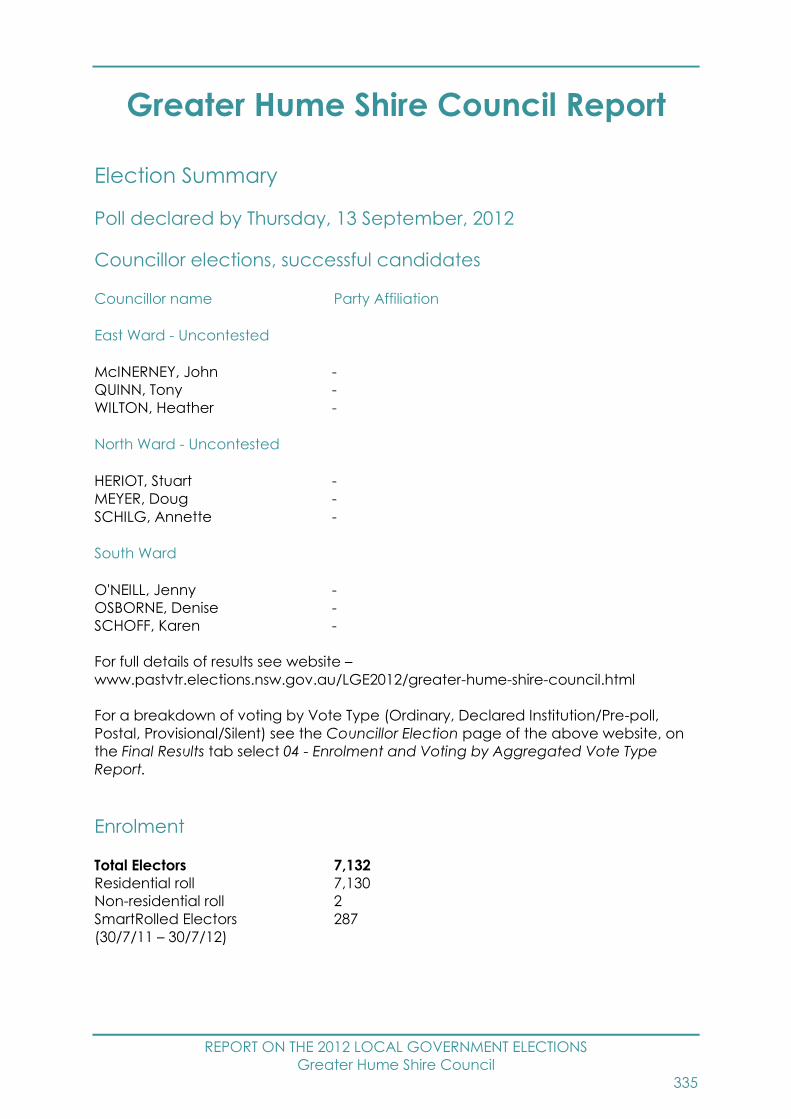
REPORT ON THE 2012 LOCAL GOVERNMENT ELECTIONS
Greater Hume Shire Council
335
Greater Hume Shire Council Report
Election Summary
Poll declared by Thursday, 13 September, 2012
Councillor elections, successful candidates
Councillor name Party Affiliation
East Ward - Uncontested
McINERNEY, John -
QUINN, Tony -
WILTON, Heather -
North Ward - Uncontested
HERIOT, Stuart -
MEYER, Doug -
SCHILG, Annette -
South Ward
O'NEILL, Jenny -
OSBORNE, Denise -
SCHOFF, Karen -
For full details of results see website –
www.pastvtr.elections.nsw.gov.au/LGE2012/greater-hume-shire-council.html
For a breakdown of voting by Vote Type (Ordinary, Declared Institution/Pre-poll,
Postal, Provisional/Silent) see the Councillor Election page of the above website, on
the Final Results tab select 04 - Enrolment and Voting by Aggregated Vote Type
Report.
Enrolment
Total Electors 7,132
Residential roll 7,130
Non-residential roll 2
SmartRolled Electors 287
(30/7/11 – 30/7/12)
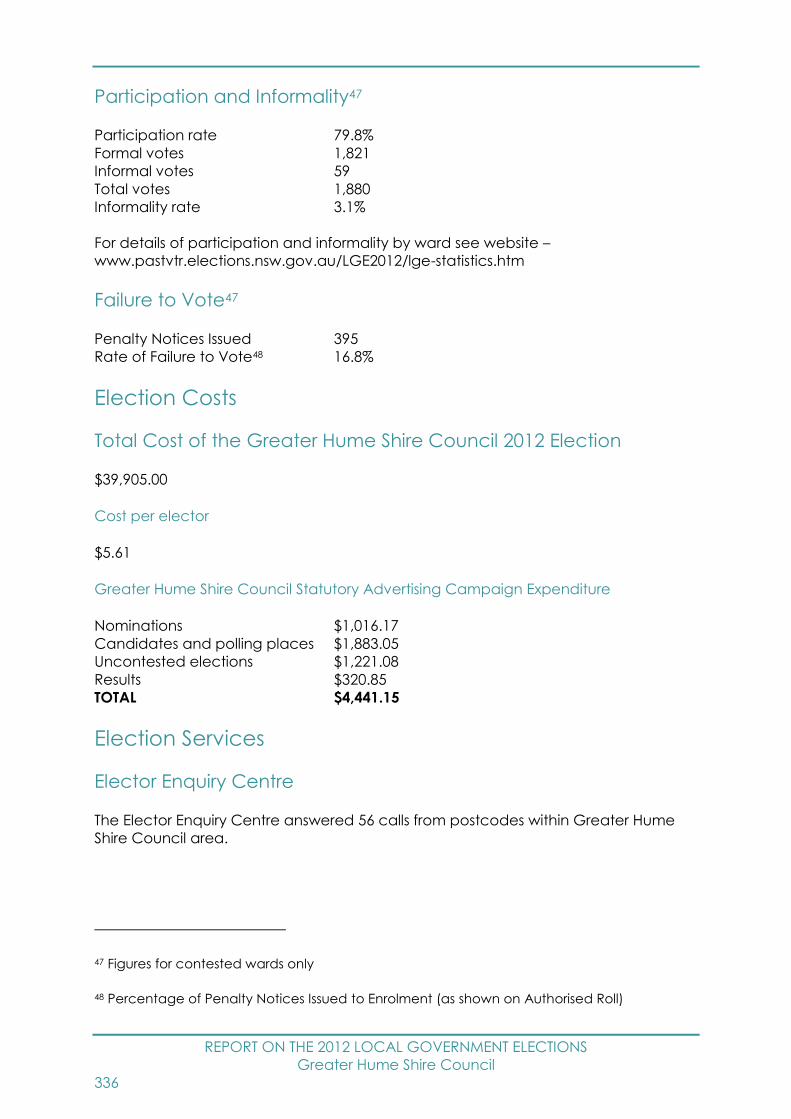
REPORT ON THE 2012 LOCAL GOVERNMENT ELECTIONS
Greater Hume Shire Council
336
Participation and Informality47
Participation rate 79.8%
Formal votes 1,821
Informal votes 59
Total votes 1,880
Informality rate 3.1%
For details of participation and informality by ward see website –
www.pastvtr.elections.nsw.gov.au/LGE2012/lge-statistics.htm
Failure to Vote47
Penalty Notices Issued 395
Rate of Failure to Vote48 16.8%
Election Costs
Total Cost of the Greater Hume Shire Council 2012 Election
$39,905.00
Cost per elector
$5.61
Greater Hume Shire Council Statutory Advertising Campaign Expenditure
Nominations $1,016.17
Candidates and polling places $1,883.05
Uncontested elections $1,221.08
Results $320.85
TOTAL $4,441.15
Election Services
Elector Enquiry Centre
The Elector Enquiry Centre answered 56 calls from postcodes within Greater Hume
Shire Council area.
47 Figures for contested wards only
48 Percentage of Penalty Notices Issued to Enrolment (as shown on Authorised Roll)
REPORT ON THE 2012 LOCAL GOVERNMENT ELECTIONS
Greater Hume Shire Council
337
NSWEC Website
There were 735 unique visitors to Greater Hume Shire Council election web page.
Braille Ballot Papers
No braille ballot papers were requested or printed.
Returning Officer
Karen Mills
Returning Officer’s Office
Albury Region Returning Officer's Office
575 Olive Street
Albury NSW 2640
Councils in Region
Albury City Council, Corowa Shire Council, Greater Hume Shire Council and
Tumbarumba Shire Council
Staffing
Office Manager 1
Senior Office Assistant 0
Office Assistants 0
Polling Place Managers 4
Polling Place Assistants 0
Deputy Polling Place Managers 0
Declaration Vote Issuing Officer 0
Election Officials 5
Council Count Manager 0
Part Day Election Officials 0
Total Staff 10
Polling Places
Pre-poll Centres 4
Declared Institutions 2
Election day Polling Places 5
Pre-poll centre locations
Albury Region Returning Officer's Office, Culcairn Pre-Poll, Jindera Pre-Poll, Sydney
Town Hall
REPORT ON THE 2012 LOCAL GOVERNMENT ELECTIONS
Greater Hume Shire Council
338
Polling place locations
For 2012 map and polling places see –
www.pastvtr.elections.nsw.gov.au/LGE2012/greater-hume-shire-council.html
Advertising
Statutory Campaign
The Council requested that the statutory advertisements be placed in the following
press:
Border Mail
Brocklesby Buzz
Culcairn Oasis
Holbrook Happenings
Henty Eastern Riverina Chronicle
Jindera News
Jindera Rural Rack
Wagga Wagga Daily Advertiser
Candidates
Nominations withdrawn
No Councillor nominations were withdrawn.
Councillor Candidates
Total Candidates 10
Female Candidates 5
Male Candidates 5
East Ward Councillor Candidates
Total Candidates 3
Female Candidates 1
Male Candidates 2
North Ward Councillor Candidates
Total Candidates 3
Female Candidates 1
Male Candidates 2
South Ward Councillor Candidates
Total Candidates 4
Female Candidates 3
Male Candidates 1

REPORT ON THE 2012 LOCAL GOVERNMENT ELECTIONS
Greater Hume Shire Council
339
Names of all candidates
Councillor Candidates Party Affiliation
South Ward
JACOB, Darryl -
O'NEILL, Jenny -
OSBORNE, Denise -
SCHOFF, Karen -

REPORT ON THE 2012 LOCAL GOVERNMENT ELECTIONS
Greater Taree City Council
340
Greater Taree City Council Report
Election Summary
Poll declared by Sunday, 16 September, 2012
Mayoral election, successful candidate
Mayor name Party Affiliation
HOGAN, Paul -
Councillor elections, successful candidates
Councillor name Party Affiliation
BELL, Kathryn -
CHRISTENSEN, Brad -
EPOV, Peter -
JENKINS, Robyn -
JENNISON, Trent -
KEEGAN, David -
TICKLE, Alan -
WEST, David -
For full details of results see website –
www.pastvtr.elections.nsw.gov.au/LGE2012/greater-taree-city-council.html
For a breakdown of voting by Vote Type (Ordinary, Declared Institution/Pre-poll,
Postal, Provisional/Silent) see the Councillor Election page of the above website, on
the Final Results tab select 04 - Enrolment and Voting by Aggregated Vote Type
Report.
Enrolment
Total Electors 35,283
Residential roll 35,278
Non-residential roll 5
SmartRolled Electors 3,549
(30/7/11 – 30/7/12)

REPORT ON THE 2012 LOCAL GOVERNMENT ELECTIONS
Greater Taree City Council
341
Participation and Informality
Participation rate 84.8%
Formal votes 27,001
Informal votes 2,915
Total votes 29,916
Informality rate 9.7%
Failure to Vote
Penalty Notices Issued 5,340
Rate of Failure to Vote49 15.2%
Election Costs
Total Cost of the Greater Taree City Council 2012 Election
$246,170.00
Cost per elector
$6.99
Greater Taree City Council Statutory Advertising Campaign Expenditure
Nominations $1,090.24
Candidates and polling places $750.31
Uncontested elections $0.00
Results $175.72
TOTAL $2,016.27
Election Services
Elector Enquiry Centre
The Elector Enquiry Centre answered 358 calls from postcodes within Greater Taree
City Council area.
NSWEC Website
There were 3,131 unique visitors to Greater Taree City Council election web page.
Braille Ballot Papers
No braille ballot papers were requested or printed.
49 Percentage of Penalty Notices Issued to Enrolment (as shown on Authorised Roll)
REPORT ON THE 2012 LOCAL GOVERNMENT ELECTIONS
Greater Taree City Council
342
Returning Officer
Ken Raison
Returning Officer’s Office
Port Macquarie Region Returning Officer's Office
Spotlight Complex
Shop 2, 180 Lake Road
Port Macquarie NSW 2444
Councils in Region
Greater Taree City Council and Port Macquarie-Hastings Council
Staffing
Office Manager 1
Senior Office Assistant 0
Office Assistants 0
Polling Place Managers 31
Polling Place Assistants 8
Deputy Polling Place Managers 2
Declaration Vote Issuing Officer 0
Election Officials 55
Council Count Manager 7
Part Day Election Officials 3
Total Staff 107
Polling Places
Pre-poll Centres 3
Declared Institutions 10
Election day Polling Places 33
Pre-poll centre locations
Port Macquarie Region Returning Officer's Office, Taree Pre-Poll, Sydney Town Hall
Polling place locations
For 2012 map and polling places see –
www.pastvtr.elections.nsw.gov.au/LGE2012/greater-taree-city-council.html

REPORT ON THE 2012 LOCAL GOVERNMENT ELECTIONS
Greater Taree City Council
343
Advertising
Statutory Campaign
The Council requested that the statutory advertisements be placed in the following
press:
Manning River Times
Wingham Chronicle
Candidates
Nominations withdrawn
No Mayoral nominations were withdrawn.
No Councillor nominations were withdrawn.
Mayoral Candidates
Total Candidates 8
Female Candidates 1
Male Candidates 7
Councillor Candidates
Total Candidates 33
Female Candidates 8
Male Candidates 25
Names of all candidates
Mayoral Candidates Party Affiliation
BELL, Kathryn -
EPOV, Peter -
GALATI, Tony -
HOGAN, Paul -
HUTH, Diceman -
SMITH, Bob -
TICKLE, Alan -
WEST, David -
Councillor Candidates Party Affiliation
ANDERSON, Kerry -
BELL, Kathryn -
BUCKLEY, Brian -
CHRISTENSEN, Brad -
CLANCY, Bryan -

REPORT ON THE 2012 LOCAL GOVERNMENT ELECTIONS
Greater Taree City Council
344
COSWAY, Alex -
CROOK, Richard -
DEVERELL, Tim -
DOUTHIE, Debbie -
EPOV, Peter -
GALATI, Tony -
GIBBONS, Christine -
HALL, Joan -
HOGAN, Paul -
HUDSON, Mike -
HUTH, Diceman -
JENKINS, Robyn -
JENNISON, Trent -
KEEGAN, David -
KENT, Michael -
LEVY, David -
LEWERS, Paul -
MAHARAJ, Nawal -
MICHAEL, Jenny -
QUINN, Dick -
RACK, Susie -
RANKIN, David -
ROBERTSON, Bruce -
SMITH, Bob -
SUMMERFIELD, Brenden -
TICKLE, Alan -
VANDERPOLL, Walter -
WEST, David -
REPORT ON THE 2012 LOCAL GOVERNMENT ELECTIONS
Griffith City Council
345
Griffith City Council Report
Election Summary
Poll declared by Saturday, 15 September, 2012
Mayoral election, successful candidate
Mayor name Party Affiliation
DAL BROI, John -
Councillor elections, successful candidates
Councillor name Party Affiliation
BALIND, Alison -
COX, Pat -
CROCE, Simon -
CURRAN, Doug -
LANCASTER, Bill -
NAPOLI, Anne -
NEVILLE, Mike -
ROSSETTO, Paul -
STEAD, Christine -
THORPE, Leon -
ZAPPACOSTA, Dino -
For full details of results see website –
www.pastvtr.elections.nsw.gov.au/LGE2012/griffith-city-council.html
For a breakdown of voting by Vote Type (Ordinary, Declared Institution/Pre-poll,
Postal, Provisional/Silent) see the Councillor Election page of the above website, on
the Final Results tab select 04 - Enrolment and Voting by Aggregated Vote Type
Report.
Enrolment
Total Electors 15,981
Residential roll 15,981
Non-residential roll 0
SmartRolled Electors 1,283
(30/7/11 – 30/7/12)

REPORT ON THE 2012 LOCAL GOVERNMENT ELECTIONS
Griffith City Council
346
Participation and Informality
Participation rate 82.7%
Formal votes 11,628
Informal votes 1,587
Total votes 13,215
Informality rate 12.0%
Failure to Vote
Penalty Notices Issued 1,948
Rate of Failure to Vote50 12.2%
Election Costs
Total Cost of the Griffith City Council 2012 Election
$128,772.00
Cost per elector
$8.07
Griffith City Council Statutory Advertising Campaign Expenditure
Nominations $824.36
Candidates and polling places $2,296.24
Uncontested elections $0.00
Results $154.80
TOTAL $3,275.40
Election Services
Elector Enquiry Centre
The Elector Enquiry Centre answered 181 calls from postcodes within Griffith City
Council area.
NSWEC Website
There were 1,276 unique visitors to Griffith City Council election web page.
Braille Ballot Papers
No braille ballot papers were requested or printed.
50 Percentage of Penalty Notices Issued to Enrolment (as shown on Authorised Roll)
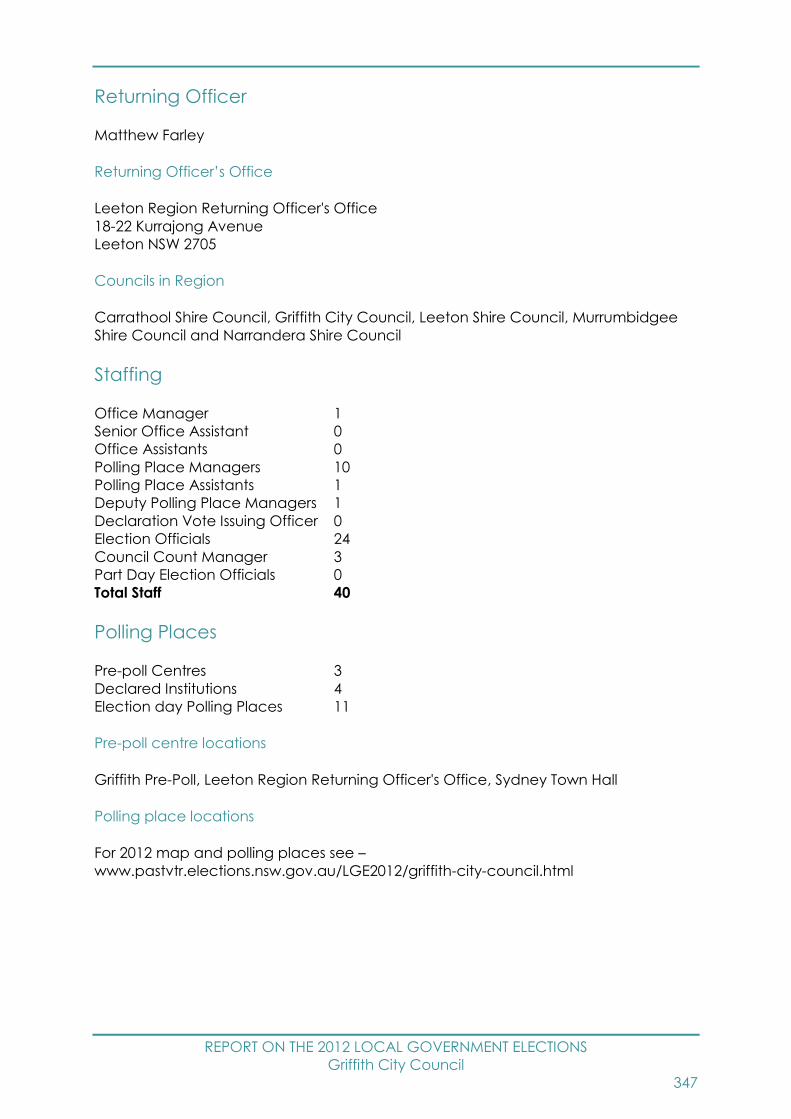
REPORT ON THE 2012 LOCAL GOVERNMENT ELECTIONS
Griffith City Council
347
Returning Officer
Matthew Farley
Returning Officer’s Office
Leeton Region Returning Officer's Office
18-22 Kurrajong Avenue
Leeton NSW 2705
Councils in Region
Carrathool Shire Council, Griffith City Council, Leeton Shire Council, Murrumbidgee
Shire Council and Narrandera Shire Council
Staffing
Office Manager 1
Senior Office Assistant 0
Office Assistants 0
Polling Place Managers 10
Polling Place Assistants 1
Deputy Polling Place Managers 1
Declaration Vote Issuing Officer 0
Election Officials 24
Council Count Manager 3
Part Day Election Officials 0
Total Staff 40
Polling Places
Pre-poll Centres 3
Declared Institutions 4
Election day Polling Places 11
Pre-poll centre locations
Griffith Pre-Poll, Leeton Region Returning Officer's Office, Sydney Town Hall
Polling place locations
For 2012 map and polling places see –
www.pastvtr.elections.nsw.gov.au/LGE2012/griffith-city-council.html

REPORT ON THE 2012 LOCAL GOVERNMENT ELECTIONS
Griffith City Council
348
Advertising
Statutory Campaign
The Council requested that the statutory advertisements be placed in the following
press:
Griffith Area News
Candidates
Nominations withdrawn
No Mayoral nominations were withdrawn.
No Councillor nominations were withdrawn.
Mayoral Candidates
Total Candidates 9
Female Candidates 1
Male Candidates 8
Councillor Candidates
Total Candidates 16
Female Candidates 5
Male Candidates 11
Names of all candidates
Mayoral Candidates Party Affiliation
BENNETT, Allan -
CROCE, Simon -
DAL BROI, John -
LANCASTER, Bill -
NAPOLI, Anne -
NEVILLE, Mike -
PERRY, Lance -
THORPE, Leon -
ZAPPACOSTA, Dino -
Councillor Candidates Party Affiliation
BALIND, Alison -
COX, Pat -
CROCE, Simon -
CURRAN, Doug -
DAL BROI, John -
DHANOA, Harnek -
REPORT ON THE 2012 LOCAL GOVERNMENT ELECTIONS
Griffith City Council
349
HOPPER, Brian -
LANCASTER, Bill -
MERCURI, Rina -
NAPOLI, Anne -
NEVILLE, Mike -
PERRY, Lance -
ROSSETTO, Paul -
STEAD, Christine -
THORPE, Leon -
ZAPPACOSTA, Dino -
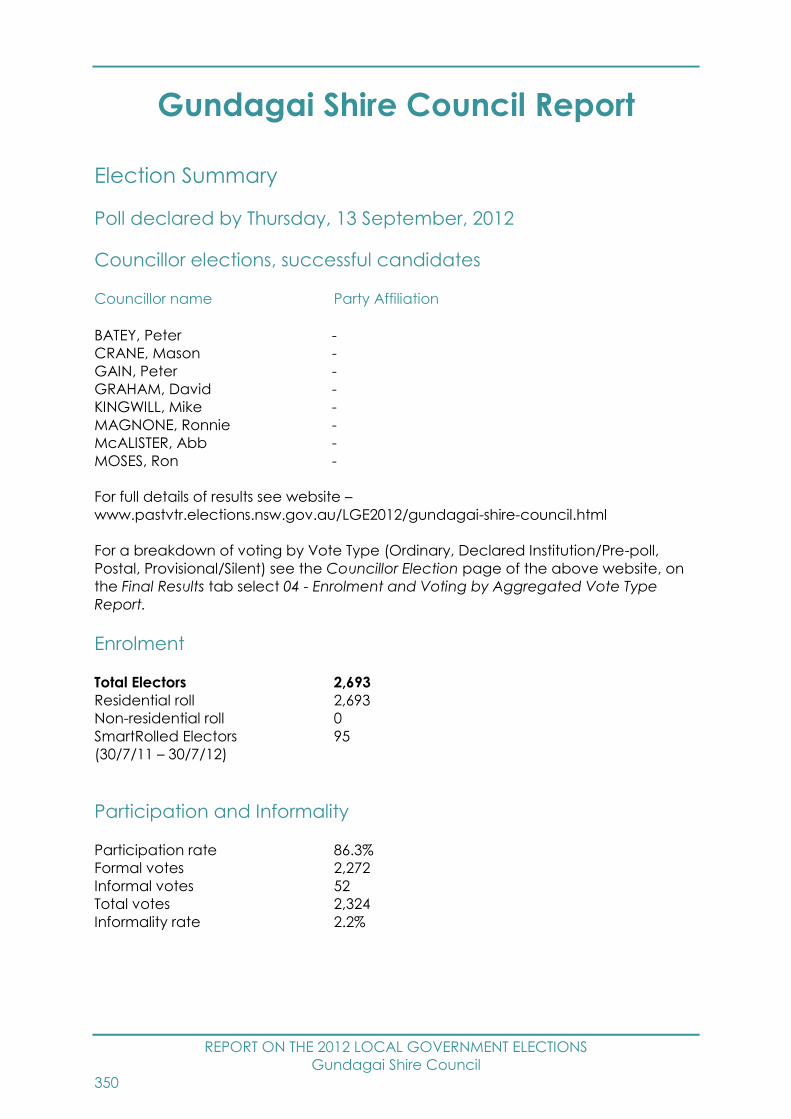
REPORT ON THE 2012 LOCAL GOVERNMENT ELECTIONS
Gundagai Shire Council
350
Gundagai Shire Council Report
Election Summary
Poll declared by Thursday, 13 September, 2012
Councillor elections, successful candidates
Councillor name Party Affiliation
BATEY, Peter -
CRANE, Mason -
GAIN, Peter -
GRAHAM, David -
KINGWILL, Mike -
MAGNONE, Ronnie -
McALISTER, Abb -
MOSES, Ron -
For full details of results see website –
www.pastvtr.elections.nsw.gov.au/LGE2012/gundagai-shire-council.html
For a breakdown of voting by Vote Type (Ordinary, Declared Institution/Pre-poll,
Postal, Provisional/Silent) see the Councillor Election page of the above website, on
the Final Results tab select 04 - Enrolment and Voting by Aggregated Vote Type
Report.
Enrolment
Total Electors 2,693
Residential roll 2,693
Non-residential roll 0
SmartRolled Electors 95
(30/7/11 – 30/7/12)
Participation and Informality
Participation rate 86.3%
Formal votes 2,272
Informal votes 52
Total votes 2,324
Informality rate 2.2%

REPORT ON THE 2012 LOCAL GOVERNMENT ELECTIONS
Gundagai Shire Council
351
Failure to Vote
Penalty Notices Issued 255
Rate of Failure to Vote51 9.5%
Election Costs
Total Cost of the Gundagai Shire Council 2012 Election
$22,196.00
Cost per elector
$8.27
Gundagai Shire Council Statutory Advertising Campaign Expenditure
Nominations $833.78
Candidates and polling places $2,202.99
Uncontested elections $0.00
Results $264.00
TOTAL $3,300.77
Election Services
Elector Enquiry Centre
The Elector Enquiry Centre answered 49 calls from postcodes within Gundagai Shire
Council area.
NSWEC Website
There were 789 unique visitors to Gundagai Shire Council election web page.
Braille Ballot Papers
No braille ballot papers were requested or printed.
Returning Officer
Barry Shields
51 Percentage of Penalty Notices Issued to Enrolment (as shown on Authorised Roll)
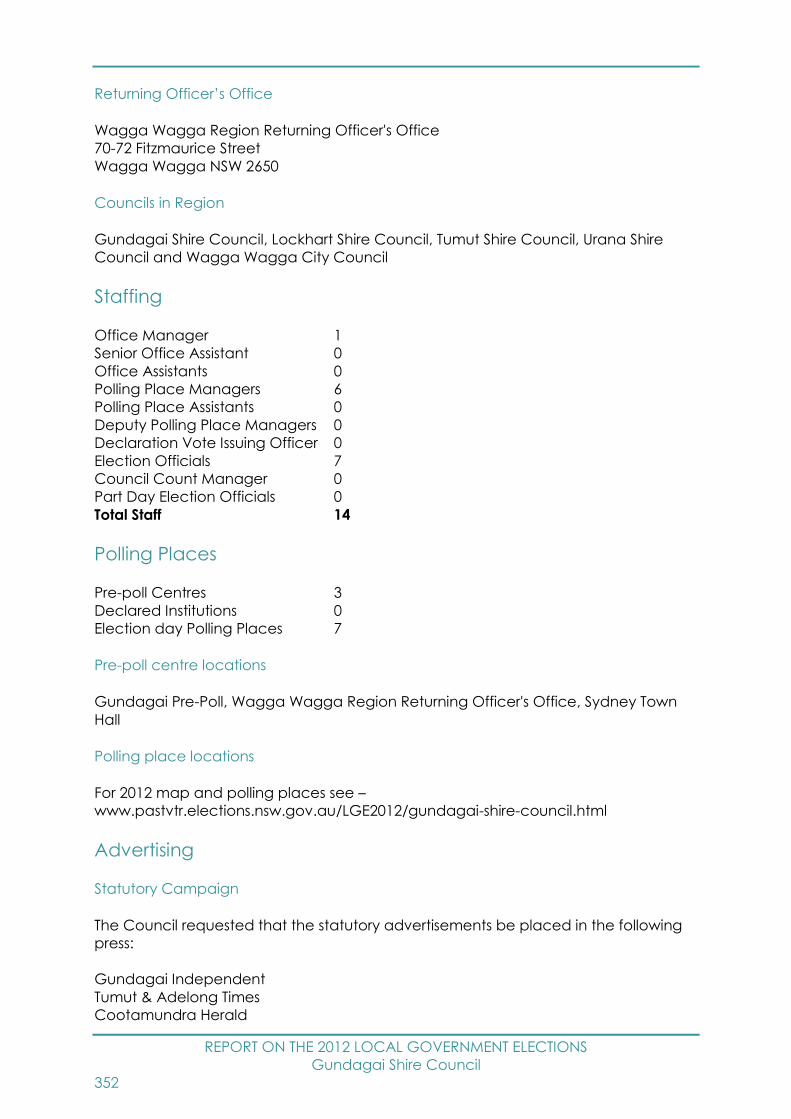
REPORT ON THE 2012 LOCAL GOVERNMENT ELECTIONS
Gundagai Shire Council
352
Returning Officer’s Office
Wagga Wagga Region Returning Officer's Office
70-72 Fitzmaurice Street
Wagga Wagga NSW 2650
Councils in Region
Gundagai Shire Council, Lockhart Shire Council, Tumut Shire Council, Urana Shire
Council and Wagga Wagga City Council
Staffing
Office Manager 1
Senior Office Assistant 0
Office Assistants 0
Polling Place Managers 6
Polling Place Assistants 0
Deputy Polling Place Managers 0
Declaration Vote Issuing Officer 0
Election Officials 7
Council Count Manager 0
Part Day Election Officials 0
Total Staff 14
Polling Places
Pre-poll Centres 3
Declared Institutions 0
Election day Polling Places 7
Pre-poll centre locations
Gundagai Pre-Poll, Wagga Wagga Region Returning Officer's Office, Sydney Town
Hall
Polling place locations
For 2012 map and polling places see –
www.pastvtr.elections.nsw.gov.au/LGE2012/gundagai-shire-council.html
Advertising
Statutory Campaign
The Council requested that the statutory advertisements be placed in the following
press:
Gundagai Independent
Tumut & Adelong Times
Cootamundra Herald
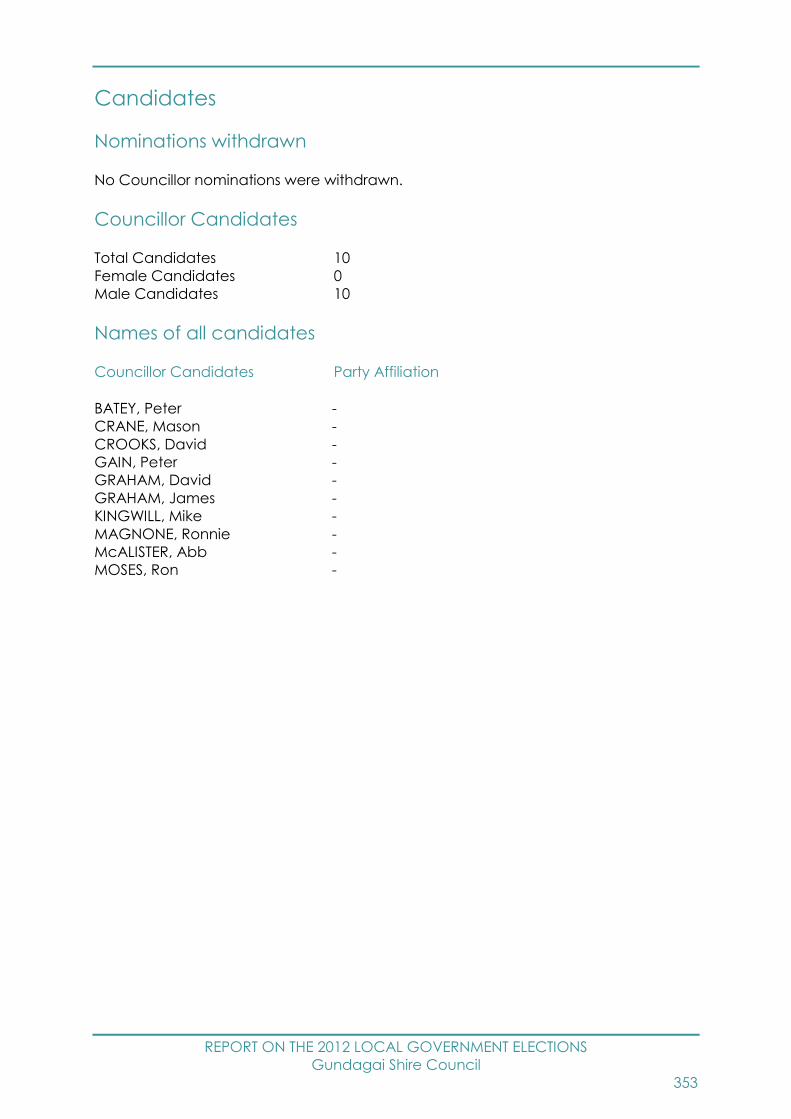
REPORT ON THE 2012 LOCAL GOVERNMENT ELECTIONS
Gundagai Shire Council
353
Candidates
Nominations withdrawn
No Councillor nominations were withdrawn.
Councillor Candidates
Total Candidates 10
Female Candidates 0
Male Candidates 10
Names of all candidates
Councillor Candidates Party Affiliation
BATEY, Peter -
CRANE, Mason -
CROOKS, David -
GAIN, Peter -
GRAHAM, David -
GRAHAM, James -
KINGWILL, Mike -
MAGNONE, Ronnie -
McALISTER, Abb -
MOSES, Ron -
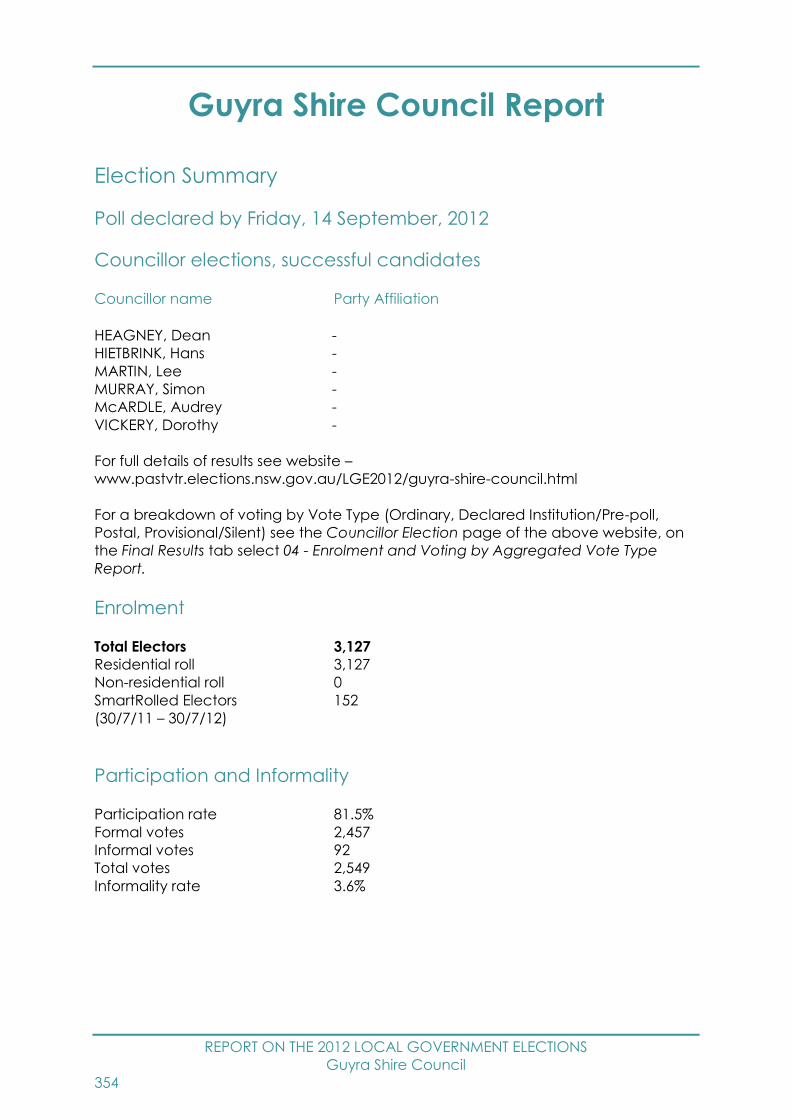
REPORT ON THE 2012 LOCAL GOVERNMENT ELECTIONS
Guyra Shire Council
354
Guyra Shire Council Report
Election Summary
Poll declared by Friday, 14 September, 2012
Councillor elections, successful candidates
Councillor name Party Affiliation
HEAGNEY, Dean -
HIETBRINK, Hans -
MARTIN, Lee -
MURRAY, Simon -
McARDLE, Audrey -
VICKERY, Dorothy -
For full details of results see website –
www.pastvtr.elections.nsw.gov.au/LGE2012/guyra-shire-council.html
For a breakdown of voting by Vote Type (Ordinary, Declared Institution/Pre-poll,
Postal, Provisional/Silent) see the Councillor Election page of the above website, on
the Final Results tab select 04 - Enrolment and Voting by Aggregated Vote Type
Report.
Enrolment
Total Electors 3,127
Residential roll 3,127
Non-residential roll 0
SmartRolled Electors 152
(30/7/11 – 30/7/12)
Participation and Informality
Participation rate 81.5%
Formal votes 2,457
Informal votes 92
Total votes 2,549
Informality rate 3.6%

REPORT ON THE 2012 LOCAL GOVERNMENT ELECTIONS
Guyra Shire Council
355
Failure to Vote
Penalty Notices Issued 361
Rate of Failure to Vote52 11.6%
Election Costs
Total Cost of the Guyra Shire Council 2012 Election
$27,544.00
Cost per elector
$8.83
Guyra Shire Council Statutory Advertising Campaign Expenditure
Nominations $1,234.06
Candidates and polling places $2,138.63
Uncontested elections $0.00
Results $576.00
TOTAL $3,948.69
Election Services
Elector Enquiry Centre
The Elector Enquiry Centre answered 50 calls from postcodes within Guyra Shire
Council area.
NSWEC Website
There were 490 unique visitors to Guyra Shire Council election web page.
Braille Ballot Papers
No braille ballot papers were requested or printed.
Returning Officer
Desmond Breen
52 Percentage of Penalty Notices Issued to Enrolment (as shown on Authorised Roll)
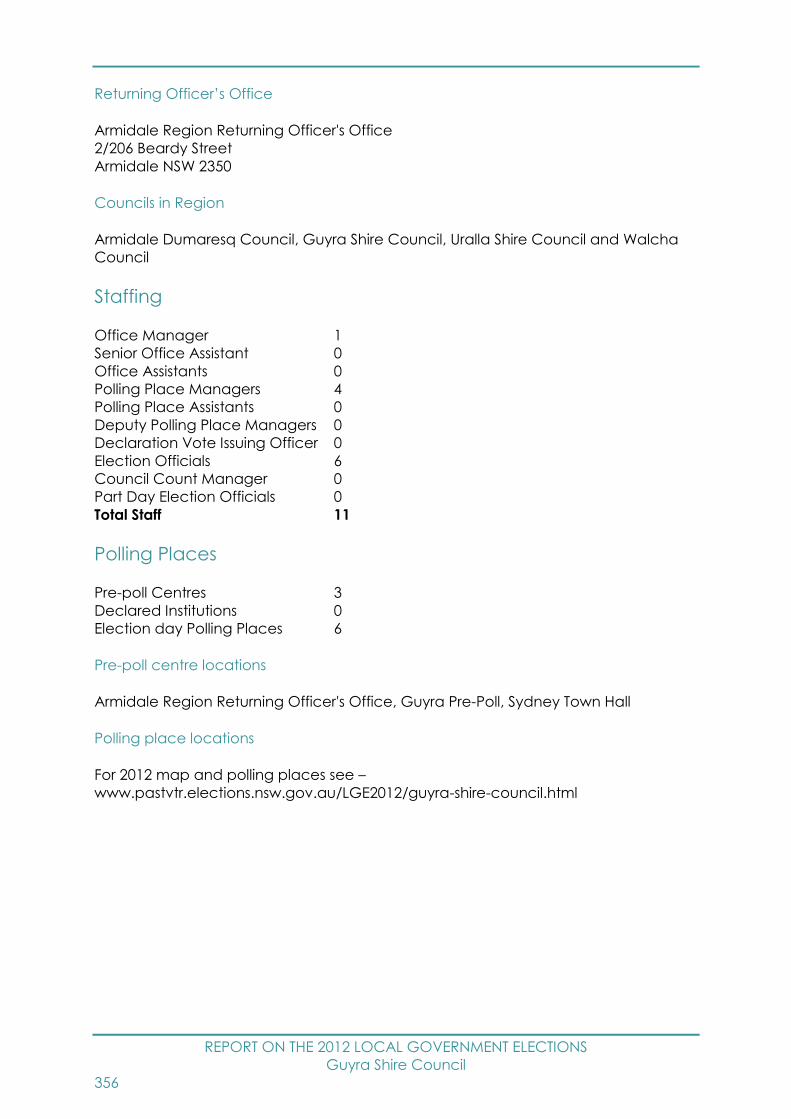
REPORT ON THE 2012 LOCAL GOVERNMENT ELECTIONS
Guyra Shire Council
356
Returning Officer’s Office
Armidale Region Returning Officer's Office
2/206 Beardy Street
Armidale NSW 2350
Councils in Region
Armidale Dumaresq Council, Guyra Shire Council, Uralla Shire Council and Walcha
Council
Staffing
Office Manager 1
Senior Office Assistant 0
Office Assistants 0
Polling Place Managers 4
Polling Place Assistants 0
Deputy Polling Place Managers 0
Declaration Vote Issuing Officer 0
Election Officials 6
Council Count Manager 0
Part Day Election Officials 0
Total Staff 11
Polling Places
Pre-poll Centres 3
Declared Institutions 0
Election day Polling Places 6
Pre-poll centre locations
Armidale Region Returning Officer's Office, Guyra Pre-Poll, Sydney Town Hall
Polling place locations
For 2012 map and polling places see –
www.pastvtr.elections.nsw.gov.au/LGE2012/guyra-shire-council.html

REPORT ON THE 2012 LOCAL GOVERNMENT ELECTIONS
Guyra Shire Council
357
Advertising
Statutory Campaign
The Council requested that the statutory advertisements be placed in the following
press:
Armidale Express
Armidale Extra
Guyra Argus
Armidale Independent
Inverell Times
Candidates
Nominations withdrawn
No Councillor nominations were withdrawn.
Councillor Candidates
Total Candidates 8
Female Candidates 3
Male Candidates 5
Names of all candidates
Councillor Candidates Party Affiliation
ELLEM, Tish -
FLEMING, Paul -
HEAGNEY, Dean -
HIETBRINK, Hans -
MARTIN, Lee -
McARDLE, Audrey -
MURRAY, Simon -
VICKERY, Dorothy -
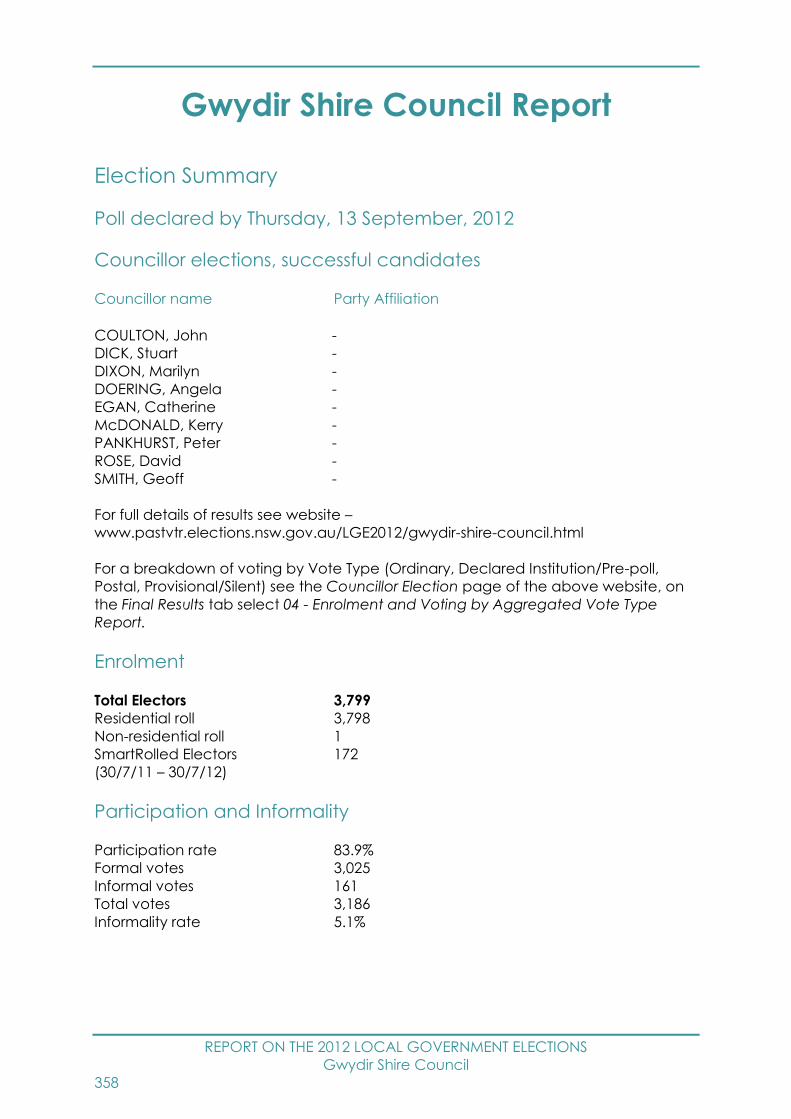
REPORT ON THE 2012 LOCAL GOVERNMENT ELECTIONS
Gwydir Shire Council
358
Gwydir Shire Council Report
Election Summary
Poll declared by Thursday, 13 September, 2012
Councillor elections, successful candidates
Councillor name Party Affiliation
COULTON, John -
DICK, Stuart -
DIXON, Marilyn -
DOERING, Angela -
EGAN, Catherine -
McDONALD, Kerry -
PANKHURST, Peter -
ROSE, David -
SMITH, Geoff -
For full details of results see website –
www.pastvtr.elections.nsw.gov.au/LGE2012/gwydir-shire-council.html
For a breakdown of voting by Vote Type (Ordinary, Declared Institution/Pre-poll,
Postal, Provisional/Silent) see the Councillor Election page of the above website, on
the Final Results tab select 04 - Enrolment and Voting by Aggregated Vote Type
Report.
Enrolment
Total Electors 3,799
Residential roll 3,798
Non-residential roll 1
SmartRolled Electors 172
(30/7/11 – 30/7/12)
Participation and Informality
Participation rate 83.9%
Formal votes 3,025
Informal votes 161
Total votes 3,186
Informality rate 5.1%

REPORT ON THE 2012 LOCAL GOVERNMENT ELECTIONS
Gwydir Shire Council
359
Failure to Vote
Penalty Notices Issued 377
Rate of Failure to Vote53 10.0%
Election Costs
Total Cost of the Gwydir Shire Council 2012 Election
$34,789.00
Cost per elector
$9.18
Gwydir Shire Council Statutory Advertising Campaign Expenditure
Nominations $1,205.00
Candidates and polling places $3,786.15
Uncontested elections $0.00
Results $276.42
TOTAL $5,267.57
Election Services
Elector Enquiry Centre
The Elector Enquiry Centre answered 76 calls from postcodes within Gwydir Shire
Council area.
NSWEC Website
There were 513 unique visitors to Gwydir Shire Council election web page.
Braille Ballot Papers
No braille ballot papers were requested or printed.
Returning Officer
Sarah Risby
53 Percentage of Penalty Notices Issued to Enrolment (as shown on Authorised Roll)
REPORT ON THE 2012 LOCAL GOVERNMENT ELECTIONS
Gwydir Shire Council
360
Returning Officer’s Office
Moree Region Returning Officer's Office
Moree Banquet Hall
36 Balo Street
Moree NSW 2400
Councils in Region
Gwydir Shire Council, Moree Plains Shire Council, Narrabri Shire Council and Walgett
Shire Council
Staffing
Office Manager 1
Senior Office Assistant 0
Office Assistants 0
Polling Place Managers 8
Polling Place Assistants 0
Deputy Polling Place Managers 0
Declaration Vote Issuing Officer 0
Election Officials 9
Council Count Manager 0
Part Day Election Officials 0
Total Staff 18
Polling Places
Pre-poll Centres 4
Declared Institutions 3
Election day Polling Places 9
Pre-poll centre locations
Bingara Pre-Poll, Moree Region Returning Officer's Office, Warialda Pre-Poll, Sydney
Town Hall
Polling place locations
For 2012 map and polling places see –
www.pastvtr.elections.nsw.gov.au/LGE2012/gwydir-shire-council.html
REPORT ON THE 2012 LOCAL GOVERNMENT ELECTIONS
Gwydir Shire Council
361
Advertising
Statutory Campaign
The Council requested that the statutory advertisements be placed in the following
press:
Bingara Advocate
Barraba Gazette
The Warialda Standard
North West Magazine - (a newspaper published weekly that inserted & appears in
The Courier - Tues; Gunnedah; Tamworth Times; Barraba Gazette; Bingara;
Coonabarabran; Coonamble; Goondiwindi; Manilla; Narrabri Courier; Quirindi;
Warialda; Moree )
Candidates
Nominations withdrawn
No Councillor nominations were withdrawn.
Councillor Candidates
Total Candidates 12
Female Candidates 5
Male Candidates 7
Names of all candidates
Councillor Candidates Party Affiliation
COULTON, John -
DICK, Stuart -
DIXON, Marilyn -
DOERING, Angela -
EGAN, Catherine -
McDONALD, Kerry -
PANKHURST, Peter -
PRICE, Trevor -
ROSE, David -
SMITH, Geoff -
SWAIN, Bob -
YOUNG, Frances -
REPORT ON THE 2012 LOCAL GOVERNMENT ELECTIONS
Harden Shire Council
362
Harden Shire Council Report
Election Summary
Poll declared by Friday, 14 September, 2012
Councillor elections, successful candidates
Councillor name Party Affiliation
CAMPBELL, Tony -
FLANERY, Tony -
HORTON, John -
MANCHESTER, Chris -
REID, Neil -
SANDERSON, Cathy -
STADTMILLER, Matthew -
For full details of results see website –
www.pastvtr.elections.nsw.gov.au/LGE2012/harden-shire-council.html
For a breakdown of voting by Vote Type (Ordinary, Declared Institution/Pre-poll,
Postal, Provisional/Silent) see the Councillor Election page of the above website, on
the Final Results tab select 04 - Enrolment and Voting by Aggregated Vote Type
Report.
Enrolment
Total Electors 2,854
Residential roll 2,853
Non-residential roll 1
SmartRolled Electors 129
(30/7/11 – 30/7/12)
Participation and Informality
Participation rate 87.6%
Formal votes 2,406
Informal votes 94
Total votes 2,500
Informality rate 3.8%

REPORT ON THE 2012 LOCAL GOVERNMENT ELECTIONS
Harden Shire Council
363
Failure to Vote
Penalty Notices Issued 261
Rate of Failure to Vote54 9.2%
Election Costs
Total Cost of the Harden Shire Council 2012 Election
$27,747.00
Cost per elector
$9.76
Harden Shire Council Statutory Advertising Campaign Expenditure
Nominations $1,149.00
Candidates and polling places $1,669.54
Uncontested elections $0.00
Results $151.62
TOTAL $2,970.16
Election Services
Elector Enquiry Centre
The Elector Enquiry Centre answered 33 calls from postcodes within Harden Shire
Council area.
NSWEC Website
There were 367 unique visitors to Harden Shire Council election web page.
Braille Ballot Papers
No braille ballot papers were requested or printed.
Returning Officer
Alan Salmon
54 Percentage of Penalty Notices Issued to Enrolment (as shown on Authorised Roll)

REPORT ON THE 2012 LOCAL GOVERNMENT ELECTIONS
Harden Shire Council
364
Returning Officer’s Office
Cootamundra Region Returning Officer's Office
Riverina Community College
76 Wallendoon Street
Cootamundra NSW 2590
Councils in Region
Coolamon Shire Council, Cootamundra Shire Council, Harden Shire Council, Junee
Shire Council and Temora Shire Council
Staffing
Office Manager 1
Senior Office Assistant 0
Office Assistants 0
Polling Place Managers 5
Polling Place Assistants 0
Deputy Polling Place Managers 0
Declaration Vote Issuing Officer 0
Election Officials 6
Council Count Manager 0
Part Day Election Officials 1
Total Staff 13
Polling Places
Pre-poll Centres 3
Declared Institutions 2
Election day Polling Places 6
Pre-poll centre locations
Cootamundra Region Returning Officer's Office, Harden Pre-Poll, Sydney Town Hall
Polling place locations
For 2012 map and polling places see –
www.pastvtr.elections.nsw.gov.au/LGE2012/harden-shire-council.html
Advertising
Statutory Campaign
The Council requested that the statutory advertisements be placed in the following
press:
Harden Murrumburrah Express
Southern Weekly
REPORT ON THE 2012 LOCAL GOVERNMENT ELECTIONS
Harden Shire Council
365
Candidates
Nominations withdrawn
No Councillor nominations were withdrawn.
Councillor Candidates
Total Candidates 8
Female Candidates 1
Male Candidates 7
Names of all candidates
Councillor Candidates Party Affiliation
CAMPBELL, Tony -
FLANERY, Tony -
HORTON, John -
MADDEN, Tony -
MANCHESTER, Chris -
REID, Neil -
SANDERSON, Cathy -
STADTMILLER, Matthew -
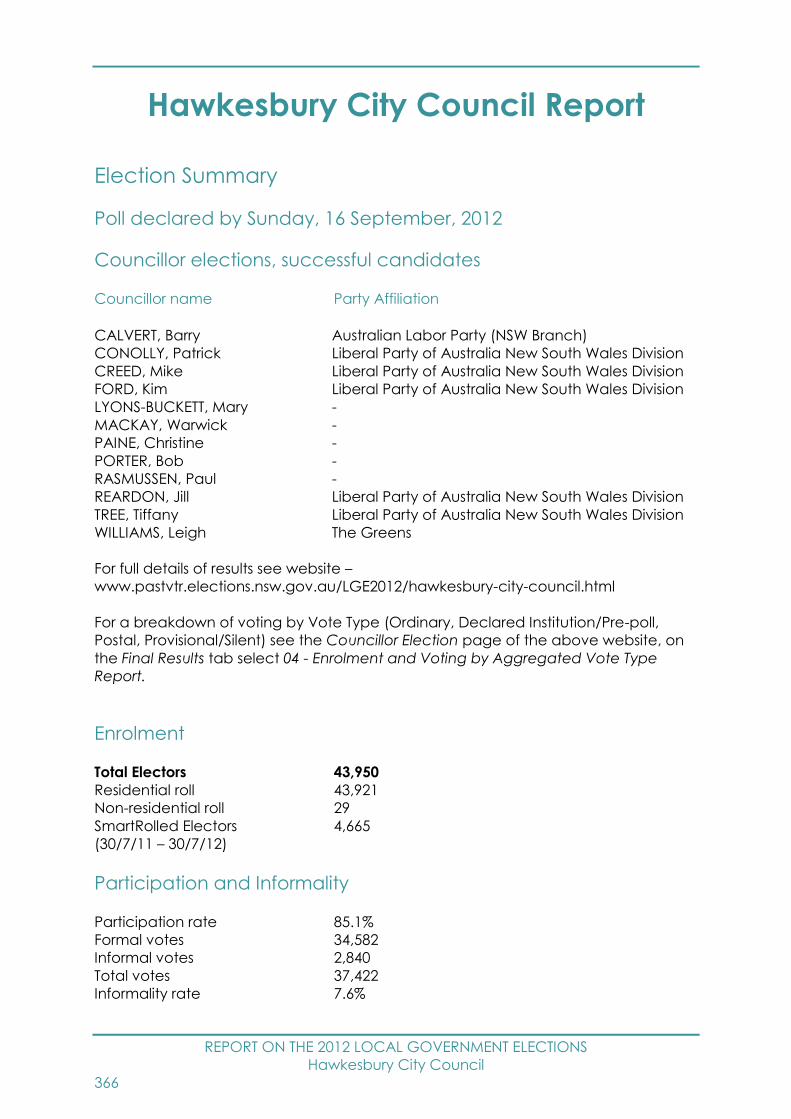
REPORT ON THE 2012 LOCAL GOVERNMENT ELECTIONS
Hawkesbury City Council
366
Hawkesbury City Council Report
Election Summary
Poll declared by Sunday, 16 September, 2012
Councillor elections, successful candidates
Councillor name Party Affiliation
CALVERT, Barry Australian Labor Party (NSW Branch)
CONOLLY, Patrick Liberal Party of Australia New South Wales Division
CREED, Mike Liberal Party of Australia New South Wales Division
FORD, Kim Liberal Party of Australia New South Wales Division
LYONS-BUCKETT, Mary -
MACKAY, Warwick -
PAINE, Christine -
PORTER, Bob -
RASMUSSEN, Paul -
REARDON, Jill Liberal Party of Australia New South Wales Division
TREE, Tiffany Liberal Party of Australia New South Wales Division
WILLIAMS, Leigh The Greens
For full details of results see website –
www.pastvtr.elections.nsw.gov.au/LGE2012/hawkesbury-city-council.html
For a breakdown of voting by Vote Type (Ordinary, Declared Institution/Pre-poll,
Postal, Provisional/Silent) see the Councillor Election page of the above website, on
the Final Results tab select 04 - Enrolment and Voting by Aggregated Vote Type
Report.
Enrolment
Total Electors 43,950
Residential roll 43,921
Non-residential roll 29
SmartRolled Electors 4,665
(30/7/11 – 30/7/12)
Participation and Informality
Participation rate 85.1%
Formal votes 34,582
Informal votes 2,840
Total votes 37,422
Informality rate 7.6%
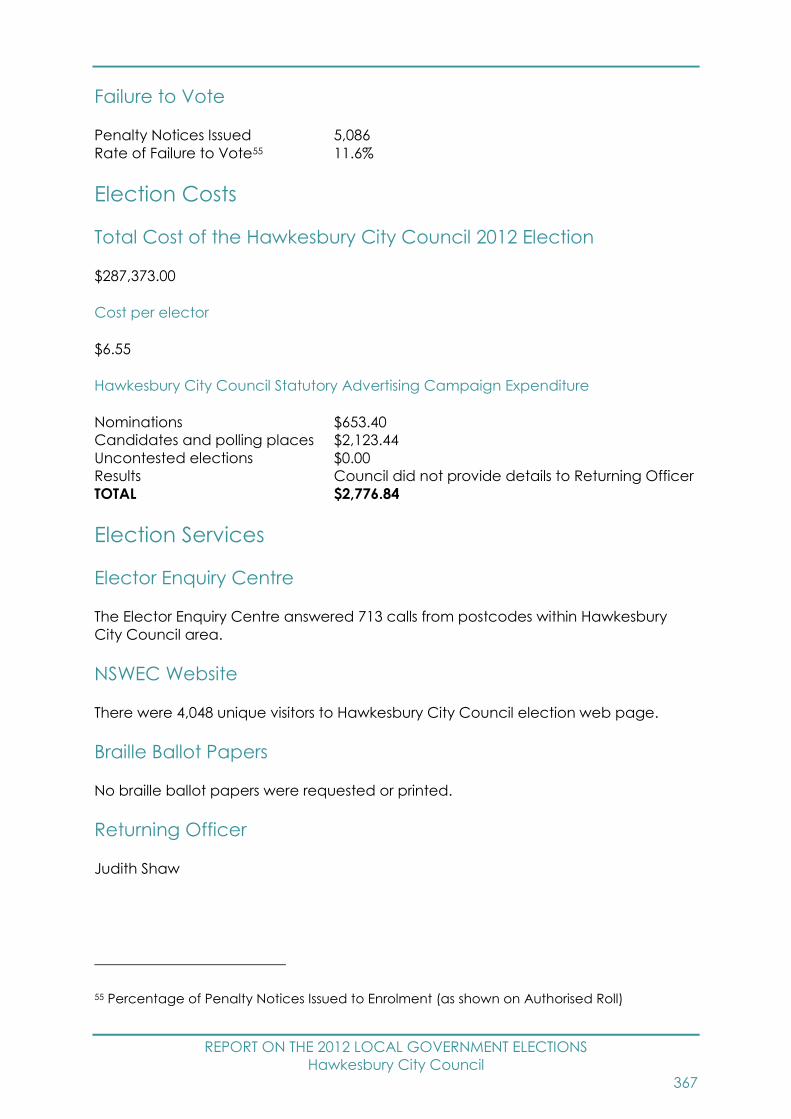
REPORT ON THE 2012 LOCAL GOVERNMENT ELECTIONS
Hawkesbury City Council
367
Failure to Vote
Penalty Notices Issued 5,086
Rate of Failure to Vote55 11.6%
Election Costs
Total Cost of the Hawkesbury City Council 2012 Election
$287,373.00
Cost per elector
$6.55
Hawkesbury City Council Statutory Advertising Campaign Expenditure
Nominations $653.40
Candidates and polling places $2,123.44
Uncontested elections $0.00
Results Council did not provide details to Returning Officer
TOTAL $2,776.84
Election Services
Elector Enquiry Centre
The Elector Enquiry Centre answered 713 calls from postcodes within Hawkesbury
City Council area.
NSWEC Website
There were 4,048 unique visitors to Hawkesbury City Council election web page.
Braille Ballot Papers
No braille ballot papers were requested or printed.
Returning Officer
Judith Shaw
55 Percentage of Penalty Notices Issued to Enrolment (as shown on Authorised Roll)
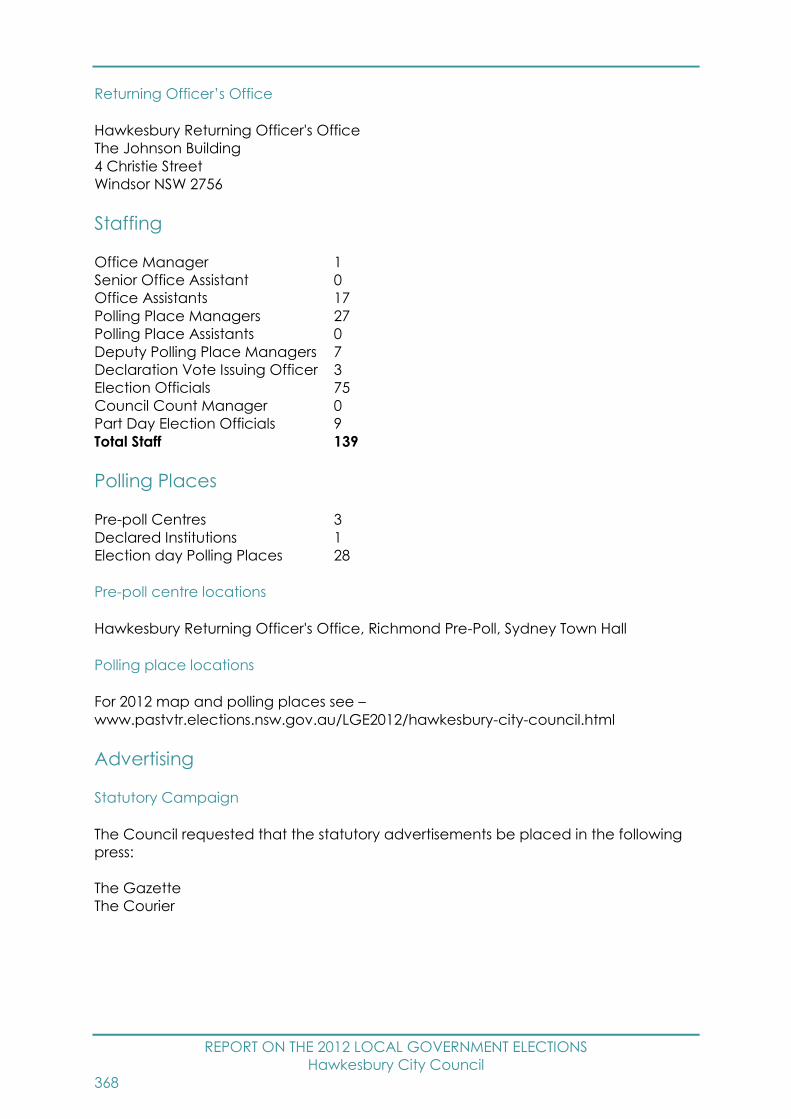
REPORT ON THE 2012 LOCAL GOVERNMENT ELECTIONS
Hawkesbury City Council
368
Returning Officer’s Office
Hawkesbury Returning Officer's Office
The Johnson Building
4 Christie Street
Windsor NSW 2756
Staffing
Office Manager 1
Senior Office Assistant 0
Office Assistants 17
Polling Place Managers 27
Polling Place Assistants 0
Deputy Polling Place Managers 7
Declaration Vote Issuing Officer 3
Election Officials 75
Council Count Manager 0
Part Day Election Officials 9
Total Staff 139
Polling Places
Pre-poll Centres 3
Declared Institutions 1
Election day Polling Places 28
Pre-poll centre locations
Hawkesbury Returning Officer's Office, Richmond Pre-Poll, Sydney Town Hall
Polling place locations
For 2012 map and polling places see –
www.pastvtr.elections.nsw.gov.au/LGE2012/hawkesbury-city-council.html
Advertising
Statutory Campaign
The Council requested that the statutory advertisements be placed in the following
press:
The Gazette
The Courier
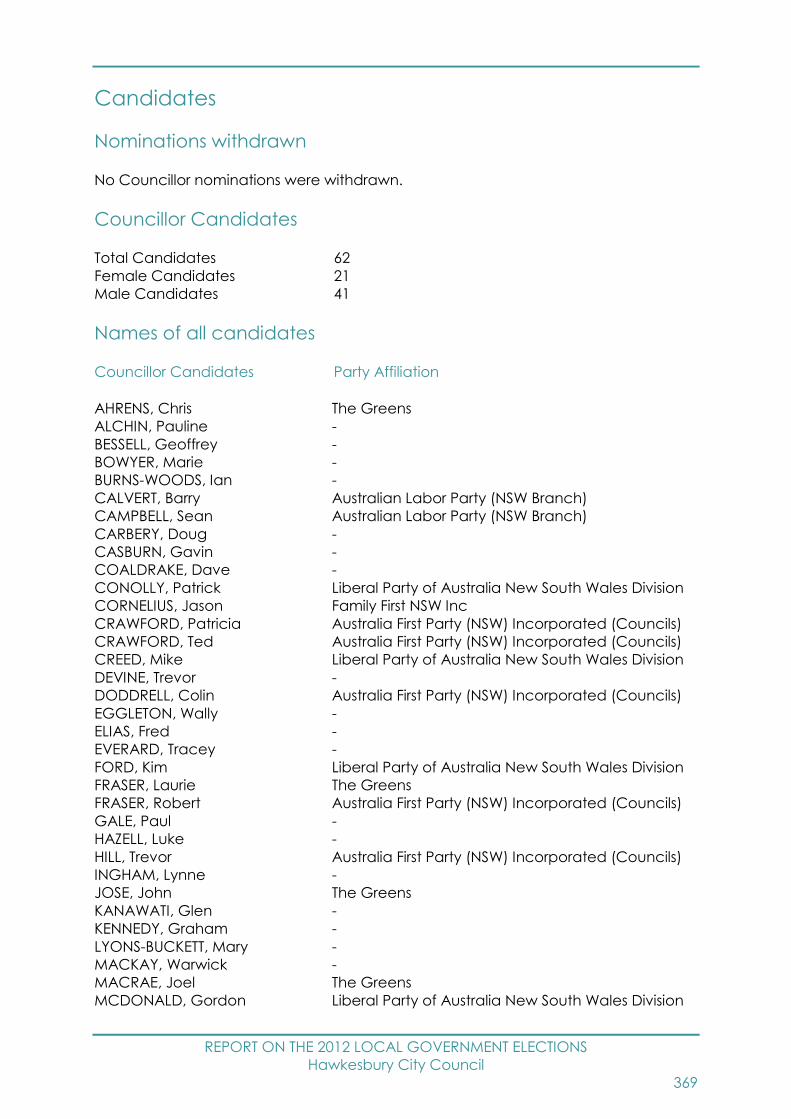
REPORT ON THE 2012 LOCAL GOVERNMENT ELECTIONS
Hawkesbury City Council
369
Candidates
Nominations withdrawn
No Councillor nominations were withdrawn.
Councillor Candidates
Total Candidates 62
Female Candidates 21
Male Candidates 41
Names of all candidates
Councillor Candidates Party Affiliation
AHRENS, Chris The Greens
ALCHIN, Pauline -
BESSELL, Geoffrey -
BOWYER, Marie -
BURNS-WOODS, Ian -
CALVERT, Barry Australian Labor Party (NSW Branch)
CAMPBELL, Sean Australian Labor Party (NSW Branch)
CARBERY, Doug -
CASBURN, Gavin -
COALDRAKE, Dave -
CONOLLY, Patrick Liberal Party of Australia New South Wales Division
CORNELIUS, Jason Family First NSW Inc
CRAWFORD, Patricia Australia First Party (NSW) Incorporated (Councils)
CRAWFORD, Ted Australia First Party (NSW) Incorporated (Councils)
CREED, Mike Liberal Party of Australia New South Wales Division
DEVINE, Trevor -
DODDRELL, Colin Australia First Party (NSW) Incorporated (Councils)
EGGLETON, Wally -
ELIAS, Fred -
EVERARD, Tracey -
FORD, Kim Liberal Party of Australia New South Wales Division
FRASER, Laurie The Greens
FRASER, Robert Australia First Party (NSW) Incorporated (Councils)
GALE, Paul -
HAZELL, Luke -
HILL, Trevor Australia First Party (NSW) Incorporated (Councils)
INGHAM, Lynne -
JOSE, John The Greens
KANAWATI, Glen -
KENNEDY, Graham -
LYONS-BUCKETT, Mary -
MACKAY, Warwick -
MACRAE, Joel The Greens
MCDONALD, Gordon Liberal Party of Australia New South Wales Division
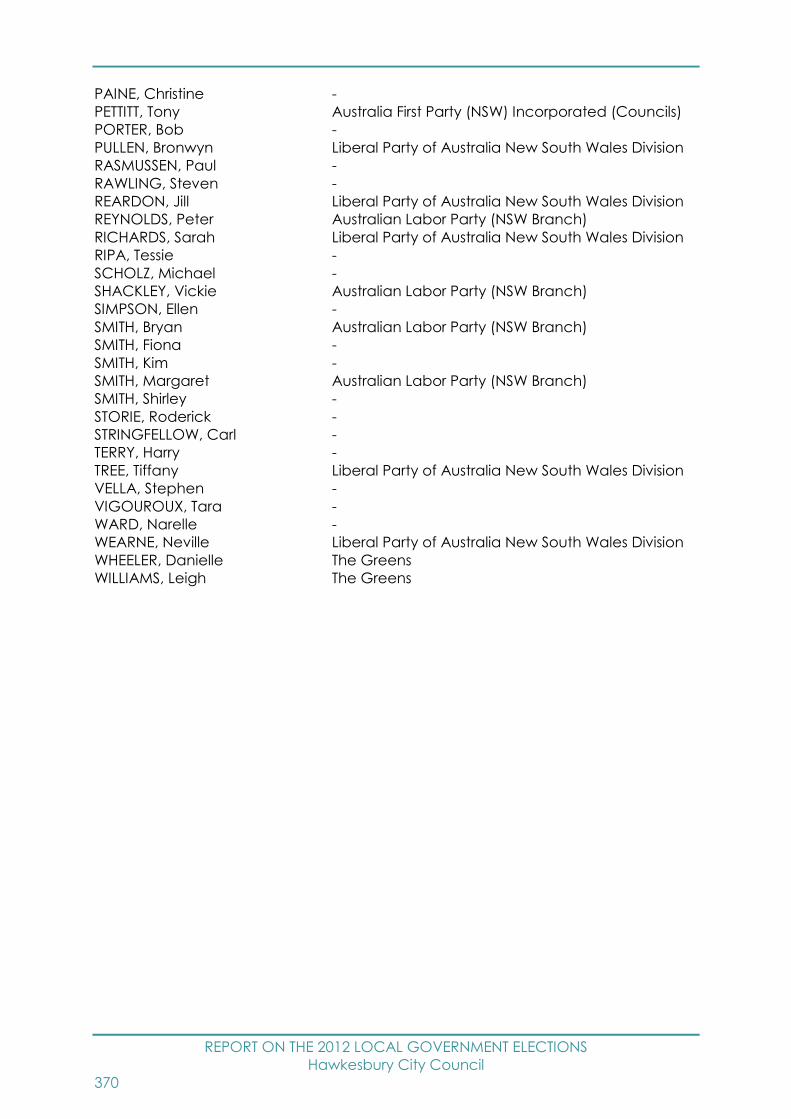
REPORT ON THE 2012 LOCAL GOVERNMENT ELECTIONS
Hawkesbury City Council
370
PAINE, Christine -
PETTITT, Tony Australia First Party (NSW) Incorporated (Councils)
PORTER, Bob -
PULLEN, Bronwyn Liberal Party of Australia New South Wales Division
RASMUSSEN, Paul -
RAWLING, Steven -
REARDON, Jill Liberal Party of Australia New South Wales Division
REYNOLDS, Peter Australian Labor Party (NSW Branch)
RICHARDS, Sarah Liberal Party of Australia New South Wales Division
RIPA, Tessie -
SCHOLZ, Michael -
SHACKLEY, Vickie Australian Labor Party (NSW Branch)
SIMPSON, Ellen -
SMITH, Bryan Australian Labor Party (NSW Branch)
SMITH, Fiona -
SMITH, Kim -
SMITH, Margaret Australian Labor Party (NSW Branch)
SMITH, Shirley -
STORIE, Roderick -
STRINGFELLOW, Carl -
TERRY, Harry -
TREE, Tiffany Liberal Party of Australia New South Wales Division
VELLA, Stephen -
VIGOUROUX, Tara -
WARD, Narelle -
WEARNE, Neville Liberal Party of Australia New South Wales Division
WHEELER, Danielle The Greens
WILLIAMS, Leigh The Greens
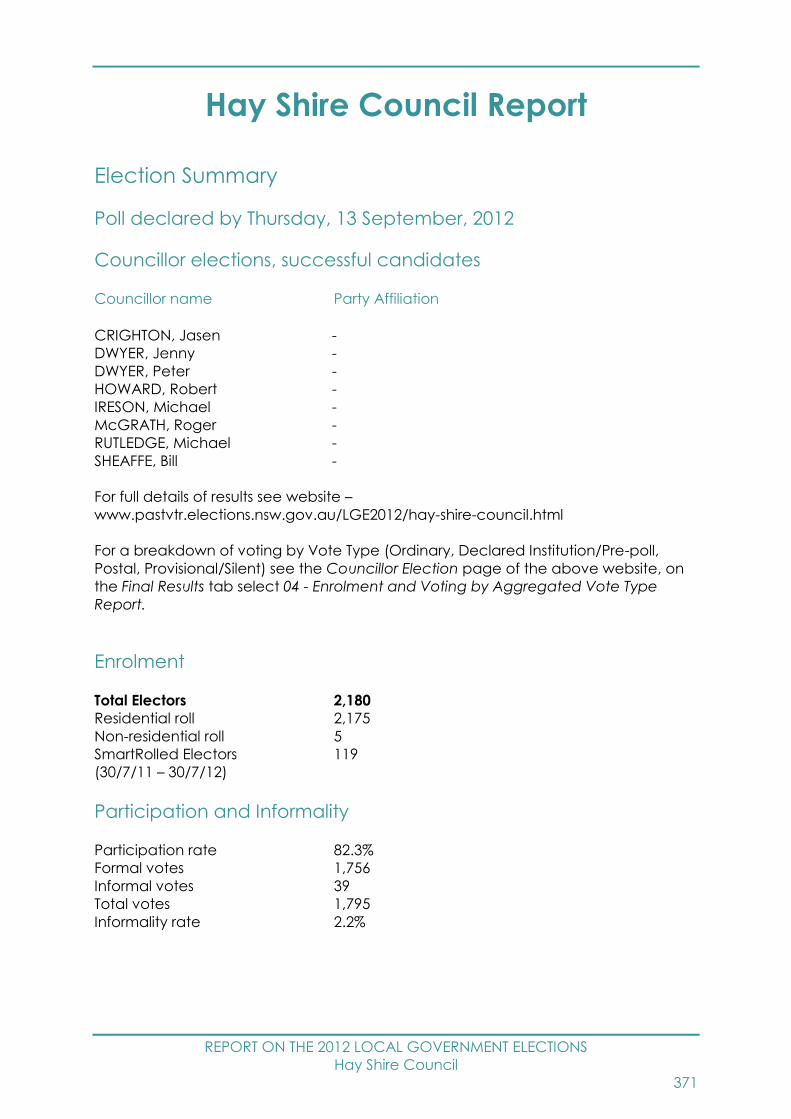
REPORT ON THE 2012 LOCAL GOVERNMENT ELECTIONS
Hay Shire Council
371
Hay Shire Council Report
Election Summary
Poll declared by Thursday, 13 September, 2012
Councillor elections, successful candidates
Councillor name Party Affiliation
CRIGHTON, Jasen -
DWYER, Jenny -
DWYER, Peter -
HOWARD, Robert -
IRESON, Michael -
McGRATH, Roger -
RUTLEDGE, Michael -
SHEAFFE, Bill -
For full details of results see website –
www.pastvtr.elections.nsw.gov.au/LGE2012/hay-shire-council.html
For a breakdown of voting by Vote Type (Ordinary, Declared Institution/Pre-poll,
Postal, Provisional/Silent) see the Councillor Election page of the above website, on
the Final Results tab select 04 - Enrolment and Voting by Aggregated Vote Type
Report.
Enrolment
Total Electors 2,180
Residential roll 2,175
Non-residential roll 5
SmartRolled Electors 119
(30/7/11 – 30/7/12)
Participation and Informality
Participation rate 82.3%
Formal votes 1,756
Informal votes 39
Total votes 1,795
Informality rate 2.2%
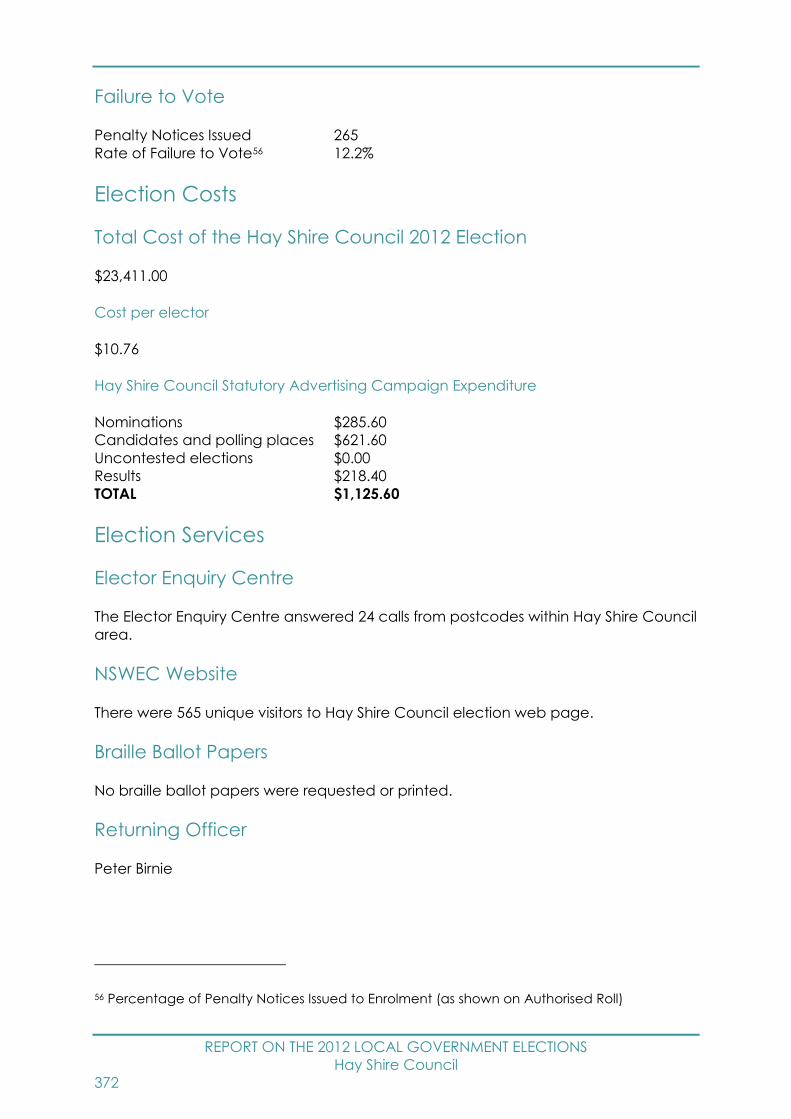
REPORT ON THE 2012 LOCAL GOVERNMENT ELECTIONS
Hay Shire Council
372
Failure to Vote
Penalty Notices Issued 265
Rate of Failure to Vote56 12.2%
Election Costs
Total Cost of the Hay Shire Council 2012 Election
$23,411.00
Cost per elector
$10.76
Hay Shire Council Statutory Advertising Campaign Expenditure
Nominations $285.60
Candidates and polling places $621.60
Uncontested elections $0.00
Results $218.40
TOTAL $1,125.60
Election Services
Elector Enquiry Centre
The Elector Enquiry Centre answered 24 calls from postcodes within Hay Shire Council
area.
NSWEC Website
There were 565 unique visitors to Hay Shire Council election web page.
Braille Ballot Papers
No braille ballot papers were requested or printed.
Returning Officer
Peter Birnie
56 Percentage of Penalty Notices Issued to Enrolment (as shown on Authorised Roll)
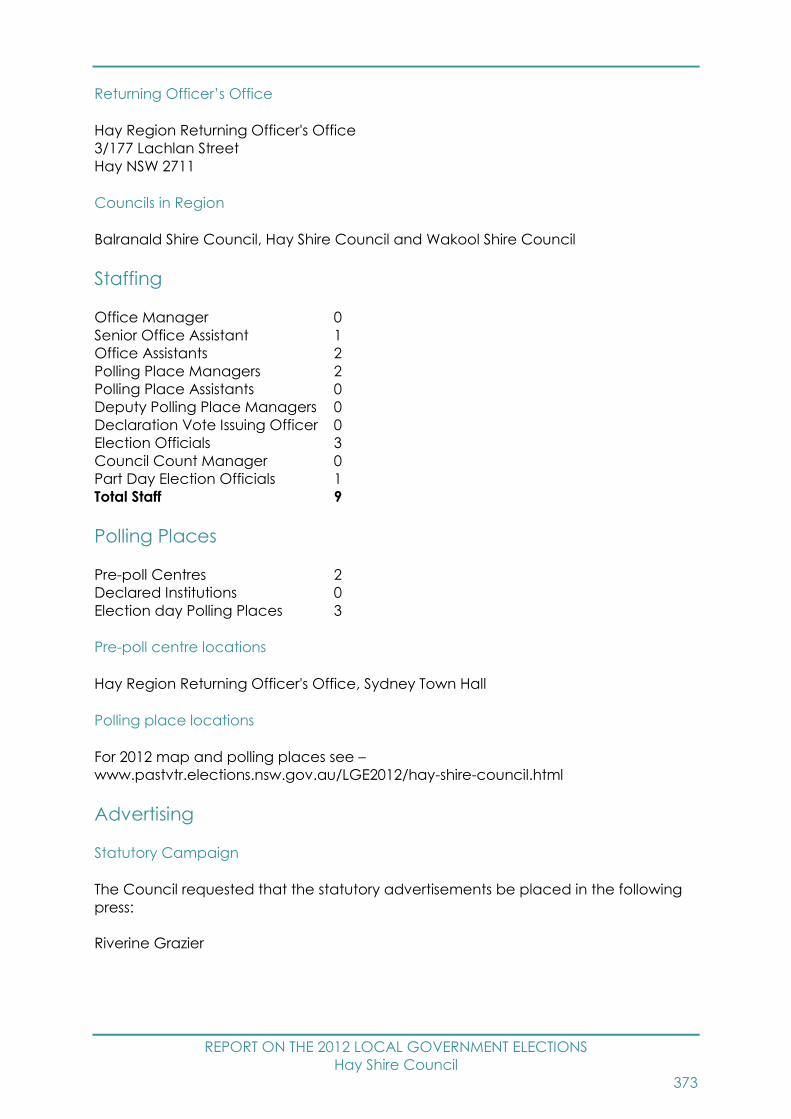
REPORT ON THE 2012 LOCAL GOVERNMENT ELECTIONS
Hay Shire Council
373
Returning Officer’s Office
Hay Region Returning Officer's Office
3/177 Lachlan Street
Hay NSW 2711
Councils in Region
Balranald Shire Council, Hay Shire Council and Wakool Shire Council
Staffing
Office Manager 0
Senior Office Assistant 1
Office Assistants 2
Polling Place Managers 2
Polling Place Assistants 0
Deputy Polling Place Managers 0
Declaration Vote Issuing Officer 0
Election Officials 3
Council Count Manager 0
Part Day Election Officials 1
Total Staff 9
Polling Places
Pre-poll Centres 2
Declared Institutions 0
Election day Polling Places 3
Pre-poll centre locations
Hay Region Returning Officer's Office, Sydney Town Hall
Polling place locations
For 2012 map and polling places see –
www.pastvtr.elections.nsw.gov.au/LGE2012/hay-shire-council.html
Advertising
Statutory Campaign
The Council requested that the statutory advertisements be placed in the following
press:
Riverine Grazier

REPORT ON THE 2012 LOCAL GOVERNMENT ELECTIONS
Hay Shire Council
374
Candidates
Nominations withdrawn
One Councillor nomination was withdrawn.
Councillor Candidates
Total Candidates 13
Female Candidates 4
Male Candidates 9
Names of all candidates
Councillor Candidates Party Affiliation
CRIGHTON, Jasen -
CURTAYNE, Lynne -
DWYER, Jenny -
DWYER, Peter -
FAYLE, Pat -
HOWARD, Robert -
IRESON, Michael -
LOW, David -
McGRATH, Roger -
OATAWAY, Peter -
RUTLEDGE, Michael -
SHEAFFE, Bill -
SMITH, Annette -
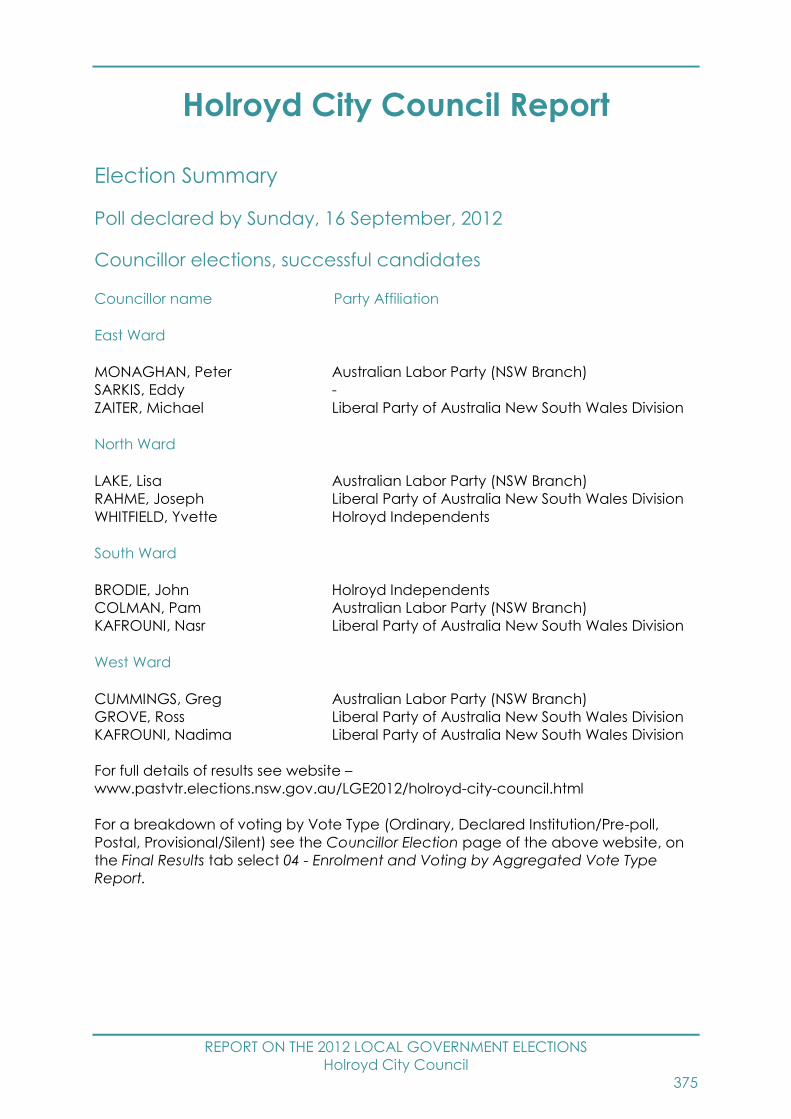
REPORT ON THE 2012 LOCAL GOVERNMENT ELECTIONS
Holroyd City Council
375
Holroyd City Council Report
Election Summary
Poll declared by Sunday, 16 September, 2012
Councillor elections, successful candidates
Councillor name Party Affiliation
East Ward
MONAGHAN, Peter Australian Labor Party (NSW Branch)
SARKIS, Eddy -
ZAITER, Michael Liberal Party of Australia New South Wales Division
North Ward
LAKE, Lisa Australian Labor Party (NSW Branch)
RAHME, Joseph Liberal Party of Australia New South Wales Division
WHITFIELD, Yvette Holroyd Independents
South Ward
BRODIE, John Holroyd Independents
COLMAN, Pam Australian Labor Party (NSW Branch)
KAFROUNI, Nasr Liberal Party of Australia New South Wales Division
West Ward
CUMMINGS, Greg Australian Labor Party (NSW Branch)
GROVE, Ross Liberal Party of Australia New South Wales Division
KAFROUNI, Nadima Liberal Party of Australia New South Wales Division
For full details of results see website –
www.pastvtr.elections.nsw.gov.au/LGE2012/holroyd-city-council.html
For a breakdown of voting by Vote Type (Ordinary, Declared Institution/Pre-poll,
Postal, Provisional/Silent) see the Councillor Election page of the above website, on
the Final Results tab select 04 - Enrolment and Voting by Aggregated Vote Type
Report.

REPORT ON THE 2012 LOCAL GOVERNMENT ELECTIONS
Holroyd City Council
376
Enrolment
Total Electors 63,030
Residential roll 63,025
Non-residential roll 5
SmartRolled Electors 6,594
(30/7/11 – 30/7/12)
Participation and Informality
Participation rate 83.0%
Formal votes 47,966
Informal votes 4,361
Total votes 52,327
Informality rate 8.3%
For details of participation and informality by ward see website –
www.pastvtr.elections.nsw.gov.au/LGE2012/lge-statistics.htm
Failure to Vote
Penalty Notices Issued 7,635
Rate of Failure to Vote57 12.2%
Election Costs
Total Cost of the Holroyd City Council 2012 Election
$388,251.00
Cost per elector
$6.18
Holroyd City Council Statutory Advertising Campaign Expenditure
Nominations $1,782.88
Candidates and polling places $11,664.64
Uncontested elections $0.00
Results $897.28
TOTAL $14,344.80
57 Percentage of Penalty Notices Issued to Enrolment (as shown on Authorised Roll)
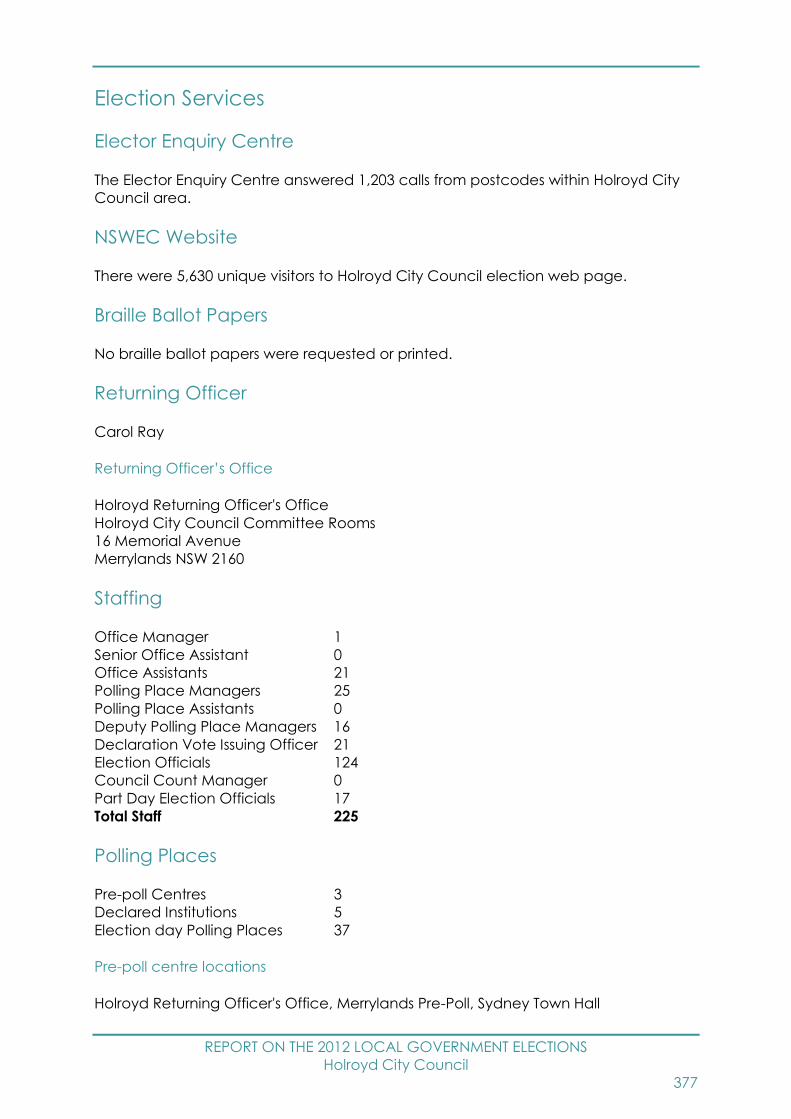
REPORT ON THE 2012 LOCAL GOVERNMENT ELECTIONS
Holroyd City Council
377
Election Services
Elector Enquiry Centre
The Elector Enquiry Centre answered 1,203 calls from postcodes within Holroyd City
Council area.
NSWEC Website
There were 5,630 unique visitors to Holroyd City Council election web page.
Braille Ballot Papers
No braille ballot papers were requested or printed.
Returning Officer
Carol Ray
Returning Officer’s Office
Holroyd Returning Officer's Office
Holroyd City Council Committee Rooms
16 Memorial Avenue
Merrylands NSW 2160
Staffing
Office Manager 1
Senior Office Assistant 0
Office Assistants 21
Polling Place Managers 25
Polling Place Assistants 0
Deputy Polling Place Managers 16
Declaration Vote Issuing Officer 21
Election Officials 124
Council Count Manager 0
Part Day Election Officials 17
Total Staff 225
Polling Places
Pre-poll Centres 3
Declared Institutions 5
Election day Polling Places 37
Pre-poll centre locations
Holroyd Returning Officer's Office, Merrylands Pre-Poll, Sydney Town Hall
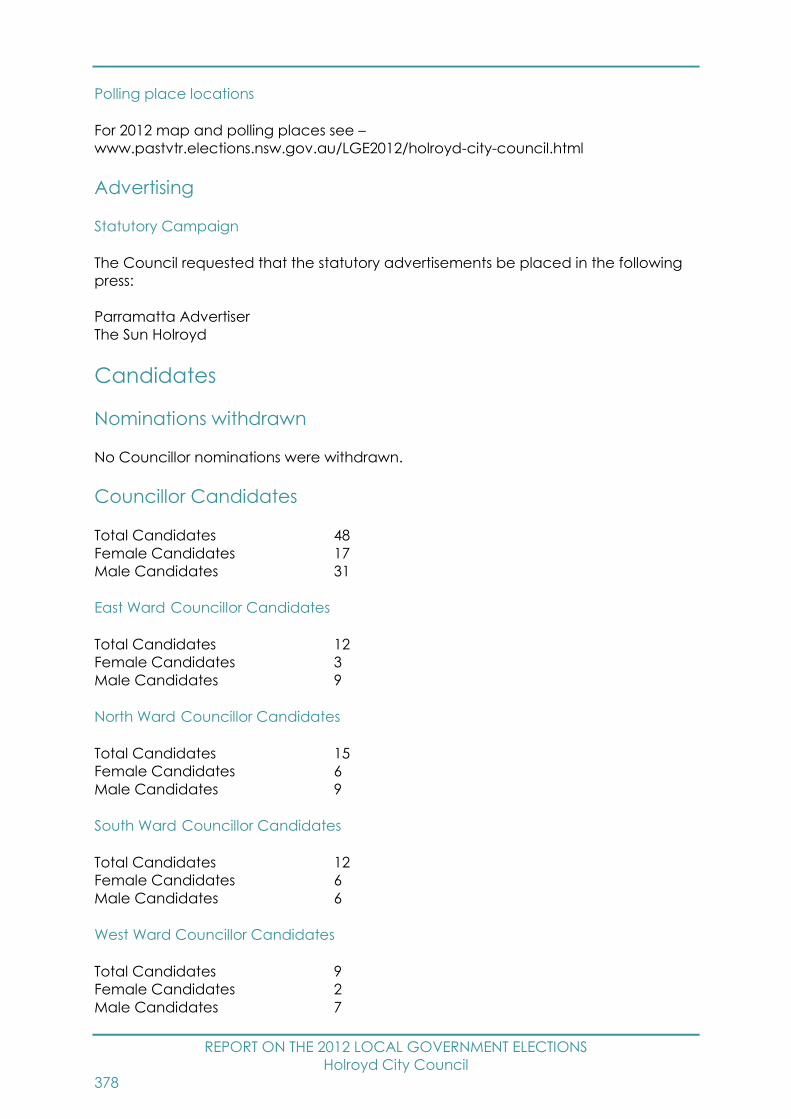
REPORT ON THE 2012 LOCAL GOVERNMENT ELECTIONS
Holroyd City Council
378
Polling place locations
For 2012 map and polling places see –
www.pastvtr.elections.nsw.gov.au/LGE2012/holroyd-city-council.html
Advertising
Statutory Campaign
The Council requested that the statutory advertisements be placed in the following
press:
Parramatta Advertiser
The Sun Holroyd
Candidates
Nominations withdrawn
No Councillor nominations were withdrawn.
Councillor Candidates
Total Candidates 48
Female Candidates 17
Male Candidates 31
East Ward Councillor Candidates
Total Candidates 12
Female Candidates 3
Male Candidates 9
North Ward Councillor Candidates
Total Candidates 15
Female Candidates 6
Male Candidates 9
South Ward Councillor Candidates
Total Candidates 12
Female Candidates 6
Male Candidates 6
West Ward Councillor Candidates
Total Candidates 9
Female Candidates 2
Male Candidates 7

REPORT ON THE 2012 LOCAL GOVERNMENT ELECTIONS
Holroyd City Council
379
Names of all candidates
Councillor Candidates Party Affiliation
East Ward
BOBB, Peter Liberal Party of Australia New South Wales Division
HON, Pik Unity Party
KALTOUM, Sandra Australian Labor Party (NSW Branch)
KARAM, Georges -
MIKHA, Elhaam Liberal Party of Australia New South Wales Division
MONAGHAN, Peter Australian Labor Party (NSW Branch)
PERERA, Beth Unity Party
PIGRAM, Ryan -
SARKIS, Eddy -
SHAHZAD, Amir Unity Party
VENKATARANGAN, Balaji Australian Labor Party (NSW Branch)
ZAITER, Michael Liberal Party of Australia New South Wales Division
North Ward
BASKARAN, Ram -
CARLINO, Sam Holroyd Independents
JEMAA, Lara Liberal Party of Australia New South Wales Division
LAKE, Lisa Australian Labor Party (NSW Branch)
LOHAN, Sumit Liberal Party of Australia New South Wales Division
MAROUN, Rita -
PIGRAM, Mark -
RAHME, Joseph Liberal Party of Australia New South Wales Division
RAJADURAI, Vasee Australian Labor Party (NSW Branch)
RITCHIE, Gregg -
SARKIS, Rima -
SRINIVASAN, Sampathkumar -
VERMA, Jitendra Australian Labor Party (NSW Branch)
WHITFIELD, Yvette Holroyd Independents
ZDJELAR, Mira Holroyd Independents
South Ward
BECHARA, Eptesam -
BRODIE, John Holroyd Independents
CHAHINE, Anaisa Liberal Party of Australia New South Wales Division
COLMAN, Pam Australian Labor Party (NSW Branch)
COUCHMAN, Allison Holroyd Independents
EASTWOOD, Jim Holroyd Independents
HORDER, Ray -
KAFROUNI, Nasr Liberal Party of Australia New South Wales Division
KHODR AGHA, Mustafa Australian Labor Party (NSW Branch)
KHOURY, George Liberal Party of Australia New South Wales Division
KIRBY, Gillian -
WILLIAMS, Melissa Australian Labor Party (NSW Branch)
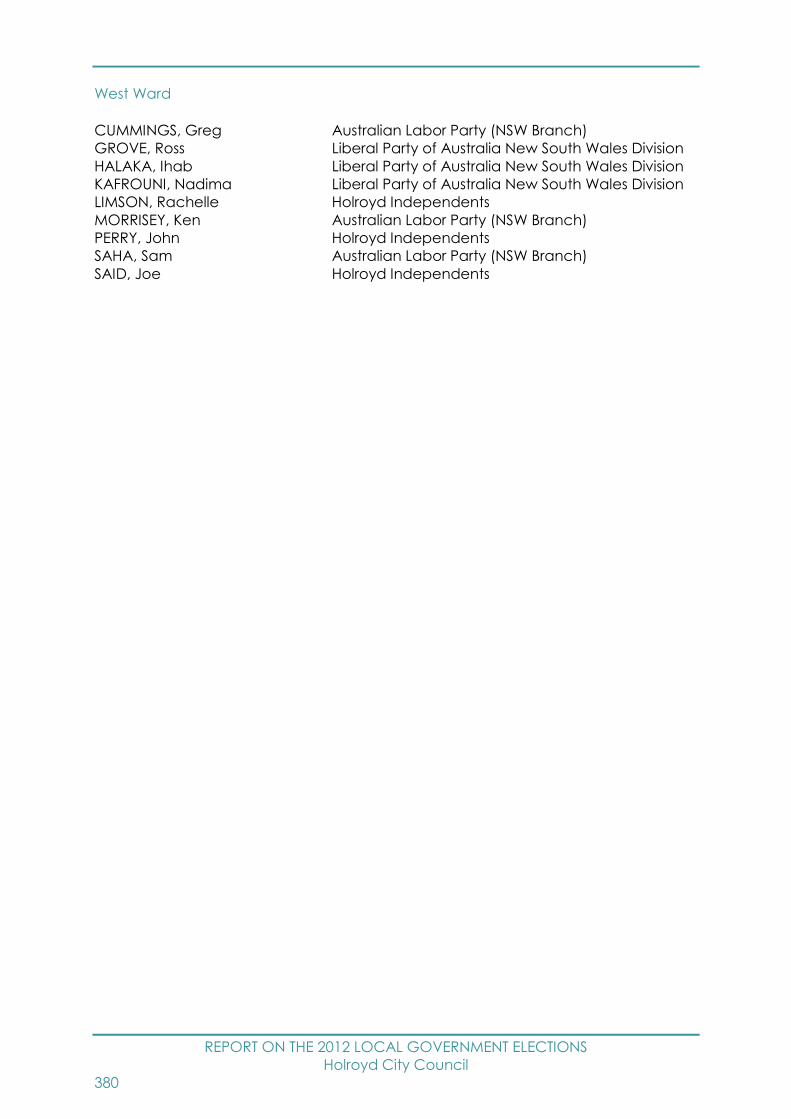
REPORT ON THE 2012 LOCAL GOVERNMENT ELECTIONS
Holroyd City Council
380
West Ward
CUMMINGS, Greg Australian Labor Party (NSW Branch)
GROVE, Ross Liberal Party of Australia New South Wales Division
HALAKA, Ihab Liberal Party of Australia New South Wales Division
KAFROUNI, Nadima Liberal Party of Australia New South Wales Division
LIMSON, Rachelle Holroyd Independents
MORRISEY, Ken Australian Labor Party (NSW Branch)
PERRY, John Holroyd Independents
SAHA, Sam Australian Labor Party (NSW Branch)
SAID, Joe Holroyd Independents
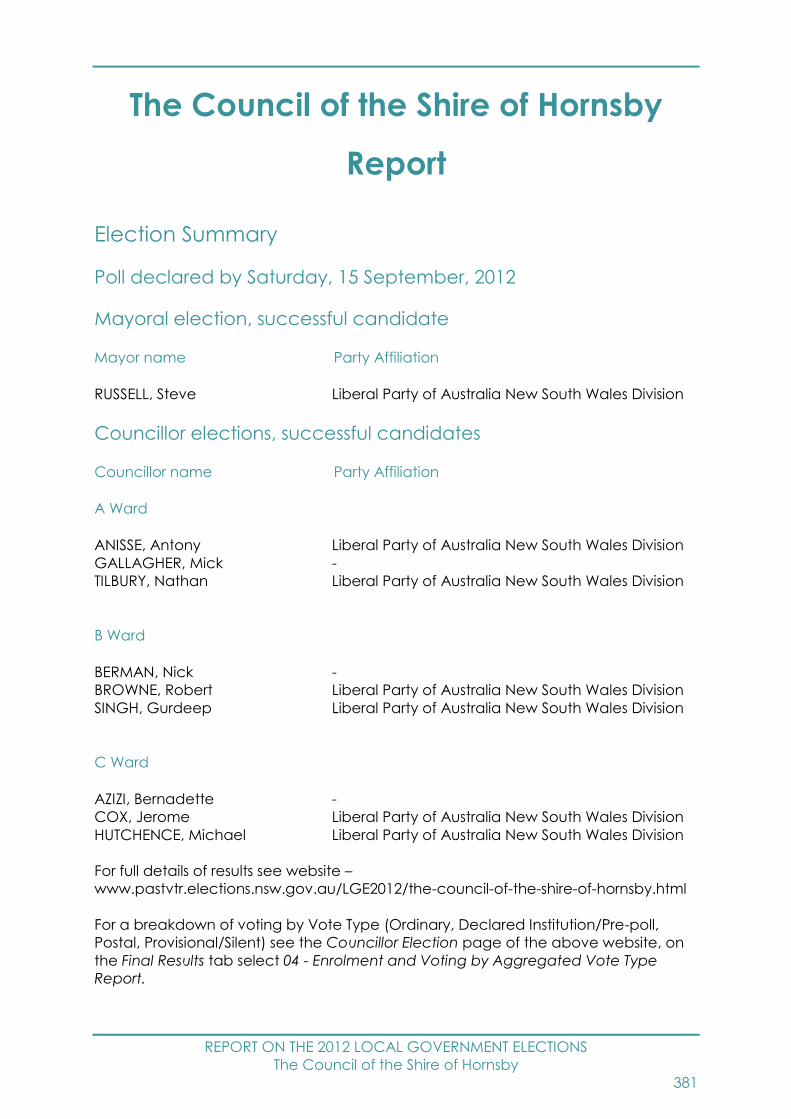
REPORT ON THE 2012 LOCAL GOVERNMENT ELECTIONS
The Council of the Shire of Hornsby
381
The Council of the Shire of Hornsby
Report
Election Summary
Poll declared by Saturday, 15 September, 2012
Mayoral election, successful candidate
Mayor name Party Affiliation
RUSSELL, Steve Liberal Party of Australia New South Wales Division
Councillor elections, successful candidates
Councillor name Party Affiliation
A Ward
ANISSE, Antony Liberal Party of Australia New South Wales Division
GALLAGHER, Mick -
TILBURY, Nathan Liberal Party of Australia New South Wales Division
B Ward
BERMAN, Nick -
BROWNE, Robert Liberal Party of Australia New South Wales Division
SINGH, Gurdeep Liberal Party of Australia New South Wales Division
C Ward
AZIZI, Bernadette -
COX, Jerome Liberal Party of Australia New South Wales Division
HUTCHENCE, Michael Liberal Party of Australia New South Wales Division
For full details of results see website –
www.pastvtr.elections.nsw.gov.au/LGE2012/the-council-of-the-shire-of-hornsby.html
For a breakdown of voting by Vote Type (Ordinary, Declared Institution/Pre-poll,
Postal, Provisional/Silent) see the Councillor Election page of the above website, on
the Final Results tab select 04 - Enrolment and Voting by Aggregated Vote Type
Report.
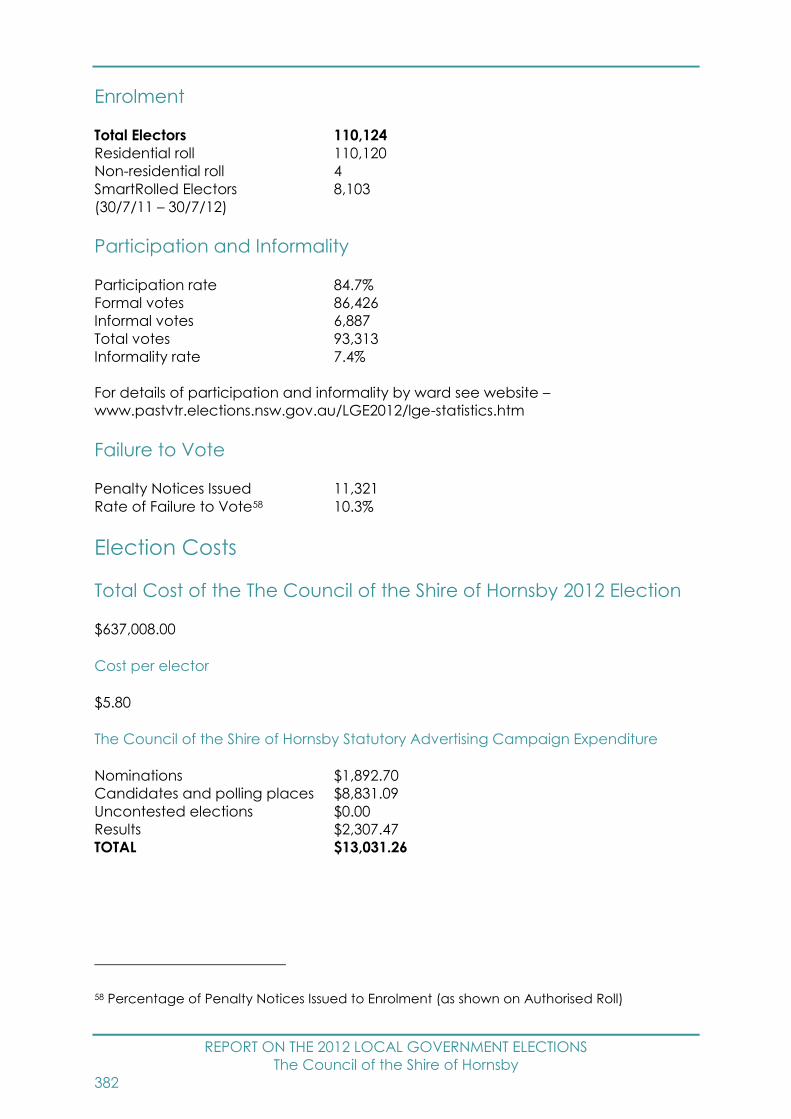
REPORT ON THE 2012 LOCAL GOVERNMENT ELECTIONS
The Council of the Shire of Hornsby
382
Enrolment
Total Electors 110,124
Residential roll 110,120
Non-residential roll 4
SmartRolled Electors 8,103
(30/7/11 – 30/7/12)
Participation and Informality
Participation rate 84.7%
Formal votes 86,426
Informal votes 6,887
Total votes 93,313
Informality rate 7.4%
For details of participation and informality by ward see website –
www.pastvtr.elections.nsw.gov.au/LGE2012/lge-statistics.htm
Failure to Vote
Penalty Notices Issued 11,321
Rate of Failure to Vote58 10.3%
Election Costs
Total Cost of the The Council of the Shire of Hornsby 2012 Election
$637,008.00
Cost per elector
$5.80
The Council of the Shire of Hornsby Statutory Advertising Campaign Expenditure
Nominations $1,892.70
Candidates and polling places $8,831.09
Uncontested elections $0.00
Results $2,307.47
TOTAL $13,031.26
58 Percentage of Penalty Notices Issued to Enrolment (as shown on Authorised Roll)

REPORT ON THE 2012 LOCAL GOVERNMENT ELECTIONS
The Council of the Shire of Hornsby
383
Election Services
Elector Enquiry Centre
The Elector Enquiry Centre answered 2,555 calls from postcodes within The Council of
the Shire of Hornsby area.
NSWEC Website
There were 10,970 unique visitors to The Council of the Shire of Hornsby election web
page.
Braille Ballot Papers
No braille ballot papers were requested or printed.
Returning Officer
Sandra Ollington
Returning Officer’s Office
Hornsby Returning Officer's Office
Hornsby Council Chambers
296 Pacific Highway
Hornsby NSW 2077
Staffing
Office Manager 1
Senior Office Assistant 0
Office Assistants 48
Polling Place Managers 47
Polling Place Assistants 9
Deputy Polling Place Managers 24
Declaration Vote Issuing Officer 28
Election Officials 190
Council Count Manager 7
Part Day Election Officials 24
Total Staff 378
Polling Places
Pre-poll Centres 3
Declared Institutions 15
Election day Polling Places 58
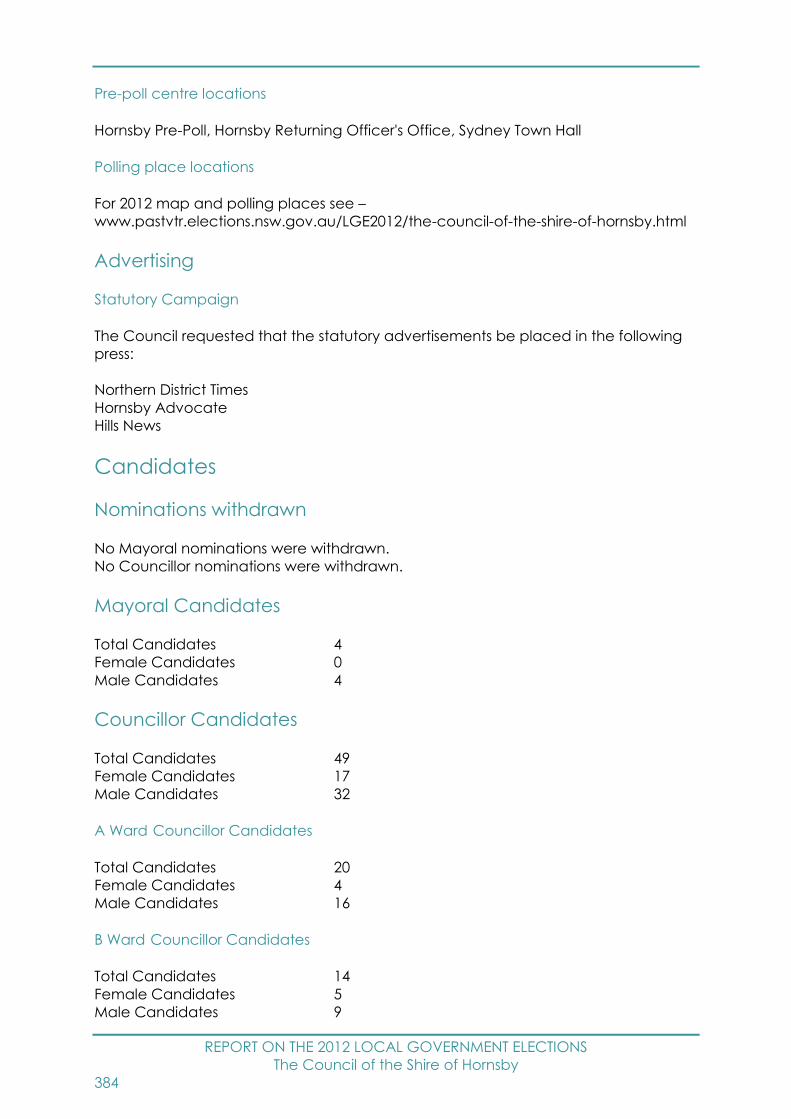
REPORT ON THE 2012 LOCAL GOVERNMENT ELECTIONS
The Council of the Shire of Hornsby
384
Pre-poll centre locations
Hornsby Pre-Poll, Hornsby Returning Officer's Office, Sydney Town Hall
Polling place locations
For 2012 map and polling places see –
www.pastvtr.elections.nsw.gov.au/LGE2012/the-council-of-the-shire-of-hornsby.html
Advertising
Statutory Campaign
The Council requested that the statutory advertisements be placed in the following
press:
Northern District Times
Hornsby Advocate
Hills News
Candidates
Nominations withdrawn
No Mayoral nominations were withdrawn.
No Councillor nominations were withdrawn.
Mayoral Candidates
Total Candidates 4
Female Candidates 0
Male Candidates 4
Councillor Candidates
Total Candidates 49
Female Candidates 17
Male Candidates 32
A Ward Councillor Candidates
Total Candidates 20
Female Candidates 4
Male Candidates 16
B Ward Councillor Candidates
Total Candidates 14
Female Candidates 5
Male Candidates 9

REPORT ON THE 2012 LOCAL GOVERNMENT ELECTIONS
The Council of the Shire of Hornsby
385
C Ward Councillor Candidates
Total Candidates 15
Female Candidates 8
Male Candidates 7
Names of all candidates
Mayoral Candidates Party Affiliation
BERMAN, Nick -
GALLAGHER, Mick -
RUSSELL, Steve Liberal Party of Australia New South Wales Division
WHELAN, Peter Liberal Democratic Party
Councillor Candidates Party Affiliation
A Ward
ALLEN, Darryl Christian Democratic Party (Fred Nile Group)
ANISSE, Antony Liberal Party of Australia New South Wales Division
BETTS, Clare -
BOULT, Richard The Greens
BRADLEY, Michael The Greens
CHOPRA, Dilip Liberal Party of Australia New South Wales Division
COMB, Kristy -
GALLAGHER, Mick -
GREENWOOD-GRAHAM, Jeremy -
GREENWOOD-GRAHAM, Verity -
KINGSMILL, John Christian Democratic Party (Fred Nile Group)
KLIMCZYK, Varise -
NAYAK, Varun -
ROSCAREL, Keith -
RUSSELL, Steve Liberal Party of Australia New South Wales Division
SMART, Mick -
STOREY, John The Greens
THEW, Leighton Christian Democratic Party (Fred Nile Group)
TILBURY, Nathan Liberal Party of Australia New South Wales Division
TUFT, Andrew -
B Ward
BERMAN, Nick -
BROWNE, Robert Liberal Party of Australia New South Wales Division
CROSS, Sherrie The Greens
ELLINAS, George -
GOONETILLEKA, Gamani -
KAUR, Avtar Liberal Party of Australia New South Wales Division
LAUGHLIN, Sarah -
NAGY, Joe -
SINGH, Gurdeep Liberal Party of Australia New South Wales Division

REPORT ON THE 2012 LOCAL GOVERNMENT ELECTIONS
The Council of the Shire of Hornsby
386
SMITH, Lee -
SOWTER, Paul The Greens
TATTERSALL, Lara -
TUIT, Ian The Greens
WU, Linda -
C Ward
AZIZI, Bernadette -
BATEMAN, Grahame -
BERMAN, Christine -
BRADLEY, Michael -
COX, Jerome Liberal Party of Australia New South Wales Division
CROKER, Jennifer Liberal Party of Australia New South Wales Division
DOLPHIN, Rob Liberal Democratic Party
ELLIS, Janet The Greens
FINDLAY, Felicity Liberal Party of Australia New South Wales Division
FOWLER, Graham Liberal Democratic Party
HEYDE, Emma The Greens
HUTCHENCE, Michael Liberal Party of Australia New South Wales Division
McMURDO, Wendy The Greens
NICHOLS, Sandra -
WHELAN, Peter Liberal Democratic Party

REPORT ON THE 2012 LOCAL GOVERNMENT ELECTIONS
The Council of the Municipality of Hunters Hill
387
The Council of the Municipality of
Hunters Hill Report
Election Summary
Poll declared by Saturday, 15 September, 2012
Mayoral election, successful candidate
Mayor name Party Affiliation
QUINN, Richard -
Councillor elections, successful candidates
Councillor name Party Affiliation
North Ward
ASTRIDGE, Peter -
BENNETT, Mark -
BIRD, Gary -
South Ward
MILES, Zac -
McLAUGHLIN, Justine -
SHEIL, Meredith -
For full details of results see website –
www.pastvtr.elections.nsw.gov.au/LGE2012/the-council-of-the-municipality-of-
hunters-hill.html
For a breakdown of voting by Vote Type (Ordinary, Declared Institution/Pre-poll,
Postal, Provisional/Silent) see the Councillor Election page of the above website, on
the Final Results tab select 04 - Enrolment and Voting by Aggregated Vote Type
Report.
Enrolment
Total Electors 9,516
Residential roll 9,515
Non-residential roll 1
SmartRolled Electors 765
(30/7/11 – 30/7/12)
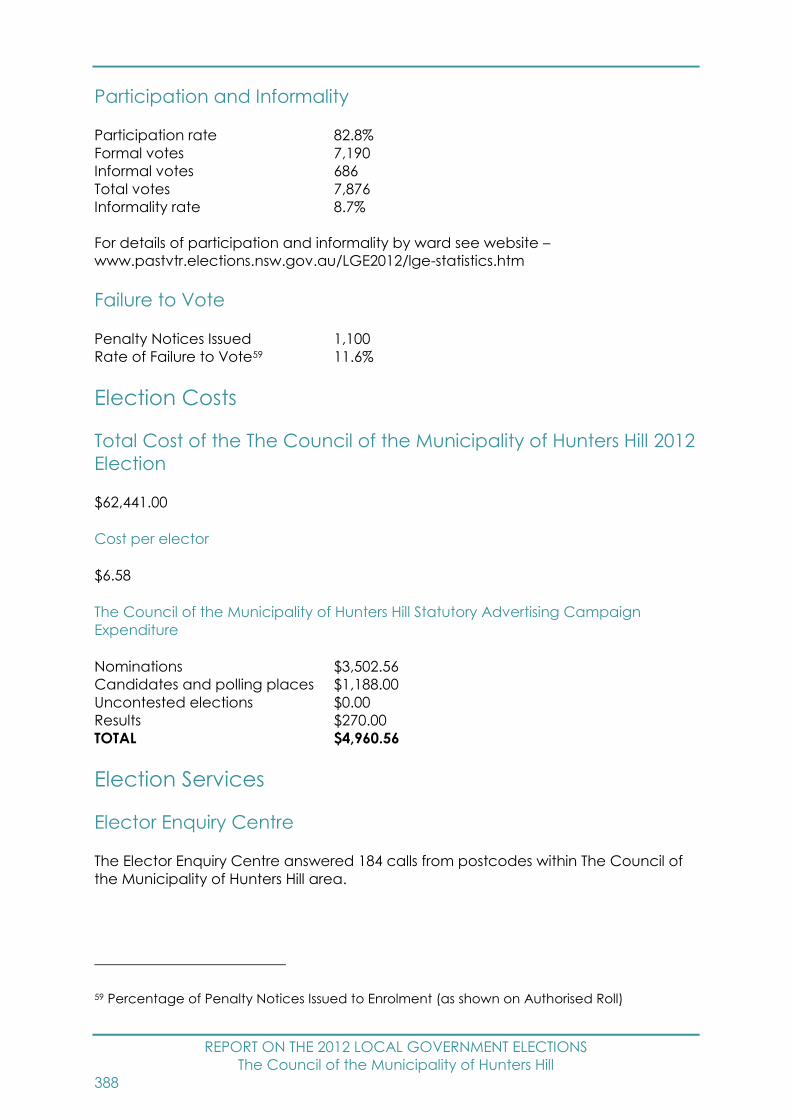
REPORT ON THE 2012 LOCAL GOVERNMENT ELECTIONS
The Council of the Municipality of Hunters Hill
388
Participation and Informality
Participation rate 82.8%
Formal votes 7,190
Informal votes 686
Total votes 7,876
Informality rate 8.7%
For details of participation and informality by ward see website –
www.pastvtr.elections.nsw.gov.au/LGE2012/lge-statistics.htm
Failure to Vote
Penalty Notices Issued 1,100
Rate of Failure to Vote59 11.6%
Election Costs
Total Cost of the The Council of the Municipality of Hunters Hill 2012
Election
$62,441.00
Cost per elector
$6.58
The Council of the Municipality of Hunters Hill Statutory Advertising Campaign
Expenditure
Nominations $3,502.56
Candidates and polling places $1,188.00
Uncontested elections $0.00
Results $270.00
TOTAL $4,960.56
Election Services
Elector Enquiry Centre
The Elector Enquiry Centre answered 184 calls from postcodes within The Council of
the Municipality of Hunters Hill area.
59 Percentage of Penalty Notices Issued to Enrolment (as shown on Authorised Roll)
REPORT ON THE 2012 LOCAL GOVERNMENT ELECTIONS
The Council of the Municipality of Hunters Hill
389
NSWEC Website
There were 1,246 unique visitors to The Council of the Municipality of Hunters Hill
election web page.
Braille Ballot Papers
No braille ballot papers were requested or printed.
Returning Officer
Karen Firestone
Returning Officer’s Office
Canada Bay Region Returning Officer's Office
142 Great North Road
Five Dock NSW 2046
Councils in Region
Canada Bay City Council and Hunters Hill Council
Staffing
Office Manager 1
Senior Office Assistant 0
Office Assistants 0
Polling Place Managers 7
Polling Place Assistants 2
Deputy Polling Place Managers 0
Declaration Vote Issuing Officer 0
Election Officials 15
Council Count Manager 2
Part Day Election Officials 1
Total Staff 28
Polling Places
Pre-poll Centres 3
Declared Institutions 5
Election day Polling Places 10
Pre-poll centre locations
Canada Bay Region Returning Officer's Office, Hunters Hill Pre-Poll, Sydney Town Hall
REPORT ON THE 2012 LOCAL GOVERNMENT ELECTIONS
The Council of the Municipality of Hunters Hill
390
Polling place locations
For 2012 map and polling places see –
www.pastvtr.elections.nsw.gov.au/LGE2012/the-council-of-the-municipality-of-
hunters-hill.html
Advertising
Statutory Campaign
The Council requested that the statutory advertisements be placed in the following
press:
Northern District Times
The Weekly Times
Candidates
Nominations withdrawn
No Mayoral nominations were withdrawn.
No Councillor nominations were withdrawn.
Mayoral Candidates
Total Candidates 4
Female Candidates 1
Male Candidates 3
Councillor Candidates
Total Candidates 23
Female Candidates 5
Male Candidates 18
North Ward Councillor Candidates
Total Candidates 10
Female Candidates 0
Male Candidates 10
South Ward Councillor Candidates
Total Candidates 13
Female Candidates 5
Male Candidates 8
REPORT ON THE 2012 LOCAL GOVERNMENT ELECTIONS
The Council of the Municipality of Hunters Hill
391
Names of all candidates
Mayoral Candidates Party Affiliation
ASTRIDGE, Peter -
QUINN, Richard -
SHEERIN, Ross -
SHEIL, Meredith -
Councillor Candidates Party Affiliation
North Ward
ASTRIDGE, Peter -
BATSHON, Bassam -
BENNETT, Mark -
BIRD, Gary -
BUTT, Murray -
EDDINGTON, Trent -
QUINN, Richard -
VELO, Peter -
VITAS, Nenad -
WARNER, Peter -
South Ward
AMOS, Charles -
CLAXTON, Julian -
CROLL, Annabel -
HINDS, Joan-Mary -
JOYCE, Anastasia -
LIN, Jason -
McLAUGHLIN, Justine -
MESSINA, Vince -
MILES, Zac -
SANDERSON, Jim -
SHEERIN, Ross -
SHEIL, Meredith -
SHERMAN, Matt -

REPORT ON THE 2012 LOCAL GOVERNMENT ELECTIONS
Hurstville City Council
392
Hurstville City Council Report
Election Summary
Poll declared by Friday, 14 September, 2012
Councillor elections, successful candidates
Councillor name Party Affiliation
Hurstville Ward
BADALATI, Vince Australian Labor Party (NSW Branch)
DRANE, Colin Australian Labor Party (NSW Branch)
ISTEPHAN, Andrew Liberal Party of Australia New South Wales Division
LIU, Nancy Unity Party
Peakhurst Ward
JACOVOU, Jack Liberal Party of Australia New South Wales Division
KASTANIAS, Rita -
SANSOM, Philip -
STEVENS, Michelle Australian Labor Party (NSW Branch)
Penshurst Ward
HINDI, Con Liberal Party of Australia New South Wales Division
MINING, Justin Australian Labor Party (NSW Branch)
SIN, Dominic Australian Labor Party (NSW Branch)
WU, Christina Liberal Party of Australia New South Wales Division
For full details of results see website –
www.pastvtr.elections.nsw.gov.au/LGE2012/hurstville-city-council.html
For a breakdown of voting by Vote Type (Ordinary, Declared Institution/Pre-poll,
Postal, Provisional/Silent) see the Councillor Election page of the above website, on
the Final Results tab select 04 - Enrolment and Voting by Aggregated Vote Type
Report.
Enrolment
Total Electors 53,794
Residential roll 53,782
Non-residential roll 12
SmartRolled Electors 4,418
(30/7/11 – 30/7/12)

REPORT ON THE 2012 LOCAL GOVERNMENT ELECTIONS
Hurstville City Council
393
Participation and Informality
Participation rate 84.6%
Formal votes 41,550
Informal votes 3,960
Total votes 45,510
Informality rate 8.7%
For details of participation and informality by ward see website –
www.pastvtr.elections.nsw.gov.au/LGE2012/lge-statistics.htm
Failure to Vote
Penalty Notices Issued 5,486
Rate of Failure to Vote60 10.2%
Election Costs
Total Cost of the Hurstville City Council 2012 Election
$332,160.00
Cost per elector
$6.19
Hurstville City Council Statutory Advertising Campaign Expenditure
Nominations $359.93
Candidates and polling places $3,220.80
Uncontested elections $0.00
Results $445.50
TOTAL $4,026.23
Election Services
Elector Enquiry Centre
The Elector Enquiry Centre answered 1,144 calls from postcodes within Hurstville City
Council area.
NSWEC Website
There were 5,852 unique visitors to Hurstville City Council election web page.
60 Percentage of Penalty Notices Issued to Enrolment (as shown on Authorised Roll)
REPORT ON THE 2012 LOCAL GOVERNMENT ELECTIONS
Hurstville City Council
394
Braille Ballot Papers
Two braille ballot papers were requested or printed.
Returning Officer
Victor Grasty
Returning Officer’s Office
Hurstville Returning Officer's Office
Suite 404, 4-8 Woodville Street
Hurstville NSW 2220
Staffing
Office Manager 1
Senior Office Assistant 0
Office Assistants 24
Polling Place Managers 22
Polling Place Assistants 0
Deputy Polling Place Managers 16
Declaration Vote Issuing Officer 15
Election Officials 112
Council Count Manager 0
Part Day Election Officials 16
Total Staff 206
Polling Places
Pre-poll Centres 2
Declared Institutions 4
Election day Polling Places 32
Pre-poll centre locations
Hurstville Returning Officer's Office, Sydney Town Hall
Polling place locations
For 2012 map and polling places see –
www.pastvtr.elections.nsw.gov.au/LGE2012/hurstville-city-council.html
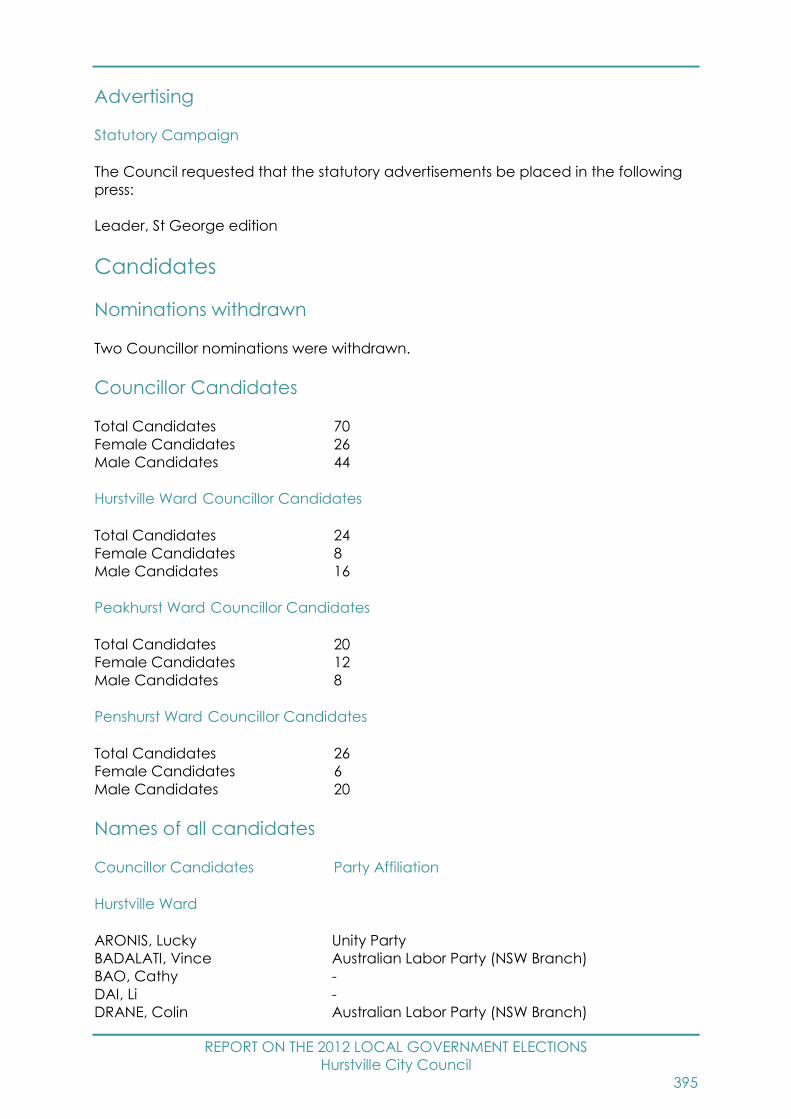
REPORT ON THE 2012 LOCAL GOVERNMENT ELECTIONS
Hurstville City Council
395
Advertising
Statutory Campaign
The Council requested that the statutory advertisements be placed in the following
press:
Leader, St George edition
Candidates
Nominations withdrawn
Two Councillor nominations were withdrawn.
Councillor Candidates
Total Candidates 70
Female Candidates 26
Male Candidates 44
Hurstville Ward Councillor Candidates
Total Candidates 24
Female Candidates 8
Male Candidates 16
Peakhurst Ward Councillor Candidates
Total Candidates 20
Female Candidates 12
Male Candidates 8
Penshurst Ward Councillor Candidates
Total Candidates 26
Female Candidates 6
Male Candidates 20
Names of all candidates
Councillor Candidates Party Affiliation
Hurstville Ward
ARONIS, Lucky Unity Party
BADALATI, Vince Australian Labor Party (NSW Branch)
BAO, Cathy -
DAI, Li -
DRANE, Colin Australian Labor Party (NSW Branch)
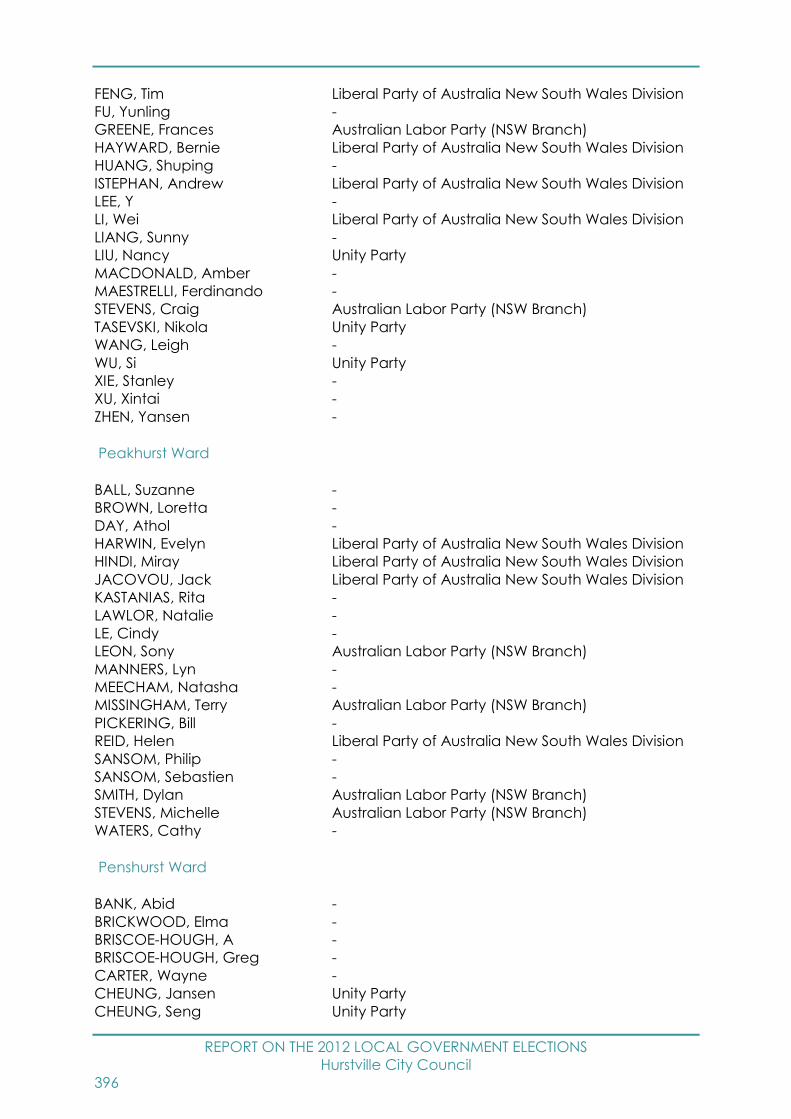
REPORT ON THE 2012 LOCAL GOVERNMENT ELECTIONS
Hurstville City Council
396
FENG, Tim Liberal Party of Australia New South Wales Division
FU, Yunling -
GREENE, Frances Australian Labor Party (NSW Branch)
HAYWARD, Bernie Liberal Party of Australia New South Wales Division
HUANG, Shuping -
ISTEPHAN, Andrew Liberal Party of Australia New South Wales Division
LEE, Y -
LI, Wei Liberal Party of Australia New South Wales Division
LIANG, Sunny -
LIU, Nancy Unity Party
MACDONALD, Amber -
MAESTRELLI, Ferdinando -
STEVENS, Craig Australian Labor Party (NSW Branch)
TASEVSKI, Nikola Unity Party
WANG, Leigh -
WU, Si Unity Party
XIE, Stanley -
XU, Xintai -
ZHEN, Yansen -
Peakhurst Ward
BALL, Suzanne -
BROWN, Loretta -
DAY, Athol -
HARWIN, Evelyn Liberal Party of Australia New South Wales Division
HINDI, Miray Liberal Party of Australia New South Wales Division
JACOVOU, Jack Liberal Party of Australia New South Wales Division
KASTANIAS, Rita -
LAWLOR, Natalie -
LE, Cindy -
LEON, Sony Australian Labor Party (NSW Branch)
MANNERS, Lyn -
MEECHAM, Natasha -
MISSINGHAM, Terry Australian Labor Party (NSW Branch)
PICKERING, Bill -
REID, Helen Liberal Party of Australia New South Wales Division
SANSOM, Philip -
SANSOM, Sebastien -
SMITH, Dylan Australian Labor Party (NSW Branch)
STEVENS, Michelle Australian Labor Party (NSW Branch)
WATERS, Cathy -
Penshurst Ward
BANK, Abid -
BRICKWOOD, Elma -
BRISCOE-HOUGH, A -
BRISCOE-HOUGH, Greg -
CARTER, Wayne -
CHEUNG, Jansen Unity Party
CHEUNG, Seng Unity Party
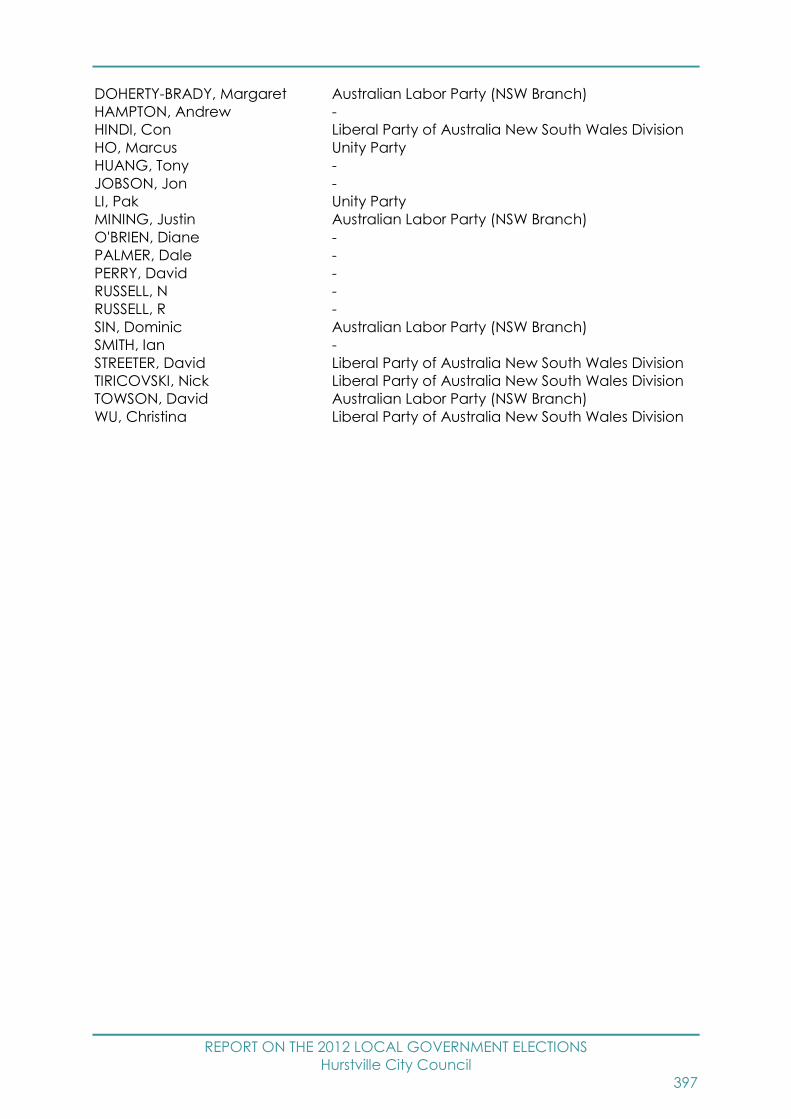
REPORT ON THE 2012 LOCAL GOVERNMENT ELECTIONS
Hurstville City Council
397
DOHERTY-BRADY, Margaret Australian Labor Party (NSW Branch)
HAMPTON, Andrew -
HINDI, Con Liberal Party of Australia New South Wales Division
HO, Marcus Unity Party
HUANG, Tony -
JOBSON, Jon -
LI, Pak Unity Party
MINING, Justin Australian Labor Party (NSW Branch)
O'BRIEN, Diane -
PALMER, Dale -
PERRY, David -
RUSSELL, N -
RUSSELL, R -
SIN, Dominic Australian Labor Party (NSW Branch)
SMITH, Ian -
STREETER, David Liberal Party of Australia New South Wales Division
TIRICOVSKI, Nick Liberal Party of Australia New South Wales Division
TOWSON, David Australian Labor Party (NSW Branch)
WU, Christina Liberal Party of Australia New South Wales Division

REPORT ON THE 2012 LOCAL GOVERNMENT ELECTIONS
Inverell Shire Council
398
Inverell Shire Council Report
Election Summary
Poll declared by Saturday, 15 September, 2012
Councillor elections, successful candidates
Councillor name Party Affiliation
BAKER, Di -
CASTLEDINE, Harold -
GIRLE, Phillip -
HARMON, Paul -
JOHNSTON, Barry -
JONES, David -
MICHAEL, Anthony -
PETERS, Mal -
WATTS, Jacki -
For full details of results see website –
www.pastvtr.elections.nsw.gov.au/LGE2012/inverell-shire-council.html
For a breakdown of voting by Vote Type (Ordinary, Declared Institution/Pre-poll,
Postal, Provisional/Silent) see the Councillor Election page of the above website, on
the Final Results tab select 04 - Enrolment and Voting by Aggregated Vote Type
Report.
Enrolment
Total Electors 11,384
Residential roll 11,383
Non-residential roll 1
SmartRolled Electors 798
(30/7/11 – 30/7/12)
Participation and Informality
Participation rate 84.9%
Formal votes 9,199
Informal votes 464
Total votes 9,663
Informality rate 4.8%
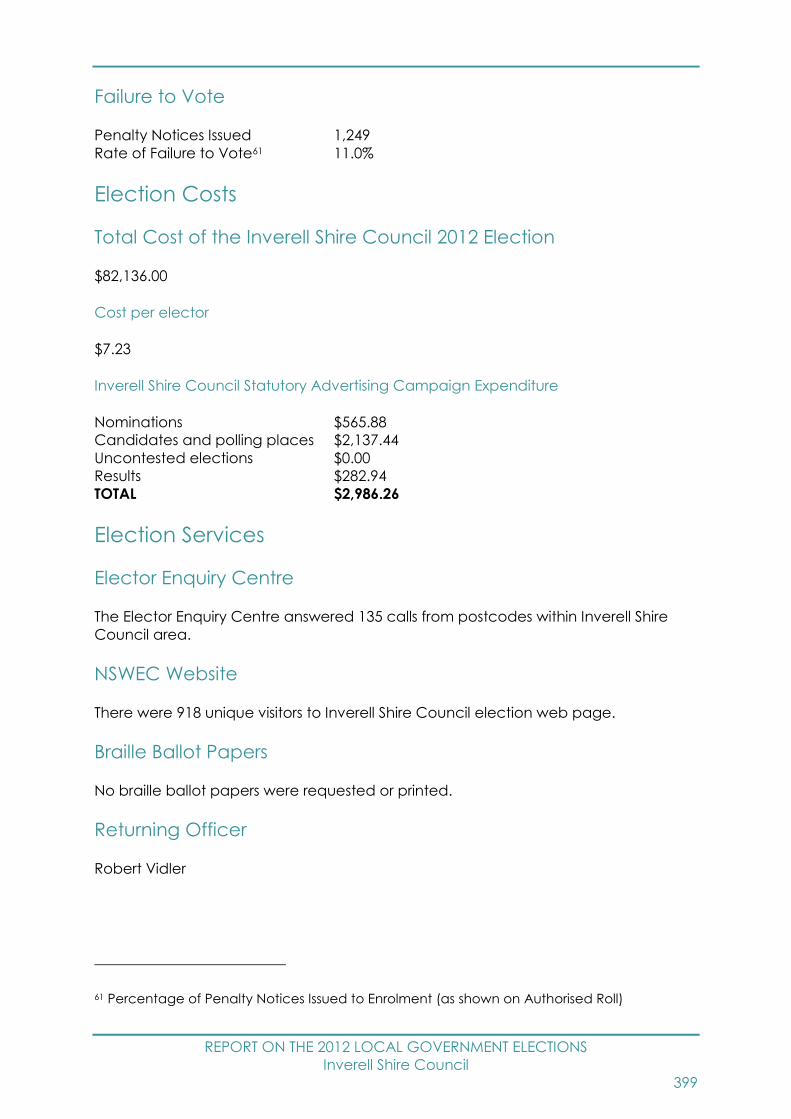
REPORT ON THE 2012 LOCAL GOVERNMENT ELECTIONS
Inverell Shire Council
399
Failure to Vote
Penalty Notices Issued 1,249
Rate of Failure to Vote61 11.0%
Election Costs
Total Cost of the Inverell Shire Council 2012 Election
$82,136.00
Cost per elector
$7.23
Inverell Shire Council Statutory Advertising Campaign Expenditure
Nominations $565.88
Candidates and polling places $2,137.44
Uncontested elections $0.00
Results $282.94
TOTAL $2,986.26
Election Services
Elector Enquiry Centre
The Elector Enquiry Centre answered 135 calls from postcodes within Inverell Shire
Council area.
NSWEC Website
There were 918 unique visitors to Inverell Shire Council election web page.
Braille Ballot Papers
No braille ballot papers were requested or printed.
Returning Officer
Robert Vidler
61 Percentage of Penalty Notices Issued to Enrolment (as shown on Authorised Roll)

REPORT ON THE 2012 LOCAL GOVERNMENT ELECTIONS
Inverell Shire Council
400
Returning Officer’s Office
Glen Innes Region Returning Officer's Office
Glen Innes Town Hall
265 Grey Street
Glen Innes NSW 2370
Councils in Region
Glen Innes Severn Council, Inverell Shire Council and Tenterfield Shire Council
Staffing
Office Manager 0
Senior Office Assistant 0
Office Assistants 0
Polling Place Managers 8
Polling Place Assistants 0
Deputy Polling Place Managers 1
Declaration Vote Issuing Officer 0
Election Officials 16
Council Count Manager 0
Part Day Election Officials 2
Total Staff 27
Polling Places
Pre-poll Centres 3
Declared Institutions 2
Election day Polling Places 9
Pre-poll centre locations
Glen Innes Region Returning Officer's Office, Inverell Pre-Poll, Sydney Town Hall
Polling place locations
For 2012 map and polling places see –
www.pastvtr.elections.nsw.gov.au/LGE2012/inverell-shire-council.html
Advertising
Statutory Campaign
The Council requested that the statutory advertisements be placed in the following
press:
The Inverell Times

REPORT ON THE 2012 LOCAL GOVERNMENT ELECTIONS
Inverell Shire Council
401
Candidates
Nominations withdrawn
No Councillor nominations were withdrawn.
Councillor Candidates
Total Candidates 12
Female Candidates 2
Male Candidates 10
Names of all candidates
Councillor Candidates Party Affiliation
BAKER, Di -
CASTLEDINE, Harold -
GAUKROGER, Simon -
GIRLE, Phillip -
HARMON, Paul -
JOHNSTON, Barry -
JONES, David -
McNEIL, Mark -
MICHAEL, Anthony -
NEWLEY, Garry -
PETERS, Mal -
WATTS, Jacki -
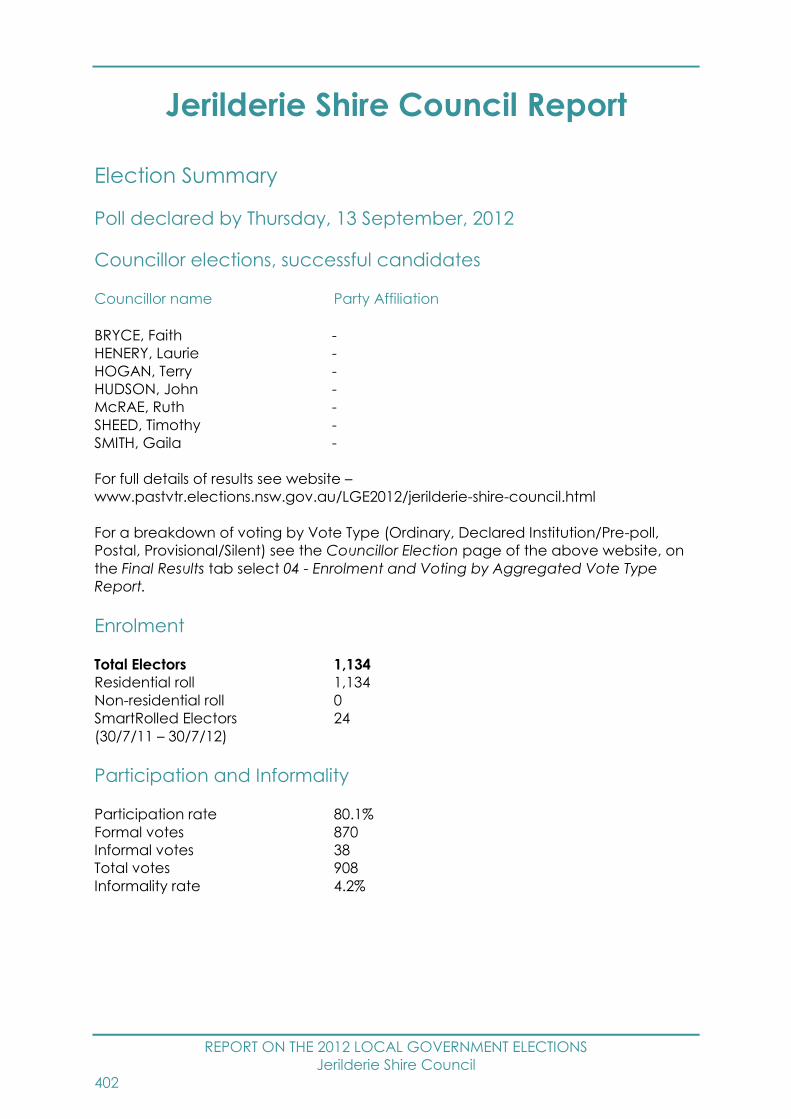
REPORT ON THE 2012 LOCAL GOVERNMENT ELECTIONS
Jerilderie Shire Council
402
Jerilderie Shire Council Report
Election Summary
Poll declared by Thursday, 13 September, 2012
Councillor elections, successful candidates
Councillor name Party Affiliation
BRYCE, Faith -
HENERY, Laurie -
HOGAN, Terry -
HUDSON, John -
McRAE, Ruth -
SHEED, Timothy -
SMITH, Gaila -
For full details of results see website –
www.pastvtr.elections.nsw.gov.au/LGE2012/jerilderie-shire-council.html
For a breakdown of voting by Vote Type (Ordinary, Declared Institution/Pre-poll,
Postal, Provisional/Silent) see the Councillor Election page of the above website, on
the Final Results tab select 04 - Enrolment and Voting by Aggregated Vote Type
Report.
Enrolment
Total Electors 1,134
Residential roll 1,134
Non-residential roll 0
SmartRolled Electors 24
(30/7/11 – 30/7/12)
Participation and Informality
Participation rate 80.1%
Formal votes 870
Informal votes 38
Total votes 908
Informality rate 4.2%

REPORT ON THE 2012 LOCAL GOVERNMENT ELECTIONS
Jerilderie Shire Council
403
Failure to Vote
Penalty Notices Issued 160
Rate of Failure to Vote62 14.1%
Election Costs
Total Cost of the Jerilderie Shire Council 2012 Election
$11,432.00
Cost per elector
$10.10
Jerilderie Shire Council Statutory Advertising Campaign Expenditure
Nominations $733.44
Candidates and polling places $1,451.20
Uncontested elections $0.00
Results $332.71
TOTAL $2,517.35
Election Services
Elector Enquiry Centre
The Elector Enquiry Centre answered 12 calls from postcodes within Jerilderie Shire
Council area.
NSWEC Website
There were 234 unique visitors to Jerilderie Shire Council election web page.
Braille Ballot Papers
No braille ballot papers were requested or printed.
Returning Officer
Erin Hore
62 Percentage of Penalty Notices Issued to Enrolment (as shown on Authorised Roll)
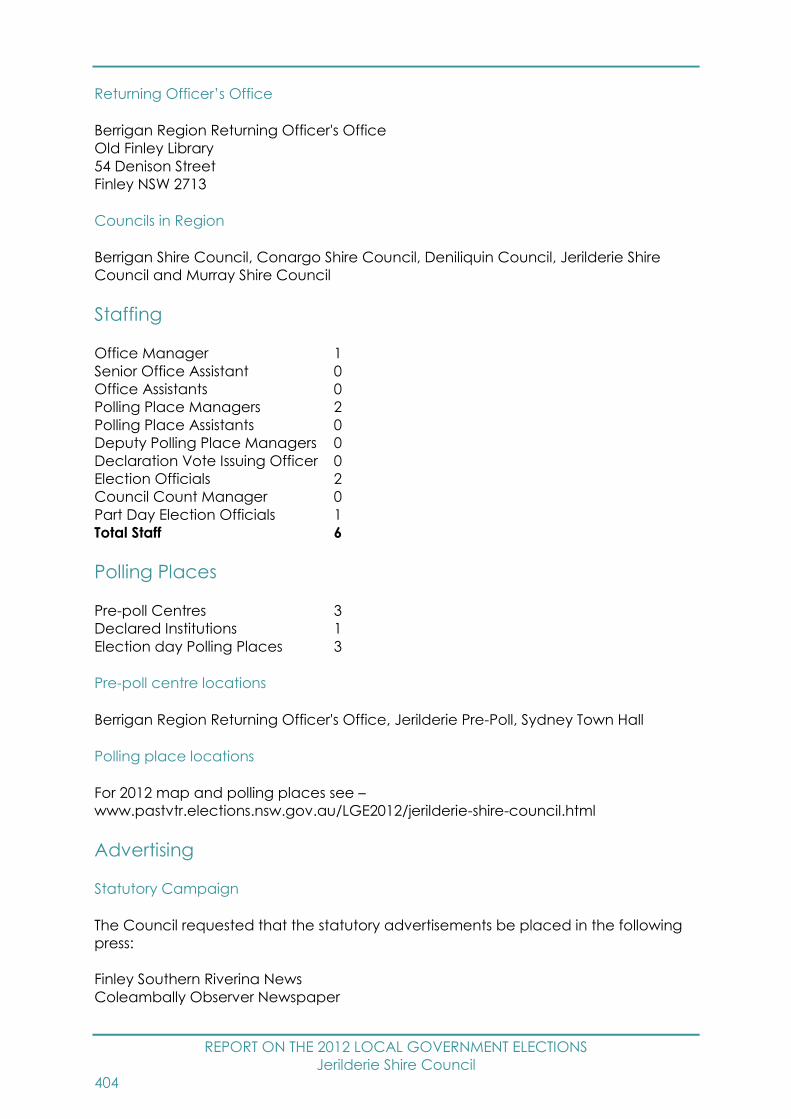
REPORT ON THE 2012 LOCAL GOVERNMENT ELECTIONS
Jerilderie Shire Council
404
Returning Officer’s Office
Berrigan Region Returning Officer's Office
Old Finley Library
54 Denison Street
Finley NSW 2713
Councils in Region
Berrigan Shire Council, Conargo Shire Council, Deniliquin Council, Jerilderie Shire
Council and Murray Shire Council
Staffing
Office Manager 1
Senior Office Assistant 0
Office Assistants 0
Polling Place Managers 2
Polling Place Assistants 0
Deputy Polling Place Managers 0
Declaration Vote Issuing Officer 0
Election Officials 2
Council Count Manager 0
Part Day Election Officials 1
Total Staff 6
Polling Places
Pre-poll Centres 3
Declared Institutions 1
Election day Polling Places 3
Pre-poll centre locations
Berrigan Region Returning Officer's Office, Jerilderie Pre-Poll, Sydney Town Hall
Polling place locations
For 2012 map and polling places see –
www.pastvtr.elections.nsw.gov.au/LGE2012/jerilderie-shire-council.html
Advertising
Statutory Campaign
The Council requested that the statutory advertisements be placed in the following
press:
Finley Southern Riverina News
Coleambally Observer Newspaper
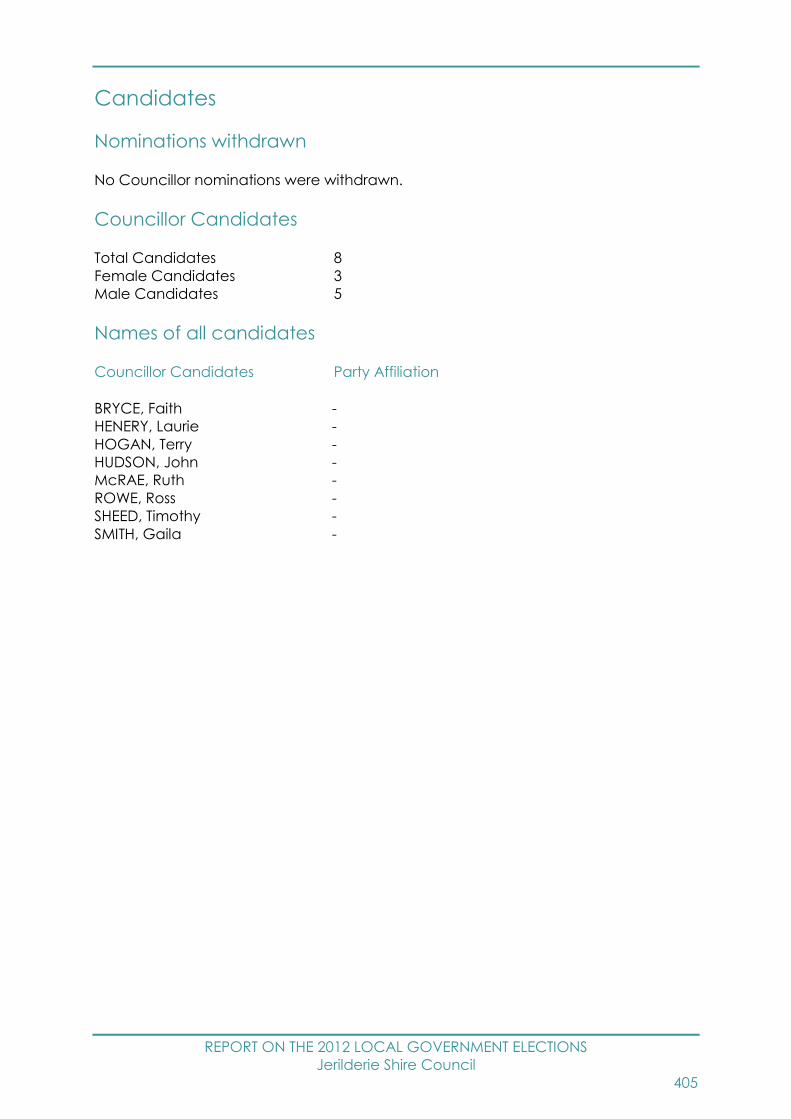
REPORT ON THE 2012 LOCAL GOVERNMENT ELECTIONS
Jerilderie Shire Council
405
Candidates
Nominations withdrawn
No Councillor nominations were withdrawn.
Councillor Candidates
Total Candidates 8
Female Candidates 3
Male Candidates 5
Names of all candidates
Councillor Candidates Party Affiliation
BRYCE, Faith -
HENERY, Laurie -
HOGAN, Terry -
HUDSON, John -
McRAE, Ruth -
ROWE, Ross -
SHEED, Timothy -
SMITH, Gaila -
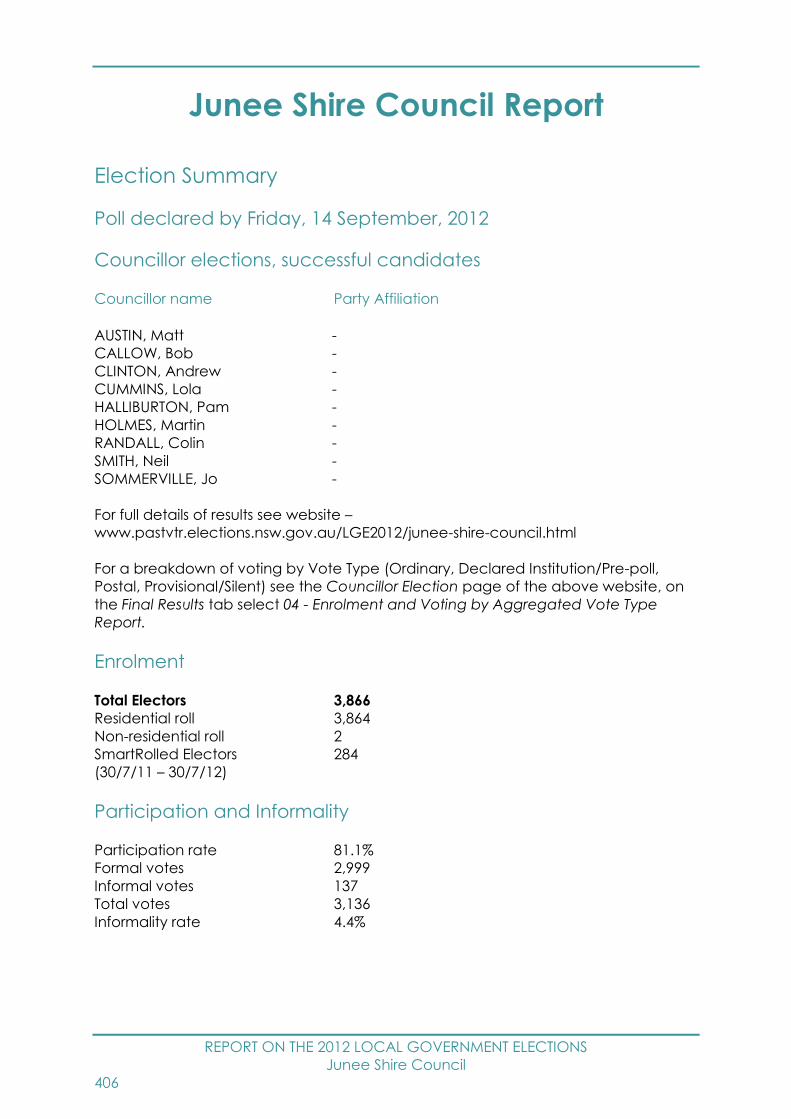
REPORT ON THE 2012 LOCAL GOVERNMENT ELECTIONS
Junee Shire Council
406
Junee Shire Council Report
Election Summary
Poll declared by Friday, 14 September, 2012
Councillor elections, successful candidates
Councillor name Party Affiliation
AUSTIN, Matt -
CALLOW, Bob -
CLINTON, Andrew -
CUMMINS, Lola -
HALLIBURTON, Pam -
HOLMES, Martin -
RANDALL, Colin -
SMITH, Neil -
SOMMERVILLE, Jo -
For full details of results see website –
www.pastvtr.elections.nsw.gov.au/LGE2012/junee-shire-council.html
For a breakdown of voting by Vote Type (Ordinary, Declared Institution/Pre-poll,
Postal, Provisional/Silent) see the Councillor Election page of the above website, on
the Final Results tab select 04 - Enrolment and Voting by Aggregated Vote Type
Report.
Enrolment
Total Electors 3,866
Residential roll 3,864
Non-residential roll 2
SmartRolled Electors 284
(30/7/11 – 30/7/12)
Participation and Informality
Participation rate 81.1%
Formal votes 2,999
Informal votes 137
Total votes 3,136
Informality rate 4.4%
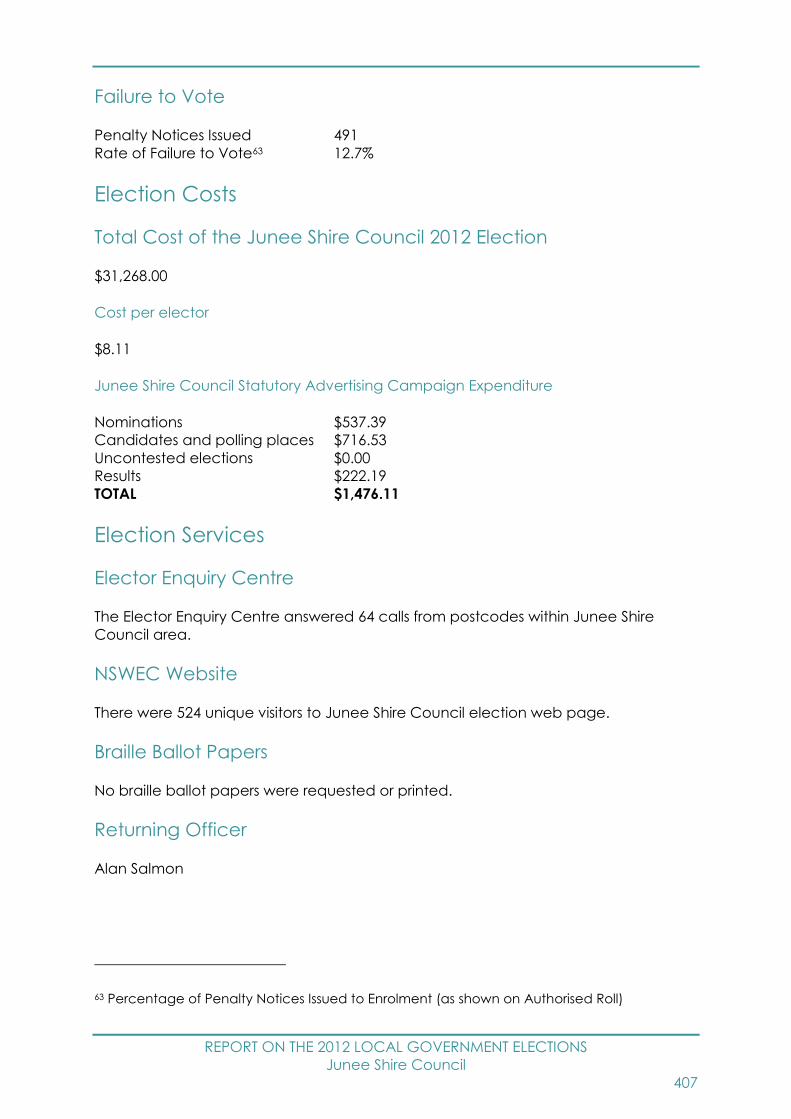
REPORT ON THE 2012 LOCAL GOVERNMENT ELECTIONS
Junee Shire Council
407
Failure to Vote
Penalty Notices Issued 491
Rate of Failure to Vote63 12.7%
Election Costs
Total Cost of the Junee Shire Council 2012 Election
$31,268.00
Cost per elector
$8.11
Junee Shire Council Statutory Advertising Campaign Expenditure
Nominations $537.39
Candidates and polling places $716.53
Uncontested elections $0.00
Results $222.19
TOTAL $1,476.11
Election Services
Elector Enquiry Centre
The Elector Enquiry Centre answered 64 calls from postcodes within Junee Shire
Council area.
NSWEC Website
There were 524 unique visitors to Junee Shire Council election web page.
Braille Ballot Papers
No braille ballot papers were requested or printed.
Returning Officer
Alan Salmon
63 Percentage of Penalty Notices Issued to Enrolment (as shown on Authorised Roll)

REPORT ON THE 2012 LOCAL GOVERNMENT ELECTIONS
Junee Shire Council
408
Returning Officer’s Office
Cootamundra Region Returning Officer's Office
Riverina Community College
76 Wallendoon Street
Cootamundra NSW 2590
Councils in Region
Coolamon Shire Council, Cootamundra Shire Council, Harden Shire Council, Junee
Shire Council and Temora Shire Council
Staffing
Office Manager 1
Senior Office Assistant 0
Office Assistants 0
Polling Place Managers 3
Polling Place Assistants 0
Deputy Polling Place Managers 1
Declaration Vote Issuing Officer 0
Election Officials 7
Council Count Manager 0
Part Day Election Officials 0
Total Staff 12
Polling Places
Pre-poll Centres 3
Declared Institutions 2
Election day Polling Places 4
Pre-poll centre locations
Cootamundra Region Returning Officer's Office, Junee Pre-Poll, Sydney Town Hall
Polling place locations
For 2012 map and polling places see –
www.pastvtr.elections.nsw.gov.au/LGE2012/junee-shire-council.html
Advertising
Statutory Campaign
The Council requested that the statutory advertisements be placed in the following
press:
Wagga Daily Advert.
Junee Southern Cross

REPORT ON THE 2012 LOCAL GOVERNMENT ELECTIONS
Junee Shire Council
409
Candidates
Nominations withdrawn
No Councillor nominations were withdrawn.
Councillor Candidates
Total Candidates 10
Female Candidates 3
Male Candidates 7
Names of all candidates
Councillor Candidates Party Affiliation
AUSTIN, Matt -
CALLOW, Bob -
CLINTON, Andrew -
CUMMINS, Lola -
HALLIBURTON, Pam -
HOLDSWORTH, Paul -
HOLMES, Martin -
RANDALL, Colin -
SMITH, Neil -
SOMMERVILLE, Jo -
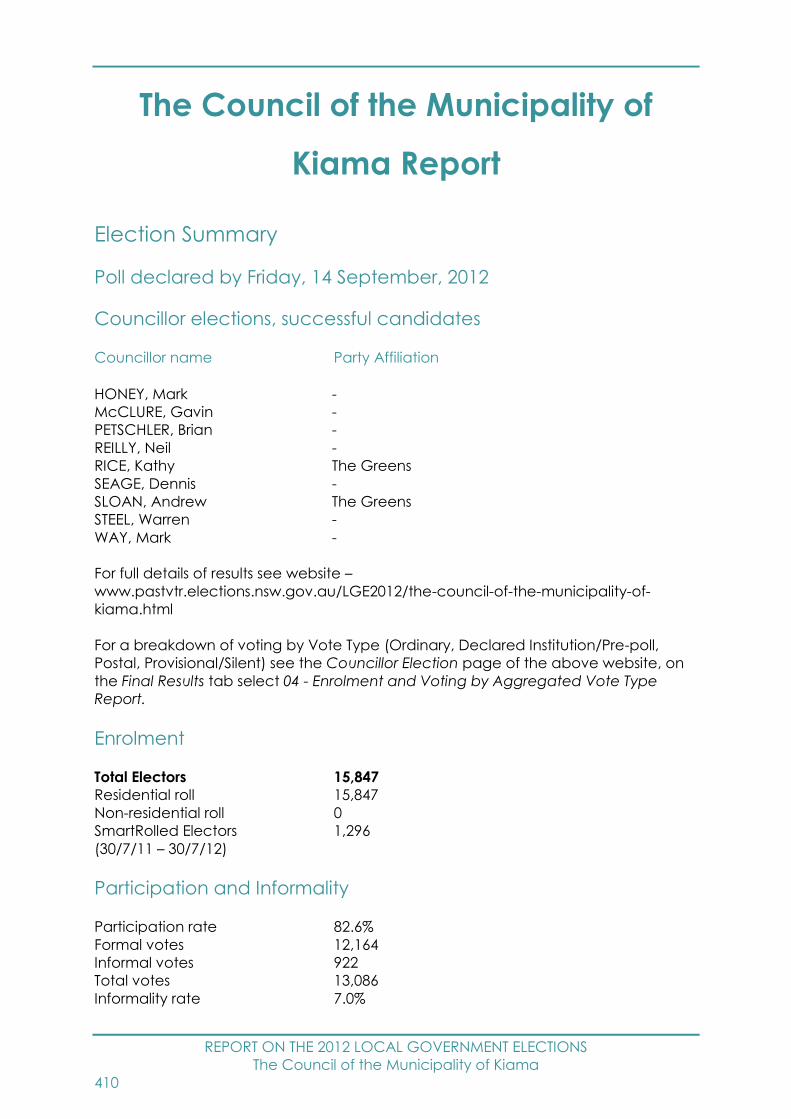
REPORT ON THE 2012 LOCAL GOVERNMENT ELECTIONS
The Council of the Municipality of Kiama
410
The Council of the Municipality of
Kiama Report
Election Summary
Poll declared by Friday, 14 September, 2012
Councillor elections, successful candidates
Councillor name Party Affiliation
HONEY, Mark -
McCLURE, Gavin -
PETSCHLER, Brian -
REILLY, Neil -
RICE, Kathy The Greens
SEAGE, Dennis -
SLOAN, Andrew The Greens
STEEL, Warren -
WAY, Mark -
For full details of results see website –
www.pastvtr.elections.nsw.gov.au/LGE2012/the-council-of-the-municipality-of-
kiama.html
For a breakdown of voting by Vote Type (Ordinary, Declared Institution/Pre-poll,
Postal, Provisional/Silent) see the Councillor Election page of the above website, on
the Final Results tab select 04 - Enrolment and Voting by Aggregated Vote Type
Report.
Enrolment
Total Electors 15,847
Residential roll 15,847
Non-residential roll 0
SmartRolled Electors 1,296
(30/7/11 – 30/7/12)
Participation and Informality
Participation rate 82.6%
Formal votes 12,164
Informal votes 922
Total votes 13,086
Informality rate 7.0%
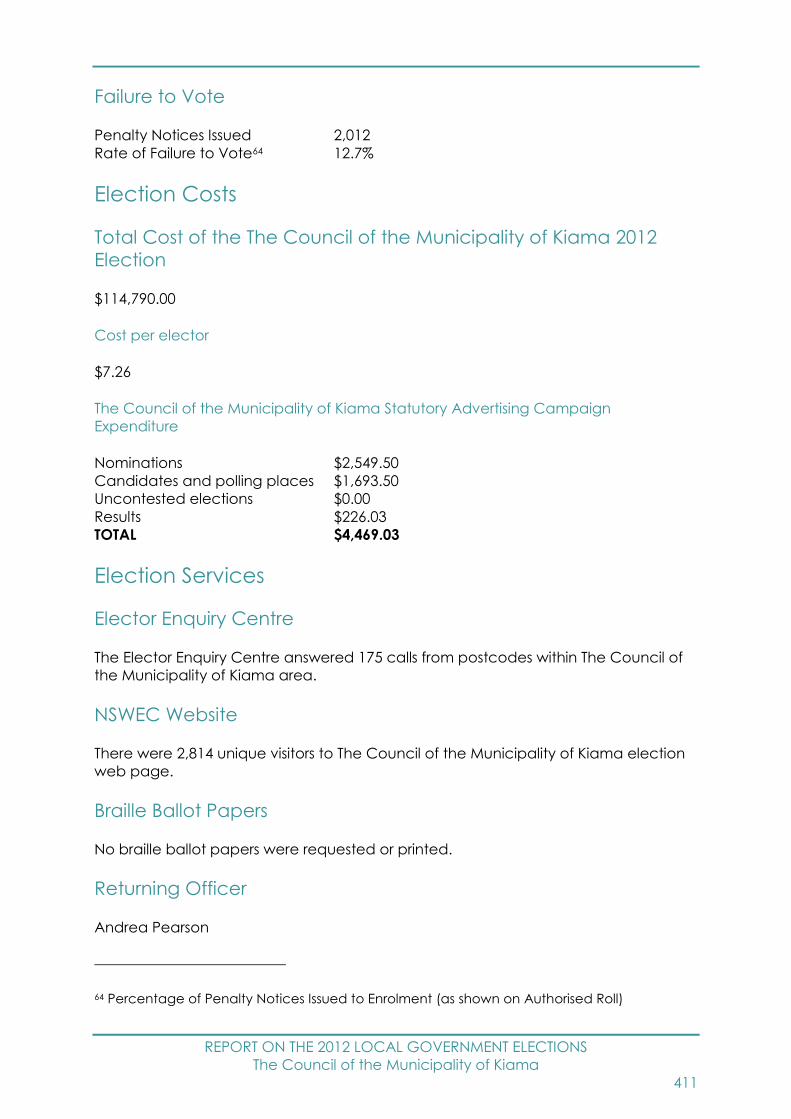
REPORT ON THE 2012 LOCAL GOVERNMENT ELECTIONS
The Council of the Municipality of Kiama
411
Failure to Vote
Penalty Notices Issued 2,012
Rate of Failure to Vote64 12.7%
Election Costs
Total Cost of the The Council of the Municipality of Kiama 2012
Election
$114,790.00
Cost per elector
$7.26
The Council of the Municipality of Kiama Statutory Advertising Campaign
Expenditure
Nominations $2,549.50
Candidates and polling places $1,693.50
Uncontested elections $0.00
Results $226.03
TOTAL $4,469.03
Election Services
Elector Enquiry Centre
The Elector Enquiry Centre answered 175 calls from postcodes within The Council of
the Municipality of Kiama area.
NSWEC Website
There were 2,814 unique visitors to The Council of the Municipality of Kiama election
web page.
Braille Ballot Papers
No braille ballot papers were requested or printed.
Returning Officer
Andrea Pearson
64 Percentage of Penalty Notices Issued to Enrolment (as shown on Authorised Roll)
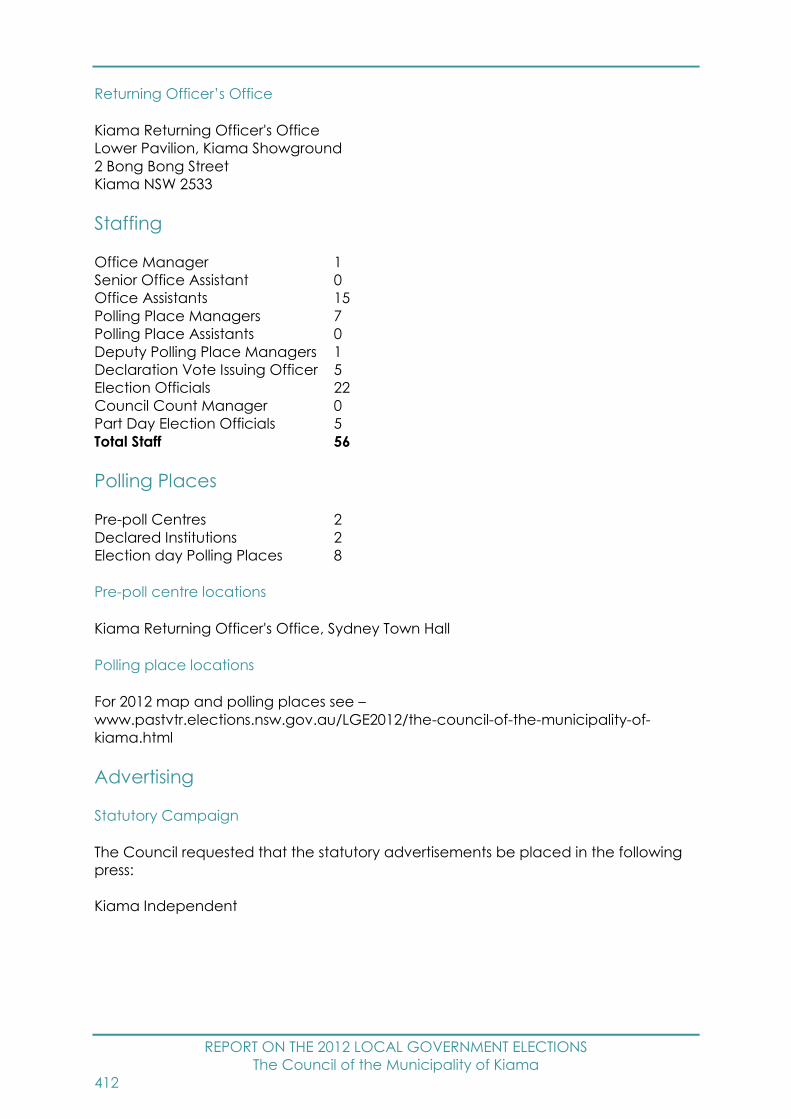
REPORT ON THE 2012 LOCAL GOVERNMENT ELECTIONS
The Council of the Municipality of Kiama
412
Returning Officer’s Office
Kiama Returning Officer's Office
Lower Pavilion, Kiama Showground
2 Bong Bong Street
Kiama NSW 2533
Staffing
Office Manager 1
Senior Office Assistant 0
Office Assistants 15
Polling Place Managers 7
Polling Place Assistants 0
Deputy Polling Place Managers 1
Declaration Vote Issuing Officer 5
Election Officials 22
Council Count Manager 0
Part Day Election Officials 5
Total Staff 56
Polling Places
Pre-poll Centres 2
Declared Institutions 2
Election day Polling Places 8
Pre-poll centre locations
Kiama Returning Officer's Office, Sydney Town Hall
Polling place locations
For 2012 map and polling places see –
www.pastvtr.elections.nsw.gov.au/LGE2012/the-council-of-the-municipality-of-
kiama.html
Advertising
Statutory Campaign
The Council requested that the statutory advertisements be placed in the following
press:
Kiama Independent

REPORT ON THE 2012 LOCAL GOVERNMENT ELECTIONS
The Council of the Municipality of Kiama
413
Candidates
Nominations withdrawn
No Councillor nominations were withdrawn.
Councillor Candidates
Total Candidates 32
Female Candidates 11
Male Candidates 21
Names of all candidates
Councillor Candidates Party Affiliation
BEHL, Bob -
DE ROOVER, Len The Greens
DOUGLAS, Shane -
DUNN, Pat The Greens
EAST, Vic -
ELDER, Kim -
GOLDSMITH, Carmel -
HAINSWORTH, Sandra -
HOLDER, Warren The Greens
HONEY, Mark -
KENNEY, James -
MANSFIELD, Simon -
MATYEAR, Renata -
McCALLUM, Tanya -
McCLURE, Gavin -
McMILLAN, Sonja -
McNIVEN, Kay -
MOORE, Peter -
PETSCHLER, Brian -
PULLAR, Ian -
REILLY, Neil -
RICE, Kathy The Greens
SARAIN, Michael -
SCHILLER GOWANS, Paula The Greens
SCHMIDT, Roy -
SEAGE, Dennis -
SLOAN, Andrew The Greens
SOUTER, Michael -
STEEL, Warren -
WAITE, Robert -
WARREN, Erica -
WAY, Mark -

REPORT ON THE 2012 LOCAL GOVERNMENT ELECTIONS
Kogarah City Council
414
Kogarah City Council Report
Election Summary
Poll declared by Friday, 14 September, 2012
Councillor elections, successful candidates
Councillor name Party Affiliation
East Ward
PLATT, Michael Australian Labor Party (NSW Branch)
STRATIKOPOULOS, Sam Liberal Party of Australia New South Wales Division
TANG, Annie Unity Party
Middle Ward
LANDSBERRY, Kathryn Australian Labor Party (NSW Branch)
SMITH, Nathaniel Liberal Party of Australia New South Wales Division
VARVARIS, Nickolas Liberal Party of Australia New South Wales Division
North Ward
AGIUS, Stephen Liberal Party of Australia New South Wales Division
KATRIS, Nick Australian Labor Party (NSW Branch)
McLEAN, Lachlan -
West Ward
ARONEY, Nicholas Liberal Party of Australia New South Wales Division
KATSABARIS, George Liberal Party of Australia New South Wales Division
PETRONI, Jacinta Australian Labor Party (NSW Branch)
For full details of results see website –
www.pastvtr.elections.nsw.gov.au/LGE2012/kogarah-city-council.html
For a breakdown of voting by Vote Type (Ordinary, Declared Institution/Pre-poll,
Postal, Provisional/Silent) see the Councillor Election page of the above website, on
the Final Results tab select 04 - Enrolment and Voting by Aggregated Vote Type
Report.

REPORT ON THE 2012 LOCAL GOVERNMENT ELECTIONS
Kogarah City Council
415
Enrolment
Total Electors 38,242
Residential roll 38,239
Non-residential roll 3
SmartRolled Electors 3,296
(30/7/11 – 30/7/12)
Participation and Informality
Participation rate 83.7%
Formal votes 29,713
Informal votes 2,310
Total votes 32,023
Informality rate 7.2%
For details of participation and informality by ward see website –
www.pastvtr.elections.nsw.gov.au/LGE2012/lge-statistics.htm
Failure to Vote
Penalty Notices Issued 4,083
Rate of Failure to Vote65 10.7%
Election Costs
Total Cost of the Kogarah City Council 2012 Election
$265,573.00
Cost per elector
$6.97
Kogarah City Council Statutory Advertising Campaign Expenditure
Nominations $395.93
Candidates and polling places $3,220.80
Uncontested elections $0.00
Results $977.90
TOTAL $4,594.63
65 Percentage of Penalty Notices Issued to Enrolment (as shown on Authorised Roll)
REPORT ON THE 2012 LOCAL GOVERNMENT ELECTIONS
Kogarah City Council
416
Election Services
Elector Enquiry Centre
The Elector Enquiry Centre answered 950 calls from postcodes within Kogarah City
Council area.
NSWEC Website
There were 3,811 unique visitors to Kogarah City Council election web page.
Braille Ballot Papers
No braille ballot papers were requested or printed.
Returning Officer
Dennis McCroary
Returning Officer’s Office
Kogarah Returning Officer's Office
Jubilee Community Centre
Kogarah Park Oval, Jubilee Avenue
Carlton NSW 2218
Staffing
Office Manager 1
Senior Office Assistant 0
Office Assistants 22
Polling Place Managers 19
Polling Place Assistants 0
Deputy Polling Place Managers 7
Declaration Vote Issuing Officer 5
Election Officials 74
Council Count Manager 0
Part Day Election Officials 9
Total Staff 137
Polling Places
Pre-poll Centres 3
Declared Institutions 6
Election day Polling Places 31
REPORT ON THE 2012 LOCAL GOVERNMENT ELECTIONS
Kogarah City Council
417
Pre-poll centre locations
Kogarah Pre-Poll, Kogarah Returning Officer's Office, Sydney Town Hall
Polling place locations
For 2012 map and polling places see –
www.pastvtr.elections.nsw.gov.au/LGE2012/kogarah-city-council.html
Advertising
Statutory Campaign
The Council requested that the statutory advertisements be placed in the following
press:
St George Leader
Candidates
Nominations withdrawn
No Councillor nominations were withdrawn.
Councillor Candidates
Total Candidates 47
Female Candidates 17
Male Candidates 30
East Ward Councillor Candidates
Total Candidates 14
Female Candidates 4
Male Candidates 10
Middle Ward Councillor Candidates
Total Candidates 10
Female Candidates 5
Male Candidates 5
North Ward Councillor Candidates
Total Candidates 13
Female Candidates 3
Male Candidates 10
REPORT ON THE 2012 LOCAL GOVERNMENT ELECTIONS
Kogarah City Council
418
West Ward Councillor Candidates
Total Candidates 10
Female Candidates 5
Male Candidates 5
Names of all candidates
Councillor Candidates Party Affiliation
East Ward
CLARK, Ross -
HE, Hua -
HUBBARD, Victoria Liberal Party of Australia New South Wales Division
MARCUS, John Australian Labor Party (NSW Branch)
MURDEN, Neale -
PLATT, Michael Australian Labor Party (NSW Branch)
QIAN, Yong -
SILK, Andrew Australian Labor Party (NSW Branch)
SMITH, Christine Liberal Party of Australia New South Wales Division
STRATIKOPOULOS, Sam Liberal Party of Australia New South Wales Division
TANG, Annie Unity Party
WOO, Hong Unity Party
ZHANG, Yunzheng Unity Party
ZHOU, Jian -
Middle Ward
COLQUHOUN, Jim Kogarah Residents' Association
GREEN, Tania -
KIRK, Sophie Australian Labor Party (NSW Branch)
LANDSBERRY, Kathryn Australian Labor Party (NSW Branch)
LEACH, Ken Kogarah Residents' Association
PAYOR, Leesha Kogarah Residents' Association
SMITH, Fran Australian Labor Party (NSW Branch)
SMITH, Nathaniel Liberal Party of Australia New South Wales Division
VARVARIS, Nickolas Liberal Party of Australia New South Wales Division
ZHOU, Jieke Liberal Party of Australia New South Wales Division
North Ward
AGIUS, Stephen Liberal Party of Australia New South Wales Division
BRIGHTWELL, Max -
BUFFONI, Brad -
CLIFT, Darren -
DE JESUS, Daniel Liberal Party of Australia New South Wales Division
KATRIS, Nick Australian Labor Party (NSW Branch)
KOKKINAKIS, Jim -
McLEAN, Lachlan -
MOONEY, Kevin Australian Labor Party (NSW Branch)
REPORT ON THE 2012 LOCAL GOVERNMENT ELECTIONS
Kogarah City Council
419
MURPHY, Lee -
SYMINGTON, Colleen Australian Labor Party (NSW Branch)
VARVARIS, Dorette Liberal Party of Australia New South Wales Division
WOODLAND, Christine -
West Ward
ADAIR, Michele -
ARONEY, Nicholas Liberal Party of Australia New South Wales Division
CLARKE, Lorne Liberal Party of Australia New South Wales Division
GREKAS, Sandy Australian Labor Party (NSW Branch)
KATSABARIS, George Liberal Party of Australia New South Wales Division
KENT, Jenny The Greens
PETRONI, Jacinta Australian Labor Party (NSW Branch)
PLATT, Nicholas Australian Labor Party (NSW Branch)
ROTHWELL, Miles The Greens
SANGSTER, Peter The Greens
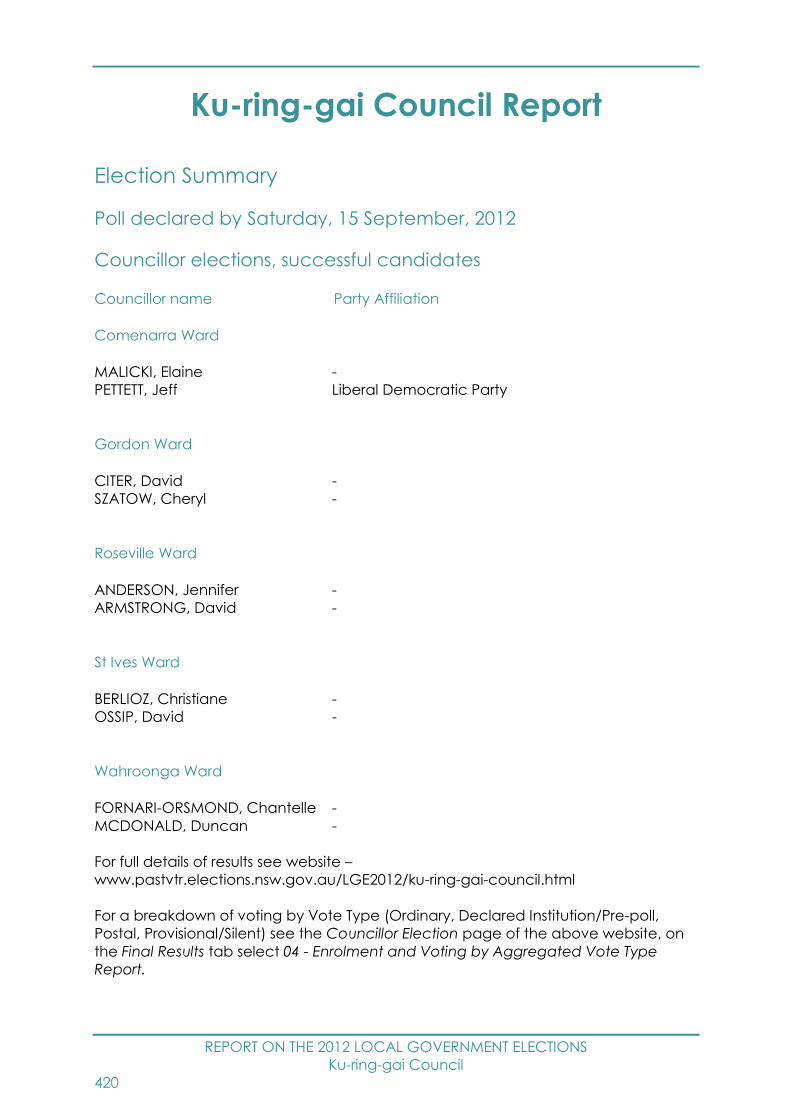
REPORT ON THE 2012 LOCAL GOVERNMENT ELECTIONS
Ku-ring-gai Council
420
Ku-ring-gai Council Report
Election Summary
Poll declared by Saturday, 15 September, 2012
Councillor elections, successful candidates
Councillor name Party Affiliation
Comenarra Ward
MALICKI, Elaine -
PETTETT, Jeff Liberal Democratic Party
Gordon Ward
CITER, David -
SZATOW, Cheryl -
Roseville Ward
ANDERSON, Jennifer -
ARMSTRONG, David -
St Ives Ward
BERLIOZ, Christiane -
OSSIP, David -
Wahroonga Ward
FORNARI-ORSMOND, Chantelle -
MCDONALD, Duncan -
For full details of results see website –
www.pastvtr.elections.nsw.gov.au/LGE2012/ku-ring-gai-council.html
For a breakdown of voting by Vote Type (Ordinary, Declared Institution/Pre-poll,
Postal, Provisional/Silent) see the Councillor Election page of the above website, on
the Final Results tab select 04 - Enrolment and Voting by Aggregated Vote Type
Report.

REPORT ON THE 2012 LOCAL GOVERNMENT ELECTIONS
Ku-ring-gai Council
421
Enrolment
Total Electors 77,927
Residential roll 77,924
Non-residential roll 3
SmartRolled Electors 5,767
(30/7/11 – 30/7/12)
Participation and Informality
Participation rate 82.0%
Formal votes 58,971
Informal votes 4,936
Total votes 63,907
Informality rate 7.7%
For details of participation and informality by ward see website –
www.pastvtr.elections.nsw.gov.au/LGE2012/lge-statistics.htm
Failure to Vote
Penalty Notices Issued 9,805
Rate of Failure to Vote66 12.6%
Election Costs
Total Cost of the Ku-ring-gai Council 2012 Election
$493,980.00
Cost per elector
$6.36
Ku-ring-gai Council Statutory Advertising Campaign Expenditure
Nominations $4,422.80
Candidates and polling places $12,431.64
Uncontested elections $0.00
Results $1,449.36
TOTAL $18,303.80
66 Percentage of Penalty Notices Issued to Enrolment (as shown on Authorised Roll)

REPORT ON THE 2012 LOCAL GOVERNMENT ELECTIONS
Ku-ring-gai Council
422
Election Services
Elector Enquiry Centre
The Elector Enquiry Centre answered 1,998 calls from postcodes within Ku-ring-gai
Council area.
NSWEC Website
There were 10,055 unique visitors to Ku-ring-gai Council election web page.
Braille Ballot Papers
One braille ballot papers were requested or printed.
Returning Officer
Kerrie Hunter
Returning Officer’s Office
Ku-ring-gai Returning Officer's Office
910 Pacific Highway
Gordon NSW 2072
Staffing
Office Manager 1
Senior Office Assistant 0
Office Assistants 33
Polling Place Managers 29
Polling Place Assistants 0
Deputy Polling Place Managers 18
Declaration Vote Issuing Officer 11
Election Officials 124
Council Count Manager 0
Part Day Election Officials 18
Total Staff 234
Polling Places
Pre-poll Centres 2
Declared Institutions 15
Election day Polling Places 46
Pre-poll centre locations
Ku-ring-gai Returning Officer's Office, Sydney Town Hall
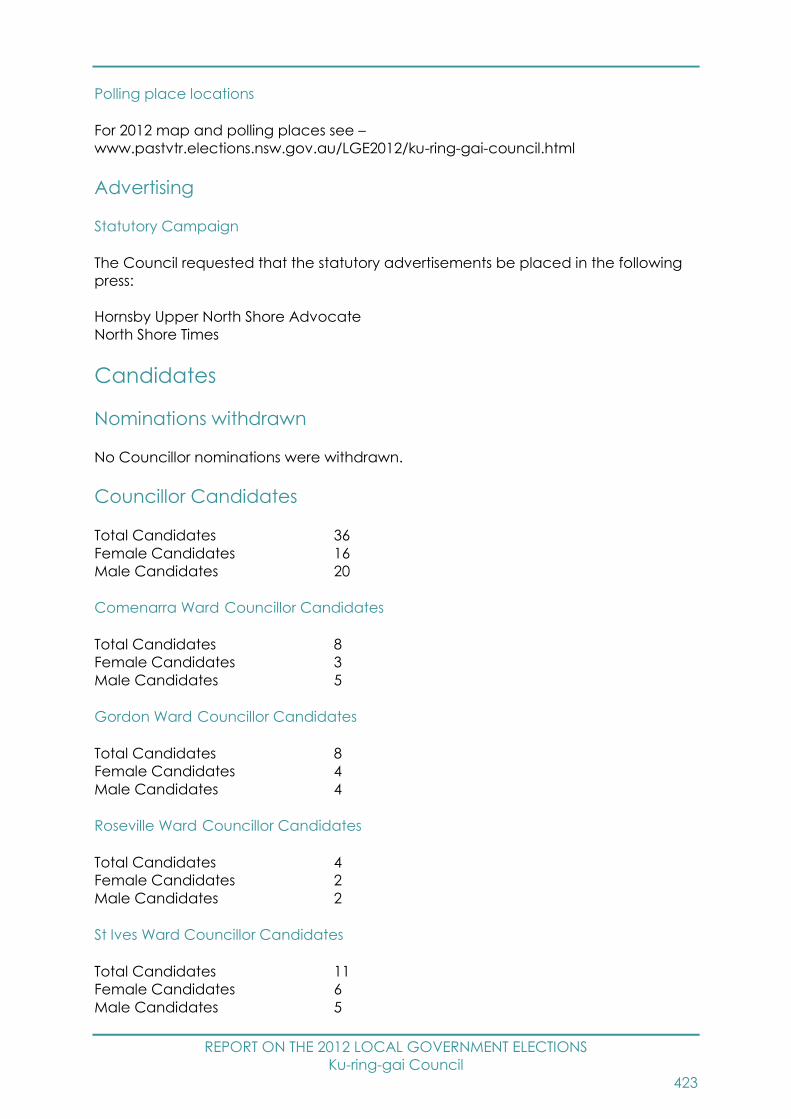
REPORT ON THE 2012 LOCAL GOVERNMENT ELECTIONS
Ku-ring-gai Council
423
Polling place locations
For 2012 map and polling places see –
www.pastvtr.elections.nsw.gov.au/LGE2012/ku-ring-gai-council.html
Advertising
Statutory Campaign
The Council requested that the statutory advertisements be placed in the following
press:
Hornsby Upper North Shore Advocate
North Shore Times
Candidates
Nominations withdrawn
No Councillor nominations were withdrawn.
Councillor Candidates
Total Candidates 36
Female Candidates 16
Male Candidates 20
Comenarra Ward Councillor Candidates
Total Candidates 8
Female Candidates 3
Male Candidates 5
Gordon Ward Councillor Candidates
Total Candidates 8
Female Candidates 4
Male Candidates 4
Roseville Ward Councillor Candidates
Total Candidates 4
Female Candidates 2
Male Candidates 2
St Ives Ward Councillor Candidates
Total Candidates 11
Female Candidates 6
Male Candidates 5
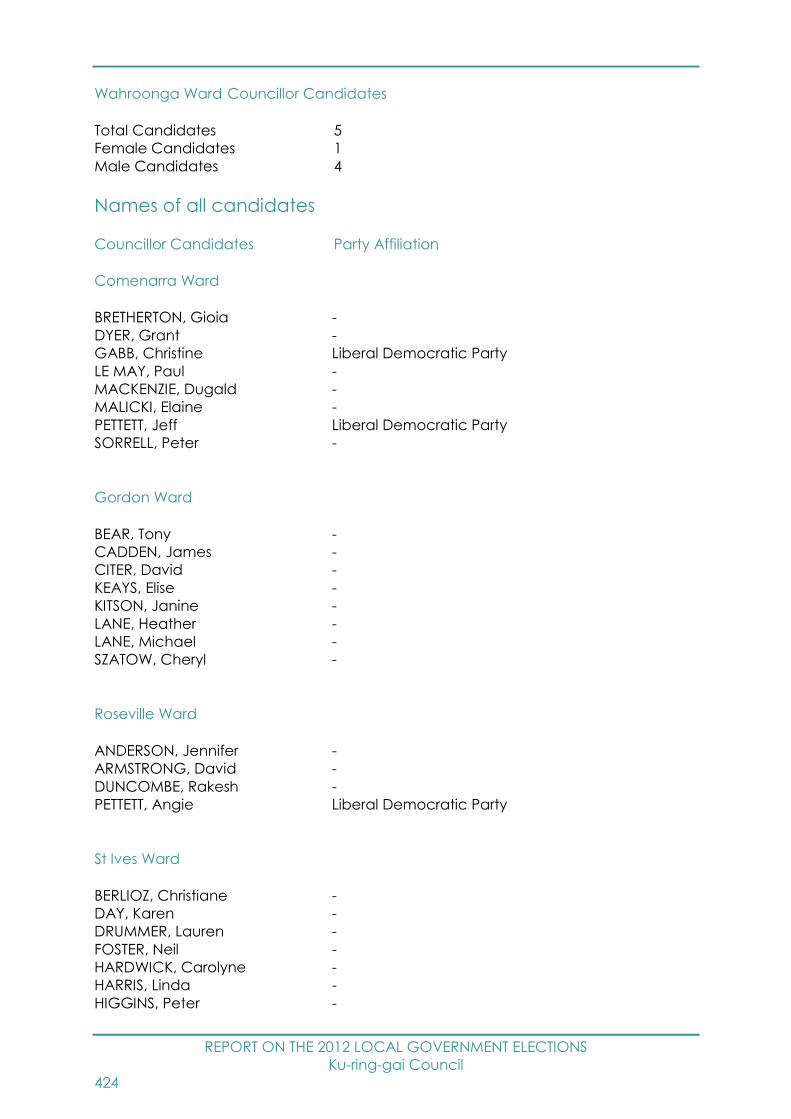
REPORT ON THE 2012 LOCAL GOVERNMENT ELECTIONS
Ku-ring-gai Council
424
Wahroonga Ward Councillor Candidates
Total Candidates 5
Female Candidates 1
Male Candidates 4
Names of all candidates
Councillor Candidates Party Affiliation
Comenarra Ward
BRETHERTON, Gioia -
DYER, Grant -
GABB, Christine Liberal Democratic Party
LE MAY, Paul -
MACKENZIE, Dugald -
MALICKI, Elaine -
PETTETT, Jeff Liberal Democratic Party
SORRELL, Peter -
Gordon Ward
BEAR, Tony -
CADDEN, James -
CITER, David -
KEAYS, Elise -
KITSON, Janine -
LANE, Heather -
LANE, Michael -
SZATOW, Cheryl -
Roseville Ward
ANDERSON, Jennifer -
ARMSTRONG, David -
DUNCOMBE, Rakesh -
PETTETT, Angie Liberal Democratic Party
St Ives Ward
BERLIOZ, Christiane -
DAY, Karen -
DRUMMER, Lauren -
FOSTER, Neil -
HARDWICK, Carolyne -
HARRIS, Linda -
HIGGINS, Peter -
REPORT ON THE 2012 LOCAL GOVERNMENT ELECTIONS
Ku-ring-gai Council
425
LLANES, Monique -
OSSIP, David -
WINDERBAUM, Ilan -
WINDERBAUM, Richard -
Wahroonga Ward
FORNARI-ORSMOND, Chantelle -
LYNCH, Stephen -
MCDONALD, Alexander -
MCDONALD, Duncan -
MUGFORD, Peter -
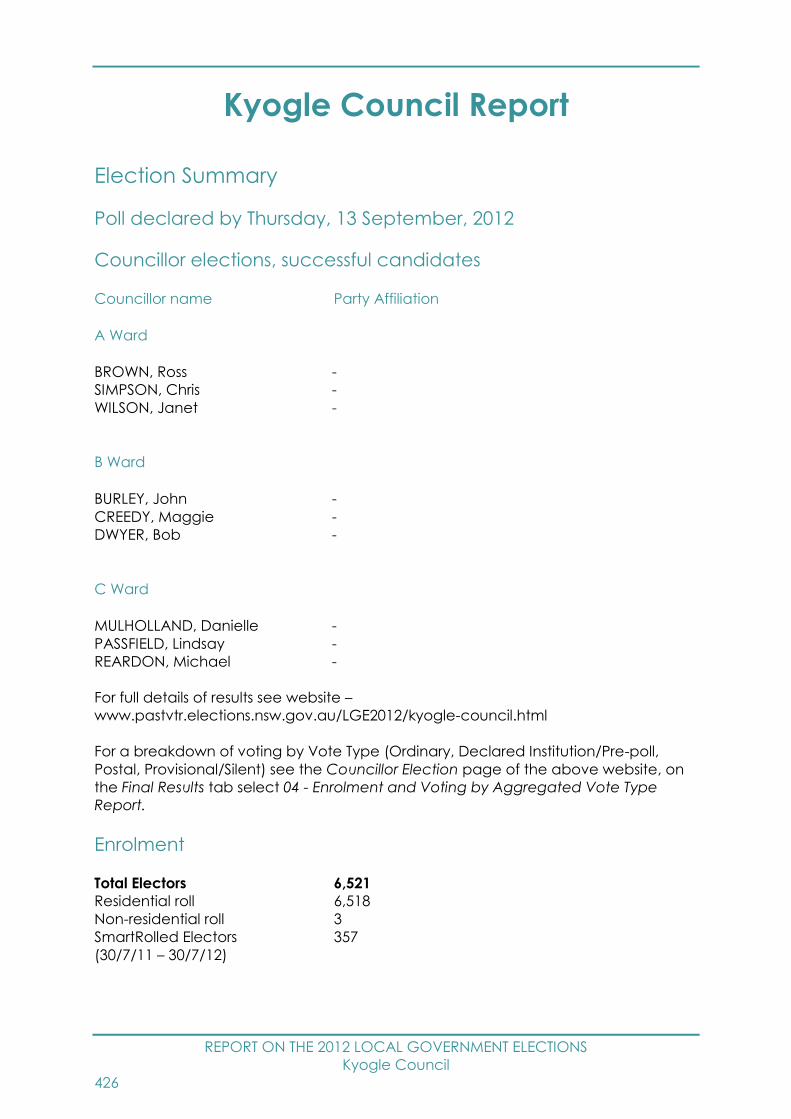
REPORT ON THE 2012 LOCAL GOVERNMENT ELECTIONS
Kyogle Council
426
Kyogle Council Report
Election Summary
Poll declared by Thursday, 13 September, 2012
Councillor elections, successful candidates
Councillor name Party Affiliation
A Ward
BROWN, Ross -
SIMPSON, Chris -
WILSON, Janet -
B Ward
BURLEY, John -
CREEDY, Maggie -
DWYER, Bob -
C Ward
MULHOLLAND, Danielle -
PASSFIELD, Lindsay -
REARDON, Michael -
For full details of results see website –
www.pastvtr.elections.nsw.gov.au/LGE2012/kyogle-council.html
For a breakdown of voting by Vote Type (Ordinary, Declared Institution/Pre-poll,
Postal, Provisional/Silent) see the Councillor Election page of the above website, on
the Final Results tab select 04 - Enrolment and Voting by Aggregated Vote Type
Report.
Enrolment
Total Electors 6,521
Residential roll 6,518
Non-residential roll 3
SmartRolled Electors 357
(30/7/11 – 30/7/12)

REPORT ON THE 2012 LOCAL GOVERNMENT ELECTIONS
Kyogle Council
427
Participation and Informality
Participation rate 81.1%
Formal votes 5,027
Informal votes 259
Total votes 5,286
Informality rate 4.9%
For details of participation and informality by ward see website –
www.pastvtr.elections.nsw.gov.au/LGE2012/lge-statistics.htm
Failure to Vote
Penalty Notices Issued 900
Rate of Failure to Vote67 13.9%
Election Costs
Total Cost of the Kyogle Council 2012 Election
$52,267.00
Cost per elector
$8.05
Kyogle Council Statutory Advertising Campaign Expenditure
Nominations $1,624.58
Candidates and polling places $5,440.18
Uncontested elections $0.00
Results $673.23
TOTAL $7,737.99
Election Services
Elector Enquiry Centre
The Elector Enquiry Centre answered 89 calls from postcodes within Kyogle Council
area.
NSWEC Website
There were 1,044 unique visitors to Kyogle Council election web page.
67 Percentage of Penalty Notices Issued to Enrolment (as shown on Authorised Roll)
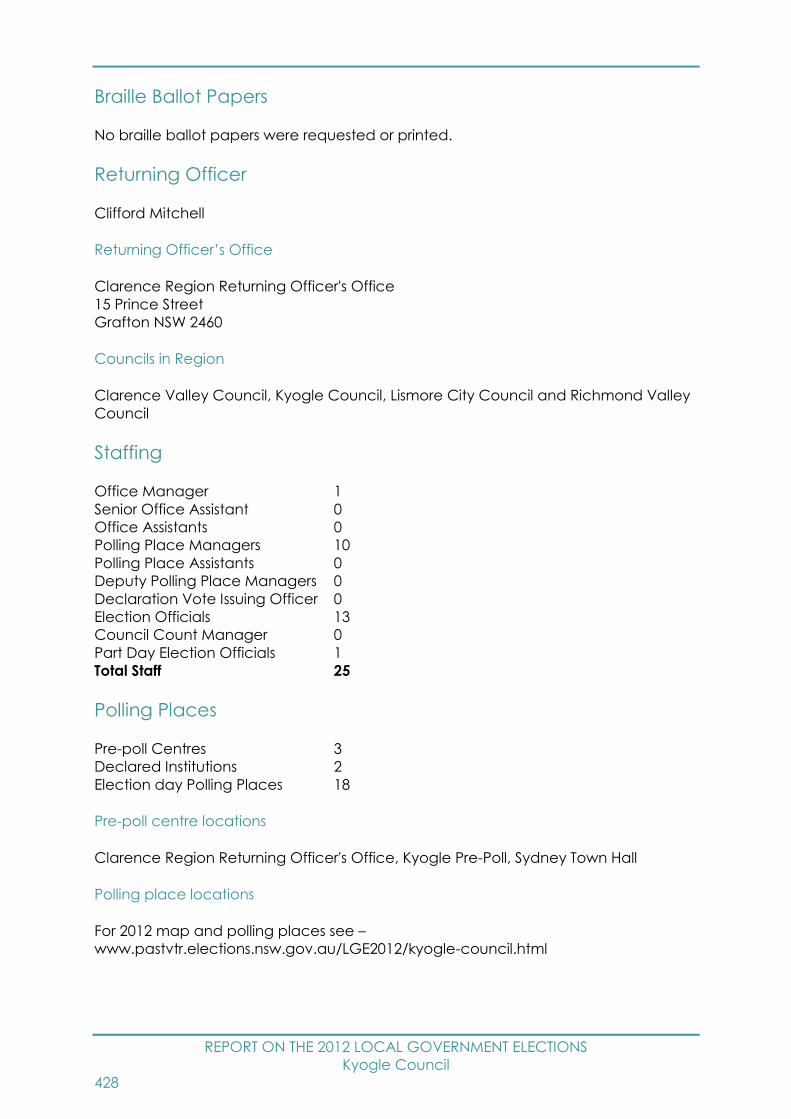
REPORT ON THE 2012 LOCAL GOVERNMENT ELECTIONS
Kyogle Council
428
Braille Ballot Papers
No braille ballot papers were requested or printed.
Returning Officer
Clifford Mitchell
Returning Officer’s Office
Clarence Region Returning Officer's Office
15 Prince Street
Grafton NSW 2460
Councils in Region
Clarence Valley Council, Kyogle Council, Lismore City Council and Richmond Valley
Council
Staffing
Office Manager 1
Senior Office Assistant 0
Office Assistants 0
Polling Place Managers 10
Polling Place Assistants 0
Deputy Polling Place Managers 0
Declaration Vote Issuing Officer 0
Election Officials 13
Council Count Manager 0
Part Day Election Officials 1
Total Staff 25
Polling Places
Pre-poll Centres 3
Declared Institutions 2
Election day Polling Places 18
Pre-poll centre locations
Clarence Region Returning Officer's Office, Kyogle Pre-Poll, Sydney Town Hall
Polling place locations
For 2012 map and polling places see –
www.pastvtr.elections.nsw.gov.au/LGE2012/kyogle-council.html

REPORT ON THE 2012 LOCAL GOVERNMENT ELECTIONS
Kyogle Council
429
Advertising
Statutory Campaign
The Council requested that the statutory advertisements be placed in the following
press:
Northern Star
Richmond River Express Examiner
Candidates
Nominations withdrawn
No Councillor nominations were withdrawn.
Councillor Candidates
Total Candidates 18
Female Candidates 4
Male Candidates 14
A Ward Councillor Candidates
Total Candidates 8
Female Candidates 1
Male Candidates 7
B Ward Councillor Candidates
Total Candidates 6
Female Candidates 2
Male Candidates 4
C Ward Councillor Candidates
Total Candidates 4
Female Candidates 1
Male Candidates 3
Names of all candidates
Councillor Candidates Party Affiliation
A Ward
BROOKE, Michael -
BROWN, Ross -
EICHMANN, Brian -
LEADBEATTER, Robert -
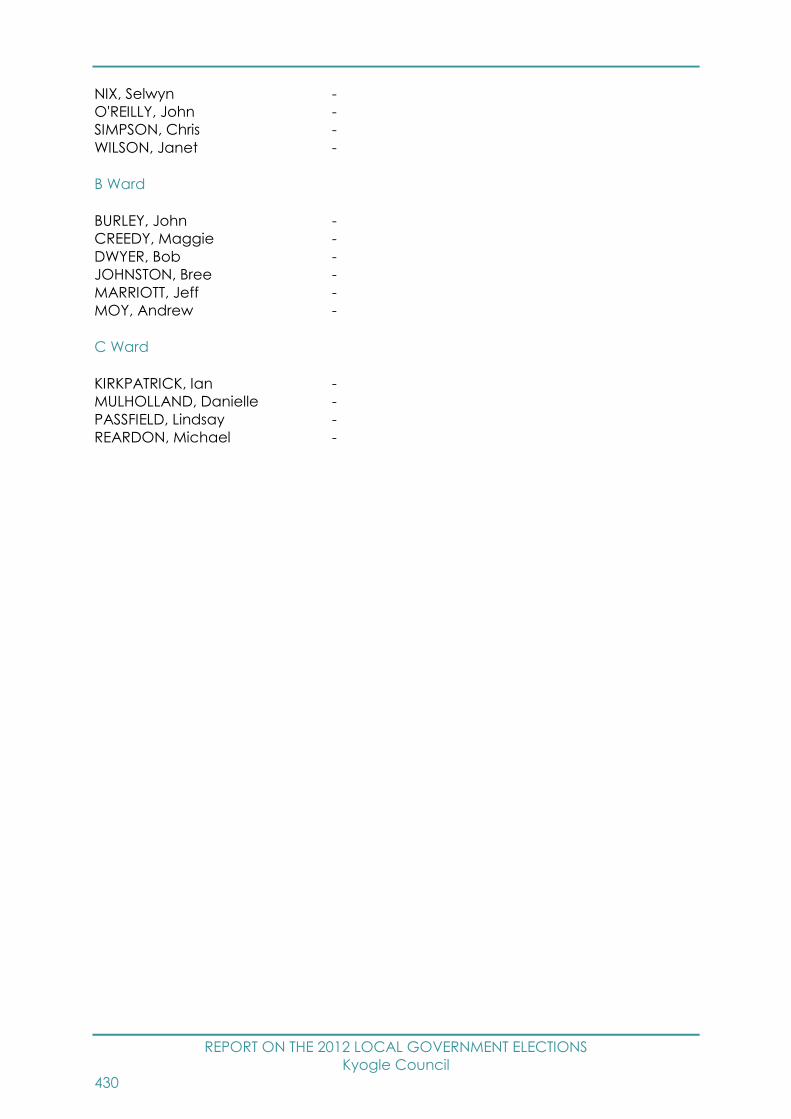
REPORT ON THE 2012 LOCAL GOVERNMENT ELECTIONS
Kyogle Council
430
NIX, Selwyn -
O'REILLY, John -
SIMPSON, Chris -
WILSON, Janet -
B Ward
BURLEY, John -
CREEDY, Maggie -
DWYER, Bob -
JOHNSTON, Bree -
MARRIOTT, Jeff -
MOY, Andrew -
C Ward
KIRKPATRICK, Ian -
MULHOLLAND, Danielle -
PASSFIELD, Lindsay -
REARDON, Michael -
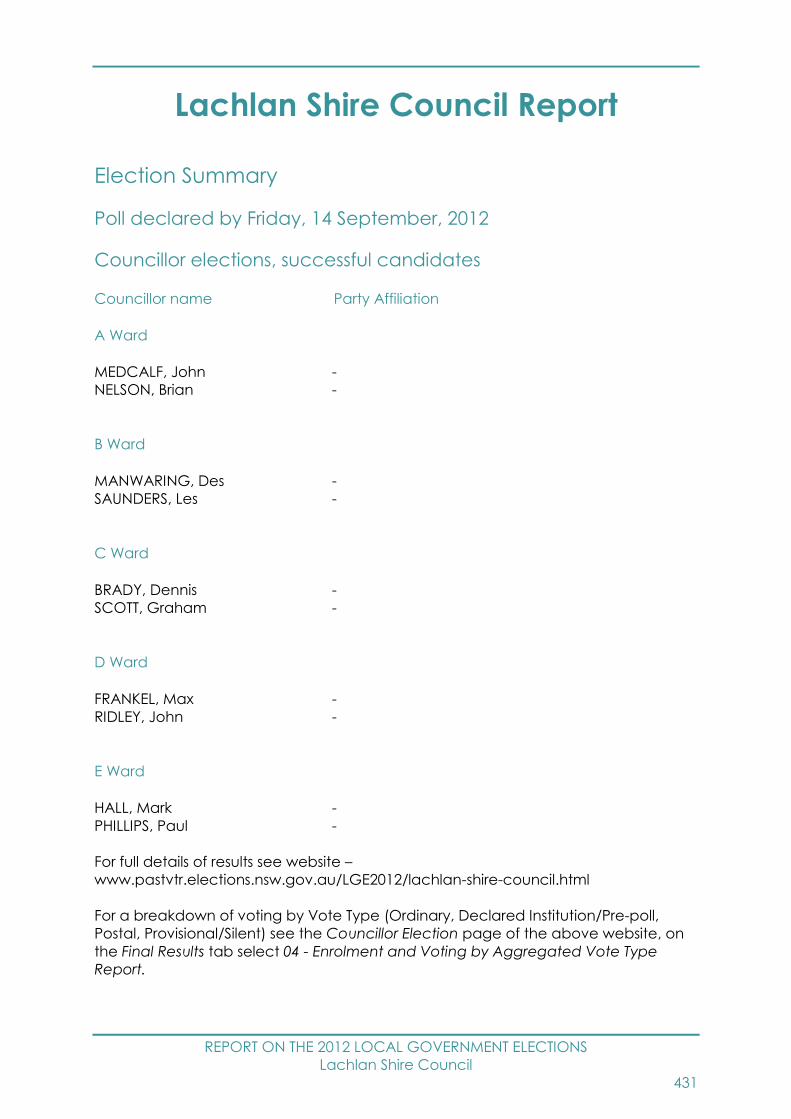
REPORT ON THE 2012 LOCAL GOVERNMENT ELECTIONS
Lachlan Shire Council
431
Lachlan Shire Council Report
Election Summary
Poll declared by Friday, 14 September, 2012
Councillor elections, successful candidates
Councillor name Party Affiliation
A Ward
MEDCALF, John -
NELSON, Brian -
B Ward
MANWARING, Des -
SAUNDERS, Les -
C Ward
BRADY, Dennis -
SCOTT, Graham -
D Ward
FRANKEL, Max -
RIDLEY, John -
E Ward
HALL, Mark -
PHILLIPS, Paul -
For full details of results see website –
www.pastvtr.elections.nsw.gov.au/LGE2012/lachlan-shire-council.html
For a breakdown of voting by Vote Type (Ordinary, Declared Institution/Pre-poll,
Postal, Provisional/Silent) see the Councillor Election page of the above website, on
the Final Results tab select 04 - Enrolment and Voting by Aggregated Vote Type
Report.

REPORT ON THE 2012 LOCAL GOVERNMENT ELECTIONS
Lachlan Shire Council
432
Enrolment
Total Electors 4,592
Residential roll 4,592
Non-residential roll 0
SmartRolled Electors 334
(30/7/11 – 30/7/12)
Participation and Informality
Participation rate 79.0%
Formal votes 3,550
Informal votes 78
Total votes 3,628
Informality rate 2.1%
For details of participation and informality by ward see website –
www.pastvtr.elections.nsw.gov.au/LGE2012/lge-statistics.htm
Failure to Vote
Penalty Notices Issued 757
Rate of Failure to Vote68 16.5%
Election Costs
Total Cost of the Lachlan Shire Council 2012 Election
$41,079.00
Cost per elector
$8.96
Lachlan Shire Council Statutory Advertising Campaign Expenditure
Nominations $560.95
Candidates and polling places $1,237.00
Uncontested elections $0.00
Results $302.00
TOTAL $2,099.95
68 Percentage of Penalty Notices Issued to Enrolment (as shown on Authorised Roll)
REPORT ON THE 2012 LOCAL GOVERNMENT ELECTIONS
Lachlan Shire Council
433
Election Services
Elector Enquiry Centre
The Elector Enquiry Centre answered 151 calls from postcodes within Lachlan Shire
Council area.
NSWEC Website
There were 854 unique visitors to Lachlan Shire Council election web page.
Braille Ballot Papers
No braille ballot papers were requested or printed.
Returning Officer
Geoffrey Lark
Returning Officer’s Office
Forbes Region Returning Officer's Office
1-5 Bandon Street
Forbes NSW 2871
Councils in Region
Bland Shire Council, Forbes Shire Council, Lachlan Shire Council and Parkes Shire
Council
Staffing
Office Manager 1
Senior Office Assistant 0
Office Assistants 0
Polling Place Managers 6
Polling Place Assistants 0
Deputy Polling Place Managers 0
Declaration Vote Issuing Officer 0
Election Officials 9
Council Count Manager 0
Part Day Election Officials 0
Total Staff 16
Polling Places
Pre-poll Centres 3
Declared Institutions 2
Election day Polling Places 17

REPORT ON THE 2012 LOCAL GOVERNMENT ELECTIONS
Lachlan Shire Council
434
Pre-poll centre locations
Condobolin Pre-Poll, Forbes Region Returning Officer's Office, Sydney Town Hall
Polling place locations
For 2012 map and polling places see –
www.pastvtr.elections.nsw.gov.au/LGE2012/lachlan-shire-council.html
Advertising
Statutory Campaign
The Council requested that the statutory advertisements be placed in the following
press:
Lake Cargelligo News
Condobolin Lachlander
Condobolin Argus
Candidates
Nominations withdrawn
No Councillor nominations were withdrawn.
Councillor Candidates
Total Candidates 17
Female Candidates 1
Male Candidates 16
A Ward Councillor Candidates
Total Candidates 3
Female Candidates 0
Male Candidates 3
B Ward Councillor Candidates
Total Candidates 3
Female Candidates 0
Male Candidates 3
C Ward Councillor Candidates
Total Candidates 3
Female Candidates 1
Male Candidates 2
REPORT ON THE 2012 LOCAL GOVERNMENT ELECTIONS
Lachlan Shire Council
435
D Ward Councillor Candidates
Total Candidates 4
Female Candidates 0
Male Candidates 4
E Ward Councillor Candidates
Total Candidates 4
Female Candidates 0
Male Candidates 4
Names of all candidates
Councillor Candidates Party Affiliation
A Ward
FISHPOOL, Terry -
MEDCALF, John -
NELSON, Brian -
B Ward
HARRIS, Peter -
MANWARING, Des -
SAUNDERS, Les -
C Ward
BRADY, Dennis -
JONES, Kim -
SCOTT, Graham -
D Ward
CARTER, Dave -
FRANKEL, Max -
RIDLEY, John -
SHIELDS, Raymond -
E Ward
BEATTIE, Ross -
HALL, Mark -
KING, Robert -
PHILLIPS, Paul -

REPORT ON THE 2012 LOCAL GOVERNMENT ELECTIONS
Leeton Shire Council
436
Leeton Shire Council Report
Election Summary
Uncontested - Poll declared by Saturday, 8 September, 2012
Councillor elections, successful candidates
Councillor name Party Affiliation
DAVIDSON, Peter -
DOIG, Emerson -
DOWLING, Steve -
KIDD, Michael -
MAYTOM, Paul -
O'CALLAGHAN, Greg -
VALENZISI, Tracey -
WESTON, George -
For full details of results see website –
www.pastvtr.elections.nsw.gov.au/LGE2012/leeton-shire-council.html
For a breakdown of voting by Vote Type (Ordinary, Declared Institution/Pre-poll,
Postal, Provisional/Silent) see the Councillor Election page of the above website, on
the Final Results tab select 04 - Enrolment and Voting by Aggregated Vote Type
Report.
Enrolment
Total Electors 7,375
Residential roll 7,375
Non-residential roll 0
SmartRolled Electors 556
(30/7/11 – 30/7/12)
Election Costs
Total Cost of the Leeton Shire Council 2012 Election
$20,818.00
Cost per elector
$2.83

REPORT ON THE 2012 LOCAL GOVERNMENT ELECTIONS
Leeton Shire Council
437
Leeton Shire Council Statutory Advertising Campaign Expenditure
Nominations $1,293.10
Candidates and polling places $0.00
Uncontested elections $200.16
Results $0.00
TOTAL $1,493.26
Election Services
Elector Enquiry Centre
The Elector Enquiry Centre answered 9 calls from postcodes within Leeton Shire
Council area.
NSWEC Website
There were 467 unique visitors to Leeton Shire Council election web page.
Braille Ballot Papers
No braille ballot papers were requested or printed.
Returning Officer
Matthew Farley
Returning Officer’s Office
Leeton Region Returning Officer's Office
18-22 Kurrajong Avenue
Leeton NSW 2705
Councils in Region
Carrathool Shire Council, Griffith City Council, Leeton Shire Council, Murrumbidgee
Shire Council and Narrandera Shire Council
Advertising
Statutory Campaign
The Council requested that the statutory advertisements be placed in the following
press:
The Irrigator
REPORT ON THE 2012 LOCAL GOVERNMENT ELECTIONS
Leeton Shire Council
438
Candidates
Nominations withdrawn
No Councillor nominations were withdrawn.
Councillor Candidates
Total Candidates 8
Female Candidates 1
Male Candidates 7

REPORT ON THE 2012 LOCAL GOVERNMENT ELECTIONS
Leeton Shire Council
439
Leeton Shire Council By-election
Report
By-election Summary
By-election held Saturday, 8 December, 2012
Poll declared Wednesday, 12 December, 2012
Councillor election, successful candidates
Councillor name Party Affiliation
MORRIS, Tracey -
For full details of results see website –
www.elections.nsw.gov.au/results/by-elections/local/2012/leeton_shire_council_by-
election_8_december_2012
For a breakdown of voting by Vote Type (Ordinary, Declared Institution/Pre-poll,
Postal, Enrolment, Provisional/Silent) see the results pages for Election Night and Post
Election Night of the above website.
Enrolment
Total Electors 7,357
Residential roll 7,357
Non-residential roll 0
Participation and Informality
Participation rate 76.1%
Formal votes 5,453
Informal votes 145
Total votes 5,598
Informality rate 2.6%
For details of participation and informality by ward see website –
www.pastvtr.elections.nsw.gov.au/LGE2012/lge-statistics.htm

REPORT ON THE 2012 LOCAL GOVERNMENT ELECTIONS
Leeton Shire Council
440
Failure to Vote
Penalty Notices Issued 1,504
Rate of Failure to Vote69 20.4%
Election Costs
Total Cost of the Leeton Shire Council 2012 Election
$39,019.79
Cost per elector
$5.30
Leeton Shire Council Statutory Advertising Campaign Expenditure
Nominations $295.42
Candidates and polling places $670.38
Uncontested elections $0.00
Results $90.89
TOTAL $1,056.69
Election Services
NSWEC Website
There were 649 unique visitors to Leeton Shire Council By-election web page.
Returning Officer
Margaret Todd
Returning Officer’s Office
Leeton Shire Council
23-25 Chelmsford Place
Leeton NSW 2705
Staffing
Office Manager 0
Senior Office Assistant 0
Office Assistants 2
Polling Place Managers 8
69 Percentage of Penalty Notices Issued to Enrolment (as shown on Authorised Roll)
REPORT ON THE 2012 LOCAL GOVERNMENT ELECTIONS
Leeton Shire Council
441
Polling Place Assistants 0
Deputy Polling Place Managers 0
Declaration Vote Issuing Officer 1
Election Officials 14
Council Count Manager 0
Part Day Election Officials 1
Total Staff 26
Polling Places
Pre-poll Centres 1
Declared Institutions 3
Election day Polling Places 8
Pre-poll centre locations
Leeton Shire Returning Officer's Office
Polling place locations
For map and polling places see –
www.elections.nsw.gov.au/results/by-elections/local/2012/leeton_shire_council_by-
election_8_december_2012/boundary_map_and_polling_places
Advertising
Statutory Campaign
The Council requested that the statutory advertisements be placed in the following
press:
The Irrigator
Candidates
Councillor Candidates
Total Candidates 7
Female Candidates 2
Male Candidates 5
Councillor Candidates Party Affiliation
BOARDMAN, Neil -
BRINK, Alan -
HOLDEN, Craig -
LOWRIE, Mick -
MORRIS, Tracey -
PROSSER, Amanda -
RENEKER, Tony -
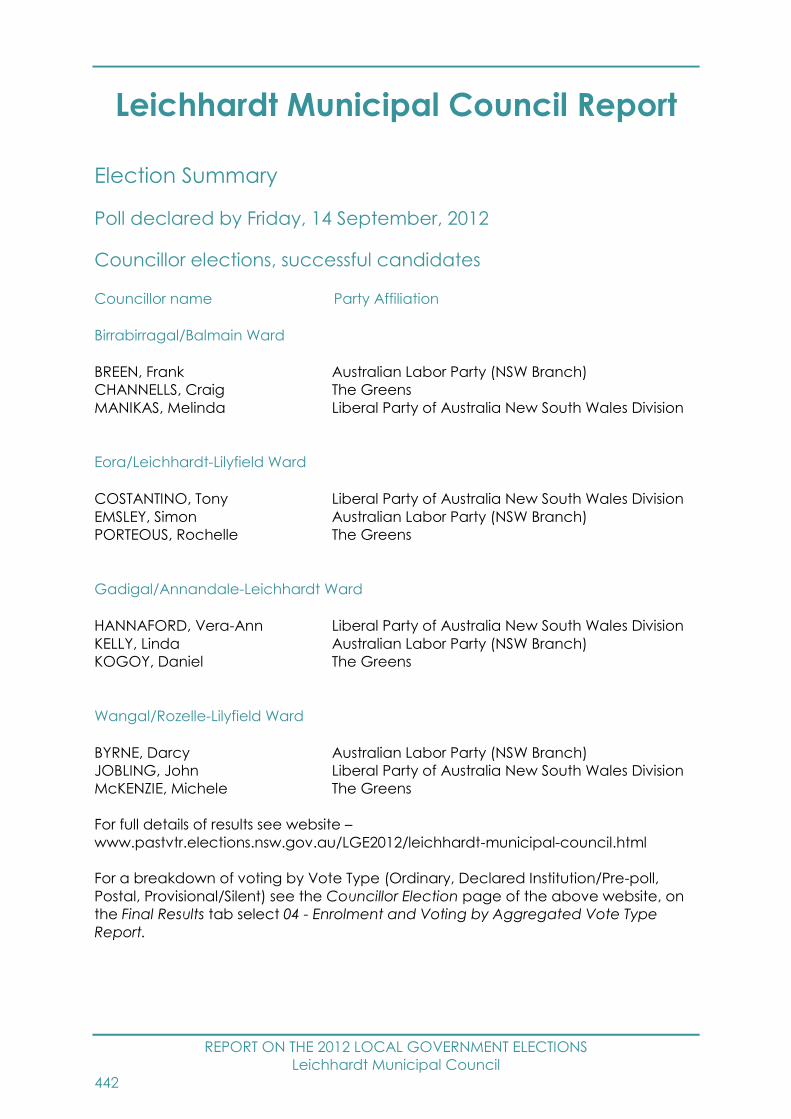
REPORT ON THE 2012 LOCAL GOVERNMENT ELECTIONS
Leichhardt Municipal Council
442
Leichhardt Municipal Council Report
Election Summary
Poll declared by Friday, 14 September, 2012
Councillor elections, successful candidates
Councillor name Party Affiliation
Birrabirragal/Balmain Ward
BREEN, Frank Australian Labor Party (NSW Branch)
CHANNELLS, Craig The Greens
MANIKAS, Melinda Liberal Party of Australia New South Wales Division
Eora/Leichhardt-Lilyfield Ward
COSTANTINO, Tony Liberal Party of Australia New South Wales Division
EMSLEY, Simon Australian Labor Party (NSW Branch)
PORTEOUS, Rochelle The Greens
Gadigal/Annandale-Leichhardt Ward
HANNAFORD, Vera-Ann Liberal Party of Australia New South Wales Division
KELLY, Linda Australian Labor Party (NSW Branch)
KOGOY, Daniel The Greens
Wangal/Rozelle-Lilyfield Ward
BYRNE, Darcy Australian Labor Party (NSW Branch)
JOBLING, John Liberal Party of Australia New South Wales Division
McKENZIE, Michele The Greens
For full details of results see website –
www.pastvtr.elections.nsw.gov.au/LGE2012/leichhardt-municipal-council.html
For a breakdown of voting by Vote Type (Ordinary, Declared Institution/Pre-poll,
Postal, Provisional/Silent) see the Councillor Election page of the above website, on
the Final Results tab select 04 - Enrolment and Voting by Aggregated Vote Type
Report.
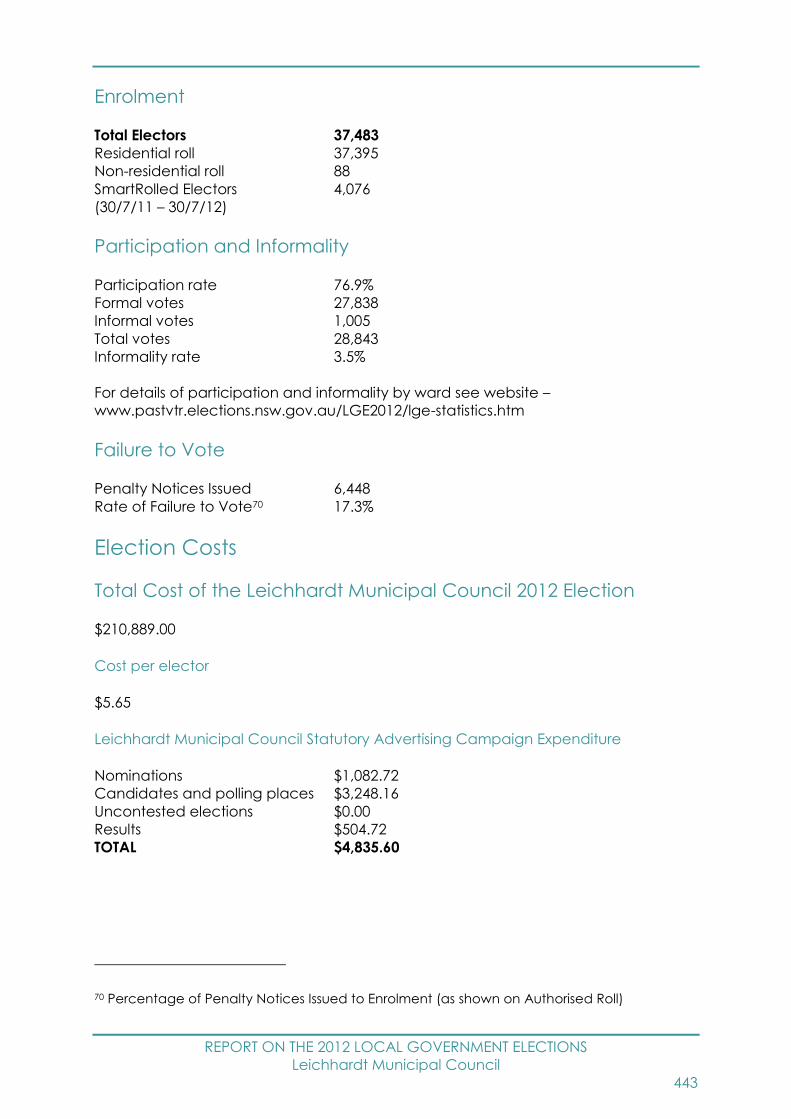
REPORT ON THE 2012 LOCAL GOVERNMENT ELECTIONS
Leichhardt Municipal Council
443
Enrolment
Total Electors 37,483
Residential roll 37,395
Non-residential roll 88
SmartRolled Electors 4,076
(30/7/11 – 30/7/12)
Participation and Informality
Participation rate 76.9%
Formal votes 27,838
Informal votes 1,005
Total votes 28,843
Informality rate 3.5%
For details of participation and informality by ward see website –
www.pastvtr.elections.nsw.gov.au/LGE2012/lge-statistics.htm
Failure to Vote
Penalty Notices Issued 6,448
Rate of Failure to Vote70 17.3%
Election Costs
Total Cost of the Leichhardt Municipal Council 2012 Election
$210,889.00
Cost per elector
$5.65
Leichhardt Municipal Council Statutory Advertising Campaign Expenditure
Nominations $1,082.72
Candidates and polling places $3,248.16
Uncontested elections $0.00
Results $504.72
TOTAL $4,835.60
70 Percentage of Penalty Notices Issued to Enrolment (as shown on Authorised Roll)
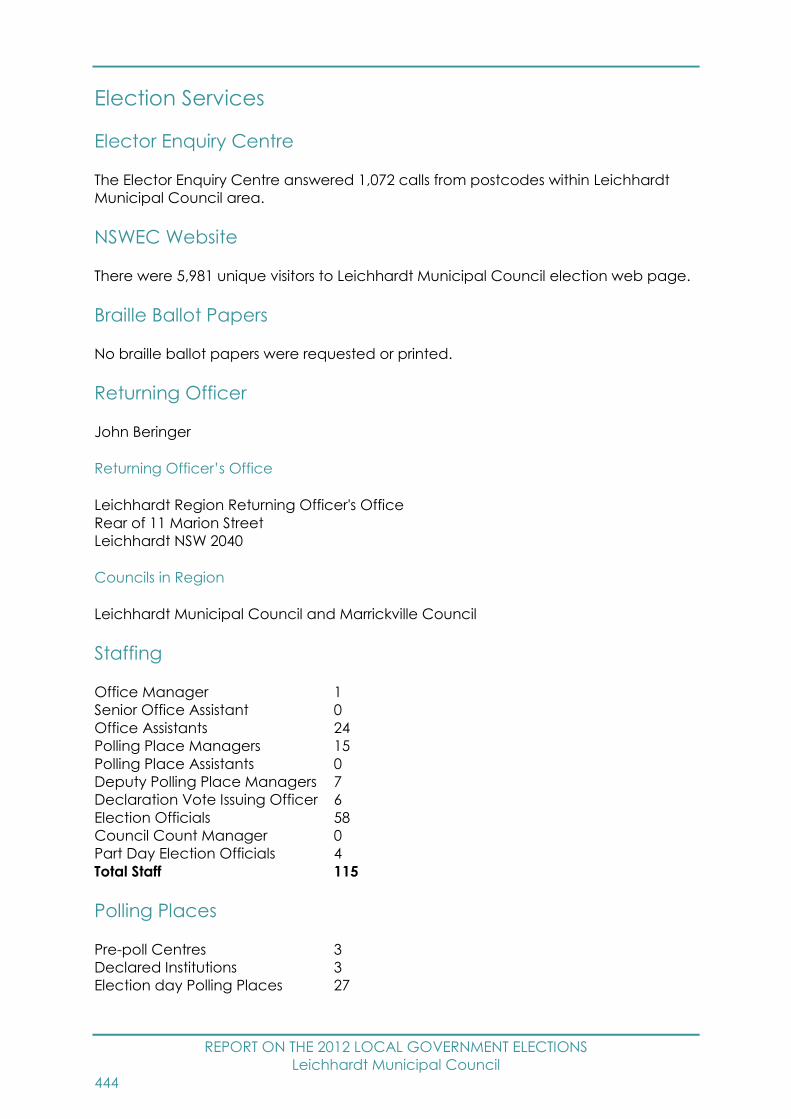
REPORT ON THE 2012 LOCAL GOVERNMENT ELECTIONS
Leichhardt Municipal Council
444
Election Services
Elector Enquiry Centre
The Elector Enquiry Centre answered 1,072 calls from postcodes within Leichhardt
Municipal Council area.
NSWEC Website
There were 5,981 unique visitors to Leichhardt Municipal Council election web page.
Braille Ballot Papers
No braille ballot papers were requested or printed.
Returning Officer
John Beringer
Returning Officer’s Office
Leichhardt Region Returning Officer's Office
Rear of 11 Marion Street
Leichhardt NSW 2040
Councils in Region
Leichhardt Municipal Council and Marrickville Council
Staffing
Office Manager 1
Senior Office Assistant 0
Office Assistants 24
Polling Place Managers 15
Polling Place Assistants 0
Deputy Polling Place Managers 7
Declaration Vote Issuing Officer 6
Election Officials 58
Council Count Manager 0
Part Day Election Officials 4
Total Staff 115
Polling Places
Pre-poll Centres 3
Declared Institutions 3
Election day Polling Places 27

REPORT ON THE 2012 LOCAL GOVERNMENT ELECTIONS
Leichhardt Municipal Council
445
Pre-poll centre locations
Leichhardt Pre-Poll, Leichhardt Region Returning Officer's Office, Sydney Town Hall
Polling place locations
For 2012 map and polling places see –
www.pastvtr.elections.nsw.gov.au/LGE2012/leichhardt-municipal-council.html
Advertising
Statutory Campaign
The Council requested that the statutory advertisements be placed in the following
press:
Inner Western Suburbs Courier
Candidates
Nominations withdrawn
No Councillor nominations were withdrawn.
Councillor Candidates
Total Candidates 43
Female Candidates 19
Male Candidates 24
Birrabirragal/Balmain Ward Councillor Candidates
Total Candidates 13
Female Candidates 6
Male Candidates 7
Eora/Leichhardt-Lilyfield Ward Councillor Candidates
Total Candidates 11
Female Candidates 4
Male Candidates 7
Gadigal/Annandale-Leichhardt Ward Councillor Candidates
Total Candidates 9
Female Candidates 4
Male Candidates 5

REPORT ON THE 2012 LOCAL GOVERNMENT ELECTIONS
Leichhardt Municipal Council
446
Wangal/Rozelle-Lilyfield WardCouncillor Candidates
Total Candidates 10
Female Candidates 5
Male Candidates 5
Names of all candidates
Councillor Candidates Party Affiliation
Birrabirragal/Balmain Ward
BREEN, Frank Australian Labor Party (NSW Branch)
BROOKS, Tracey -
CHANNELLS, Craig The Greens
CUNNINGTON, Ben -
FRANKHAM, Brian Australian Labor Party (NSW Branch)
GILLIES, John The Greens
HACKING, Kath -
HALFORD, Judith Liberal Party of Australia New South Wales Division
LEEDHAM, Steffi The Greens
MANIKAS, Melinda Liberal Party of Australia New South Wales Division
MOXHAM-HALL, Vivienne Australian Labor Party (NSW Branch)
STAMOLIS, John -
ZABAKLY, Theo Liberal Party of Australia New South Wales Division
Eora/Leichhardt-Lilyfield Ward
BRACCI, Christian Liberal Party of Australia New South Wales Division
CARROLL, Roger -
COSTANTINO, Tony Liberal Party of Australia New South Wales Division
CUNICH, Michelle Liberal Party of Australia New South Wales Division
EMSLEY, Simon Australian Labor Party (NSW Branch)
GIBSON, Helen Australian Labor Party (NSW Branch)
GREENLAND, Hall The Greens
PISACANE, Nicola -
PLATE, Cassi The Greens
PORTEOUS, Rochelle The Greens
WEBB, Robert Australian Labor Party (NSW Branch)
Gadigal/Annandale-Leichhardt Ward
BHATT, Neerav The Greens
FIELD, Anna Liberal Party of Australia New South Wales Division
FRY-KONTAXIS, Leon Australian Labor Party (NSW Branch)
HANNAFORD, Vera-Ann Liberal Party of Australia New South Wales Division
HEBBLEWHITE, Mark Australian Labor Party (NSW Branch)
KELLY, Linda Australian Labor Party (NSW Branch)
KOGOY, Daniel The Greens
LANGTREE, Sandra The Greens
SPERANZA, Tony Liberal Party of Australia New South Wales Division
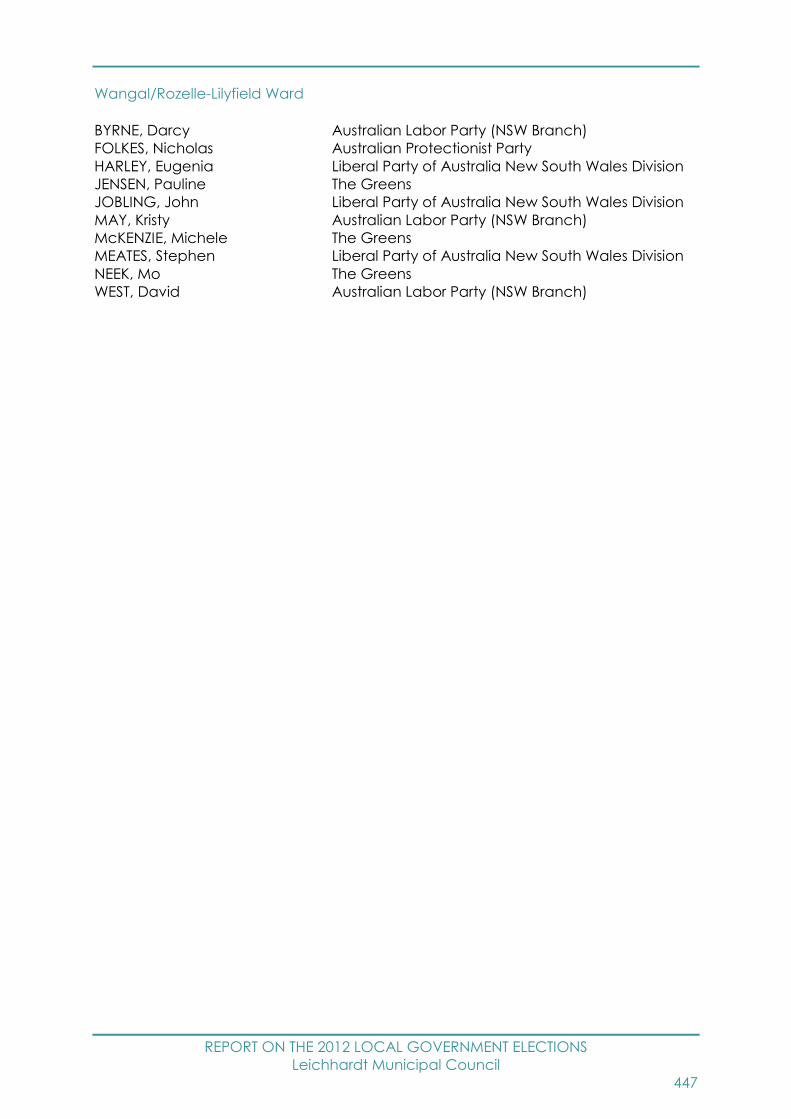
REPORT ON THE 2012 LOCAL GOVERNMENT ELECTIONS
Leichhardt Municipal Council
447
Wangal/Rozelle-Lilyfield Ward
BYRNE, Darcy Australian Labor Party (NSW Branch)
FOLKES, Nicholas Australian Protectionist Party
HARLEY, Eugenia Liberal Party of Australia New South Wales Division
JENSEN, Pauline The Greens
JOBLING, John Liberal Party of Australia New South Wales Division
MAY, Kristy Australian Labor Party (NSW Branch)
McKENZIE, Michele The Greens
MEATES, Stephen Liberal Party of Australia New South Wales Division
NEEK, Mo The Greens
WEST, David Australian Labor Party (NSW Branch)
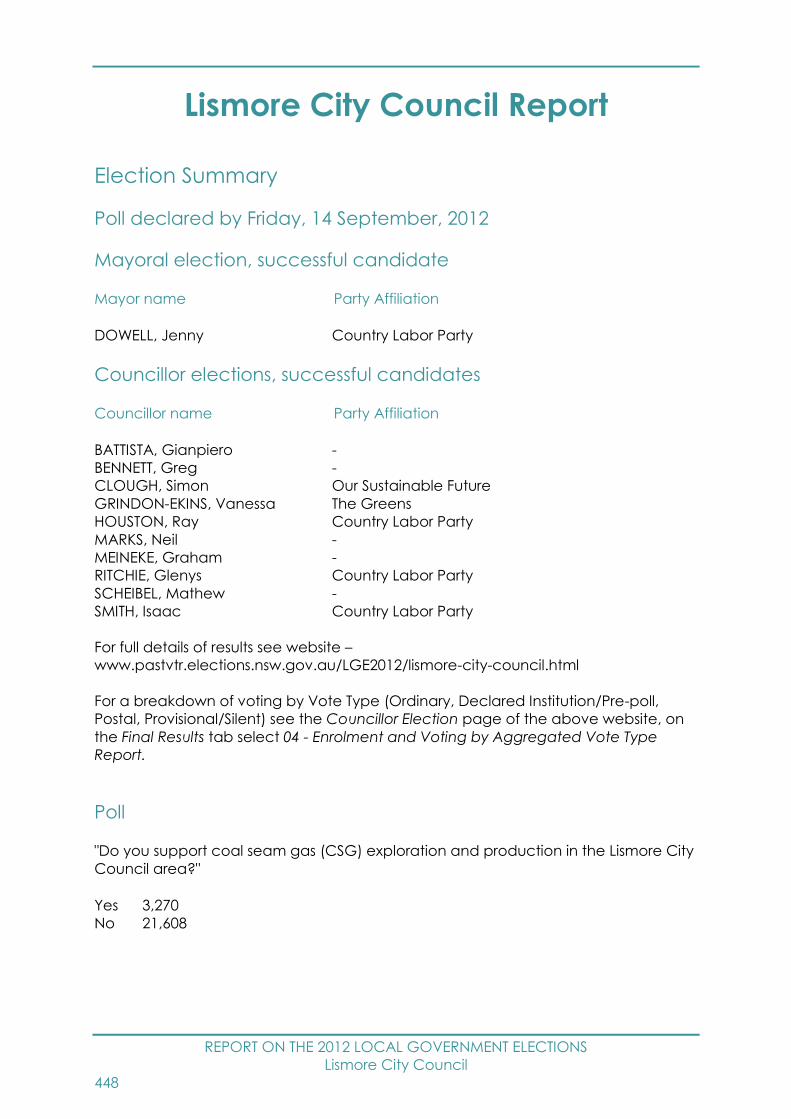
REPORT ON THE 2012 LOCAL GOVERNMENT ELECTIONS
Lismore City Council
448
Lismore City Council Report
Election Summary
Poll declared by Friday, 14 September, 2012
Mayoral election, successful candidate
Mayor name Party Affiliation
DOWELL, Jenny Country Labor Party
Councillor elections, successful candidates
Councillor name Party Affiliation
BATTISTA, Gianpiero -
BENNETT, Greg -
CLOUGH, Simon Our Sustainable Future
GRINDON-EKINS, Vanessa The Greens
HOUSTON, Ray Country Labor Party
MARKS, Neil -
MEINEKE, Graham -
RITCHIE, Glenys Country Labor Party
SCHEIBEL, Mathew -
SMITH, Isaac Country Labor Party
For full details of results see website –
www.pastvtr.elections.nsw.gov.au/LGE2012/lismore-city-council.html
For a breakdown of voting by Vote Type (Ordinary, Declared Institution/Pre-poll,
Postal, Provisional/Silent) see the Councillor Election page of the above website, on
the Final Results tab select 04 - Enrolment and Voting by Aggregated Vote Type
Report.
Poll
"Do you support coal seam gas (CSG) exploration and production in the Lismore City
Council area?"
Yes 3,270
No 21,608
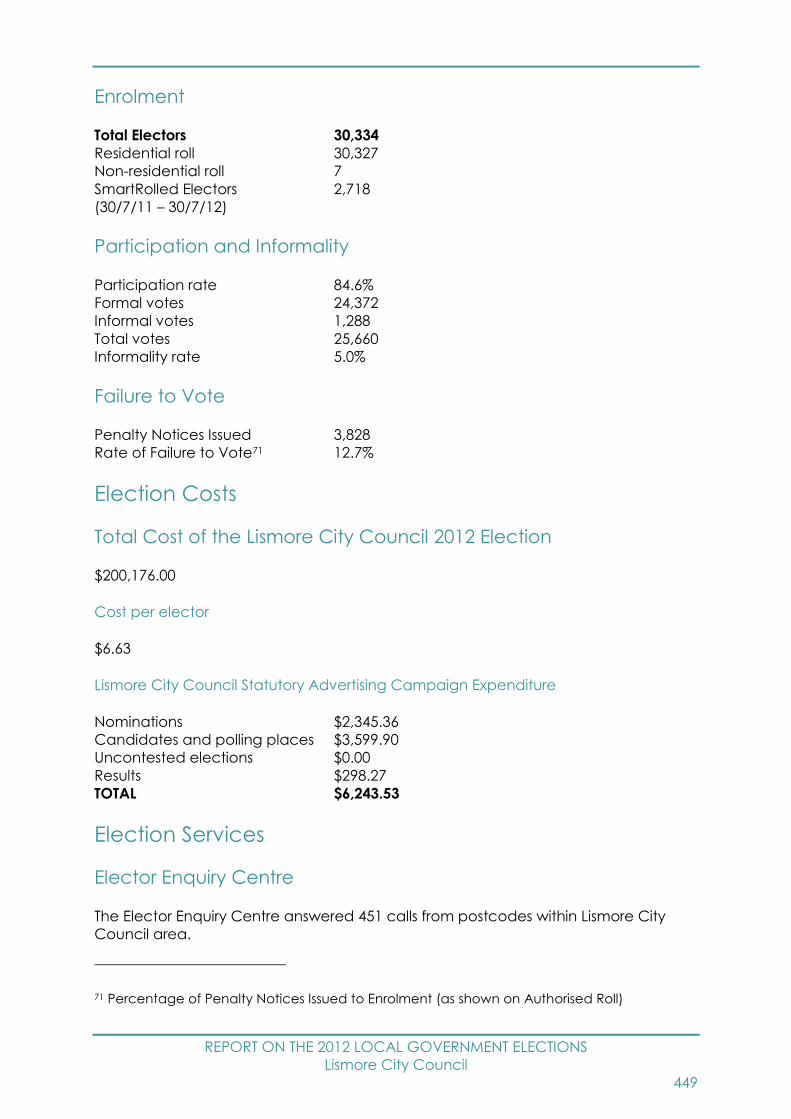
REPORT ON THE 2012 LOCAL GOVERNMENT ELECTIONS
Lismore City Council
449
Enrolment
Total Electors 30,334
Residential roll 30,327
Non-residential roll 7
SmartRolled Electors 2,718
(30/7/11 – 30/7/12)
Participation and Informality
Participation rate 84.6%
Formal votes 24,372
Informal votes 1,288
Total votes 25,660
Informality rate 5.0%
Failure to Vote
Penalty Notices Issued 3,828
Rate of Failure to Vote71 12.7%
Election Costs
Total Cost of the Lismore City Council 2012 Election
$200,176.00
Cost per elector
$6.63
Lismore City Council Statutory Advertising Campaign Expenditure
Nominations $2,345.36
Candidates and polling places $3,599.90
Uncontested elections $0.00
Results $298.27
TOTAL $6,243.53
Election Services
Elector Enquiry Centre
The Elector Enquiry Centre answered 451 calls from postcodes within Lismore City
Council area.
71 Percentage of Penalty Notices Issued to Enrolment (as shown on Authorised Roll)

REPORT ON THE 2012 LOCAL GOVERNMENT ELECTIONS
Lismore City Council
450
NSWEC Website
There were 2,389 unique visitors to Lismore City Council election web page.
Braille Ballot Papers
No braille ballot papers were requested or printed.
Returning Officer
Clifford Mitchell
Returning Officer’s Office
Clarence Region Returning Officer's Office
15 Prince Street
Grafton NSW 2460
Councils in Region
Clarence Valley Council, Kyogle Council, Lismore City Council and Richmond Valley
Council
Staffing
Office Manager 1
Senior Office Assistant 0
Office Assistants 0
Polling Place Managers 19
Polling Place Assistants 27
Deputy Polling Place Managers 5
Declaration Vote Issuing Officer 0
Election Officials 50
Council Count Manager 2
Part Day Election Officials 3
Total Staff 107
Polling Places
Pre-poll Centres 3
Declared Institutions 6
Election day Polling Places 20
Pre-poll centre locations
Clarence Region Returning Officer's Office, Lismore Pre-Poll, Sydney Town Hall
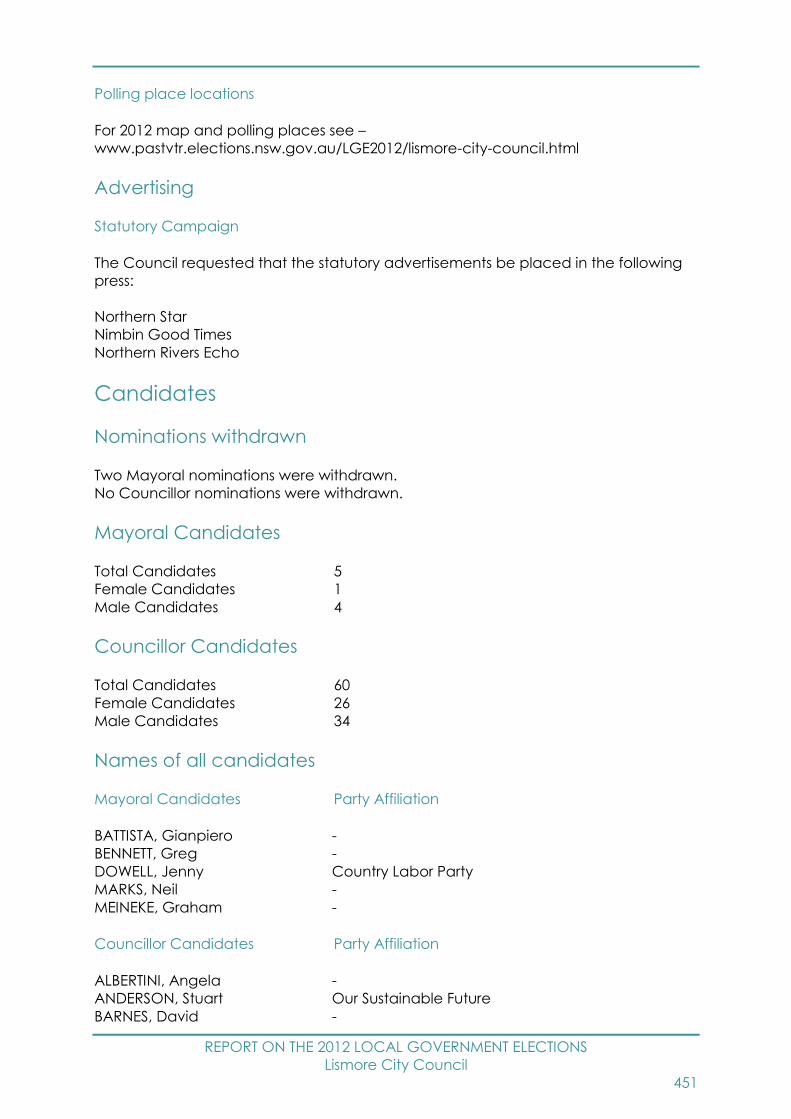
REPORT ON THE 2012 LOCAL GOVERNMENT ELECTIONS
Lismore City Council
451
Polling place locations
For 2012 map and polling places see –
www.pastvtr.elections.nsw.gov.au/LGE2012/lismore-city-council.html
Advertising
Statutory Campaign
The Council requested that the statutory advertisements be placed in the following
press:
Northern Star
Nimbin Good Times
Northern Rivers Echo
Candidates
Nominations withdrawn
Two Mayoral nominations were withdrawn.
No Councillor nominations were withdrawn.
Mayoral Candidates
Total Candidates 5
Female Candidates 1
Male Candidates 4
Councillor Candidates
Total Candidates 60
Female Candidates 26
Male Candidates 34
Names of all candidates
Mayoral Candidates Party Affiliation
BATTISTA, Gianpiero -
BENNETT, Greg -
DOWELL, Jenny Country Labor Party
MARKS, Neil -
MEINEKE, Graham -
Councillor Candidates Party Affiliation
ALBERTINI, Angela -
ANDERSON, Stuart Our Sustainable Future
BARNES, David -
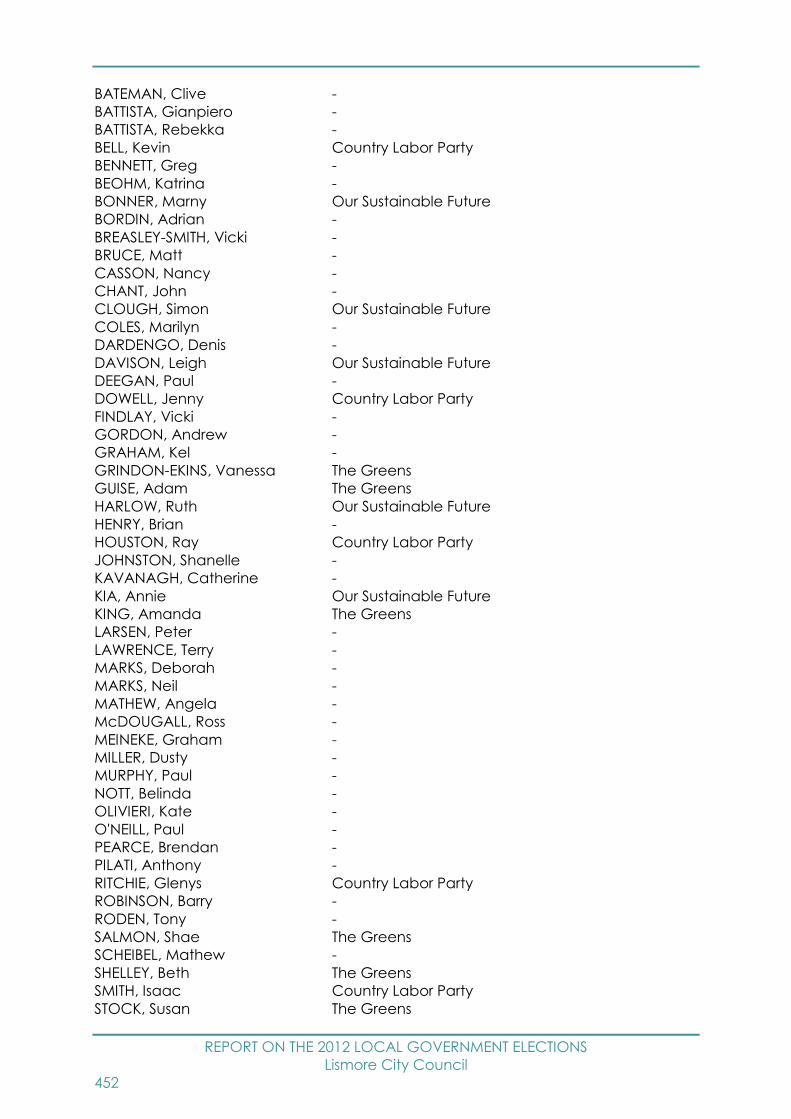
REPORT ON THE 2012 LOCAL GOVERNMENT ELECTIONS
Lismore City Council
452
BATEMAN, Clive -
BATTISTA, Gianpiero -
BATTISTA, Rebekka -
BELL, Kevin Country Labor Party
BENNETT, Greg -
BEOHM, Katrina -
BONNER, Marny Our Sustainable Future
BORDIN, Adrian -
BREASLEY-SMITH, Vicki -
BRUCE, Matt -
CASSON, Nancy -
CHANT, John -
CLOUGH, Simon Our Sustainable Future
COLES, Marilyn -
DARDENGO, Denis -
DAVISON, Leigh Our Sustainable Future
DEEGAN, Paul -
DOWELL, Jenny Country Labor Party
FINDLAY, Vicki -
GORDON, Andrew -
GRAHAM, Kel -
GRINDON-EKINS, Vanessa The Greens
GUISE, Adam The Greens
HARLOW, Ruth Our Sustainable Future
HENRY, Brian -
HOUSTON, Ray Country Labor Party
JOHNSTON, Shanelle -
KAVANAGH, Catherine -
KIA, Annie Our Sustainable Future
KING, Amanda The Greens
LARSEN, Peter -
LAWRENCE, Terry -
MARKS, Deborah -
MARKS, Neil -
MATHEW, Angela -
McDOUGALL, Ross -
MEINEKE, Graham -
MILLER, Dusty -
MURPHY, Paul -
NOTT, Belinda -
OLIVIERI, Kate -
O'NEILL, Paul -
PEARCE, Brendan -
PILATI, Anthony -
RITCHIE, Glenys Country Labor Party
ROBINSON, Barry -
RODEN, Tony -
SALMON, Shae The Greens
SCHEIBEL, Mathew -
SHELLEY, Beth The Greens
SMITH, Isaac Country Labor Party
STOCK, Susan The Greens
REPORT ON THE 2012 LOCAL GOVERNMENT ELECTIONS
Lismore City Council
453
SYMONS, Scout -
VERARDO, Sante -
WOODHAM, Nick -
WORRALL, Naomi Country Labor Party
YARNALL, David -
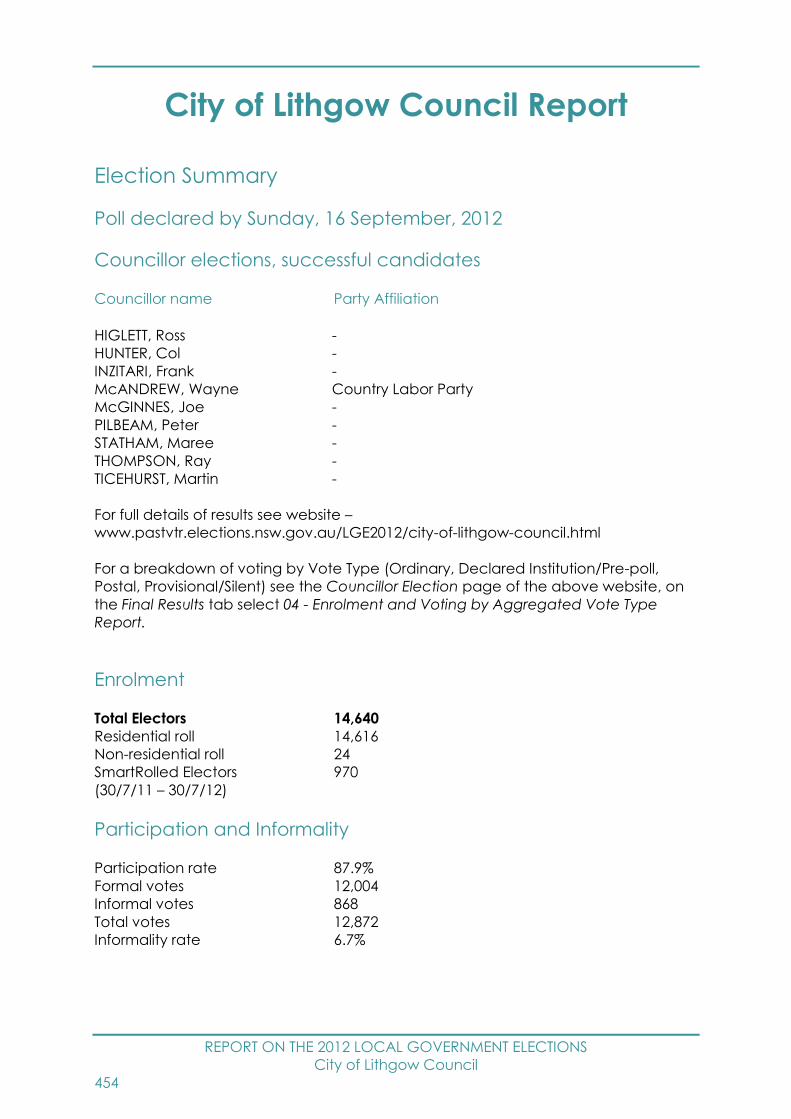
REPORT ON THE 2012 LOCAL GOVERNMENT ELECTIONS
City of Lithgow Council
454
City of Lithgow Council Report
Election Summary
Poll declared by Sunday, 16 September, 2012
Councillor elections, successful candidates
Councillor name Party Affiliation
HIGLETT, Ross -
HUNTER, Col -
INZITARI, Frank -
McANDREW, Wayne Country Labor Party
McGINNES, Joe -
PILBEAM, Peter -
STATHAM, Maree -
THOMPSON, Ray -
TICEHURST, Martin -
For full details of results see website –
www.pastvtr.elections.nsw.gov.au/LGE2012/city-of-lithgow-council.html
For a breakdown of voting by Vote Type (Ordinary, Declared Institution/Pre-poll,
Postal, Provisional/Silent) see the Councillor Election page of the above website, on
the Final Results tab select 04 - Enrolment and Voting by Aggregated Vote Type
Report.
Enrolment
Total Electors 14,640
Residential roll 14,616
Non-residential roll 24
SmartRolled Electors 970
(30/7/11 – 30/7/12)
Participation and Informality
Participation rate 87.9%
Formal votes 12,004
Informal votes 868
Total votes 12,872
Informality rate 6.7%
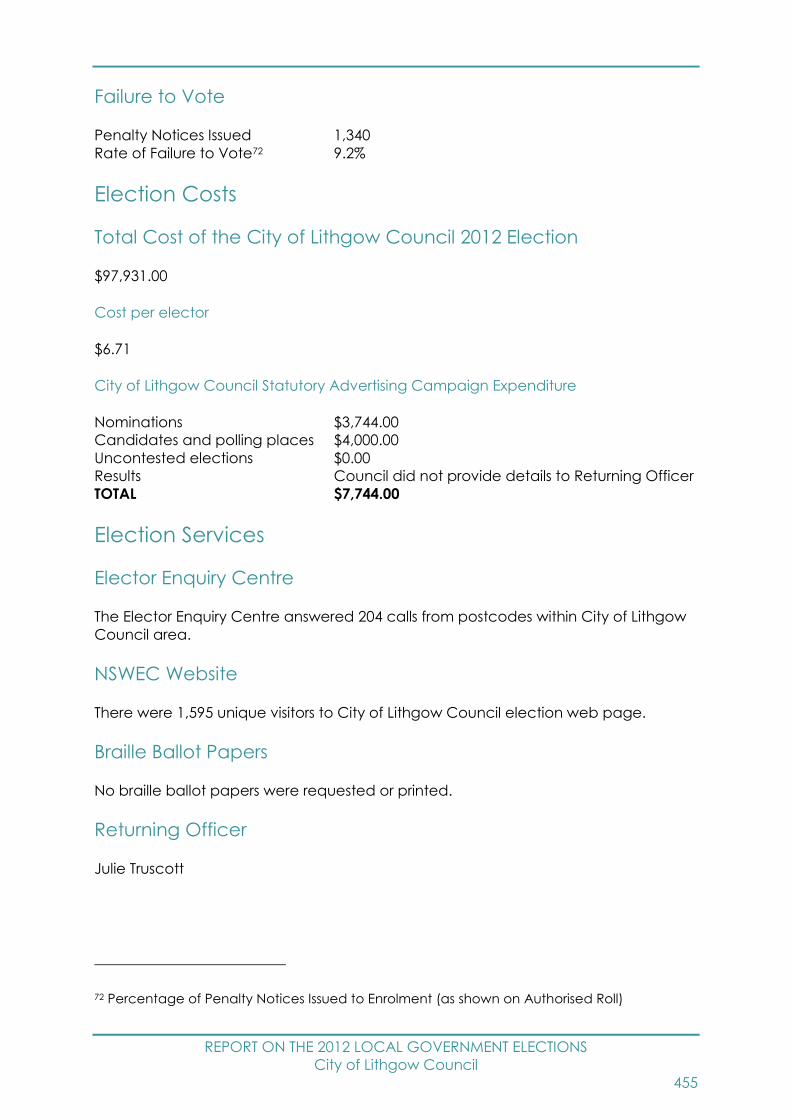
REPORT ON THE 2012 LOCAL GOVERNMENT ELECTIONS
City of Lithgow Council
455
Failure to Vote
Penalty Notices Issued 1,340
Rate of Failure to Vote72 9.2%
Election Costs
Total Cost of the City of Lithgow Council 2012 Election
$97,931.00
Cost per elector
$6.71
City of Lithgow Council Statutory Advertising Campaign Expenditure
Nominations $3,744.00
Candidates and polling places $4,000.00
Uncontested elections $0.00
Results Council did not provide details to Returning Officer
TOTAL $7,744.00
Election Services
Elector Enquiry Centre
The Elector Enquiry Centre answered 204 calls from postcodes within City of Lithgow
Council area.
NSWEC Website
There were 1,595 unique visitors to City of Lithgow Council election web page.
Braille Ballot Papers
No braille ballot papers were requested or printed.
Returning Officer
Julie Truscott
72 Percentage of Penalty Notices Issued to Enrolment (as shown on Authorised Roll)

REPORT ON THE 2012 LOCAL GOVERNMENT ELECTIONS
City of Lithgow Council
456
Returning Officer’s Office
Blue Mountains Region Returning Officer's Office
Town Centre Arcade
Shops 10-13, 81-83 Katoomba Street
Katoomba NSW 2780
Councils in Region
Blue Mountains City Council and Lithgow City Council
Staffing
Office Manager 1
Senior Office Assistant 0
Office Assistants 0
Polling Place Managers 16
Polling Place Assistants 0
Deputy Polling Place Managers 0
Declaration Vote Issuing Officer 0
Election Officials 23
Council Count Manager 0
Part Day Election Officials 4
Total Staff 44
Polling Places
Pre-poll Centres 3
Declared Institutions 5
Election day Polling Places 17
Pre-poll centre locations
Blue Mountains Region Returning Officer's Office, Lithgow Pre-Poll, Sydney Town Hall
Polling place locations
For 2012 map and polling places see –
www.pastvtr.elections.nsw.gov.au/LGE2012/city-of-lithgow-council.html
Advertising
Statutory Campaign
The Council requested that the statutory advertisements be placed in the following
press:
Lithgow Mercury
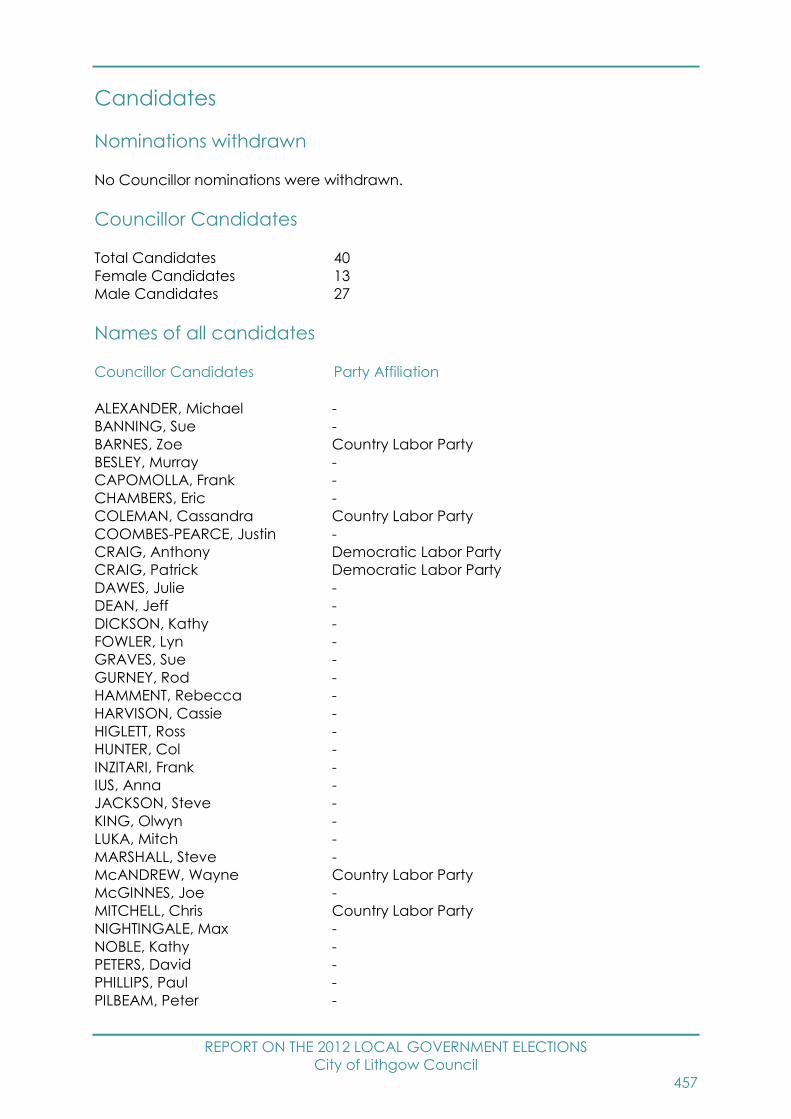
REPORT ON THE 2012 LOCAL GOVERNMENT ELECTIONS
City of Lithgow Council
457
Candidates
Nominations withdrawn
No Councillor nominations were withdrawn.
Councillor Candidates
Total Candidates 40
Female Candidates 13
Male Candidates 27
Names of all candidates
Councillor Candidates Party Affiliation
ALEXANDER, Michael -
BANNING, Sue -
BARNES, Zoe Country Labor Party
BESLEY, Murray -
CAPOMOLLA, Frank -
CHAMBERS, Eric -
COLEMAN, Cassandra Country Labor Party
COOMBES-PEARCE, Justin -
CRAIG, Anthony Democratic Labor Party
CRAIG, Patrick Democratic Labor Party
DAWES, Julie -
DEAN, Jeff -
DICKSON, Kathy -
FOWLER, Lyn -
GRAVES, Sue -
GURNEY, Rod -
HAMMENT, Rebecca -
HARVISON, Cassie -
HIGLETT, Ross -
HUNTER, Col -
INZITARI, Frank -
IUS, Anna -
JACKSON, Steve -
KING, Olwyn -
LUKA, Mitch -
MARSHALL, Steve -
McANDREW, Wayne Country Labor Party
McGINNES, Joe -
MITCHELL, Chris Country Labor Party
NIGHTINGALE, Max -
NOBLE, Kathy -
PETERS, David -
PHILLIPS, Paul -
PILBEAM, Peter -
REPORT ON THE 2012 LOCAL GOVERNMENT ELECTIONS
City of Lithgow Council
458
RAY, Chris -
STATHAM, Maree -
THOMPSON, Ray -
THURLOW, Jeff Country Labor Party
TICEHURST, Martin -
WIGGINS, Lee -
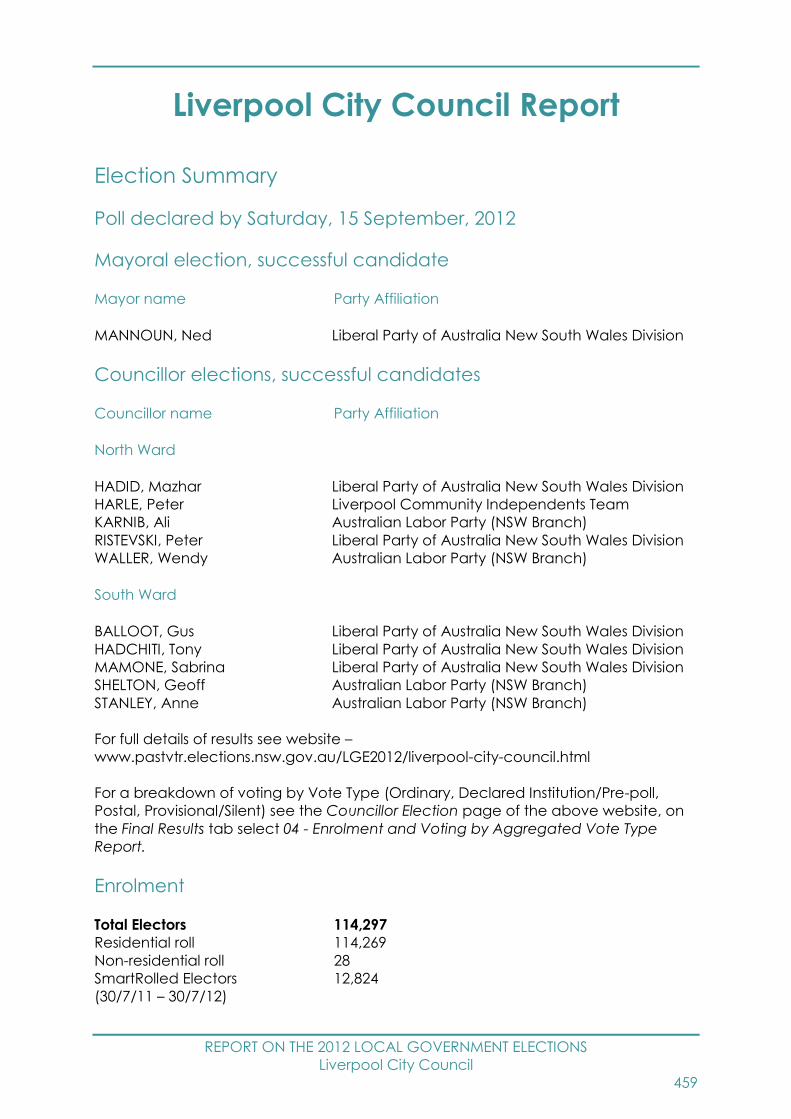
REPORT ON THE 2012 LOCAL GOVERNMENT ELECTIONS
Liverpool City Council
459
Liverpool City Council Report
Election Summary
Poll declared by Saturday, 15 September, 2012
Mayoral election, successful candidate
Mayor name Party Affiliation
MANNOUN, Ned Liberal Party of Australia New South Wales Division
Councillor elections, successful candidates
Councillor name Party Affiliation
North Ward
HADID, Mazhar Liberal Party of Australia New South Wales Division
HARLE, Peter Liverpool Community Independents Team
KARNIB, Ali Australian Labor Party (NSW Branch)
RISTEVSKI, Peter Liberal Party of Australia New South Wales Division
WALLER, Wendy Australian Labor Party (NSW Branch)
South Ward
BALLOOT, Gus Liberal Party of Australia New South Wales Division
HADCHITI, Tony Liberal Party of Australia New South Wales Division
MAMONE, Sabrina Liberal Party of Australia New South Wales Division
SHELTON, Geoff Australian Labor Party (NSW Branch)
STANLEY, Anne Australian Labor Party (NSW Branch)
For full details of results see website –
www.pastvtr.elections.nsw.gov.au/LGE2012/liverpool-city-council.html
For a breakdown of voting by Vote Type (Ordinary, Declared Institution/Pre-poll,
Postal, Provisional/Silent) see the Councillor Election page of the above website, on
the Final Results tab select 04 - Enrolment and Voting by Aggregated Vote Type
Report.
Enrolment
Total Electors 114,297
Residential roll 114,269
Non-residential roll 28
SmartRolled Electors 12,824
(30/7/11 – 30/7/12)

REPORT ON THE 2012 LOCAL GOVERNMENT ELECTIONS
Liverpool City Council
460
Participation and Informality
Participation rate 84.1%
Formal votes 83,182
Informal votes 12,998
Total votes 96,180
Informality rate 13.5%
For details of participation and informality by ward see website –
www.pastvtr.elections.nsw.gov.au/LGE2012/lge-statistics.htm
Failure to Vote
Penalty Notices Issued 14,106
Rate of Failure to Vote73 12.4%
Election Costs
Total Cost of the Liverpool City Council 2012 Election
$671,202.00
Cost per elector
$5.89
Liverpool City Council Statutory Advertising Campaign Expenditure
Nominations $2,612.50
Candidates and polling places $8,404.42
Uncontested elections $0.00
Results $1,768.88
TOTAL $12,785.80
Election Services
Elector Enquiry Centre
The Elector Enquiry Centre answered 1,760 calls from postcodes within Liverpool City
Council area.
NSWEC Website
There were 8,204 unique visitors to Liverpool City Council election web page.
73 Percentage of Penalty Notices Issued to Enrolment (as shown on Authorised Roll)
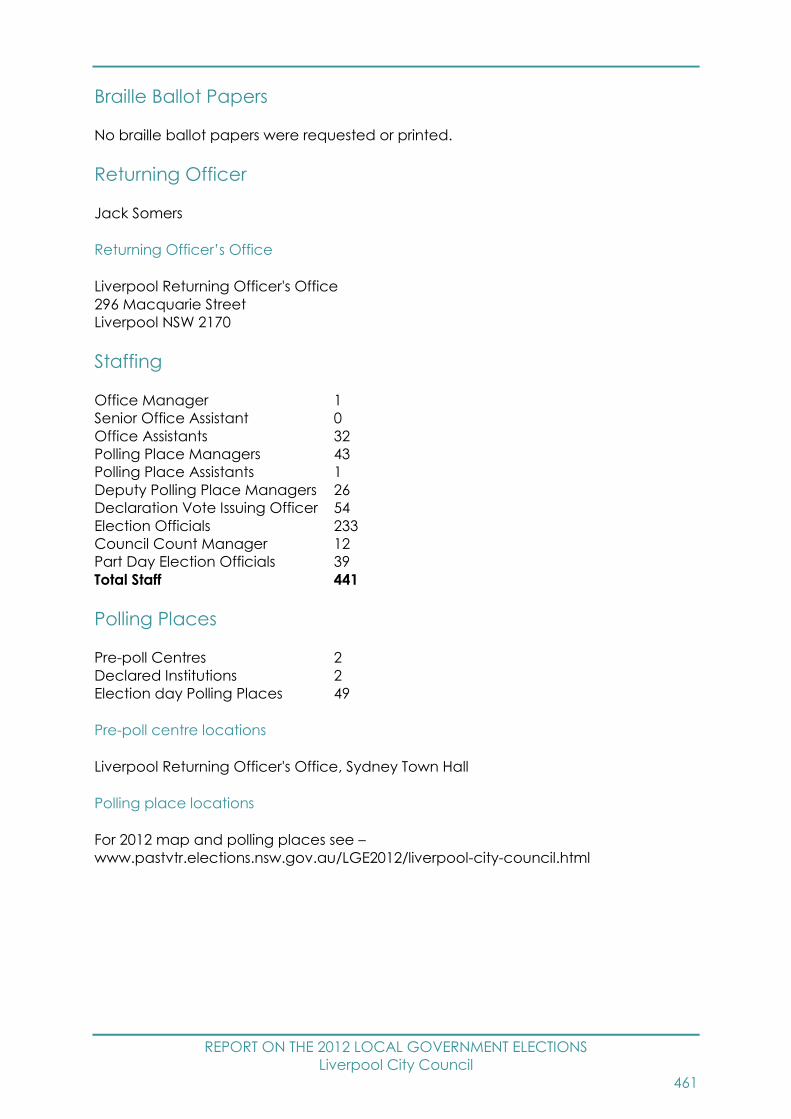
REPORT ON THE 2012 LOCAL GOVERNMENT ELECTIONS
Liverpool City Council
461
Braille Ballot Papers
No braille ballot papers were requested or printed.
Returning Officer
Jack Somers
Returning Officer’s Office
Liverpool Returning Officer's Office
296 Macquarie Street
Liverpool NSW 2170
Staffing
Office Manager 1
Senior Office Assistant 0
Office Assistants 32
Polling Place Managers 43
Polling Place Assistants 1
Deputy Polling Place Managers 26
Declaration Vote Issuing Officer 54
Election Officials 233
Council Count Manager 12
Part Day Election Officials 39
Total Staff 441
Polling Places
Pre-poll Centres 2
Declared Institutions 2
Election day Polling Places 49
Pre-poll centre locations
Liverpool Returning Officer's Office, Sydney Town Hall
Polling place locations
For 2012 map and polling places see –
www.pastvtr.elections.nsw.gov.au/LGE2012/liverpool-city-council.html

REPORT ON THE 2012 LOCAL GOVERNMENT ELECTIONS
Liverpool City Council
462
Advertising
Statutory Campaign
The Council requested that the statutory advertisements be placed in the following
press:
Liverpool Leader
Liverpool Champion
El Telegraph (Arabic)
Chieu Dong (Vietnamese)
Indian Link (Hindi)
South West Advertiser
Candidates
Nominations withdrawn
No Mayoral nominations were withdrawn.
No Councillor nominations were withdrawn.
Mayoral Candidates
Total Candidates 7
Female Candidates 3
Male Candidates 4
Councillor Candidates
Total Candidates 63
Female Candidates 19
Male Candidates 44
North Ward Councillor Candidates
Total Candidates 27
Female Candidates 8
Male Candidates 19
South Ward Councillor Candidates
Total Candidates 36
Female Candidates 11
Male Candidates 25
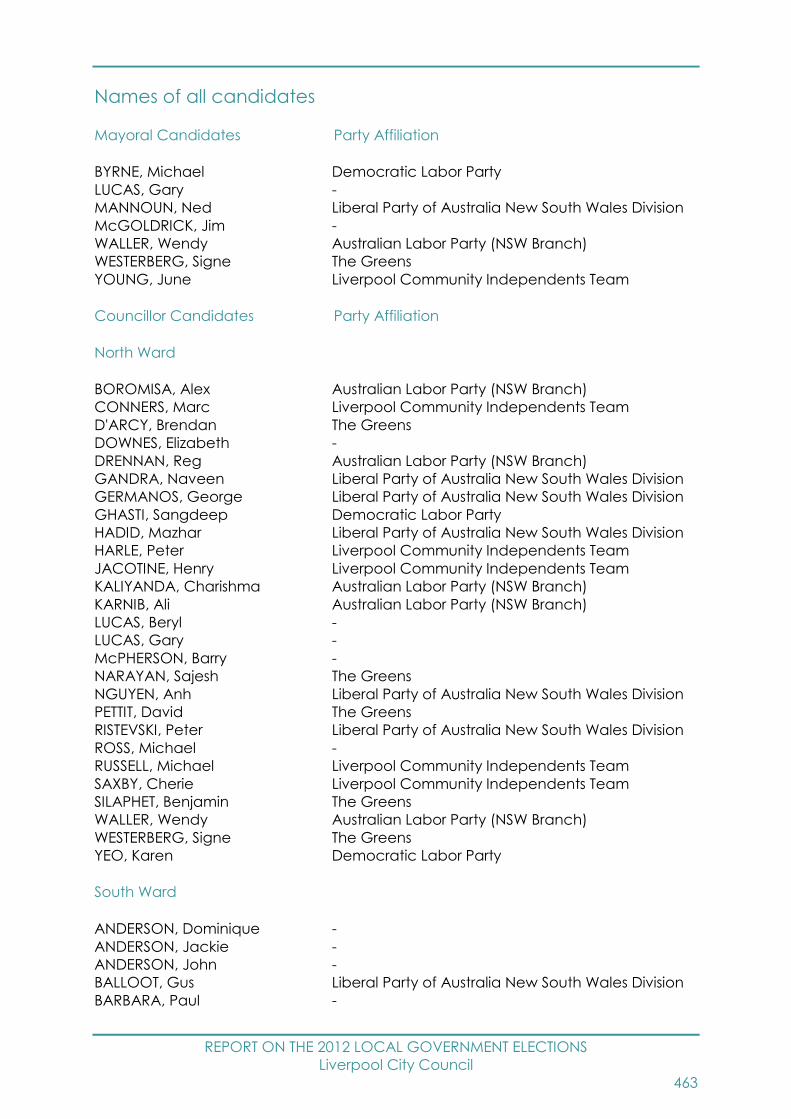
REPORT ON THE 2012 LOCAL GOVERNMENT ELECTIONS
Liverpool City Council
463
Names of all candidates
Mayoral Candidates Party Affiliation
BYRNE, Michael Democratic Labor Party
LUCAS, Gary -
MANNOUN, Ned Liberal Party of Australia New South Wales Division
McGOLDRICK, Jim -
WALLER, Wendy Australian Labor Party (NSW Branch)
WESTERBERG, Signe The Greens
YOUNG, June Liverpool Community Independents Team
Councillor Candidates Party Affiliation
North Ward
BOROMISA, Alex Australian Labor Party (NSW Branch)
CONNERS, Marc Liverpool Community Independents Team
D'ARCY, Brendan The Greens
DOWNES, Elizabeth -
DRENNAN, Reg Australian Labor Party (NSW Branch)
GANDRA, Naveen Liberal Party of Australia New South Wales Division
GERMANOS, George Liberal Party of Australia New South Wales Division
GHASTI, Sangdeep Democratic Labor Party
HADID, Mazhar Liberal Party of Australia New South Wales Division
HARLE, Peter Liverpool Community Independents Team
JACOTINE, Henry Liverpool Community Independents Team
KALIYANDA, Charishma Australian Labor Party (NSW Branch)
KARNIB, Ali Australian Labor Party (NSW Branch)
LUCAS, Beryl -
LUCAS, Gary -
McPHERSON, Barry -
NARAYAN, Sajesh The Greens
NGUYEN, Anh Liberal Party of Australia New South Wales Division
PETTIT, David The Greens
RISTEVSKI, Peter Liberal Party of Australia New South Wales Division
ROSS, Michael -
RUSSELL, Michael Liverpool Community Independents Team
SAXBY, Cherie Liverpool Community Independents Team
SILAPHET, Benjamin The Greens
WALLER, Wendy Australian Labor Party (NSW Branch)
WESTERBERG, Signe The Greens
YEO, Karen Democratic Labor Party
South Ward
ANDERSON, Dominique -
ANDERSON, Jackie -
ANDERSON, John -
BALLOOT, Gus Liberal Party of Australia New South Wales Division
BARBARA, Paul -
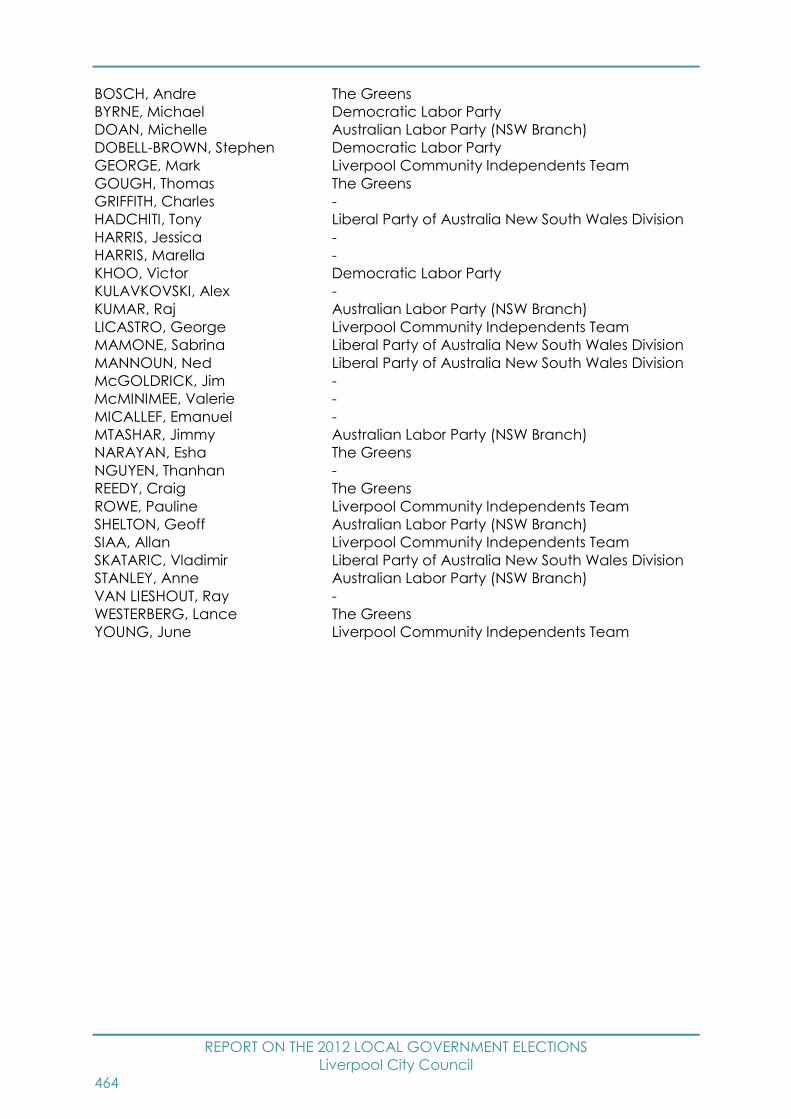
REPORT ON THE 2012 LOCAL GOVERNMENT ELECTIONS
Liverpool City Council
464
BOSCH, Andre The Greens
BYRNE, Michael Democratic Labor Party
DOAN, Michelle Australian Labor Party (NSW Branch)
DOBELL-BROWN, Stephen Democratic Labor Party
GEORGE, Mark Liverpool Community Independents Team
GOUGH, Thomas The Greens
GRIFFITH, Charles -
HADCHITI, Tony Liberal Party of Australia New South Wales Division
HARRIS, Jessica -
HARRIS, Marella -
KHOO, Victor Democratic Labor Party
KULAVKOVSKI, Alex -
KUMAR, Raj Australian Labor Party (NSW Branch)
LICASTRO, George Liverpool Community Independents Team
MAMONE, Sabrina Liberal Party of Australia New South Wales Division
MANNOUN, Ned Liberal Party of Australia New South Wales Division
McGOLDRICK, Jim -
McMINIMEE, Valerie -
MICALLEF, Emanuel -
MTASHAR, Jimmy Australian Labor Party (NSW Branch)
NARAYAN, Esha The Greens
NGUYEN, Thanhan -
REEDY, Craig The Greens
ROWE, Pauline Liverpool Community Independents Team
SHELTON, Geoff Australian Labor Party (NSW Branch)
SIAA, Allan Liverpool Community Independents Team
SKATARIC, Vladimir Liberal Party of Australia New South Wales Division
STANLEY, Anne Australian Labor Party (NSW Branch)
VAN LIESHOUT, Ray -
WESTERBERG, Lance The Greens
YOUNG, June Liverpool Community Independents Team

REPORT ON THE 2012 LOCAL GOVERNMENT ELECTIONS
Liverpool Plains Shire Council
465
Liverpool Plains Shire Council Report
Election Summary
Poll declared by Wednesday, 12 September, 2012
Councillor elections, successful candidates
Councillor name Party Affiliation
CUDMORE, Ken -
HOPE, Andrew -
LAURIE, Andrew -
LOBSEY, Ian -
ROBERTS, Mary -
STEWART, Col -
WEBSTER, Rob -
For full details of results see website –
www.pastvtr.elections.nsw.gov.au/LGE2012/liverpool-plains-shire-council.html
For a breakdown of voting by Vote Type (Ordinary, Declared Institution/Pre-poll,
Postal, Provisional/Silent) see the Councillor Election page of the above website, on
the Final Results tab select 04 - Enrolment and Voting by Aggregated Vote Type
Report.
Enrolment
Total Electors 5,503
Residential roll 5,501
Non-residential roll 2
SmartRolled Electors 349
(30/7/11 – 30/7/12)
Participation and Informality
Participation rate 84.7%
Formal votes 4,468
Informal votes 192
Total votes 4,660
Informality rate 4.1%
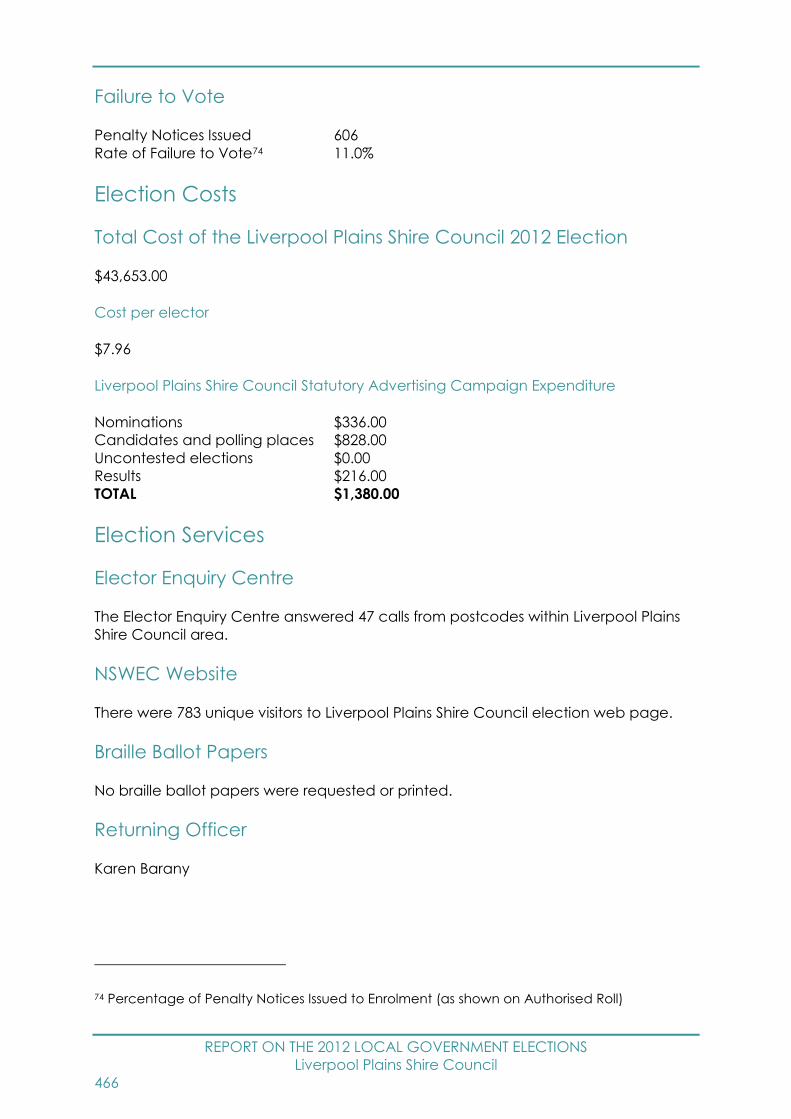
REPORT ON THE 2012 LOCAL GOVERNMENT ELECTIONS
Liverpool Plains Shire Council
466
Failure to Vote
Penalty Notices Issued 606
Rate of Failure to Vote74 11.0%
Election Costs
Total Cost of the Liverpool Plains Shire Council 2012 Election
$43,653.00
Cost per elector
$7.96
Liverpool Plains Shire Council Statutory Advertising Campaign Expenditure
Nominations $336.00
Candidates and polling places $828.00
Uncontested elections $0.00
Results $216.00
TOTAL $1,380.00
Election Services
Elector Enquiry Centre
The Elector Enquiry Centre answered 47 calls from postcodes within Liverpool Plains
Shire Council area.
NSWEC Website
There were 783 unique visitors to Liverpool Plains Shire Council election web page.
Braille Ballot Papers
No braille ballot papers were requested or printed.
Returning Officer
Karen Barany
74 Percentage of Penalty Notices Issued to Enrolment (as shown on Authorised Roll)
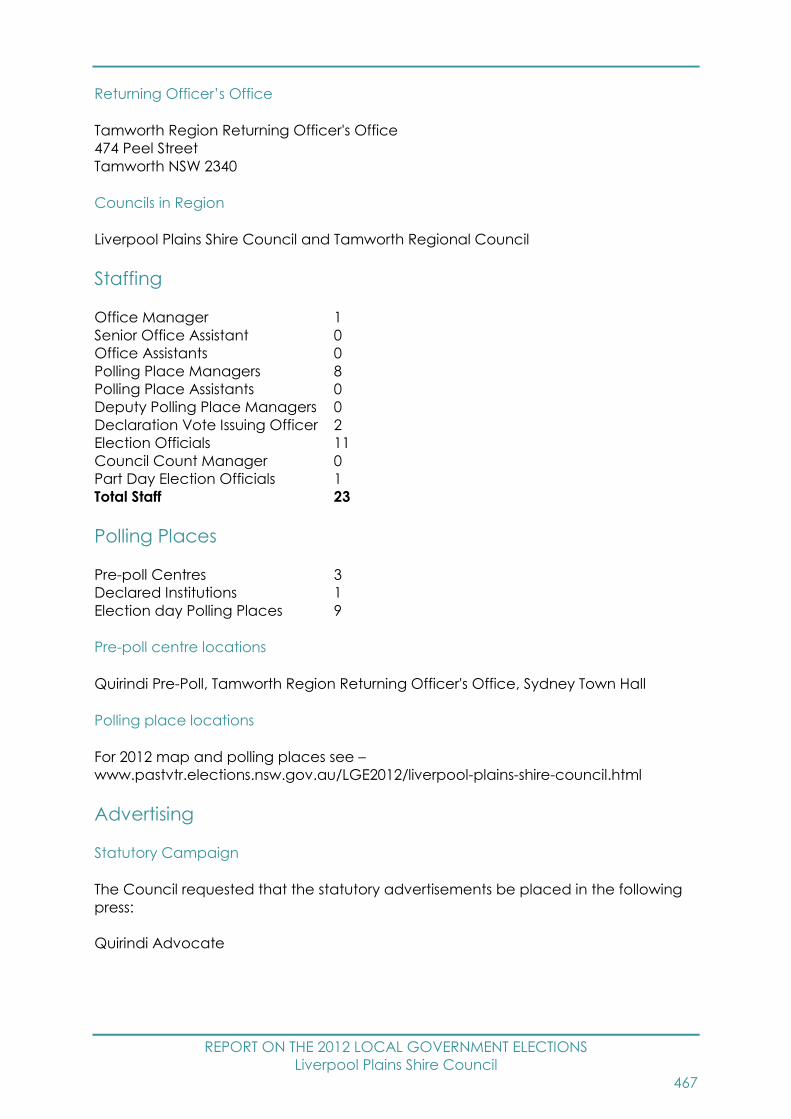
REPORT ON THE 2012 LOCAL GOVERNMENT ELECTIONS
Liverpool Plains Shire Council
467
Returning Officer’s Office
Tamworth Region Returning Officer's Office
474 Peel Street
Tamworth NSW 2340
Councils in Region
Liverpool Plains Shire Council and Tamworth Regional Council
Staffing
Office Manager 1
Senior Office Assistant 0
Office Assistants 0
Polling Place Managers 8
Polling Place Assistants 0
Deputy Polling Place Managers 0
Declaration Vote Issuing Officer 2
Election Officials 11
Council Count Manager 0
Part Day Election Officials 1
Total Staff 23
Polling Places
Pre-poll Centres 3
Declared Institutions 1
Election day Polling Places 9
Pre-poll centre locations
Quirindi Pre-Poll, Tamworth Region Returning Officer's Office, Sydney Town Hall
Polling place locations
For 2012 map and polling places see –
www.pastvtr.elections.nsw.gov.au/LGE2012/liverpool-plains-shire-council.html
Advertising
Statutory Campaign
The Council requested that the statutory advertisements be placed in the following
press:
Quirindi Advocate

REPORT ON THE 2012 LOCAL GOVERNMENT ELECTIONS
Liverpool Plains Shire Council
468
Candidates
Nominations withdrawn
No Councillor nominations were withdrawn.
Councillor Candidates
Total Candidates 10
Female Candidates 1
Male Candidates 9
Names of all candidates
Councillor Candidates Party Affiliation
CUDMORE, Ken -
DEVON, Richard -
HOPE, Andrew -
LAURIE, Andrew -
LOBSEY, Ian -
McDONALD, Jim -
MOULES, Paul -
ROBERTS, Mary -
STEWART, Col -
WEBSTER, Rob -

REPORT ON THE 2012 LOCAL GOVERNMENT ELECTIONS
Lockhart Shire Council
469
Lockhart Shire Council Report
Election Summary
Poll declared by Thursday, 13 September, 2012
Councillor elections, successful candidates
Councillor name Party Affiliation
A Ward
DAY, Max -
McDONNELL, Rodney -
SCHIRMER, Rodger -
B Ward
DOUGLAS, Derek -
MORGAN, Jim -
YATES, Peter -
C Ward - Uncontested
DRISCOLL, Gail -
PATERSON, John -
VERDON, Greg -
For full details of results see website –
www.pastvtr.elections.nsw.gov.au/LGE2012/lockhart-shire-council.html
For a breakdown of voting by Vote Type (Ordinary, Declared Institution/Pre-poll,
Postal, Provisional/Silent) see the Councillor Election page of the above website, on
the Final Results tab select 04 - Enrolment and Voting by Aggregated Vote Type
Report.
Enrolment
Total Electors 2,396
Residential roll 2,395
Non-residential roll 1
SmartRolled Electors 117
(30/7/11 – 30/7/12)
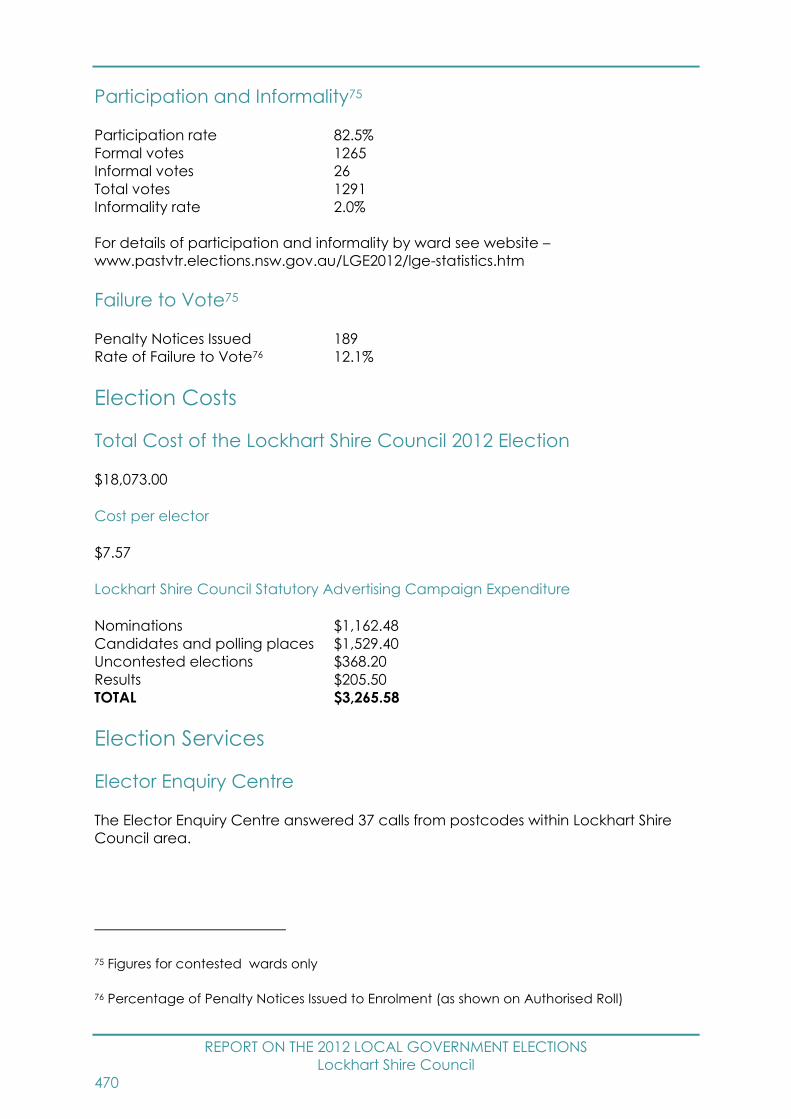
REPORT ON THE 2012 LOCAL GOVERNMENT ELECTIONS
Lockhart Shire Council
470
Participation and Informality75
Participation rate 82.5%
Formal votes 1265
Informal votes 26
Total votes 1291
Informality rate 2.0%
For details of participation and informality by ward see website –
www.pastvtr.elections.nsw.gov.au/LGE2012/lge-statistics.htm
Failure to Vote75
Penalty Notices Issued 189
Rate of Failure to Vote76 12.1%
Election Costs
Total Cost of the Lockhart Shire Council 2012 Election
$18,073.00
Cost per elector
$7.57
Lockhart Shire Council Statutory Advertising Campaign Expenditure
Nominations $1,162.48
Candidates and polling places $1,529.40
Uncontested elections $368.20
Results $205.50
TOTAL $3,265.58
Election Services
Elector Enquiry Centre
The Elector Enquiry Centre answered 37 calls from postcodes within Lockhart Shire
Council area.
75 Figures for contested wards only
76 Percentage of Penalty Notices Issued to Enrolment (as shown on Authorised Roll)
REPORT ON THE 2012 LOCAL GOVERNMENT ELECTIONS
Lockhart Shire Council
471
NSWEC Website
There were 703 unique visitors to Lockhart Shire Council election web page.
Braille Ballot Papers
No braille ballot papers were requested or printed.
Returning Officer
Barry Shields
Returning Officer’s Office
Wagga Wagga Region Returning Officer's Office
70-72 Fitzmaurice Street
Wagga Wagga NSW 2650
Councils in Region
Gundagai Shire Council, Lockhart Shire Council, Tumut Shire Council, Urana Shire
Council and Wagga Wagga City Council
Staffing
Office Manager 1
Senior Office Assistant 0
Office Assistants 0
Polling Place Managers 4
Polling Place Assistants 0
Deputy Polling Place Managers 0
Declaration Vote Issuing Officer 0
Election Officials 5
Council Count Manager 0
Part Day Election Officials 0
Total Staff 10
Polling Places
Pre-poll Centres 3
Declared Institutions 1
Election day Polling Places 7
Pre-poll centre locations
Lockhart Pre-Poll, Wagga Wagga Region Returning Officer's Office, Sydney Town Hall
REPORT ON THE 2012 LOCAL GOVERNMENT ELECTIONS
Lockhart Shire Council
472
Polling place locations
For 2012 map and polling places see –
www.pastvtr.elections.nsw.gov.au/LGE2012/lockhart-shire-council.html
Advertising
Statutory Campaign
The Council requested that the statutory advertisements be placed in the following
press:
Daily Advertiser
Chronicle
Candidates
Nominations withdrawn
No Councillor nominations were withdrawn.
Councillor Candidates
Total Candidates 13
Female Candidates 4
Male Candidates 9
A Ward Councillor Candidates
Total Candidates 5
Female Candidates 2
Male Candidates 3
B Ward Councillor Candidates
Total Candidates 5
Female Candidates 1
Male Candidates 4
C Ward Councillor Candidates
Total Candidates 3
Female Candidates 1
Male Candidates 2
REPORT ON THE 2012 LOCAL GOVERNMENT ELECTIONS
Lockhart Shire Council
473
Names of all candidates
Councillor Candidates Party Affiliation
A Ward
DAY, Max -
McDONNELL, Rodney -
MILDREN, Margo -
MULHOLLAND, Sylvia -
SCHIRMER, Rodger -
B Ward
DOUGLAS, Derek -
HOGAN, Ken -
MORGAN, Jim -
THIELE, Leia -
YATES, Peter -
REPORT ON THE 2012 LOCAL GOVERNMENT ELECTIONS
Manly Council
474
Manly Council Report
Election Summary
Poll declared by Friday, 14 September, 2012
Mayoral election, successful candidate
Mayor name Party Affiliation
HAY, Jean Liberal Party of Australia New South Wales Division
Councillor elections, successful candidates
Councillor name Party Affiliation
AIRD, Barbara Manly Independents - Putting Residents First
BINGHAM, Candy -
BURNS, Hugh Manly Independents - Putting Residents First
GRIFFIN, Cathy The Greens
GRIFFIN, James Liberal Party of Australia New South Wales Division
HEASMAN, Adele Liberal Party of Australia New South Wales Division
LE SURF, Alan Liberal Party of Australia New South Wales Division
PICKERING, Steve Liberal Party of Australia New South Wales Division
For full details of results see website –
www.pastvtr.elections.nsw.gov.au/LGE2012/manly-council.html
For a breakdown of voting by Vote Type (Ordinary, Declared Institution/Pre-poll,
Postal, Provisional/Silent) see the Councillor Election page of the above website, on
the Final Results tab select 04 - Enrolment and Voting by Aggregated Vote Type
Report.
Enrolment
Total Electors 26,727
Residential roll 26,718
Non-residential roll 9
SmartRolled Electors 2,743
(30/7/11 – 30/7/12)

REPORT ON THE 2012 LOCAL GOVERNMENT ELECTIONS
Manly Council
475
Participation and Informality
Participation rate 76.9%
Formal votes 19,708
Informal votes 848
Total votes 20,556
Informality rate 4.1%
Failure to Vote
Penalty Notices Issued 4,517
Rate of Failure to Vote77 17.0%
Election Costs
Total Cost of the Manly Council 2012 Election
$196,509.00
Cost per elector
$7.38
Manly Council Statutory Advertising Campaign Expenditure
Nominations $1,187.60
Candidates and polling places $3,562.00
Uncontested elections $0.00
Results $1,164.32
TOTAL $5,913.92
Election Services
Elector Enquiry Centre
The Elector Enquiry Centre answered 536 calls from postcodes within Manly Council
area.
NSWEC Website
There were 2,581 unique visitors to Manly Council election web page.
Braille Ballot Papers
No braille ballot papers were requested or printed.
77 Percentage of Penalty Notices Issued to Enrolment (as shown on Authorised Roll)
REPORT ON THE 2012 LOCAL GOVERNMENT ELECTIONS
Manly Council
476
Returning Officer
Suzanne Turner
Returning Officer’s Office
Mosman Region Returning Officer's Office
Old Greater Union Cinema Complex
Ground Floor, 7-11 Spit Road
Mosman NSW 2088
Councils in Region
Manly Council and Mosman Municipal Council
Staffing
Office Manager 1
Senior Office Assistant 0
Office Assistants 0
Polling Place Managers 11
Polling Place Assistants 3
Deputy Polling Place Managers 5
Declaration Vote Issuing Officer 7
Election Officials 44
Council Count Manager 2
Part Day Election Officials 6
Total Staff 79
Polling Places
Pre-poll Centres 3
Declared Institutions 2
Election day Polling Places 12
Pre-poll centre locations
Manly Pre-Poll, Mosman Region Returning Officer's Office, Sydney Town Hall
Polling place locations
For 2012 map and polling places see –
www.pastvtr.elections.nsw.gov.au/LGE2012/manly-council.html
REPORT ON THE 2012 LOCAL GOVERNMENT ELECTIONS
Manly Council
477
Advertising
Statutory Campaign
The Council requested that the statutory advertisements be placed in the following
press:
Manly Daily
Candidates
Nominations withdrawn
No Mayoral nominations were withdrawn.
No Councillor nominations were withdrawn.
Mayoral Candidates
Total Candidates 5
Female Candidates 4
Male Candidates 1
Councillor Candidates
Total Candidates 30
Female Candidates 11
Male Candidates 19
Names of all candidates
Mayoral Candidates Party Affiliation
AIRD, Barbara Manly Independents - Putting Residents First
BINGHAM, Candy -
GRIFFIN, Cathy The Greens
HAY, Jean Liberal Party of Australia New South Wales Division
WHITTING, Craig Australian Labor Party (NSW Branch)
Councillor Candidates Party Affiliation
AIRD, Barbara Manly Independents - Putting Residents First
BINGHAM, Candy -
BROXOM, Shelley -
BURNS, David Manly Independents - Putting Residents First
BURNS, Hugh Manly Independents - Putting Residents First
CHAPMAN, Michael Australian Labor Party (NSW Branch)
COLLINS, Patrick Australian Labor Party (NSW Branch)
COULTER, Stephen -
CUTHILL, Alex -
D'AMBROSIO, Silvano -
REPORT ON THE 2012 LOCAL GOVERNMENT ELECTIONS
Manly Council
478
FRENCH, Jacqueline Manly Independents - Putting Residents First
GRIFFIN, Cathy The Greens
GRIFFIN, James Liberal Party of Australia New South Wales Division
HAY, Jean Liberal Party of Australia New South Wales Division
HEASMAN, Adele Liberal Party of Australia New South Wales Division
HITCHMAN, Kylie The Greens
KEEN, Lloyd -
KENNY, Julian Australian Labor Party (NSW Branch)
KITCHING, Will The Greens
LAMBERT, Judy The Greens
LE ROUX, Terry The Greens
LE SURF, Alan Liberal Party of Australia New South Wales Division
MOONEY, Deborah -
NAGEL, Dirk -
OHLBACK, Neil Manly Independents - Putting Residents First
PICKERING, Steve Liberal Party of Australia New South Wales Division
PRITCHARD, Rowan Manly Independents - Putting Residents First
ROGERS, Daniel Liberal Party of Australia New South Wales Division
SANSEY, Tanie Australian Labor Party (NSW Branch)
WHITTING, Craig Australian Labor Party (NSW Branch)
REPORT ON THE 2012 LOCAL GOVERNMENT ELECTIONS
Marrickville Council
479
Marrickville Council Report
Election Summary
Poll declared by Saturday, 15 September, 2012
Councillor elections, successful candidates
Councillor name Party Affiliation
Central Ward - Wirraga
ISKANDAR, Sam Australian Labor Party (NSW Branch)
MACRI, Victor -
PHILLIPS, Max The Greens
North Ward - Wali
ELLSMORE, Sylvie The Greens
GARDINER, Mark Liberal Party of Australia New South Wales Division
HAYLEN, Jo Australian Labor Party (NSW Branch)
South Ward - Magura
HANNA, Morris -
LEARY, David The Greens
WOODS, Chris Australian Labor Party (NSW Branch)
West Ward - Burraga
BROOKS, Melissa The Greens
TSARDOULIAS, Emanuel Australian Labor Party (NSW Branch)
TYLER, Rosana Liberal Party of Australia New South Wales Division
For full details of results see website –
www.pastvtr.elections.nsw.gov.au/LGE2012/marrickville-council.html
For a breakdown of voting by Vote Type (Ordinary, Declared Institution/Pre-poll,
Postal, Provisional/Silent) see the Councillor Election page of the above website, on
the Final Results tab select 04 - Enrolment and Voting by Aggregated Vote Type
Report.
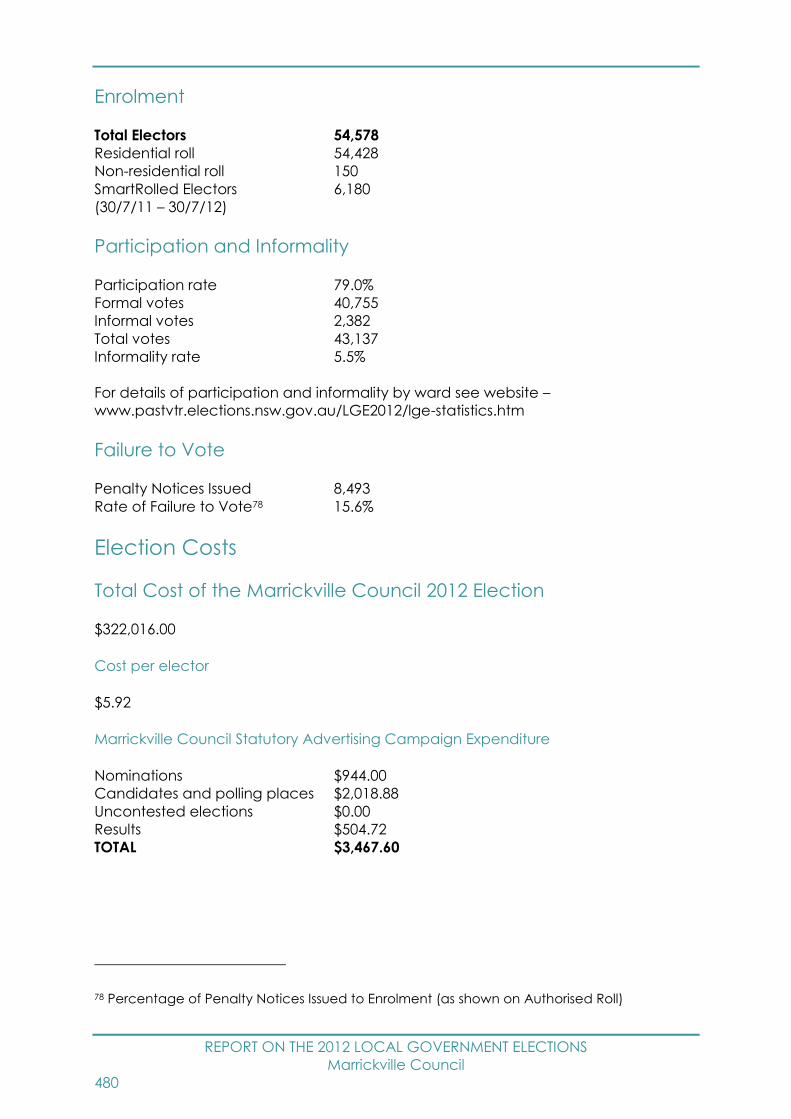
REPORT ON THE 2012 LOCAL GOVERNMENT ELECTIONS
Marrickville Council
480
Enrolment
Total Electors 54,578
Residential roll 54,428
Non-residential roll 150
SmartRolled Electors 6,180
(30/7/11 – 30/7/12)
Participation and Informality
Participation rate 79.0%
Formal votes 40,755
Informal votes 2,382
Total votes 43,137
Informality rate 5.5%
For details of participation and informality by ward see website –
www.pastvtr.elections.nsw.gov.au/LGE2012/lge-statistics.htm
Failure to Vote
Penalty Notices Issued 8,493
Rate of Failure to Vote78 15.6%
Election Costs
Total Cost of the Marrickville Council 2012 Election
$322,016.00
Cost per elector
$5.92
Marrickville Council Statutory Advertising Campaign Expenditure
Nominations $944.00
Candidates and polling places $2,018.88
Uncontested elections $0.00
Results $504.72
TOTAL $3,467.60
78 Percentage of Penalty Notices Issued to Enrolment (as shown on Authorised Roll)
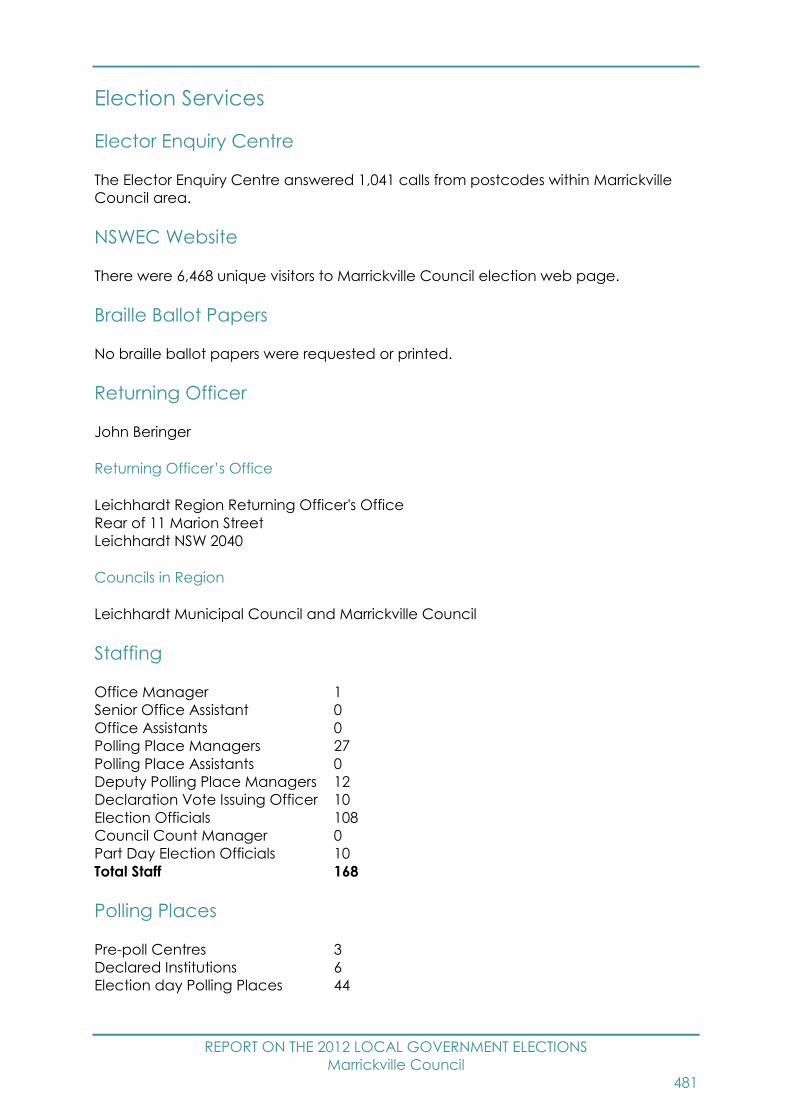
REPORT ON THE 2012 LOCAL GOVERNMENT ELECTIONS
Marrickville Council
481
Election Services
Elector Enquiry Centre
The Elector Enquiry Centre answered 1,041 calls from postcodes within Marrickville
Council area.
NSWEC Website
There were 6,468 unique visitors to Marrickville Council election web page.
Braille Ballot Papers
No braille ballot papers were requested or printed.
Returning Officer
John Beringer
Returning Officer’s Office
Leichhardt Region Returning Officer's Office
Rear of 11 Marion Street
Leichhardt NSW 2040
Councils in Region
Leichhardt Municipal Council and Marrickville Council
Staffing
Office Manager 1
Senior Office Assistant 0
Office Assistants 0
Polling Place Managers 27
Polling Place Assistants 0
Deputy Polling Place Managers 12
Declaration Vote Issuing Officer 10
Election Officials 108
Council Count Manager 0
Part Day Election Officials 10
Total Staff 168
Polling Places
Pre-poll Centres 3
Declared Institutions 6
Election day Polling Places 44

REPORT ON THE 2012 LOCAL GOVERNMENT ELECTIONS
Marrickville Council
482
Pre-poll centre locations
Leichhardt Region Returning Officer's Office, Marrickville Pre-poll, Sydney Town Hall
Polling place locations
For 2012 map and polling places see –
www.pastvtr.elections.nsw.gov.au/LGE2012/marrickville-council.html
Advertising
Statutory Campaign
The Council requested that the statutory advertisements be placed in the following
press:
Inner Western Suburbs Courier
Inner City Weekender
Candidates
Nominations withdrawn
No Councillor nominations were withdrawn.
Councillor Candidates
Total Candidates 50
Female Candidates 18
Male Candidates 32
Central Ward - Wirraga Councillor Candidates
Total Candidates 12
Female Candidates 2
Male Candidates 10
North Ward - Wali Councillor Candidates
Total Candidates 15
Female Candidates 8
Male Candidates 7
South Ward - Magura Councillor Candidates
Total Candidates 14
Female Candidates 3
Male Candidates 11

REPORT ON THE 2012 LOCAL GOVERNMENT ELECTIONS
Marrickville Council
483
West Ward - Burraga Councillor Candidates
Total Candidates 9
Female Candidates 5
Male Candidates 4
Names of all candidates
Councillor Candidates Party Affiliation
Central Ward - Wirraga
ANDRADE, George Liberal Party of Australia New South Wales Division
CAPOGRECO, Joseph -
CHISTIAKOFF, Alex Liberal Party of Australia New South Wales Division
HUDSON, Katherine Australian Labor Party (NSW Branch)
ISKANDAR, Sam Australian Labor Party (NSW Branch)
KENT, Jennifer The Greens
KHOURI, Joe -
MACRI, Victor -
PHILLIPS, Max The Greens
POULIKAKOS, Dimitrios The Greens
SACHS, Antony Australian Labor Party (NSW Branch)
SUTHERLAND, Bill Liberal Party of Australia New South Wales Division
North Ward - Wali
BRYANT, Gareth The Greens
BURNFIELD, David Liberal Party of Australia New South Wales Division
DRAKE, Phoebe Australian Labor Party (NSW Branch)
DUARTE, Jason Liberal Party of Australia New South Wales Division
ELLSMORE, Sylvie The Greens
EVANS, Josie Socialist Alliance
GARDINER, Mark Liberal Party of Australia New South Wales Division
HAYLEN, Jo Australian Labor Party (NSW Branch)
HICKSON, Jill Socialist Alliance
HINMAN, Pip Socialist Alliance
KOVIC, Chelsea -
LOVELL, Jaimie Australian Labor Party (NSW Branch)
REDEGALLI, Sergio -
REITERBAUER, George -
SOLOMON, Karel The Greens
South Ward - Magura
GERBER, Matthew Liberal Party of Australia New South Wales Division
HANNA, Morris -
HOWE, Elizabeth -
KHOURY, David Australian Labor Party (NSW Branch)
LANGFORD, Justine The Greens
LEARY, David The Greens
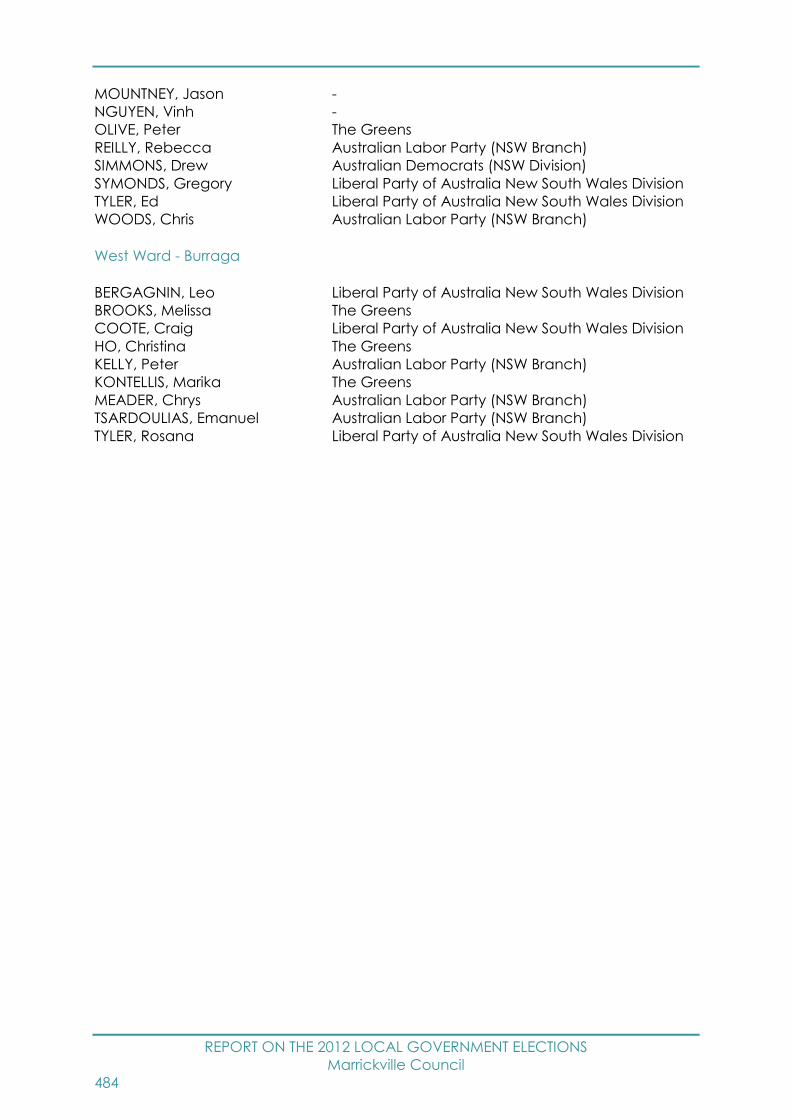
REPORT ON THE 2012 LOCAL GOVERNMENT ELECTIONS
Marrickville Council
484
MOUNTNEY, Jason -
NGUYEN, Vinh -
OLIVE, Peter The Greens
REILLY, Rebecca Australian Labor Party (NSW Branch)
SIMMONS, Drew Australian Democrats (NSW Division)
SYMONDS, Gregory Liberal Party of Australia New South Wales Division
TYLER, Ed Liberal Party of Australia New South Wales Division
WOODS, Chris Australian Labor Party (NSW Branch)
West Ward - Burraga
BERGAGNIN, Leo Liberal Party of Australia New South Wales Division
BROOKS, Melissa The Greens
COOTE, Craig Liberal Party of Australia New South Wales Division
HO, Christina The Greens
KELLY, Peter Australian Labor Party (NSW Branch)
KONTELLIS, Marika The Greens
MEADER, Chrys Australian Labor Party (NSW Branch)
TSARDOULIAS, Emanuel Australian Labor Party (NSW Branch)
TYLER, Rosana Liberal Party of Australia New South Wales Division

REPORT ON THE 2012 LOCAL GOVERNMENT ELECTIONS
Mid-Western Regional Council
485
Mid-Western Regional Council Report
Election Summary
Poll declared by Thursday, 13 September, 2012
Councillor elections, successful candidates
Councillor name Party Affiliation
CAVALIER, Paul -
KENNEDY, Des -
MARTENS, Esme -
SHELLEY, Peter -
THOMPSON, Percy -
WALKER, Max -
WEATHERLEY, John -
WEBB, John -
WHITE, Lucy -
For full details of results see website –
www.pastvtr.elections.nsw.gov.au/LGE2012/mid-western-regional-council.html
For a breakdown of voting by Vote Type (Ordinary, Declared Institution/Pre-poll,
Postal, Provisional/Silent) see the Councillor Election page of the above website, on
the Final Results tab select 04 - Enrolment and Voting by Aggregated Vote Type
Report.
Enrolment
Total Electors 16,100
Residential roll 16,094
Non-residential roll 6
SmartRolled Electors 1,466
(30/7/11 – 30/7/12)
Participation and Informality
Participation rate 86.5%
Formal votes 13,034
Informal votes 886
Total votes 13,920
Informality rate 6.4%

REPORT ON THE 2012 LOCAL GOVERNMENT ELECTIONS
Mid-Western Regional Council
486
Failure to Vote
Penalty Notices Issued 1,648
Rate of Failure to Vote79 10.3%
Election Costs
Total Cost of the Mid-Western Regional Council 2012 Election
$135,419.00
Cost per elector
$8.44
Mid-Western Regional Council Statutory Advertising Campaign Expenditure
Nominations $462.73
Candidates and polling places $1,765.60
Uncontested elections $0.00
Results $420.66
TOTAL $2,648.99
Election Services
Elector Enquiry Centre
The Elector Enquiry Centre answered 174 calls from postcodes within Mid-Western
Regional Council area.
NSWEC Website
There were 1,632 unique visitors to Mid-Western Regional Council election web page.
Braille Ballot Papers
No braille ballot papers were requested or printed.
Returning Officer
John Kaus
79 Percentage of Penalty Notices Issued to Enrolment (as shown on Authorised Roll)
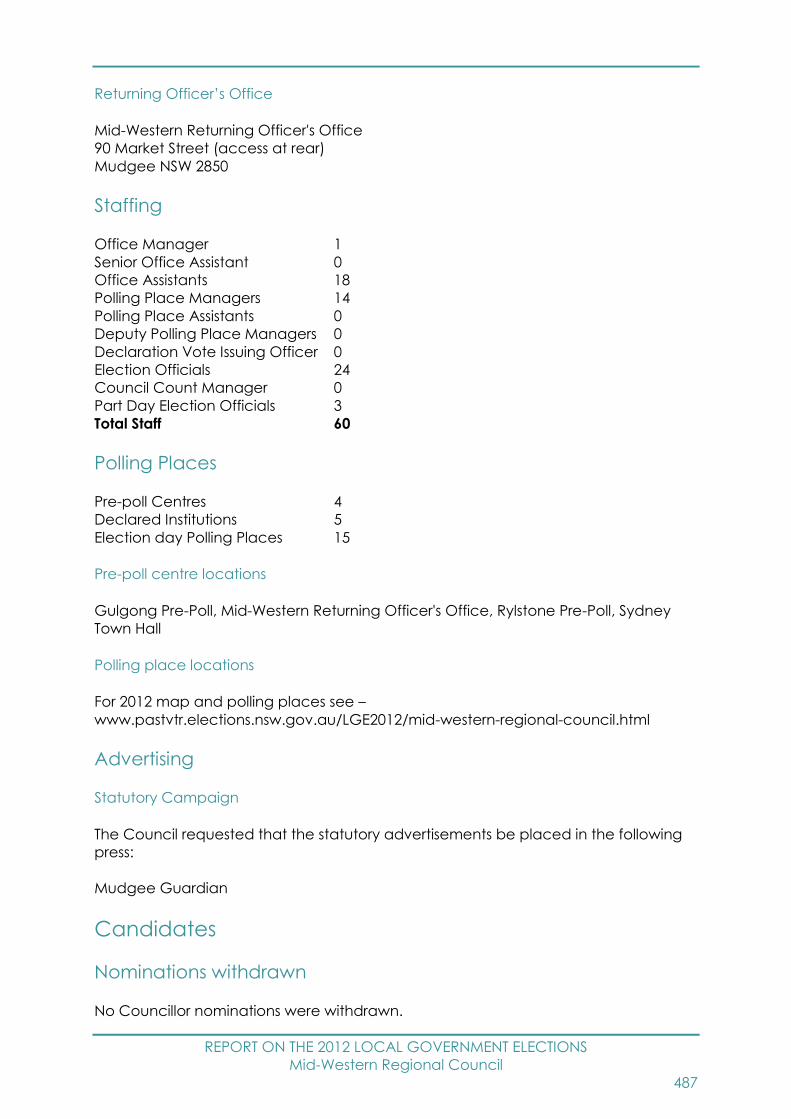
REPORT ON THE 2012 LOCAL GOVERNMENT ELECTIONS
Mid-Western Regional Council
487
Returning Officer’s Office
Mid-Western Returning Officer's Office
90 Market Street (access at rear)
Mudgee NSW 2850
Staffing
Office Manager 1
Senior Office Assistant 0
Office Assistants 18
Polling Place Managers 14
Polling Place Assistants 0
Deputy Polling Place Managers 0
Declaration Vote Issuing Officer 0
Election Officials 24
Council Count Manager 0
Part Day Election Officials 3
Total Staff 60
Polling Places
Pre-poll Centres 4
Declared Institutions 5
Election day Polling Places 15
Pre-poll centre locations
Gulgong Pre-Poll, Mid-Western Returning Officer's Office, Rylstone Pre-Poll, Sydney
Town Hall
Polling place locations
For 2012 map and polling places see –
www.pastvtr.elections.nsw.gov.au/LGE2012/mid-western-regional-council.html
Advertising
Statutory Campaign
The Council requested that the statutory advertisements be placed in the following
press:
Mudgee Guardian
Candidates
Nominations withdrawn
No Councillor nominations were withdrawn.
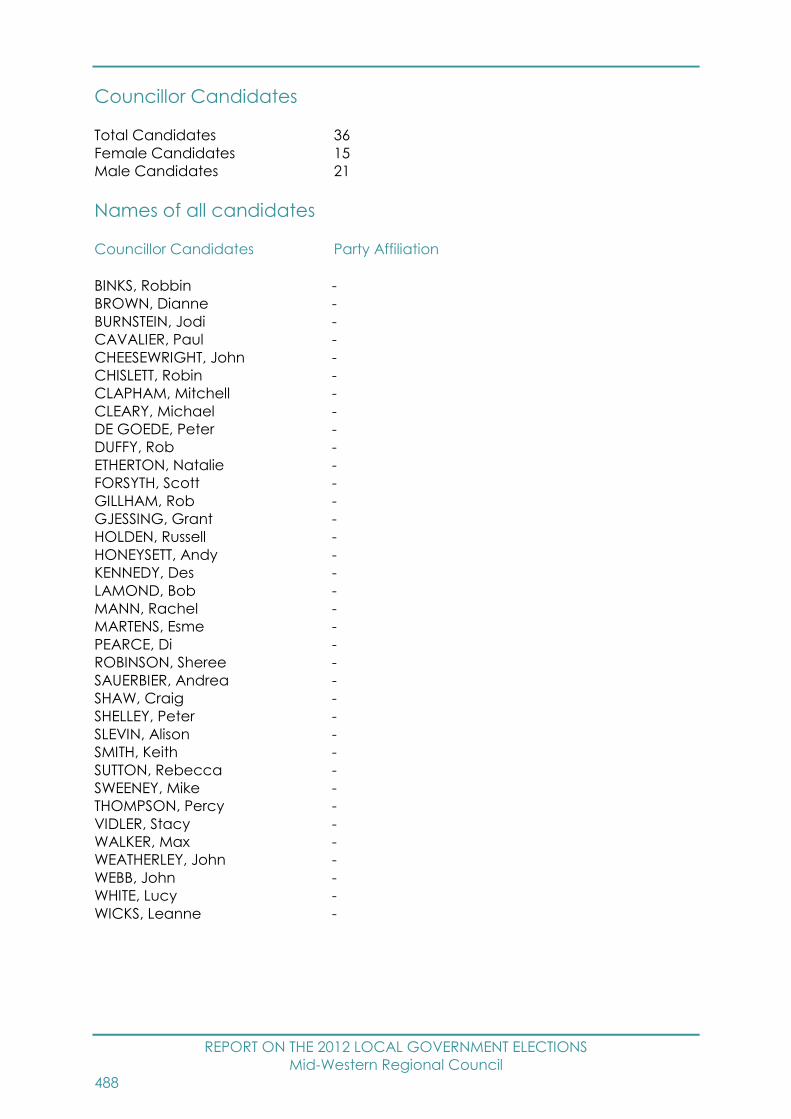
REPORT ON THE 2012 LOCAL GOVERNMENT ELECTIONS
Mid-Western Regional Council
488
Councillor Candidates
Total Candidates 36
Female Candidates 15
Male Candidates 21
Names of all candidates
Councillor Candidates Party Affiliation
BINKS, Robbin -
BROWN, Dianne -
BURNSTEIN, Jodi -
CAVALIER, Paul -
CHEESEWRIGHT, John -
CHISLETT, Robin -
CLAPHAM, Mitchell -
CLEARY, Michael -
DE GOEDE, Peter -
DUFFY, Rob -
ETHERTON, Natalie -
FORSYTH, Scott -
GILLHAM, Rob -
GJESSING, Grant -
HOLDEN, Russell -
HONEYSETT, Andy -
KENNEDY, Des -
LAMOND, Bob -
MANN, Rachel -
MARTENS, Esme -
PEARCE, Di -
ROBINSON, Sheree -
SAUERBIER, Andrea -
SHAW, Craig -
SHELLEY, Peter -
SLEVIN, Alison -
SMITH, Keith -
SUTTON, Rebecca -
SWEENEY, Mike -
THOMPSON, Percy -
VIDLER, Stacy -
WALKER, Max -
WEATHERLEY, John -
WEBB, John -
WHITE, Lucy -
WICKS, Leanne -

REPORT ON THE 2012 LOCAL GOVERNMENT ELECTIONS
Moree Plains Shire Council
489
Moree Plains Shire Council Report
Election Summary
Poll declared by Friday, 14 September, 2012
Councillor elections, successful candidates
Councillor name Party Affiliation
BRAZEL, Rodney -
CIKOTA, Mick -
GALL, Claudia -
HUMPHRIES, Katrina -
MUNN, Brendan -
PRICE, Sue -
TRAMBY, John -
TZANNES, Theo -
VON DREHNEN, James -
For full details of results see website –
www.pastvtr.elections.nsw.gov.au/LGE2012/moree-plains-shire-council.html
For a breakdown of voting by Vote Type (Ordinary, Declared Institution/Pre-poll,
Postal, Provisional/Silent) see the Councillor Election page of the above website, on
the Final Results tab select 04 - Enrolment and Voting by Aggregated Vote Type
Report.
Enrolment
Total Electors 8,251
Residential roll 8,250
Non-residential roll 1
SmartRolled Electors 838
(30/7/11 – 30/7/12)
Participation and Informality
Participation rate 78.0%
Formal votes 6,021
Informal votes 417
Total votes 6,438
Informality rate 6.5%

REPORT ON THE 2012 LOCAL GOVERNMENT ELECTIONS
Moree Plains Shire Council
490
Failure to Vote
Penalty Notices Issued 1,517
Rate of Failure to Vote80 18.5%
Election Costs
Total Cost of the Moree Plains Shire Council 2012 Election
$71,880.00
Cost per elector
$8.74
Moree Plains Shire Council Statutory Advertising Campaign Expenditure
Nominations $1,485.66
Candidates and polling places $2,196.70
Uncontested elections $0.00
Results $957.82
TOTAL $4,640.18
Election Services
Elector Enquiry Centre
The Elector Enquiry Centre answered 124 calls from postcodes within Moree Plains
Shire Council area.
NSWEC Website
There were 955 unique visitors to Moree Plains Shire Council election web page.
Braille Ballot Papers
No braille ballot papers were requested or printed.
Returning Officer
Sarah Risby
80 Percentage of Penalty Notices Issued to Enrolment (as shown on Authorised Roll)
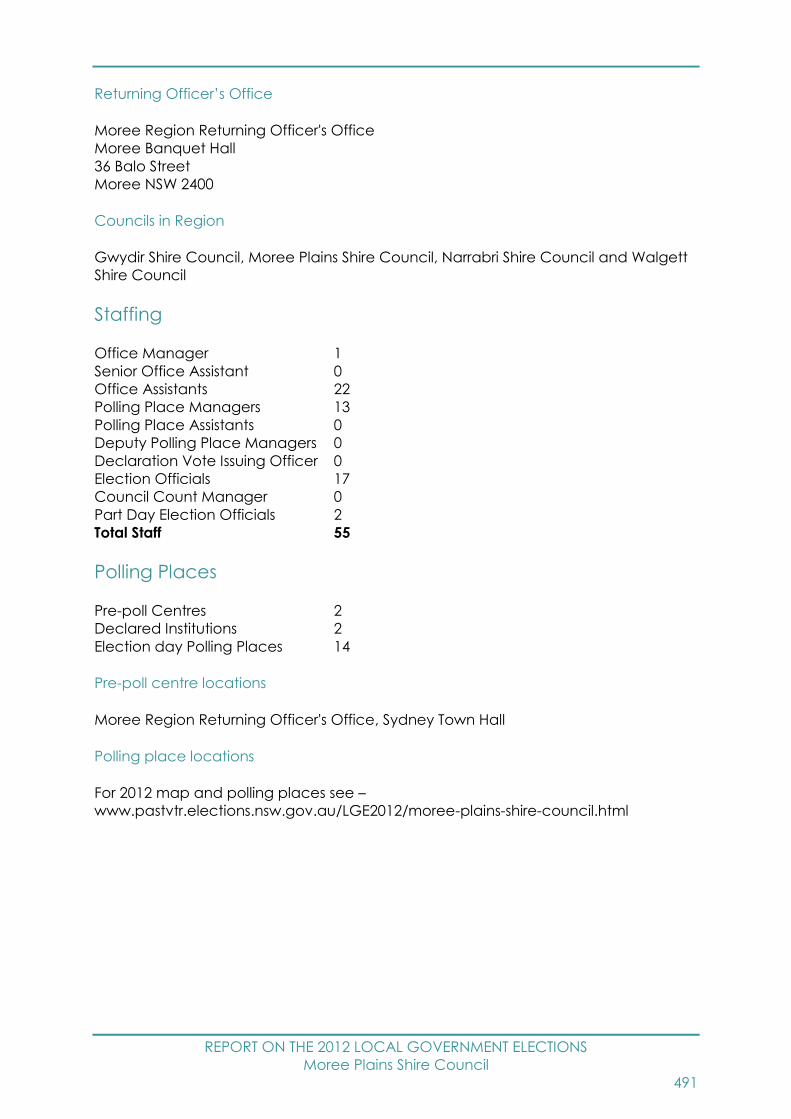
REPORT ON THE 2012 LOCAL GOVERNMENT ELECTIONS
Moree Plains Shire Council
491
Returning Officer’s Office
Moree Region Returning Officer's Office
Moree Banquet Hall
36 Balo Street
Moree NSW 2400
Councils in Region
Gwydir Shire Council, Moree Plains Shire Council, Narrabri Shire Council and Walgett
Shire Council
Staffing
Office Manager 1
Senior Office Assistant 0
Office Assistants 22
Polling Place Managers 13
Polling Place Assistants 0
Deputy Polling Place Managers 0
Declaration Vote Issuing Officer 0
Election Officials 17
Council Count Manager 0
Part Day Election Officials 2
Total Staff 55
Polling Places
Pre-poll Centres 2
Declared Institutions 2
Election day Polling Places 14
Pre-poll centre locations
Moree Region Returning Officer's Office, Sydney Town Hall
Polling place locations
For 2012 map and polling places see –
www.pastvtr.elections.nsw.gov.au/LGE2012/moree-plains-shire-council.html
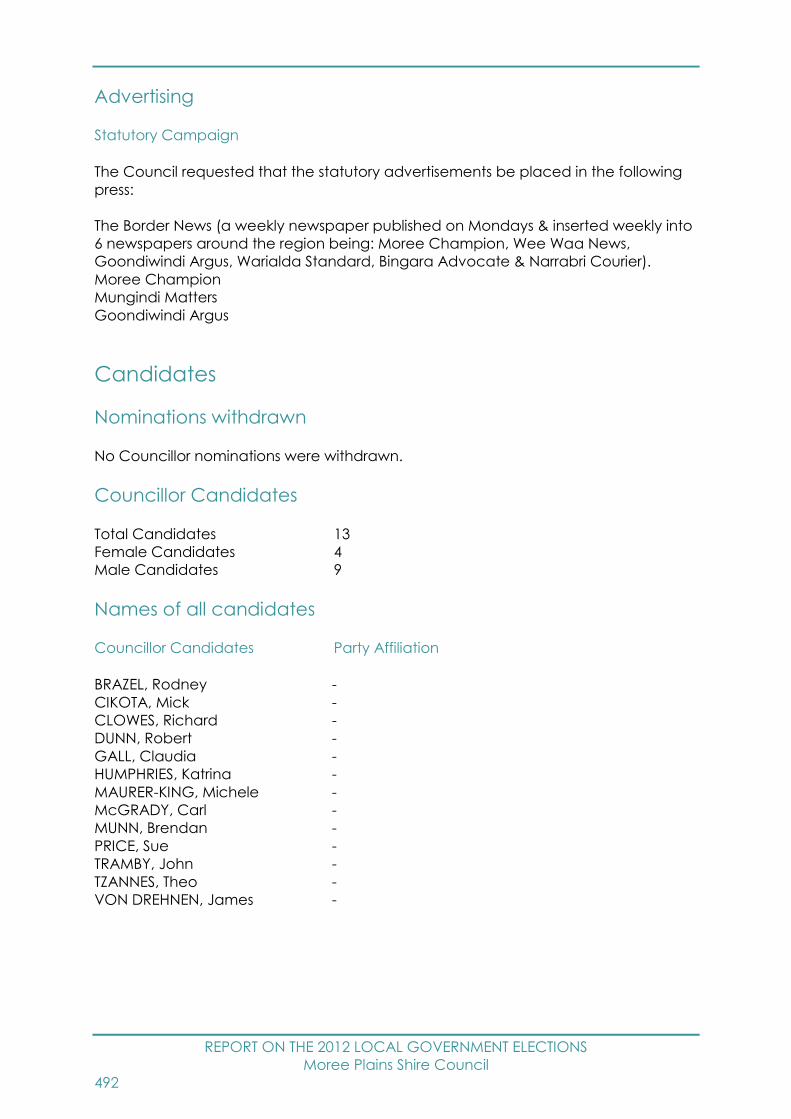
REPORT ON THE 2012 LOCAL GOVERNMENT ELECTIONS
Moree Plains Shire Council
492
Advertising
Statutory Campaign
The Council requested that the statutory advertisements be placed in the following
press:
The Border News (a weekly newspaper published on Mondays & inserted weekly into
6 newspapers around the region being: Moree Champion, Wee Waa News,
Goondiwindi Argus, Warialda Standard, Bingara Advocate & Narrabri Courier).
Moree Champion
Mungindi Matters
Goondiwindi Argus
Candidates
Nominations withdrawn
No Councillor nominations were withdrawn.
Councillor Candidates
Total Candidates 13
Female Candidates 4
Male Candidates 9
Names of all candidates
Councillor Candidates Party Affiliation
BRAZEL, Rodney -
CIKOTA, Mick -
CLOWES, Richard -
DUNN, Robert -
GALL, Claudia -
HUMPHRIES, Katrina -
MAURER-KING, Michele -
McGRADY, Carl -
MUNN, Brendan -
PRICE, Sue -
TRAMBY, John -
TZANNES, Theo -
VON DREHNEN, James -
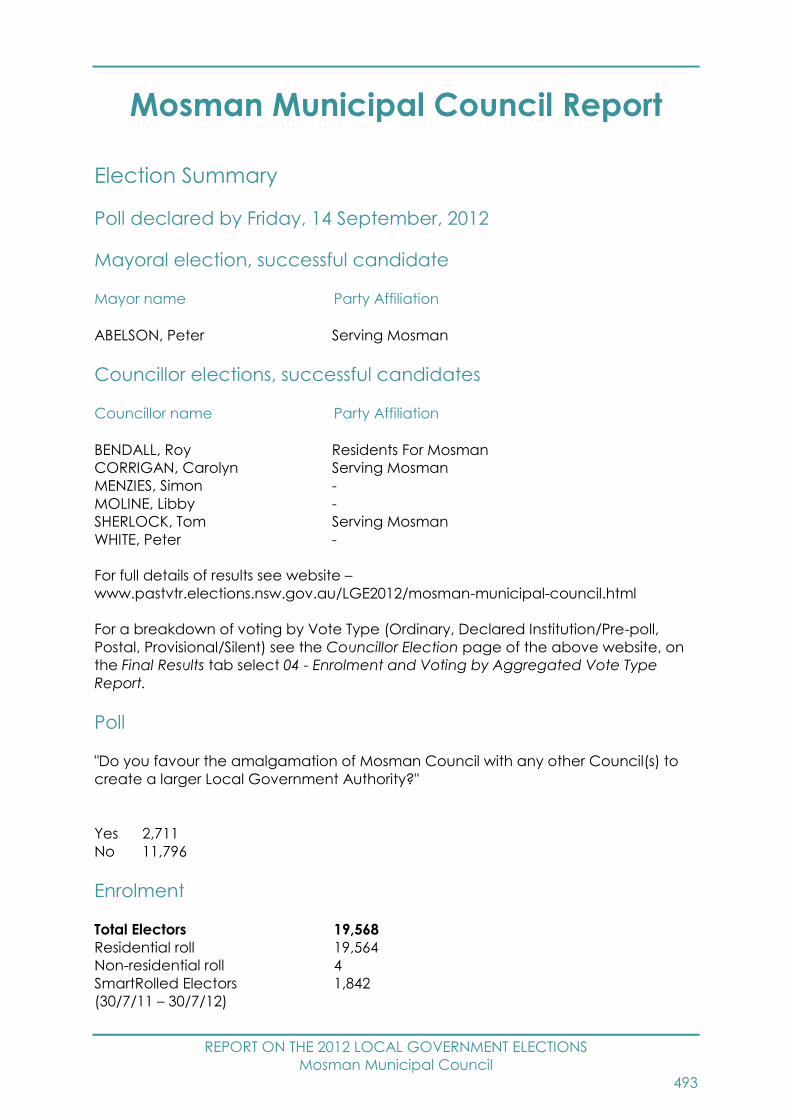
REPORT ON THE 2012 LOCAL GOVERNMENT ELECTIONS
Mosman Municipal Council
493
Mosman Municipal Council Report
Election Summary
Poll declared by Friday, 14 September, 2012
Mayoral election, successful candidate
Mayor name Party Affiliation
ABELSON, Peter Serving Mosman
Councillor elections, successful candidates
Councillor name Party Affiliation
BENDALL, Roy Residents For Mosman
CORRIGAN, Carolyn Serving Mosman
MENZIES, Simon -
MOLINE, Libby -
SHERLOCK, Tom Serving Mosman
WHITE, Peter -
For full details of results see website –
www.pastvtr.elections.nsw.gov.au/LGE2012/mosman-municipal-council.html
For a breakdown of voting by Vote Type (Ordinary, Declared Institution/Pre-poll,
Postal, Provisional/Silent) see the Councillor Election page of the above website, on
the Final Results tab select 04 - Enrolment and Voting by Aggregated Vote Type
Report.
Poll
"Do you favour the amalgamation of Mosman Council with any other Council(s) to
create a larger Local Government Authority?"
Yes 2,711
No 11,796
Enrolment
Total Electors 19,568
Residential roll 19,564
Non-residential roll 4
SmartRolled Electors 1,842
(30/7/11 – 30/7/12)

REPORT ON THE 2012 LOCAL GOVERNMENT ELECTIONS
Mosman Municipal Council
494
Participation and Informality
Participation rate 76.8%
Formal votes 13,951
Informal votes 1,087
Total votes 15,038
Informality rate 7.2%
Failure to Vote
Penalty Notices Issued 3,259
Rate of Failure to Vote81 16.7%
Election Costs
Total Cost of the Mosman Municipal Council 2012 Election
$147,392.00
Cost per elector
$7.55
Mosman Municipal Council Statutory Advertising Campaign Expenditure
Nominations $1,463.44
Candidates and polling places $2,195.16
Uncontested elections $0.00
Results $2,351.00
TOTAL $6,009.60
Election Services
Elector Enquiry Centre
The Elector Enquiry Centre answered 419 calls from postcodes within Mosman
Municipal Council area.
NSWEC Website
There were 2,320 unique visitors to Mosman Municipal Council election web page.
Braille Ballot Papers
No braille ballot papers were requested or printed.
81 Percentage of Penalty Notices Issued to Enrolment (as shown on Authorised Roll)
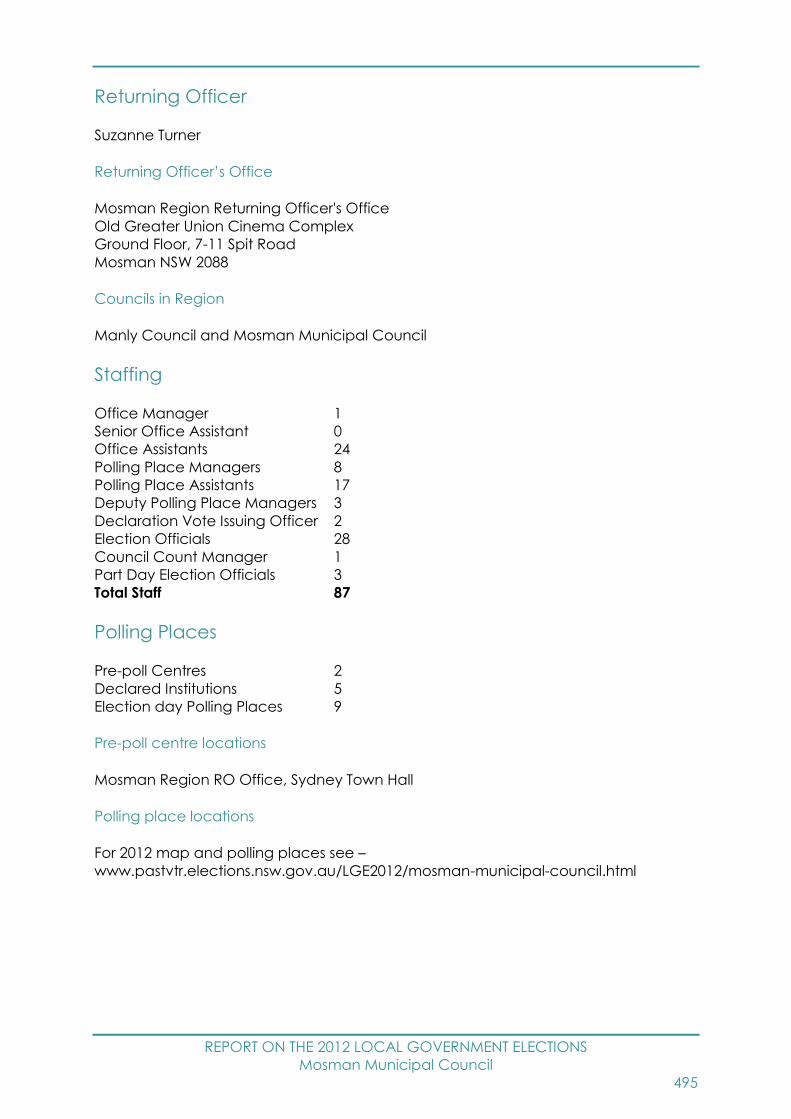
REPORT ON THE 2012 LOCAL GOVERNMENT ELECTIONS
Mosman Municipal Council
495
Returning Officer
Suzanne Turner
Returning Officer’s Office
Mosman Region Returning Officer's Office
Old Greater Union Cinema Complex
Ground Floor, 7-11 Spit Road
Mosman NSW 2088
Councils in Region
Manly Council and Mosman Municipal Council
Staffing
Office Manager 1
Senior Office Assistant 0
Office Assistants 24
Polling Place Managers 8
Polling Place Assistants 17
Deputy Polling Place Managers 3
Declaration Vote Issuing Officer 2
Election Officials 28
Council Count Manager 1
Part Day Election Officials 3
Total Staff 87
Polling Places
Pre-poll Centres 2
Declared Institutions 5
Election day Polling Places 9
Pre-poll centre locations
Mosman Region RO Office, Sydney Town Hall
Polling place locations
For 2012 map and polling places see –
www.pastvtr.elections.nsw.gov.au/LGE2012/mosman-municipal-council.html

REPORT ON THE 2012 LOCAL GOVERNMENT ELECTIONS
Mosman Municipal Council
496
Advertising
Statutory Campaign
The Council requested that the statutory advertisements be placed in the following
press:
Mosman Daily
Candidates
Nominations withdrawn
No Mayoral nominations were withdrawn.
No Councillor nominations were withdrawn.
Mayoral Candidates
Total Candidates 7
Female Candidates 1
Male Candidates 6
Councillor Candidates
Total Candidates 29
Female Candidates 14
Male Candidates 15
Names of all candidates
Mayoral Candidates Party Affiliation
ABELSON, Peter Serving Mosman
BENDALL, Roy Residents For Mosman
MENZIES, Simon -
MOLINE, Libby -
REID, Jim -
WHITE, Peter -
YATES, Warren -
Councillor Candidates Party Affiliation
ABELSON, Peter Serving Mosman
BARRETT, Olivia Residents For Mosman
BENDALL, Roy Residents For Mosman
BRADY, Lauren -
BROWN, Louise -
CONNON, Anne -
CORRIGAN, Carolyn Serving Mosman
DAWSON, Fred -
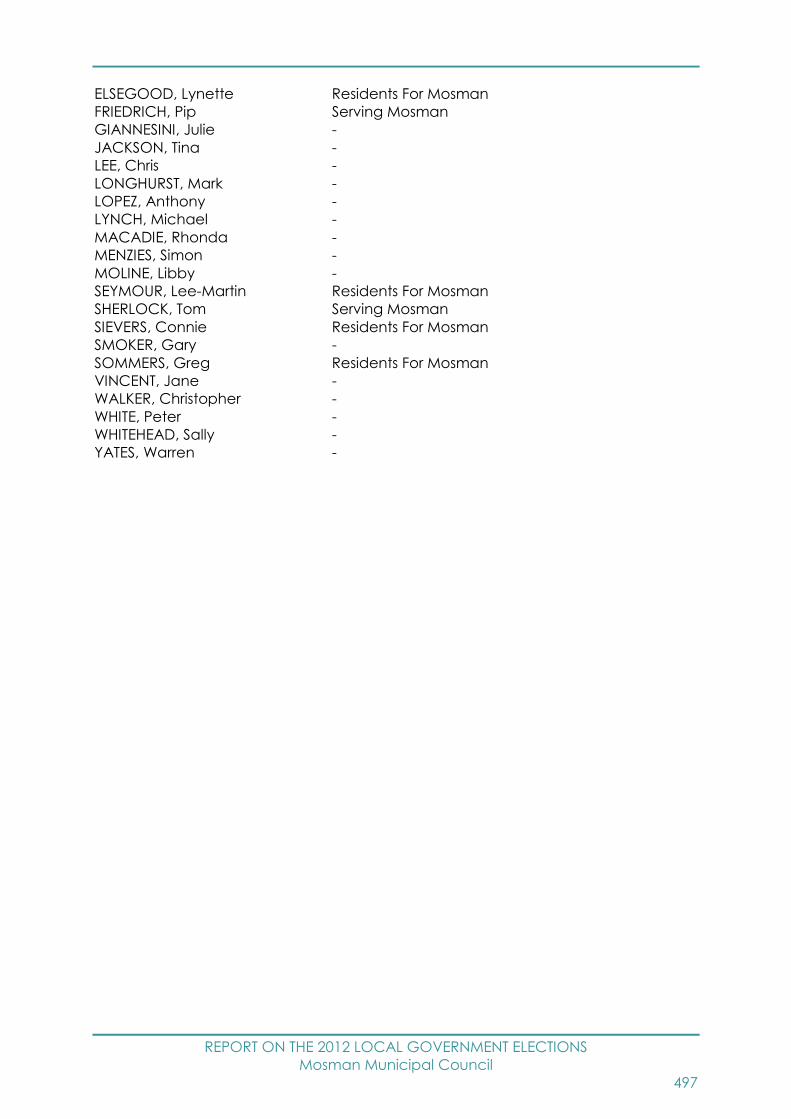
REPORT ON THE 2012 LOCAL GOVERNMENT ELECTIONS
Mosman Municipal Council
497
ELSEGOOD, Lynette Residents For Mosman
FRIEDRICH, Pip Serving Mosman
GIANNESINI, Julie -
JACKSON, Tina -
LEE, Chris -
LONGHURST, Mark -
LOPEZ, Anthony -
LYNCH, Michael -
MACADIE, Rhonda -
MENZIES, Simon -
MOLINE, Libby -
SEYMOUR, Lee-Martin Residents For Mosman
SHERLOCK, Tom Serving Mosman
SIEVERS, Connie Residents For Mosman
SMOKER, Gary -
SOMMERS, Greg Residents For Mosman
VINCENT, Jane -
WALKER, Christopher -
WHITE, Peter -
WHITEHEAD, Sally -
YATES, Warren -

REPORT ON THE 2012 LOCAL GOVERNMENT ELECTIONS
Murray Shire Council
498
Murray Shire Council Report
Election Summary
Poll declared by Thursday, 13 September, 2012
Councillor elections, successful candidates
Councillor name Party Affiliation
ANDERSON, Bill -
BURKE, Gavin -
CAMPBELL, Gen -
MOON, Ian -
MULCAHY, Sue -
MURPHY, Betty -
POCKLINGTON, John -
SHARP, Brian -
WEYRICH, Thomas -
For full details of results see website –
www.pastvtr.elections.nsw.gov.au/LGE2012/murray-shire-council.html
For a breakdown of voting by Vote Type (Ordinary, Declared Institution/Pre-poll,
Postal, Provisional/Silent) see the Councillor Election page of the above website, on
the Final Results tab select 04 - Enrolment and Voting by Aggregated Vote Type
Report.
Enrolment
Total Electors 4,870
Residential roll 4,867
Non-residential roll 3
SmartRolled Electors 110
(30/7/11 – 30/7/12)
Participation and Informality
Participation rate 79.6%
Formal votes 3,557
Informal votes 319
Total votes 3,876
Informality rate 8.2%
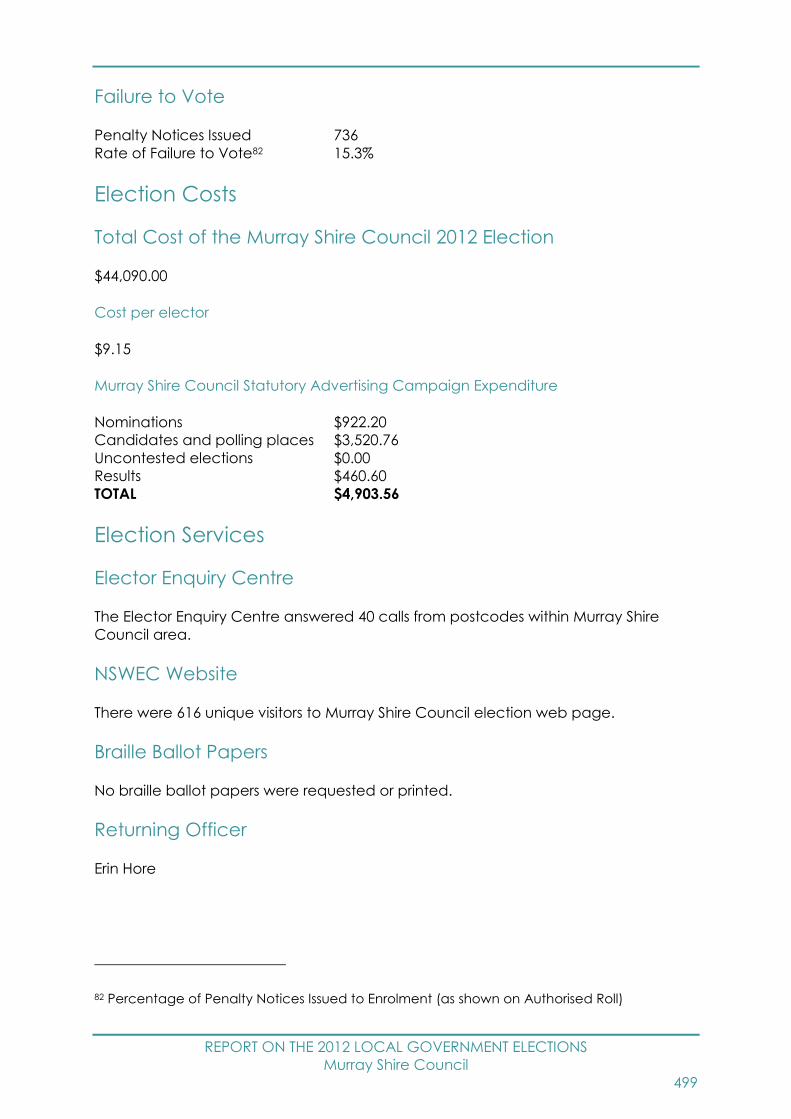
REPORT ON THE 2012 LOCAL GOVERNMENT ELECTIONS
Murray Shire Council
499
Failure to Vote
Penalty Notices Issued 736
Rate of Failure to Vote82 15.3%
Election Costs
Total Cost of the Murray Shire Council 2012 Election
$44,090.00
Cost per elector
$9.15
Murray Shire Council Statutory Advertising Campaign Expenditure
Nominations $922.20
Candidates and polling places $3,520.76
Uncontested elections $0.00
Results $460.60
TOTAL $4,903.56
Election Services
Elector Enquiry Centre
The Elector Enquiry Centre answered 40 calls from postcodes within Murray Shire
Council area.
NSWEC Website
There were 616 unique visitors to Murray Shire Council election web page.
Braille Ballot Papers
No braille ballot papers were requested or printed.
Returning Officer
Erin Hore
82 Percentage of Penalty Notices Issued to Enrolment (as shown on Authorised Roll)
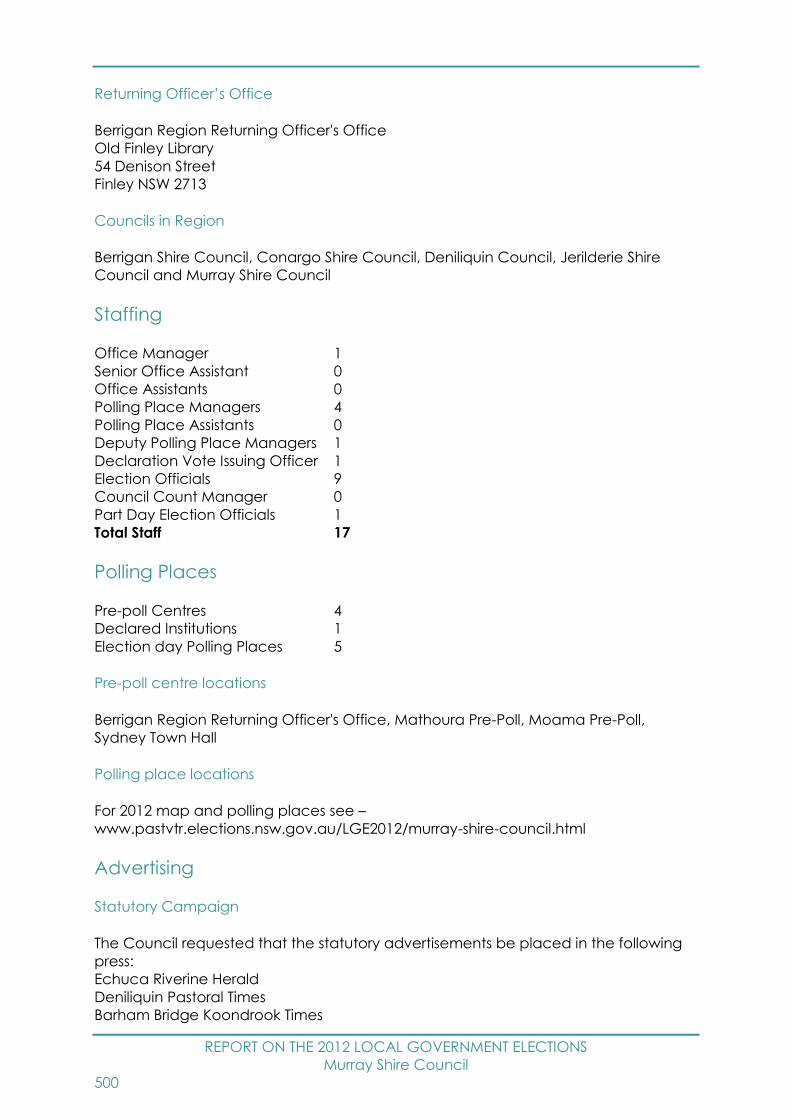
REPORT ON THE 2012 LOCAL GOVERNMENT ELECTIONS
Murray Shire Council
500
Returning Officer’s Office
Berrigan Region Returning Officer's Office
Old Finley Library
54 Denison Street
Finley NSW 2713
Councils in Region
Berrigan Shire Council, Conargo Shire Council, Deniliquin Council, Jerilderie Shire
Council and Murray Shire Council
Staffing
Office Manager 1
Senior Office Assistant 0
Office Assistants 0
Polling Place Managers 4
Polling Place Assistants 0
Deputy Polling Place Managers 1
Declaration Vote Issuing Officer 1
Election Officials 9
Council Count Manager 0
Part Day Election Officials 1
Total Staff 17
Polling Places
Pre-poll Centres 4
Declared Institutions 1
Election day Polling Places 5
Pre-poll centre locations
Berrigan Region Returning Officer's Office, Mathoura Pre-Poll, Moama Pre-Poll,
Sydney Town Hall
Polling place locations
For 2012 map and polling places see –
www.pastvtr.elections.nsw.gov.au/LGE2012/murray-shire-council.html
Advertising
Statutory Campaign
The Council requested that the statutory advertisements be placed in the following
press:
Echuca Riverine Herald
Deniliquin Pastoral Times
Barham Bridge Koondrook Times

REPORT ON THE 2012 LOCAL GOVERNMENT ELECTIONS
Murray Shire Council
501
Candidates
Nominations withdrawn
No Councillor nominations were withdrawn.
Councillor Candidates
Total Candidates 13
Female Candidates 3
Male Candidates 10
Names of all candidates
Councillor Candidates Party Affiliation
ANDERSON, Bill -
BILKEY, Chris -
BURKE, Gavin -
CAMPBELL, Gen -
GREAVES, Neil -
HOLDING, Alan -
MACKENZIE, Geoff -
MOON, Ian -
MULCAHY, Sue -
MURPHY, Betty -
POCKLINGTON, John -
SHARP, Brian -
WEYRICH, Thomas -

REPORT ON THE 2012 LOCAL GOVERNMENT ELECTIONS
Murrumbidgee Shire Council
502
Murrumbidgee Shire Council Report
Election Summary
Poll declared by Wednesday, 12 September, 2012
Councillor elections, successful candidates
Councillor name Party Affiliation
East Ward - Uncontested
BLACK, Robert -
CHIRGWIN, Christine -
EVANS, Austin -
West Ward
CURPHEY, Robert -
GILBERT, Gavin -
WELLS, Phillip -
For full details of results see website –
www.pastvtr.elections.nsw.gov.au/LGE2012/murrumbidgee-shire-council.html
For a breakdown of voting by Vote Type (Ordinary, Declared Institution/Pre-poll,
Postal, Provisional/Silent) see the Councillor Election page of the above website, on
the Final Results tab select 04 - Enrolment and Voting by Aggregated Vote Type
Report.
Enrolment
Total Electors 1,554
Residential roll 1,551
Non-residential roll 3
SmartRolled Electors 91
(30/7/11 – 30/7/12)
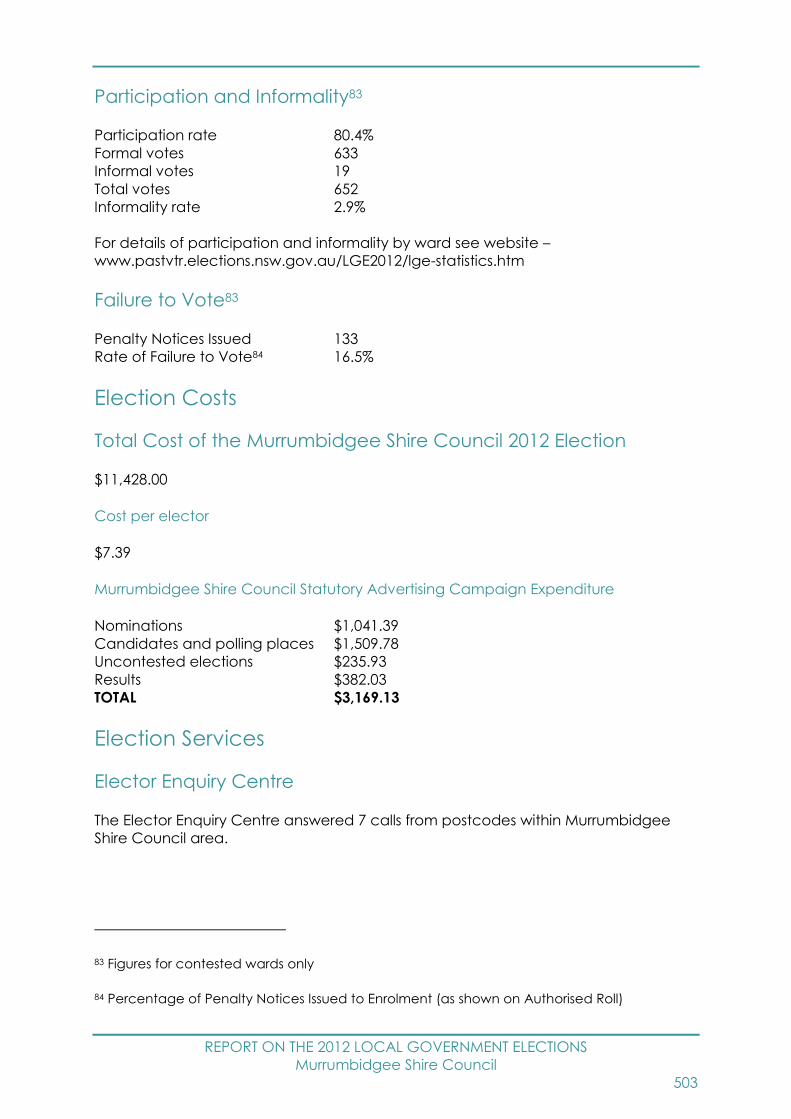
REPORT ON THE 2012 LOCAL GOVERNMENT ELECTIONS
Murrumbidgee Shire Council
503
Participation and Informality83
Participation rate 80.4%
Formal votes 633
Informal votes 19
Total votes 652
Informality rate 2.9%
For details of participation and informality by ward see website –
www.pastvtr.elections.nsw.gov.au/LGE2012/lge-statistics.htm
Failure to Vote83
Penalty Notices Issued 133
Rate of Failure to Vote84 16.5%
Election Costs
Total Cost of the Murrumbidgee Shire Council 2012 Election
$11,428.00
Cost per elector
$7.39
Murrumbidgee Shire Council Statutory Advertising Campaign Expenditure
Nominations $1,041.39
Candidates and polling places $1,509.78
Uncontested elections $235.93
Results $382.03
TOTAL $3,169.13
Election Services
Elector Enquiry Centre
The Elector Enquiry Centre answered 7 calls from postcodes within Murrumbidgee
Shire Council area.
83 Figures for contested wards only
84 Percentage of Penalty Notices Issued to Enrolment (as shown on Authorised Roll)

REPORT ON THE 2012 LOCAL GOVERNMENT ELECTIONS
Murrumbidgee Shire Council
504
NSWEC Website
There were 320 unique visitors to Murrumbidgee Shire Council election web page.
Braille Ballot Papers
No braille ballot papers were requested or printed.
Returning Officer
Matthew Farley
Returning Officer’s Office
Leeton Region Returning Officer's Office
18-22 Kurrajong Avenue
Leeton NSW 2705
Councils in Region
Carrathool Shire Council, Griffith City Council, Leeton Shire Council, Murrumbidgee
Shire Council and Narrandera Shire Council
Staffing
Office Manager 1
Senior Office Assistant 0
Office Assistants 0
Polling Place Managers 1
Polling Place Assistants 0
Deputy Polling Place Managers 0
Declaration Vote Issuing Officer 0
Election Officials 1
Council Count Manager 0
Part Day Election Officials 0
Total Staff 3
Polling Places
Pre-poll Centres 4
Declared Institutions 0
Election day Polling Places 2
Pre-poll centre locations
Coleambally Pre-Poll, Darlington Point Pre-Poll, Leeton Region Returning Officer's
Office, Sydney Town Hall
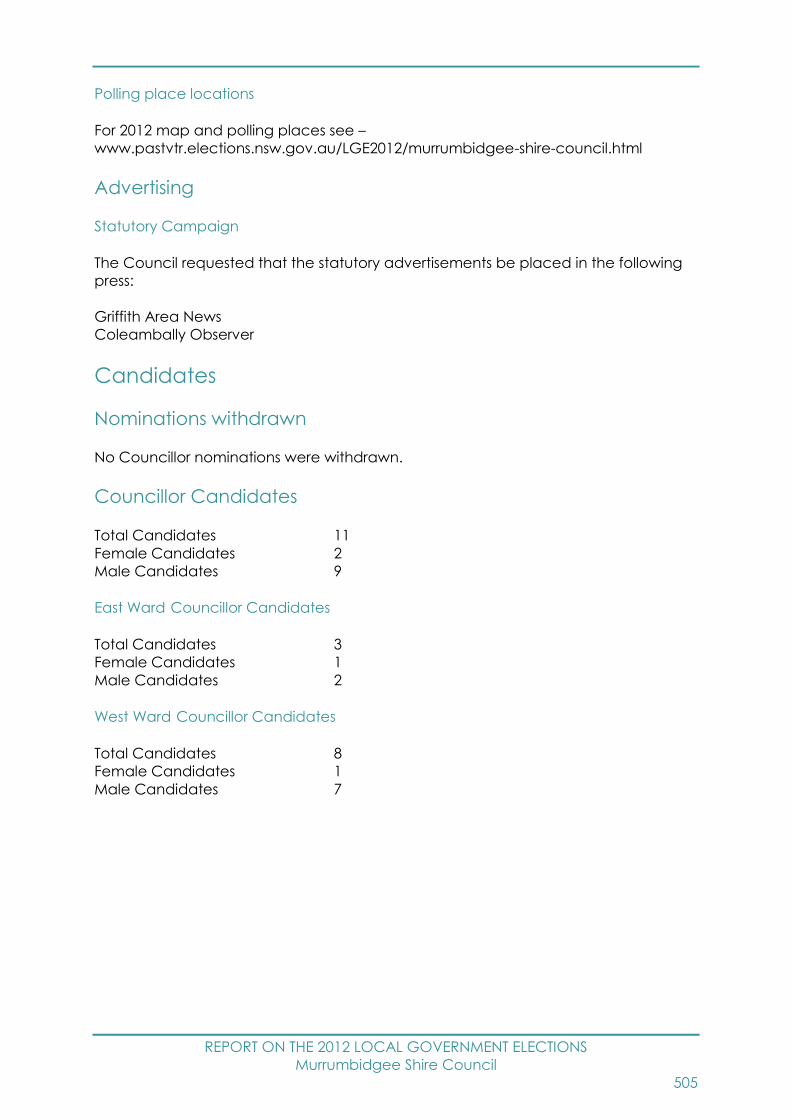
REPORT ON THE 2012 LOCAL GOVERNMENT ELECTIONS
Murrumbidgee Shire Council
505
Polling place locations
For 2012 map and polling places see –
www.pastvtr.elections.nsw.gov.au/LGE2012/murrumbidgee-shire-council.html
Advertising
Statutory Campaign
The Council requested that the statutory advertisements be placed in the following
press:
Griffith Area News
Coleambally Observer
Candidates
Nominations withdrawn
No Councillor nominations were withdrawn.
Councillor Candidates
Total Candidates 11
Female Candidates 2
Male Candidates 9
East Ward Councillor Candidates
Total Candidates 3
Female Candidates 1
Male Candidates 2
West Ward Councillor Candidates
Total Candidates 8
Female Candidates 1
Male Candidates 7
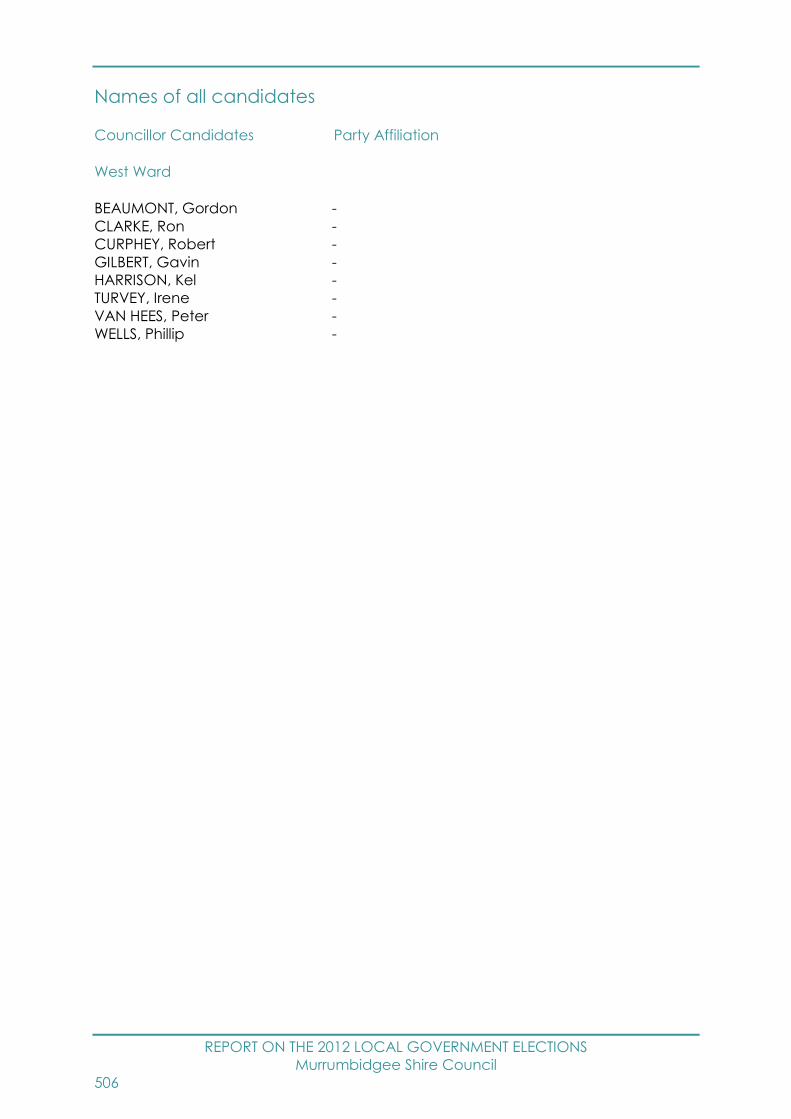
REPORT ON THE 2012 LOCAL GOVERNMENT ELECTIONS
Murrumbidgee Shire Council
506
Names of all candidates
Councillor Candidates Party Affiliation
West Ward
BEAUMONT, Gordon -
CLARKE, Ron -
CURPHEY, Robert -
GILBERT, Gavin -
HARRISON, Kel -
TURVEY, Irene -
VAN HEES, Peter -
WELLS, Phillip -
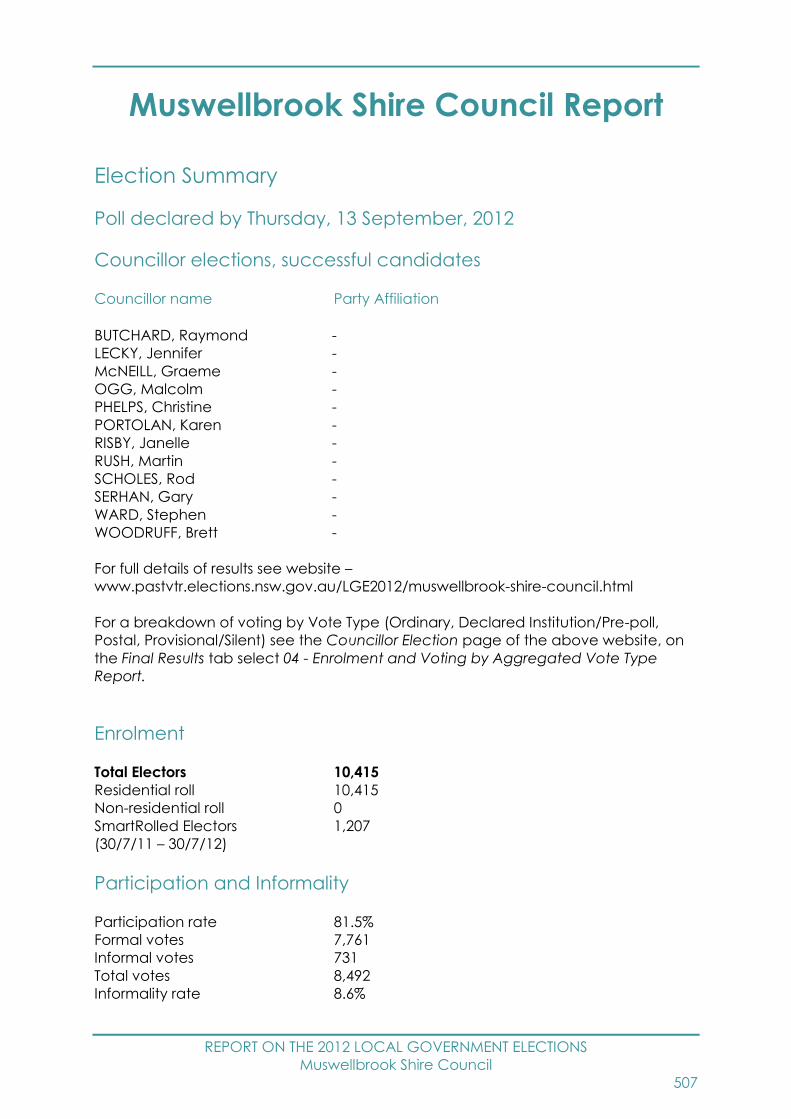
REPORT ON THE 2012 LOCAL GOVERNMENT ELECTIONS
Muswellbrook Shire Council
507
Muswellbrook Shire Council Report
Election Summary
Poll declared by Thursday, 13 September, 2012
Councillor elections, successful candidates
Councillor name Party Affiliation
BUTCHARD, Raymond -
LECKY, Jennifer -
McNEILL, Graeme -
OGG, Malcolm -
PHELPS, Christine -
PORTOLAN, Karen -
RISBY, Janelle -
RUSH, Martin -
SCHOLES, Rod -
SERHAN, Gary -
WARD, Stephen -
WOODRUFF, Brett -
For full details of results see website –
www.pastvtr.elections.nsw.gov.au/LGE2012/muswellbrook-shire-council.html
For a breakdown of voting by Vote Type (Ordinary, Declared Institution/Pre-poll,
Postal, Provisional/Silent) see the Councillor Election page of the above website, on
the Final Results tab select 04 - Enrolment and Voting by Aggregated Vote Type
Report.
Enrolment
Total Electors 10,415
Residential roll 10,415
Non-residential roll 0
SmartRolled Electors 1,207
(30/7/11 – 30/7/12)
Participation and Informality
Participation rate 81.5%
Formal votes 7,761
Informal votes 731
Total votes 8,492
Informality rate 8.6%
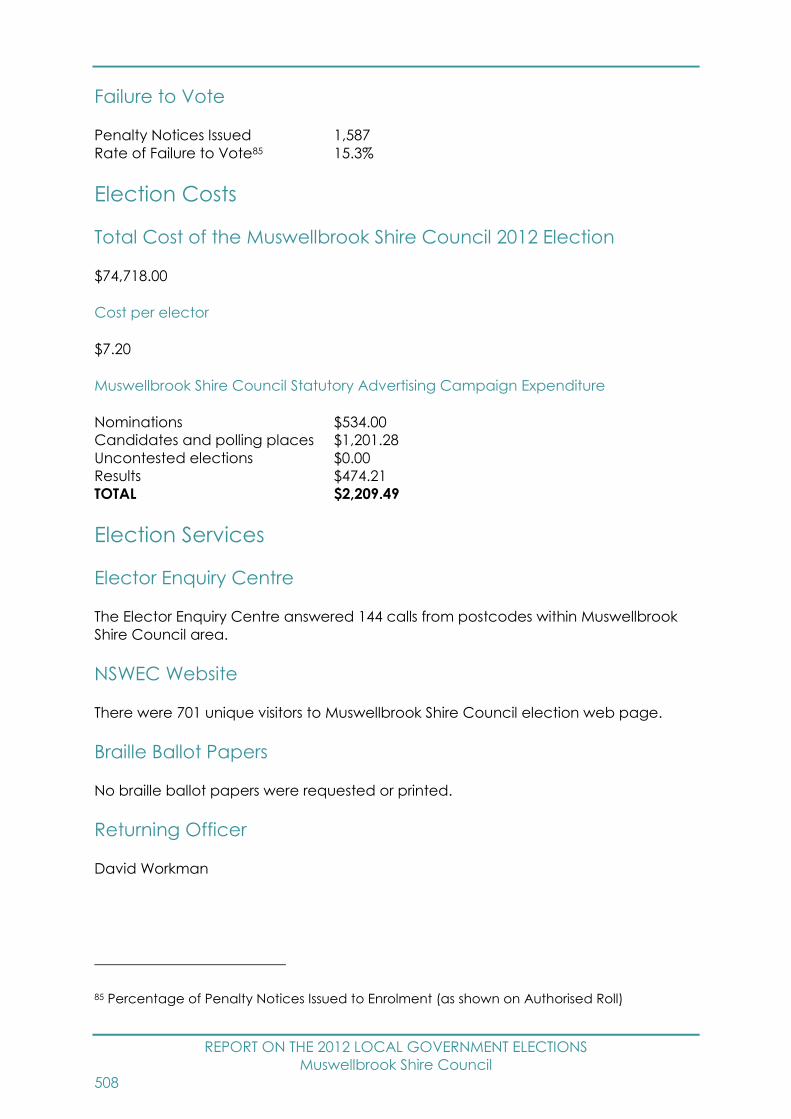
REPORT ON THE 2012 LOCAL GOVERNMENT ELECTIONS
Muswellbrook Shire Council
508
Failure to Vote
Penalty Notices Issued 1,587
Rate of Failure to Vote85 15.3%
Election Costs
Total Cost of the Muswellbrook Shire Council 2012 Election
$74,718.00
Cost per elector
$7.20
Muswellbrook Shire Council Statutory Advertising Campaign Expenditure
Nominations $534.00
Candidates and polling places $1,201.28
Uncontested elections $0.00
Results $474.21
TOTAL $2,209.49
Election Services
Elector Enquiry Centre
The Elector Enquiry Centre answered 144 calls from postcodes within Muswellbrook
Shire Council area.
NSWEC Website
There were 701 unique visitors to Muswellbrook Shire Council election web page.
Braille Ballot Papers
No braille ballot papers were requested or printed.
Returning Officer
David Workman
85 Percentage of Penalty Notices Issued to Enrolment (as shown on Authorised Roll)
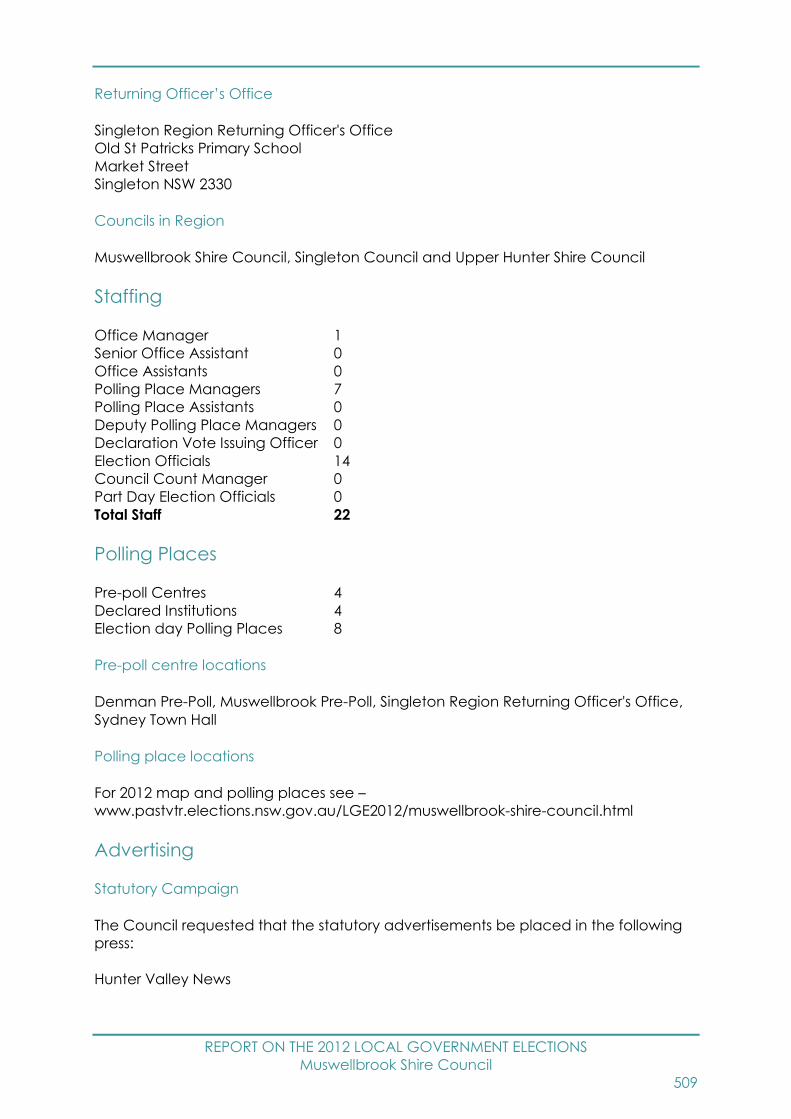
REPORT ON THE 2012 LOCAL GOVERNMENT ELECTIONS
Muswellbrook Shire Council
509
Returning Officer’s Office
Singleton Region Returning Officer's Office
Old St Patricks Primary School
Market Street
Singleton NSW 2330
Councils in Region
Muswellbrook Shire Council, Singleton Council and Upper Hunter Shire Council
Staffing
Office Manager 1
Senior Office Assistant 0
Office Assistants 0
Polling Place Managers 7
Polling Place Assistants 0
Deputy Polling Place Managers 0
Declaration Vote Issuing Officer 0
Election Officials 14
Council Count Manager 0
Part Day Election Officials 0
Total Staff 22
Polling Places
Pre-poll Centres 4
Declared Institutions 4
Election day Polling Places 8
Pre-poll centre locations
Denman Pre-Poll, Muswellbrook Pre-Poll, Singleton Region Returning Officer's Office,
Sydney Town Hall
Polling place locations
For 2012 map and polling places see –
www.pastvtr.elections.nsw.gov.au/LGE2012/muswellbrook-shire-council.html
Advertising
Statutory Campaign
The Council requested that the statutory advertisements be placed in the following
press:
Hunter Valley News

REPORT ON THE 2012 LOCAL GOVERNMENT ELECTIONS
Muswellbrook Shire Council
510
Candidates
Nominations withdrawn
No Councillor nominations were withdrawn.
Councillor Candidates
Total Candidates 13
Female Candidates 4
Male Candidates 9
Names of all candidates
Councillor Candidates Party Affiliation
BUTCHARD, Raymond -
LECKY, Jennifer -
McNEILL, Graeme -
OGG, Malcolm -
PHELPS, Christine -
PORTOLAN, Karen -
RISBY, Janelle -
RUSH, Martin -
SCHOLES, Rod -
SERHAN, Gary -
SHEWAN, John -
WARD, Stephen -
WOODRUFF, Brett -
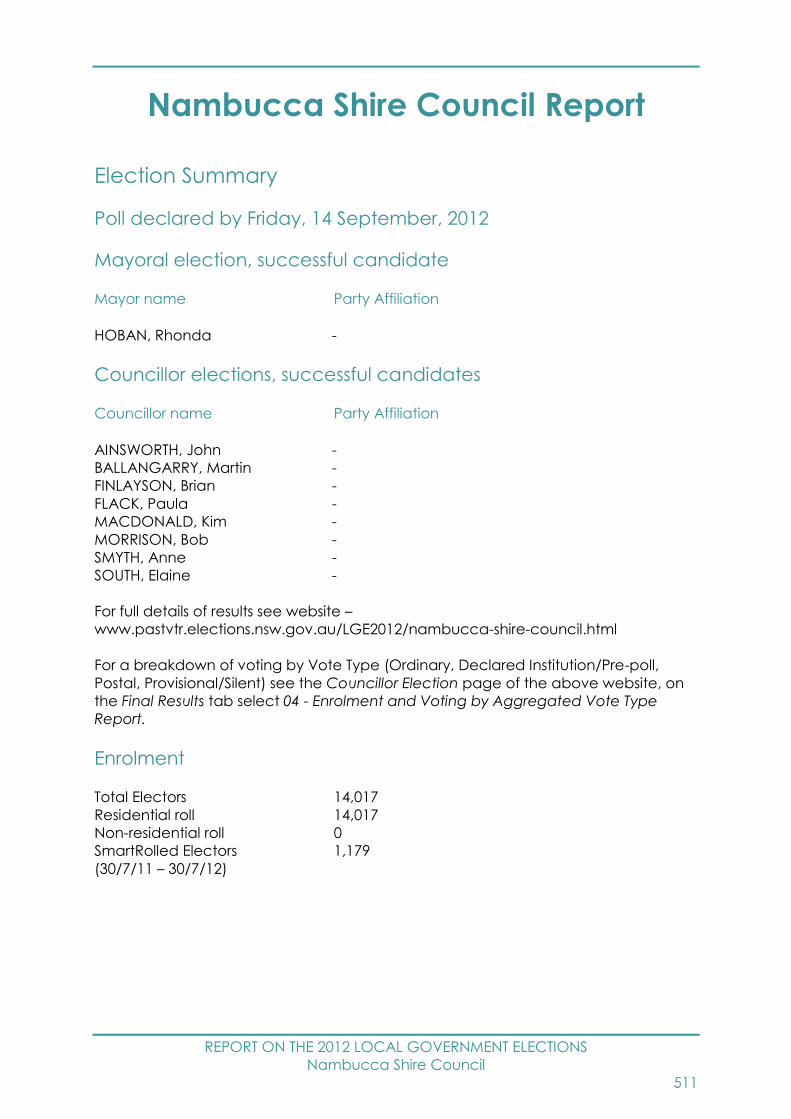
REPORT ON THE 2012 LOCAL GOVERNMENT ELECTIONS
Nambucca Shire Council
511
Nambucca Shire Council Report
Election Summary
Poll declared by Friday, 14 September, 2012
Mayoral election, successful candidate
Mayor name Party Affiliation
HOBAN, Rhonda -
Councillor elections, successful candidates
Councillor name Party Affiliation
AINSWORTH, John -
BALLANGARRY, Martin -
FINLAYSON, Brian -
FLACK, Paula -
MACDONALD, Kim -
MORRISON, Bob -
SMYTH, Anne -
SOUTH, Elaine -
For full details of results see website –
www.pastvtr.elections.nsw.gov.au/LGE2012/nambucca-shire-council.html
For a breakdown of voting by Vote Type (Ordinary, Declared Institution/Pre-poll,
Postal, Provisional/Silent) see the Councillor Election page of the above website, on
the Final Results tab select 04 - Enrolment and Voting by Aggregated Vote Type
Report.
Enrolment
Total Electors 14,017
Residential roll 14,017
Non-residential roll 0
SmartRolled Electors 1,179
(30/7/11 – 30/7/12)

REPORT ON THE 2012 LOCAL GOVERNMENT ELECTIONS
Nambucca Shire Council
512
Participation and Informality
Participation rate 80.5%
Formal votes 10,402
Informal votes 886
Total votes 11,288
Informality rate 7.8%
Failure to Vote
Penalty Notices Issued 2,086
Rate of Failure to Vote86 14.9%
Election Costs
Total Cost of the Nambucca Shire Council 2012 Election
$108,126.00
Cost per elector
$7.73
Nambucca Shire Council Statutory Advertising Campaign Expenditure
Nominations $1,032.88
Candidates and polling places $724.50
Uncontested elections $0.00
Results $362.25
TOTAL $2,119.63
Election Services
Elector Enquiry Centre
The Elector Enquiry Centre answered 119 calls from postcodes within Nambucca
Shire Council area.
NSWEC Website
There were 1,269 unique visitors to Nambucca Shire Council election web page.
Braille Ballot Papers
No braille ballot papers were requested or printed.
86 Percentage of Penalty Notices Issued to Enrolment (as shown on Authorised Roll)
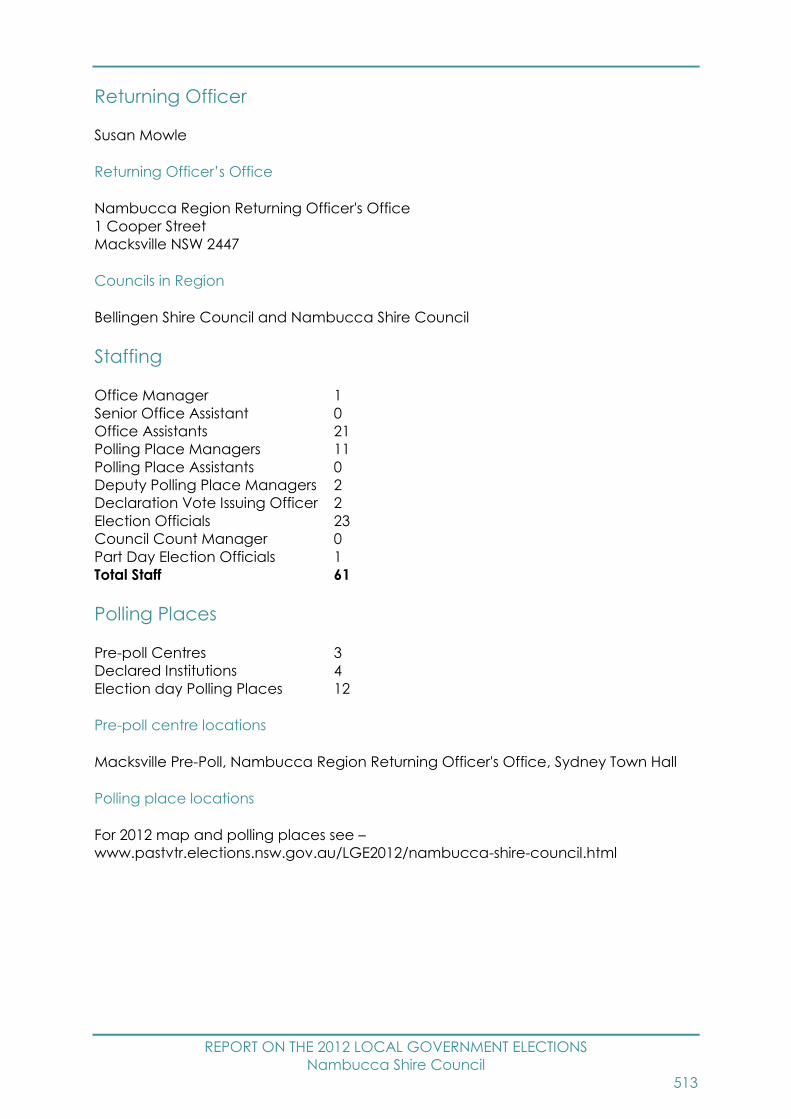
REPORT ON THE 2012 LOCAL GOVERNMENT ELECTIONS
Nambucca Shire Council
513
Returning Officer
Susan Mowle
Returning Officer’s Office
Nambucca Region Returning Officer's Office
1 Cooper Street
Macksville NSW 2447
Councils in Region
Bellingen Shire Council and Nambucca Shire Council
Staffing
Office Manager 1
Senior Office Assistant 0
Office Assistants 21
Polling Place Managers 11
Polling Place Assistants 0
Deputy Polling Place Managers 2
Declaration Vote Issuing Officer 2
Election Officials 23
Council Count Manager 0
Part Day Election Officials 1
Total Staff 61
Polling Places
Pre-poll Centres 3
Declared Institutions 4
Election day Polling Places 12
Pre-poll centre locations
Macksville Pre-Poll, Nambucca Region Returning Officer's Office, Sydney Town Hall
Polling place locations
For 2012 map and polling places see –
www.pastvtr.elections.nsw.gov.au/LGE2012/nambucca-shire-council.html

REPORT ON THE 2012 LOCAL GOVERNMENT ELECTIONS
Nambucca Shire Council
514
Advertising
Statutory Campaign
The Council requested that the statutory advertisements be placed in the following
press:
Nambucca Guardian
Candidates
Nominations withdrawn
No Mayoral nominations were withdrawn.
No Councillor nominations were withdrawn.
Mayoral Candidates
Total Candidates 2
Female Candidates 1
Male Candidates 1
Councillor Candidates
Total Candidates 13
Female Candidates 8
Male Candidates 5
Names of all candidates
Mayoral Candidates Party Affiliation
AINSWORTH, John -
HOBAN, Rhonda -
Councillor Candidates Party Affiliation
AINSWORTH, John -
BALLANGARRY, Martin -
COURT, Janet -
FINLAYSON, Brian -
FLACK, Paula -
HOBAN, Rhonda -
JAMIESON, Robby -
LANE, Joy -
MACDONALD, Kim -
MORRISON, Bob -
SHEATHER, Joy -
SMYTH, Anne -
SOUTH, Elaine -
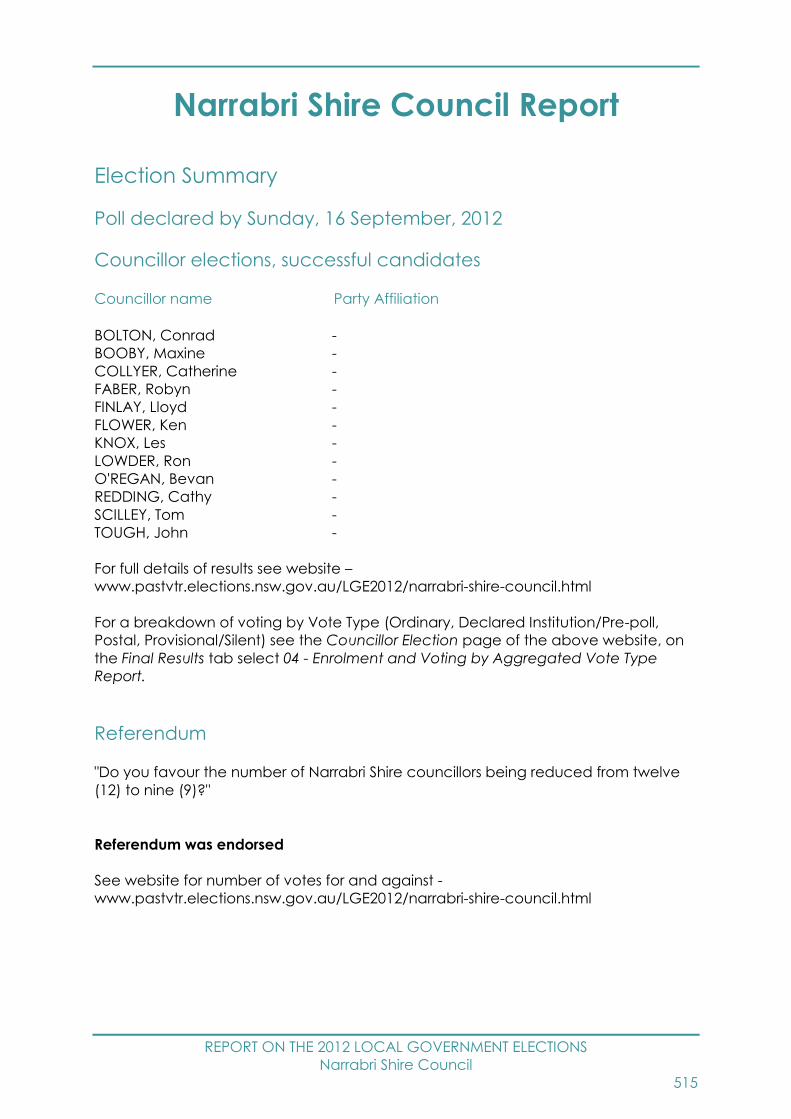
REPORT ON THE 2012 LOCAL GOVERNMENT ELECTIONS
Narrabri Shire Council
515
Narrabri Shire Council Report
Election Summary
Poll declared by Sunday, 16 September, 2012
Councillor elections, successful candidates
Councillor name Party Affiliation
BOLTON, Conrad -
BOOBY, Maxine -
COLLYER, Catherine -
FABER, Robyn -
FINLAY, Lloyd -
FLOWER, Ken -
KNOX, Les -
LOWDER, Ron -
O'REGAN, Bevan -
REDDING, Cathy -
SCILLEY, Tom -
TOUGH, John -
For full details of results see website –
www.pastvtr.elections.nsw.gov.au/LGE2012/narrabri-shire-council.html
For a breakdown of voting by Vote Type (Ordinary, Declared Institution/Pre-poll,
Postal, Provisional/Silent) see the Councillor Election page of the above website, on
the Final Results tab select 04 - Enrolment and Voting by Aggregated Vote Type
Report.
Referendum
"Do you favour the number of Narrabri Shire councillors being reduced from twelve
(12) to nine (9)?"
Referendum was endorsed
See website for number of votes for and against -
www.pastvtr.elections.nsw.gov.au/LGE2012/narrabri-shire-council.html
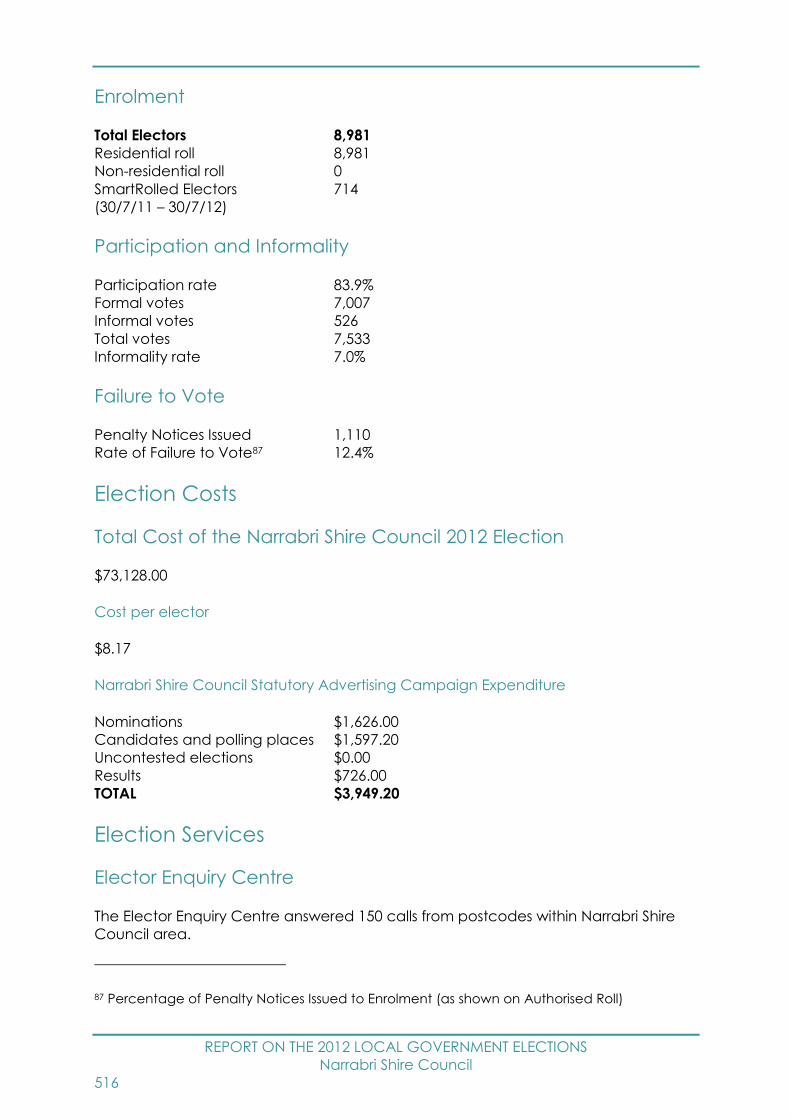
REPORT ON THE 2012 LOCAL GOVERNMENT ELECTIONS
Narrabri Shire Council
516
Enrolment
Total Electors 8,981
Residential roll 8,981
Non-residential roll 0
SmartRolled Electors 714
(30/7/11 – 30/7/12)
Participation and Informality
Participation rate 83.9%
Formal votes 7,007
Informal votes 526
Total votes 7,533
Informality rate 7.0%
Failure to Vote
Penalty Notices Issued 1,110
Rate of Failure to Vote87 12.4%
Election Costs
Total Cost of the Narrabri Shire Council 2012 Election
$73,128.00
Cost per elector
$8.17
Narrabri Shire Council Statutory Advertising Campaign Expenditure
Nominations $1,626.00
Candidates and polling places $1,597.20
Uncontested elections $0.00
Results $726.00
TOTAL $3,949.20
Election Services
Elector Enquiry Centre
The Elector Enquiry Centre answered 150 calls from postcodes within Narrabri Shire
Council area.
87 Percentage of Penalty Notices Issued to Enrolment (as shown on Authorised Roll)

REPORT ON THE 2012 LOCAL GOVERNMENT ELECTIONS
Narrabri Shire Council
517
NSWEC Website
There were 713 unique visitors to Narrabri Shire Council election web page.
Braille Ballot Papers
No braille ballot papers were requested or printed.
Returning Officer
Sarah Risby
Returning Officer’s Office
Moree Region Returning Officer's Office
Moree Banquet Hall
36 Balo Street
Moree NSW 2400
Councils in Region
Gwydir Shire Council, Moree Plains Shire Council, Narrabri Shire Council and Walgett
Shire Council
Staffing
Office Manager 1
Senior Office Assistant 0
Office Assistants 0
Polling Place Managers 10
Polling Place Assistants 0
Deputy Polling Place Managers 0
Declaration Vote Issuing Officer 0
Election Officials 15
Council Count Manager 0
Part Day Election Officials 2
Total Staff 28
Polling Places
Pre-poll Centres 5
Declared Institutions 2
Election day Polling Places 11
Pre-poll centre locations
Boggabri Pre-Poll, Moree Region Returning Officer's Office, Narrabri Pre-Poll, Wee
Waa Pre-Poll, Sydney Town Hall
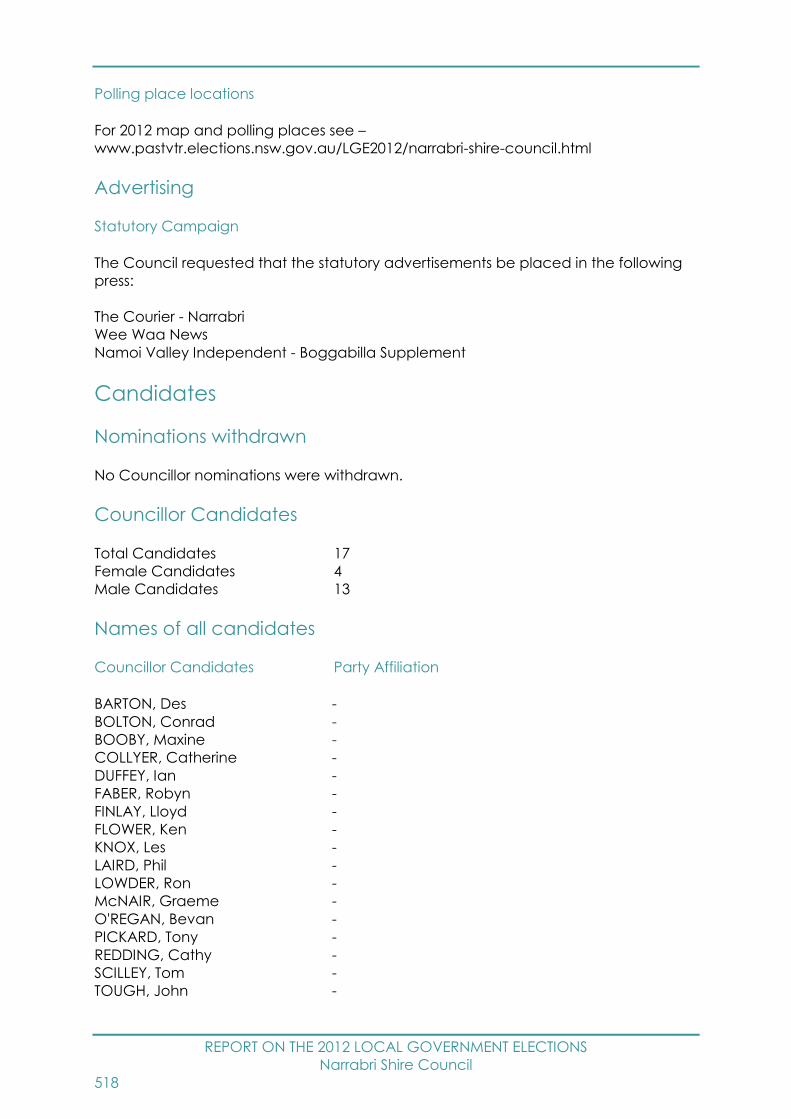
REPORT ON THE 2012 LOCAL GOVERNMENT ELECTIONS
Narrabri Shire Council
518
Polling place locations
For 2012 map and polling places see –
www.pastvtr.elections.nsw.gov.au/LGE2012/narrabri-shire-council.html
Advertising
Statutory Campaign
The Council requested that the statutory advertisements be placed in the following
press:
The Courier - Narrabri
Wee Waa News
Namoi Valley Independent - Boggabilla Supplement
Candidates
Nominations withdrawn
No Councillor nominations were withdrawn.
Councillor Candidates
Total Candidates 17
Female Candidates 4
Male Candidates 13
Names of all candidates
Councillor Candidates Party Affiliation
BARTON, Des -
BOLTON, Conrad -
BOOBY, Maxine -
COLLYER, Catherine -
DUFFEY, Ian -
FABER, Robyn -
FINLAY, Lloyd -
FLOWER, Ken -
KNOX, Les -
LAIRD, Phil -
LOWDER, Ron -
McNAIR, Graeme -
O'REGAN, Bevan -
PICKARD, Tony -
REDDING, Cathy -
SCILLEY, Tom -
TOUGH, John -

REPORT ON THE 2012 LOCAL GOVERNMENT ELECTIONS
Narrandera Shire Council
519
Narrandera Shire Council Report
Election Summary
Uncontested - Poll declared by Saturday, 8 September, 2012
Councillor elections, successful candidates
Councillor name Party Affiliation
CLARKE, Jenny -
EIPPER, Graham -
HALL, Wesley -
HOWARD, James -
KSCHENKA, Neville -
LEE, Jason -
MAYNE, Barry -
MORRIS, Kevin -
SULLIVAN, John -
Enrolment
Total Electors 4,366
Residential roll 4,366
Non-residential roll 0
SmartRolled Electors 328
(30/7/11 – 30/7/12)
Election Costs
Total Cost of the Narrandera Shire Council 2012 Election
$12,335.00
Cost per elector
$2.83
Narrandera Shire Council Statutory Advertising Campaign Expenditure
Nominations $586.40
Candidates and polling places $0.00
Uncontested elections $175.00
Results $0.00
TOTAL $761.40

REPORT ON THE 2012 LOCAL GOVERNMENT ELECTIONS
Narrandera Shire Council
520
Election Services
Elector Enquiry Centre
The Elector Enquiry Centre answered 12 calls from postcodes within Narrandera Shire
Council area.
NSWEC Website
There were 563 unique visitors to Narrandera Shire Council election web page.
Braille Ballot Papers
No braille ballot papers were requested.
Returning Officer
Matthew Farley
Returning Officer’s Office
Leeton Region Returning Officer's Office
18-22 Kurrajong Avenue
Leeton NSW 2705
Advertising
Statutory Campaign
The Council requested that the statutory advertisements be placed in the following
press:
Narrandera Argus
Candidates
Nominations withdrawn
No Councillor nominations were withdrawn.
Councillor Candidates
Total Candidates 9
Female Candidates 1
Male Candidates 8

REPORT ON THE 2012 LOCAL GOVERNMENT ELECTIONS
Narromine Shire Council
521
Narromine Shire Council Report
Election Summary
Poll declared by Thursday, 13 September, 2012
Councillor elections, successful candidates
Councillor name Party Affiliation
CARNEY, Ruth -
COLLINS, Dawn -
DAVIES, Craig -
ELLIS, Tony -
LAMBERT, Les -
MACK, George -
McANALLY, Billy -
McCUTCHEON, Sue -
TRUSCOTT, Ivan -
For full details of results see website –
www.pastvtr.elections.nsw.gov.au/LGE2012/narromine-shire-council.html
For a breakdown of voting by Vote Type (Ordinary, Declared Institution/Pre-poll,
Postal, Provisional/Silent) see the Councillor Election page of the above website, on
the Final Results tab select 04 - Enrolment and Voting by Aggregated Vote Type
Report.
Enrolment
Total Electors 4,541
Residential roll 4,541
Non-residential roll 0
SmartRolled Electors 308
(30/7/11 – 30/7/12)
Participation and Informality
Participation rate 85.8%
Formal votes 3,723
Informal votes 173
Total votes 3,896
Informality rate 4.4%

REPORT ON THE 2012 LOCAL GOVERNMENT ELECTIONS
Narromine Shire Council
522
Failure to Vote
Penalty Notices Issued 463
Rate of Failure to Vote88 10.2%
Election Costs
Total Cost of the Narromine Shire Council 2012 Election
$33,002.00
Cost per elector
$7.29
Narromine Shire Council Statutory Advertising Campaign Expenditure
Nominations $800.19
Candidates and polling places $792.90
Uncontested elections $0.00
Results $212.00
TOTAL $1,805.09
Election Services
Elector Enquiry Centre
The Elector Enquiry Centre answered 53 calls from postcodes within Narromine Shire
Council area.
NSWEC Website
There were 632 unique visitors to Narromine Shire Council election web page.
Braille Ballot Papers
No braille ballot papers were requested or printed.
Returning Officer
Katherine Reid
88 Percentage of Penalty Notices Issued to Enrolment (as shown on Authorised Roll)
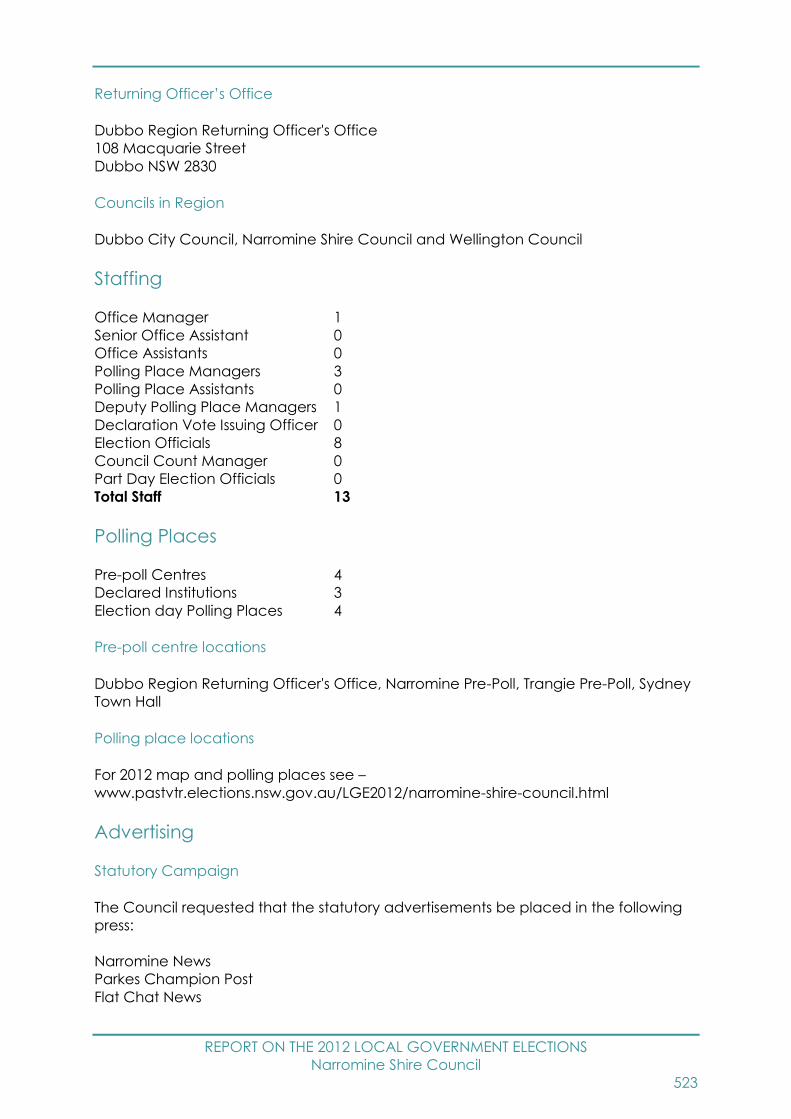
REPORT ON THE 2012 LOCAL GOVERNMENT ELECTIONS
Narromine Shire Council
523
Returning Officer’s Office
Dubbo Region Returning Officer's Office
108 Macquarie Street
Dubbo NSW 2830
Councils in Region
Dubbo City Council, Narromine Shire Council and Wellington Council
Staffing
Office Manager 1
Senior Office Assistant 0
Office Assistants 0
Polling Place Managers 3
Polling Place Assistants 0
Deputy Polling Place Managers 1
Declaration Vote Issuing Officer 0
Election Officials 8
Council Count Manager 0
Part Day Election Officials 0
Total Staff 13
Polling Places
Pre-poll Centres 4
Declared Institutions 3
Election day Polling Places 4
Pre-poll centre locations
Dubbo Region Returning Officer's Office, Narromine Pre-Poll, Trangie Pre-Poll, Sydney
Town Hall
Polling place locations
For 2012 map and polling places see –
www.pastvtr.elections.nsw.gov.au/LGE2012/narromine-shire-council.html
Advertising
Statutory Campaign
The Council requested that the statutory advertisements be placed in the following
press:
Narromine News
Parkes Champion Post
Flat Chat News

REPORT ON THE 2012 LOCAL GOVERNMENT ELECTIONS
Narromine Shire Council
524
Candidates
Nominations withdrawn
No Councillor nominations were withdrawn.
Councillor Candidates
Total Candidates 13
Female Candidates 5
Male Candidates 8
Names of all candidates
Councillor Candidates Party Affiliation
BARNETT, Bob -
BRYDON, Midnight -
CARNEY, Ruth -
COLLINS, Dawn -
DAVIES, Craig -
ELLIS, Tony -
JONES, Raynor -
LAMBERT, Les -
MACK, George -
McANALLY, Billy -
McCUTCHEON, Sue -
TRUSCOTT, Ivan -
WILSON, Gai -
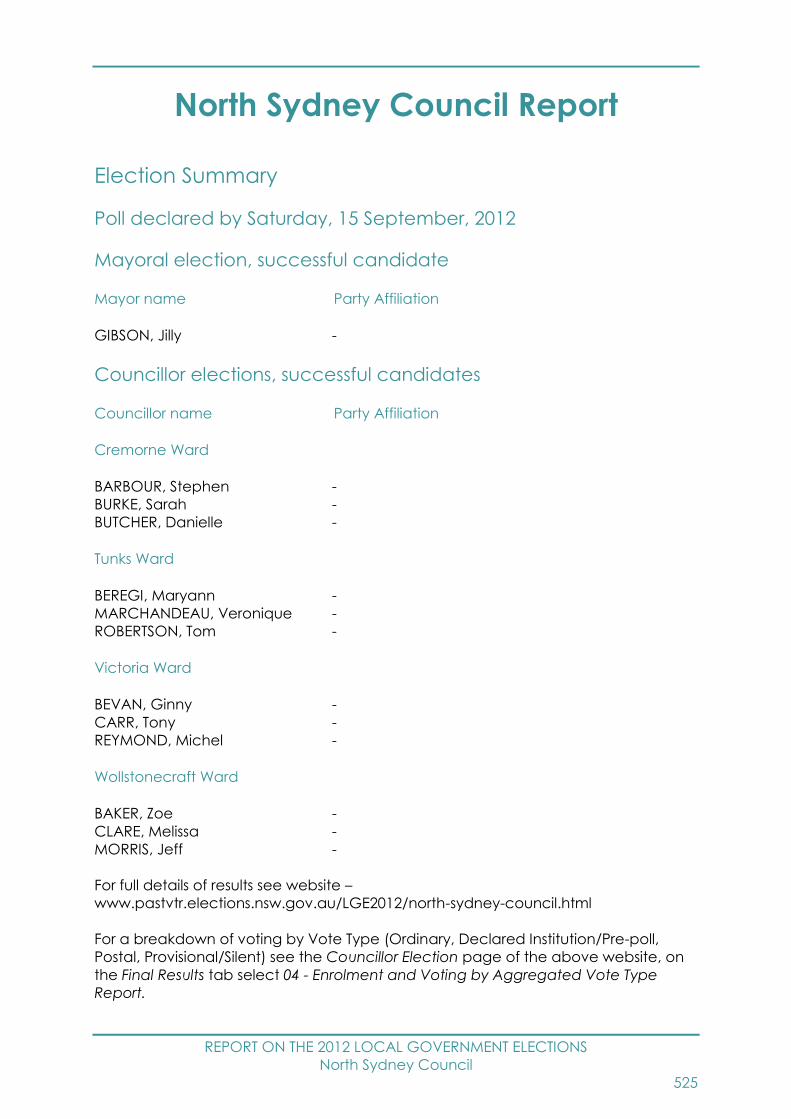
REPORT ON THE 2012 LOCAL GOVERNMENT ELECTIONS
North Sydney Council
525
North Sydney Council Report
Election Summary
Poll declared by Saturday, 15 September, 2012
Mayoral election, successful candidate
Mayor name Party Affiliation
GIBSON, Jilly -
Councillor elections, successful candidates
Councillor name Party Affiliation
Cremorne Ward
BARBOUR, Stephen -
BURKE, Sarah -
BUTCHER, Danielle -
Tunks Ward
BEREGI, Maryann -
MARCHANDEAU, Veronique -
ROBERTSON, Tom -
Victoria Ward
BEVAN, Ginny -
CARR, Tony -
REYMOND, Michel -
Wollstonecraft Ward
BAKER, Zoe -
CLARE, Melissa -
MORRIS, Jeff -
For full details of results see website –
www.pastvtr.elections.nsw.gov.au/LGE2012/north-sydney-council.html
For a breakdown of voting by Vote Type (Ordinary, Declared Institution/Pre-poll,
Postal, Provisional/Silent) see the Councillor Election page of the above website, on
the Final Results tab select 04 - Enrolment and Voting by Aggregated Vote Type
Report.

REPORT ON THE 2012 LOCAL GOVERNMENT ELECTIONS
North Sydney Council
526
Referendum
"Currently North Sydney Council has four wards and 12 councillors (three per ward),
plus the popularly elected mayor, elected for a four year term. Do you favour a
reduction in the number of wards from four to three and the number of councillors
from 13 to 10, inclusive of the popularly elected mayor? If there is majority support for
the proposal, the changes will take effect from the 2016 election."
Referendum was endorsed
See website for number of votes for and against -
www.pastvtr.elections.nsw.gov.au/LGE2012/north-sydney-council.html
Enrolment
Total Electors 42,562
Residential roll 42,475
Non-residential roll 87
SmartRolled Electors 5,355
(30/7/11 – 30/7/12)
Participation and Informality
Participation rate 74.1%
Formal votes 28,981
Informal votes 2,551
Total votes 31,532
Informality rate 8.1%
For details of participation and informality by ward see website –
www.pastvtr.elections.nsw.gov.au/LGE2012/lge-statistics.htm
Failure to Vote
Penalty Notices Issued 8,337
Rate of Failure to Vote89 19.7%
Election Costs
Total Cost of the North Sydney Council 2012 Election
$308,193.00
Cost per elector
$7.27
89 Percentage of Penalty Notices Issued to Enrolment (as shown on Authorised Roll)
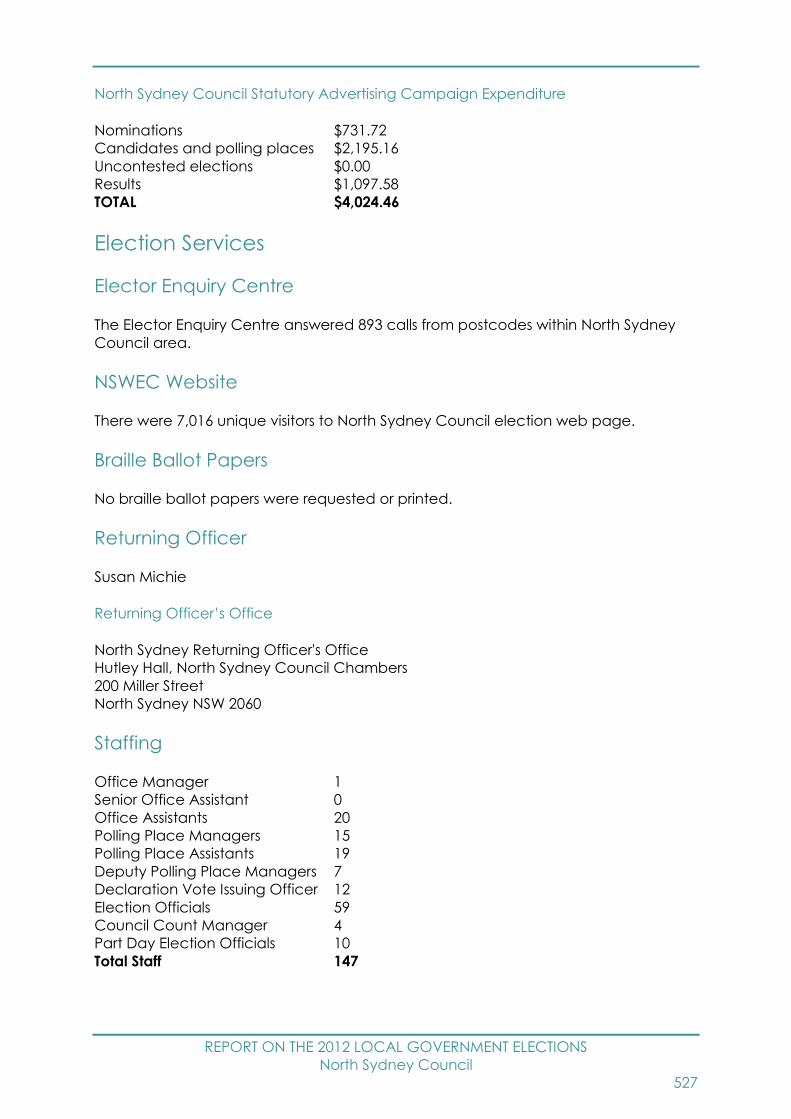
REPORT ON THE 2012 LOCAL GOVERNMENT ELECTIONS
North Sydney Council
527
North Sydney Council Statutory Advertising Campaign Expenditure
Nominations $731.72
Candidates and polling places $2,195.16
Uncontested elections $0.00
Results $1,097.58
TOTAL $4,024.46
Election Services
Elector Enquiry Centre
The Elector Enquiry Centre answered 893 calls from postcodes within North Sydney
Council area.
NSWEC Website
There were 7,016 unique visitors to North Sydney Council election web page.
Braille Ballot Papers
No braille ballot papers were requested or printed.
Returning Officer
Susan Michie
Returning Officer’s Office
North Sydney Returning Officer's Office
Hutley Hall, North Sydney Council Chambers
200 Miller Street
North Sydney NSW 2060
Staffing
Office Manager 1
Senior Office Assistant 0
Office Assistants 20
Polling Place Managers 15
Polling Place Assistants 19
Deputy Polling Place Managers 7
Declaration Vote Issuing Officer 12
Election Officials 59
Council Count Manager 4
Part Day Election Officials 10
Total Staff 147
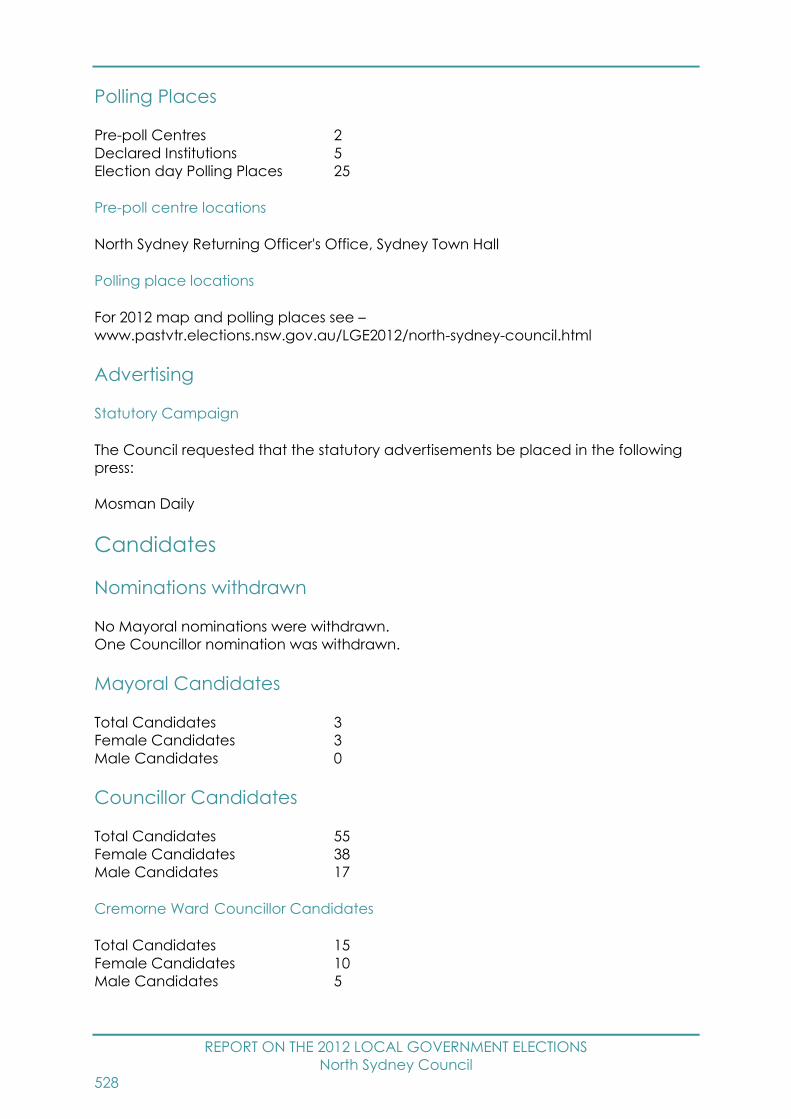
REPORT ON THE 2012 LOCAL GOVERNMENT ELECTIONS
North Sydney Council
528
Polling Places
Pre-poll Centres 2
Declared Institutions 5
Election day Polling Places 25
Pre-poll centre locations
North Sydney Returning Officer's Office, Sydney Town Hall
Polling place locations
For 2012 map and polling places see –
www.pastvtr.elections.nsw.gov.au/LGE2012/north-sydney-council.html
Advertising
Statutory Campaign
The Council requested that the statutory advertisements be placed in the following
press:
Mosman Daily
Candidates
Nominations withdrawn
No Mayoral nominations were withdrawn.
One Councillor nomination was withdrawn.
Mayoral Candidates
Total Candidates 3
Female Candidates 3
Male Candidates 0
Councillor Candidates
Total Candidates 55
Female Candidates 38
Male Candidates 17
Cremorne Ward Councillor Candidates
Total Candidates 15
Female Candidates 10
Male Candidates 5
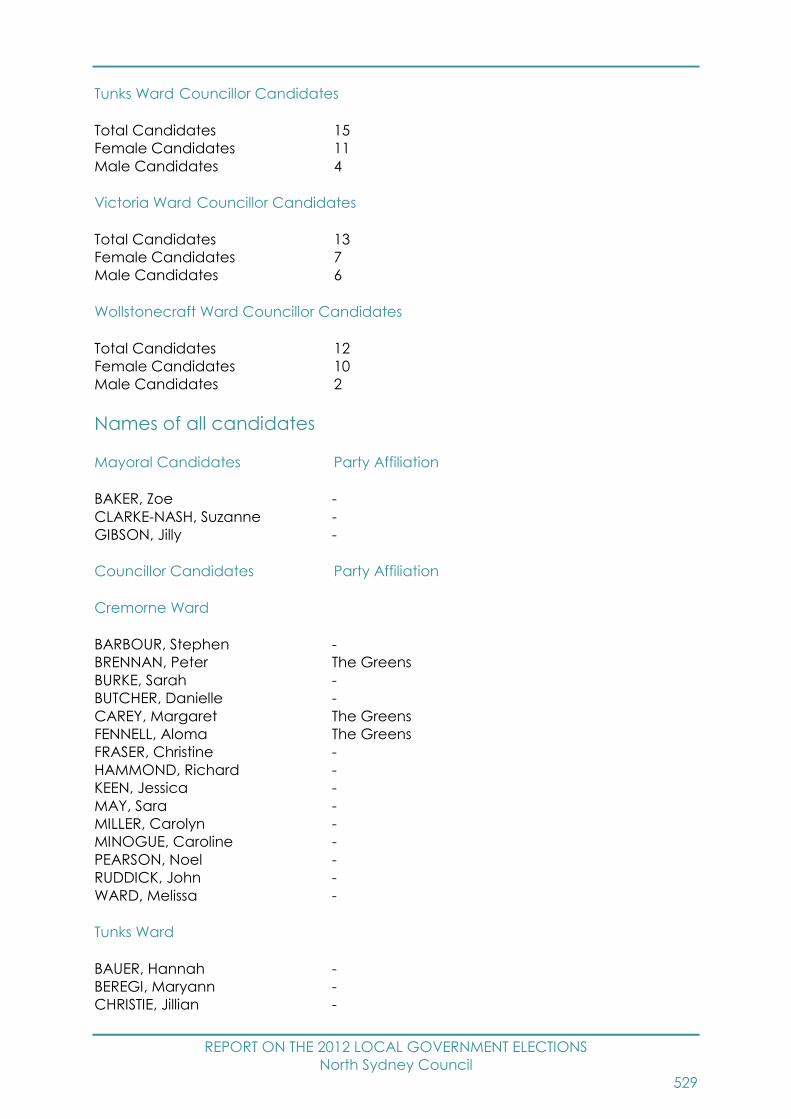
REPORT ON THE 2012 LOCAL GOVERNMENT ELECTIONS
North Sydney Council
529
Tunks Ward Councillor Candidates
Total Candidates 15
Female Candidates 11
Male Candidates 4
Victoria Ward Councillor Candidates
Total Candidates 13
Female Candidates 7
Male Candidates 6
Wollstonecraft Ward Councillor Candidates
Total Candidates 12
Female Candidates 10
Male Candidates 2
Names of all candidates
Mayoral Candidates Party Affiliation
BAKER, Zoe -
CLARKE-NASH, Suzanne -
GIBSON, Jilly -
Councillor Candidates Party Affiliation
Cremorne Ward
BARBOUR, Stephen -
BRENNAN, Peter The Greens
BURKE, Sarah -
BUTCHER, Danielle -
CAREY, Margaret The Greens
FENNELL, Aloma The Greens
FRASER, Christine -
HAMMOND, Richard -
KEEN, Jessica -
MAY, Sara -
MILLER, Carolyn -
MINOGUE, Caroline -
PEARSON, Noel -
RUDDICK, John -
WARD, Melissa -
Tunks Ward
BAUER, Hannah -
BEREGI, Maryann -
CHRISTIE, Jillian -

REPORT ON THE 2012 LOCAL GOVERNMENT ELECTIONS
North Sydney Council
530
DE COURCAY, Marion -
DRUMMOND, Alanya -
FARRAR, Richard -
FERGUSON, Zoe -
MACDONALD, Kate -
MARCHANDEAU, Veronique -
MARSH, Sam -
RAYNER, Rose -
ROBERTSON, Tom -
SMAILES, Kate -
WORRALL, Phil -
YAAGER, Lara -
Victoria Ward
ATKIN, Elsa -
BEVAN, Ginny -
CARR, Tony -
DAI, Kelly -
GIBSON, Jilly -
IACCARINO, Toby -
OWEN, Justin -
RAYNER, Tom -
REED, Sarah -
REYMOND, Michel -
SCANLAN, Mark -
STONEBERG, Molly -
WILSON, Carol -
Wollstonecraft Ward
BAKER, Zoe -
CARRIGAN, Carol -
CLARE, Melissa -
DAVIDSON, Diana -
GREENOP, Jane -
GUERRERO, Rebecca -
HENDERSON, Anne -
HUDSON, Steven -
MARTIN, Jenna -
MORRIS, Jeff -
ROBSON, Susan -
SOUTH, Nikki -

REPORT ON THE 2012 LOCAL GOVERNMENT ELECTIONS
Oberon Council
531
Oberon Council Report
Election Summary
Uncontested - Poll declared by Saturday, 8 September, 2012
Councillor elections, successful candidates
Councillor name Party Affiliation
DONEY, Ian -
EVANS, Jill -
FRANCIS, Neil -
GIBBONS, Kerry -
LORD, Sam -
McCARTHY, Clive -
McMAHON, John -
MORGAN, John -
SAJOWITZ, Kathy -
Enrolment
Total Electors 3,574
Residential roll 3,574
Non-residential roll 0
SmartRolled Electors 203
(30/7/11 – 30/7/12)
Election Costs
Total Cost of the Oberon Council 2012 Election
$10,076.00
Cost per elector
$2.82
Oberon Council Statutory Advertising Campaign Expenditure
Nominations $1,285.51
Candidates and polling places $298.80
Uncontested elections $513.00
Results $0.00
TOTAL $2,097.31
REPORT ON THE 2012 LOCAL GOVERNMENT ELECTIONS
Oberon Council
532
Election Services
Elector Enquiry Centre
The Elector Enquiry Centre answered 19 calls from postcodes within Oberon Council
area.
NSWEC Website
There were 381 unique visitors to Oberon Council election web page.
Braille Ballot Papers
No braille ballot papers were requested.
Returning Officer
Stuart Evennett
Returning Officer’s Office
Bathurst Region Returning Officer's Office
126 Bentinck Street
Bathurst NSW 2795
Councils in Region
Bathurst Regional Council, Blayney Shire Council and Oberon Council
Advertising
Statutory Campaign
The Council requested that the statutory advertisements be placed in the following
press:
Oberon Review
Western Advocate
Candidates
Nominations withdrawn
No Councillor nominations were withdrawn.
REPORT ON THE 2012 LOCAL GOVERNMENT ELECTIONS
Oberon Council
533
Councillor Candidates
Total Candidates 9
Female Candidates 3
Male Candidates 6
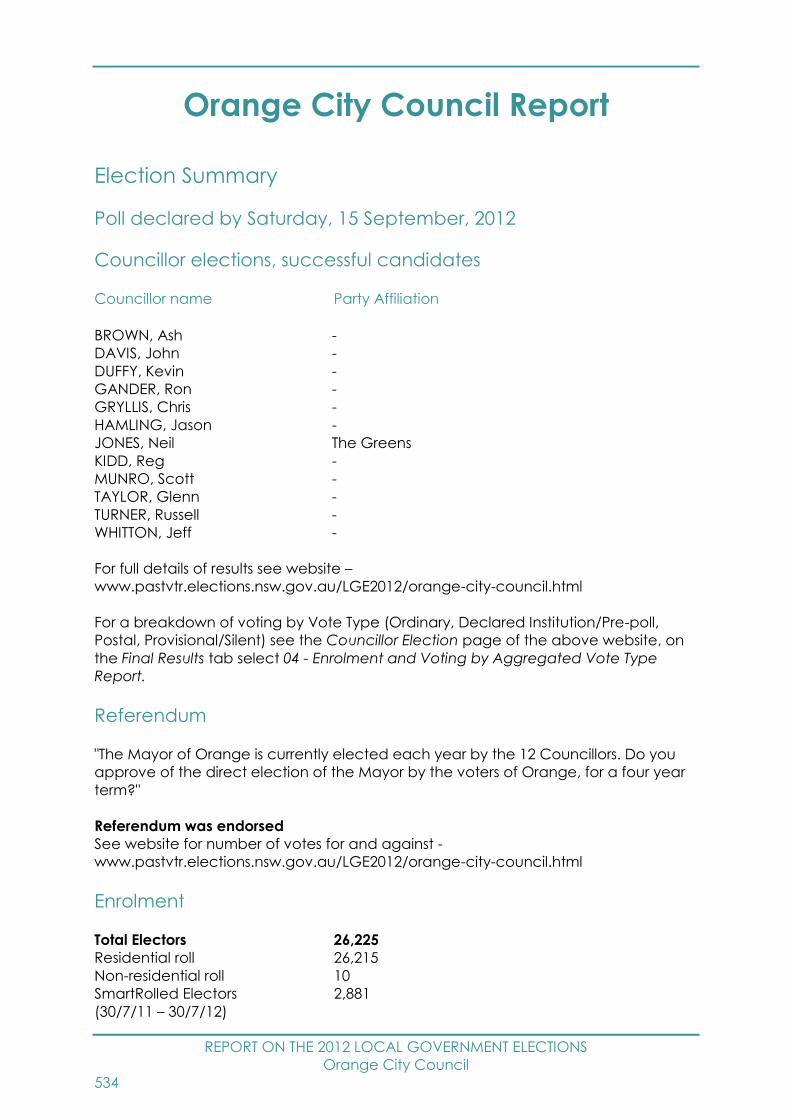
REPORT ON THE 2012 LOCAL GOVERNMENT ELECTIONS
Orange City Council
534
Orange City Council Report
Election Summary
Poll declared by Saturday, 15 September, 2012
Councillor elections, successful candidates
Councillor name Party Affiliation
BROWN, Ash -
DAVIS, John -
DUFFY, Kevin -
GANDER, Ron -
GRYLLIS, Chris -
HAMLING, Jason -
JONES, Neil The Greens
KIDD, Reg -
MUNRO, Scott -
TAYLOR, Glenn -
TURNER, Russell -
WHITTON, Jeff -
For full details of results see website –
www.pastvtr.elections.nsw.gov.au/LGE2012/orange-city-council.html
For a breakdown of voting by Vote Type (Ordinary, Declared Institution/Pre-poll,
Postal, Provisional/Silent) see the Councillor Election page of the above website, on
the Final Results tab select 04 - Enrolment and Voting by Aggregated Vote Type
Report.
Referendum
"The Mayor of Orange is currently elected each year by the 12 Councillors. Do you
approve of the direct election of the Mayor by the voters of Orange, for a four year
term?"
Referendum was endorsed
See website for number of votes for and against -
www.pastvtr.elections.nsw.gov.au/LGE2012/orange-city-council.html
Enrolment
Total Electors 26,225
Residential roll 26,215
Non-residential roll 10
SmartRolled Electors 2,881
(30/7/11 – 30/7/12)
REPORT ON THE 2012 LOCAL GOVERNMENT ELECTIONS
Orange City Council
535
Participation and Informality
Participation rate 85.7%
Formal votes 20,798
Informal votes 1,677
Total votes 22,475
Informality rate 7.5%
Failure to Vote
Penalty Notices Issued 2,893
Rate of Failure to Vote90 11.1%
Election Costs
Total Cost of the Orange City Council 2012 Election
$183,096.00
Cost per elector
$7.01
Orange City Council Statutory Advertising Campaign Expenditure
Nominations $1,663.20
Candidates and polling places $2,743.37
Uncontested elections $0.00
Results $326.70
TOTAL $4,733.27
Election Services
Elector Enquiry Centre
The Elector Enquiry Centre answered 228 calls from postcodes within Orange City
Council area.
NSWEC Website
There were 2,911 unique visitors to Orange City Council election web page.
Braille Ballot Papers
No braille ballot papers were requested or printed.
90 Percentage of Penalty Notices Issued to Enrolment (as shown on Authorised Roll)
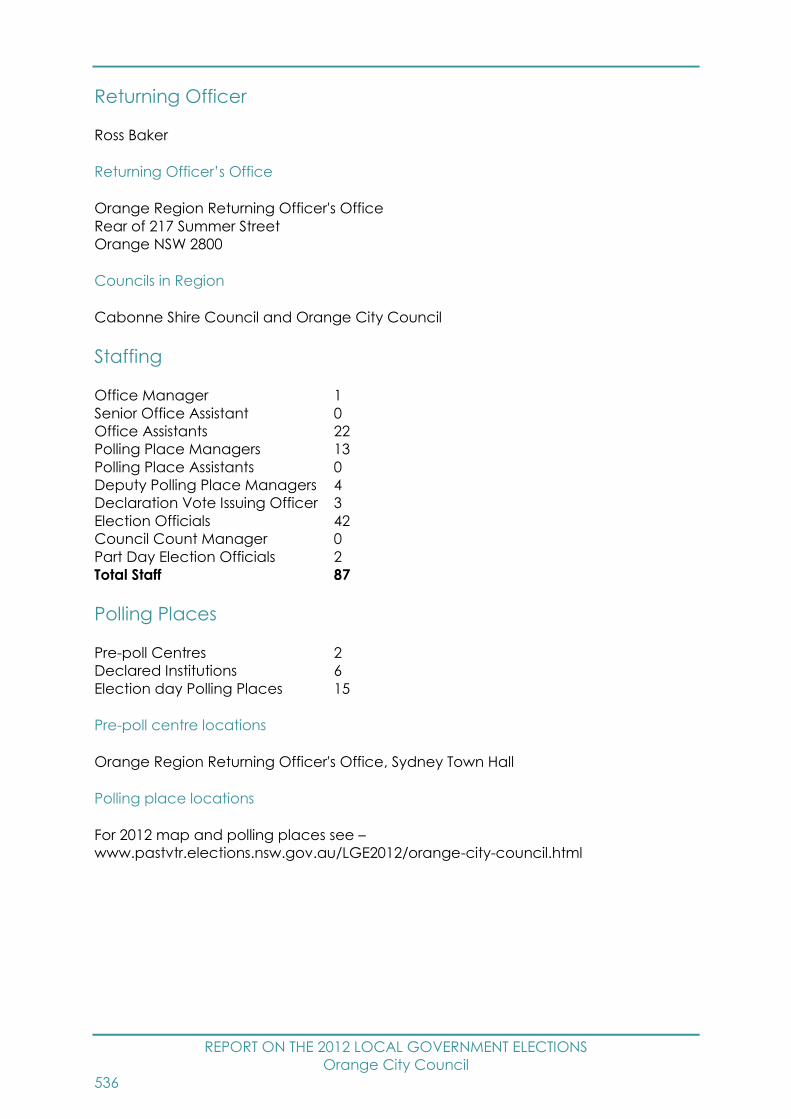
REPORT ON THE 2012 LOCAL GOVERNMENT ELECTIONS
Orange City Council
536
Returning Officer
Ross Baker
Returning Officer’s Office
Orange Region Returning Officer's Office
Rear of 217 Summer Street
Orange NSW 2800
Councils in Region
Cabonne Shire Council and Orange City Council
Staffing
Office Manager 1
Senior Office Assistant 0
Office Assistants 22
Polling Place Managers 13
Polling Place Assistants 0
Deputy Polling Place Managers 4
Declaration Vote Issuing Officer 3
Election Officials 42
Council Count Manager 0
Part Day Election Officials 2
Total Staff 87
Polling Places
Pre-poll Centres 2
Declared Institutions 6
Election day Polling Places 15
Pre-poll centre locations
Orange Region Returning Officer's Office, Sydney Town Hall
Polling place locations
For 2012 map and polling places see –
www.pastvtr.elections.nsw.gov.au/LGE2012/orange-city-council.html
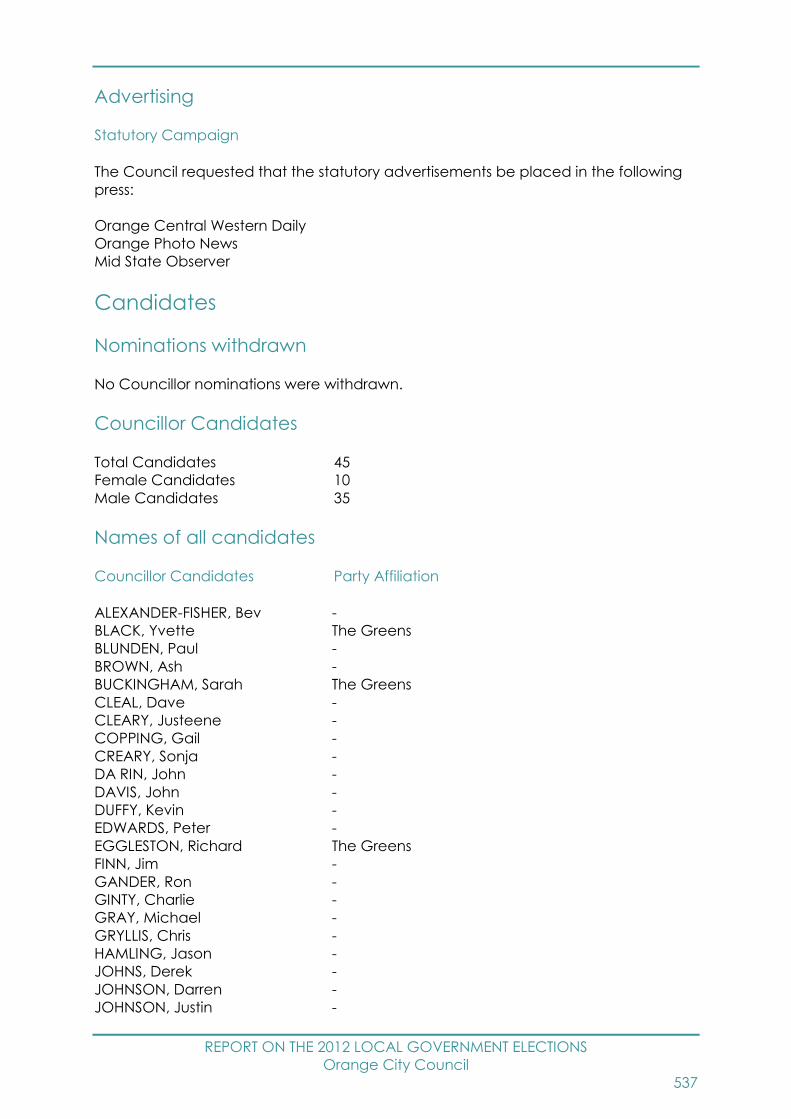
REPORT ON THE 2012 LOCAL GOVERNMENT ELECTIONS
Orange City Council
537
Advertising
Statutory Campaign
The Council requested that the statutory advertisements be placed in the following
press:
Orange Central Western Daily
Orange Photo News
Mid State Observer
Candidates
Nominations withdrawn
No Councillor nominations were withdrawn.
Councillor Candidates
Total Candidates 45
Female Candidates 10
Male Candidates 35
Names of all candidates
Councillor Candidates Party Affiliation
ALEXANDER-FISHER, Bev -
BLACK, Yvette The Greens
BLUNDEN, Paul -
BROWN, Ash -
BUCKINGHAM, Sarah The Greens
CLEAL, Dave -
CLEARY, Justeene -
COPPING, Gail -
CREARY, Sonja -
DA RIN, John -
DAVIS, John -
DUFFY, Kevin -
EDWARDS, Peter -
EGGLESTON, Richard The Greens
FINN, Jim -
GANDER, Ron -
GINTY, Charlie -
GRAY, Michael -
GRYLLIS, Chris -
HAMLING, Jason -
JOHNS, Derek -
JOHNSON, Darren -
JOHNSON, Justin -
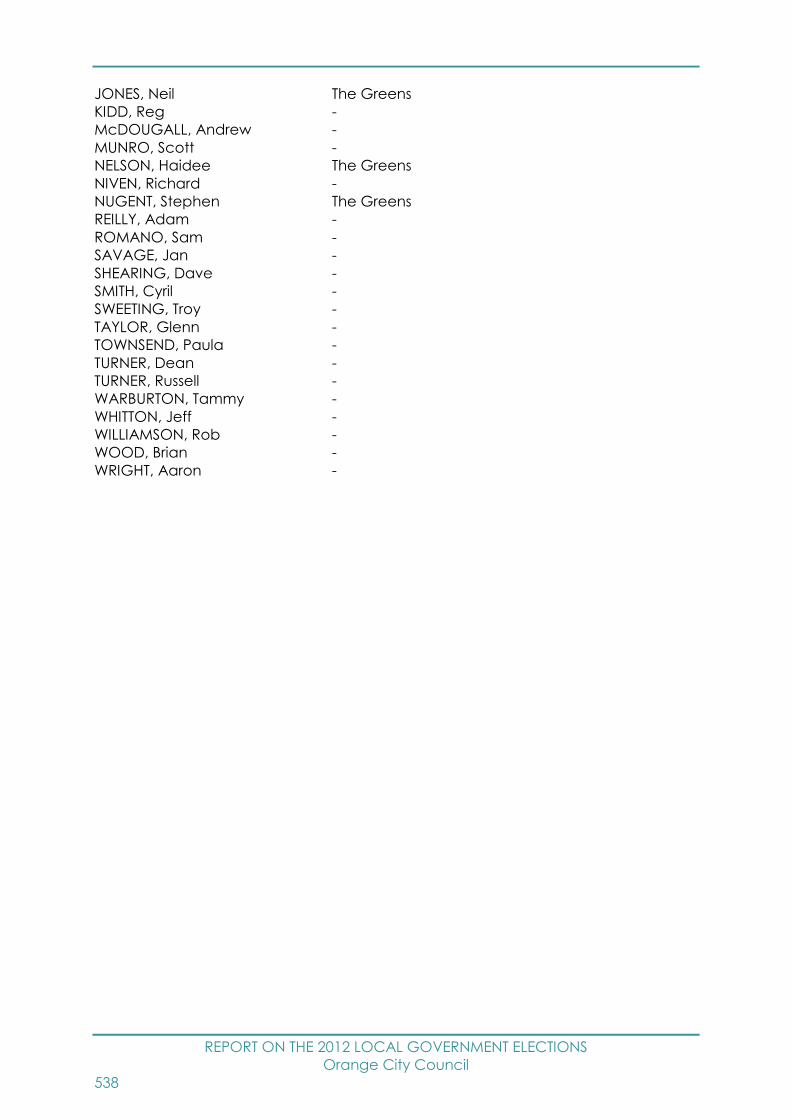
REPORT ON THE 2012 LOCAL GOVERNMENT ELECTIONS
Orange City Council
538
JONES, Neil The Greens
KIDD, Reg -
McDOUGALL, Andrew -
MUNRO, Scott -
NELSON, Haidee The Greens
NIVEN, Richard -
NUGENT, Stephen The Greens
REILLY, Adam -
ROMANO, Sam -
SAVAGE, Jan -
SHEARING, Dave -
SMITH, Cyril -
SWEETING, Troy -
TAYLOR, Glenn -
TOWNSEND, Paula -
TURNER, Dean -
TURNER, Russell -
WARBURTON, Tammy -
WHITTON, Jeff -
WILLIAMSON, Rob -
WOOD, Brian -
WRIGHT, Aaron -
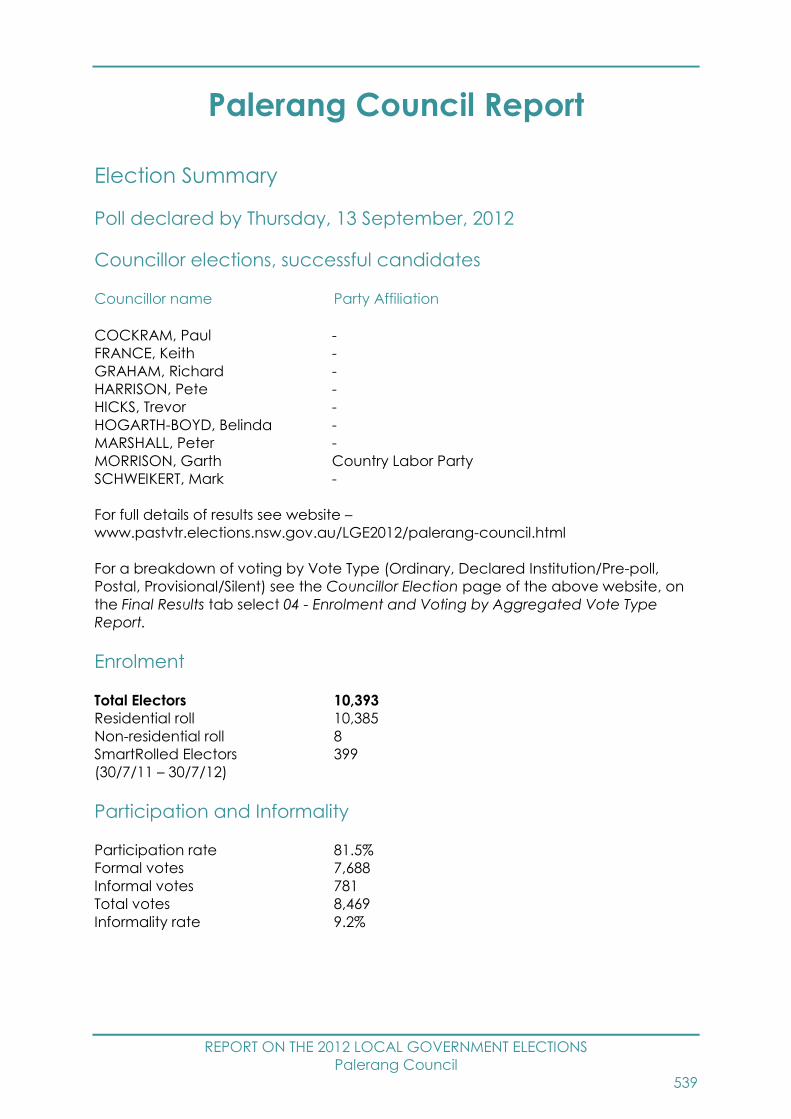
REPORT ON THE 2012 LOCAL GOVERNMENT ELECTIONS
Palerang Council
539
Palerang Council Report
Election Summary
Poll declared by Thursday, 13 September, 2012
Councillor elections, successful candidates
Councillor name Party Affiliation
COCKRAM, Paul -
FRANCE, Keith -
GRAHAM, Richard -
HARRISON, Pete -
HICKS, Trevor -
HOGARTH-BOYD, Belinda -
MARSHALL, Peter -
MORRISON, Garth Country Labor Party
SCHWEIKERT, Mark -
For full details of results see website –
www.pastvtr.elections.nsw.gov.au/LGE2012/palerang-council.html
For a breakdown of voting by Vote Type (Ordinary, Declared Institution/Pre-poll,
Postal, Provisional/Silent) see the Councillor Election page of the above website, on
the Final Results tab select 04 - Enrolment and Voting by Aggregated Vote Type
Report.
Enrolment
Total Electors 10,393
Residential roll 10,385
Non-residential roll 8
SmartRolled Electors 399
(30/7/11 – 30/7/12)
Participation and Informality
Participation rate 81.5%
Formal votes 7,688
Informal votes 781
Total votes 8,469
Informality rate 9.2%

REPORT ON THE 2012 LOCAL GOVERNMENT ELECTIONS
Palerang Council
540
Failure to Vote
Penalty Notices Issued 1,436
Rate of Failure to Vote91 14.0%
Election Costs
Total Cost of the Palerang Council 2012 Election
$73,294.00
Cost per elector
$7.13
Palerang Council Statutory Advertising Campaign Expenditure
Nominations $1,047.82
Candidates and polling places $2,128.34
Uncontested elections $0.00
Results $364.28
TOTAL $3,540.44
Election Services
Elector Enquiry Centre
The Elector Enquiry Centre answered 195 calls from postcodes within Palerang
Council area.
NSWEC Website
There were 1,954 unique visitors to Palerang Council election web page.
Braille Ballot Papers
No braille ballot papers were requested or printed.
Returning Officer
Linda Strika
91 Percentage of Penalty Notices Issued to Enrolment (as shown on Authorised Roll)

REPORT ON THE 2012 LOCAL GOVERNMENT ELECTIONS
Palerang Council
541
Returning Officer’s Office
Queanbeyan Region Returning Officer's Office
256 Crawford Street
Queanbeyan NSW 2620
Councils in Region
Palerang Council and Queanbeyan City Council
Staffing
Office Manager 1
Senior Office Assistant 0
Office Assistants 0
Polling Place Managers 9
Polling Place Assistants 0
Deputy Polling Place Managers 1
Declaration Vote Issuing Officer 1
Election Officials 17
Council Count Manager 0
Part Day Election Officials 3
Total Staff 32
Polling Places
Pre-poll Centres 4
Declared Institutions 1
Election day Polling Places 10
Pre-poll centre locations
Braidwood Pre-Poll, Bungendore Pre-Poll, Queanbeyan Region Returning Officer's
Office, Sydney Town Hall
Polling place locations
For 2012 map and polling places see –
www.pastvtr.elections.nsw.gov.au/LGE2012/palerang-council.html
Advertising
Statutory Campaign
The Council requested that the statutory advertisements be placed in the following
press:
Bugendore Bulletin
Captains Flat Telegraph
Queanbeyan Age
Braidwood Times
Bungendore Mirror

REPORT ON THE 2012 LOCAL GOVERNMENT ELECTIONS
Palerang Council
542
Candidates
Nominations withdrawn
No Councillor nominations were withdrawn.
Councillor Candidates
Total Candidates 27
Female Candidates 8
Male Candidates 19
Names of all candidates
Councillor Candidates Party Affiliation
BOS, Kerry -
CHAPMAN, Jil Country Labor Party
COCKRAM, Paul -
DIGNAN, Cecily -
FALKINER, James -
FRANCE, Keith -
GEORGE, Greg -
GRAHAM, Richard -
HAND, Sandra -
HARRISON, Pete -
HENRY, Naomi -
HICKS, Trevor -
HOGARTH-BOYD, Belinda -
HOLTHOUSE, David -
LANGFORD, Geoffrey -
MARJASON, Ian -
MARSHALL, Peter -
McCOLL, Mike Country Labor Party
MONTESIN, Helen -
MORRISON, Garth Country Labor Party
PETERS, Ian -
RICHARDS, Bronwyn -
RUTLEDGE, William -
SCHWEIKERT, Mark -
SMITH, Alison Country Labor Party
VAN DER LINDEN, Fernando Country Labor Party
VAN DER STRAATEN, John -
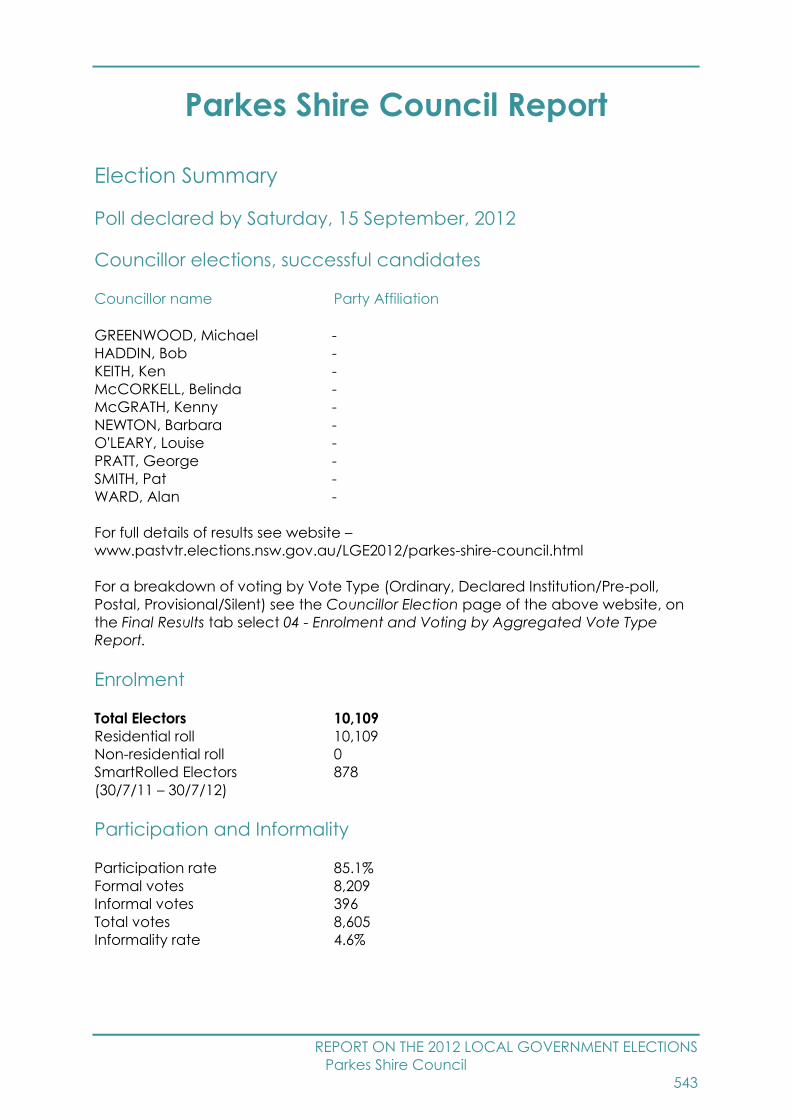
REPORT ON THE 2012 LOCAL GOVERNMENT ELECTIONS
Parkes Shire Council
543
Parkes Shire Council Report
Election Summary
Poll declared by Saturday, 15 September, 2012
Councillor elections, successful candidates
Councillor name Party Affiliation
GREENWOOD, Michael -
HADDIN, Bob -
KEITH, Ken -
McCORKELL, Belinda -
McGRATH, Kenny -
NEWTON, Barbara -
O'LEARY, Louise -
PRATT, George -
SMITH, Pat -
WARD, Alan -
For full details of results see website –
www.pastvtr.elections.nsw.gov.au/LGE2012/parkes-shire-council.html
For a breakdown of voting by Vote Type (Ordinary, Declared Institution/Pre-poll,
Postal, Provisional/Silent) see the Councillor Election page of the above website, on
the Final Results tab select 04 - Enrolment and Voting by Aggregated Vote Type
Report.
Enrolment
Total Electors 10,109
Residential roll 10,109
Non-residential roll 0
SmartRolled Electors 878
(30/7/11 – 30/7/12)
Participation and Informality
Participation rate 85.1%
Formal votes 8,209
Informal votes 396
Total votes 8,605
Informality rate 4.6%

REPORT ON THE 2012 LOCAL GOVERNMENT ELECTIONS
Parkes Shire Council
544
Failure to Vote
Penalty Notices Issued 1,115
Rate of Failure to Vote92 11.1%
Election Costs
Total Cost of the Parkes Shire Council 2012 Election
$82,687.00
Cost per elector
$8.20
Parkes Shire Council Statutory Advertising Campaign Expenditure
Nominations $543.18
Candidates and polling places $1,008.00
Uncontested elections $0.00
Results $162.00
TOTAL $1,713.18
Election Services
Elector Enquiry Centre
The Elector Enquiry Centre answered 177 calls from postcodes within Parkes Shire
Council area.
NSWEC Website
There were 1,470 unique visitors to Parkes Shire Council election web page.
Braille Ballot Papers
No braille ballot papers were requested or printed.
Returning Officer
Geoffrey Lark
92 Percentage of Penalty Notices Issued to Enrolment (as shown on Authorised Roll)
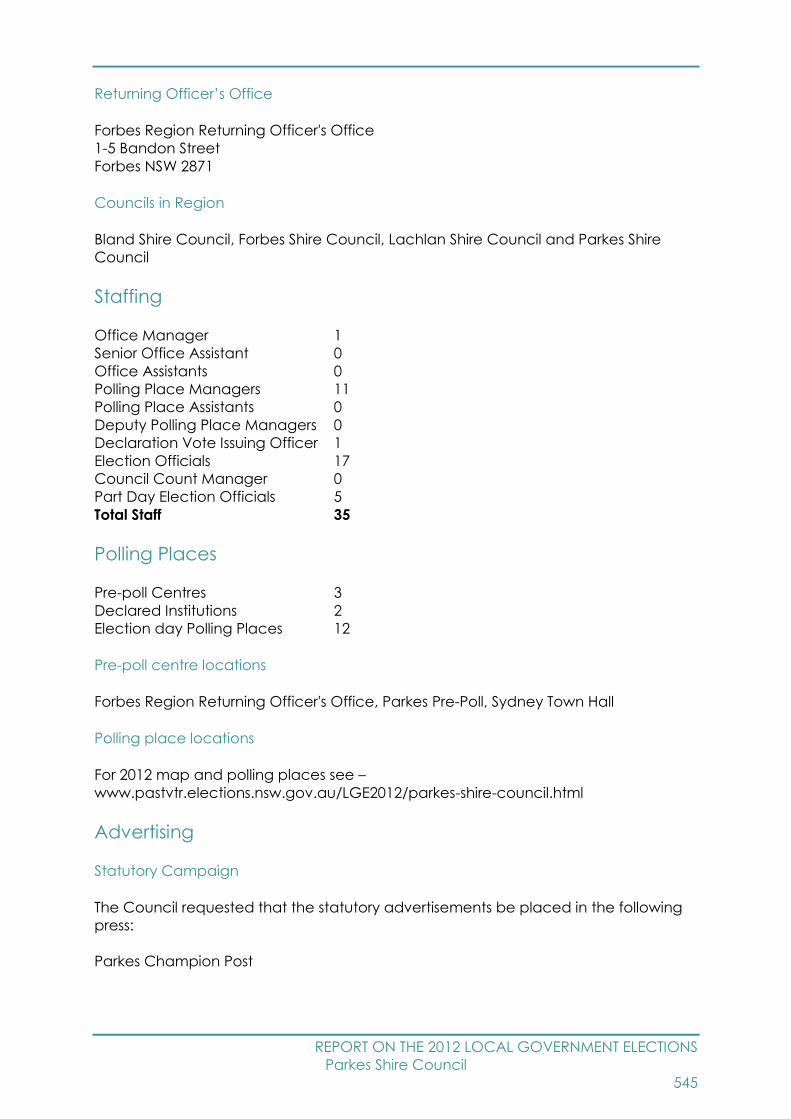
REPORT ON THE 2012 LOCAL GOVERNMENT ELECTIONS
Parkes Shire Council
545
Returning Officer’s Office
Forbes Region Returning Officer's Office
1-5 Bandon Street
Forbes NSW 2871
Councils in Region
Bland Shire Council, Forbes Shire Council, Lachlan Shire Council and Parkes Shire
Council
Staffing
Office Manager 1
Senior Office Assistant 0
Office Assistants 0
Polling Place Managers 11
Polling Place Assistants 0
Deputy Polling Place Managers 0
Declaration Vote Issuing Officer 1
Election Officials 17
Council Count Manager 0
Part Day Election Officials 5
Total Staff 35
Polling Places
Pre-poll Centres 3
Declared Institutions 2
Election day Polling Places 12
Pre-poll centre locations
Forbes Region Returning Officer's Office, Parkes Pre-Poll, Sydney Town Hall
Polling place locations
For 2012 map and polling places see –
www.pastvtr.elections.nsw.gov.au/LGE2012/parkes-shire-council.html
Advertising
Statutory Campaign
The Council requested that the statutory advertisements be placed in the following
press:
Parkes Champion Post

REPORT ON THE 2012 LOCAL GOVERNMENT ELECTIONS
Parkes Shire Council
546
Candidates
Nominations withdrawn
No Councillor nominations were withdrawn.
Councillor Candidates
Total Candidates 12
Female Candidates 5
Male Candidates 7
Names of all candidates
Councillor Candidates Party Affiliation
GREENWOOD, Michael -
HADDIN, Bob -
KEITH, Ken -
McCORKELL, Belinda -
McGRATH, Kenny -
NEWTON, Barbara -
O'LEARY, Louise -
PRATT, George -
REYNOLDS, Grant -
RICHARDSON-BARTLEY, Gail -
SMITH, Pat -
WARD, Alan -

REPORT ON THE 2012 LOCAL GOVERNMENT ELECTIONS
Parramatta City Council
547
Parramatta City Council Report
Election Summary
Poll declared by Sunday, 16 September, 2012
Councillor elections, successful candidates
Councillor name Party Affiliation
Arthur Phillip Ward
FINN, Julia Australian Labor Party (NSW Branch)
MAKARI, Bakous Liberal Party of Australia New South Wales Division
WILSON, Andrew Lorraine Wearne Independents
Caroline Chisholm Ward
CHOWDHURY, Shahadat Australian Labor Party (NSW Branch)
DWYER, Bob -
LLOYD, Scott Liberal Party of Australia New South Wales Division
Elizabeth Macarthur Ward
CHEDID, John Liberal Party of Australia New South Wales Division
HUGH, John Liberal Party of Australia New South Wales Division
SHAW, James Australian Labor Party (NSW Branch)
Lachlan Macquarie Ward
ABOOD, Jean Pierre Liberal Party of Australia New South Wales Division
ESBER, Pierre Australian Labor Party (NSW Branch)
WEARNE, Lorraine Lorraine Wearne Independents
Woodville Ward
ELMORE, Glenn Australian Labor Party (NSW Branch)
GARRARD, Paul Woodville Independents
ISSA, Steven Liberal Party of Australia New South Wales Division
For full details of results see website –
www.pastvtr.elections.nsw.gov.au/LGE2012/parramatta-city-council.html
For a breakdown of voting by Vote Type (Ordinary, Declared Institution/Pre-poll,
Postal, Provisional/Silent) see the Councillor Election page of the above website, on
the Final Results tab select 04 - Enrolment and Voting by Aggregated Vote Type
Report.
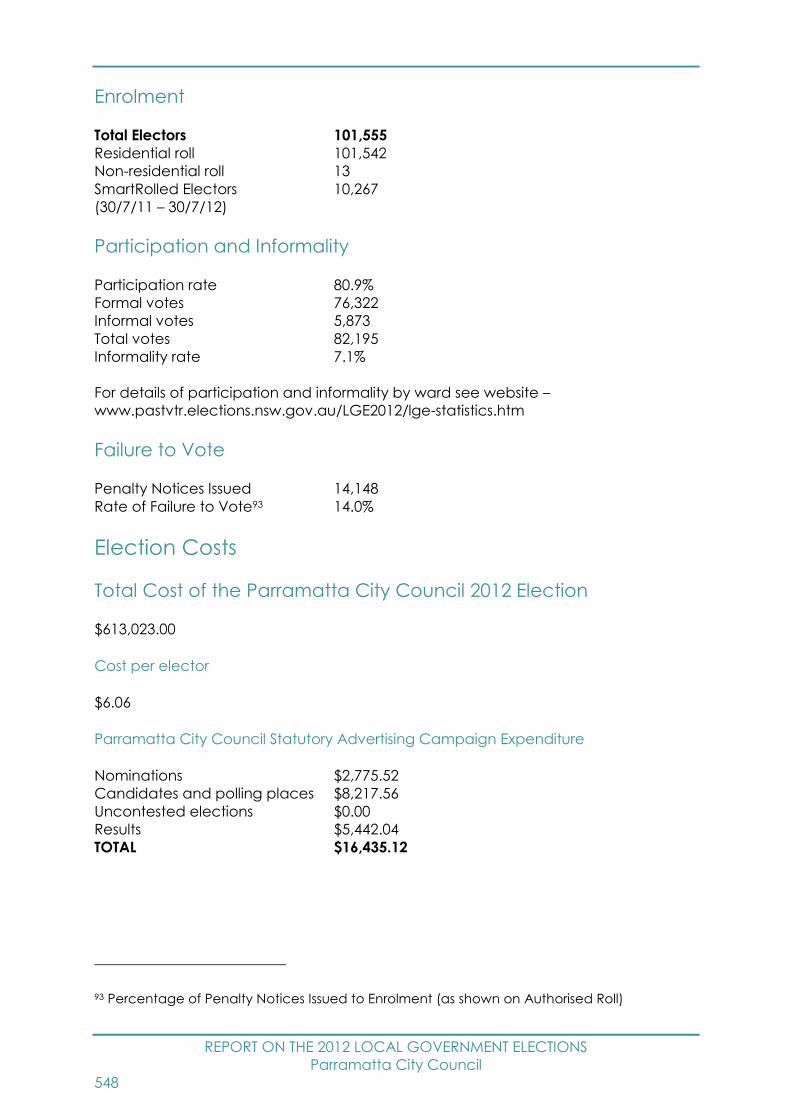
REPORT ON THE 2012 LOCAL GOVERNMENT ELECTIONS
Parramatta City Council
548
Enrolment
Total Electors 101,555
Residential roll 101,542
Non-residential roll 13
SmartRolled Electors 10,267
(30/7/11 – 30/7/12)
Participation and Informality
Participation rate 80.9%
Formal votes 76,322
Informal votes 5,873
Total votes 82,195
Informality rate 7.1%
For details of participation and informality by ward see website –
www.pastvtr.elections.nsw.gov.au/LGE2012/lge-statistics.htm
Failure to Vote
Penalty Notices Issued 14,148
Rate of Failure to Vote93 14.0%
Election Costs
Total Cost of the Parramatta City Council 2012 Election
$613,023.00
Cost per elector
$6.06
Parramatta City Council Statutory Advertising Campaign Expenditure
Nominations $2,775.52
Candidates and polling places $8,217.56
Uncontested elections $0.00
Results $5,442.04
TOTAL $16,435.12
93 Percentage of Penalty Notices Issued to Enrolment (as shown on Authorised Roll)
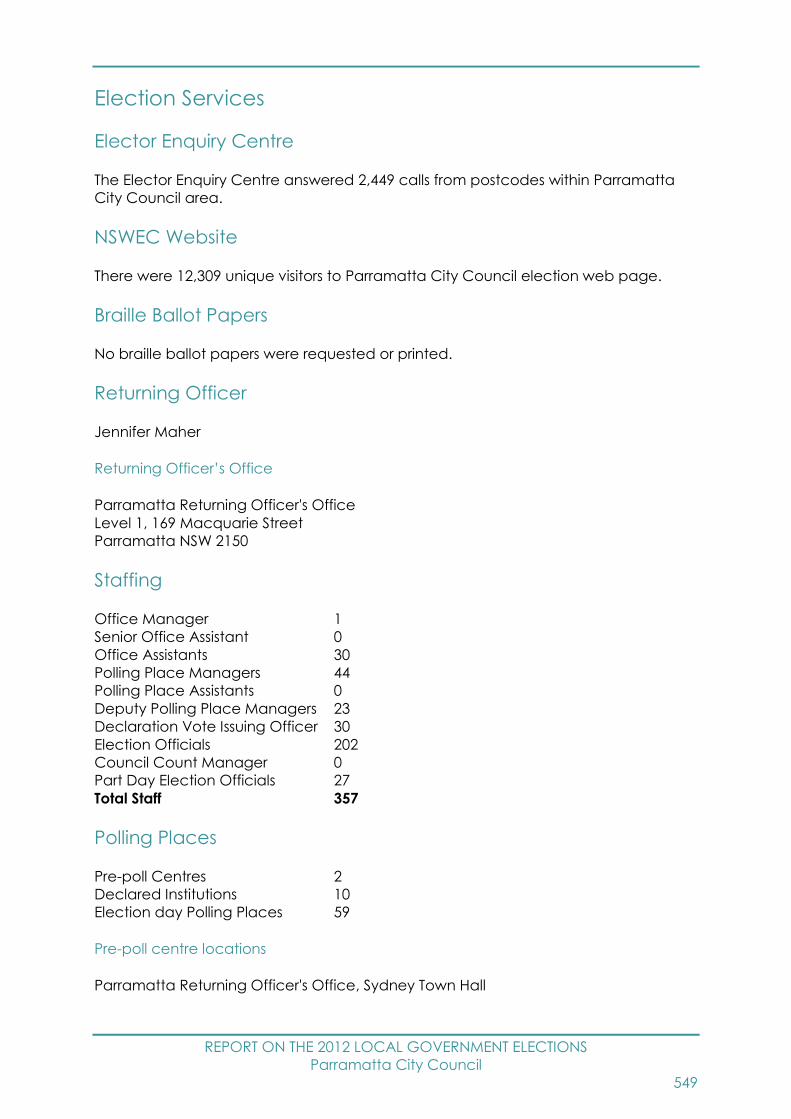
REPORT ON THE 2012 LOCAL GOVERNMENT ELECTIONS
Parramatta City Council
549
Election Services
Elector Enquiry Centre
The Elector Enquiry Centre answered 2,449 calls from postcodes within Parramatta
City Council area.
NSWEC Website
There were 12,309 unique visitors to Parramatta City Council election web page.
Braille Ballot Papers
No braille ballot papers were requested or printed.
Returning Officer
Jennifer Maher
Returning Officer’s Office
Parramatta Returning Officer's Office
Level 1, 169 Macquarie Street
Parramatta NSW 2150
Staffing
Office Manager 1
Senior Office Assistant 0
Office Assistants 30
Polling Place Managers 44
Polling Place Assistants 0
Deputy Polling Place Managers 23
Declaration Vote Issuing Officer 30
Election Officials 202
Council Count Manager 0
Part Day Election Officials 27
Total Staff 357
Polling Places
Pre-poll Centres 2
Declared Institutions 10
Election day Polling Places 59
Pre-poll centre locations
Parramatta Returning Officer's Office, Sydney Town Hall
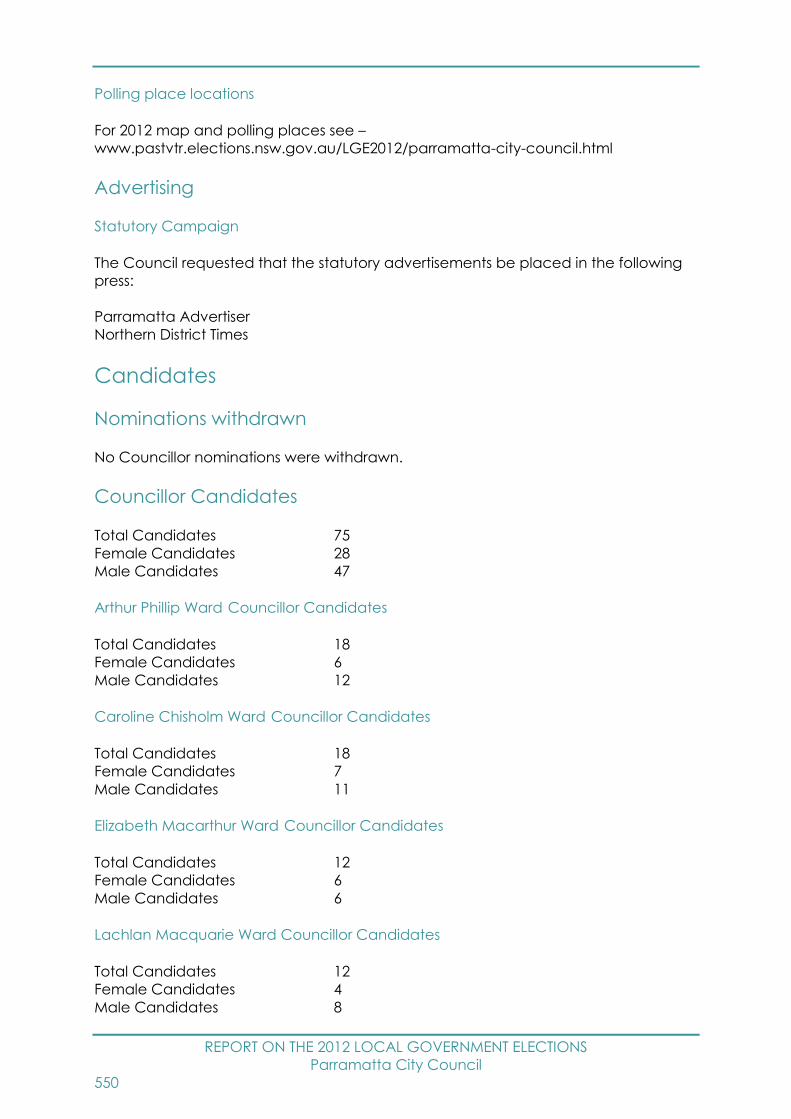
REPORT ON THE 2012 LOCAL GOVERNMENT ELECTIONS
Parramatta City Council
550
Polling place locations
For 2012 map and polling places see –
www.pastvtr.elections.nsw.gov.au/LGE2012/parramatta-city-council.html
Advertising
Statutory Campaign
The Council requested that the statutory advertisements be placed in the following
press:
Parramatta Advertiser
Northern District Times
Candidates
Nominations withdrawn
No Councillor nominations were withdrawn.
Councillor Candidates
Total Candidates 75
Female Candidates 28
Male Candidates 47
Arthur Phillip Ward Councillor Candidates
Total Candidates 18
Female Candidates 6
Male Candidates 12
Caroline Chisholm Ward Councillor Candidates
Total Candidates 18
Female Candidates 7
Male Candidates 11
Elizabeth Macarthur Ward Councillor Candidates
Total Candidates 12
Female Candidates 6
Male Candidates 6
Lachlan Macquarie Ward Councillor Candidates
Total Candidates 12
Female Candidates 4
Male Candidates 8
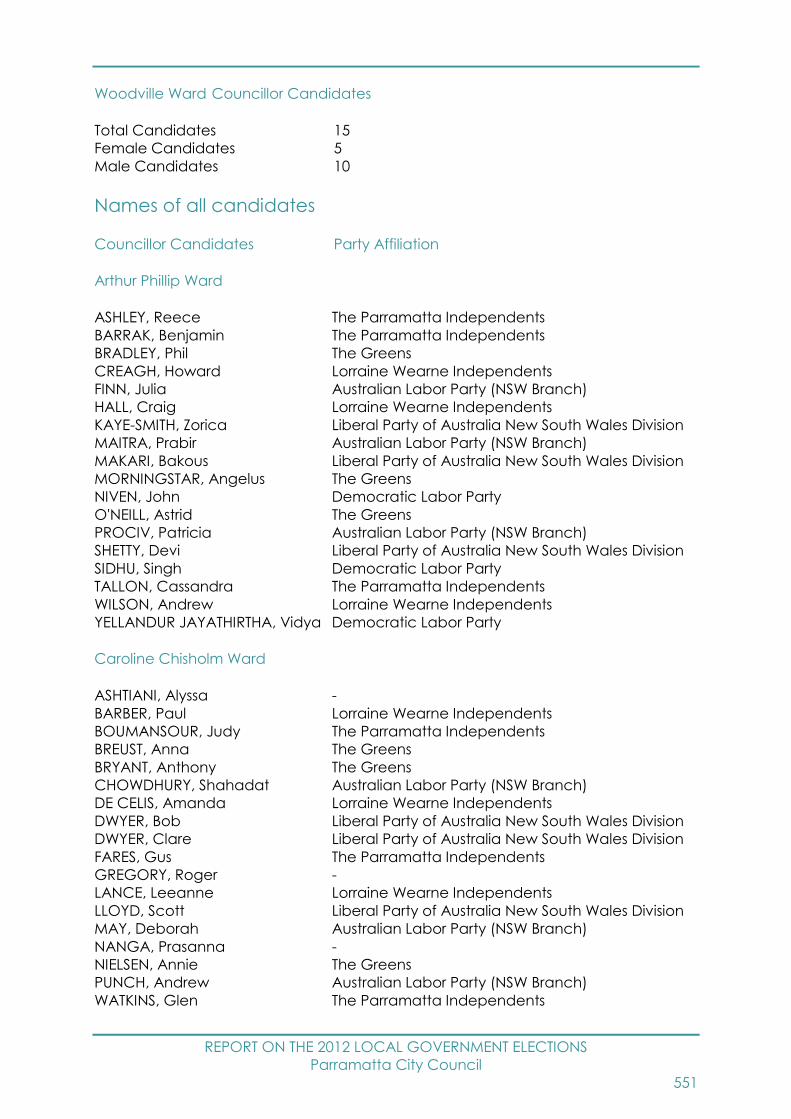
REPORT ON THE 2012 LOCAL GOVERNMENT ELECTIONS
Parramatta City Council
551
Woodville Ward Councillor Candidates
Total Candidates 15
Female Candidates 5
Male Candidates 10
Names of all candidates
Councillor Candidates Party Affiliation
Arthur Phillip Ward
ASHLEY, Reece The Parramatta Independents
BARRAK, Benjamin The Parramatta Independents
BRADLEY, Phil The Greens
CREAGH, Howard Lorraine Wearne Independents
FINN, Julia Australian Labor Party (NSW Branch)
HALL, Craig Lorraine Wearne Independents
KAYE-SMITH, Zorica Liberal Party of Australia New South Wales Division
MAITRA, Prabir Australian Labor Party (NSW Branch)
MAKARI, Bakous Liberal Party of Australia New South Wales Division
MORNINGSTAR, Angelus The Greens
NIVEN, John Democratic Labor Party
O'NEILL, Astrid The Greens
PROCIV, Patricia Australian Labor Party (NSW Branch)
SHETTY, Devi Liberal Party of Australia New South Wales Division
SIDHU, Singh Democratic Labor Party
TALLON, Cassandra The Parramatta Independents
WILSON, Andrew Lorraine Wearne Independents
YELLANDUR JAYATHIRTHA, Vidya Democratic Labor Party
Caroline Chisholm Ward
ASHTIANI, Alyssa -
BARBER, Paul Lorraine Wearne Independents
BOUMANSOUR, Judy The Parramatta Independents
BREUST, Anna The Greens
BRYANT, Anthony The Greens
CHOWDHURY, Shahadat Australian Labor Party (NSW Branch)
DE CELIS, Amanda Lorraine Wearne Independents
DWYER, Bob Liberal Party of Australia New South Wales Division
DWYER, Clare Liberal Party of Australia New South Wales Division
FARES, Gus The Parramatta Independents
GREGORY, Roger -
LANCE, Leeanne Lorraine Wearne Independents
LLOYD, Scott Liberal Party of Australia New South Wales Division
MAY, Deborah Australian Labor Party (NSW Branch)
NANGA, Prasanna -
NIELSEN, Annie The Greens
PUNCH, Andrew Australian Labor Party (NSW Branch)
WATKINS, Glen The Parramatta Independents
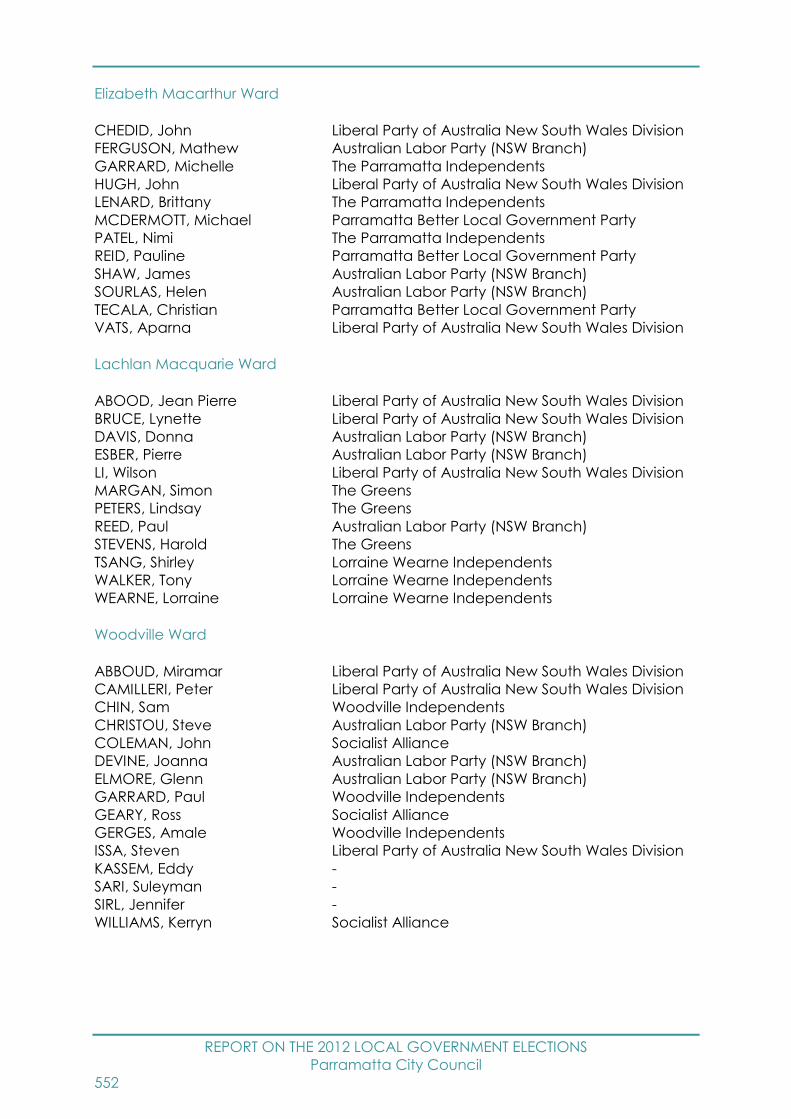
REPORT ON THE 2012 LOCAL GOVERNMENT ELECTIONS
Parramatta City Council
552
Elizabeth Macarthur Ward
CHEDID, John Liberal Party of Australia New South Wales Division
FERGUSON, Mathew Australian Labor Party (NSW Branch)
GARRARD, Michelle The Parramatta Independents
HUGH, John Liberal Party of Australia New South Wales Division
LENARD, Brittany The Parramatta Independents
MCDERMOTT, Michael Parramatta Better Local Government Party
PATEL, Nimi The Parramatta Independents
REID, Pauline Parramatta Better Local Government Party
SHAW, James Australian Labor Party (NSW Branch)
SOURLAS, Helen Australian Labor Party (NSW Branch)
TECALA, Christian Parramatta Better Local Government Party
VATS, Aparna Liberal Party of Australia New South Wales Division
Lachlan Macquarie Ward
ABOOD, Jean Pierre Liberal Party of Australia New South Wales Division
BRUCE, Lynette Liberal Party of Australia New South Wales Division
DAVIS, Donna Australian Labor Party (NSW Branch)
ESBER, Pierre Australian Labor Party (NSW Branch)
LI, Wilson Liberal Party of Australia New South Wales Division
MARGAN, Simon The Greens
PETERS, Lindsay The Greens
REED, Paul Australian Labor Party (NSW Branch)
STEVENS, Harold The Greens
TSANG, Shirley Lorraine Wearne Independents
WALKER, Tony Lorraine Wearne Independents
WEARNE, Lorraine Lorraine Wearne Independents
Woodville Ward
ABBOUD, Miramar Liberal Party of Australia New South Wales Division
CAMILLERI, Peter Liberal Party of Australia New South Wales Division
CHIN, Sam Woodville Independents
CHRISTOU, Steve Australian Labor Party (NSW Branch)
COLEMAN, John Socialist Alliance
DEVINE, Joanna Australian Labor Party (NSW Branch)
ELMORE, Glenn Australian Labor Party (NSW Branch)
GARRARD, Paul Woodville Independents
GEARY, Ross Socialist Alliance
GERGES, Amale Woodville Independents
ISSA, Steven Liberal Party of Australia New South Wales Division
KASSEM, Eddy -
SARI, Suleyman -
SIRL, Jennifer -
WILLIAMS, Kerryn Socialist Alliance
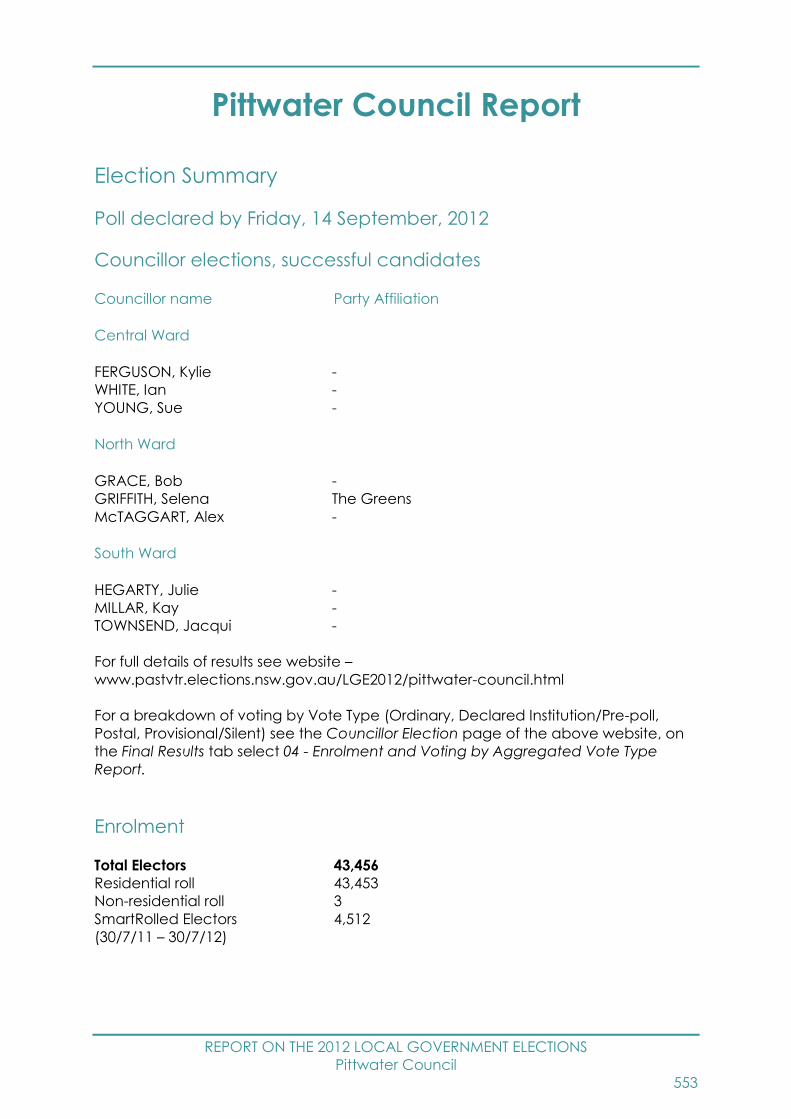
REPORT ON THE 2012 LOCAL GOVERNMENT ELECTIONS
Pittwater Council
553
Pittwater Council Report
Election Summary
Poll declared by Friday, 14 September, 2012
Councillor elections, successful candidates
Councillor name Party Affiliation
Central Ward
FERGUSON, Kylie -
WHITE, Ian -
YOUNG, Sue -
North Ward
GRACE, Bob -
GRIFFITH, Selena The Greens
McTAGGART, Alex -
South Ward
HEGARTY, Julie -
MILLAR, Kay -
TOWNSEND, Jacqui -
For full details of results see website –
www.pastvtr.elections.nsw.gov.au/LGE2012/pittwater-council.html
For a breakdown of voting by Vote Type (Ordinary, Declared Institution/Pre-poll,
Postal, Provisional/Silent) see the Councillor Election page of the above website, on
the Final Results tab select 04 - Enrolment and Voting by Aggregated Vote Type
Report.
Enrolment
Total Electors 43,456
Residential roll 43,453
Non-residential roll 3
SmartRolled Electors 4,512
(30/7/11 – 30/7/12)
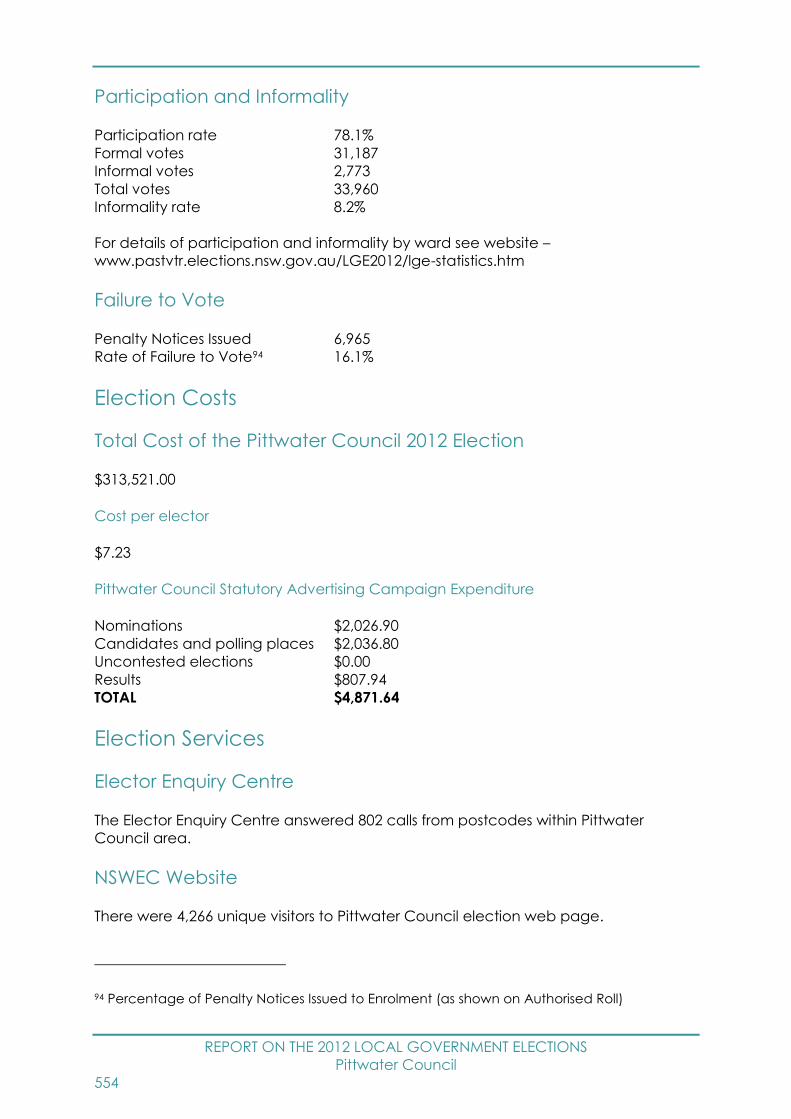
REPORT ON THE 2012 LOCAL GOVERNMENT ELECTIONS
Pittwater Council
554
Participation and Informality
Participation rate 78.1%
Formal votes 31,187
Informal votes 2,773
Total votes 33,960
Informality rate 8.2%
For details of participation and informality by ward see website –
www.pastvtr.elections.nsw.gov.au/LGE2012/lge-statistics.htm
Failure to Vote
Penalty Notices Issued 6,965
Rate of Failure to Vote94 16.1%
Election Costs
Total Cost of the Pittwater Council 2012 Election
$313,521.00
Cost per elector
$7.23
Pittwater Council Statutory Advertising Campaign Expenditure
Nominations $2,026.90
Candidates and polling places $2,036.80
Uncontested elections $0.00
Results $807.94
TOTAL $4,871.64
Election Services
Elector Enquiry Centre
The Elector Enquiry Centre answered 802 calls from postcodes within Pittwater
Council area.
NSWEC Website
There were 4,266 unique visitors to Pittwater Council election web page.
94 Percentage of Penalty Notices Issued to Enrolment (as shown on Authorised Roll)

REPORT ON THE 2012 LOCAL GOVERNMENT ELECTIONS
Pittwater Council
555
Braille Ballot Papers
No braille ballot papers were requested or printed.
Returning Officer
Christopher McGuckin
Returning Officer’s Office
Pittwater Returning Officer's Office
341 Barrenjoey Road
Newport NSW 2106
Staffing
Office Manager 1
Senior Office Assistant 0
Office Assistants 12
Polling Place Managers 15
Polling Place Assistants 0
Deputy Polling Place Managers 9
Declaration Vote Issuing Officer 10
Election Officials 72
Council Count Manager 0
Part Day Election Officials 11
Total Staff 130
Polling Places
Pre-poll Centres 2
Declared Institutions 2
Election day Polling Places 23
Pre-poll centre locations
Pittwater Returning Officer's Office, Sydney Town Hall
Polling place locations
For 2012 map and polling places see –
www.pastvtr.elections.nsw.gov.au/LGE2012/pittwater-council.html
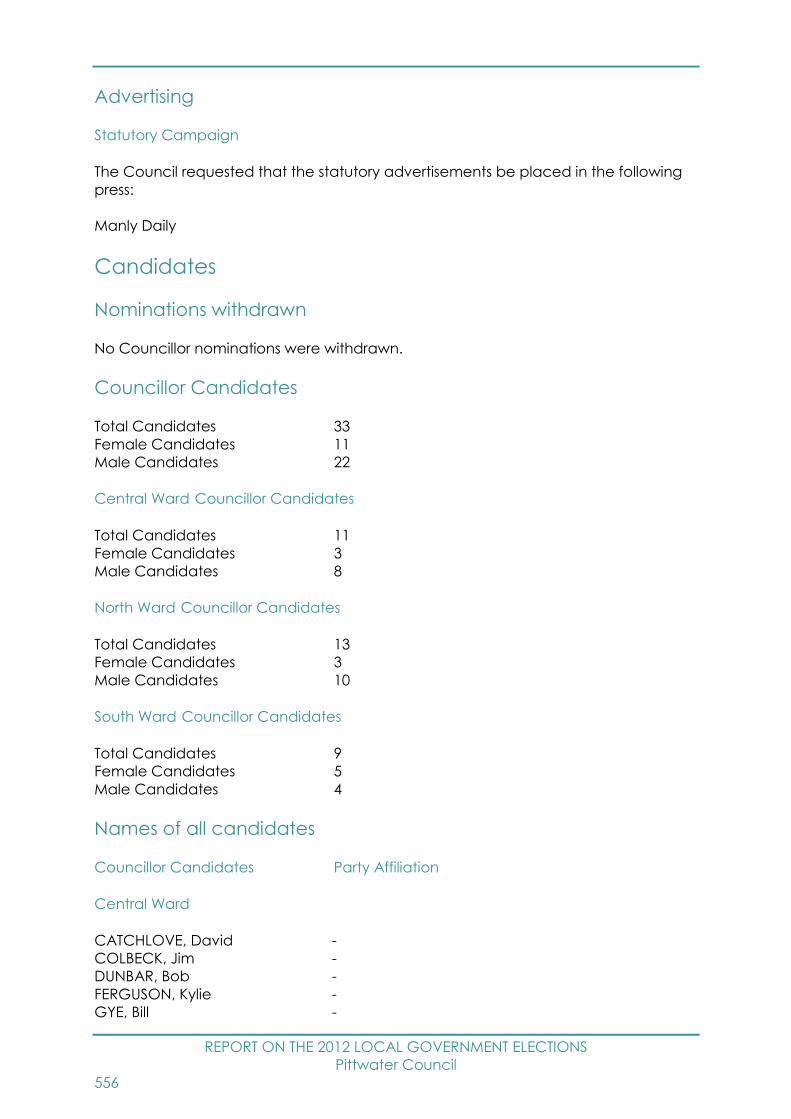
REPORT ON THE 2012 LOCAL GOVERNMENT ELECTIONS
Pittwater Council
556
Advertising
Statutory Campaign
The Council requested that the statutory advertisements be placed in the following
press:
Manly Daily
Candidates
Nominations withdrawn
No Councillor nominations were withdrawn.
Councillor Candidates
Total Candidates 33
Female Candidates 11
Male Candidates 22
Central Ward Councillor Candidates
Total Candidates 11
Female Candidates 3
Male Candidates 8
North Ward Councillor Candidates
Total Candidates 13
Female Candidates 3
Male Candidates 10
South Ward Councillor Candidates
Total Candidates 9
Female Candidates 5
Male Candidates 4
Names of all candidates
Councillor Candidates Party Affiliation
Central Ward
CATCHLOVE, David -
COLBECK, Jim -
DUNBAR, Bob -
FERGUSON, Kylie -
GYE, Bill -
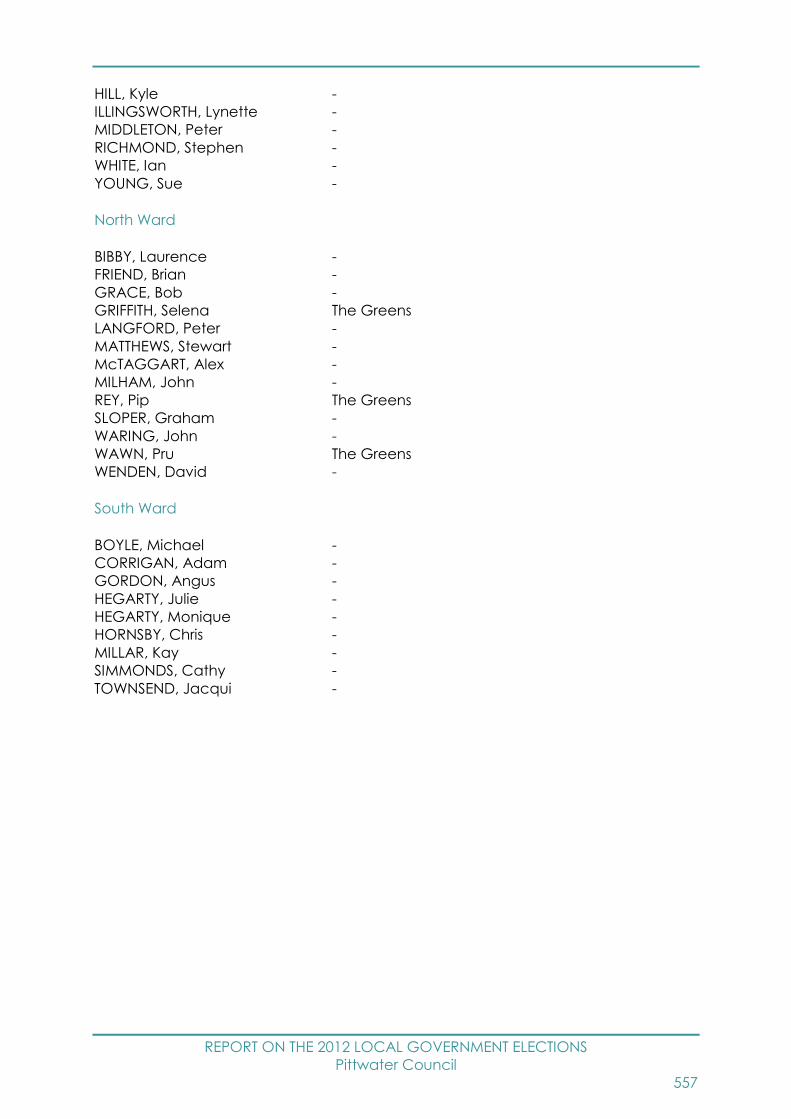
REPORT ON THE 2012 LOCAL GOVERNMENT ELECTIONS
Pittwater Council
557
HILL, Kyle -
ILLINGSWORTH, Lynette -
MIDDLETON, Peter -
RICHMOND, Stephen -
WHITE, Ian -
YOUNG, Sue -
North Ward
BIBBY, Laurence -
FRIEND, Brian -
GRACE, Bob -
GRIFFITH, Selena The Greens
LANGFORD, Peter -
MATTHEWS, Stewart -
McTAGGART, Alex -
MILHAM, John -
REY, Pip The Greens
SLOPER, Graham -
WARING, John -
WAWN, Pru The Greens
WENDEN, David -
South Ward
BOYLE, Michael -
CORRIGAN, Adam -
GORDON, Angus -
HEGARTY, Julie -
HEGARTY, Monique -
HORNSBY, Chris -
MILLAR, Kay -
SIMMONDS, Cathy -
TOWNSEND, Jacqui -
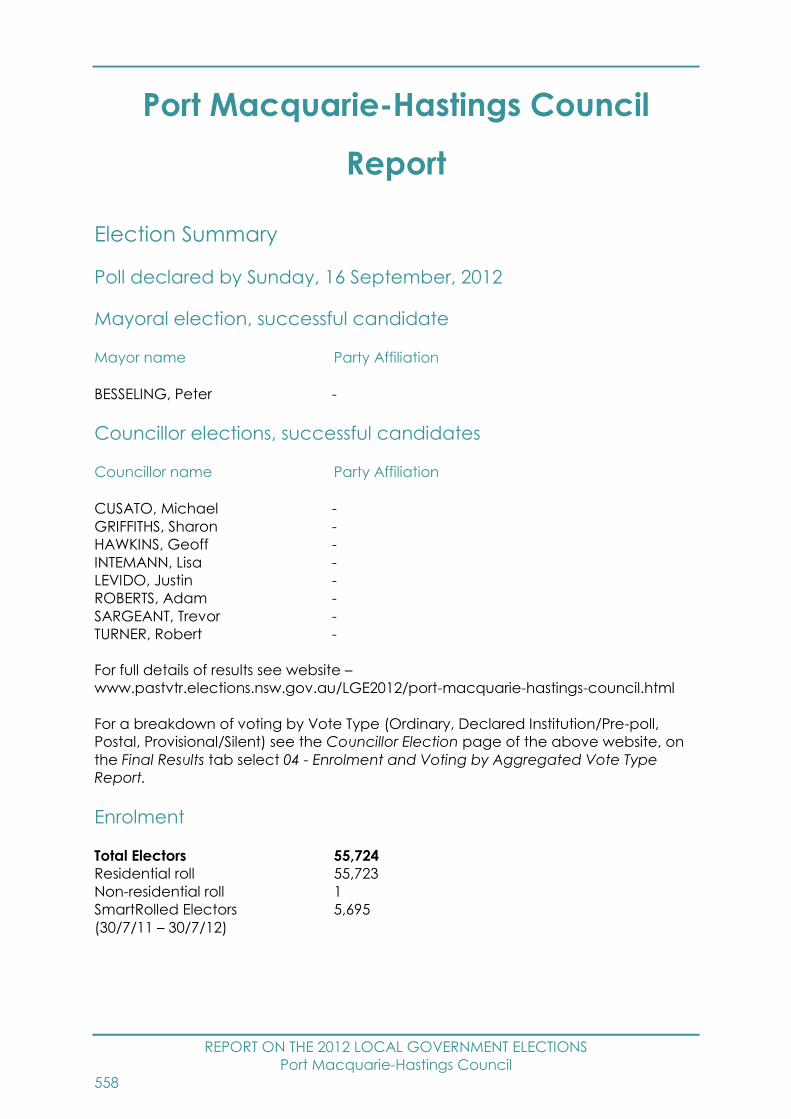
REPORT ON THE 2012 LOCAL GOVERNMENT ELECTIONS
Port Macquarie-Hastings Council
558
Port Macquarie-Hastings Council
Report
Election Summary
Poll declared by Sunday, 16 September, 2012
Mayoral election, successful candidate
Mayor name Party Affiliation
BESSELING, Peter -
Councillor elections, successful candidates
Councillor name Party Affiliation
CUSATO, Michael -
GRIFFITHS, Sharon -
HAWKINS, Geoff -
INTEMANN, Lisa -
LEVIDO, Justin -
ROBERTS, Adam -
SARGEANT, Trevor -
TURNER, Robert -
For full details of results see website –
www.pastvtr.elections.nsw.gov.au/LGE2012/port-macquarie-hastings-council.html
For a breakdown of voting by Vote Type (Ordinary, Declared Institution/Pre-poll,
Postal, Provisional/Silent) see the Councillor Election page of the above website, on
the Final Results tab select 04 - Enrolment and Voting by Aggregated Vote Type
Report.
Enrolment
Total Electors 55,724
Residential roll 55,723
Non-residential roll 1
SmartRolled Electors 5,695
(30/7/11 – 30/7/12)

REPORT ON THE 2012 LOCAL GOVERNMENT ELECTIONS
Port Macquarie-Hastings Council
559
Participation and Informality
Participation rate 85.1%
Formal votes 43,137
Informal votes 4,281
Total votes 47,418
Informality rate 9.0%
Failure to Vote
Penalty Notices Issued 5,798
Rate of Failure to Vote95 10.4%
Election Costs
Total Cost of the Port Macquarie-Hastings Council 2012 Election
$369,669.00
Cost per elector
$6.65
Port Macquarie-Hastings Council Statutory Advertising Campaign Expenditure
Nominations $2,898.28
Candidates and polling places $5,506.16
Uncontested elections $0.00
Results $621.06
TOTAL $9,025.50
Election Services
Elector Enquiry Centre
The Elector Enquiry Centre answered 839 calls from postcodes within Port Macquarie-
Hastings Council area.
NSWEC Website
There were 4,692 unique visitors to Port Macquarie-Hastings Council election web
page.
95 Percentage of Penalty Notices Issued to Enrolment (as shown on Authorised Roll)
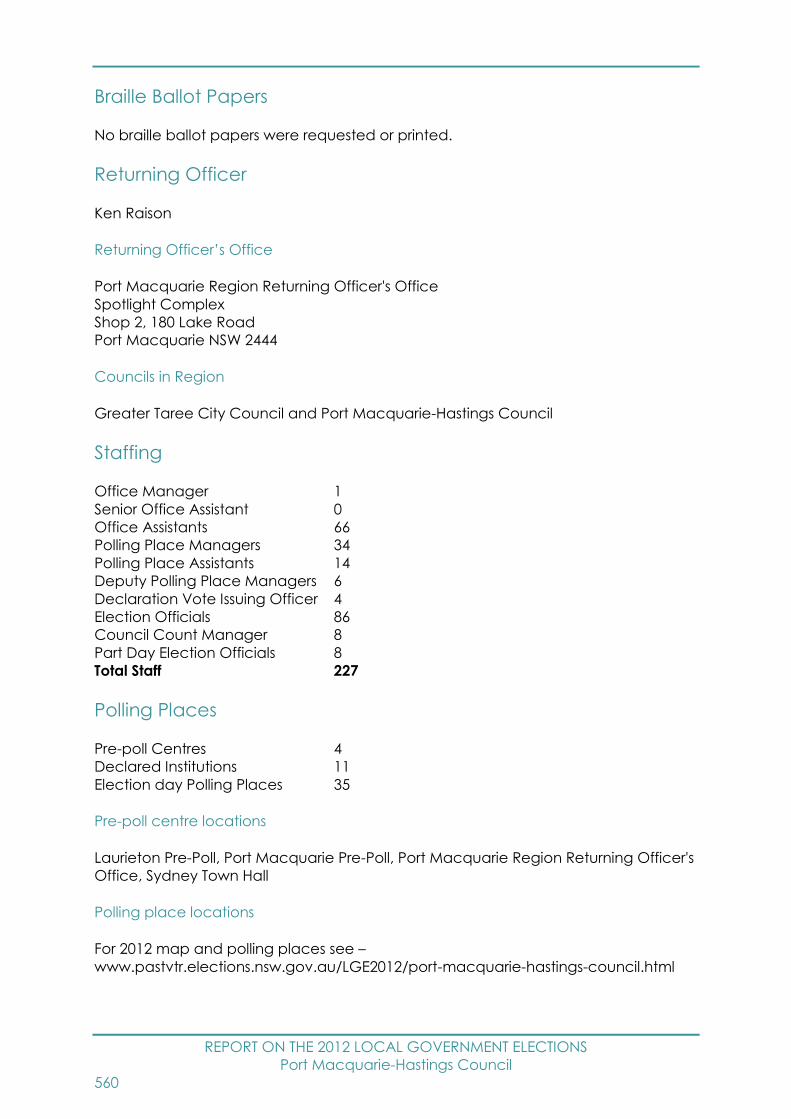
REPORT ON THE 2012 LOCAL GOVERNMENT ELECTIONS
Port Macquarie-Hastings Council
560
Braille Ballot Papers
No braille ballot papers were requested or printed.
Returning Officer
Ken Raison
Returning Officer’s Office
Port Macquarie Region Returning Officer's Office
Spotlight Complex
Shop 2, 180 Lake Road
Port Macquarie NSW 2444
Councils in Region
Greater Taree City Council and Port Macquarie-Hastings Council
Staffing
Office Manager 1
Senior Office Assistant 0
Office Assistants 66
Polling Place Managers 34
Polling Place Assistants 14
Deputy Polling Place Managers 6
Declaration Vote Issuing Officer 4
Election Officials 86
Council Count Manager 8
Part Day Election Officials 8
Total Staff 227
Polling Places
Pre-poll Centres 4
Declared Institutions 11
Election day Polling Places 35
Pre-poll centre locations
Laurieton Pre-Poll, Port Macquarie Pre-Poll, Port Macquarie Region Returning Officer's
Office, Sydney Town Hall
Polling place locations
For 2012 map and polling places see –
www.pastvtr.elections.nsw.gov.au/LGE2012/port-macquarie-hastings-council.html
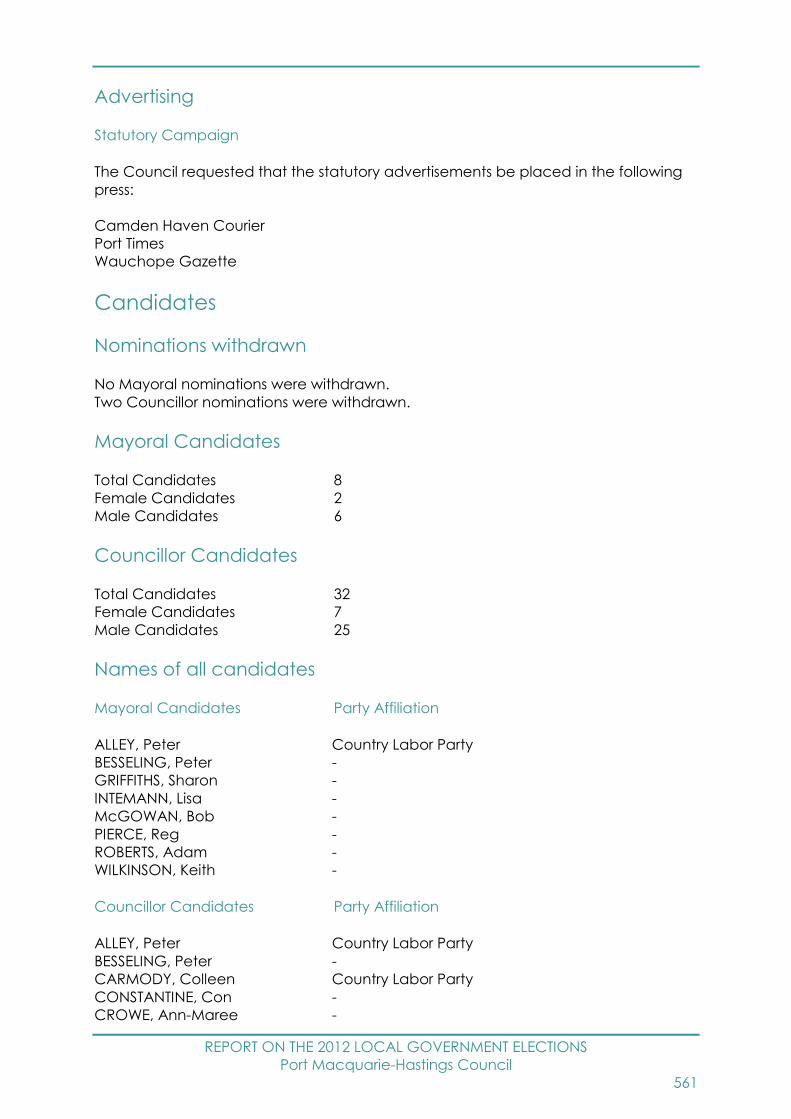
REPORT ON THE 2012 LOCAL GOVERNMENT ELECTIONS
Port Macquarie-Hastings Council
561
Advertising
Statutory Campaign
The Council requested that the statutory advertisements be placed in the following
press:
Camden Haven Courier
Port Times
Wauchope Gazette
Candidates
Nominations withdrawn
No Mayoral nominations were withdrawn.
Two Councillor nominations were withdrawn.
Mayoral Candidates
Total Candidates 8
Female Candidates 2
Male Candidates 6
Councillor Candidates
Total Candidates 32
Female Candidates 7
Male Candidates 25
Names of all candidates
Mayoral Candidates Party Affiliation
ALLEY, Peter Country Labor Party
BESSELING, Peter -
GRIFFITHS, Sharon -
INTEMANN, Lisa -
McGOWAN, Bob -
PIERCE, Reg -
ROBERTS, Adam -
WILKINSON, Keith -
Councillor Candidates Party Affiliation
ALLEY, Peter Country Labor Party
BESSELING, Peter -
CARMODY, Colleen Country Labor Party
CONSTANTINE, Con -
CROWE, Ann-Maree -
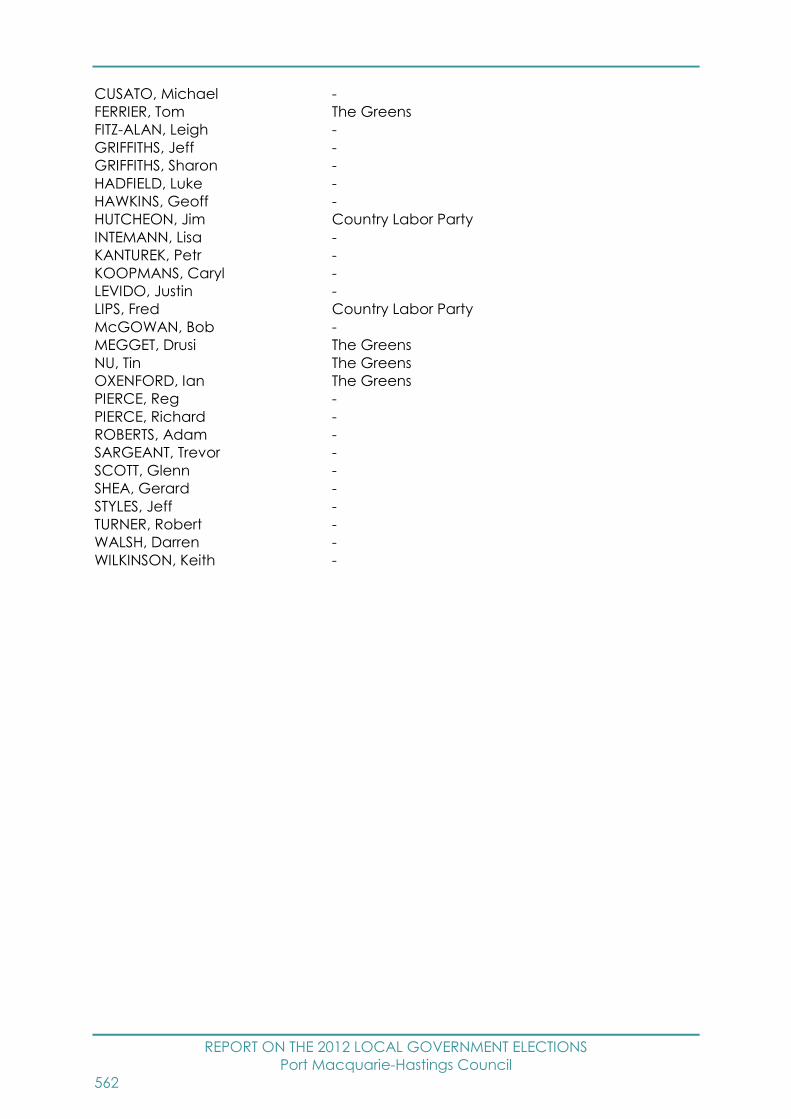
REPORT ON THE 2012 LOCAL GOVERNMENT ELECTIONS
Port Macquarie-Hastings Council
562
CUSATO, Michael -
FERRIER, Tom The Greens
FITZ-ALAN, Leigh -
GRIFFITHS, Jeff -
GRIFFITHS, Sharon -
HADFIELD, Luke -
HAWKINS, Geoff -
HUTCHEON, Jim Country Labor Party
INTEMANN, Lisa -
KANTUREK, Petr -
KOOPMANS, Caryl -
LEVIDO, Justin -
LIPS, Fred Country Labor Party
McGOWAN, Bob -
MEGGET, Drusi The Greens
NU, Tin The Greens
OXENFORD, Ian The Greens
PIERCE, Reg -
PIERCE, Richard -
ROBERTS, Adam -
SARGEANT, Trevor -
SCOTT, Glenn -
SHEA, Gerard -
STYLES, Jeff -
TURNER, Robert -
WALSH, Darren -
WILKINSON, Keith -

REPORT ON THE 2012 LOCAL GOVERNMENT ELECTIONS
Queanbeyan City Council
563
Queanbeyan City Council Report
Election Summary
Poll declared by Friday, 14 September, 2012
Mayoral election, successful candidate
Mayor name Party Affiliation
OVERALL, Tim -
Councillor elections, successful candidates
Councillor name Party Affiliation
BRAY, Peter -
BROWN, Brian Australian Labor Party (NSW Branch)
BURFOOT, Judith Australian Labor Party (NSW Branch)
CREGAN, Jamie -
McLENNAN, Toni -
TAYLOR, Trudy -
TRAJANOSKI, Velice -
WHELAN, Sue -
WINCHESTER, Kenrick -
For full details of results see website –
www.pastvtr.elections.nsw.gov.au/LGE2012/queanbeyan-city-council.html
For a breakdown of voting by Vote Type (Ordinary, Declared Institution/Pre-poll,
Postal, Provisional/Silent) see the Councillor Election page of the above website, on
the Final Results tab select 04 - Enrolment and Voting by Aggregated Vote Type
Report.
Enrolment
Total Electors 26,617
Residential roll 26,610
Non-residential roll 7
SmartRolled Electors 1,892
(30/7/11 – 30/7/12)
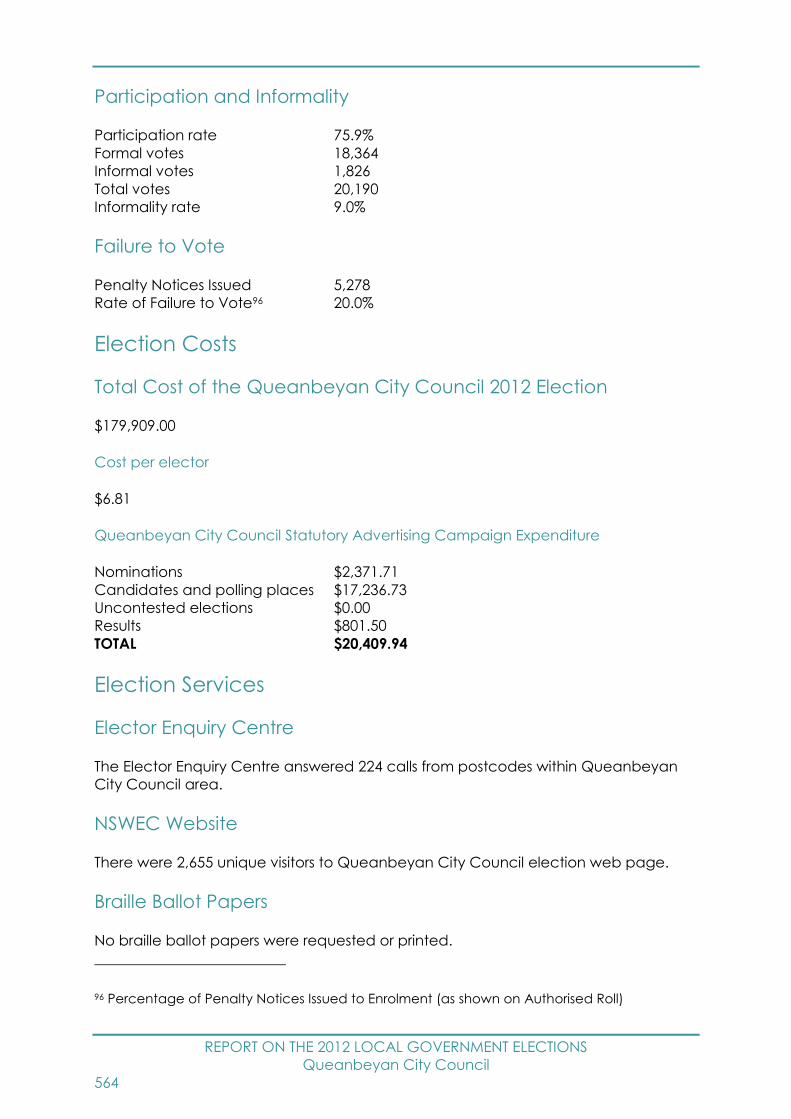
REPORT ON THE 2012 LOCAL GOVERNMENT ELECTIONS
Queanbeyan City Council
564
Participation and Informality
Participation rate 75.9%
Formal votes 18,364
Informal votes 1,826
Total votes 20,190
Informality rate 9.0%
Failure to Vote
Penalty Notices Issued 5,278
Rate of Failure to Vote96 20.0%
Election Costs
Total Cost of the Queanbeyan City Council 2012 Election
$179,909.00
Cost per elector
$6.81
Queanbeyan City Council Statutory Advertising Campaign Expenditure
Nominations $2,371.71
Candidates and polling places $17,236.73
Uncontested elections $0.00
Results $801.50
TOTAL $20,409.94
Election Services
Elector Enquiry Centre
The Elector Enquiry Centre answered 224 calls from postcodes within Queanbeyan
City Council area.
NSWEC Website
There were 2,655 unique visitors to Queanbeyan City Council election web page.
Braille Ballot Papers
No braille ballot papers were requested or printed.
96 Percentage of Penalty Notices Issued to Enrolment (as shown on Authorised Roll)

REPORT ON THE 2012 LOCAL GOVERNMENT ELECTIONS
Queanbeyan City Council
565
Returning Officer
Linda Strika
Returning Officer’s Office
Queanbeyan Region Returning Officer's Office
256 Crawford Street
Queanbeyan NSW 2620
Councils in Region
Palerang Council and Queanbeyan City Council
Staffing
Office Manager 1
Senior Office Assistant 0
Office Assistants 31
Polling Place Managers 9
Polling Place Assistants 2
Deputy Polling Place Managers 4
Declaration Vote Issuing Officer 6
Election Officials 38
Council Count Manager 3
Part Day Election Officials 8
Total Staff 102
Polling Places
Pre-poll Centres 2
Declared Institutions 3
Election day Polling Places 10
Pre-poll centre locations
Queanbeyan Region Returning Officer's Office, Sydney Town Hall
Polling place locations
For 2012 map and polling places see –
www.pastvtr.elections.nsw.gov.au/LGE2012/queanbeyan-city-council.html

REPORT ON THE 2012 LOCAL GOVERNMENT ELECTIONS
Queanbeyan City Council
566
Advertising
Statutory Campaign
The Council requested that the statutory advertisements be placed in the following
press:
Queanbeyan Chronicle
Queanbeyan Age
Canberra Times
Candidates
Nominations withdrawn
No Mayoral nominations were withdrawn.
No Councillor nominations were withdrawn.
Mayoral Candidates
Total Candidates 5
Female Candidates 2
Male Candidates 3
Councillor Candidates
Total Candidates 36
Female Candidates 12
Male Candidates 24
Names of all candidates
Mayoral Candidates Party Affiliation
BROWN, Brian Australian Labor Party (NSW Branch)
CREGAN, Jamie -
OVERALL, Tim -
ROCCA, Ann -
WHELAN, Sue -
Councillor Candidates Party Affiliation
BAGLEY, Michael -
BARTLETT, Steve -
BISCOTTI, Michael -
BOLAND, Meg The Greens
BRAY, Peter -
BROWN, Brian Australian Labor Party (NSW Branch)
BUCKMAN, Gregory The Greens
BURFOOT, Judith Australian Labor Party (NSW Branch)

REPORT ON THE 2012 LOCAL GOVERNMENT ELECTIONS
Queanbeyan City Council
567
CAWSE, Kane -
CREGAN, Jamie -
CURREN, Steve Australian Labor Party (NSW Branch)
DAVANZO, Mauro -
DUGGAN, Ben Australian Labor Party (NSW Branch)
HUNTER, Brent -
KAWALEVA, Keni -
McLENNAN, Toni -
NEWMAN, Chris -
OVERALL, Tim -
PARKER, Liz -
PETKOVSKI, Steven -
PHILPOTT, Richard The Greens
PIPER, Margaret The Greens
SADA, Benjamin -
SPEARS, Rena -
STONHAM, Philip -
TAYLOR, Trudy -
THOMPSON, Neil -
TRAJANOSKI, Velice -
TUTTY, Lyndell Australian Labor Party (NSW Branch)
WALTER, Anne Australian Labor Party (NSW Branch)
WALTMANN, Harry -
WEBB, Jason -
WHELAN, Sue -
WILLIS, Katrina The Greens
WINCHESTER, Briony -
WINCHESTER, Kenrick -
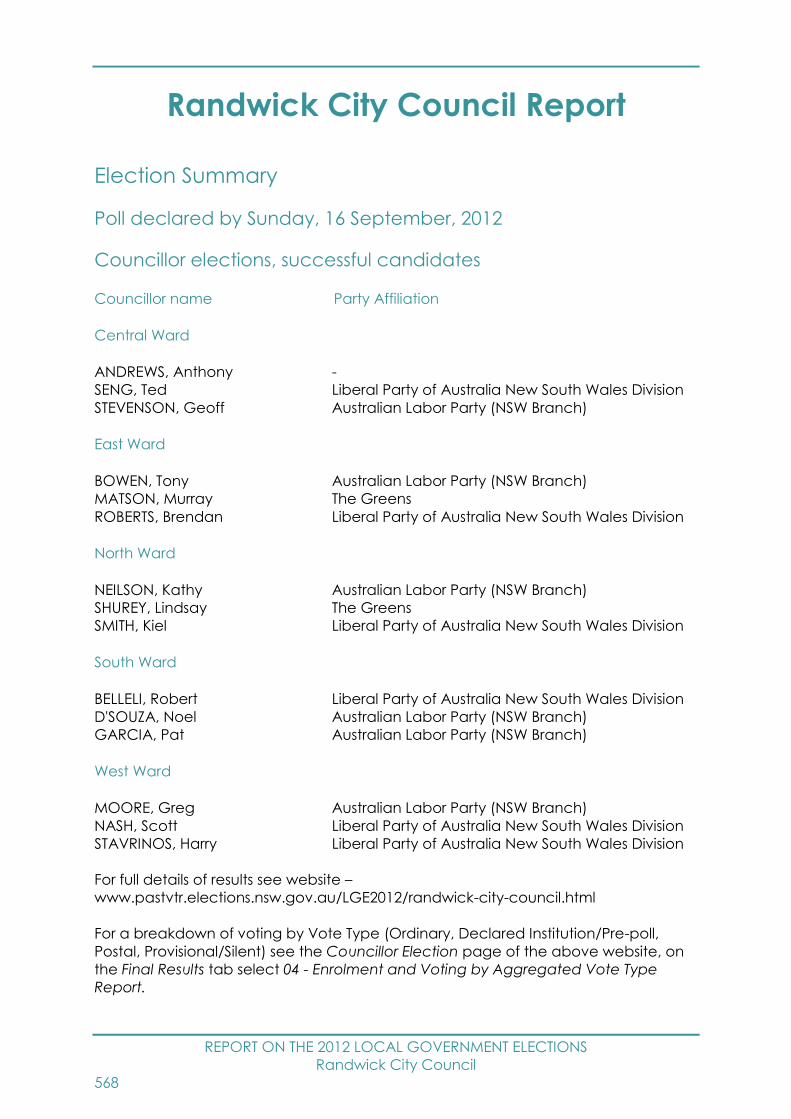
REPORT ON THE 2012 LOCAL GOVERNMENT ELECTIONS
Randwick City Council
568
Randwick City Council Report
Election Summary
Poll declared by Sunday, 16 September, 2012
Councillor elections, successful candidates
Councillor name Party Affiliation
Central Ward
ANDREWS, Anthony -
SENG, Ted Liberal Party of Australia New South Wales Division
STEVENSON, Geoff Australian Labor Party (NSW Branch)
East Ward
BOWEN, Tony Australian Labor Party (NSW Branch)
MATSON, Murray The Greens
ROBERTS, Brendan Liberal Party of Australia New South Wales Division
North Ward
NEILSON, Kathy Australian Labor Party (NSW Branch)
SHUREY, Lindsay The Greens
SMITH, Kiel Liberal Party of Australia New South Wales Division
South Ward
BELLELI, Robert Liberal Party of Australia New South Wales Division
D'SOUZA, Noel Australian Labor Party (NSW Branch)
GARCIA, Pat Australian Labor Party (NSW Branch)
West Ward
MOORE, Greg Australian Labor Party (NSW Branch)
NASH, Scott Liberal Party of Australia New South Wales Division
STAVRINOS, Harry Liberal Party of Australia New South Wales Division
For full details of results see website –
www.pastvtr.elections.nsw.gov.au/LGE2012/randwick-city-council.html
For a breakdown of voting by Vote Type (Ordinary, Declared Institution/Pre-poll,
Postal, Provisional/Silent) see the Councillor Election page of the above website, on
the Final Results tab select 04 - Enrolment and Voting by Aggregated Vote Type
Report.
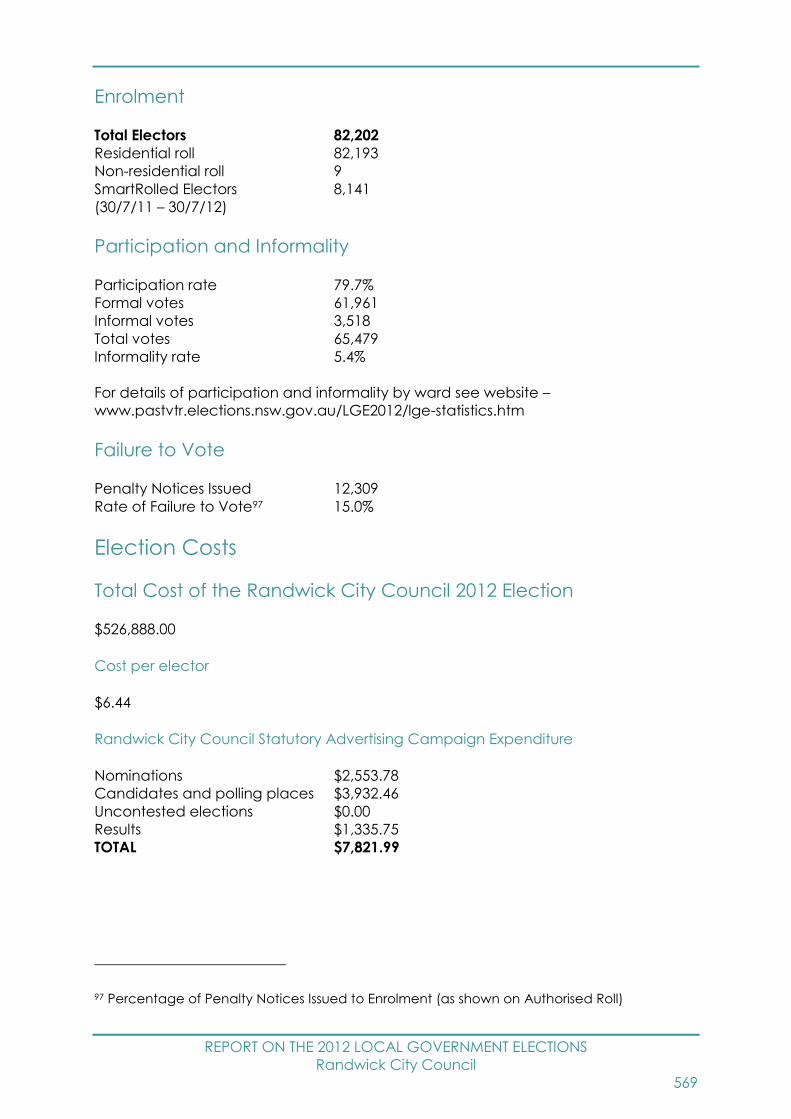
REPORT ON THE 2012 LOCAL GOVERNMENT ELECTIONS
Randwick City Council
569
Enrolment
Total Electors 82,202
Residential roll 82,193
Non-residential roll 9
SmartRolled Electors 8,141
(30/7/11 – 30/7/12)
Participation and Informality
Participation rate 79.7%
Formal votes 61,961
Informal votes 3,518
Total votes 65,479
Informality rate 5.4%
For details of participation and informality by ward see website –
www.pastvtr.elections.nsw.gov.au/LGE2012/lge-statistics.htm
Failure to Vote
Penalty Notices Issued 12,309
Rate of Failure to Vote97 15.0%
Election Costs
Total Cost of the Randwick City Council 2012 Election
$526,888.00
Cost per elector
$6.44
Randwick City Council Statutory Advertising Campaign Expenditure
Nominations $2,553.78
Candidates and polling places $3,932.46
Uncontested elections $0.00
Results $1,335.75
TOTAL $7,821.99
97 Percentage of Penalty Notices Issued to Enrolment (as shown on Authorised Roll)

REPORT ON THE 2012 LOCAL GOVERNMENT ELECTIONS
Randwick City Council
570
Election Services
Elector Enquiry Centre
The Elector Enquiry Centre answered 1,740 calls from postcodes within Randwick City
Council area.
NSWEC Website
There were 10,012 unique visitors to Randwick City Council election web page.
Braille Ballot Papers
No braille ballot papers were requested or printed.
Returning Officer
John Powell
Returning Officer’s Office
Randwick Returning Officer's Office
Randwick Town Hall
30 Frances Street
Randwick NSW 2031
Staffing
Office Manager 1
Senior Office Assistant 0
Office Assistants 29
Polling Place Managers 30
Polling Place Assistants 0
Deputy Polling Place Managers 18
Declaration Vote Issuing Officer 21
Election Officials 132
Council Count Manager 0
Part Day Election Officials 13
Total Staff 244
Polling Places
Pre-poll Centres 2
Declared Institutions 9
Election day Polling Places 48
Pre-poll centre locations
Randwick Returning Officer's Office, Sydney Town Hall

REPORT ON THE 2012 LOCAL GOVERNMENT ELECTIONS
Randwick City Council
571
Polling place locations
For 2012 map and polling places see –
www.pastvtr.elections.nsw.gov.au/LGE2012/randwick-city-council.html
Advertising
Statutory Campaign
The Council requested that the statutory advertisements be placed in the following
press:
Southern Courier
Candidates
Nominations withdrawn
No Councillor nominations were withdrawn.
Councillor Candidates
Total Candidates 74
Female Candidates 22
Male Candidates 52
Central Ward Councillor Candidates
Total Candidates 12
Female Candidates 4
Male Candidates 8
East Ward Councillor Candidates
Total Candidates 16
Female Candidates 6
Male Candidates 10
North Ward Councillor Candidates
Total Candidates 16
Female Candidates 6
Male Candidates 10
South Ward Councillor Candidates
Total Candidates 12
Female Candidates 2
Male Candidates 10
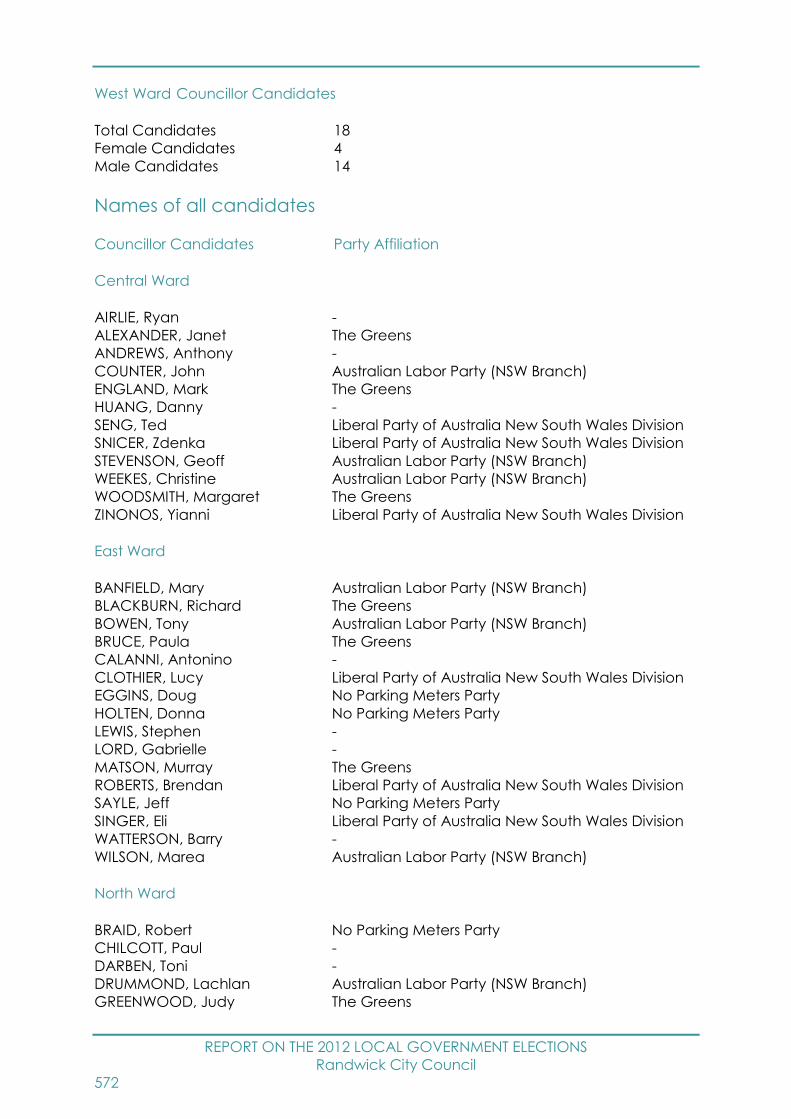
REPORT ON THE 2012 LOCAL GOVERNMENT ELECTIONS
Randwick City Council
572
West Ward Councillor Candidates
Total Candidates 18
Female Candidates 4
Male Candidates 14
Names of all candidates
Councillor Candidates Party Affiliation
Central Ward
AIRLIE, Ryan -
ALEXANDER, Janet The Greens
ANDREWS, Anthony -
COUNTER, John Australian Labor Party (NSW Branch)
ENGLAND, Mark The Greens
HUANG, Danny -
SENG, Ted Liberal Party of Australia New South Wales Division
SNICER, Zdenka Liberal Party of Australia New South Wales Division
STEVENSON, Geoff Australian Labor Party (NSW Branch)
WEEKES, Christine Australian Labor Party (NSW Branch)
WOODSMITH, Margaret The Greens
ZINONOS, Yianni Liberal Party of Australia New South Wales Division
East Ward
BANFIELD, Mary Australian Labor Party (NSW Branch)
BLACKBURN, Richard The Greens
BOWEN, Tony Australian Labor Party (NSW Branch)
BRUCE, Paula The Greens
CALANNI, Antonino -
CLOTHIER, Lucy Liberal Party of Australia New South Wales Division
EGGINS, Doug No Parking Meters Party
HOLTEN, Donna No Parking Meters Party
LEWIS, Stephen -
LORD, Gabrielle -
MATSON, Murray The Greens
ROBERTS, Brendan Liberal Party of Australia New South Wales Division
SAYLE, Jeff No Parking Meters Party
SINGER, Eli Liberal Party of Australia New South Wales Division
WATTERSON, Barry -
WILSON, Marea Australian Labor Party (NSW Branch)
North Ward
BRAID, Robert No Parking Meters Party
CHILCOTT, Paul -
DARBEN, Toni -
DRUMMOND, Lachlan Australian Labor Party (NSW Branch)
GREENWOOD, Judy The Greens
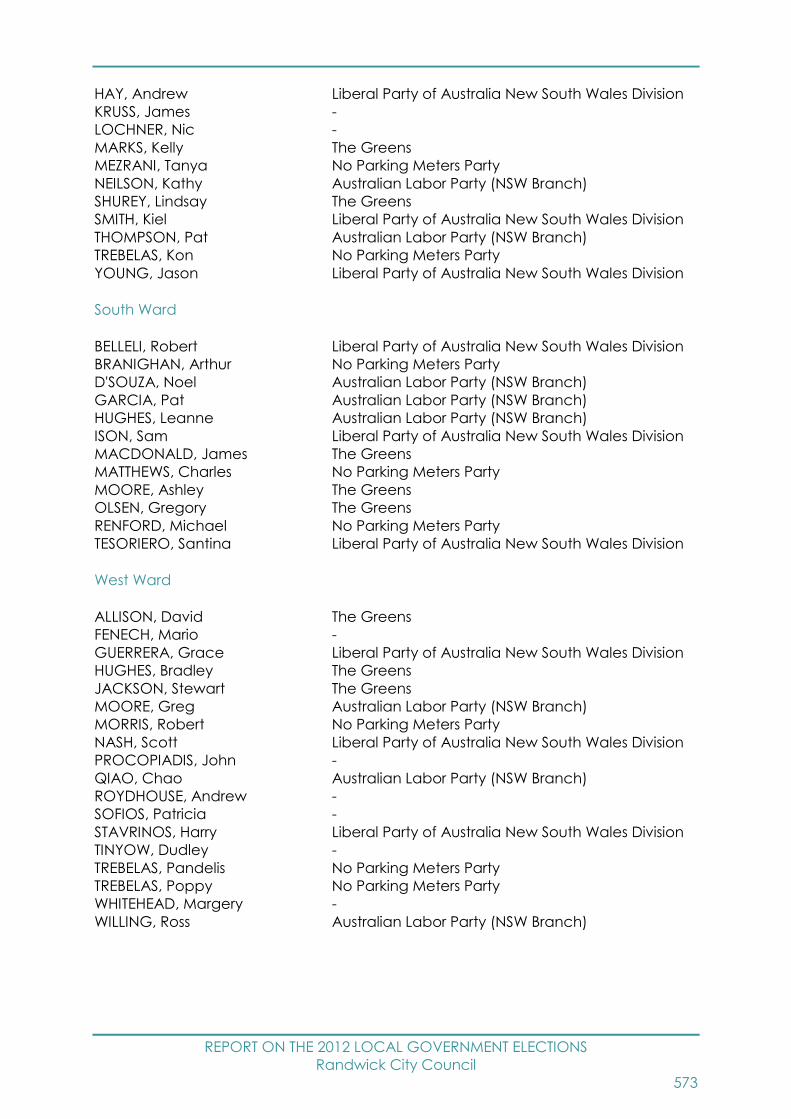
REPORT ON THE 2012 LOCAL GOVERNMENT ELECTIONS
Randwick City Council
573
HAY, Andrew Liberal Party of Australia New South Wales Division
KRUSS, James -
LOCHNER, Nic -
MARKS, Kelly The Greens
MEZRANI, Tanya No Parking Meters Party
NEILSON, Kathy Australian Labor Party (NSW Branch)
SHUREY, Lindsay The Greens
SMITH, Kiel Liberal Party of Australia New South Wales Division
THOMPSON, Pat Australian Labor Party (NSW Branch)
TREBELAS, Kon No Parking Meters Party
YOUNG, Jason Liberal Party of Australia New South Wales Division
South Ward
BELLELI, Robert Liberal Party of Australia New South Wales Division
BRANIGHAN, Arthur No Parking Meters Party
D'SOUZA, Noel Australian Labor Party (NSW Branch)
GARCIA, Pat Australian Labor Party (NSW Branch)
HUGHES, Leanne Australian Labor Party (NSW Branch)
ISON, Sam Liberal Party of Australia New South Wales Division
MACDONALD, James The Greens
MATTHEWS, Charles No Parking Meters Party
MOORE, Ashley The Greens
OLSEN, Gregory The Greens
RENFORD, Michael No Parking Meters Party
TESORIERO, Santina Liberal Party of Australia New South Wales Division
West Ward
ALLISON, David The Greens
FENECH, Mario -
GUERRERA, Grace Liberal Party of Australia New South Wales Division
HUGHES, Bradley The Greens
JACKSON, Stewart The Greens
MOORE, Greg Australian Labor Party (NSW Branch)
MORRIS, Robert No Parking Meters Party
NASH, Scott Liberal Party of Australia New South Wales Division
PROCOPIADIS, John -
QIAO, Chao Australian Labor Party (NSW Branch)
ROYDHOUSE, Andrew -
SOFIOS, Patricia -
STAVRINOS, Harry Liberal Party of Australia New South Wales Division
TINYOW, Dudley -
TREBELAS, Pandelis No Parking Meters Party
TREBELAS, Poppy No Parking Meters Party
WHITEHEAD, Margery -
WILLING, Ross Australian Labor Party (NSW Branch)
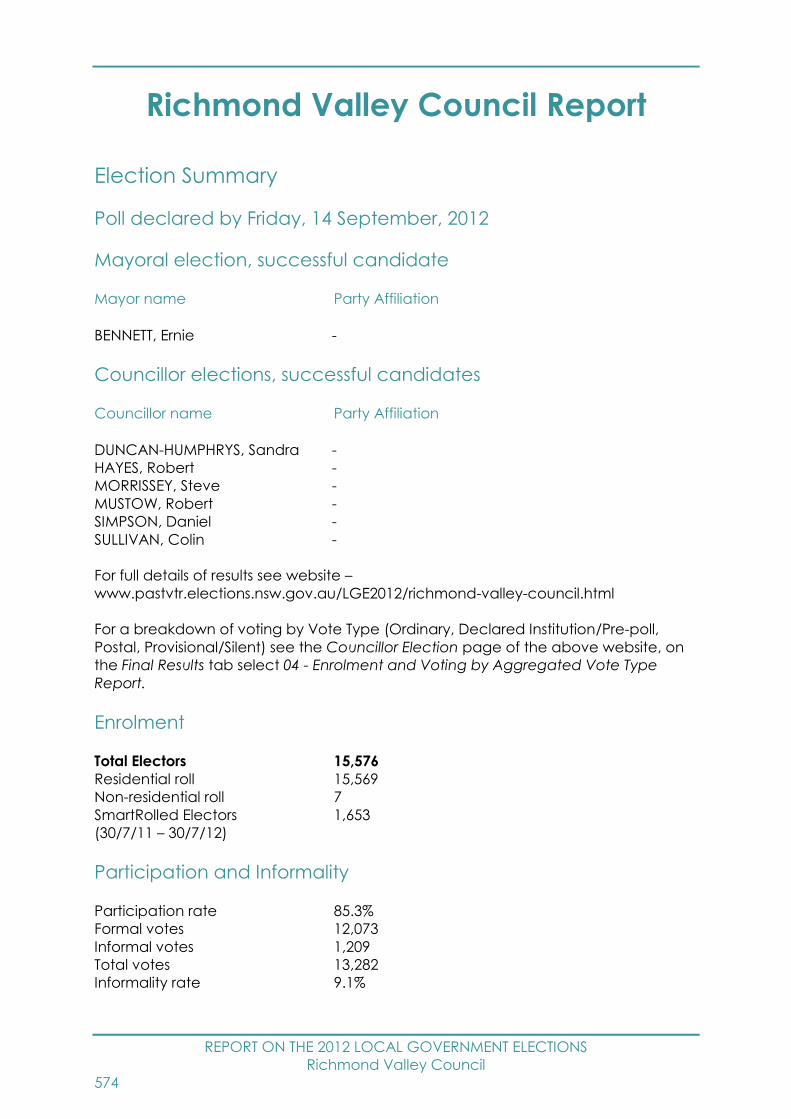
REPORT ON THE 2012 LOCAL GOVERNMENT ELECTIONS
Richmond Valley Council
574
Richmond Valley Council Report
Election Summary
Poll declared by Friday, 14 September, 2012
Mayoral election, successful candidate
Mayor name Party Affiliation
BENNETT, Ernie -
Councillor elections, successful candidates
Councillor name Party Affiliation
DUNCAN-HUMPHRYS, Sandra -
HAYES, Robert -
MORRISSEY, Steve -
MUSTOW, Robert -
SIMPSON, Daniel -
SULLIVAN, Colin -
For full details of results see website –
www.pastvtr.elections.nsw.gov.au/LGE2012/richmond-valley-council.html
For a breakdown of voting by Vote Type (Ordinary, Declared Institution/Pre-poll,
Postal, Provisional/Silent) see the Councillor Election page of the above website, on
the Final Results tab select 04 - Enrolment and Voting by Aggregated Vote Type
Report.
Enrolment
Total Electors 15,576
Residential roll 15,569
Non-residential roll 7
SmartRolled Electors 1,653
(30/7/11 – 30/7/12)
Participation and Informality
Participation rate 85.3%
Formal votes 12,073
Informal votes 1,209
Total votes 13,282
Informality rate 9.1%

REPORT ON THE 2012 LOCAL GOVERNMENT ELECTIONS
Richmond Valley Council
575
Failure to Vote
Penalty Notices Issued 1,748
Rate of Failure to Vote98 11.3%
Election Costs
Total Cost of the Richmond Valley Council 2012 Election
$112,365.00
Cost per elector
$7.23
Richmond Valley Council Statutory Advertising Campaign Expenditure
Nominations $466.24
Candidates and polling places $2,048.44
Uncontested elections $0.00
Results $810.99
TOTAL $3,325.67
Election Services
Elector Enquiry Centre
The Elector Enquiry Centre answered 196 calls from postcodes within Richmond
Valley Council area.
NSWEC Website
There were 1,084 unique visitors to Richmond Valley Council election web page.
Braille Ballot Papers
No braille ballot papers were requested or printed.
Returning Officer
Clifford Mitchell
98 Percentage of Penalty Notices Issued to Enrolment (as shown on Authorised Roll)
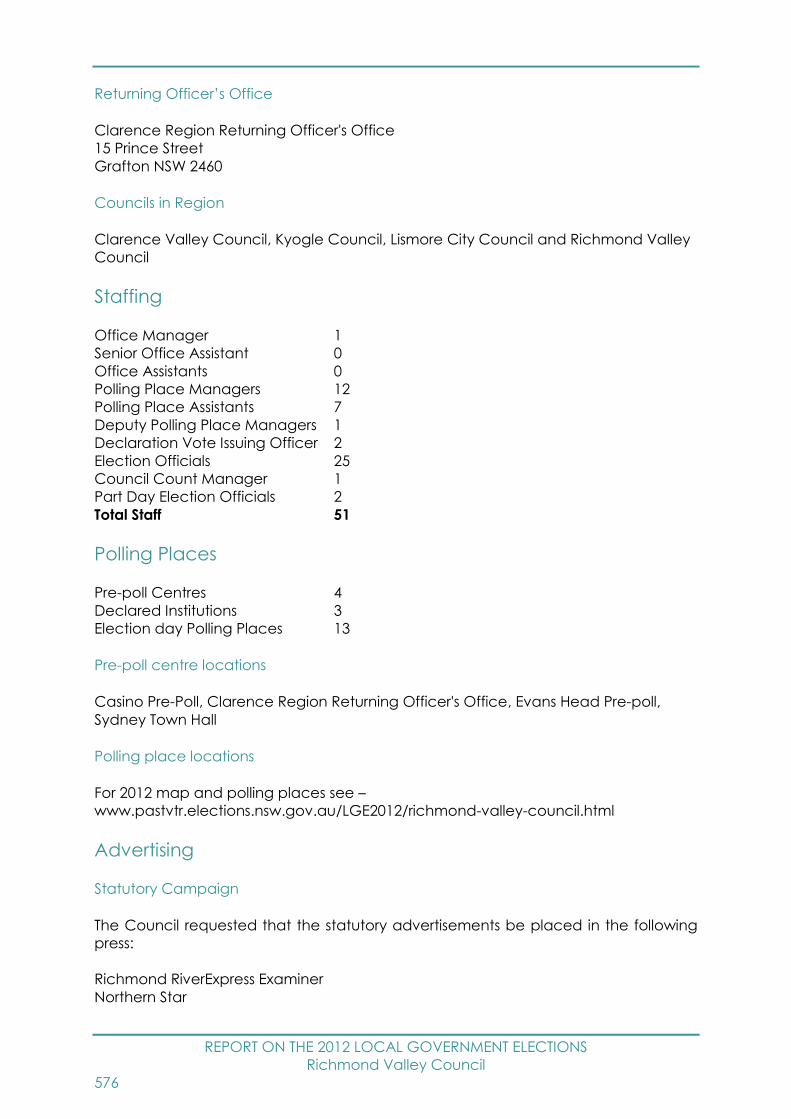
REPORT ON THE 2012 LOCAL GOVERNMENT ELECTIONS
Richmond Valley Council
576
Returning Officer’s Office
Clarence Region Returning Officer's Office
15 Prince Street
Grafton NSW 2460
Councils in Region
Clarence Valley Council, Kyogle Council, Lismore City Council and Richmond Valley
Council
Staffing
Office Manager 1
Senior Office Assistant 0
Office Assistants 0
Polling Place Managers 12
Polling Place Assistants 7
Deputy Polling Place Managers 1
Declaration Vote Issuing Officer 2
Election Officials 25
Council Count Manager 1
Part Day Election Officials 2
Total Staff 51
Polling Places
Pre-poll Centres 4
Declared Institutions 3
Election day Polling Places 13
Pre-poll centre locations
Casino Pre-Poll, Clarence Region Returning Officer's Office, Evans Head Pre-poll,
Sydney Town Hall
Polling place locations
For 2012 map and polling places see –
www.pastvtr.elections.nsw.gov.au/LGE2012/richmond-valley-council.html
Advertising
Statutory Campaign
The Council requested that the statutory advertisements be placed in the following
press:
Richmond RiverExpress Examiner
Northern Star
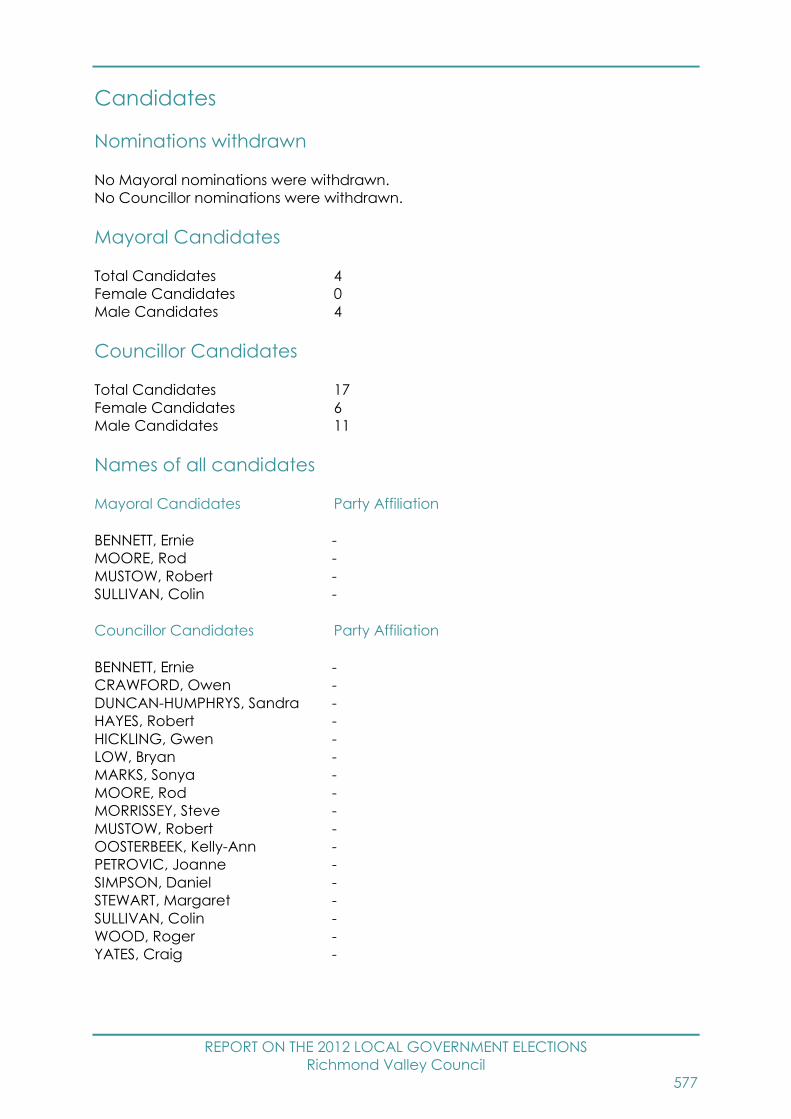
REPORT ON THE 2012 LOCAL GOVERNMENT ELECTIONS
Richmond Valley Council
577
Candidates
Nominations withdrawn
No Mayoral nominations were withdrawn.
No Councillor nominations were withdrawn.
Mayoral Candidates
Total Candidates 4
Female Candidates 0
Male Candidates 4
Councillor Candidates
Total Candidates 17
Female Candidates 6
Male Candidates 11
Names of all candidates
Mayoral Candidates Party Affiliation
BENNETT, Ernie -
MOORE, Rod -
MUSTOW, Robert -
SULLIVAN, Colin -
Councillor Candidates Party Affiliation
BENNETT, Ernie -
CRAWFORD, Owen -
DUNCAN-HUMPHRYS, Sandra -
HAYES, Robert -
HICKLING, Gwen -
LOW, Bryan -
MARKS, Sonya -
MOORE, Rod -
MORRISSEY, Steve -
MUSTOW, Robert -
OOSTERBEEK, Kelly-Ann -
PETROVIC, Joanne -
SIMPSON, Daniel -
STEWART, Margaret -
SULLIVAN, Colin -
WOOD, Roger -
YATES, Craig -

REPORT ON THE 2012 LOCAL GOVERNMENT ELECTIONS
Rockdale City Council
578
Rockdale City Council Report
Election Summary
Poll declared by Saturday, 15 September, 2012
Councillor elections, successful candidates
Councillor name Party Affiliation
First Ward
HANNA, Mark -
POULOS, Peter Liberal Party of Australia New South Wales Division
TSOUNIS, Andrew Australian Labor Party (NSW Branch)
Second Ward
IBRAHIM, Tarek Australian Labor Party (NSW Branch)
MICKOVSKI, Nicholas Liberal Party of Australia New South Wales Division
NAGI, Michael -
Third Ward
KALLIGAS, Petros Liberal Party of Australia New South Wales Division
SARAVINOVSKI, Bill Australian Labor Party (NSW Branch)
SEDRAK, Lydia Liberal Party of Australia New South Wales Division
Fourth Ward
AWADA, Joe Australian Labor Party (NSW Branch)
BARLOW, Liz -
SEDRAK, Paul Liberal Party of Australia New South Wales Division
Fifth Ward
BEZIC, Ron Liberal Party of Australia New South Wales Division
MACDONALD, James -
O'BRIEN, Shane Australian Labor Party (NSW Branch)
For full details of results see website –
www.pastvtr.elections.nsw.gov.au/LGE2012/rockdale-city-council.html
For a breakdown of voting by Vote Type (Ordinary, Declared Institution/Pre-poll,
Postal, Provisional/Silent) see the Councillor Election page of the above website, on
the Final Results tab select 04 - Enrolment and Voting by Aggregated Vote Type
Report.
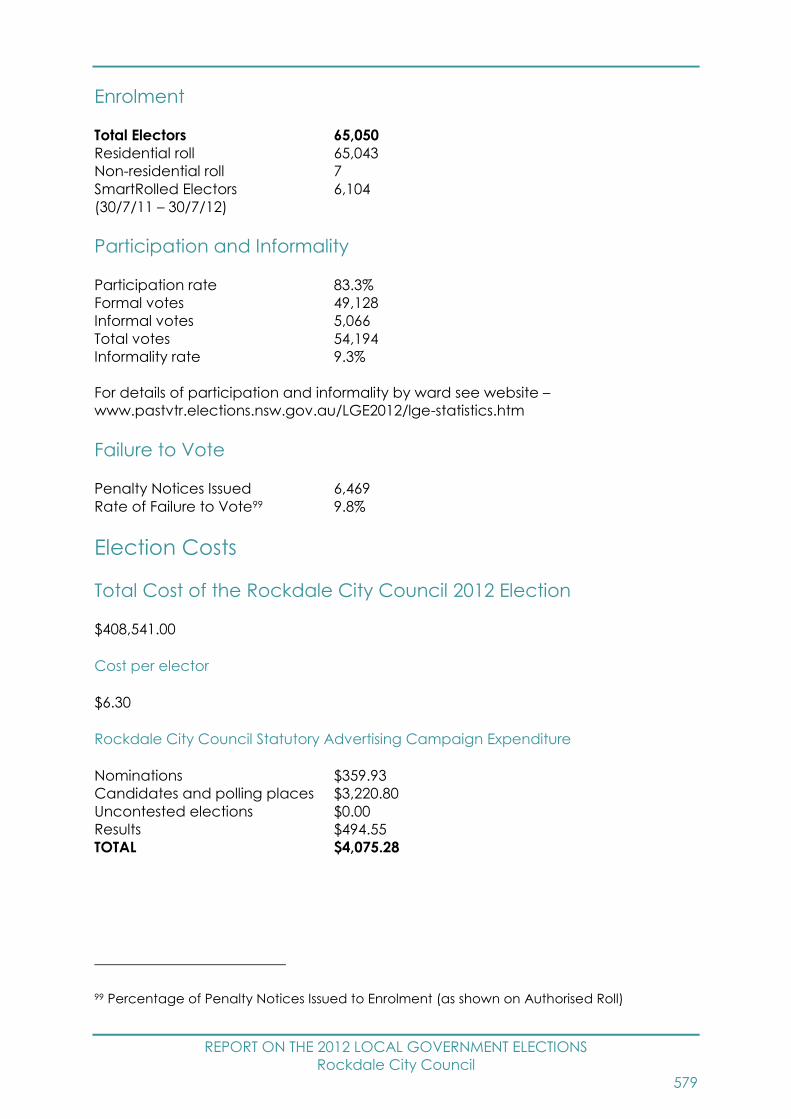
REPORT ON THE 2012 LOCAL GOVERNMENT ELECTIONS
Rockdale City Council
579
Enrolment
Total Electors 65,050
Residential roll 65,043
Non-residential roll 7
SmartRolled Electors 6,104
(30/7/11 – 30/7/12)
Participation and Informality
Participation rate 83.3%
Formal votes 49,128
Informal votes 5,066
Total votes 54,194
Informality rate 9.3%
For details of participation and informality by ward see website –
www.pastvtr.elections.nsw.gov.au/LGE2012/lge-statistics.htm
Failure to Vote
Penalty Notices Issued 6,469
Rate of Failure to Vote99 9.8%
Election Costs
Total Cost of the Rockdale City Council 2012 Election
$408,541.00
Cost per elector
$6.30
Rockdale City Council Statutory Advertising Campaign Expenditure
Nominations $359.93
Candidates and polling places $3,220.80
Uncontested elections $0.00
Results $494.55
TOTAL $4,075.28
99 Percentage of Penalty Notices Issued to Enrolment (as shown on Authorised Roll)
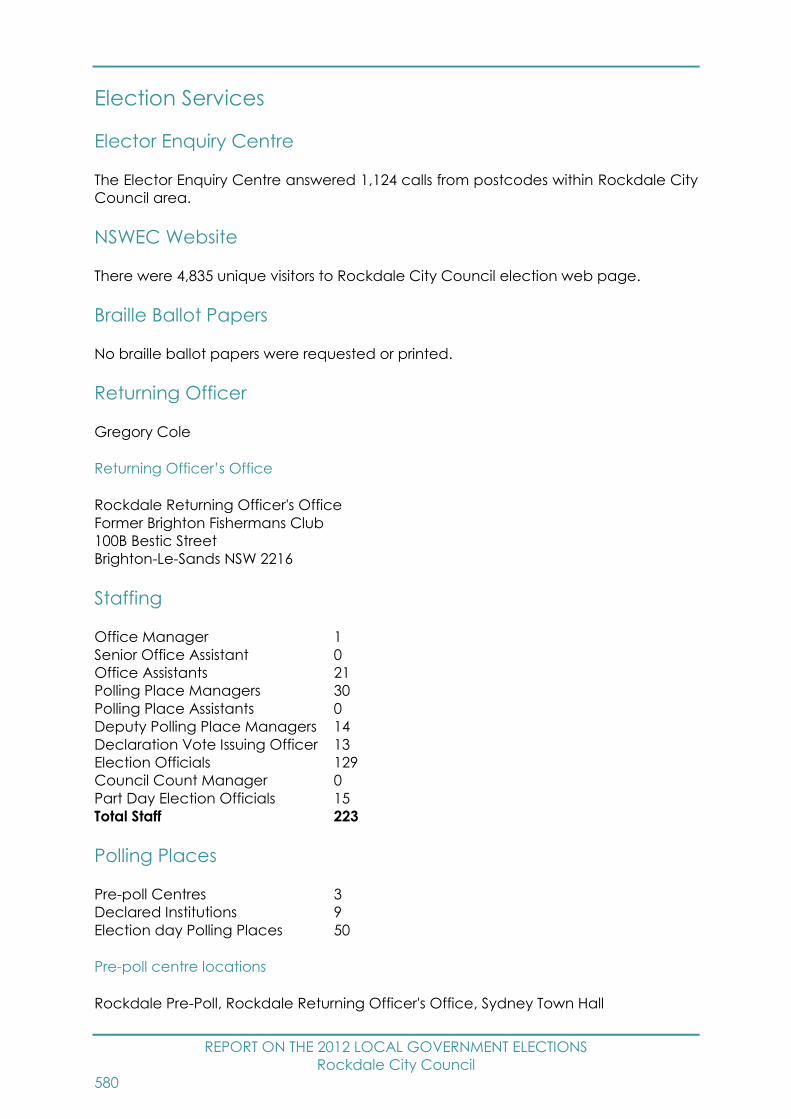
REPORT ON THE 2012 LOCAL GOVERNMENT ELECTIONS
Rockdale City Council
580
Election Services
Elector Enquiry Centre
The Elector Enquiry Centre answered 1,124 calls from postcodes within Rockdale City
Council area.
NSWEC Website
There were 4,835 unique visitors to Rockdale City Council election web page.
Braille Ballot Papers
No braille ballot papers were requested or printed.
Returning Officer
Gregory Cole
Returning Officer’s Office
Rockdale Returning Officer's Office
Former Brighton Fishermans Club
100B Bestic Street
Brighton-Le-Sands NSW 2216
Staffing
Office Manager 1
Senior Office Assistant 0
Office Assistants 21
Polling Place Managers 30
Polling Place Assistants 0
Deputy Polling Place Managers 14
Declaration Vote Issuing Officer 13
Election Officials 129
Council Count Manager 0
Part Day Election Officials 15
Total Staff 223
Polling Places
Pre-poll Centres 3
Declared Institutions 9
Election day Polling Places 50
Pre-poll centre locations
Rockdale Pre-Poll, Rockdale Returning Officer's Office, Sydney Town Hall
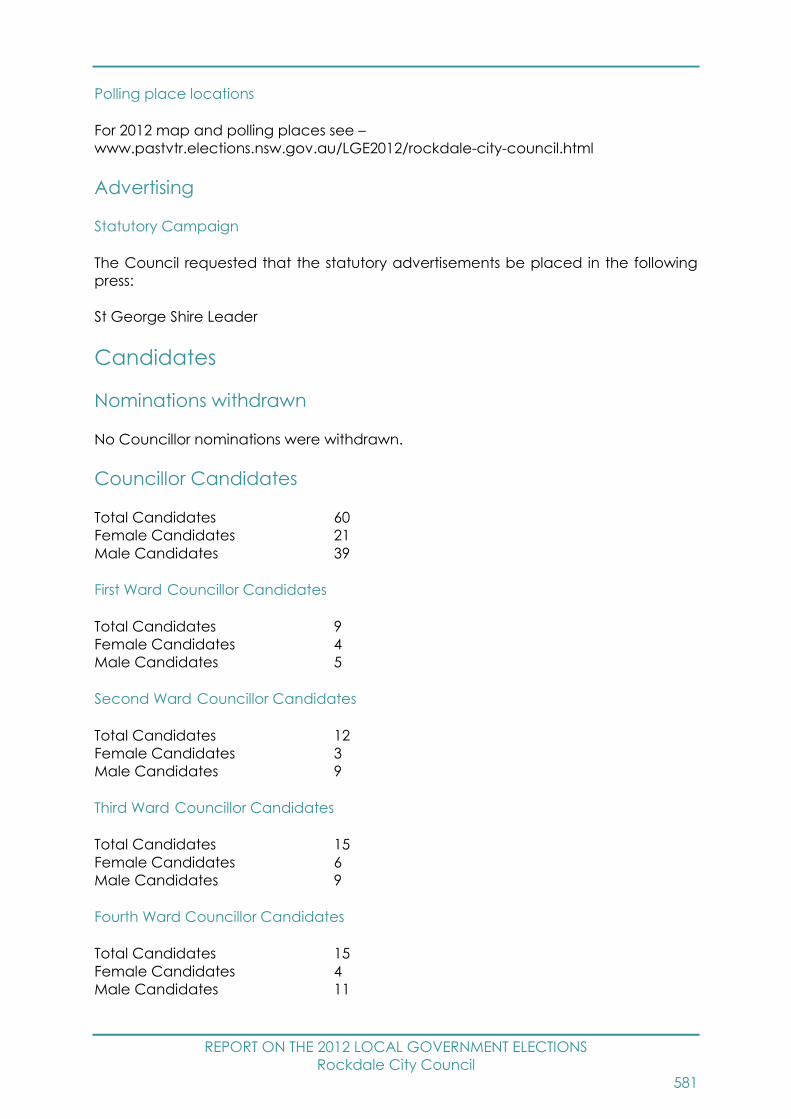
REPORT ON THE 2012 LOCAL GOVERNMENT ELECTIONS
Rockdale City Council
581
Polling place locations
For 2012 map and polling places see –
www.pastvtr.elections.nsw.gov.au/LGE2012/rockdale-city-council.html
Advertising
Statutory Campaign
The Council requested that the statutory advertisements be placed in the following
press:
St George Shire Leader
Candidates
Nominations withdrawn
No Councillor nominations were withdrawn.
Councillor Candidates
Total Candidates 60
Female Candidates 21
Male Candidates 39
First Ward Councillor Candidates
Total Candidates 9
Female Candidates 4
Male Candidates 5
Second Ward Councillor Candidates
Total Candidates 12
Female Candidates 3
Male Candidates 9
Third Ward Councillor Candidates
Total Candidates 15
Female Candidates 6
Male Candidates 9
Fourth Ward Councillor Candidates
Total Candidates 15
Female Candidates 4
Male Candidates 11

REPORT ON THE 2012 LOCAL GOVERNMENT ELECTIONS
Rockdale City Council
582
Fifth Ward Councillor Candidates
Total Candidates 9
Female Candidates 4
Male Candidates 5
Names of all candidates
Councillor Candidates Party Affiliation
First Ward
CROMPTON, Les Australian Labor Party (NSW Branch)
HAN, Samantha Australian Labor Party (NSW Branch)
HANNA, Mark -
HRDINA, Georgina Liberal Party of Australia New South Wales Division
KALLIGAS, Patricia Liberal Party of Australia New South Wales Division
KARAVANAS, Kosta -
POULOS, Peter Liberal Party of Australia New South Wales Division
TSOUNIS, Andrew Australian Labor Party (NSW Branch)
YU, Jenny -
Second Ward
BEZIC, Ritsa Liberal Party of Australia New South Wales Division
BRENNAN, Jan Liberal Party of Australia New South Wales Division
CHAHINE, Moussa -
IBRAHIM, Tarek Australian Labor Party (NSW Branch)
KHAMIS, Ali -
MICKOVSKI, Nicholas Liberal Party of Australia New South Wales Division
NAGI, Michael -
PASOVSKI, Kiro Australian Labor Party (NSW Branch)
SHARAH, Bernie -
TENODI, Damir -
TENODI, Vesna -
YAN, Jack Australian Labor Party (NSW Branch)
Third Ward
ABDALLAH, Rami -
COLLARO, Evelyn The Greens
DE LEAU, Lesa The Greens
IBRAHIM, Khalil Australian Labor Party (NSW Branch)
KALLIGAS, Petros Liberal Party of Australia New South Wales Division
MARTIN, Barbara -
MORGAN, David The Greens
PEPPAS, Con Liberal Party of Australia New South Wales Division
SARAVINOVSKA, Belinda -
SARAVINOVSKI, Bill Australian Labor Party (NSW Branch)
SARAVINOVSKI, George -
SEDRAK, Lydia Liberal Party of Australia New South Wales Division
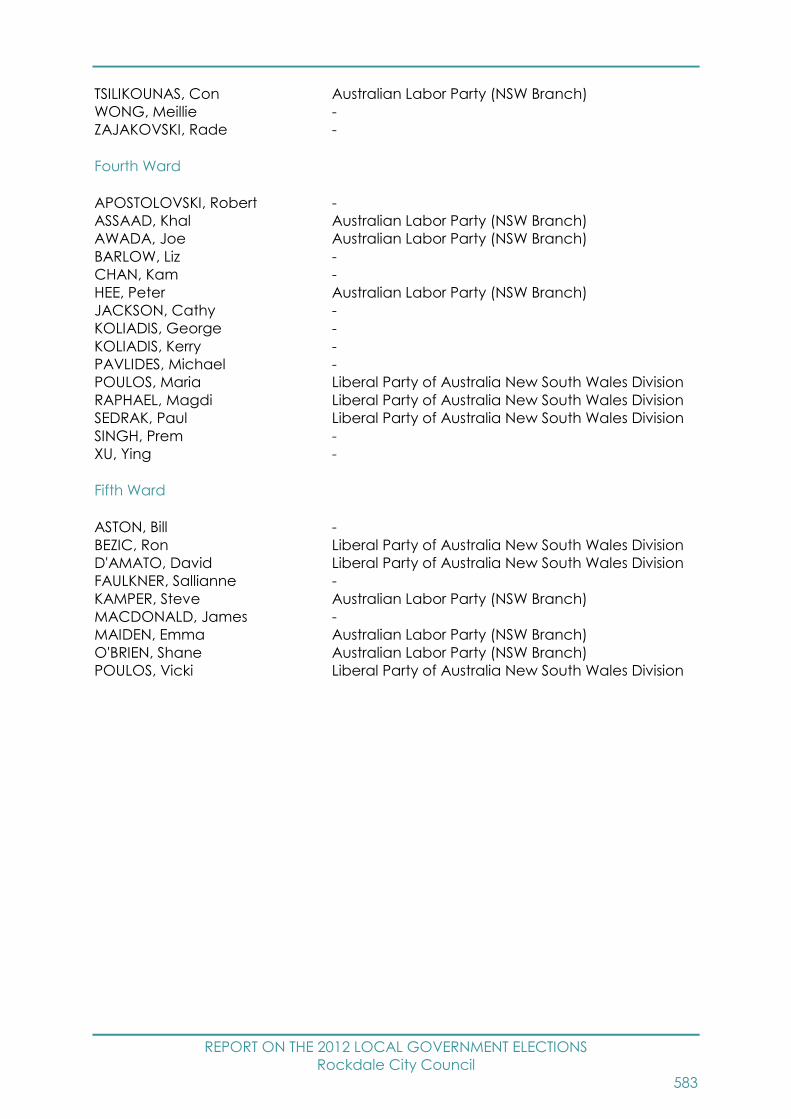
REPORT ON THE 2012 LOCAL GOVERNMENT ELECTIONS
Rockdale City Council
583
TSILIKOUNAS, Con Australian Labor Party (NSW Branch)
WONG, Meillie -
ZAJAKOVSKI, Rade -
Fourth Ward
APOSTOLOVSKI, Robert -
ASSAAD, Khal Australian Labor Party (NSW Branch)
AWADA, Joe Australian Labor Party (NSW Branch)
BARLOW, Liz -
CHAN, Kam -
HEE, Peter Australian Labor Party (NSW Branch)
JACKSON, Cathy -
KOLIADIS, George -
KOLIADIS, Kerry -
PAVLIDES, Michael -
POULOS, Maria Liberal Party of Australia New South Wales Division
RAPHAEL, Magdi Liberal Party of Australia New South Wales Division
SEDRAK, Paul Liberal Party of Australia New South Wales Division
SINGH, Prem -
XU, Ying -
Fifth Ward
ASTON, Bill -
BEZIC, Ron Liberal Party of Australia New South Wales Division
D'AMATO, David Liberal Party of Australia New South Wales Division
FAULKNER, Sallianne -
KAMPER, Steve Australian Labor Party (NSW Branch)
MACDONALD, James -
MAIDEN, Emma Australian Labor Party (NSW Branch)
O'BRIEN, Shane Australian Labor Party (NSW Branch)
POULOS, Vicki Liberal Party of Australia New South Wales Division
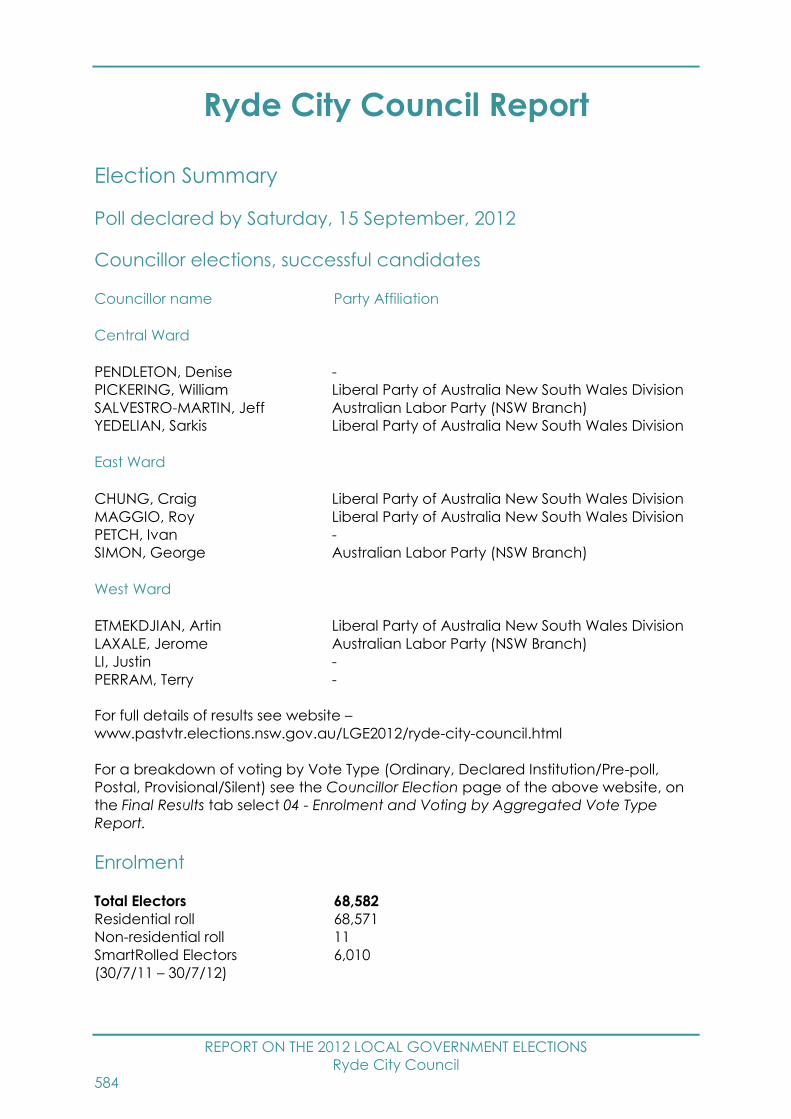
REPORT ON THE 2012 LOCAL GOVERNMENT ELECTIONS
Ryde City Council
584
Ryde City Council Report
Election Summary
Poll declared by Saturday, 15 September, 2012
Councillor elections, successful candidates
Councillor name Party Affiliation
Central Ward
PENDLETON, Denise -
PICKERING, William Liberal Party of Australia New South Wales Division
SALVESTRO-MARTIN, Jeff Australian Labor Party (NSW Branch)
YEDELIAN, Sarkis Liberal Party of Australia New South Wales Division
East Ward
CHUNG, Craig Liberal Party of Australia New South Wales Division
MAGGIO, Roy Liberal Party of Australia New South Wales Division
PETCH, Ivan -
SIMON, George Australian Labor Party (NSW Branch)
West Ward
ETMEKDJIAN, Artin Liberal Party of Australia New South Wales Division
LAXALE, Jerome Australian Labor Party (NSW Branch)
LI, Justin -
PERRAM, Terry -
For full details of results see website –
www.pastvtr.elections.nsw.gov.au/LGE2012/ryde-city-council.html
For a breakdown of voting by Vote Type (Ordinary, Declared Institution/Pre-poll,
Postal, Provisional/Silent) see the Councillor Election page of the above website, on
the Final Results tab select 04 - Enrolment and Voting by Aggregated Vote Type
Report.
Enrolment
Total Electors 68,582
Residential roll 68,571
Non-residential roll 11
SmartRolled Electors 6,010
(30/7/11 – 30/7/12)
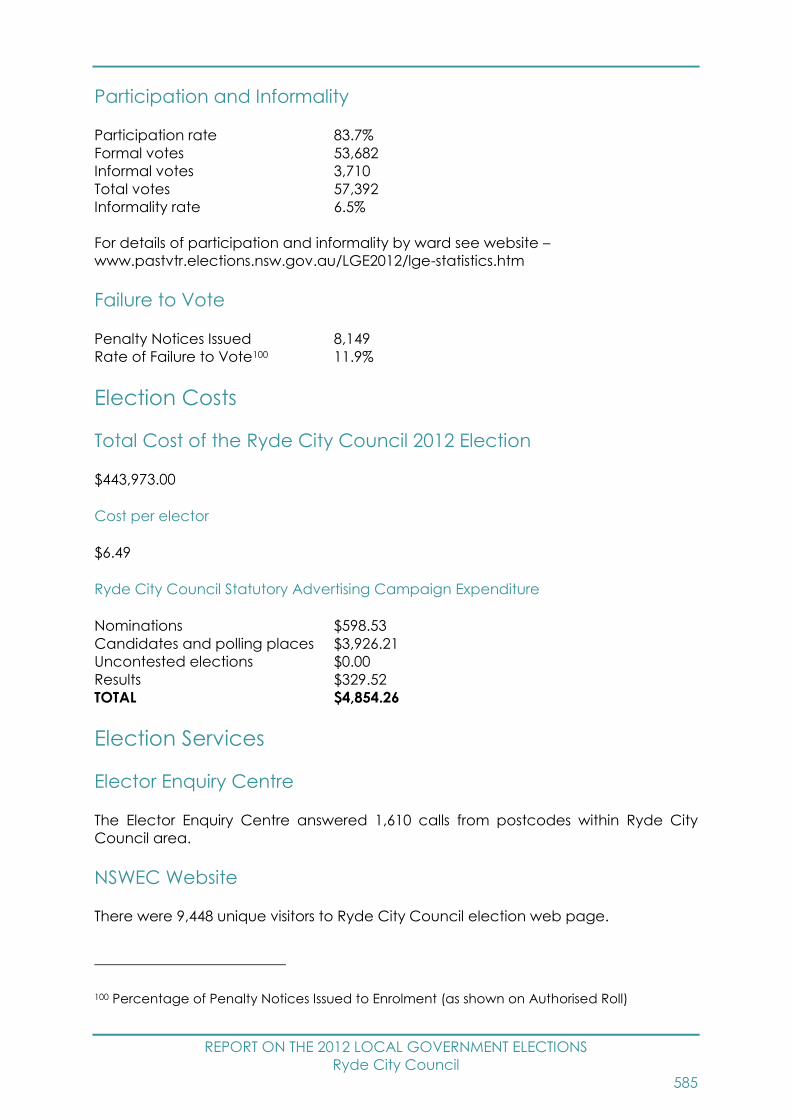
REPORT ON THE 2012 LOCAL GOVERNMENT ELECTIONS
Ryde City Council
585
Participation and Informality
Participation rate 83.7%
Formal votes 53,682
Informal votes 3,710
Total votes 57,392
Informality rate 6.5%
For details of participation and informality by ward see website –
www.pastvtr.elections.nsw.gov.au/LGE2012/lge-statistics.htm
Failure to Vote
Penalty Notices Issued 8,149
Rate of Failure to Vote100 11.9%
Election Costs
Total Cost of the Ryde City Council 2012 Election
$443,973.00
Cost per elector
$6.49
Ryde City Council Statutory Advertising Campaign Expenditure
Nominations $598.53
Candidates and polling places $3,926.21
Uncontested elections $0.00
Results $329.52
TOTAL $4,854.26
Election Services
Elector Enquiry Centre
The Elector Enquiry Centre answered 1,610 calls from postcodes within Ryde City
Council area.
NSWEC Website
There were 9,448 unique visitors to Ryde City Council election web page.
100 Percentage of Penalty Notices Issued to Enrolment (as shown on Authorised Roll)
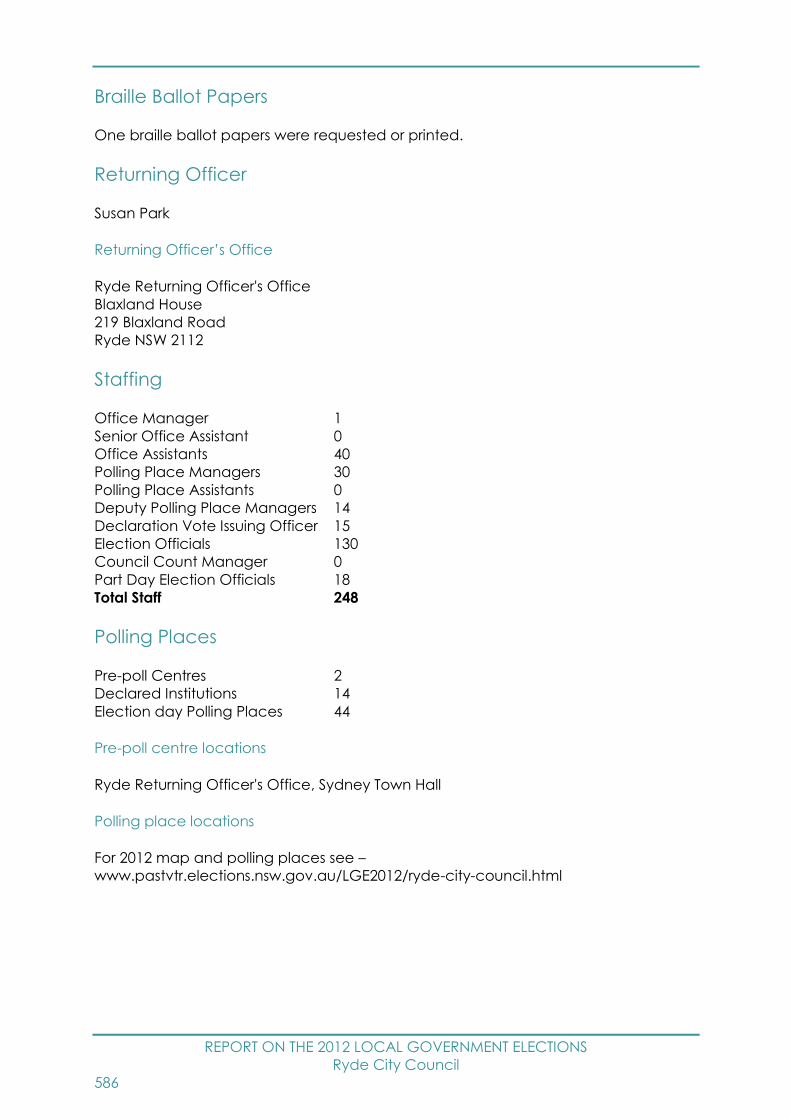
REPORT ON THE 2012 LOCAL GOVERNMENT ELECTIONS
Ryde City Council
586
Braille Ballot Papers
One braille ballot papers were requested or printed.
Returning Officer
Susan Park
Returning Officer’s Office
Ryde Returning Officer's Office
Blaxland House
219 Blaxland Road
Ryde NSW 2112
Staffing
Office Manager 1
Senior Office Assistant 0
Office Assistants 40
Polling Place Managers 30
Polling Place Assistants 0
Deputy Polling Place Managers 14
Declaration Vote Issuing Officer 15
Election Officials 130
Council Count Manager 0
Part Day Election Officials 18
Total Staff 248
Polling Places
Pre-poll Centres 2
Declared Institutions 14
Election day Polling Places 44
Pre-poll centre locations
Ryde Returning Officer's Office, Sydney Town Hall
Polling place locations
For 2012 map and polling places see –
www.pastvtr.elections.nsw.gov.au/LGE2012/ryde-city-council.html
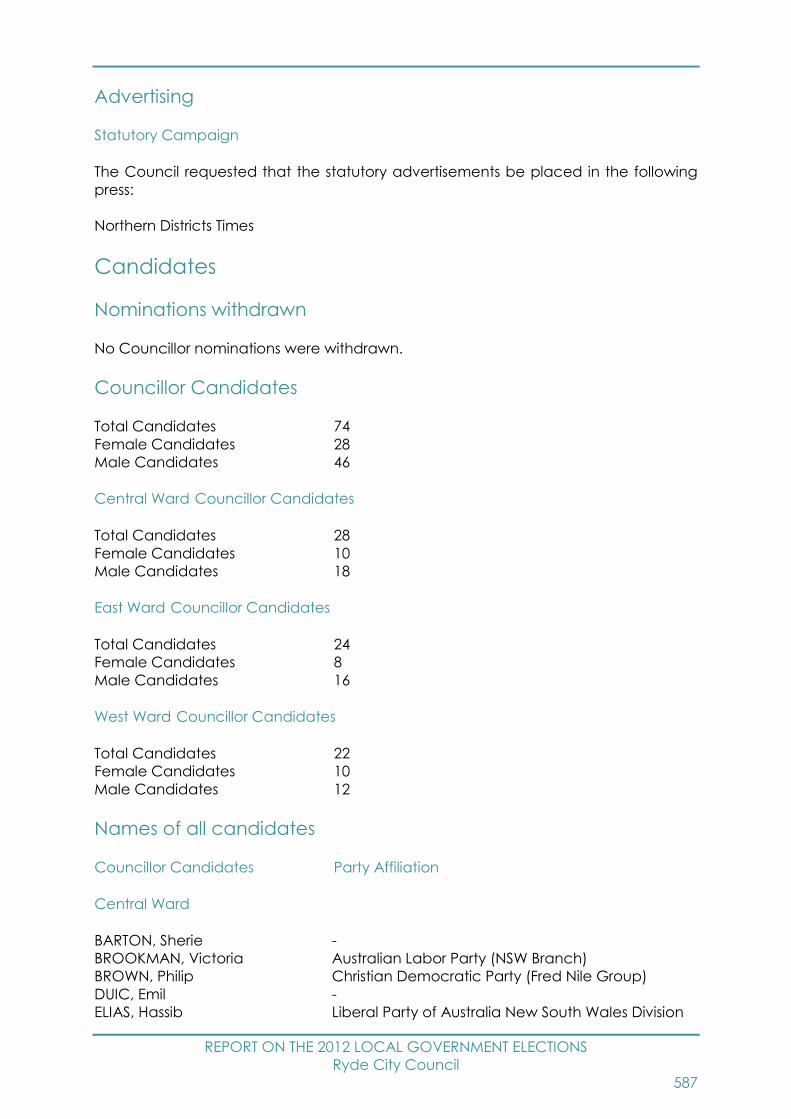
REPORT ON THE 2012 LOCAL GOVERNMENT ELECTIONS
Ryde City Council
587
Advertising
Statutory Campaign
The Council requested that the statutory advertisements be placed in the following
press:
Northern Districts Times
Candidates
Nominations withdrawn
No Councillor nominations were withdrawn.
Councillor Candidates
Total Candidates 74
Female Candidates 28
Male Candidates 46
Central Ward Councillor Candidates
Total Candidates 28
Female Candidates 10
Male Candidates 18
East Ward Councillor Candidates
Total Candidates 24
Female Candidates 8
Male Candidates 16
West Ward Councillor Candidates
Total Candidates 22
Female Candidates 10
Male Candidates 12
Names of all candidates
Councillor Candidates Party Affiliation
Central Ward
BARTON, Sherie -
BROOKMAN, Victoria Australian Labor Party (NSW Branch)
BROWN, Philip Christian Democratic Party (Fred Nile Group)
DUIC, Emil -
ELIAS, Hassib Liberal Party of Australia New South Wales Division
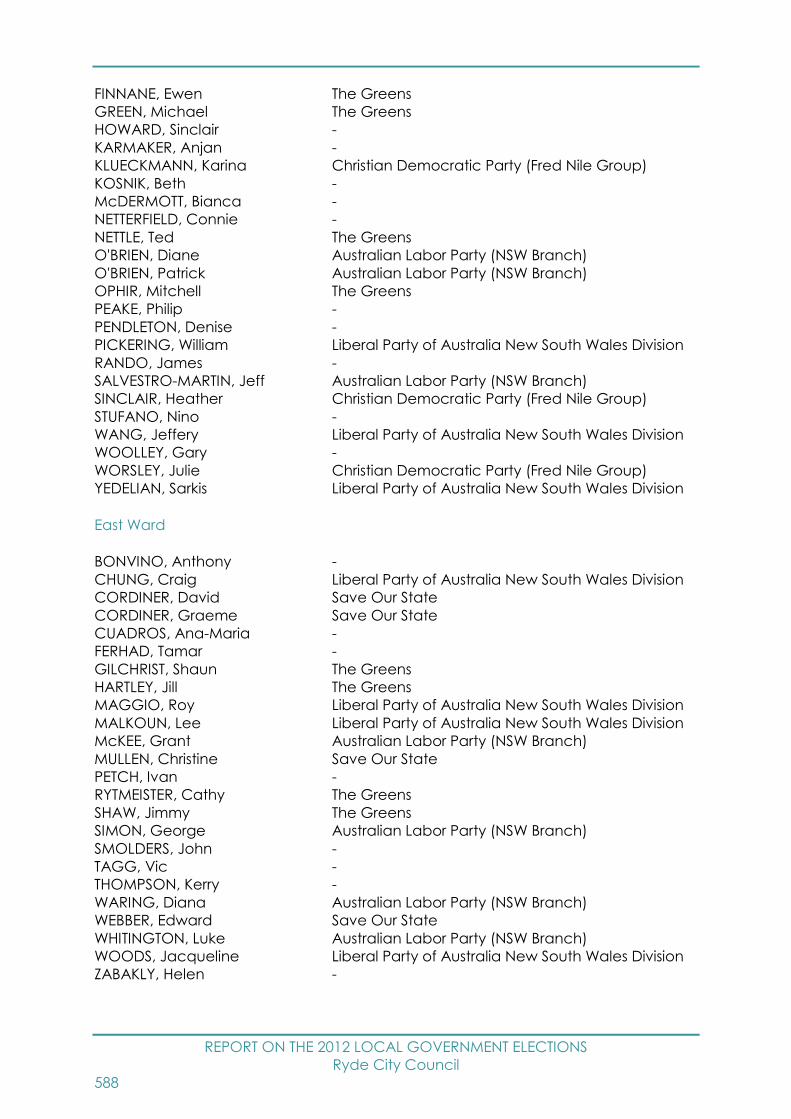
REPORT ON THE 2012 LOCAL GOVERNMENT ELECTIONS
Ryde City Council
588
FINNANE, Ewen The Greens
GREEN, Michael The Greens
HOWARD, Sinclair -
KARMAKER, Anjan -
KLUECKMANN, Karina Christian Democratic Party (Fred Nile Group)
KOSNIK, Beth -
McDERMOTT, Bianca -
NETTERFIELD, Connie -
NETTLE, Ted The Greens
O'BRIEN, Diane Australian Labor Party (NSW Branch)
O'BRIEN, Patrick Australian Labor Party (NSW Branch)
OPHIR, Mitchell The Greens
PEAKE, Philip -
PENDLETON, Denise -
PICKERING, William Liberal Party of Australia New South Wales Division
RANDO, James -
SALVESTRO-MARTIN, Jeff Australian Labor Party (NSW Branch)
SINCLAIR, Heather Christian Democratic Party (Fred Nile Group)
STUFANO, Nino -
WANG, Jeffery Liberal Party of Australia New South Wales Division
WOOLLEY, Gary -
WORSLEY, Julie Christian Democratic Party (Fred Nile Group)
YEDELIAN, Sarkis Liberal Party of Australia New South Wales Division
East Ward
BONVINO, Anthony -
CHUNG, Craig Liberal Party of Australia New South Wales Division
CORDINER, David Save Our State
CORDINER, Graeme Save Our State
CUADROS, Ana-Maria -
FERHAD, Tamar -
GILCHRIST, Shaun The Greens
HARTLEY, Jill The Greens
MAGGIO, Roy Liberal Party of Australia New South Wales Division
MALKOUN, Lee Liberal Party of Australia New South Wales Division
McKEE, Grant Australian Labor Party (NSW Branch)
MULLEN, Christine Save Our State
PETCH, Ivan -
RYTMEISTER, Cathy The Greens
SHAW, Jimmy The Greens
SIMON, George Australian Labor Party (NSW Branch)
SMOLDERS, John -
TAGG, Vic -
THOMPSON, Kerry -
WARING, Diana Australian Labor Party (NSW Branch)
WEBBER, Edward Save Our State
WHITINGTON, Luke Australian Labor Party (NSW Branch)
WOODS, Jacqueline Liberal Party of Australia New South Wales Division
ZABAKLY, Helen -

REPORT ON THE 2012 LOCAL GOVERNMENT ELECTIONS
Ryde City Council
589
West Ward
BENZANO, Fiona Australian Labor Party (NSW Branch)
CHECCHIA, Simone Liberal Party of Australia New South Wales Division
COCKING, David -
COOPER, Beth -
ETMEKDJIAN, Artin Liberal Party of Australia New South Wales Division
GILCHRIST, Patricia -
HARDWICK, Ian -
HARDY, Doug Liberal Party of Australia New South Wales Division
JENSEN, Coralie -
LAXALE, Jerome Australian Labor Party (NSW Branch)
LEE, Geoffrey Australian Labor Party (NSW Branch)
LI, Justin -
MAYGER, Margaret Australian Labor Party (NSW Branch)
NEWSTEAD, Vicki -
PERRAM, Terry -
SANGKUHL, Helge -
SUN, Douglas Liberal Party of Australia New South Wales Division
TOROSSIAN, Rose -
WANG, Yvonne -
WILLIAMS, John -
WILLIAMS, Miechele Democratic Labor Party
WILLIAMS, Nick Democratic Labor Party

REPORT ON THE 2012 LOCAL GOVERNMENT ELECTIONS
Singleton Council
590
Singleton Council Report
Election Summary
Poll declared by Friday, 14 September, 2012
Mayoral election, successful candidate
Mayor name Party Affiliation
MARTIN, John -
Councillor elections, successful candidates
Councillor name Party Affiliation
ADAMTHWAITE, Godfrey -
CAPSANIS, Tessa -
JENKINS, Hollee -
KEOWN, Bob -
LOWE, Gary -
MOORE, Sue -
McNAMARA, Tony -
ROGERS, Ruth -
SCOTT, Val -
For full details of results see website –
www.pastvtr.elections.nsw.gov.au/LGE2012/singleton-council.html
For a breakdown of voting by Vote Type (Ordinary, Declared Institution/Pre-poll,
Postal, Provisional/Silent) see the Councillor Election page of the above website, on
the Final Results tab select 04 - Enrolment and Voting by Aggregated Vote Type
Report.
Enrolment
Total Electors 15,154
Residential roll 15,149
Non-residential roll 5
SmartRolled Electors 1,443
(30/7/11 – 30/7/12)
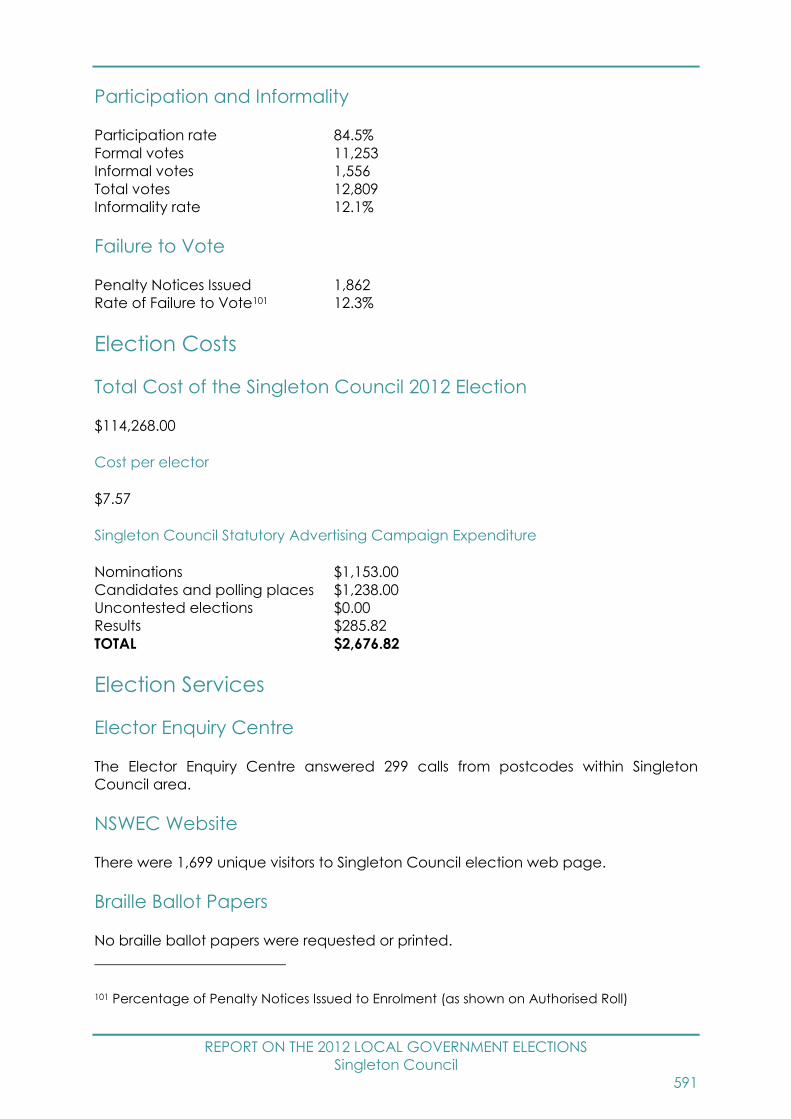
REPORT ON THE 2012 LOCAL GOVERNMENT ELECTIONS
Singleton Council
591
Participation and Informality
Participation rate 84.5%
Formal votes 11,253
Informal votes 1,556
Total votes 12,809
Informality rate 12.1%
Failure to Vote
Penalty Notices Issued 1,862
Rate of Failure to Vote101 12.3%
Election Costs
Total Cost of the Singleton Council 2012 Election
$114,268.00
Cost per elector
$7.57
Singleton Council Statutory Advertising Campaign Expenditure
Nominations $1,153.00
Candidates and polling places $1,238.00
Uncontested elections $0.00
Results $285.82
TOTAL $2,676.82
Election Services
Elector Enquiry Centre
The Elector Enquiry Centre answered 299 calls from postcodes within Singleton
Council area.
NSWEC Website
There were 1,699 unique visitors to Singleton Council election web page.
Braille Ballot Papers
No braille ballot papers were requested or printed.
101 Percentage of Penalty Notices Issued to Enrolment (as shown on Authorised Roll)

REPORT ON THE 2012 LOCAL GOVERNMENT ELECTIONS
Singleton Council
592
Returning Officer
David Workman
Returning Officer’s Office
Singleton Region Returning Officer's Office
Old St Patricks Primary School
Market Street
Singleton NSW 2330
Councils in Region
Muswellbrook Shire Council, Singleton Council and Upper Hunter Shire Council
Staffing
Office Manager 1
Senior Office Assistant 0
Office Assistants 37
Polling Place Managers 13
Polling Place Assistants 2
Deputy Polling Place Managers 1
Declaration Vote Issuing Officer 2
Election Officials 21
Council Count Manager 1
Part Day Election Officials 4
Total Staff 82
Polling Places
Pre-poll Centres 2
Declared Institutions 4
Election day Polling Places 14
Pre-poll centre locations
Singleton Region Returning Officer's Office, Sydney Town Hall
Polling place locations
For 2012 map and polling places see –
www.pastvtr.elections.nsw.gov.au/LGE2012/singleton-council.html

REPORT ON THE 2012 LOCAL GOVERNMENT ELECTIONS
Singleton Council
593
Advertising
Statutory Campaign
The Council requested that the statutory advertisements be placed in the following
press:
Singleton Argus
Hunter Valley News
Candidates
Nominations withdrawn
No Mayoral nominations were withdrawn.
No Councillor nominations were withdrawn.
Mayoral Candidates
Total Candidates 7
Female Candidates 2
Male Candidates 5
Councillor Candidates
Total Candidates 12
Female Candidates 6
Male Candidates 6
Names of all candidates
Mayoral Candidates Party Affiliation
GALLAGHER, Lee -
HARVISON, Fred -
MARTIN, John -
McNAMARA, Tony -
MOORE, Sue -
O'BRIEN, Terence Liberal Party of Australia New South Wales Division
STIBBARD, Kylie -
Councillor Candidates Party Affiliation
ADAMTHWAITE, Godfrey -
CAPSANIS, Tessa -
GALLAGHER, Lee -
JENKINS, Hollee -
KEOWN, Bob -
LOWE, Gary -
MARTIN, John -
REPORT ON THE 2012 LOCAL GOVERNMENT ELECTIONS
Singleton Council
594
McNAMARA, Tony -
METLIKOVEC, Christina -
MOORE, Sue -
ROGERS, Ruth -
SCOTT, Val -
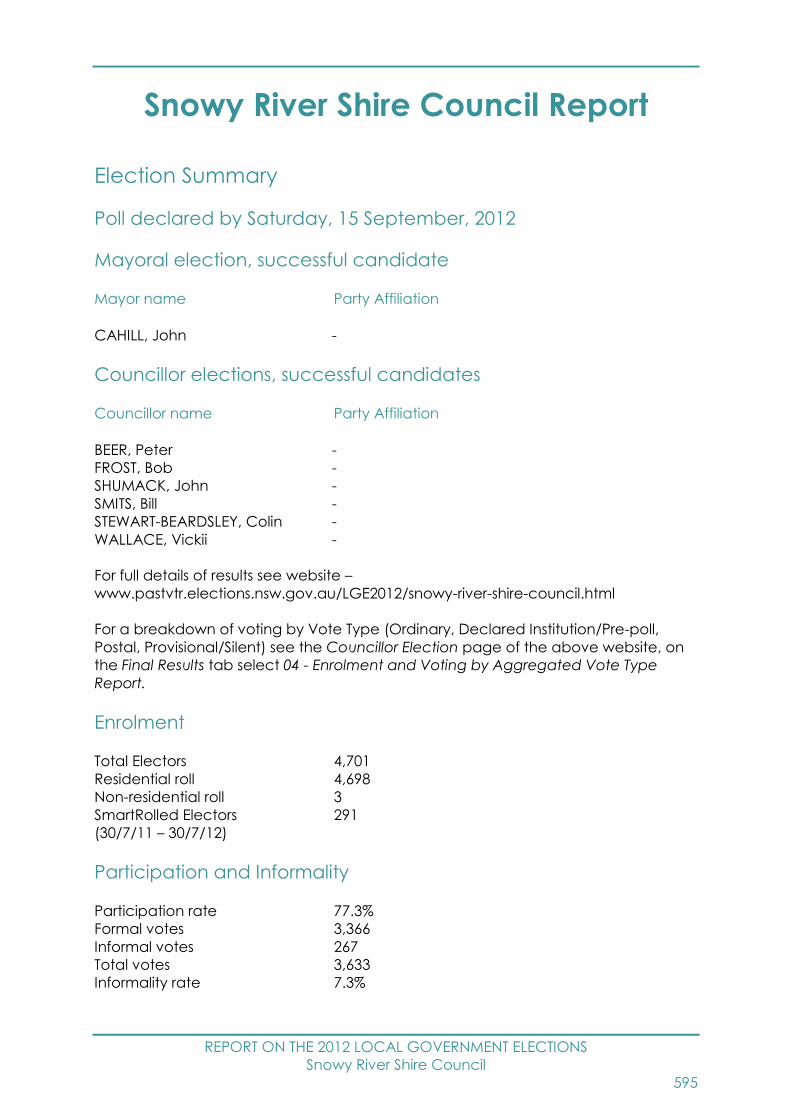
REPORT ON THE 2012 LOCAL GOVERNMENT ELECTIONS
Snowy River Shire Council
595
Snowy River Shire Council Report
Election Summary
Poll declared by Saturday, 15 September, 2012
Mayoral election, successful candidate
Mayor name Party Affiliation
CAHILL, John -
Councillor elections, successful candidates
Councillor name Party Affiliation
BEER, Peter -
FROST, Bob -
SHUMACK, John -
SMITS, Bill -
STEWART-BEARDSLEY, Colin -
WALLACE, Vickii -
For full details of results see website –
www.pastvtr.elections.nsw.gov.au/LGE2012/snowy-river-shire-council.html
For a breakdown of voting by Vote Type (Ordinary, Declared Institution/Pre-poll,
Postal, Provisional/Silent) see the Councillor Election page of the above website, on
the Final Results tab select 04 - Enrolment and Voting by Aggregated Vote Type
Report.
Enrolment
Total Electors 4,701
Residential roll 4,698
Non-residential roll 3
SmartRolled Electors 291
(30/7/11 – 30/7/12)
Participation and Informality
Participation rate 77.3%
Formal votes 3,366
Informal votes 267
Total votes 3,633
Informality rate 7.3%

REPORT ON THE 2012 LOCAL GOVERNMENT ELECTIONS
Snowy River Shire Council
596
Failure to Vote
Penalty Notices Issued 907
Rate of Failure to Vote102 19.4%
Election Costs
Total Cost of the Snowy River Shire Council 2012 Election
$44,930.00
Cost per elector
$9.61
Snowy River Shire Council Statutory Advertising Campaign Expenditure
Nominations $1,400.46
Candidates and polling places $2,701.66
Uncontested elections $0.00
Results $93.00
TOTAL $4,195.12
Election Services
Elector Enquiry Centre
The Elector Enquiry Centre answered 49 calls from postcodes within Snowy River Shire
Council area.
NSWEC Website
There were 672 unique visitors to Snowy River Shire Council election web page.
Braille Ballot Papers
No braille ballot papers were requested or printed.
Returning Officer
Susan Burke
102 Percentage of Penalty Notices Issued to Enrolment (as shown on Authorised Roll)

REPORT ON THE 2012 LOCAL GOVERNMENT ELECTIONS
Snowy River Shire Council
597
Returning Officer’s Office
Cooma Region Returning Officer's Office
Shop 3, 57 Sharp Street
Cooma NSW 2630
Councils in Region
Bombala Council, Cooma-Monaro Shire Council and Snowy River Shire Council
Staffing
Office Manager 1
Senior Office Assistant 0
Office Assistants 0
Polling Place Managers 7
Polling Place Assistants 1
Deputy Polling Place Managers 0
Declaration Vote Issuing Officer 0
Election Officials 9
Council Count Manager 1
Part Day Election Officials 1
Total Staff 20
Polling Places
Pre-poll Centres 4
Declared Institutions 0
Election day Polling Places 8
Pre-poll centre locations
Berridale Pre-Poll, Cooma Region Returning Officer's Office, Jindabyne Pre-Poll,
Sydney Town Hall
Polling place locations
For 2012 map and polling places see –
www.pastvtr.elections.nsw.gov.au/LGE2012/snowy-river-shire-council.html
Advertising
Statutory Campaign
The Council requested that the statutory advertisements be placed in the following
press:
Cooma Monaro Express
Cooma Summit Sun
Snowy River Echo
Monaro Post
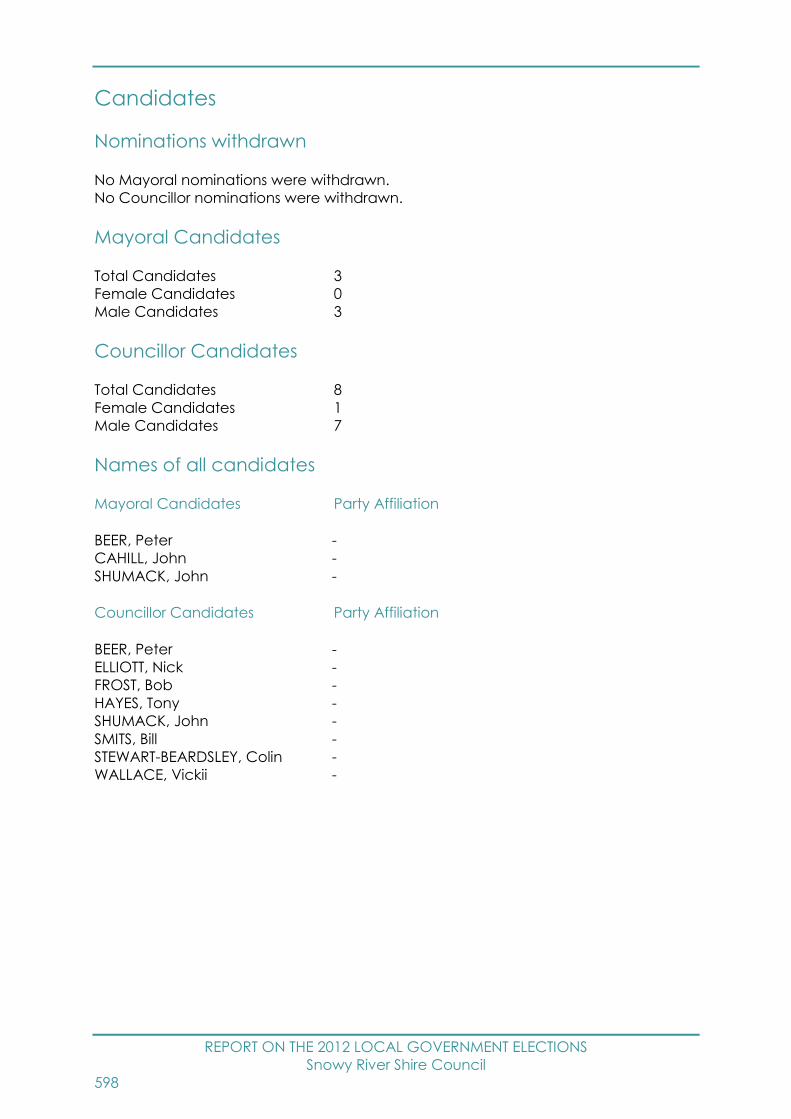
REPORT ON THE 2012 LOCAL GOVERNMENT ELECTIONS
Snowy River Shire Council
598
Candidates
Nominations withdrawn
No Mayoral nominations were withdrawn.
No Councillor nominations were withdrawn.
Mayoral Candidates
Total Candidates 3
Female Candidates 0
Male Candidates 3
Councillor Candidates
Total Candidates 8
Female Candidates 1
Male Candidates 7
Names of all candidates
Mayoral Candidates Party Affiliation
BEER, Peter -
CAHILL, John -
SHUMACK, John -
Councillor Candidates Party Affiliation
BEER, Peter -
ELLIOTT, Nick -
FROST, Bob -
HAYES, Tony -
SHUMACK, John -
SMITS, Bill -
STEWART-BEARDSLEY, Colin -
WALLACE, Vickii -
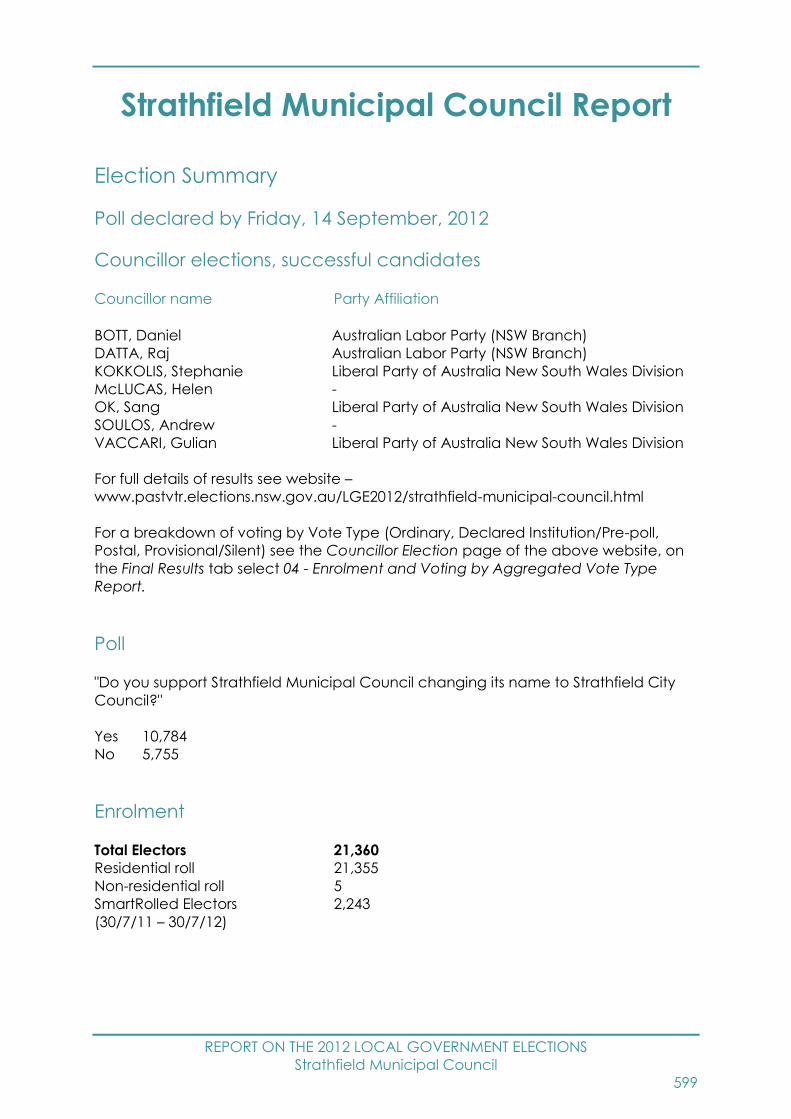
REPORT ON THE 2012 LOCAL GOVERNMENT ELECTIONS
Strathfield Municipal Council
599
Strathfield Municipal Council Report
Election Summary
Poll declared by Friday, 14 September, 2012
Councillor elections, successful candidates
Councillor name Party Affiliation
BOTT, Daniel Australian Labor Party (NSW Branch)
DATTA, Raj Australian Labor Party (NSW Branch)
KOKKOLIS, Stephanie Liberal Party of Australia New South Wales Division
McLUCAS, Helen -
OK, Sang Liberal Party of Australia New South Wales Division
SOULOS, Andrew -
VACCARI, Gulian Liberal Party of Australia New South Wales Division
For full details of results see website –
www.pastvtr.elections.nsw.gov.au/LGE2012/strathfield-municipal-council.html
For a breakdown of voting by Vote Type (Ordinary, Declared Institution/Pre-poll,
Postal, Provisional/Silent) see the Councillor Election page of the above website, on
the Final Results tab select 04 - Enrolment and Voting by Aggregated Vote Type
Report.
Poll
"Do you support Strathfield Municipal Council changing its name to Strathfield City
Council?"
Yes 10,784
No 5,755
Enrolment
Total Electors 21,360
Residential roll 21,355
Non-residential roll 5
SmartRolled Electors 2,243
(30/7/11 – 30/7/12)

REPORT ON THE 2012 LOCAL GOVERNMENT ELECTIONS
Strathfield Municipal Council
600
Participation and Informality
Participation rate 83.1%
Formal votes 16,504
Informal votes 1,255
Total votes 17,759
Informality rate 7.1%
Failure to Vote
Penalty Notices Issued 2,433
Rate of Failure to Vote103 11.5%
Election Costs
Total Cost of the Strathfield Municipal Council 2012 Election
$149,028.00
Cost per elector
$7.02
Strathfield Municipal Council Statutory Advertising Campaign Expenditure
Nominations $1,427.28
Candidates and polling places $1,284.00
Uncontested elections $0.00
Results $642.00
TOTAL $3,353.28
Election Services
Elector Enquiry Centre
The Elector Enquiry Centre answered 509 calls from postcodes within Strathfield
Municipal Council area.
NSWEC Website
There were 3,267 unique visitors to Strathfield Municipal Council election web page.
Braille Ballot Papers
No braille ballot papers were requested or printed.
103 Percentage of Penalty Notices Issued to Enrolment (as shown on Authorised Roll)

REPORT ON THE 2012 LOCAL GOVERNMENT ELECTIONS
Strathfield Municipal Council
601
Returning Officer
John Neely
Returning Officer’s Office
Burwood Region Returning Officer's Office
Burwood Council Chambers
1-17 Elsie Street
Burwood NSW 2134
Councils in Region
Ashfield Council, Burwood Council and Strathfield Municipal Council
Staffing
Office Manager 1
Senior Office Assistant 0
Office Assistants 0
Polling Place Managers 10
Polling Place Assistants 0
Deputy Polling Place Managers 6
Declaration Vote Issuing Officer 5
Election Officials 43
Council Count Manager 0
Part Day Election Officials 5
Total Staff 70
Polling Places
Pre-poll Centres 3
Declared Institutions 2
Election day Polling Places 11
Pre-poll centre locations
Burwood Region Returning Officer's Office, Strathfield Pre-Poll, Sydney Town Hall
Polling place locations
For 2012 map and polling places see –
www.pastvtr.elections.nsw.gov.au/LGE2012/strathfield-municipal-council.html

REPORT ON THE 2012 LOCAL GOVERNMENT ELECTIONS
Strathfield Municipal Council
602
Advertising
Statutory Campaign
The Council requested that the statutory advertisements be placed in the following
press:
Inner Western Courier
Inner West Weekly
Candidates
Nominations withdrawn
No Councillor nominations were withdrawn.
Councillor Candidates
Total Candidates 33
Female Candidates 16
Male Candidates 17
Names of all candidates
Councillor Candidates Party Affiliation
ANANDAN, Victor -
BARRON, Paul -
BHANDULA, Rajiv Liberal Party of Australia New South Wales Division
BOTT, Daniel Australian Labor Party (NSW Branch)
CAI, Benjamin Australian Labor Party (NSW Branch)
CAI, Xiaobing Unity Party
CARNEY, Mira Liberal Party of Australia New South Wales Division
CHEUNG, Jennifer -
CREMATY, Edward -
DATTA, Raj Australian Labor Party (NSW Branch)
DEVATHI, Krishna -
DORAN, Marlene -
DUONG, Krystal Unity Party
EDWARDS, Anna -
FORD, Dale -
GAUGHAN, Nella -
HAVEA, Phillip -
HEIDARI, Sakineh Australian Labor Party (NSW Branch)
KIM, Thomas Unity Party
KOKKOLIS, Stephanie Liberal Party of Australia New South Wales Division
KREBS, John -
LEUNG, Pinkie Unity Party
McLUCAS, Helen -
OK, Sang Liberal Party of Australia New South Wales Division
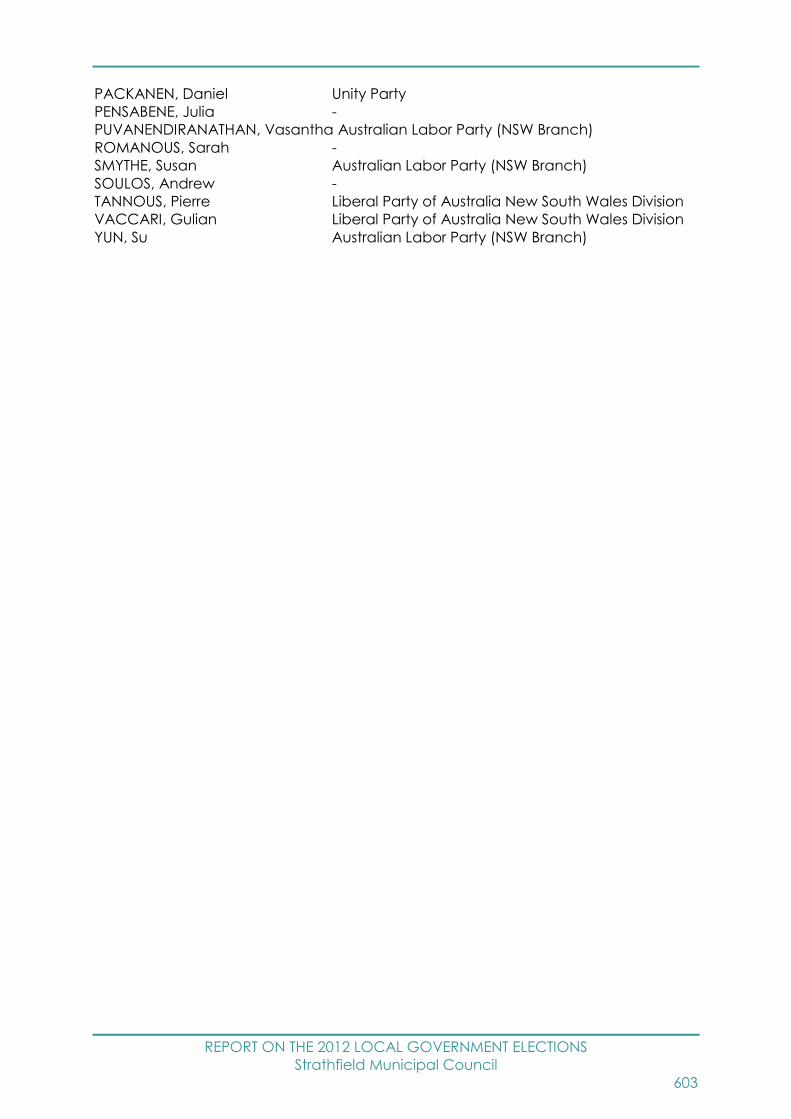
REPORT ON THE 2012 LOCAL GOVERNMENT ELECTIONS
Strathfield Municipal Council
603
PACKANEN, Daniel Unity Party
PENSABENE, Julia -
PUVANENDIRANATHAN, Vasantha Australian Labor Party (NSW Branch)
ROMANOUS, Sarah -
SMYTHE, Susan Australian Labor Party (NSW Branch)
SOULOS, Andrew -
TANNOUS, Pierre Liberal Party of Australia New South Wales Division
VACCARI, Gulian Liberal Party of Australia New South Wales Division
YUN, Su Australian Labor Party (NSW Branch)
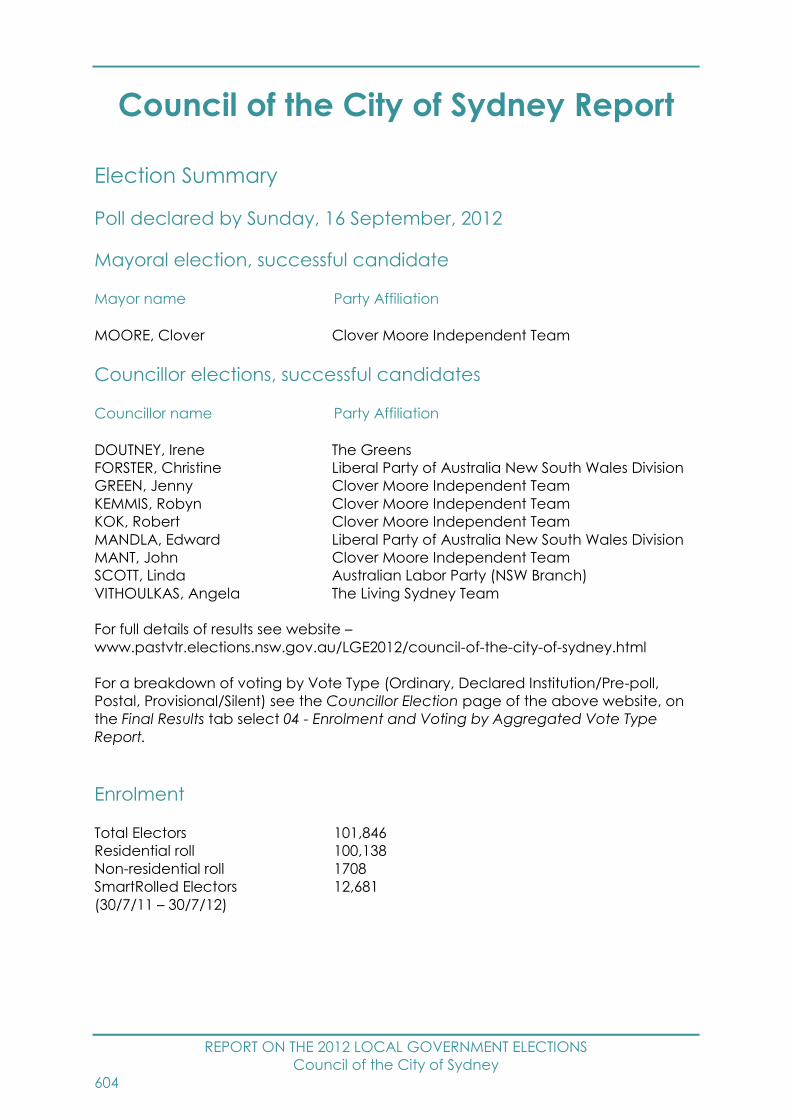
REPORT ON THE 2012 LOCAL GOVERNMENT ELECTIONS
Council of the City of Sydney
604
Council of the City of Sydney Report
Election Summary
Poll declared by Sunday, 16 September, 2012
Mayoral election, successful candidate
Mayor name Party Affiliation
MOORE, Clover Clover Moore Independent Team
Councillor elections, successful candidates
Councillor name Party Affiliation
DOUTNEY, Irene The Greens
FORSTER, Christine Liberal Party of Australia New South Wales Division
GREEN, Jenny Clover Moore Independent Team
KEMMIS, Robyn Clover Moore Independent Team
KOK, Robert Clover Moore Independent Team
MANDLA, Edward Liberal Party of Australia New South Wales Division
MANT, John Clover Moore Independent Team
SCOTT, Linda Australian Labor Party (NSW Branch)
VITHOULKAS, Angela The Living Sydney Team
For full details of results see website –
www.pastvtr.elections.nsw.gov.au/LGE2012/council-of-the-city-of-sydney.html
For a breakdown of voting by Vote Type (Ordinary, Declared Institution/Pre-poll,
Postal, Provisional/Silent) see the Councillor Election page of the above website, on
the Final Results tab select 04 - Enrolment and Voting by Aggregated Vote Type
Report.
Enrolment
Total Electors 101,846
Residential roll 100,138
Non-residential roll 1708
SmartRolled Electors 12,681
(30/7/11 – 30/7/12)

REPORT ON THE 2012 LOCAL GOVERNMENT ELECTIONS
Council of the City of Sydney
605
Participation and Informality
Participation rate 69.1%
Formal votes 65,981
Informal votes 4,374
Total votes 70,355
Informality rate 6.2%
Failure to Vote
Penalty Notices Issued 25,841
Rate of Failure to Vote104 25.5%
Election Costs
Total Cost of the Council of the City of Sydney 2012 Election
$708,833.00
Cost per elector
$6.99
Council of the City of Sydney Statutory Advertising Campaign Expenditure
Nominations $24,224.60
Candidates and polling places $88,048.30
Uncontested elections $0.00
Results $8,433.80
TOTAL $120,706.70
Election Services
Elector Enquiry Centre
The Elector Enquiry Centre answered 3,705 calls from postcodes within Council of the
City of Sydney area.
NSWEC Website
There were 15,192 unique visitors to Council of the City of Sydney election web page.
Braille Ballot Papers
Two braille ballot papers were requested or printed.
104 Percentage of Penalty Notices Issued to Enrolment (as shown on Authorised Roll)

REPORT ON THE 2012 LOCAL GOVERNMENT ELECTIONS
Council of the City of Sydney
606
Returning Officer
Colin McNaught
Returning Officer’s Office
Sydney Returning Officer's Office
Level 1, 309 Pitt Street
Sydney NSW 2000
Staffing
Office Manager 1
Senior Office Assistant 0
Office Assistants 100
Polling Place Managers 39
Polling Place Assistants 12
Deputy Polling Place Managers 19
Declaration Vote Issuing Officer 31
Election Officials 189
Council Count Manager 21
Part Day Election Officials 19
Total Staff 431
Polling Places
Pre-poll Centres 4
Declared Institutions 7
Election day Polling Places 39
Pre-poll centre locations
Glebe Pre-Poll, Redfern Pre-Poll, Sydney Returning Officer's Office, Sydney Town Hall
Polling place locations
For 2012 map and polling places see –
www.pastvtr.elections.nsw.gov.au/LGE2012/council-of-the-city-of-sydney.html
Advertising
Statutory Campaign
The Council requested that the statutory advertisements be placed in the following
press:
Sydney Morning Herald
Inner West Courier
Sydney Star Observer
Sydney Central Courier
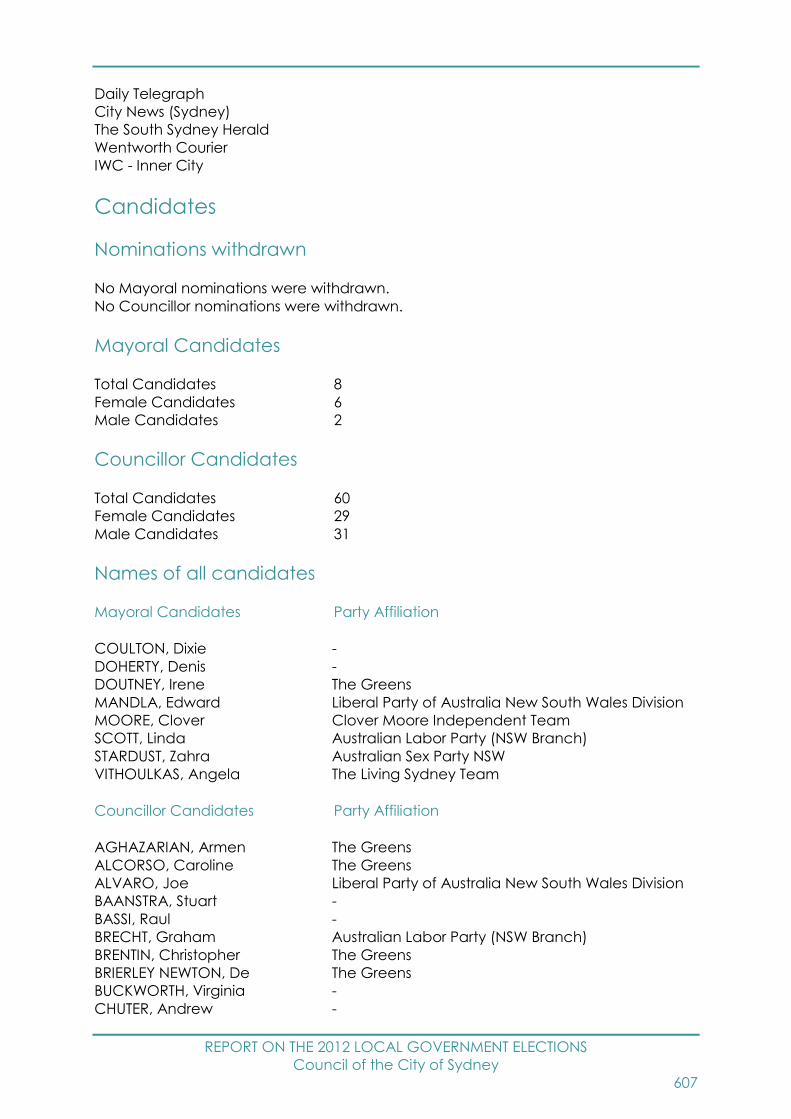
REPORT ON THE 2012 LOCAL GOVERNMENT ELECTIONS
Council of the City of Sydney
607
Daily Telegraph
City News (Sydney)
The South Sydney Herald
Wentworth Courier
IWC - Inner City
Candidates
Nominations withdrawn
No Mayoral nominations were withdrawn.
No Councillor nominations were withdrawn.
Mayoral Candidates
Total Candidates 8
Female Candidates 6
Male Candidates 2
Councillor Candidates
Total Candidates 60
Female Candidates 29
Male Candidates 31
Names of all candidates
Mayoral Candidates Party Affiliation
COULTON, Dixie -
DOHERTY, Denis -
DOUTNEY, Irene The Greens
MANDLA, Edward Liberal Party of Australia New South Wales Division
MOORE, Clover Clover Moore Independent Team
SCOTT, Linda Australian Labor Party (NSW Branch)
STARDUST, Zahra Australian Sex Party NSW
VITHOULKAS, Angela The Living Sydney Team
Councillor Candidates Party Affiliation
AGHAZARIAN, Armen The Greens
ALCORSO, Caroline The Greens
ALVARO, Joe Liberal Party of Australia New South Wales Division
BAANSTRA, Stuart -
BASSI, Raul -
BRECHT, Graham Australian Labor Party (NSW Branch)
BRENTIN, Christopher The Greens
BRIERLEY NEWTON, De The Greens
BUCKWORTH, Virginia -
CHUTER, Andrew -

REPORT ON THE 2012 LOCAL GOVERNMENT ELECTIONS
Council of the City of Sydney
608
COULTON, Dixie -
DEAUNA, Roman The Greens
DOHERTY, Denis -
DOUTNEY, Irene The Greens
DUCKMANTON, Andrew The Living Sydney Team
DUNNE, Graeme Australian Sex Party NSW
ERIKSEN, Tony Liberal Party of Australia New South Wales Division
FENWICK, Lisa Liberal Party of Australia New South Wales Division
FLETCHER, Jay -
FORSTER, Christine Liberal Party of Australia New South Wales Division
FORTESCUE, Robyn Australian Labor Party (NSW Branch)
GOLDSWORTHY, Rebecca -
GREEN, Jenny Clover Moore Independent Team
GREENWICH, Alex Clover Moore Independent Team
GYORY, Stephan The Living Sydney Team
HALL, Robbie -
HARVIE, Margaret The Living Sydney Team
HOLDER, Jo Australian Labor Party (NSW Branch)
HUTCHINSON, John Clover Moore Independent Team
JACKSON, Ray -
KEMMIS, Robyn Clover Moore Independent Team
KOK, Robert Clover Moore Independent Team
LAU, Rebecca Liberal Party of Australia New South Wales Division
LOVEKIN, Gregory Australian Labor Party (NSW Branch)
LYON, Collin Australian Labor Party (NSW Branch)
MALE, Andrew -
MANDLA, Edward Liberal Party of Australia New South Wales Division
MANT, John Clover Moore Independent Team
MARSDEN, Fabian The Living Sydney Team
McINTOSH, Claudia Clover Moore Independent Team
McINTOSH, Isabel The Greens
McNALLY, Peter Australian Labor Party (NSW Branch)
MOORE, Clover Clover Moore Independent Team
MORTLOCK, Hilary Australian Labor Party (NSW Branch)
O'CONNOR, Sean Liberal Party of Australia New South Wales Division
PANUCCIO, Maddalen -
PATTERSON, Andrew Australian Sex Party NSW
SCHOFIELD, Nell Clover Moore Independent Team
SCOTT, Linda Australian Labor Party (NSW Branch)
SMITH, Mark The Greens
SPRUCE, Damian Australian Labor Party (NSW Branch)
STARDUST, Zahra Australian Sex Party NSW
THOMAS, Geoffrey Australian Sex Party NSW
TOBOREK, Dejay The Greens
TRIGG, Robyn Australian Sex Party NSW
TSIRBAS, Angelo The Living Sydney Team
TYRRELL, Jade Australian Labor Party (NSW Branch)
VITHOULKAS, Angela The Living Sydney Team
WANG, Linda The Living Sydney Team
YATES, Jill The Living Sydney Team
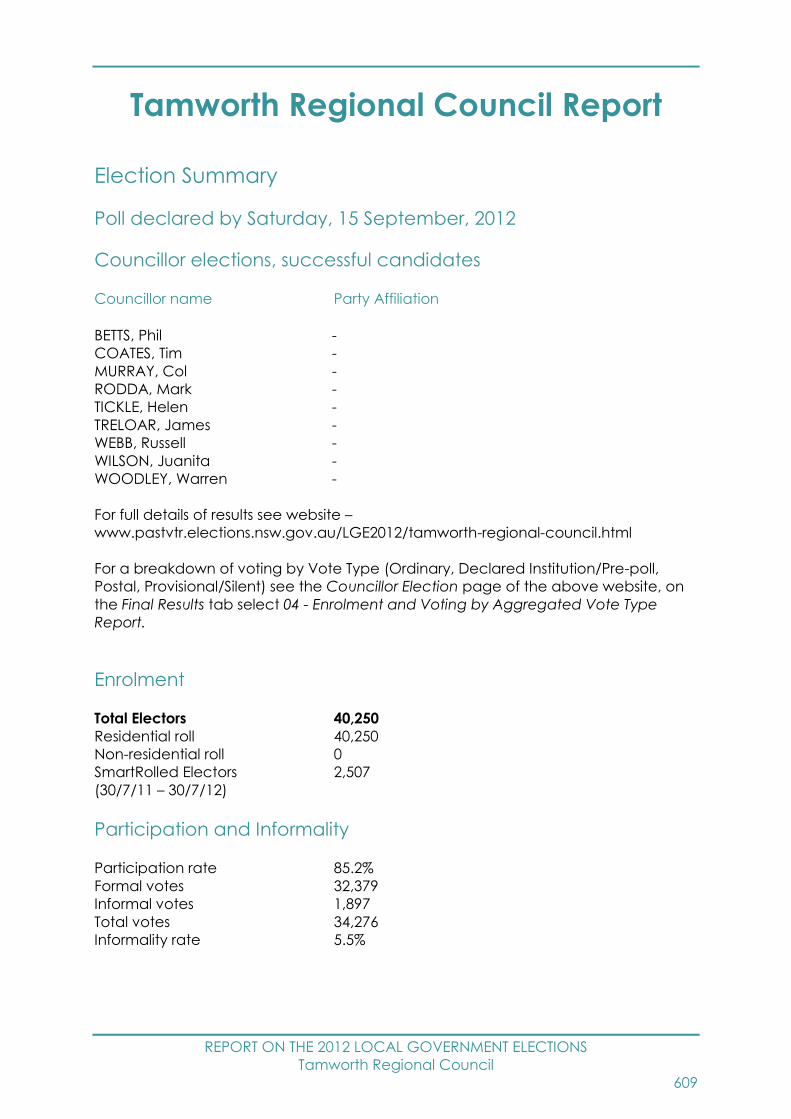
REPORT ON THE 2012 LOCAL GOVERNMENT ELECTIONS
Tamworth Regional Council
609
Tamworth Regional Council Report
Election Summary
Poll declared by Saturday, 15 September, 2012
Councillor elections, successful candidates
Councillor name Party Affiliation
BETTS, Phil -
COATES, Tim -
MURRAY, Col -
RODDA, Mark -
TICKLE, Helen -
TRELOAR, James -
WEBB, Russell -
WILSON, Juanita -
WOODLEY, Warren -
For full details of results see website –
www.pastvtr.elections.nsw.gov.au/LGE2012/tamworth-regional-council.html
For a breakdown of voting by Vote Type (Ordinary, Declared Institution/Pre-poll,
Postal, Provisional/Silent) see the Councillor Election page of the above website, on
the Final Results tab select 04 - Enrolment and Voting by Aggregated Vote Type
Report.
Enrolment
Total Electors 40,250
Residential roll 40,250
Non-residential roll 0
SmartRolled Electors 2,507
(30/7/11 – 30/7/12)
Participation and Informality
Participation rate 85.2%
Formal votes 32,379
Informal votes 1,897
Total votes 34,276
Informality rate 5.5%

REPORT ON THE 2012 LOCAL GOVERNMENT ELECTIONS
Tamworth Regional Council
610
Failure to Vote
Penalty Notices Issued 4,488
Rate of Failure to Vote105 11.2%
Election Costs
Total Cost of the Tamworth Regional Council 2012 Election
$271,450.00
Cost per elector
$6.76
Tamworth Regional Council Statutory Advertising Campaign Expenditure
Nominations $1,948.10
Candidates and polling places $3,519.96
Uncontested elections $0.00
Results $739.20
TOTAL $6,207.26
Election Services
Elector Enquiry Centre
The Elector Enquiry Centre answered 564 calls from postcodes within Tamworth
Regional Council area.
NSWEC Website
There were 3,606 unique visitors to Tamworth Regional Council election web page.
Braille Ballot Papers
No braille ballot papers were requested or printed.
Returning Officer
Karen Barany
105 Percentage of Penalty Notices Issued to Enrolment (as shown on Authorised Roll)
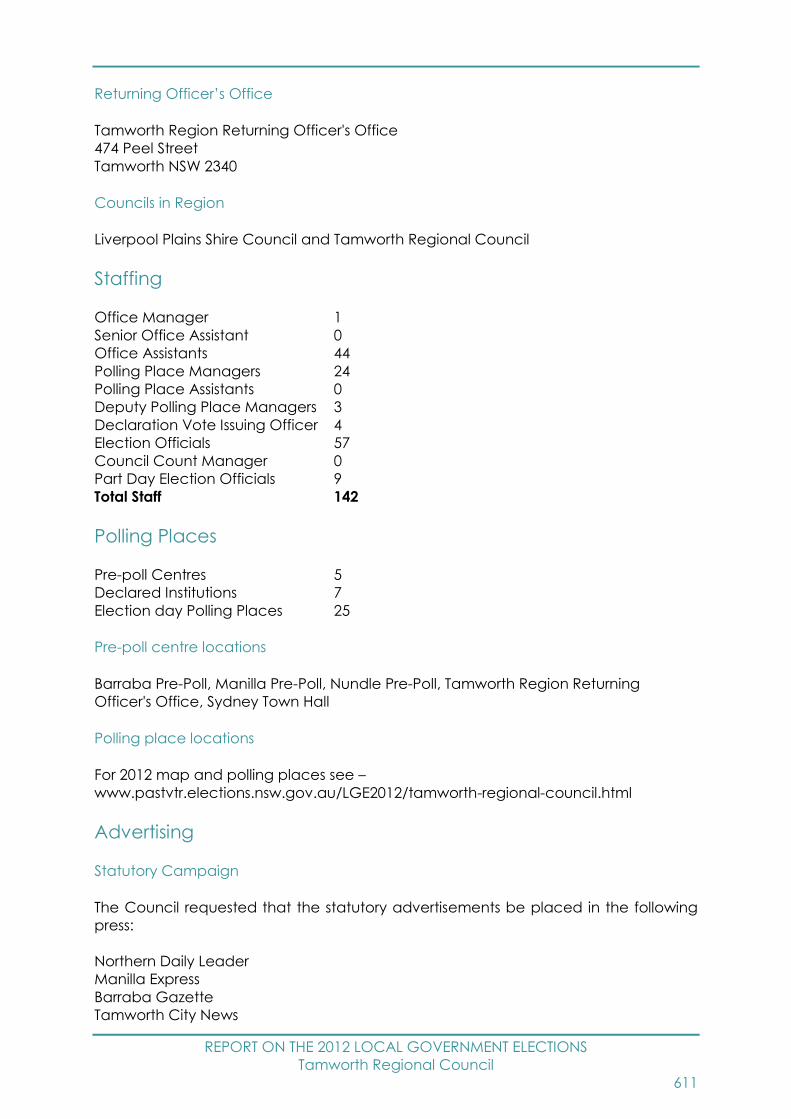
REPORT ON THE 2012 LOCAL GOVERNMENT ELECTIONS
Tamworth Regional Council
611
Returning Officer’s Office
Tamworth Region Returning Officer's Office
474 Peel Street
Tamworth NSW 2340
Councils in Region
Liverpool Plains Shire Council and Tamworth Regional Council
Staffing
Office Manager 1
Senior Office Assistant 0
Office Assistants 44
Polling Place Managers 24
Polling Place Assistants 0
Deputy Polling Place Managers 3
Declaration Vote Issuing Officer 4
Election Officials 57
Council Count Manager 0
Part Day Election Officials 9
Total Staff 142
Polling Places
Pre-poll Centres 5
Declared Institutions 7
Election day Polling Places 25
Pre-poll centre locations
Barraba Pre-Poll, Manilla Pre-Poll, Nundle Pre-Poll, Tamworth Region Returning
Officer's Office, Sydney Town Hall
Polling place locations
For 2012 map and polling places see –
www.pastvtr.elections.nsw.gov.au/LGE2012/tamworth-regional-council.html
Advertising
Statutory Campaign
The Council requested that the statutory advertisements be placed in the following
press:
Northern Daily Leader
Manilla Express
Barraba Gazette
Tamworth City News

REPORT ON THE 2012 LOCAL GOVERNMENT ELECTIONS
Tamworth Regional Council
612
Candidates
Nominations withdrawn
No Councillor nominations were withdrawn.
Councillor Candidates
Total Candidates 17
Female Candidates 4
Male Candidates 13
Names of all candidates
Councillor Candidates Party Affiliation
ALLAN, Sandy -
BALLARD, Danny -
BETTS, Phil -
BIFFIN, Barry -
CHILLINGWORTH, Gary -
COATES, Tim -
DURANT, Paul -
EDMUNDS, Judith -
MURRAY, Col -
RODDA, Mark -
SHERWOOD, Kimberley -
TAIT, Ray -
TICKLE, Helen -
TRELOAR, James -
WEBB, Russell -
WILSON, Juanita -
WOODLEY, Warren -

REPORT ON THE 2012 LOCAL GOVERNMENT ELECTIONS
Temora Shire Council
613
Temora Shire Council Report
Election Summary
Poll declared by Saturday, 15 September, 2012
Councillor elections, successful candidates
Councillor name Party Affiliation
COATES, Graham -
FIRMAN, Rick -
JUDD, Nigel -
OLIVER, Max -
SCHLIEBS, Rachael -
SINCLAIR, Graham -
SLEIGH, Dennis -
SMITH, Ken -
SPEIRS, Peter -
For full details of results see website –
www.pastvtr.elections.nsw.gov.au/LGE2012/temora-shire-council.html
For a breakdown of voting by Vote Type (Ordinary, Declared Institution/Pre-poll,
Postal, Provisional/Silent) see the Councillor Election page of the above website, on
the Final Results tab select 04 - Enrolment and Voting by Aggregated Vote Type
Report.
Enrolment
Total Electors 4,460
Residential roll 4,453
Non-residential roll 7
SmartRolled Electors 222
(30/7/11 – 30/7/12)
Participation and Informality
Participation rate 87.8%
Formal votes 3,820
Informal votes 94
Total votes 3,914
Informality rate 2.4%

REPORT ON THE 2012 LOCAL GOVERNMENT ELECTIONS
Temora Shire Council
614
Failure to Vote
Penalty Notices Issued 369
Rate of Failure to Vote106 8.3%
Election Costs
Total Cost of the Temora Shire Council 2012 Election
$35,428.00
Cost per elector
$7.97
Temora Shire Council Statutory Advertising Campaign Expenditure
Nominations $351.52
Candidates and polling places $1,190.40
Uncontested elections $0.00
Results $93.46
TOTAL $1,635.38
Election Services
Elector Enquiry Centre
The Elector Enquiry Centre answered 30 calls from postcodes within Temora Shire
Council area.
NSWEC Website
There were 509 unique visitors to Temora Shire Council election web page.
Braille Ballot Papers
No braille ballot papers were requested or printed.
Returning Officer
Alan Salmon
106 Percentage of Penalty Notices Issued to Enrolment (as shown on Authorised Roll)
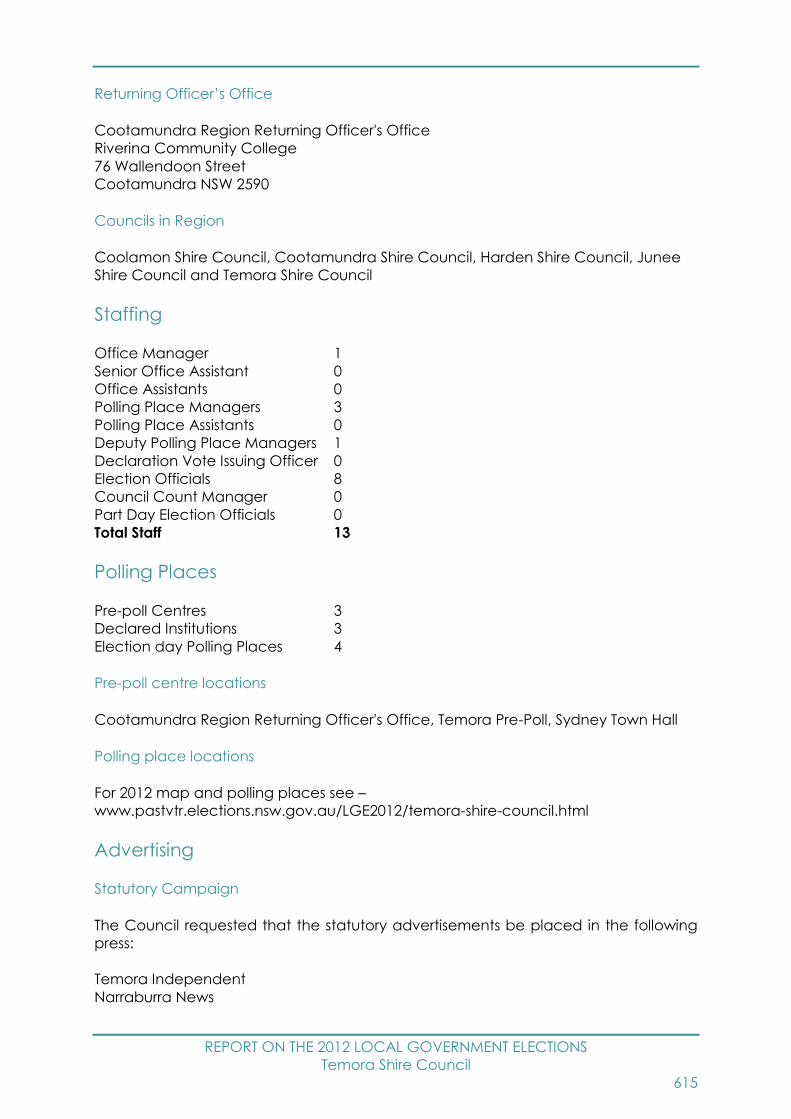
REPORT ON THE 2012 LOCAL GOVERNMENT ELECTIONS
Temora Shire Council
615
Returning Officer’s Office
Cootamundra Region Returning Officer's Office
Riverina Community College
76 Wallendoon Street
Cootamundra NSW 2590
Councils in Region
Coolamon Shire Council, Cootamundra Shire Council, Harden Shire Council, Junee
Shire Council and Temora Shire Council
Staffing
Office Manager 1
Senior Office Assistant 0
Office Assistants 0
Polling Place Managers 3
Polling Place Assistants 0
Deputy Polling Place Managers 1
Declaration Vote Issuing Officer 0
Election Officials 8
Council Count Manager 0
Part Day Election Officials 0
Total Staff 13
Polling Places
Pre-poll Centres 3
Declared Institutions 3
Election day Polling Places 4
Pre-poll centre locations
Cootamundra Region Returning Officer's Office, Temora Pre-Poll, Sydney Town Hall
Polling place locations
For 2012 map and polling places see –
www.pastvtr.elections.nsw.gov.au/LGE2012/temora-shire-council.html
Advertising
Statutory Campaign
The Council requested that the statutory advertisements be placed in the following
press:
Temora Independent
Narraburra News

REPORT ON THE 2012 LOCAL GOVERNMENT ELECTIONS
Temora Shire Council
616
Candidates
Nominations withdrawn
No Councillor nominations were withdrawn.
Councillor Candidates
Total Candidates 14
Female Candidates 3
Male Candidates 11
Names of all candidates
Councillor Candidates Party Affiliation
ANTHONY, Michael -
BROAD, Irene -
BRYANT, Rex -
COATES, Graham -
FIRMAN, Rick -
JUDD, Nigel -
OLIVER, Max -
SCHLIEBS, Rachael -
SHARROCK, Mary-Anne -
SINCLAIR, Graham -
SLEIGH, Dennis -
SMITH, Ken -
SPEIRS, Peter -
STORM, Tony -
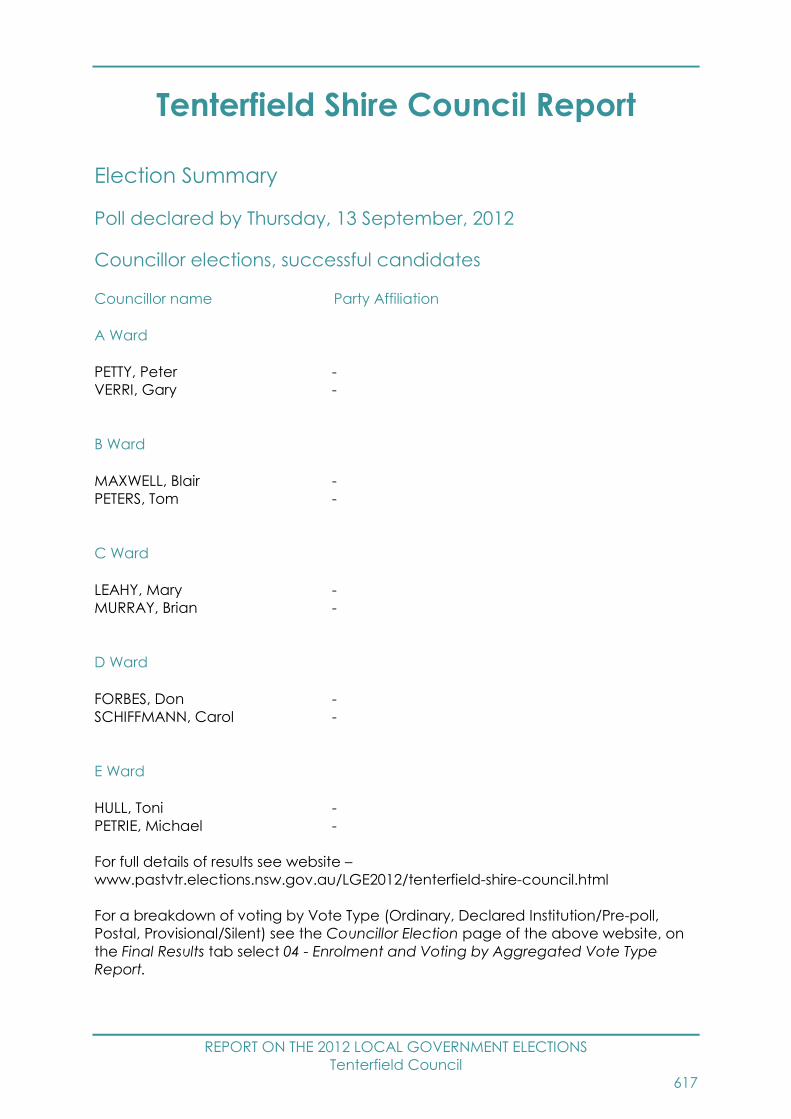
REPORT ON THE 2012 LOCAL GOVERNMENT ELECTIONS
Tenterfield Council
617
Tenterfield Shire Council Report
Election Summary
Poll declared by Thursday, 13 September, 2012
Councillor elections, successful candidates
Councillor name Party Affiliation
A Ward
PETTY, Peter -
VERRI, Gary -
B Ward
MAXWELL, Blair -
PETERS, Tom -
C Ward
LEAHY, Mary -
MURRAY, Brian -
D Ward
FORBES, Don -
SCHIFFMANN, Carol -
E Ward
HULL, Toni -
PETRIE, Michael -
For full details of results see website –
www.pastvtr.elections.nsw.gov.au/LGE2012/tenterfield-shire-council.html
For a breakdown of voting by Vote Type (Ordinary, Declared Institution/Pre-poll,
Postal, Provisional/Silent) see the Councillor Election page of the above website, on
the Final Results tab select 04 - Enrolment and Voting by Aggregated Vote Type
Report.
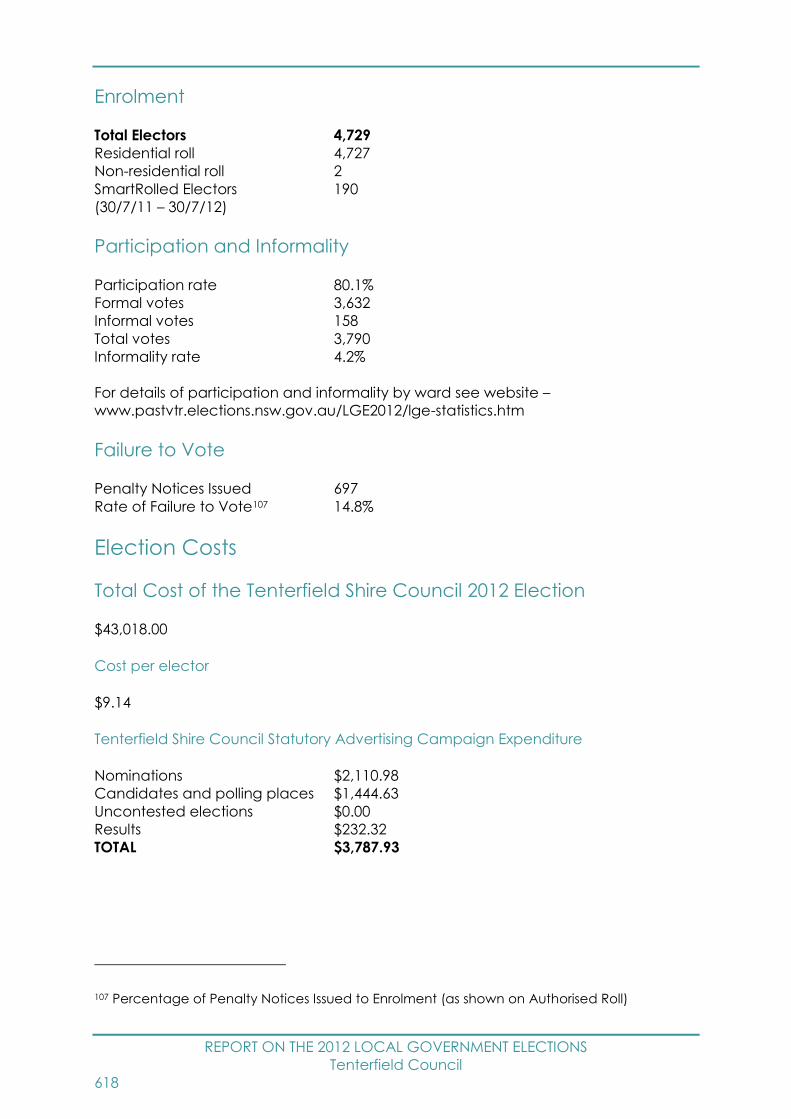
REPORT ON THE 2012 LOCAL GOVERNMENT ELECTIONS
Tenterfield Council
618
Enrolment
Total Electors 4,729
Residential roll 4,727
Non-residential roll 2
SmartRolled Electors 190
(30/7/11 – 30/7/12)
Participation and Informality
Participation rate 80.1%
Formal votes 3,632
Informal votes 158
Total votes 3,790
Informality rate 4.2%
For details of participation and informality by ward see website –
www.pastvtr.elections.nsw.gov.au/LGE2012/lge-statistics.htm
Failure to Vote
Penalty Notices Issued 697
Rate of Failure to Vote107 14.8%
Election Costs
Total Cost of the Tenterfield Shire Council 2012 Election
$43,018.00
Cost per elector
$9.14
Tenterfield Shire Council Statutory Advertising Campaign Expenditure
Nominations $2,110.98
Candidates and polling places $1,444.63
Uncontested elections $0.00
Results $232.32
TOTAL $3,787.93
107 Percentage of Penalty Notices Issued to Enrolment (as shown on Authorised Roll)
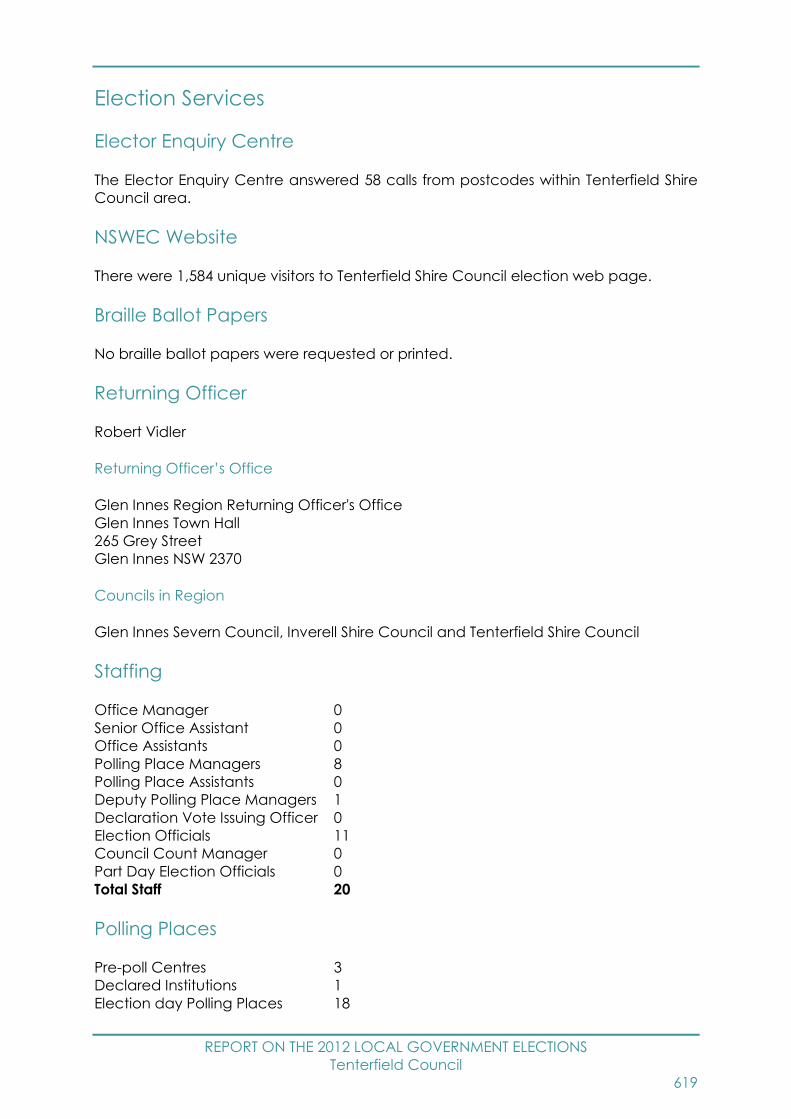
REPORT ON THE 2012 LOCAL GOVERNMENT ELECTIONS
Tenterfield Council
619
Election Services
Elector Enquiry Centre
The Elector Enquiry Centre answered 58 calls from postcodes within Tenterfield Shire
Council area.
NSWEC Website
There were 1,584 unique visitors to Tenterfield Shire Council election web page.
Braille Ballot Papers
No braille ballot papers were requested or printed.
Returning Officer
Robert Vidler
Returning Officer’s Office
Glen Innes Region Returning Officer's Office
Glen Innes Town Hall
265 Grey Street
Glen Innes NSW 2370
Councils in Region
Glen Innes Severn Council, Inverell Shire Council and Tenterfield Shire Council
Staffing
Office Manager 0
Senior Office Assistant 0
Office Assistants 0
Polling Place Managers 8
Polling Place Assistants 0
Deputy Polling Place Managers 1
Declaration Vote Issuing Officer 0
Election Officials 11
Council Count Manager 0
Part Day Election Officials 0
Total Staff 20
Polling Places
Pre-poll Centres 3
Declared Institutions 1
Election day Polling Places 18

REPORT ON THE 2012 LOCAL GOVERNMENT ELECTIONS
Tenterfield Council
620
Pre-poll centre locations
Glen Innes Region Returning Officer's Office, Tenterfield Pre-Poll, Sydney Town Hall
Polling place locations
For 2012 map and polling places see –
www.pastvtr.elections.nsw.gov.au/LGE2012/tenterfield-shire-council.html
Advertising
Statutory Campaign
The Council requested that the statutory advertisements be placed in the following
press:
Southern Free Times
Tenterfield Star
Northern Star
Candidates
Nominations withdrawn
No Councillor nominations were withdrawn.
Councillor Candidates
Total Candidates 21
Female Candidates 7
Male Candidates 14
A Ward Councillor Candidates
Total Candidates 4
Female Candidates 1
Male Candidates 3
B Ward Councillor Candidates
Total Candidates 5
Female Candidates 0
Male Candidates 5
C Ward Councillor Candidates
Total Candidates 3
Female Candidates 1
Male Candidates 2

REPORT ON THE 2012 LOCAL GOVERNMENT ELECTIONS
Tenterfield Council
621
D Ward Councillor Candidates
Total Candidates 4
Female Candidates 1
Male Candidates 3
E Ward Councillor Candidates
Total Candidates 5
Female Candidates 4
Male Candidates 1
Names of all candidates
Councillor Candidates Party Affiliation
A Ward
HORNEMAN, Alan -
I'ONS, Jane -
PETTY, Peter -
VERRI, Gary -
B Ward
FOAN, Graham -
LAVENDER, Clifford -
MACNISH, John -
MAXWELL, Blair -
PETERS, Tom -
C Ward
LEAHY, Mary -
MURRAY, Brian -
SOUTH, Bob -
D Ward
FORBES, Don -
HARMOND, Peter -
SCHIFFMANN, Carol -
WEST, Lawrie -
E Ward
BANCROFT-STUART, Roxanne -
HENNESSY, Kym-Maree -
HULL, Toni -
PETRIE, Michael -
VIRTUE, Julie -

REPORT ON THE 2012 LOCAL GOVERNMENT ELECTIONS
The Hills Shire Council
622
The Hills Shire Council Report
Election Summary
Poll declared by Monday, 17 September, 2012
Councillor elections, successful candidates
Councillor name Party Affiliation
Central Ward
HAY, Tony Australian Labor Party (NSW Branch)
KEANE, Yvonne Liberal Party of Australia New South Wales Division
LOWE, Jeff Liberal Party of Australia New South Wales Division
East Ward
HASELDEN, Alan Liberal Party of Australia New South Wales Division
JEFFERIES, Andrew Liberal Party of Australia New South Wales Division
TRACEY, Ryan Australian Labor Party (NSW Branch)
North Ward
GANGEMI, Peter Liberal Party of Australia New South Wales Division
PRESTON, Robyn Liberal Party of Australia New South Wales Division
TAYLOR, Mark Liberal Party of Australia New South Wales Division
West Ward
BYRNE, Michelle Liberal Party of Australia New South Wales Division
HARTY, Raymond Australian Labor Party (NSW Branch)
THOMAS, Mike Liberal Party of Australia New South Wales Division
For full details of results see website –
www.pastvtr.elections.nsw.gov.au/LGE2012/the-hills-shire-council.html
For a breakdown of voting by Vote Type (Ordinary, Declared Institution/Pre-poll,
Postal, Provisional/Silent) see the Councillor Election page of the above website, on
the Final Results tab select 04 - Enrolment and Voting by Aggregated Vote Type
Report.
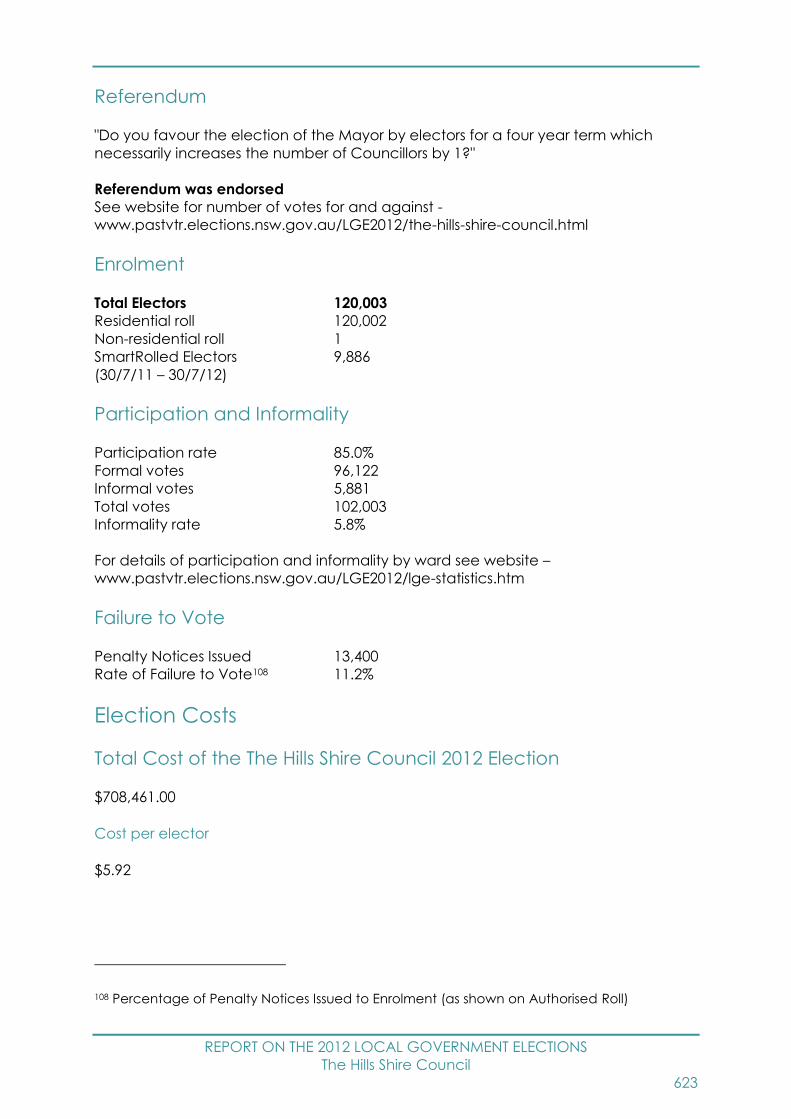
REPORT ON THE 2012 LOCAL GOVERNMENT ELECTIONS
The Hills Shire Council
623
Referendum
"Do you favour the election of the Mayor by electors for a four year term which
necessarily increases the number of Councillors by 1?"
Referendum was endorsed
See website for number of votes for and against -
www.pastvtr.elections.nsw.gov.au/LGE2012/the-hills-shire-council.html
Enrolment
Total Electors 120,003
Residential roll 120,002
Non-residential roll 1
SmartRolled Electors 9,886
(30/7/11 – 30/7/12)
Participation and Informality
Participation rate 85.0%
Formal votes 96,122
Informal votes 5,881
Total votes 102,003
Informality rate 5.8%
For details of participation and informality by ward see website –
www.pastvtr.elections.nsw.gov.au/LGE2012/lge-statistics.htm
Failure to Vote
Penalty Notices Issued 13,400
Rate of Failure to Vote108 11.2%
Election Costs
Total Cost of the The Hills Shire Council 2012 Election
$708,461.00
Cost per elector
$5.92
108 Percentage of Penalty Notices Issued to Enrolment (as shown on Authorised Roll)
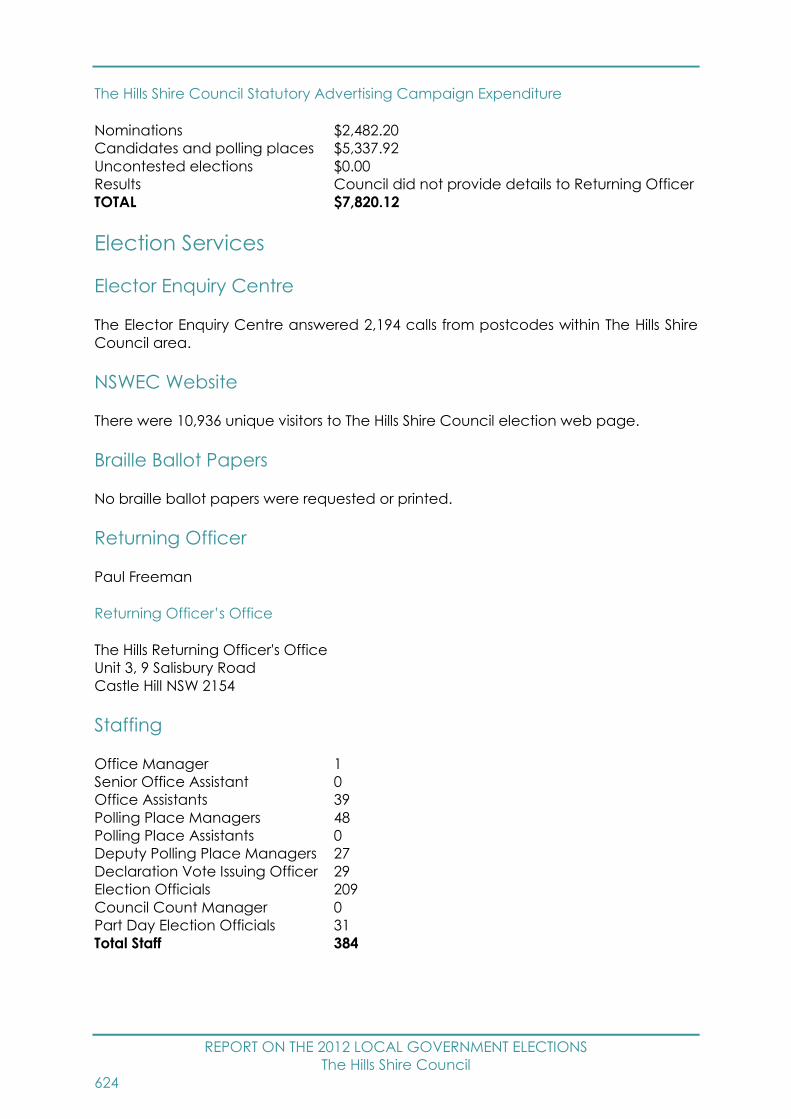
REPORT ON THE 2012 LOCAL GOVERNMENT ELECTIONS
The Hills Shire Council
624
The Hills Shire Council Statutory Advertising Campaign Expenditure
Nominations $2,482.20
Candidates and polling places $5,337.92
Uncontested elections $0.00
Results Council did not provide details to Returning Officer
TOTAL $7,820.12
Election Services
Elector Enquiry Centre
The Elector Enquiry Centre answered 2,194 calls from postcodes within The Hills Shire
Council area.
NSWEC Website
There were 10,936 unique visitors to The Hills Shire Council election web page.
Braille Ballot Papers
No braille ballot papers were requested or printed.
Returning Officer
Paul Freeman
Returning Officer’s Office
The Hills Returning Officer's Office
Unit 3, 9 Salisbury Road
Castle Hill NSW 2154
Staffing
Office Manager 1
Senior Office Assistant 0
Office Assistants 39
Polling Place Managers 48
Polling Place Assistants 0
Deputy Polling Place Managers 27
Declaration Vote Issuing Officer 29
Election Officials 209
Council Count Manager 0
Part Day Election Officials 31
Total Staff 384
REPORT ON THE 2012 LOCAL GOVERNMENT ELECTIONS
The Hills Shire Council
625
Polling Places
Pre-poll Centres 3
Declared Institutions 2
Election day Polling Places 64
Pre-poll centre locations
Castle Hill Pre-poll, The Hills Returning Officer's Office, Sydney Town Hall
Polling place locations
For 2012 map and polling places see –
www.pastvtr.elections.nsw.gov.au/LGE2012/the-hills-shire-council.html
Advertising
Statutory Campaign
The Council requested that the statutory advertisements be placed in the following
press:
Hills News
Rouse Hill & Stanhope Gardens News
Hills Shire Times
Rouse Hill Times
Candidates
Nominations withdrawn
No Councillor nominations were withdrawn.
Councillor Candidates
Total Candidates 46
Female Candidates 13
Male Candidates 33
Central Ward Councillor Candidates
Total Candidates 11
Female Candidates 2
Male Candidates 9
East Ward Councillor Candidates
Total Candidates 9
Female Candidates 3
Male Candidates 6
REPORT ON THE 2012 LOCAL GOVERNMENT ELECTIONS
The Hills Shire Council
626
North Ward Councillor Candidates
Total Candidates 16
Female Candidates 6
Male Candidates 10
West Ward Councillor Candidates
Total Candidates 10
Female Candidates 2
Male Candidates 8
Names of all candidates
Councillor Candidates Party Affiliation
Central Ward
ATKINS, Darryl Australian Labor Party (NSW Branch)
BROWN, Ray Building Australia Party
CRAIG, Geoff Building Australia Party
DIMBROWSKY, Peter -
DUNCAN, Geoff -
EMRICH, Eva Building Australia Party
GIOVAS, George Liberal Party of Australia New South Wales Division
HAY, Tony Australian Labor Party (NSW Branch)
HUDSON, Garry Australian Labor Party (NSW Branch)
KEANE, Yvonne Liberal Party of Australia New South Wales Division
LOWE, Jeff Liberal Party of Australia New South Wales Division
East Ward
BOOTHBY, Jeanette Liberal Party of Australia New South Wales Division
BURNS, Nicole Building Australia Party
CHAN, Carol Australian Labor Party (NSW Branch)
HAN, Paul Australian Labor Party (NSW Branch)
HASELDEN, Alan Liberal Party of Australia New South Wales Division
HENDERSON, Ross Building Australia Party
JEFFERIES, Andrew Liberal Party of Australia New South Wales Division
PIGNAT, Jim Building Australia Party
TRACEY, Ryan Australian Labor Party (NSW Branch)
North Ward
AMJAD, Aisha Australian Labor Party (NSW Branch)
ATKINSON, Monique Australian Labor Party (NSW Branch)
BELLSTEDT, Michael The Greens
BURTON, Barbara Australian Labor Party (NSW Branch)
CUNNINGHAM, Pat -
FRIER, Bob Liberal Democratic Party
GANGEMI, Peter Liberal Party of Australia New South Wales Division

REPORT ON THE 2012 LOCAL GOVERNMENT ELECTIONS
The Hills Shire Council
627
HOWDEN, Jocelyn The Greens
KWONG, Kenneth Liberal Democratic Party
NICKOLS, Graham Liberal Democratic Party
PIGNAT, Reg Building Australia Party
PRESTON, Robyn Liberal Party of Australia New South Wales Division
TAYLOR, Mark Liberal Party of Australia New South Wales Division
VELLENGA, John Building Australia Party
WAKEFIELD, Peter Building Australia Party
WOOLNOUGH, Catherine The Greens
West Ward
BLAIR, Mike Liberal Party of Australia New South Wales Division
BYRNE, Michelle Liberal Party of Australia New South Wales Division
DODD, Catherine Democratic Labor Party
HARTY, Raymond Australian Labor Party (NSW Branch)
MARKS, Steve Australian Labor Party (NSW Branch)
O'DONNELL, Mike Building Australia Party
PORTER, Todd Building Australia Party
SELVARAJ, Immanuel Australian Labor Party (NSW Branch)
THOMAS, Mike Liberal Party of Australia New South Wales Division
WALTER, David Building Australia Party

REPORT ON THE 2012 LOCAL GOVERNMENT ELECTIONS
Tumbarumba Shire Council
628
Tumbarumba Shire Council Report
Election Summary
Poll declared by Thursday, 13 September, 2012
Councillor elections, successful candidates
Councillor name Party Affiliation
A'BECKETT, Tony -
BECKE, Alan -
CHAFFEY, Ian -
FLETCHER, Sue -
GIDDINGS, Julie -
LIVERMORE, Brent -
MARTIN, George -
SHAW, Rodney -
For full details of results see website –
www.pastvtr.elections.nsw.gov.au/LGE2012/tumbarumba-shire-council.html
For a breakdown of voting by Vote Type (Ordinary, Declared Institution/Pre-poll,
Postal, Provisional/Silent) see the Councillor Election page of the above website, on
the Final Results tab select 04 - Enrolment and Voting by Aggregated Vote Type
Report.
Enrolment
Total Electors 2,488
Residential roll 2,469
Non-residential roll 19
SmartRolled Electors 127
(30/7/11 – 30/7/12)
Participation and Informality
Participation rate 78.3%
Formal votes 1,871
Informal votes 76
Total votes 1,947
Informality rate 3.9%
REPORT ON THE 2012 LOCAL GOVERNMENT ELECTIONS
Tumbarumba Shire Council
629
Failure to Vote
Penalty Notices Issued 367
Rate of Failure to Vote109 14.8%
Election Costs
Total Cost of the Tumbarumba Shire Council 2012 Election
$19,482.00
Cost per elector
$7.86
Tumbarumba Shire Council Statutory Advertising Campaign Expenditure
Nominations $497.50
Candidates and polling places $2,004.00
Uncontested elections $0.00
Results $546.00
TOTAL $3,047.50
Election Services
Elector Enquiry Centre
The Elector Enquiry Centre answered 55 calls from postcodes within Tumbarumba
Shire Council area.
NSWEC Website
There were 520 unique visitors to Tumbarumba Shire Council election web page.
Braille Ballot Papers
No braille ballot papers were requested or printed.
Returning Officer
Karen Mills
109 Percentage of Penalty Notices Issued to Enrolment (as shown on Authorised Roll)
REPORT ON THE 2012 LOCAL GOVERNMENT ELECTIONS
Tumbarumba Shire Council
630
Returning Officer’s Office
Albury Region Returning Officer's Office
575 Olive Street
Albury NSW 2640
Councils in Region
Albury City Council, Corowa Shire Council, Greater Hume Shire Council and
Tumbarumba Shire Council
Staffing
Office Manager 1
Senior Office Assistant 0
Office Assistants 0
Polling Place Managers 5
Polling Place Assistants 0
Deputy Polling Place Managers 0
Declaration Vote Issuing Officer 0
Election Officials 6
Council Count Manager 0
Part Day Election Officials 0
Total Staff 12
Polling Places
Pre-poll Centres 3
Declared Institutions 1
Election day Polling Places 6
Pre-poll centre locations
Albury Region Returning Officer's Office, Tumbarumba Pre-Poll, Sydney Town Hall
Polling place locations
For 2012 map and polling places see –
www.pastvtr.elections.nsw.gov.au/LGE2012/tumbarumba-shire-council.html
Advertising
Statutory Campaign
The Council requested that the statutory advertisements be placed in the following
press:
Tumbarumba Times
Khancoban Echo
Corryong Courier

REPORT ON THE 2012 LOCAL GOVERNMENT ELECTIONS
Tumbarumba Shire Council
631
Candidates
Nominations withdrawn
No Councillor nominations were withdrawn.
Councillor Candidates
Total Candidates 11
Female Candidates 2
Male Candidates 9
Names of all candidates
Councillor Candidates Party Affiliation
A'BECKETT, Tony -
BECKE, Alan -
BLYTON, Ron -
CHAFFEY, Ian -
FLETCHER, Sue -
GIDDINGS, Julie -
HALL, Gerry -
LIVERMORE, Brent -
MARTIN, George -
NAGLE, Colin -
SHAW, Rodney -
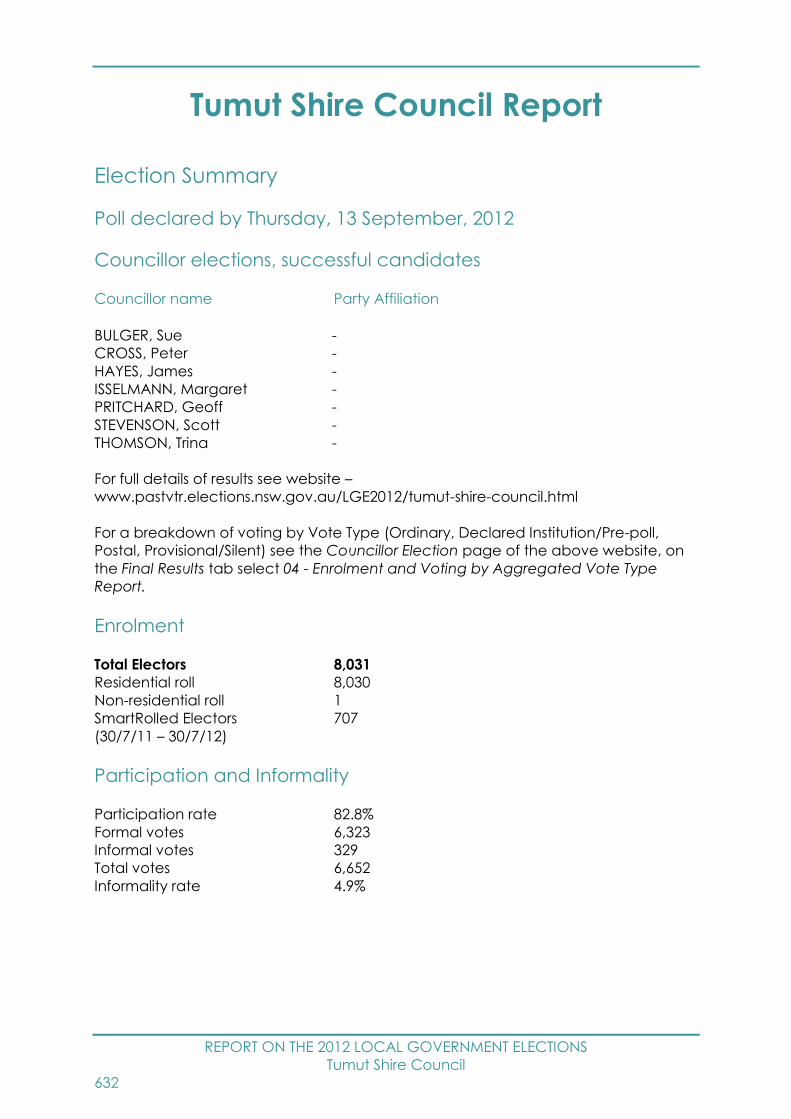
REPORT ON THE 2012 LOCAL GOVERNMENT ELECTIONS
Tumut Shire Council
632
Tumut Shire Council Report
Election Summary
Poll declared by Thursday, 13 September, 2012
Councillor elections, successful candidates
Councillor name Party Affiliation
BULGER, Sue -
CROSS, Peter -
HAYES, James -
ISSELMANN, Margaret -
PRITCHARD, Geoff -
STEVENSON, Scott -
THOMSON, Trina -
For full details of results see website –
www.pastvtr.elections.nsw.gov.au/LGE2012/tumut-shire-council.html
For a breakdown of voting by Vote Type (Ordinary, Declared Institution/Pre-poll,
Postal, Provisional/Silent) see the Councillor Election page of the above website, on
the Final Results tab select 04 - Enrolment and Voting by Aggregated Vote Type
Report.
Enrolment
Total Electors 8,031
Residential roll 8,030
Non-residential roll 1
SmartRolled Electors 707
(30/7/11 – 30/7/12)
Participation and Informality
Participation rate 82.8%
Formal votes 6,323
Informal votes 329
Total votes 6,652
Informality rate 4.9%

REPORT ON THE 2012 LOCAL GOVERNMENT ELECTIONS
Tumut Shire Council
633
Failure to Vote
Penalty Notices Issued 1,175
Rate of Failure to Vote110 14.7%
Election Costs
Total Cost of the Tumut Shire Council 2012 Election
$53,751.00
Cost per elector
$6.71
Tumut Shire Council Statutory Advertising Campaign Expenditure
Nominations $280.50
Candidates and polling places $836.00
Uncontested elections $0.00
Results $330.00
TOTAL $1,446.50
Election Services
Elector Enquiry Centre
The Elector Enquiry Centre answered 123 calls from postcodes within Tumut Shire
Council area.
NSWEC Website
There were 1,133 unique visitors to Tumut Shire Council election web page.
Braille Ballot Papers
No braille ballot papers were requested or printed.
Returning Officer
Barry Shields
110 Percentage of Penalty Notices Issued to Enrolment (as shown on Authorised Roll)
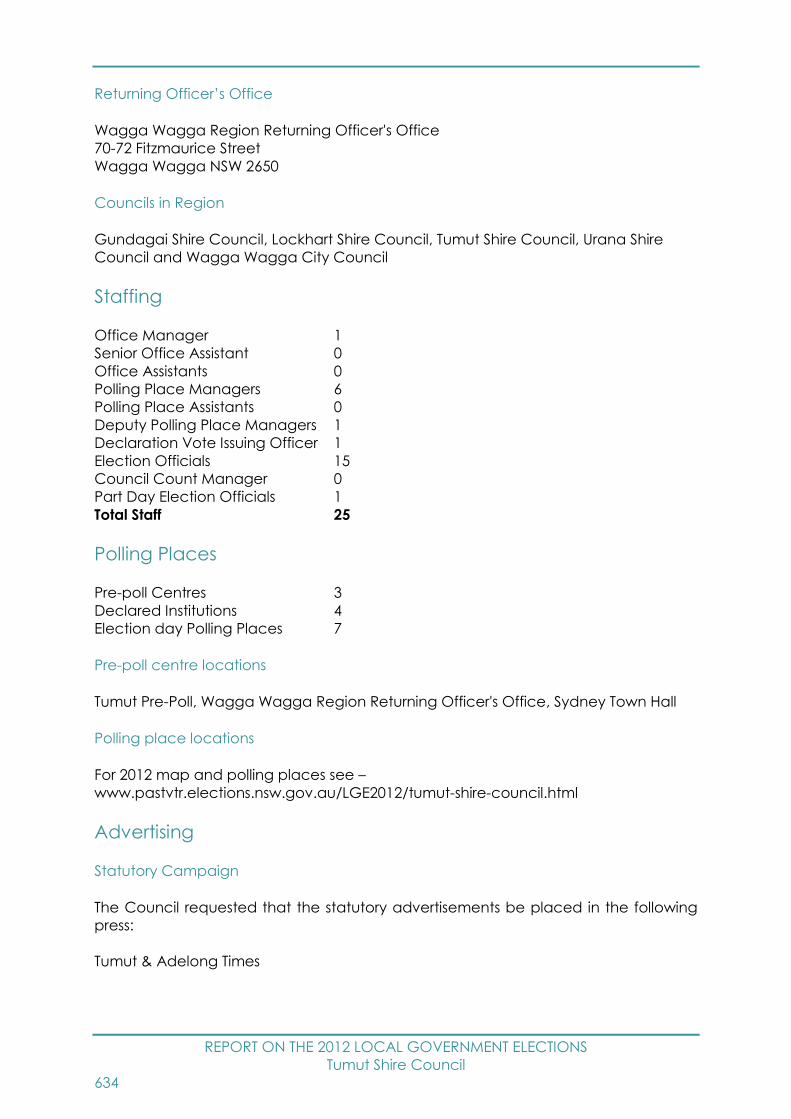
REPORT ON THE 2012 LOCAL GOVERNMENT ELECTIONS
Tumut Shire Council
634
Returning Officer’s Office
Wagga Wagga Region Returning Officer's Office
70-72 Fitzmaurice Street
Wagga Wagga NSW 2650
Councils in Region
Gundagai Shire Council, Lockhart Shire Council, Tumut Shire Council, Urana Shire
Council and Wagga Wagga City Council
Staffing
Office Manager 1
Senior Office Assistant 0
Office Assistants 0
Polling Place Managers 6
Polling Place Assistants 0
Deputy Polling Place Managers 1
Declaration Vote Issuing Officer 1
Election Officials 15
Council Count Manager 0
Part Day Election Officials 1
Total Staff 25
Polling Places
Pre-poll Centres 3
Declared Institutions 4
Election day Polling Places 7
Pre-poll centre locations
Tumut Pre-Poll, Wagga Wagga Region Returning Officer's Office, Sydney Town Hall
Polling place locations
For 2012 map and polling places see –
www.pastvtr.elections.nsw.gov.au/LGE2012/tumut-shire-council.html
Advertising
Statutory Campaign
The Council requested that the statutory advertisements be placed in the following
press:
Tumut & Adelong Times

REPORT ON THE 2012 LOCAL GOVERNMENT ELECTIONS
Tumut Shire Council
635
Candidates
Nominations withdrawn
No Councillor nominations were withdrawn.
Councillor Candidates
Total Candidates 12
Female Candidates 5
Male Candidates 7
Names of all candidates
Councillor Candidates Party Affiliation
ALCHIN, Janice -
BULGER, Sue -
CROSS, Peter -
DUMBRELL, Ben -
ERSKINE, Bob -
HAYES, James -
ISSELMANN, Margaret -
LARTER, John -
McKENZIE, Audrey -
PRITCHARD, Geoff -
STEVENSON, Scott -
THOMSON, Trina -
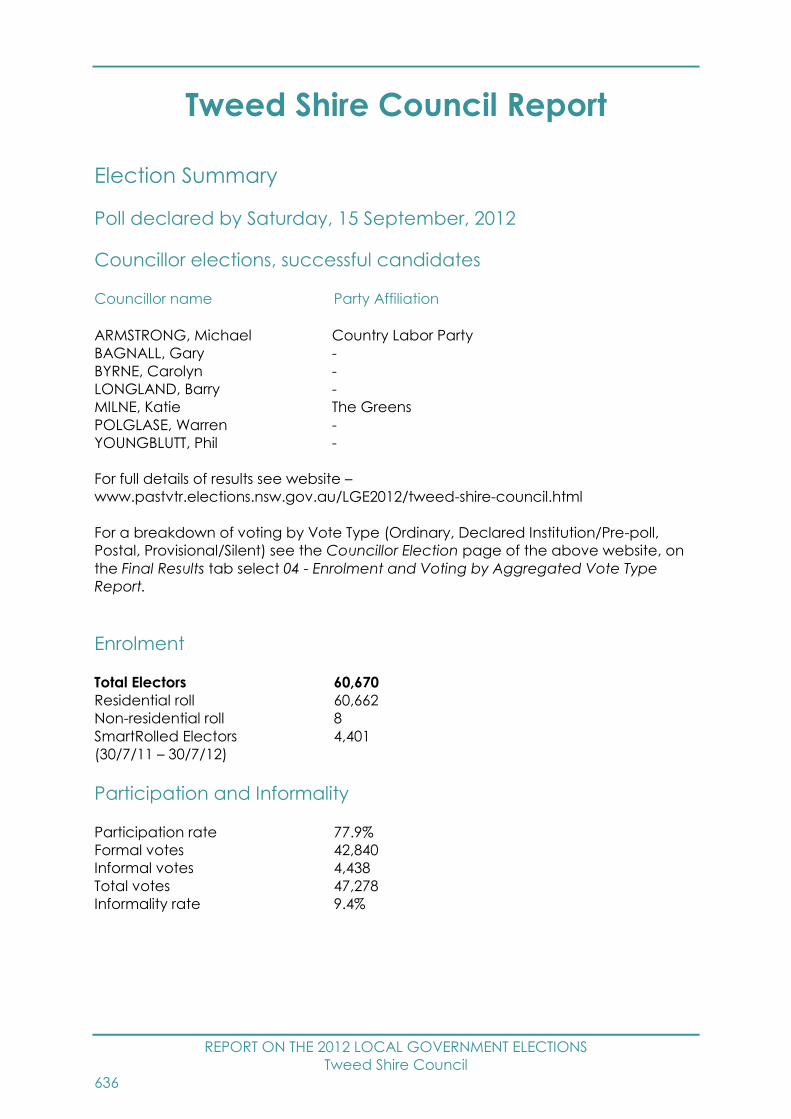
REPORT ON THE 2012 LOCAL GOVERNMENT ELECTIONS
Tweed Shire Council
636
Tweed Shire Council Report
Election Summary
Poll declared by Saturday, 15 September, 2012
Councillor elections, successful candidates
Councillor name Party Affiliation
ARMSTRONG, Michael Country Labor Party
BAGNALL, Gary -
BYRNE, Carolyn -
LONGLAND, Barry -
MILNE, Katie The Greens
POLGLASE, Warren -
YOUNGBLUTT, Phil -
For full details of results see website –
www.pastvtr.elections.nsw.gov.au/LGE2012/tweed-shire-council.html
For a breakdown of voting by Vote Type (Ordinary, Declared Institution/Pre-poll,
Postal, Provisional/Silent) see the Councillor Election page of the above website, on
the Final Results tab select 04 - Enrolment and Voting by Aggregated Vote Type
Report.
Enrolment
Total Electors 60,670
Residential roll 60,662
Non-residential roll 8
SmartRolled Electors 4,401
(30/7/11 – 30/7/12)
Participation and Informality
Participation rate 77.9%
Formal votes 42,840
Informal votes 4,438
Total votes 47,278
Informality rate 9.4%
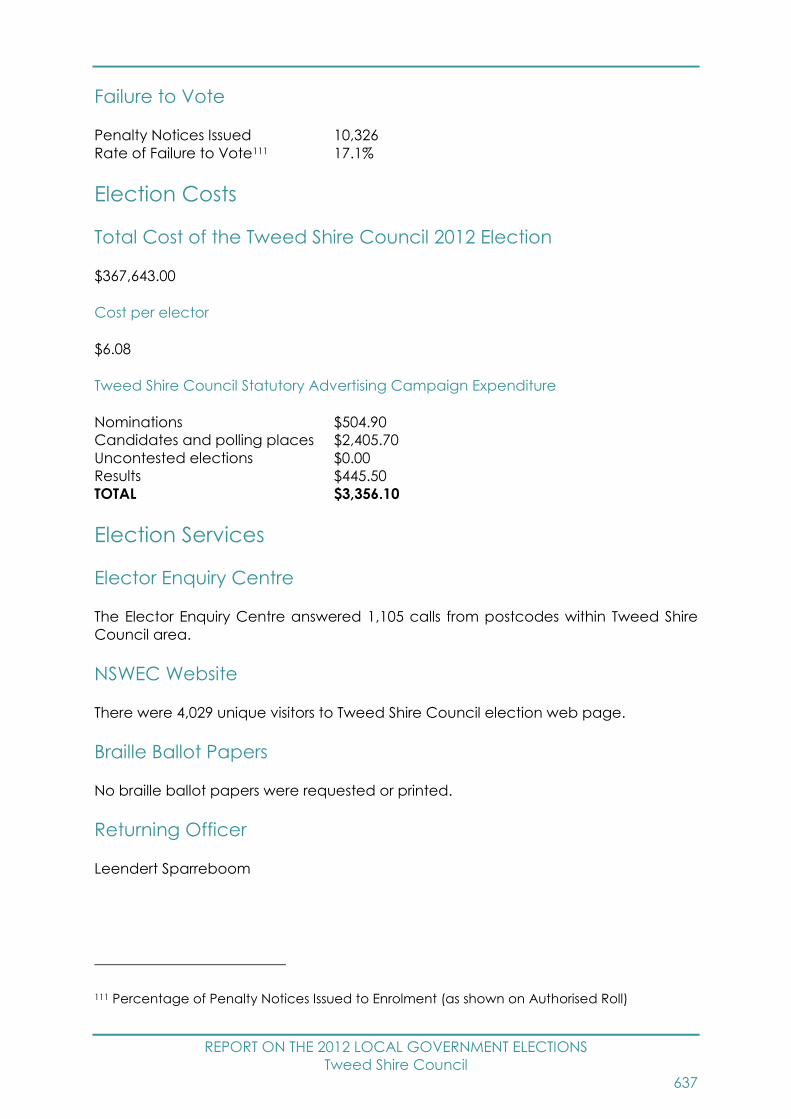
REPORT ON THE 2012 LOCAL GOVERNMENT ELECTIONS
Tweed Shire Council
637
Failure to Vote
Penalty Notices Issued 10,326
Rate of Failure to Vote111 17.1%
Election Costs
Total Cost of the Tweed Shire Council 2012 Election
$367,643.00
Cost per elector
$6.08
Tweed Shire Council Statutory Advertising Campaign Expenditure
Nominations $504.90
Candidates and polling places $2,405.70
Uncontested elections $0.00
Results $445.50
TOTAL $3,356.10
Election Services
Elector Enquiry Centre
The Elector Enquiry Centre answered 1,105 calls from postcodes within Tweed Shire
Council area.
NSWEC Website
There were 4,029 unique visitors to Tweed Shire Council election web page.
Braille Ballot Papers
No braille ballot papers were requested or printed.
Returning Officer
Leendert Sparreboom
111 Percentage of Penalty Notices Issued to Enrolment (as shown on Authorised Roll)

REPORT ON THE 2012 LOCAL GOVERNMENT ELECTIONS
Tweed Shire Council
638
Returning Officer’s Office
Tweed Returning Officer's Office
39 Wharf Street
Tweed Heads NSW 2485
Staffing
Office Manager 1
Senior Office Assistant 0
Office Assistants 37
Polling Place Managers 31
Polling Place Assistants 0
Deputy Polling Place Managers 9
Declaration Vote Issuing Officer 2
Election Officials 86
Council Count Manager 0
Part Day Election Officials 8
Total Staff 174
Polling Places
Pre-poll Centres 3
Declared Institutions 16
Election day Polling Places 32
Pre-poll centre locations
Murwillumbah Pre-Poll, Tweed Returning Officer's Office, Sydney Town Hall
Polling place locations
For 2012 map and polling places see –
www.pastvtr.elections.nsw.gov.au/LGE2012/tweed-shire-council.html
Advertising
Statutory Campaign
The Council requested that the statutory advertisements be placed in the following
press:
Tweed Link

REPORT ON THE 2012 LOCAL GOVERNMENT ELECTIONS
Tweed Shire Council
639
Candidates
Nominations withdrawn
No Councillor nominations were withdrawn.
Councillor Candidates
Total Candidates 59
Female Candidates 29
Male Candidates 30
Names of all candidates
Councillor Candidates Party Affiliation
ADAMS, Angela -
ALFORD, Linton -
ARMSTRONG, Michael Country Labor Party
BAGNALL, Gary -
BRINSMEAD, Rhiannon -
BROWNJOHN, Anni -
BUTTERWORTH, Katherine -
BYRNE, Carolyn -
BYRNES, Reece Country Labor Party
CAHILL, Stuart -
CAMPBELL, Bruce -
CHERRY, Chris -
COOPER, Ron -
COWDROY, Una -
DUPUIS, Anthony -
EALAND, Kirsten The Greens
EMBREY, Karen -
FIEN, Sam -
GARDNER, Joanna The Greens
GARDNER, Marion Country Labor Party
HAWKEN, Robert -
HAYES, Jenny -
HENRY, Jayne -
HEWISON, Fred Country Labor Party
HOLDOM, Dot -
KILARNEY, Russell Family First NSW Inc
KINNEALLY, Rob -
LARKIN, Bill -
LEWIS, Brian -
LOGAN, Russell -
LONGLAND, Barry -
LUFF, Mandy -
LYNCH, Cath -
MCKITTRICK, Stephanie -

REPORT ON THE 2012 LOCAL GOVERNMENT ELECTIONS
Tweed Shire Council
640
MEEVES, Andrew -
MILNE, Katie The Greens
MILNER, Paul -
MUNDAY, Mick The Greens
NAYLOR, Mel -
O'HARA, Tim -
PICKERING, Carolyn -
POLGLASE, Warren -
ROBERTS, Eddie -
ROWE, Bill -
SAUNDERS, Lindsay -
SCHILLER, Nicole -
SHARPLES, Kaye -
SKINNER, Kevin -
SLEDGE, Scott -
SMITH, Lindy -
STRIDE, Tracey -
TURNER, Kerry -
VICKERS, Andrea The Greens
WELSH, Doreen -
WEST, Julie -
WESTON, Bruce -
WILLIS, Ian The Greens
YOUNGBLUTT, Phil -
ZAHN, John -
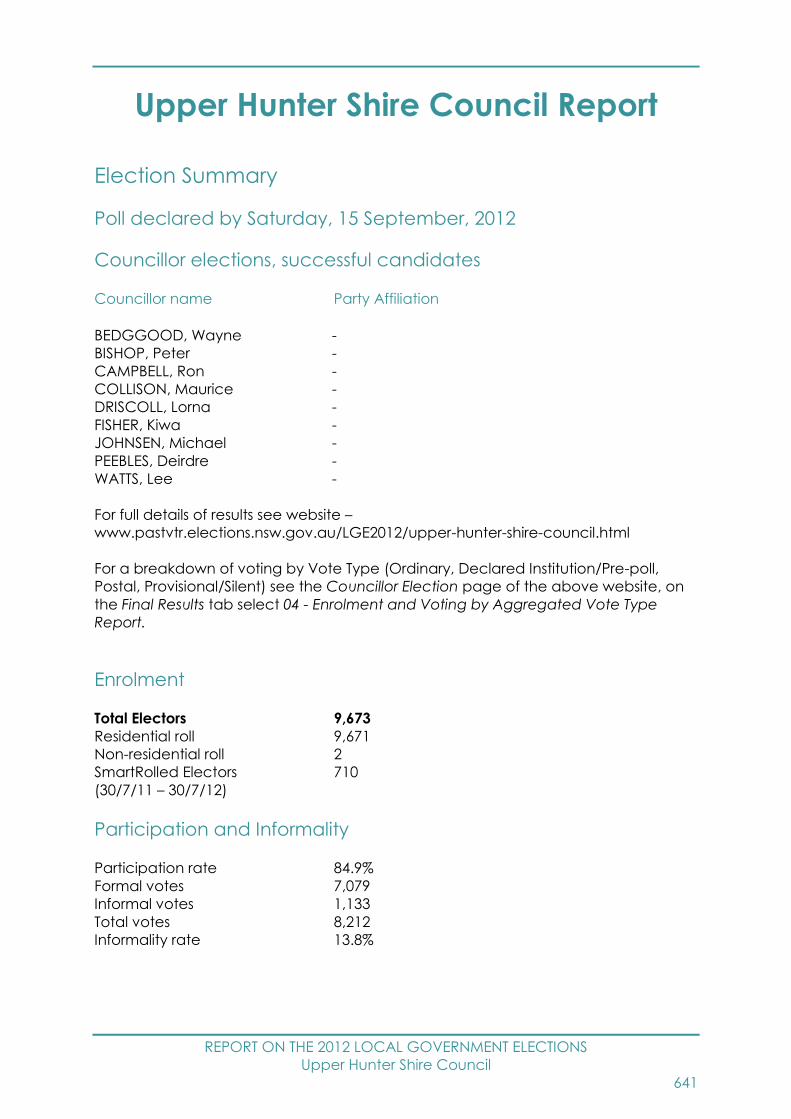
REPORT ON THE 2012 LOCAL GOVERNMENT ELECTIONS
Upper Hunter Shire Council
641
Upper Hunter Shire Council Report
Election Summary
Poll declared by Saturday, 15 September, 2012
Councillor elections, successful candidates
Councillor name Party Affiliation
BEDGGOOD, Wayne -
BISHOP, Peter -
CAMPBELL, Ron -
COLLISON, Maurice -
DRISCOLL, Lorna -
FISHER, Kiwa -
JOHNSEN, Michael -
PEEBLES, Deirdre -
WATTS, Lee -
For full details of results see website –
www.pastvtr.elections.nsw.gov.au/LGE2012/upper-hunter-shire-council.html
For a breakdown of voting by Vote Type (Ordinary, Declared Institution/Pre-poll,
Postal, Provisional/Silent) see the Councillor Election page of the above website, on
the Final Results tab select 04 - Enrolment and Voting by Aggregated Vote Type
Report.
Enrolment
Total Electors 9,673
Residential roll 9,671
Non-residential roll 2
SmartRolled Electors 710
(30/7/11 – 30/7/12)
Participation and Informality
Participation rate 84.9%
Formal votes 7,079
Informal votes 1,133
Total votes 8,212
Informality rate 13.8%

REPORT ON THE 2012 LOCAL GOVERNMENT ELECTIONS
Upper Hunter Shire Council
642
Failure to Vote
Penalty Notices Issued 1,025
Rate of Failure to Vote112 10.6%
Election Costs
Total Cost of the Upper Hunter Shire Council 2012 Election
$75,348.00
Cost per elector
$7.82
Upper Hunter Shire Council Statutory Advertising Campaign Expenditure
Nominations $961.69
Candidates and polling places $3,100.68
Uncontested elections $0.00
Results $801.90
TOTAL $4,864.27
Election Services
Elector Enquiry Centre
The Elector Enquiry Centre answered 128 calls from postcodes within Upper Hunter
Shire Council area.
NSWEC Website
There were 1,137 unique visitors to Upper Hunter Shire Council election web page.
Braille Ballot Papers
No braille ballot papers were requested or printed.
Returning Officer
David Workman
112 Percentage of Penalty Notices Issued to Enrolment (as shown on Authorised Roll)

REPORT ON THE 2012 LOCAL GOVERNMENT ELECTIONS
Upper Hunter Shire Council
643
Returning Officer’s Office
Singleton Region Returning Officer's Office
Old St Patricks Primary School
Market Street
Singleton NSW 2330
Councils in Region
Muswellbrook Shire Council, Singleton Council and Upper Hunter Shire Council
Staffing
Office Manager 1
Senior Office Assistant 0
Office Assistants 0
Polling Place Managers 11
Polling Place Assistants 0
Deputy Polling Place Managers 0
Declaration Vote Issuing Officer 0
Election Officials 18
Council Count Manager 0
Part Day Election Officials 0
Total Staff 30
Polling Places
Pre-poll Centres 5
Declared Institutions 4
Election day Polling Places 12
Pre-poll centre locations
Merriwa Pre-Poll, Murrurundi Pre-Poll, Scone Pre-Poll, Singleton Region Returning
Officer's Office, Sydney Town Hall
Polling place locations
For 2012 map and polling places see –
www.pastvtr.elections.nsw.gov.au/LGE2012/upper-hunter-shire-council.html
Advertising
Statutory Campaign
The Council requested that the statutory advertisements be placed in the following
press:
Hunter Valley News
Scone Advocate
Murrurundi Links
Merriwa Ringer
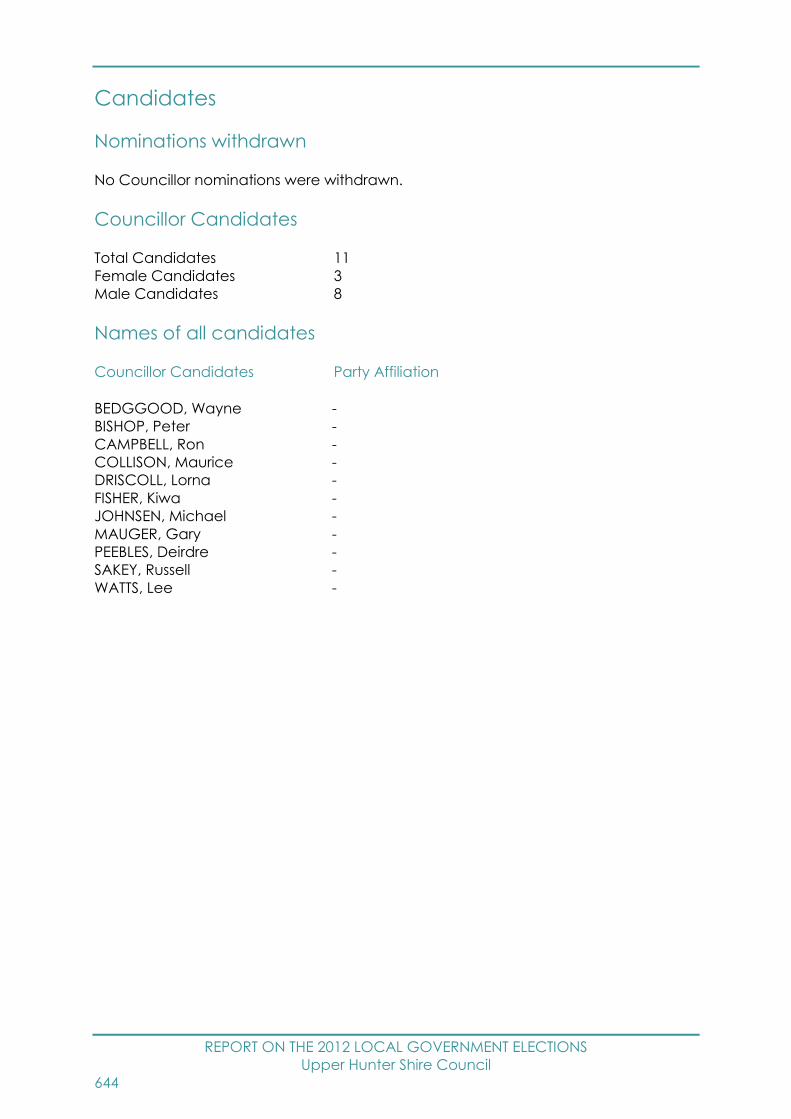
REPORT ON THE 2012 LOCAL GOVERNMENT ELECTIONS
Upper Hunter Shire Council
644
Candidates
Nominations withdrawn
No Councillor nominations were withdrawn.
Councillor Candidates
Total Candidates 11
Female Candidates 3
Male Candidates 8
Names of all candidates
Councillor Candidates Party Affiliation
BEDGGOOD, Wayne -
BISHOP, Peter -
CAMPBELL, Ron -
COLLISON, Maurice -
DRISCOLL, Lorna -
FISHER, Kiwa -
JOHNSEN, Michael -
MAUGER, Gary -
PEEBLES, Deirdre -
SAKEY, Russell -
WATTS, Lee -

REPORT ON THE 2012 LOCAL GOVERNMENT ELECTIONS
Upper Lachlan Shire Council
645
Upper Lachlan Shire Council Report
Election Summary
Poll declared by Thursday, 13 September, 2012
Councillor elections, successful candidates
Councillor name Party Affiliation
BARLOW, Malcolm -
CRAIG, Scott -
CULHANE, Paul -
MARSHALL, Jo -
McCORMACK, Brian -
O'BRIEN, Darren -
SEARL, John -
SHAW, John -
WHEELWRIGHT, James -
For full details of results see website –
www.pastvtr.elections.nsw.gov.au/LGE2012/upper-lachlan-shire-council.html
For a breakdown of voting by Vote Type (Ordinary, Declared Institution/Pre-poll,
Postal, Provisional/Silent) see the Councillor Election page of the above website, on
the Final Results tab select 04 - Enrolment and Voting by Aggregated Vote Type
Report.
Enrolment
Total Electors 5,775
Residential roll 5,765
Non-residential roll 10
SmartRolled Electors 220
(30/7/11 – 30/7/12)
Participation and Informality
Participation rate 83.9%
Formal votes 4,629
Informal votes 218
Total votes 4,847
Informality rate 4.5%

REPORT ON THE 2012 LOCAL GOVERNMENT ELECTIONS
Upper Lachlan Shire Council
646
Failure to Vote
Penalty Notices Issued 618
Rate of Failure to Vote113 10.7%
Election Costs
Total Cost of the Upper Lachlan Shire Council 2012 Election
$50,933.00
Cost per elector
$8.85
Upper Lachlan Shire Council Statutory Advertising Campaign Expenditure
Nominations $1,628.50
Candidates and polling places $1,637.82
Uncontested elections $0.00
Results $808.72
TOTAL $4,075.04
Election Services
Elector Enquiry Centre
The Elector Enquiry Centre answered 75 calls from postcodes within Upper Lachlan
Shire Council area.
NSWEC Website
There were 918 unique visitors to Upper Lachlan Shire Council election web page.
Braille Ballot Papers
No braille ballot papers were requested or printed.
Returning Officer
Brenda Hangilias
113 Percentage of Penalty Notices Issued to Enrolment (as shown on Authorised Roll)

REPORT ON THE 2012 LOCAL GOVERNMENT ELECTIONS
Upper Lachlan Shire Council
647
Returning Officer’s Office
Goulburn Region Returning Officer's Office
104 Clinton Street
Goulburn NSW 2580
Councils in Region
Goulburn Mulwaree Council, Upper Lachlan Shire Council and Yass Valley Council
Staffing
Office Manager 1
Senior Office Assistant 0
Office Assistants 0
Polling Place Managers 12
Polling Place Assistants 0
Deputy Polling Place Managers 0
Declaration Vote Issuing Officer 0
Election Officials 13
Council Count Manager 0
Part Day Election Officials 2
Total Staff 28
Polling Places
Pre-poll Centres 4
Declared Institutions 4
Election day Polling Places 13
Pre-poll centre locations
Crookwell Pre-Poll, Goulburn Region Returning Officer's Office, Gunning Pre-Poll,
Sydney Town Hall
Polling place locations
For 2012 map and polling places see –
www.pastvtr.elections.nsw.gov.au/LGE2012/upper-lachlan-shire-council.html
Advertising
Statutory Campaign
The Council requested that the statutory advertisements be placed in the following
press:
Goulburn Post
Yass Tribune
Crookwell Gazette
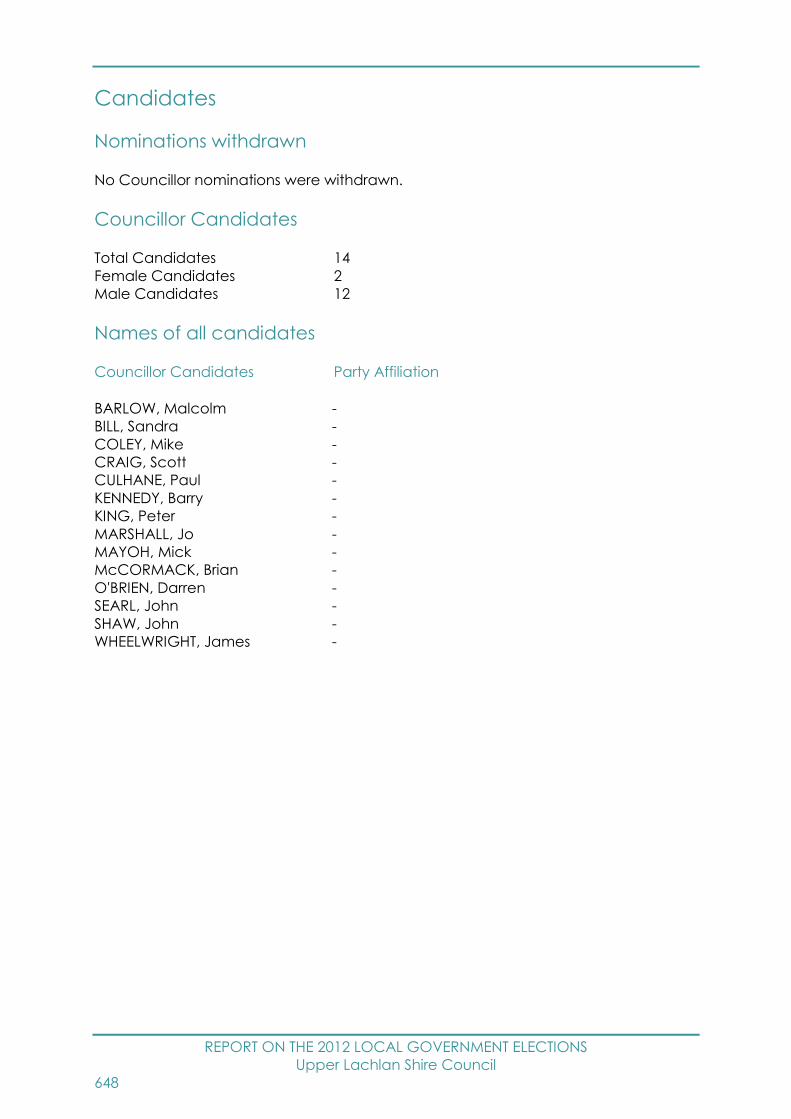
REPORT ON THE 2012 LOCAL GOVERNMENT ELECTIONS
Upper Lachlan Shire Council
648
Candidates
Nominations withdrawn
No Councillor nominations were withdrawn.
Councillor Candidates
Total Candidates 14
Female Candidates 2
Male Candidates 12
Names of all candidates
Councillor Candidates Party Affiliation
BARLOW, Malcolm -
BILL, Sandra -
COLEY, Mike -
CRAIG, Scott -
CULHANE, Paul -
KENNEDY, Barry -
KING, Peter -
MARSHALL, Jo -
MAYOH, Mick -
McCORMACK, Brian -
O'BRIEN, Darren -
SEARL, John -
SHAW, John -
WHEELWRIGHT, James -
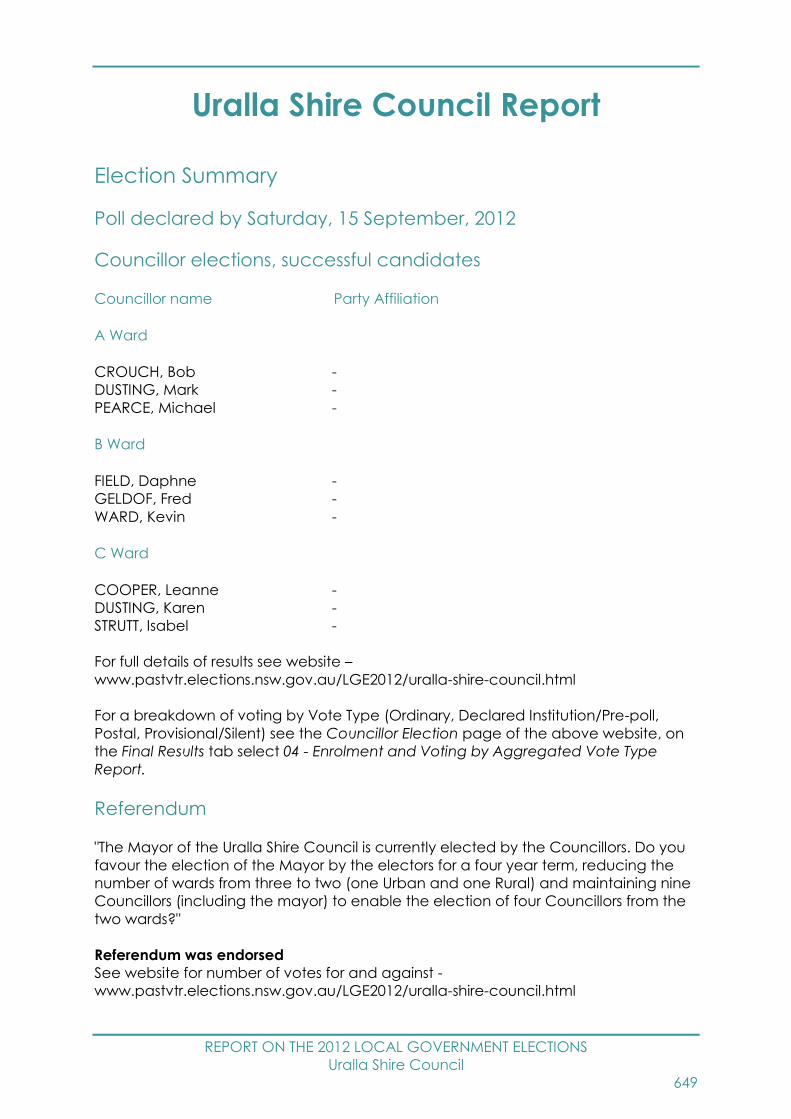
REPORT ON THE 2012 LOCAL GOVERNMENT ELECTIONS
Uralla Shire Council
649
Uralla Shire Council Report
Election Summary
Poll declared by Saturday, 15 September, 2012
Councillor elections, successful candidates
Councillor name Party Affiliation
A Ward
CROUCH, Bob -
DUSTING, Mark -
PEARCE, Michael -
B Ward
FIELD, Daphne -
GELDOF, Fred -
WARD, Kevin -
C Ward
COOPER, Leanne -
DUSTING, Karen -
STRUTT, Isabel -
For full details of results see website –
www.pastvtr.elections.nsw.gov.au/LGE2012/uralla-shire-council.html
For a breakdown of voting by Vote Type (Ordinary, Declared Institution/Pre-poll,
Postal, Provisional/Silent) see the Councillor Election page of the above website, on
the Final Results tab select 04 - Enrolment and Voting by Aggregated Vote Type
Report.
Referendum
"The Mayor of the Uralla Shire Council is currently elected by the Councillors. Do you
favour the election of the Mayor by the electors for a four year term, reducing the
number of wards from three to two (one Urban and one Rural) and maintaining nine
Councillors (including the mayor) to enable the election of four Councillors from the
two wards?"
Referendum was endorsed
See website for number of votes for and against -
www.pastvtr.elections.nsw.gov.au/LGE2012/uralla-shire-council.html
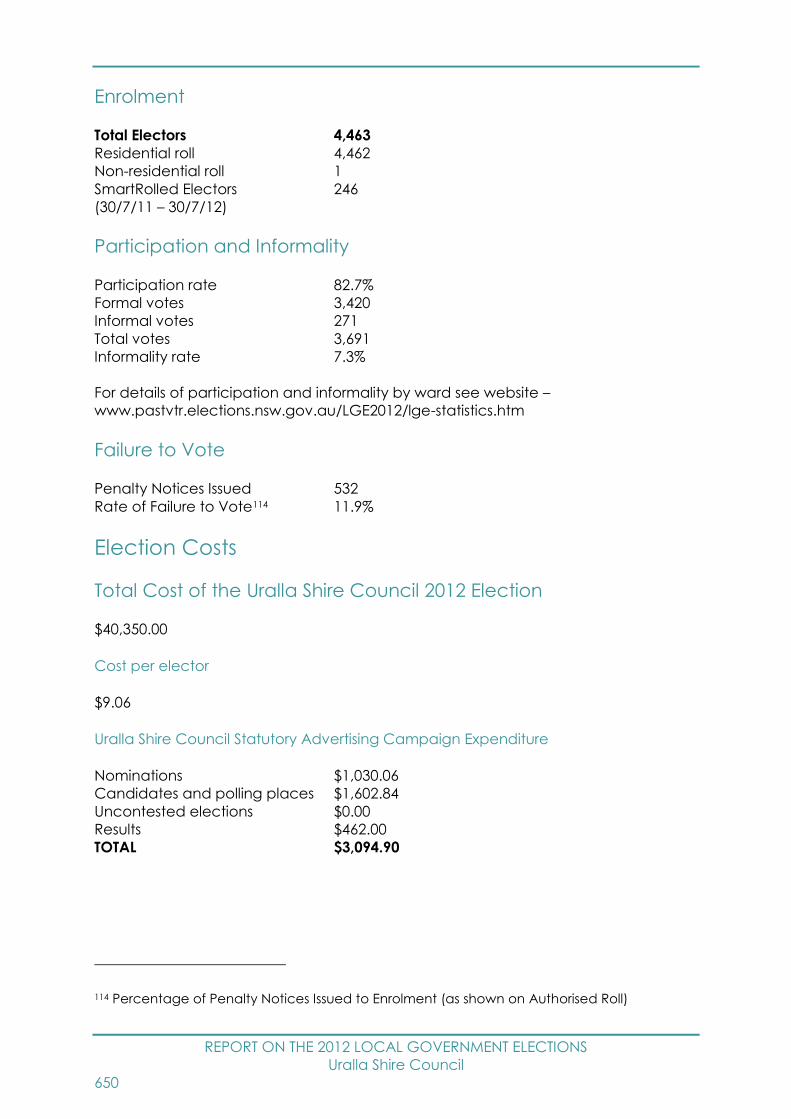
REPORT ON THE 2012 LOCAL GOVERNMENT ELECTIONS
Uralla Shire Council
650
Enrolment
Total Electors 4,463
Residential roll 4,462
Non-residential roll 1
SmartRolled Electors 246
(30/7/11 – 30/7/12)
Participation and Informality
Participation rate 82.7%
Formal votes 3,420
Informal votes 271
Total votes 3,691
Informality rate 7.3%
For details of participation and informality by ward see website –
www.pastvtr.elections.nsw.gov.au/LGE2012/lge-statistics.htm
Failure to Vote
Penalty Notices Issued 532
Rate of Failure to Vote114 11.9%
Election Costs
Total Cost of the Uralla Shire Council 2012 Election
$40,350.00
Cost per elector
$9.06
Uralla Shire Council Statutory Advertising Campaign Expenditure
Nominations $1,030.06
Candidates and polling places $1,602.84
Uncontested elections $0.00
Results $462.00
TOTAL $3,094.90
114 Percentage of Penalty Notices Issued to Enrolment (as shown on Authorised Roll)

REPORT ON THE 2012 LOCAL GOVERNMENT ELECTIONS
Uralla Shire Council
651
Election Services
Elector Enquiry Centre
The Elector Enquiry Centre answered 79 calls from postcodes within Uralla Shire
Council area.
NSWEC Website
There were 1,069 unique visitors to Uralla Shire Council election web page.
Braille Ballot Papers
No braille ballot papers were requested or printed.
Returning Officer
Desmond Breen
Returning Officer’s Office
Armidale Region Returning Officer's Office
2/206 Beardy Street
Armidale NSW 2350
Councils in Region
Armidale Dumaresq Council, Guyra Shire Council, Uralla Shire Council and Walcha
Council
Staffing
Office Manager 1
Senior Office Assistant 0
Office Assistants 0
Polling Place Managers 6
Polling Place Assistants 0
Deputy Polling Place Managers 0
Declaration Vote Issuing Officer 0
Election Officials 8
Council Count Manager 0
Part Day Election Officials 0
Total Staff 15
Polling Places
Pre-poll Centres 3
Declared Institutions 2
Election day Polling Places 12
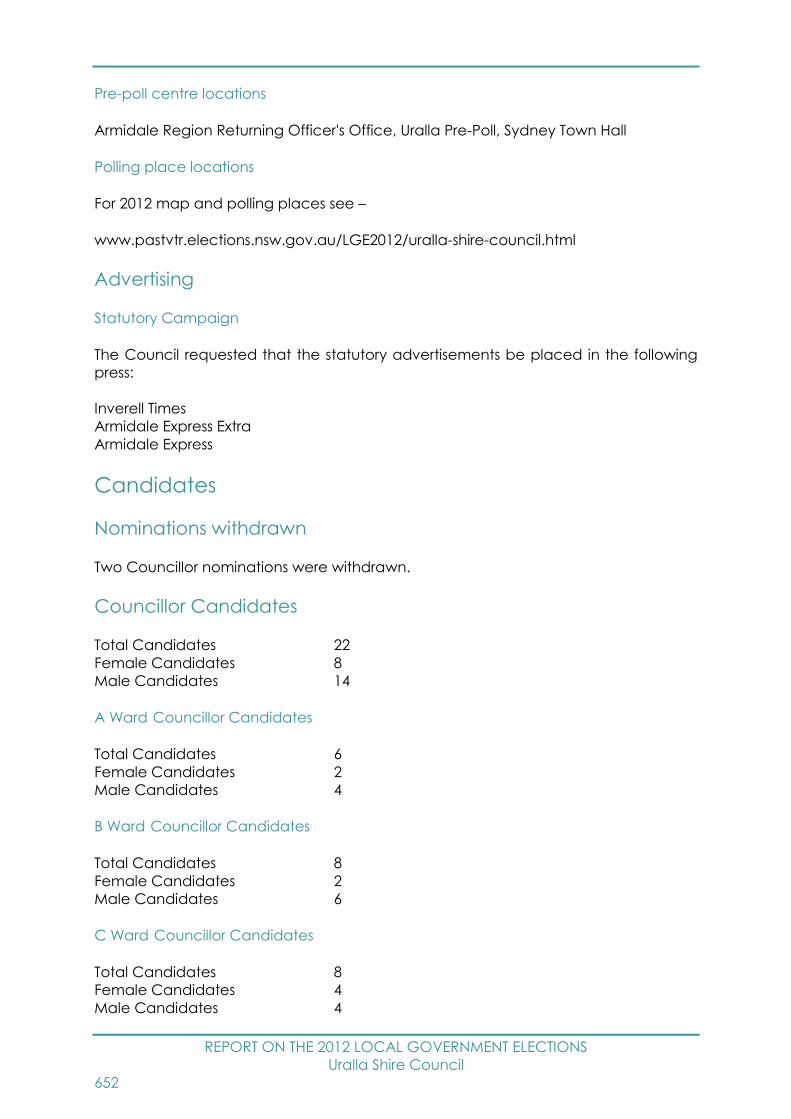
REPORT ON THE 2012 LOCAL GOVERNMENT ELECTIONS
Uralla Shire Council
652
Pre-poll centre locations
Armidale Region Returning Officer's Office, Uralla Pre-Poll, Sydney Town Hall
Polling place locations
For 2012 map and polling places see –
www.pastvtr.elections.nsw.gov.au/LGE2012/uralla-shire-council.html
Advertising
Statutory Campaign
The Council requested that the statutory advertisements be placed in the following
press:
Inverell Times
Armidale Express Extra
Armidale Express
Candidates
Nominations withdrawn
Two Councillor nominations were withdrawn.
Councillor Candidates
Total Candidates 22
Female Candidates 8
Male Candidates 14
A Ward Councillor Candidates
Total Candidates 6
Female Candidates 2
Male Candidates 4
B Ward Councillor Candidates
Total Candidates 8
Female Candidates 2
Male Candidates 6
C Ward Councillor Candidates
Total Candidates 8
Female Candidates 4
Male Candidates 4

REPORT ON THE 2012 LOCAL GOVERNMENT ELECTIONS
Uralla Shire Council
653
Names of all candidates
Councillor Candidates Party Affiliation
A Ward
CROUCH, Bob -
DUSTING, Mark -
FARRELL, John -
HARVIE, Kim -
PEARCE, Michael -
STRONG, Celia -
B Ward
BARWELL, Erica -
FIELD, Daphne -
FISCHER, Duncan -
GELDOF, Fred -
MAGILL, David -
McMULLEN, Bruce -
TAYLOR, Graeme -
WARD, Kevin -
C Ward
CALLIESS, Wayne -
COOPER, Leanne -
DUSTING, Karen -
HOBBS, Paul -
POWLEY, Stephen -
ROHDE, Hazel -
SPREADBOROUGH, Robert -
STRUTT, Isabel -
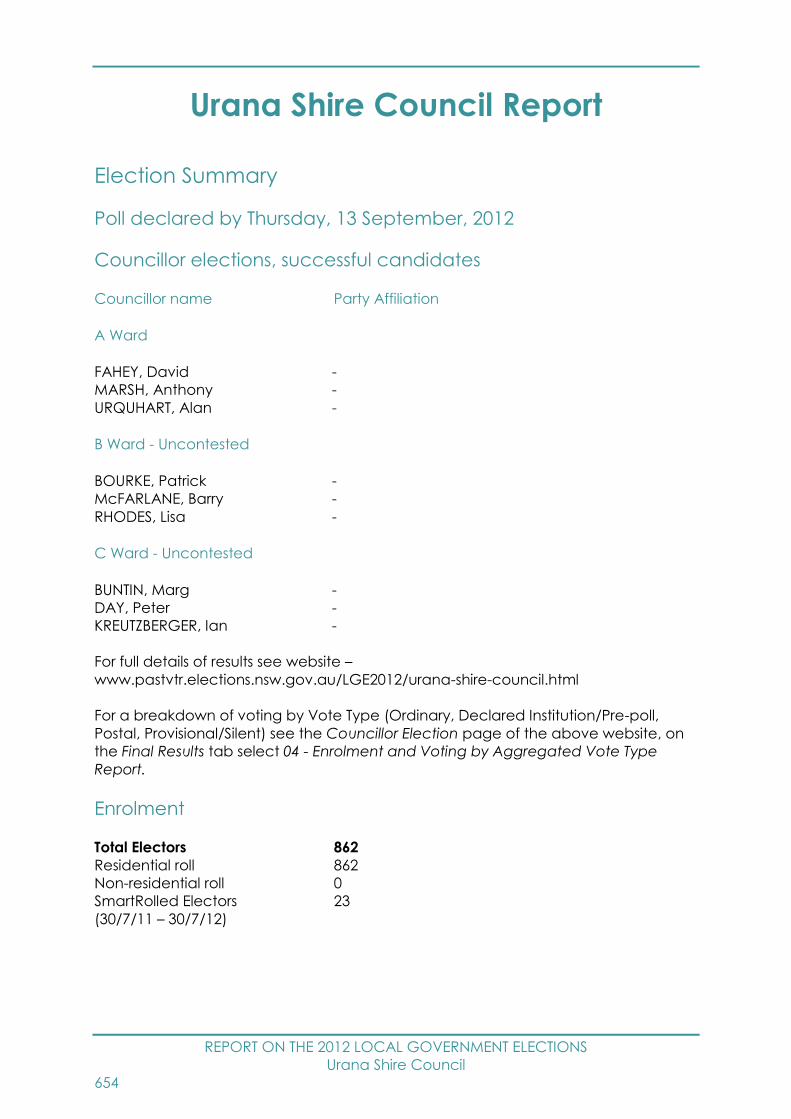
REPORT ON THE 2012 LOCAL GOVERNMENT ELECTIONS
Urana Shire Council
654
Urana Shire Council Report
Election Summary
Poll declared by Thursday, 13 September, 2012
Councillor elections, successful candidates
Councillor name Party Affiliation
A Ward
FAHEY, David -
MARSH, Anthony -
URQUHART, Alan -
B Ward - Uncontested
BOURKE, Patrick -
McFARLANE, Barry -
RHODES, Lisa -
C Ward - Uncontested
BUNTIN, Marg -
DAY, Peter -
KREUTZBERGER, Ian -
For full details of results see website –
www.pastvtr.elections.nsw.gov.au/LGE2012/urana-shire-council.html
For a breakdown of voting by Vote Type (Ordinary, Declared Institution/Pre-poll,
Postal, Provisional/Silent) see the Councillor Election page of the above website, on
the Final Results tab select 04 - Enrolment and Voting by Aggregated Vote Type
Report.
Enrolment
Total Electors 862
Residential roll 862
Non-residential roll 0
SmartRolled Electors 23
(30/7/11 – 30/7/12)
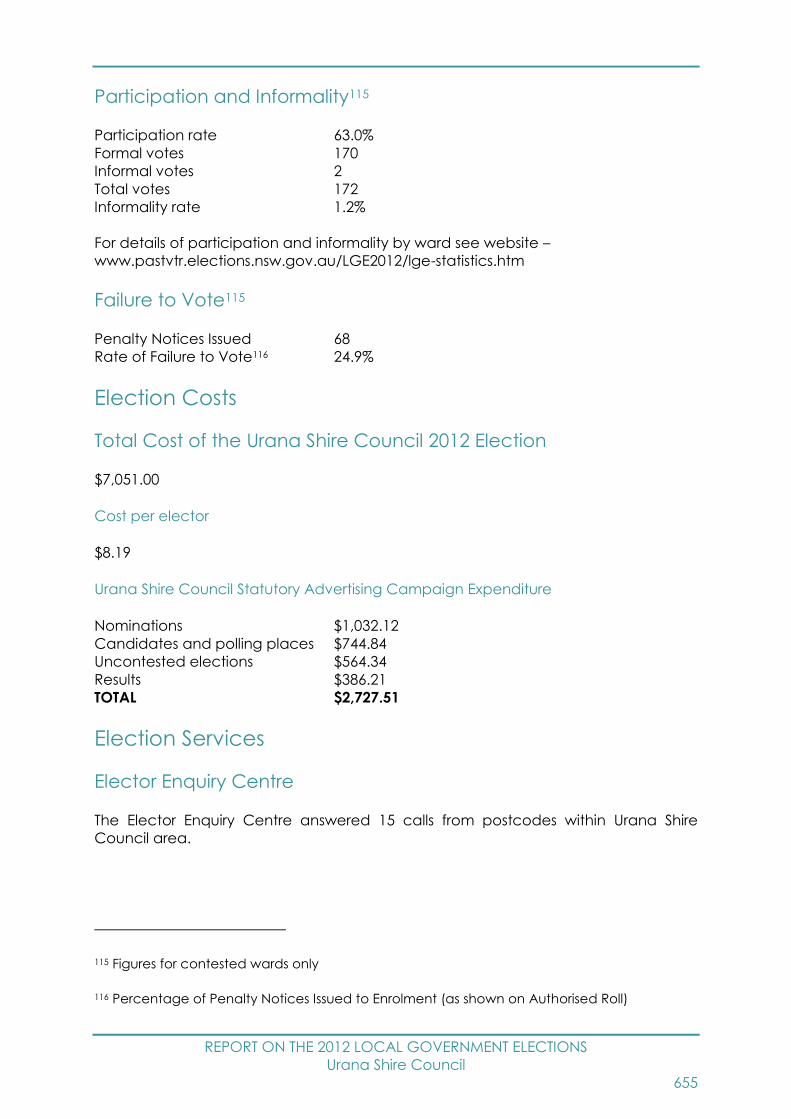
REPORT ON THE 2012 LOCAL GOVERNMENT ELECTIONS
Urana Shire Council
655
Participation and Informality115
Participation rate 63.0%
Formal votes 170
Informal votes 2
Total votes 172
Informality rate 1.2%
For details of participation and informality by ward see website –
www.pastvtr.elections.nsw.gov.au/LGE2012/lge-statistics.htm
Failure to Vote115
Penalty Notices Issued 68
Rate of Failure to Vote116 24.9%
Election Costs
Total Cost of the Urana Shire Council 2012 Election
$7,051.00
Cost per elector
$8.19
Urana Shire Council Statutory Advertising Campaign Expenditure
Nominations $1,032.12
Candidates and polling places $744.84
Uncontested elections $564.34
Results $386.21
TOTAL $2,727.51
Election Services
Elector Enquiry Centre
The Elector Enquiry Centre answered 15 calls from postcodes within Urana Shire
Council area.
115 Figures for contested wards only
116 Percentage of Penalty Notices Issued to Enrolment (as shown on Authorised Roll)
REPORT ON THE 2012 LOCAL GOVERNMENT ELECTIONS
Urana Shire Council
656
NSWEC Website
There were 235 unique visitors to Urana Shire Council election web page.
Braille Ballot Papers
No braille ballot papers were requested or printed.
Returning Officer
Barry Shields
Returning Officer’s Office
Wagga Wagga Region Returning Officer's Office
70-72 Fitzmaurice Street
Wagga Wagga NSW 2650
Councils in Region
Gundagai Shire Council, Lockhart Shire Council, Tumut Shire Council, Urana Shire
Council and Wagga Wagga City Council
Staffing
Office Manager 1
Senior Office Assistant 0
Office Assistants 0
Polling Place Managers 2
Polling Place Assistants 0
Deputy Polling Place Managers 0
Declaration Vote Issuing Officer 0
Election Officials 2
Council Count Manager 0
Part Day Election Officials 0
Total Staff 5
Polling Places
Pre-poll Centres 3
Declared Institutions 0
Election day Polling Places 3
Pre-poll centre locations
Urana Pre-Poll, Wagga Wagga Region Returning Officer's Office, Sydney Town Hall
REPORT ON THE 2012 LOCAL GOVERNMENT ELECTIONS
Urana Shire Council
657
Polling place locations
For 2012 map and polling places see –
www.pastvtr.elections.nsw.gov.au/LGE2012/urana-shire-council.html
Advertising
Statutory Campaign
The Council requested that the statutory advertisements be placed in the following
press:
Albury /Wodonga Border Mail
Daily Advertiser
Border Mail
Wagga Daily Advertiser
Candidates
Nominations withdrawn
No Councillor nominations were withdrawn.
Councillor Candidates
Total Candidates 10
Female Candidates 2
Male Candidates 8
A Ward Councillor Candidates
Total Candidates 4
Female Candidates 0
Male Candidates 4
B Ward Councillor Candidates
Total Candidates 3
Female Candidates 1
Male Candidates 2
C Ward Councillor Candidates
Total Candidates 3
Female Candidates 1
Male Candidates 2
REPORT ON THE 2012 LOCAL GOVERNMENT ELECTIONS
Urana Shire Council
658
Names of all candidates
Councillor Candidates Party Affiliation
A Ward
FAHEY, David -
JAMES, Arthur -
MARSH, Anthony -
URQUHART, Alan -
REPORT ON THE 2012 LOCAL GOVERNMENT ELECTIONS
Wagga Wagga City Council
659
Wagga Wagga City Council Report
Election Summary
Poll declared by Monday, 17 September, 2012
Councillor elections, successful candidates
Councillor name Party Affiliation
BRAID, Yvonne -
BROWN, Alan -
CONKEY, Greg -
FUNNELL, Paul -
HISCOCK, Garry -
KENDALL, Rod -
McLAREN, Julian -
NEGLINE, Andrew -
PASCOE, Kerry -
POYNTER, Kevin The Greens
TOUT, Dallas -
For full details of results see website –
www.pastvtr.elections.nsw.gov.au/LGE2012/wagga-wagga-city-council.html
For a breakdown of voting by Vote Type (Ordinary, Declared Institution/Pre-poll,
Postal, Provisional/Silent) see the Councillor Election page of the above website, on
the Final Results tab select 04 - Enrolment and Voting by Aggregated Vote Type
Report.
Referendum
"Do you support a reduction in the number of Councillors for the City of Wagga
Wagga from 11 to 9?"
Referendum was endorsed
See website for number of votes for and against -
www.pastvtr.elections.nsw.gov.au/LGE2012/wagga-wagga-city-council.html
Enrolment
Total Electors 41,891
Residential roll 41,888
Non-residential roll 3
SmartRolled Electors 4,505
(30/7/11 – 30/7/12)

REPORT ON THE 2012 LOCAL GOVERNMENT ELECTIONS
Wagga Wagga City Council
660
Participation and Informality
Participation rate 81.9%
Formal votes 31,232
Informal votes 3,083
Total votes 34,315
Informality rate 9.0%
Failure to Vote
Penalty Notices Issued 6,090
Rate of Failure to Vote117 14.6%
Election Costs
Total Cost of the Wagga Wagga City Council 2012 Election
$291,222.00
Cost per elector
$6.97
Wagga Wagga City Council Statutory Advertising Campaign Expenditure
Nominations $531.38
Candidates and polling places $375.09
Uncontested elections $0.00
Results $260.91
TOTAL $1,167.38
Election Services
Elector Enquiry Centre
The Elector Enquiry Centre answered 527 calls from postcodes within Wagga Wagga
City Council area.
NSWEC Website
There were 4,545 unique visitors to Wagga Wagga City Council election web page.
Braille Ballot Papers
No braille ballot papers were requested or printed.
117 Percentage of Penalty Notices Issued to Enrolment (as shown on Authorised Roll)

REPORT ON THE 2012 LOCAL GOVERNMENT ELECTIONS
Wagga Wagga City Council
661
Returning Officer
Barry Shields
Returning Officer’s Office
Wagga Wagga Region Returning Officer's Office
70-72 Fitzmaurice Street
Wagga Wagga NSW 2650
Councils in Region
Gundagai Shire Council, Lockhart Shire Council, Tumut Shire Council, Urana Shire
Council and Wagga Wagga City Council
Staffing
Office Manager 1
Senior Office Assistant 0
Office Assistants 29
Polling Place Managers 23
Polling Place Assistants 10
Deputy Polling Place Managers 6
Declaration Vote Issuing Officer 1
Election Officials 64
Council Count Manager 0
Part Day Election Officials 5
Total Staff 139
Polling Places
Pre-poll Centres 2
Declared Institutions 8
Election day Polling Places 24
Pre-poll centre locations
Wagga Wagga Region Returning Officer's Office, Sydney Town Hall
Polling place locations
For 2012 map and polling places see –
www.pastvtr.elections.nsw.gov.au/LGE2012/wagga-wagga-city-council.html
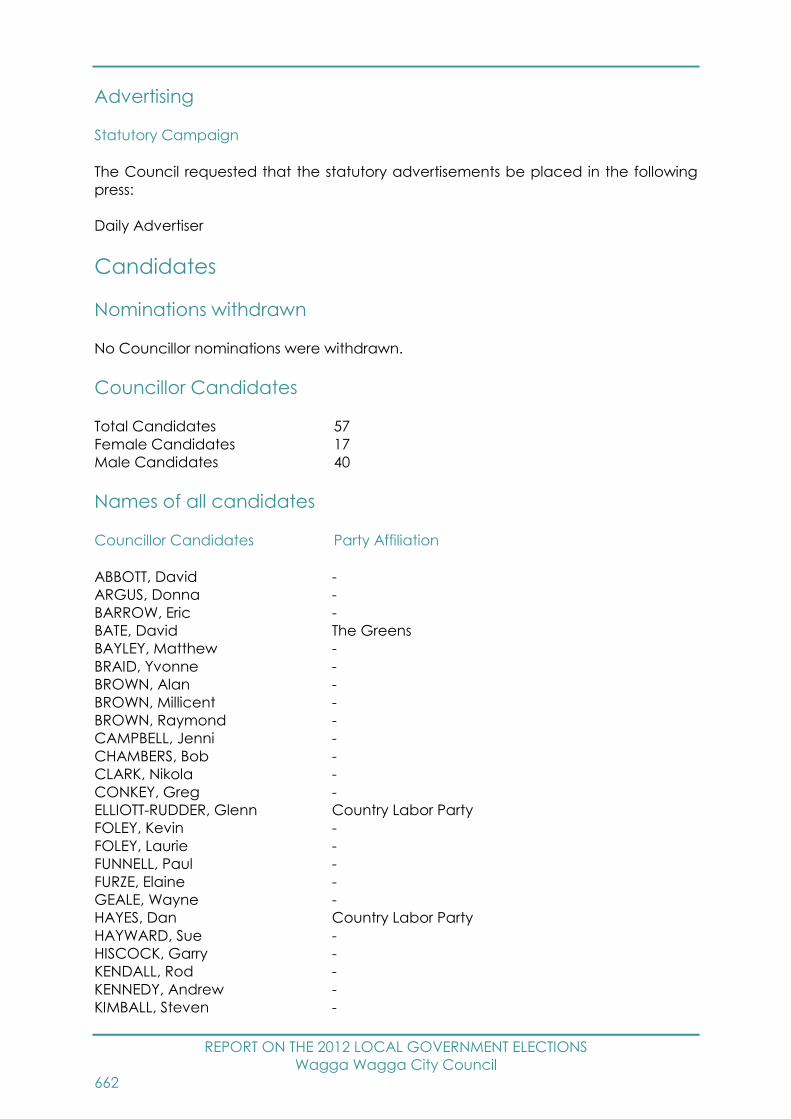
REPORT ON THE 2012 LOCAL GOVERNMENT ELECTIONS
Wagga Wagga City Council
662
Advertising
Statutory Campaign
The Council requested that the statutory advertisements be placed in the following
press:
Daily Advertiser
Candidates
Nominations withdrawn
No Councillor nominations were withdrawn.
Councillor Candidates
Total Candidates 57
Female Candidates 17
Male Candidates 40
Names of all candidates
Councillor Candidates Party Affiliation
ABBOTT, David -
ARGUS, Donna -
BARROW, Eric -
BATE, David The Greens
BAYLEY, Matthew -
BRAID, Yvonne -
BROWN, Alan -
BROWN, Millicent -
BROWN, Raymond -
CAMPBELL, Jenni -
CHAMBERS, Bob -
CLARK, Nikola -
CONKEY, Greg -
ELLIOTT-RUDDER, Glenn Country Labor Party
FOLEY, Kevin -
FOLEY, Laurie -
FUNNELL, Paul -
FURZE, Elaine -
GEALE, Wayne -
HAYES, Dan Country Labor Party
HAYWARD, Sue -
HISCOCK, Garry -
KENDALL, Rod -
KENNEDY, Andrew -
KIMBALL, Steven -
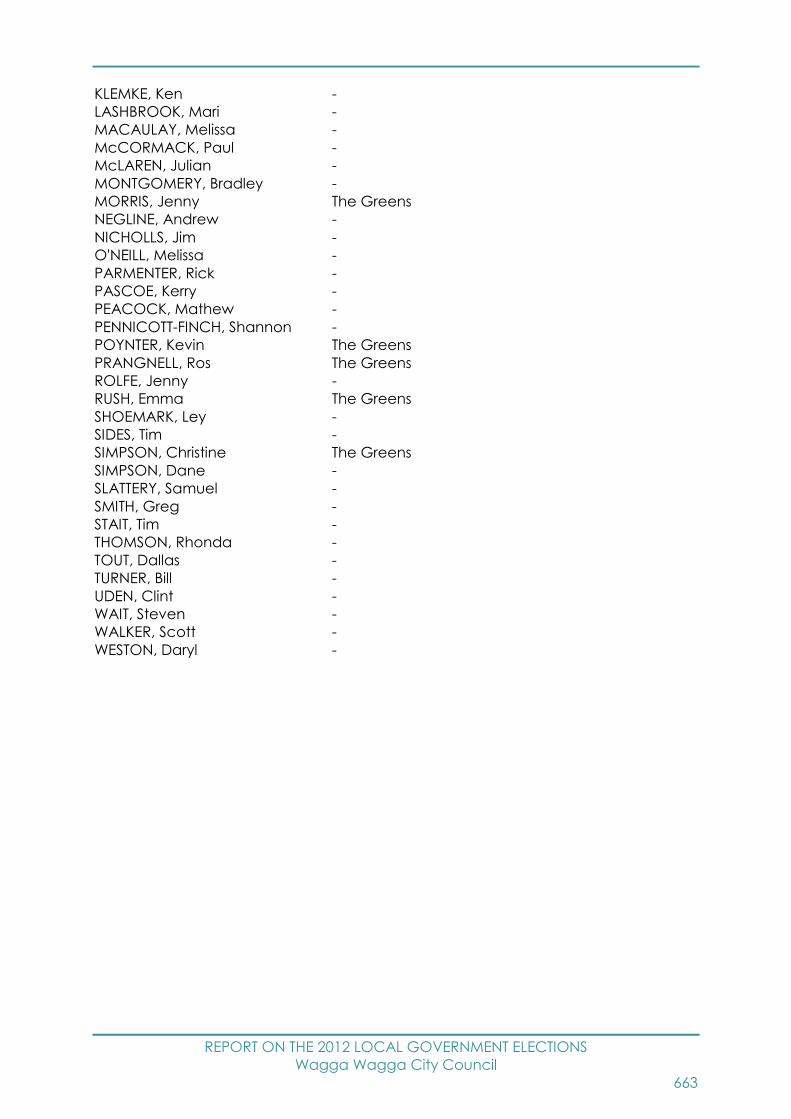
REPORT ON THE 2012 LOCAL GOVERNMENT ELECTIONS
Wagga Wagga City Council
663
KLEMKE, Ken -
LASHBROOK, Mari -
MACAULAY, Melissa -
McCORMACK, Paul -
McLAREN, Julian -
MONTGOMERY, Bradley -
MORRIS, Jenny The Greens
NEGLINE, Andrew -
NICHOLLS, Jim -
O'NEILL, Melissa -
PARMENTER, Rick -
PASCOE, Kerry -
PEACOCK, Mathew -
PENNICOTT-FINCH, Shannon -
POYNTER, Kevin The Greens
PRANGNELL, Ros The Greens
ROLFE, Jenny -
RUSH, Emma The Greens
SHOEMARK, Ley -
SIDES, Tim -
SIMPSON, Christine The Greens
SIMPSON, Dane -
SLATTERY, Samuel -
SMITH, Greg -
STAIT, Tim -
THOMSON, Rhonda -
TOUT, Dallas -
TURNER, Bill -
UDEN, Clint -
WAIT, Steven -
WALKER, Scott -
WESTON, Daryl -
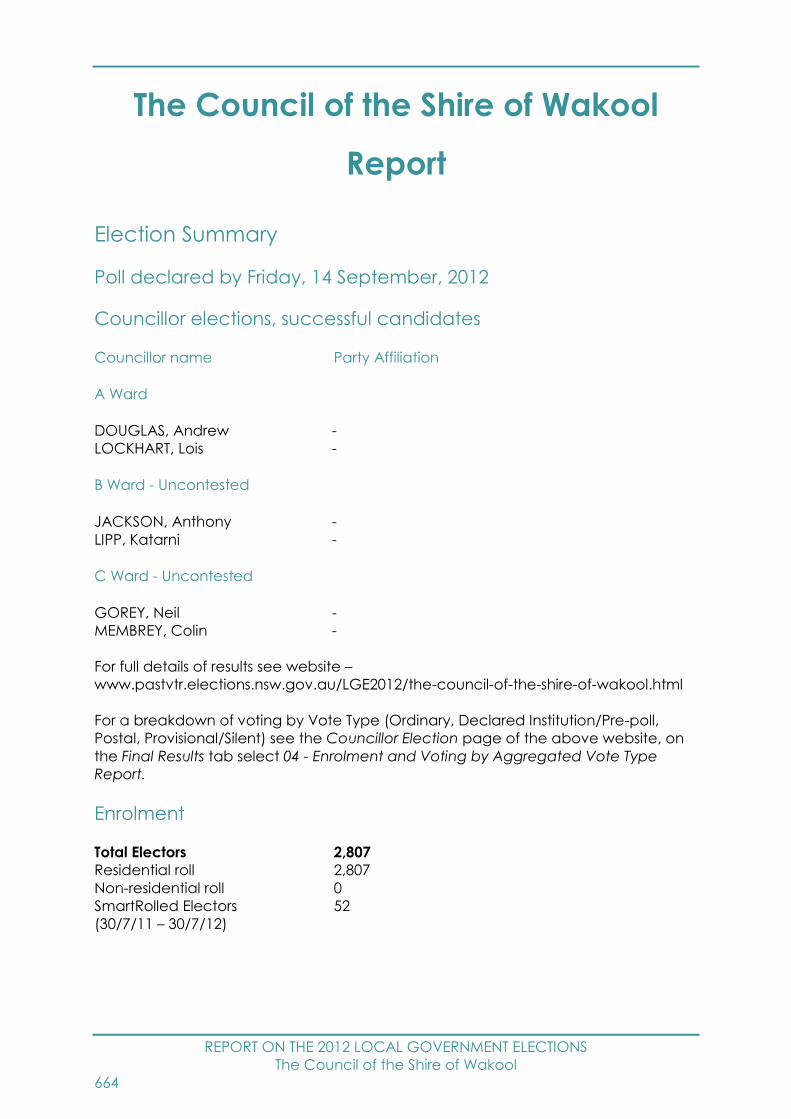
REPORT ON THE 2012 LOCAL GOVERNMENT ELECTIONS
The Council of the Shire of Wakool
664
The Council of the Shire of Wakool
Report
Election Summary
Poll declared by Friday, 14 September, 2012
Councillor elections, successful candidates
Councillor name Party Affiliation
A Ward
DOUGLAS, Andrew -
LOCKHART, Lois -
B Ward - Uncontested
JACKSON, Anthony -
LIPP, Katarni -
C Ward - Uncontested
GOREY, Neil -
MEMBREY, Colin -
For full details of results see website –
www.pastvtr.elections.nsw.gov.au/LGE2012/the-council-of-the-shire-of-wakool.html
For a breakdown of voting by Vote Type (Ordinary, Declared Institution/Pre-poll,
Postal, Provisional/Silent) see the Councillor Election page of the above website, on
the Final Results tab select 04 - Enrolment and Voting by Aggregated Vote Type
Report.
Enrolment
Total Electors 2,807
Residential roll 2,807
Non-residential roll 0
SmartRolled Electors 52
(30/7/11 – 30/7/12)
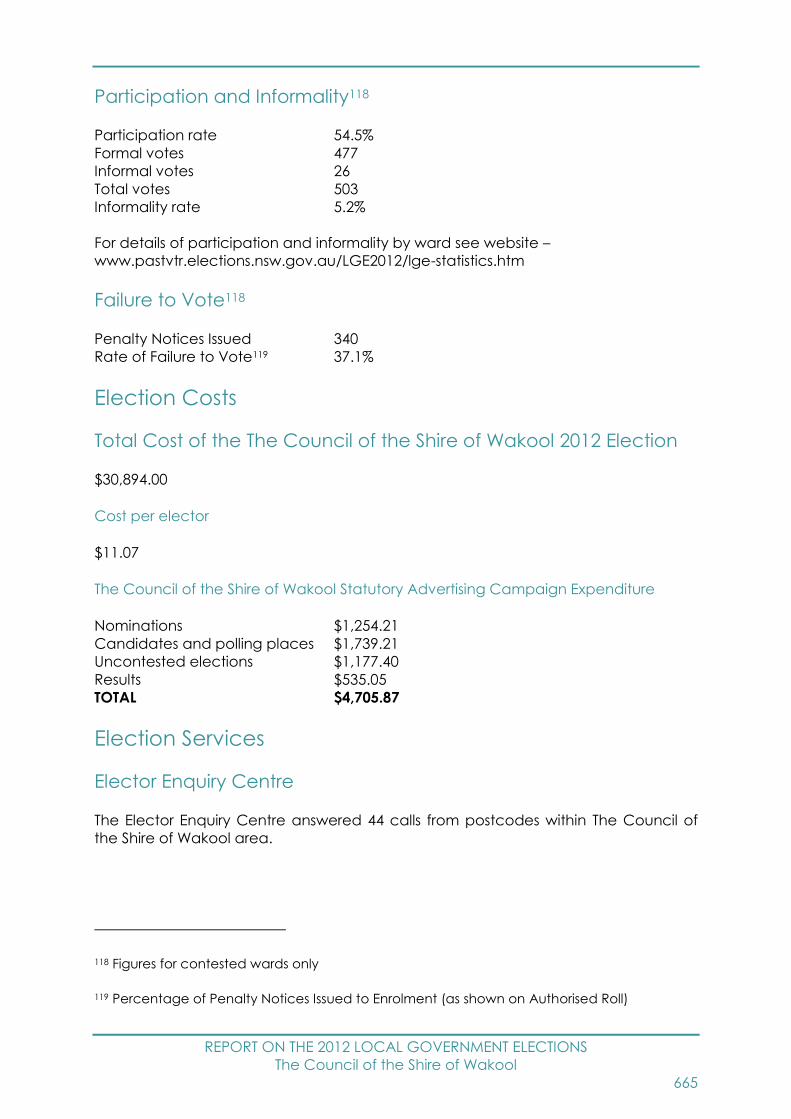
REPORT ON THE 2012 LOCAL GOVERNMENT ELECTIONS
The Council of the Shire of Wakool
665
Participation and Informality118
Participation rate 54.5%
Formal votes 477
Informal votes 26
Total votes 503
Informality rate 5.2%
For details of participation and informality by ward see website –
www.pastvtr.elections.nsw.gov.au/LGE2012/lge-statistics.htm
Failure to Vote118
Penalty Notices Issued 340
Rate of Failure to Vote119 37.1%
Election Costs
Total Cost of the The Council of the Shire of Wakool 2012 Election
$30,894.00
Cost per elector
$11.07
The Council of the Shire of Wakool Statutory Advertising Campaign Expenditure
Nominations $1,254.21
Candidates and polling places $1,739.21
Uncontested elections $1,177.40
Results $535.05
TOTAL $4,705.87
Election Services
Elector Enquiry Centre
The Elector Enquiry Centre answered 44 calls from postcodes within The Council of
the Shire of Wakool area.
118 Figures for contested wards only
119 Percentage of Penalty Notices Issued to Enrolment (as shown on Authorised Roll)

REPORT ON THE 2012 LOCAL GOVERNMENT ELECTIONS
The Council of the Shire of Wakool
666
NSWEC Website
There were 327 unique visitors to The Council of the Shire of Wakool election web
page.
Braille Ballot Papers
No braille ballot papers were requested or printed.
Returning Officer
Peter Birnie
Returning Officer’s Office
Hay Region Returning Officer's Office
3/177 Lachlan Street
Hay NSW 2711
Councils in Region
Balranald Shire Council, Hay Shire Council and Wakool Shire Council
Staffing
Office Manager 0
Senior Office Assistant 0
Office Assistants 0
Polling Place Managers 4
Polling Place Assistants 0
Deputy Polling Place Managers 0
Declaration Vote Issuing Officer 0
Election Officials 4
Council Count Manager 0
Part Day Election Officials 0
Total Staff 8
Polling Places
Pre-poll Centres 3
Declared Institutions 0
Election day Polling Places 6
Pre-poll centre locations
Hay Region Returning Officer's Office, Moulamein Pre-Poll, Sydney Town Hall
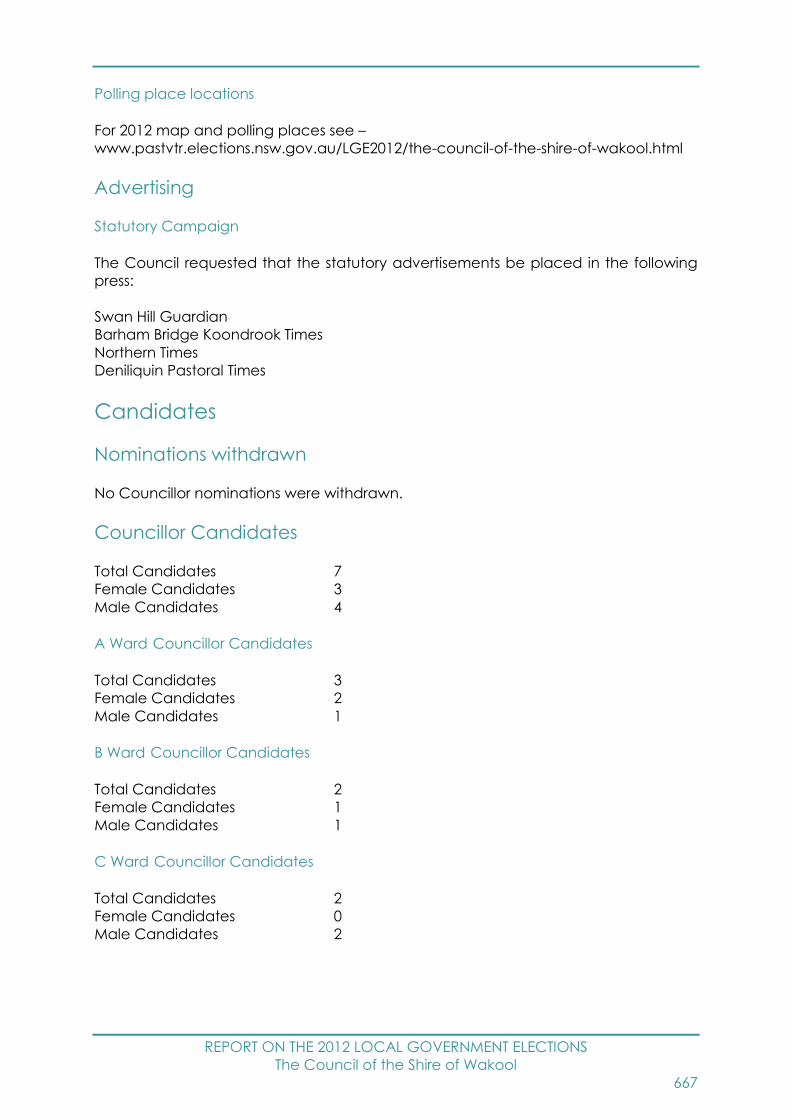
REPORT ON THE 2012 LOCAL GOVERNMENT ELECTIONS
The Council of the Shire of Wakool
667
Polling place locations
For 2012 map and polling places see –
www.pastvtr.elections.nsw.gov.au/LGE2012/the-council-of-the-shire-of-wakool.html
Advertising
Statutory Campaign
The Council requested that the statutory advertisements be placed in the following
press:
Swan Hill Guardian
Barham Bridge Koondrook Times
Northern Times
Deniliquin Pastoral Times
Candidates
Nominations withdrawn
No Councillor nominations were withdrawn.
Councillor Candidates
Total Candidates 7
Female Candidates 3
Male Candidates 4
A Ward Councillor Candidates
Total Candidates 3
Female Candidates 2
Male Candidates 1
B Ward Councillor Candidates
Total Candidates 2
Female Candidates 1
Male Candidates 1
C Ward Councillor Candidates
Total Candidates 2
Female Candidates 0
Male Candidates 2

REPORT ON THE 2012 LOCAL GOVERNMENT ELECTIONS
The Council of the Shire of Wakool
668
Names of all candidates
Councillor Candidates Party Affiliation
A Ward
CROWE, Ann -
DOUGLAS, Andrew -
LOCKHART, Lois -
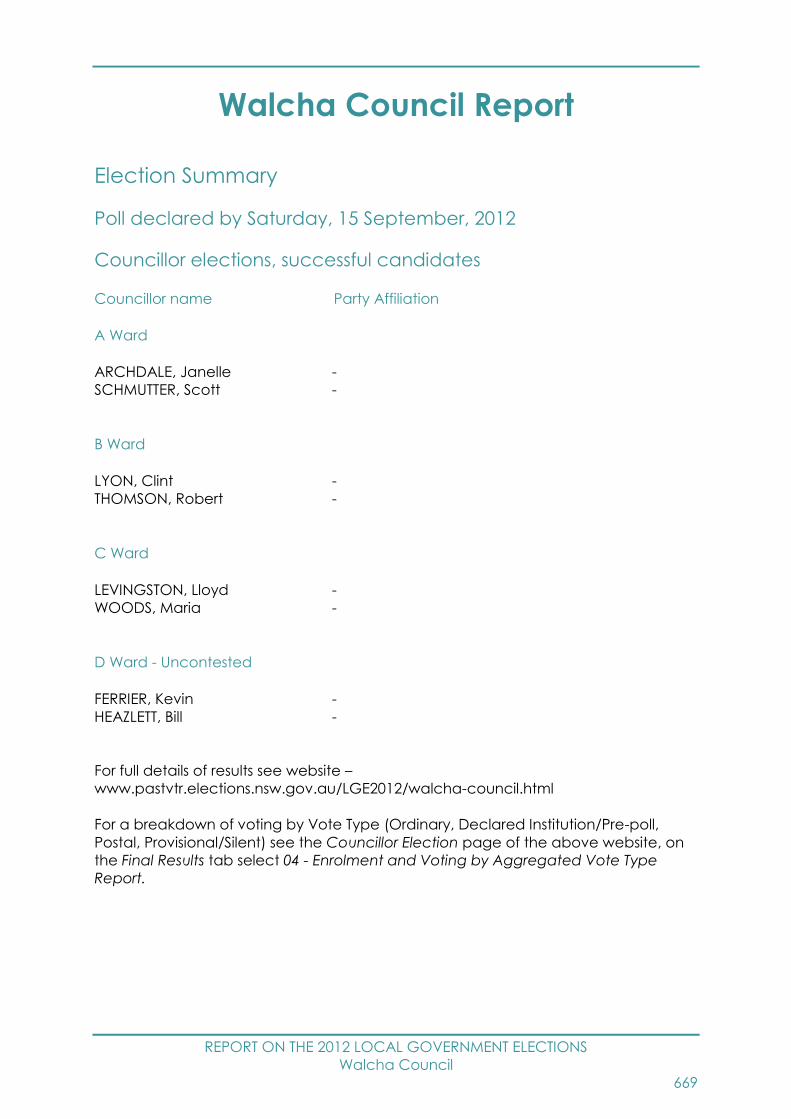
REPORT ON THE 2012 LOCAL GOVERNMENT ELECTIONS
Walcha Council
669
Walcha Council Report
Election Summary
Poll declared by Saturday, 15 September, 2012
Councillor elections, successful candidates
Councillor name Party Affiliation
A Ward
ARCHDALE, Janelle -
SCHMUTTER, Scott -
B Ward
LYON, Clint -
THOMSON, Robert -
C Ward
LEVINGSTON, Lloyd -
WOODS, Maria -
D Ward - Uncontested
FERRIER, Kevin -
HEAZLETT, Bill -
For full details of results see website –
www.pastvtr.elections.nsw.gov.au/LGE2012/walcha-council.html
For a breakdown of voting by Vote Type (Ordinary, Declared Institution/Pre-poll,
Postal, Provisional/Silent) see the Councillor Election page of the above website, on
the Final Results tab select 04 - Enrolment and Voting by Aggregated Vote Type
Report.
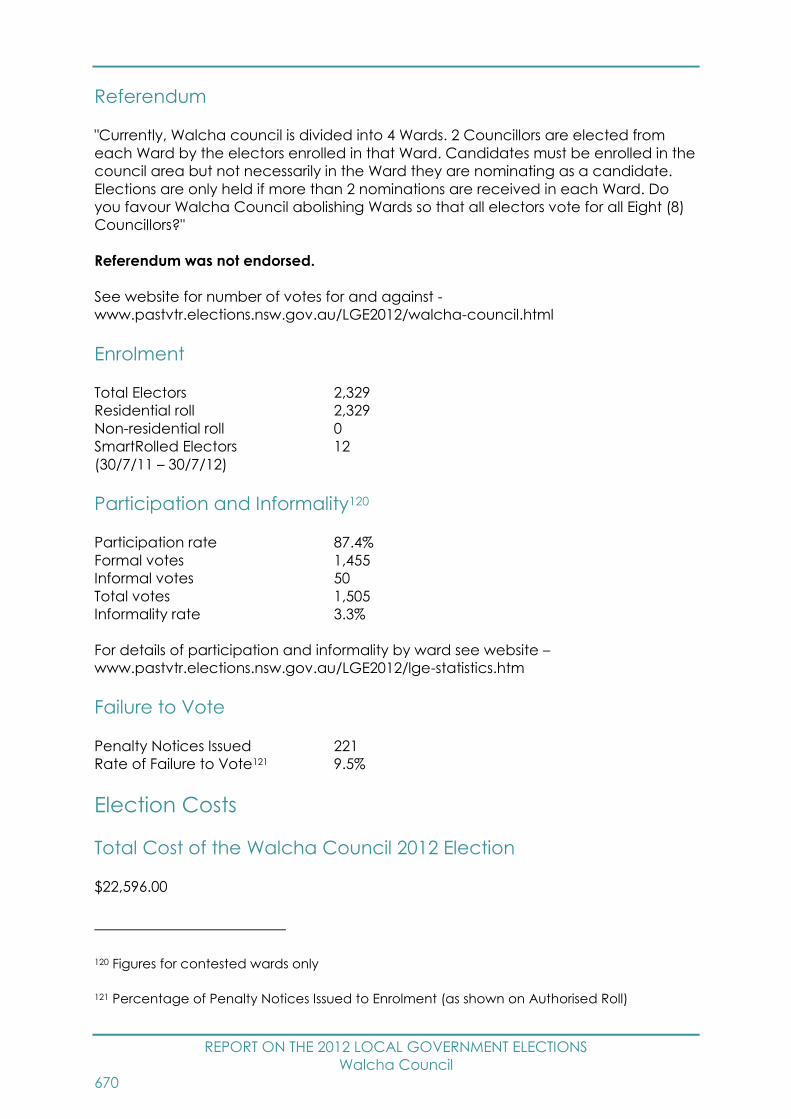
REPORT ON THE 2012 LOCAL GOVERNMENT ELECTIONS
Walcha Council
670
Referendum
"Currently, Walcha council is divided into 4 Wards. 2 Councillors are elected from
each Ward by the electors enrolled in that Ward. Candidates must be enrolled in the
council area but not necessarily in the Ward they are nominating as a candidate.
Elections are only held if more than 2 nominations are received in each Ward. Do
you favour Walcha Council abolishing Wards so that all electors vote for all Eight (8)
Councillors?"
Referendum was not endorsed.
See website for number of votes for and against -
www.pastvtr.elections.nsw.gov.au/LGE2012/walcha-council.html
Enrolment
Total Electors 2,329
Residential roll 2,329
Non-residential roll 0
SmartRolled Electors 12
(30/7/11 – 30/7/12)
Participation and Informality120
Participation rate 87.4%
Formal votes 1,455
Informal votes 50
Total votes 1,505
Informality rate 3.3%
For details of participation and informality by ward see website –
www.pastvtr.elections.nsw.gov.au/LGE2012/lge-statistics.htm
Failure to Vote
Penalty Notices Issued 221
Rate of Failure to Vote121 9.5%
Election Costs
Total Cost of the Walcha Council 2012 Election
$22,596.00
120 Figures for contested wards only
121 Percentage of Penalty Notices Issued to Enrolment (as shown on Authorised Roll)

REPORT ON THE 2012 LOCAL GOVERNMENT ELECTIONS
Walcha Council
671
Cost per elector
$9.73
Walcha Council Statutory Advertising Campaign Expenditure
Nominations $767.28
Candidates and polling places $1,358.20
Uncontested elections $289.70
Results $95.00
TOTAL $2,510.18
Election Services
Elector Enquiry Centre
The Elector Enquiry Centre answered 30 calls from postcodes within Walcha Council
area.
NSWEC Website
There were 726 unique visitors to Walcha Council election web page.
Braille Ballot Papers
No braille ballot papers were requested or printed.
Returning Officer
Desmond Breen
Returning Officer’s Office
Armidale Region Returning Officer's Office
2/206 Beardy Street
Armidale NSW 2350
Councils in Region
Armidale Dumaresq Council, Guyra Shire Council, Uralla Shire Council and Walcha
Council
Staffing
Office Manager 1
Senior Office Assistant 0
Office Assistants 0
Polling Place Managers 4
Polling Place Assistants 0

REPORT ON THE 2012 LOCAL GOVERNMENT ELECTIONS
Walcha Council
672
Deputy Polling Place Managers 0
Declaration Vote Issuing Officer 0
Election Officials 4
Council Count Manager 0
Part Day Election Officials 1
Total Staff 10
Polling Places
Pre-poll Centres 3
Declared Institutions 1
Election day Polling Places 9
Pre-poll centre locations
Armidale Region Returning Officer's Office, Walcha Pre-Poll, Sydney Town Hall
Polling place locations
For 2012 map and polling places see –
www.pastvtr.elections.nsw.gov.au/LGE2012/walcha-council.html
Advertising
Statutory Campaign
The Council requested that the statutory advertisements be placed in the following
press:
Walcha Apsley Advocate
Walcha News
Candidates
Nominations withdrawn
No Councillor nominations were withdrawn.
Councillor Candidates
Total Candidates 15
Female Candidates 4
Male Candidates 11
A Ward Councillor Candidates
Total Candidates 4
Female Candidates 2
Male Candidates 2

REPORT ON THE 2012 LOCAL GOVERNMENT ELECTIONS
Walcha Council
673
B Ward Councillor Candidates
Total Candidates 5
Female Candidates 0
Male Candidates 5
C Ward Councillor Candidates
Total Candidates 4
Female Candidates 2
Male Candidates 2
D Ward Councillor Candidates
Total Candidates 2
Female Candidates 0
Male Candidates 2
Names of all candidates
Councillor Candidates Party Affiliation
A Ward
ARCHDALE, Janelle -
BETTERRIDGE, Daniel -
CLARE, Debra -
SCHMUTTER, Scott -
B Ward
BIRD, David -
CROSS, John -
LYON, Clint -
MOXEY, Aaron -
THOMSON, Robert -
C Ward
KENNELLY, Tony -
LEVINGSTON, Lloyd -
SMITH, Janelle -
WOODS, Maria -

REPORT ON THE 2012 LOCAL GOVERNMENT ELECTIONS
Walgett Shire Council
674
Walgett Shire Council Report
Election Summary
Poll declared by Saturday, 15 September, 2012
Councillor elections, successful candidates
Councillor name Party Affiliation
COOPER, Darryl -
GREENAWAY, Robert -
KEIR, Jane -
LANE, David -
MARTINEZ, Manuel -
MURRAY, Bill -
TAYLOR, Michael -
WALFORD, Lawrence -
WOODCOCK, Ian -
For full details of results see website –
www.pastvtr.elections.nsw.gov.au/LGE2012/walgett-shire-council.html
For a breakdown of voting by Vote Type (Ordinary, Declared Institution/Pre-poll,
Postal, Provisional/Silent) see the Councillor Election page of the above website, on
the Final Results tab select 04 - Enrolment and Voting by Aggregated Vote Type
Report.
Enrolment
Total Electors 3,809
Residential roll 3,809
Non-residential roll 0
SmartRolled Electors 271
(30/7/11 – 30/7/12)
Participation and Informality
Participation rate 68.8%
Formal votes 2,497
Informal votes 122
Total votes 2,619
Informality rate 4.7%

REPORT ON THE 2012 LOCAL GOVERNMENT ELECTIONS
Walgett Shire Council
675
Failure to Vote
Penalty Notices Issued 942
Rate of Failure to Vote122 24.8%
Election Costs
Total Cost of the Walgett Shire Council 2012 Election
$34,292.00
Cost per elector
$9.02
Walgett Shire Council Statutory Advertising Campaign Expenditure
Nominations $1,798.47
Candidates and polling places $1,415.42
Uncontested elections $0.00
Results $421.57
TOTAL $3,635.46
Election Services
Elector Enquiry Centre
The Elector Enquiry Centre answered 83 calls from postcodes within Walgett Shire
Council area.
NSWEC Website
There were 488 unique visitors to Walgett Shire Council election web page.
Braille Ballot Papers
No braille ballot papers were requested or printed.
Returning Officer
Sarah Risby
122 Percentage of Penalty Notices Issued to Enrolment (as shown on Authorised Roll)

REPORT ON THE 2012 LOCAL GOVERNMENT ELECTIONS
Walgett Shire Council
676
Returning Officer’s Office
Moree Region Returning Officer's Office
Moree Banquet Hall
36 Balo Street
Moree NSW 2400
Councils in Region
Gwydir Shire Council, Moree Plains Shire Council, Narrabri Shire Council and Walgett
Shire Council
Staffing
Office Manager 1
Senior Office Assistant 0
Office Assistants 0
Polling Place Managers 7
Polling Place Assistants 0
Deputy Polling Place Managers 0
Declaration Vote Issuing Officer 1
Election Officials 9
Council Count Manager 0
Part Day Election Officials 0
Total Staff 18
Polling Places
Pre-poll Centres 3
Declared Institutions 0
Election day Polling Places 8
Pre-poll centre locations
Moree Region Returning Officer's Office, Walgett Pre-Poll, Sydney Town Hall
Polling place locations
For 2012 map and polling places see –
www.pastvtr.elections.nsw.gov.au/LGE2012/walgett-shire-council.html
Advertising
Statutory Campaign
The Council requested that the statutory advertisements be placed in the following
press:
Walgett Spectator
Lightning Ridge News
The Border News
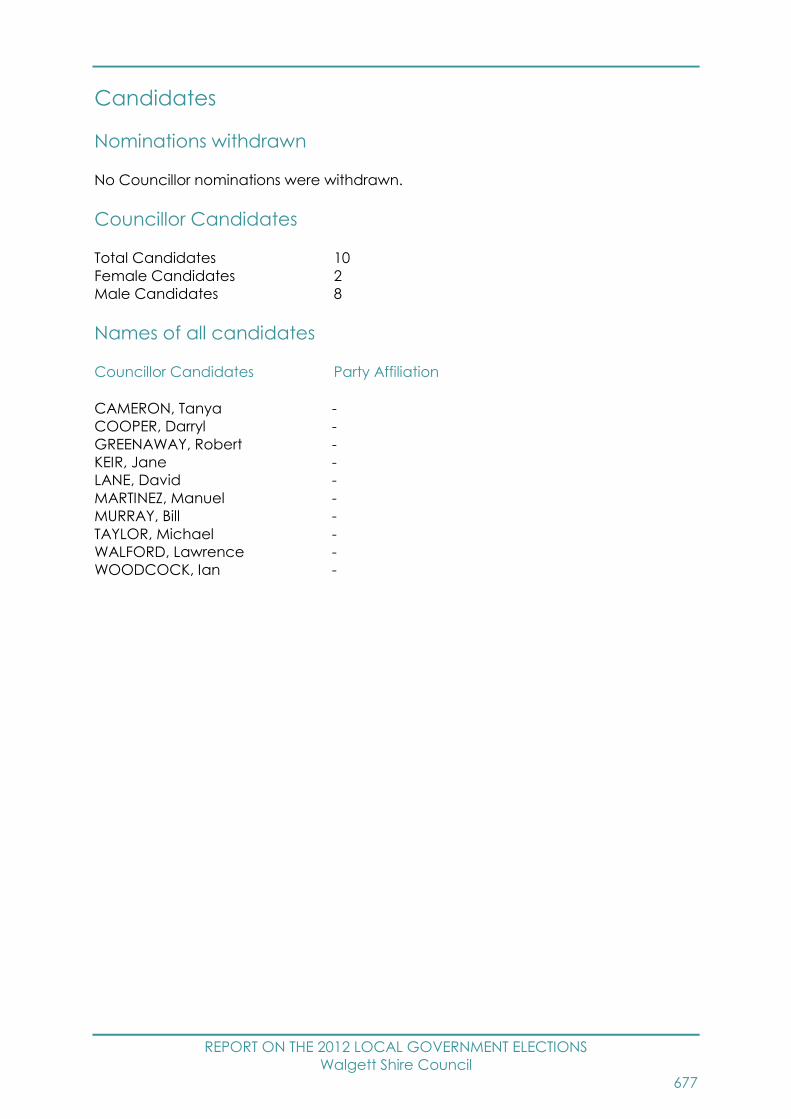
REPORT ON THE 2012 LOCAL GOVERNMENT ELECTIONS
Walgett Shire Council
677
Candidates
Nominations withdrawn
No Councillor nominations were withdrawn.
Councillor Candidates
Total Candidates 10
Female Candidates 2
Male Candidates 8
Names of all candidates
Councillor Candidates Party Affiliation
CAMERON, Tanya -
COOPER, Darryl -
GREENAWAY, Robert -
KEIR, Jane -
LANE, David -
MARTINEZ, Manuel -
MURRAY, Bill -
TAYLOR, Michael -
WALFORD, Lawrence -
WOODCOCK, Ian -
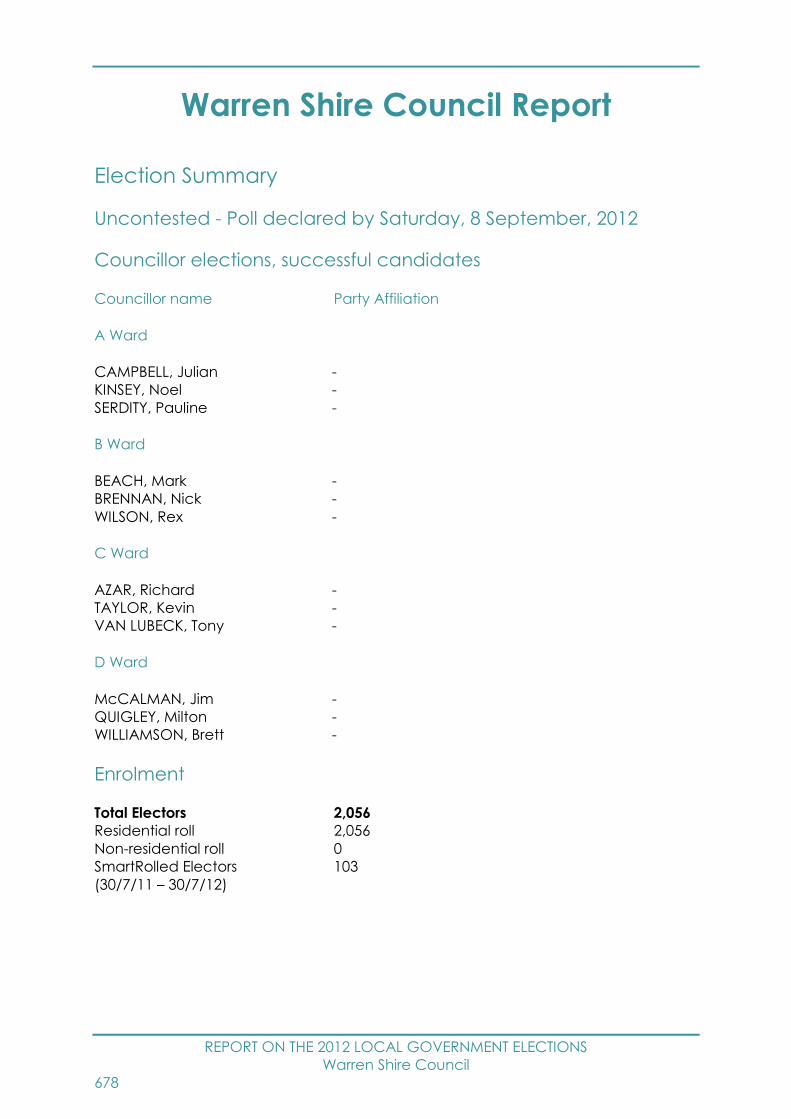
REPORT ON THE 2012 LOCAL GOVERNMENT ELECTIONS
Warren Shire Council
678
Warren Shire Council Report
Election Summary
Uncontested - Poll declared by Saturday, 8 September, 2012
Councillor elections, successful candidates
Councillor name Party Affiliation
A Ward
CAMPBELL, Julian -
KINSEY, Noel -
SERDITY, Pauline -
B Ward
BEACH, Mark -
BRENNAN, Nick -
WILSON, Rex -
C Ward
AZAR, Richard -
TAYLOR, Kevin -
VAN LUBECK, Tony -
D Ward
McCALMAN, Jim -
QUIGLEY, Milton -
WILLIAMSON, Brett -
Enrolment
Total Electors 2,056
Residential roll 2,056
Non-residential roll 0
SmartRolled Electors 103
(30/7/11 – 30/7/12)
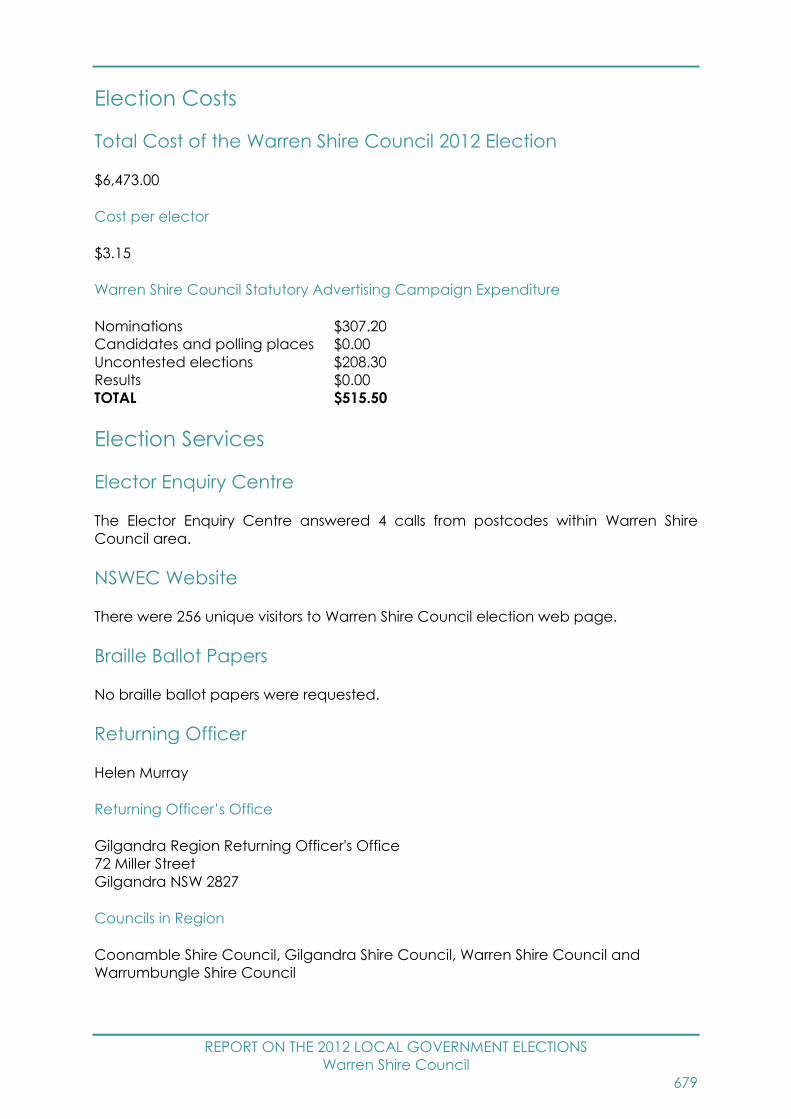
REPORT ON THE 2012 LOCAL GOVERNMENT ELECTIONS
Warren Shire Council
679
Election Costs
Total Cost of the Warren Shire Council 2012 Election
$6,473.00
Cost per elector
$3.15
Warren Shire Council Statutory Advertising Campaign Expenditure
Nominations $307.20
Candidates and polling places $0.00
Uncontested elections $208.30
Results $0.00
TOTAL $515.50
Election Services
Elector Enquiry Centre
The Elector Enquiry Centre answered 4 calls from postcodes within Warren Shire
Council area.
NSWEC Website
There were 256 unique visitors to Warren Shire Council election web page.
Braille Ballot Papers
No braille ballot papers were requested.
Returning Officer
Helen Murray
Returning Officer’s Office
Gilgandra Region Returning Officer's Office
72 Miller Street
Gilgandra NSW 2827
Councils in Region
Coonamble Shire Council, Gilgandra Shire Council, Warren Shire Council and
Warrumbungle Shire Council

REPORT ON THE 2012 LOCAL GOVERNMENT ELECTIONS
Warren Shire Council
680
Advertising
Statutory Campaign
The Council requested that the statutory advertisements be placed in the following
press:
Warren Weekly
Warren Advocate
Candidates
Nominations withdrawn
One Councillor nomination was withdrawn.
Councillor Candidates
Total Candidates 12
Female Candidates 2
Male Candidates 10
A Ward Councillor Candidates
Total Candidates 3
Female Candidates 2
Male Candidates 1
B Ward Councillor Candidates
Total Candidates 3
Female Candidates 0
Male Candidates 3
C Ward Councillor Candidates
Total Candidates 3
Female Candidates 0
Male Candidates 3
D Ward Councillor Candidates
Total Candidates 3
Female Candidates 0
Male Candidates 3
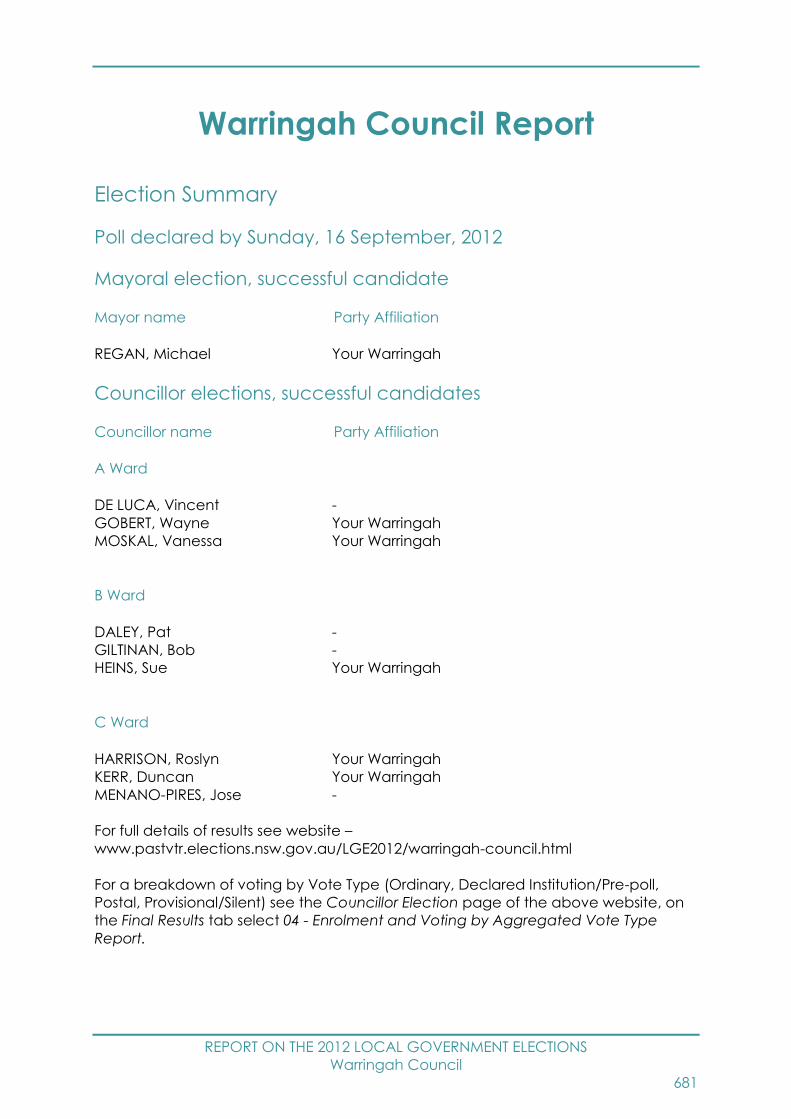
REPORT ON THE 2012 LOCAL GOVERNMENT ELECTIONS
Warringah Council
681
Warringah Council Report
Election Summary
Poll declared by Sunday, 16 September, 2012
Mayoral election, successful candidate
Mayor name Party Affiliation
REGAN, Michael Your Warringah
Councillor elections, successful candidates
Councillor name Party Affiliation
A Ward
DE LUCA, Vincent -
GOBERT, Wayne Your Warringah
MOSKAL, Vanessa Your Warringah
B Ward
DALEY, Pat -
GILTINAN, Bob -
HEINS, Sue Your Warringah
C Ward
HARRISON, Roslyn Your Warringah
KERR, Duncan Your Warringah
MENANO-PIRES, Jose -
For full details of results see website –
www.pastvtr.elections.nsw.gov.au/LGE2012/warringah-council.html
For a breakdown of voting by Vote Type (Ordinary, Declared Institution/Pre-poll,
Postal, Provisional/Silent) see the Councillor Election page of the above website, on
the Final Results tab select 04 - Enrolment and Voting by Aggregated Vote Type
Report.
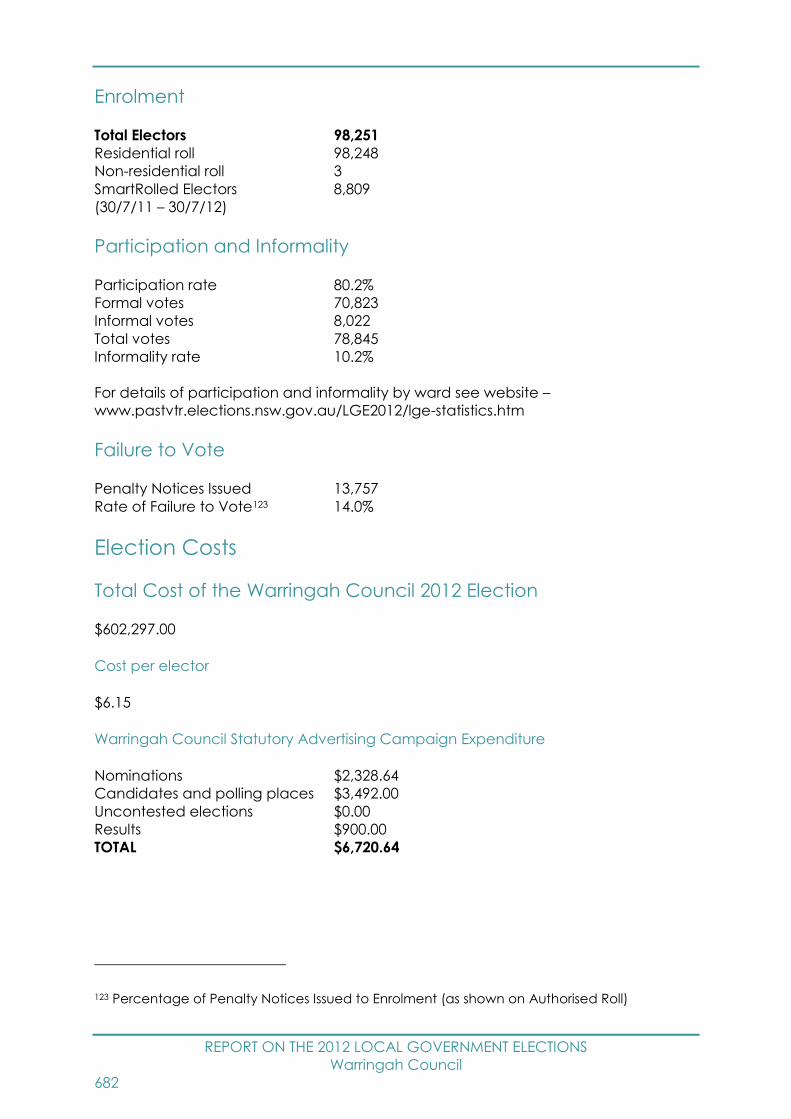
REPORT ON THE 2012 LOCAL GOVERNMENT ELECTIONS
Warringah Council
682
Enrolment
Total Electors 98,251
Residential roll 98,248
Non-residential roll 3
SmartRolled Electors 8,809
(30/7/11 – 30/7/12)
Participation and Informality
Participation rate 80.2%
Formal votes 70,823
Informal votes 8,022
Total votes 78,845
Informality rate 10.2%
For details of participation and informality by ward see website –
www.pastvtr.elections.nsw.gov.au/LGE2012/lge-statistics.htm
Failure to Vote
Penalty Notices Issued 13,757
Rate of Failure to Vote123 14.0%
Election Costs
Total Cost of the Warringah Council 2012 Election
$602,297.00
Cost per elector
$6.15
Warringah Council Statutory Advertising Campaign Expenditure
Nominations $2,328.64
Candidates and polling places $3,492.00
Uncontested elections $0.00
Results $900.00
TOTAL $6,720.64
123 Percentage of Penalty Notices Issued to Enrolment (as shown on Authorised Roll)
REPORT ON THE 2012 LOCAL GOVERNMENT ELECTIONS
Warringah Council
683
Election Services
Elector Enquiry Centre
The Elector Enquiry Centre answered 1,815 calls from postcodes within Warringah
Council area.
NSWEC Website
There were 11,207 unique visitors to Warringah Council election web page.
Braille Ballot Papers
No braille ballot papers were requested or printed.
Returning Officer
Elizabeth Wright
Returning Officer’s Office
Warringah Returning Officer's Office
295 Condamine Street
Manly Vale NSW 2093
Staffing
Office Manager 1
Senior Office Assistant 0
Office Assistants 48
Polling Place Managers 37
Polling Place Assistants 10
Deputy Polling Place Managers 22
Declaration Vote Issuing Officer 21
Election Officials 164
Council Count Manager 6
Part Day Election Officials 24
Total Staff 333
Polling Places
Pre-poll Centres 2
Declared Institutions 13
Election day Polling Places 46
Pre-poll centre locations
Warringah Returning Officer's Office, Sydney Town Hall
REPORT ON THE 2012 LOCAL GOVERNMENT ELECTIONS
Warringah Council
684
Polling place locations
For 2012 map and polling places see –
www.pastvtr.elections.nsw.gov.au/LGE2012/warringah-council.html
Advertising
Statutory Campaign
The Council requested that the statutory advertisements be placed in the following
press:
Manly Daily
Candidates
Nominations withdrawn
No Mayoral nominations were withdrawn.
No Councillor nominations were withdrawn.
Mayoral Candidates
Total Candidates 4
Female Candidates 1
Male Candidates 3
Councillor Candidates
Total Candidates 49
Female Candidates 21
Male Candidates 28
A Ward Councillor Candidates
Total Candidates 12
Female Candidates 6
Male Candidates 6
B Ward Councillor Candidates
Total Candidates 23
Female Candidates 10
Male Candidates 13
C Ward Councillor Candidates
Total Candidates 14
Female Candidates 5
Male Candidates 9
REPORT ON THE 2012 LOCAL GOVERNMENT ELECTIONS
Warringah Council
685
Names of all candidates
Mayoral Candidates Party Affiliation
DALEY, Pat -
DE LUCA, Vincent -
HARRIS, Conny The Greens
REGAN, Michael Your Warringah
Councillor Candidates Party Affiliation
A Ward
AMON, Rory -
DE LUCA, Vincent -
FALINSKI, Jason -
FINIANOS, Wendy -
FISHER, Rohan Your Warringah
GAMMIE, Denise -
GOBERT, Wayne Your Warringah
KIRSCH, Christina The Greens
LITTLE, Cameron The Greens
MOSKAL, Vanessa Your Warringah
POCHWYT, Halina The Greens
RAY, Michelle -
B Ward
BEACHLEY, Layne -
BLOOMFIELD, Michelle -
BURKE, Sean -
DALEY, Pat -
DODDS, Matthew -
GAMBACORTI, Angela Christian Democratic Party (Fred Nile Group)
GILTINAN, Bob -
HEINS, Sue Your Warringah
HENNESSEY, Adam -
HODGES, Ken -
LAKEMAN, Julia -
LOWE, Adrienne -
Mc CANN-YOUNG, Susan -
McKAY, Geoff -
MOORE, Graham -
NERO, Pasquale Christian Democratic Party (Fred Nile Group)
NERO, Silvana Christian Democratic Party (Fred Nile Group)
PETROLO, Anthony The Greens
RASMUSSEN, Joe The Greens
RICHARDS, Rob -
STANFORD, Gavin Your Warringah
THORNTON, Liz The Greens
WILKINS, Helen Your Warringah
REPORT ON THE 2012 LOCAL GOVERNMENT ELECTIONS
Warringah Council
686
C Ward
COFFIN, Carl -
COLLINS, Kevin -
CRVELIN, Bianca -
HARRIS, Conny The Greens
HARRISON, Roslyn Your Warringah
HEHIR, Ian The Greens
KERR, Duncan Your Warringah
KUYUMGIAN-RANKIN, Beatrice The Greens
LAUGESEN, Virginia -
LINDLEY, John -
MENANO-PIRES, Jose -
MOMDJIAN, Shahe -
REGAN, Michael Your Warringah
THORPE, Gordon Your Warringah
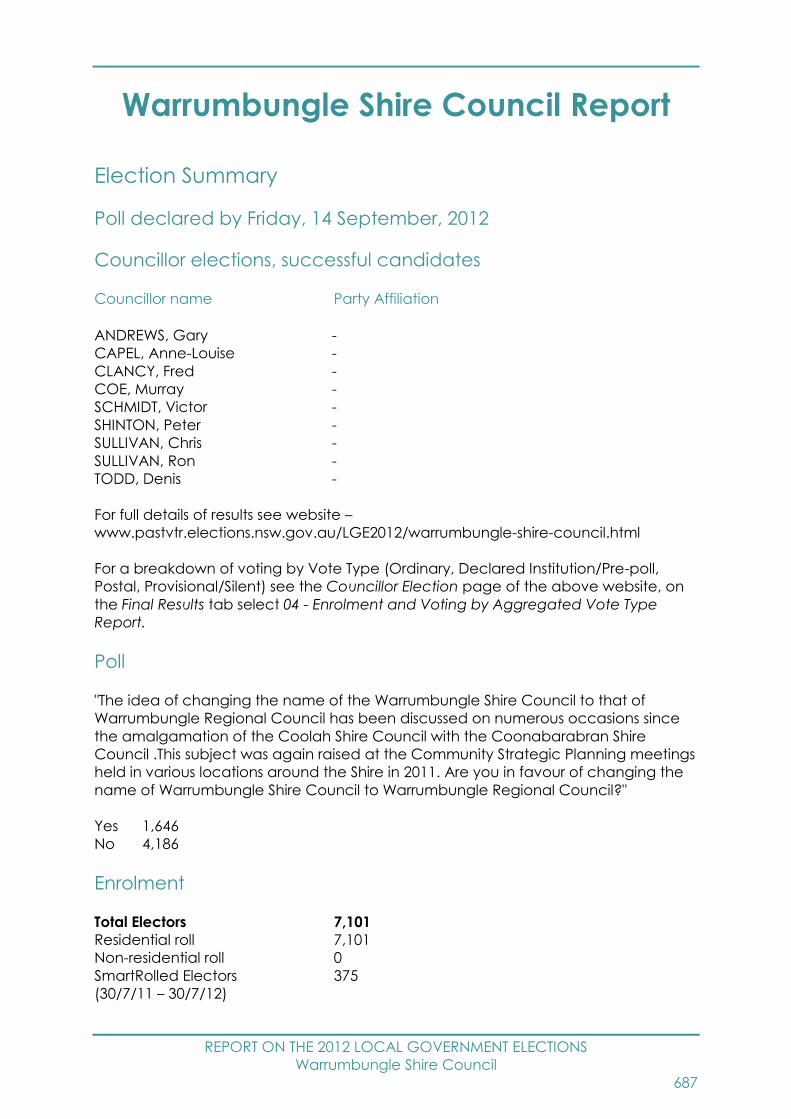
REPORT ON THE 2012 LOCAL GOVERNMENT ELECTIONS
Warrumbungle Shire Council
687
Warrumbungle Shire Council Report
Election Summary
Poll declared by Friday, 14 September, 2012
Councillor elections, successful candidates
Councillor name Party Affiliation
ANDREWS, Gary -
CAPEL, Anne-Louise -
CLANCY, Fred -
COE, Murray -
SCHMIDT, Victor -
SHINTON, Peter -
SULLIVAN, Chris -
SULLIVAN, Ron -
TODD, Denis -
For full details of results see website –
www.pastvtr.elections.nsw.gov.au/LGE2012/warrumbungle-shire-council.html
For a breakdown of voting by Vote Type (Ordinary, Declared Institution/Pre-poll,
Postal, Provisional/Silent) see the Councillor Election page of the above website, on
the Final Results tab select 04 - Enrolment and Voting by Aggregated Vote Type
Report.
Poll
"The idea of changing the name of the Warrumbungle Shire Council to that of
Warrumbungle Regional Council has been discussed on numerous occasions since
the amalgamation of the Coolah Shire Council with the Coonabarabran Shire
Council .This subject was again raised at the Community Strategic Planning meetings
held in various locations around the Shire in 2011. Are you in favour of changing the
name of Warrumbungle Shire Council to Warrumbungle Regional Council?"
Yes 1,646
No 4,186
Enrolment
Total Electors 7,101
Residential roll 7,101
Non-residential roll 0
SmartRolled Electors 375
(30/7/11 – 30/7/12)
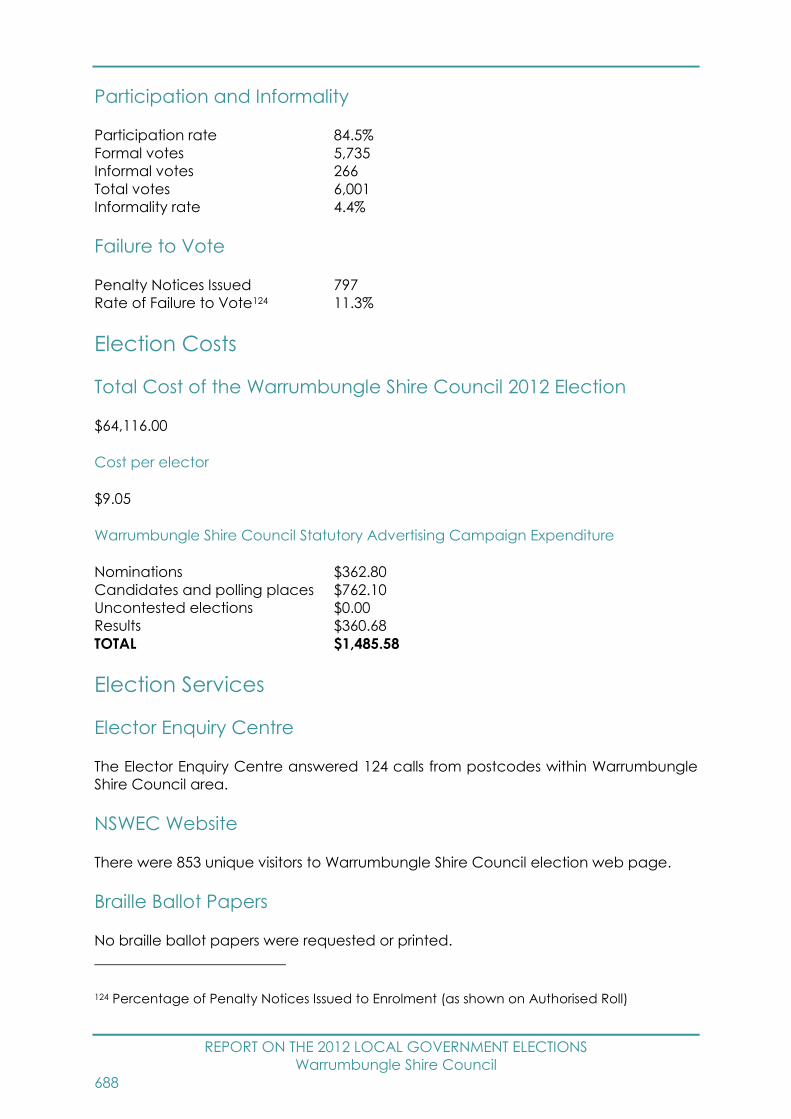
REPORT ON THE 2012 LOCAL GOVERNMENT ELECTIONS
Warrumbungle Shire Council
688
Participation and Informality
Participation rate 84.5%
Formal votes 5,735
Informal votes 266
Total votes 6,001
Informality rate 4.4%
Failure to Vote
Penalty Notices Issued 797
Rate of Failure to Vote124 11.3%
Election Costs
Total Cost of the Warrumbungle Shire Council 2012 Election
$64,116.00
Cost per elector
$9.05
Warrumbungle Shire Council Statutory Advertising Campaign Expenditure
Nominations $362.80
Candidates and polling places $762.10
Uncontested elections $0.00
Results $360.68
TOTAL $1,485.58
Election Services
Elector Enquiry Centre
The Elector Enquiry Centre answered 124 calls from postcodes within Warrumbungle
Shire Council area.
NSWEC Website
There were 853 unique visitors to Warrumbungle Shire Council election web page.
Braille Ballot Papers
No braille ballot papers were requested or printed.
124 Percentage of Penalty Notices Issued to Enrolment (as shown on Authorised Roll)
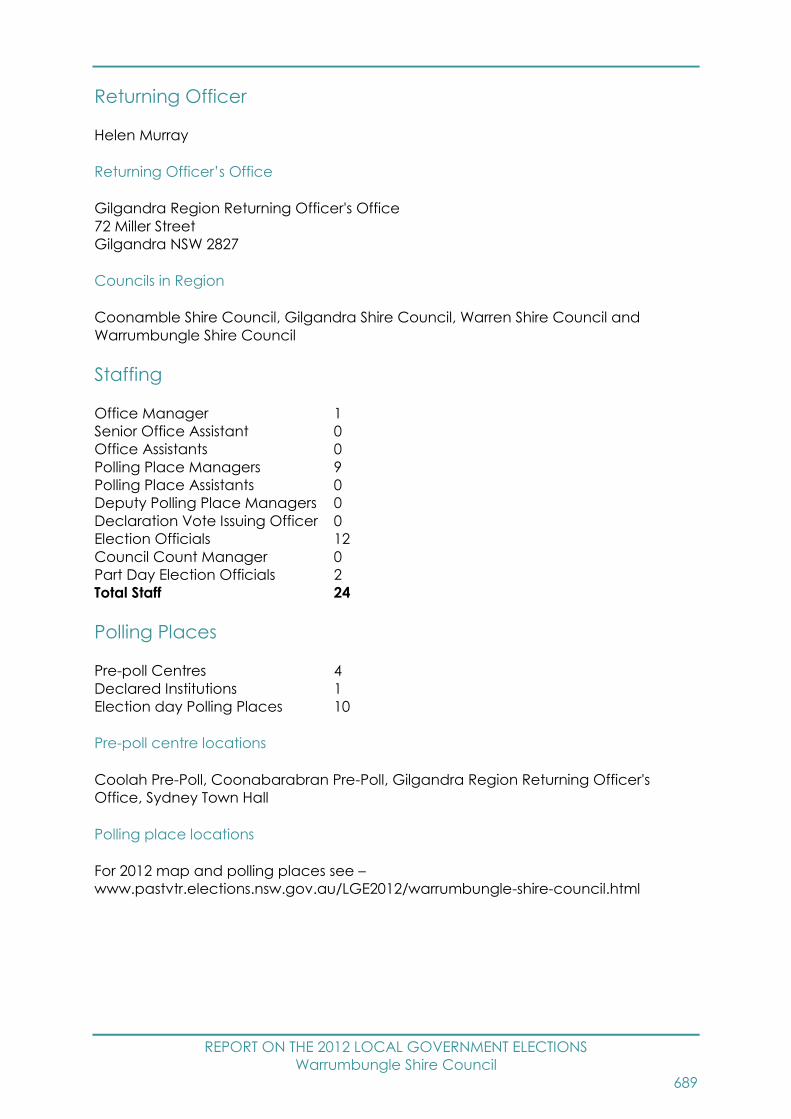
REPORT ON THE 2012 LOCAL GOVERNMENT ELECTIONS
Warrumbungle Shire Council
689
Returning Officer
Helen Murray
Returning Officer’s Office
Gilgandra Region Returning Officer's Office
72 Miller Street
Gilgandra NSW 2827
Councils in Region
Coonamble Shire Council, Gilgandra Shire Council, Warren Shire Council and
Warrumbungle Shire Council
Staffing
Office Manager 1
Senior Office Assistant 0
Office Assistants 0
Polling Place Managers 9
Polling Place Assistants 0
Deputy Polling Place Managers 0
Declaration Vote Issuing Officer 0
Election Officials 12
Council Count Manager 0
Part Day Election Officials 2
Total Staff 24
Polling Places
Pre-poll Centres 4
Declared Institutions 1
Election day Polling Places 10
Pre-poll centre locations
Coolah Pre-Poll, Coonabarabran Pre-Poll, Gilgandra Region Returning Officer's
Office, Sydney Town Hall
Polling place locations
For 2012 map and polling places see –
www.pastvtr.elections.nsw.gov.au/LGE2012/warrumbungle-shire-council.html
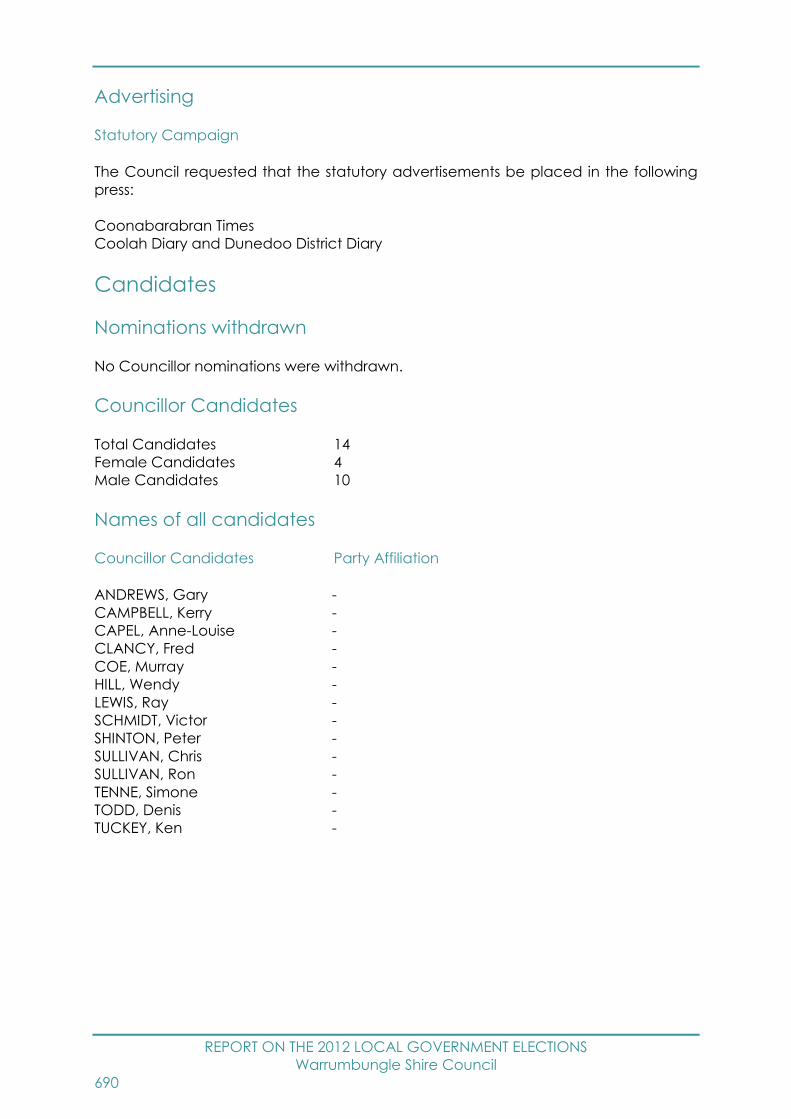
REPORT ON THE 2012 LOCAL GOVERNMENT ELECTIONS
Warrumbungle Shire Council
690
Advertising
Statutory Campaign
The Council requested that the statutory advertisements be placed in the following
press:
Coonabarabran Times
Coolah Diary and Dunedoo District Diary
Candidates
Nominations withdrawn
No Councillor nominations were withdrawn.
Councillor Candidates
Total Candidates 14
Female Candidates 4
Male Candidates 10
Names of all candidates
Councillor Candidates Party Affiliation
ANDREWS, Gary -
CAMPBELL, Kerry -
CAPEL, Anne-Louise -
CLANCY, Fred -
COE, Murray -
HILL, Wendy -
LEWIS, Ray -
SCHMIDT, Victor -
SHINTON, Peter -
SULLIVAN, Chris -
SULLIVAN, Ron -
TENNE, Simone -
TODD, Denis -
TUCKEY, Ken -
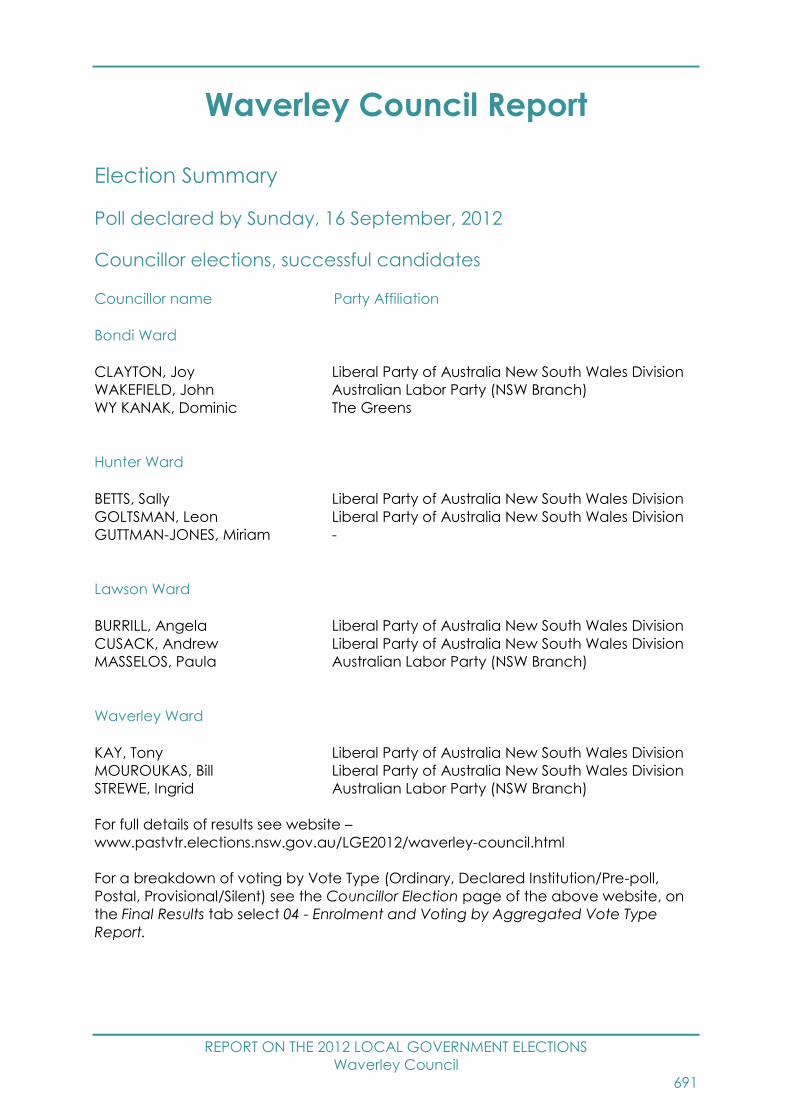
REPORT ON THE 2012 LOCAL GOVERNMENT ELECTIONS
Waverley Council
691
Waverley Council Report
Election Summary
Poll declared by Sunday, 16 September, 2012
Councillor elections, successful candidates
Councillor name Party Affiliation
Bondi Ward
CLAYTON, Joy Liberal Party of Australia New South Wales Division
WAKEFIELD, John Australian Labor Party (NSW Branch)
WY KANAK, Dominic The Greens
Hunter Ward
BETTS, Sally Liberal Party of Australia New South Wales Division
GOLTSMAN, Leon Liberal Party of Australia New South Wales Division
GUTTMAN-JONES, Miriam -
Lawson Ward
BURRILL, Angela Liberal Party of Australia New South Wales Division
CUSACK, Andrew Liberal Party of Australia New South Wales Division
MASSELOS, Paula Australian Labor Party (NSW Branch)
Waverley Ward
KAY, Tony Liberal Party of Australia New South Wales Division
MOUROUKAS, Bill Liberal Party of Australia New South Wales Division
STREWE, Ingrid Australian Labor Party (NSW Branch)
For full details of results see website –
www.pastvtr.elections.nsw.gov.au/LGE2012/waverley-council.html
For a breakdown of voting by Vote Type (Ordinary, Declared Institution/Pre-poll,
Postal, Provisional/Silent) see the Councillor Election page of the above website, on
the Final Results tab select 04 - Enrolment and Voting by Aggregated Vote Type
Report.
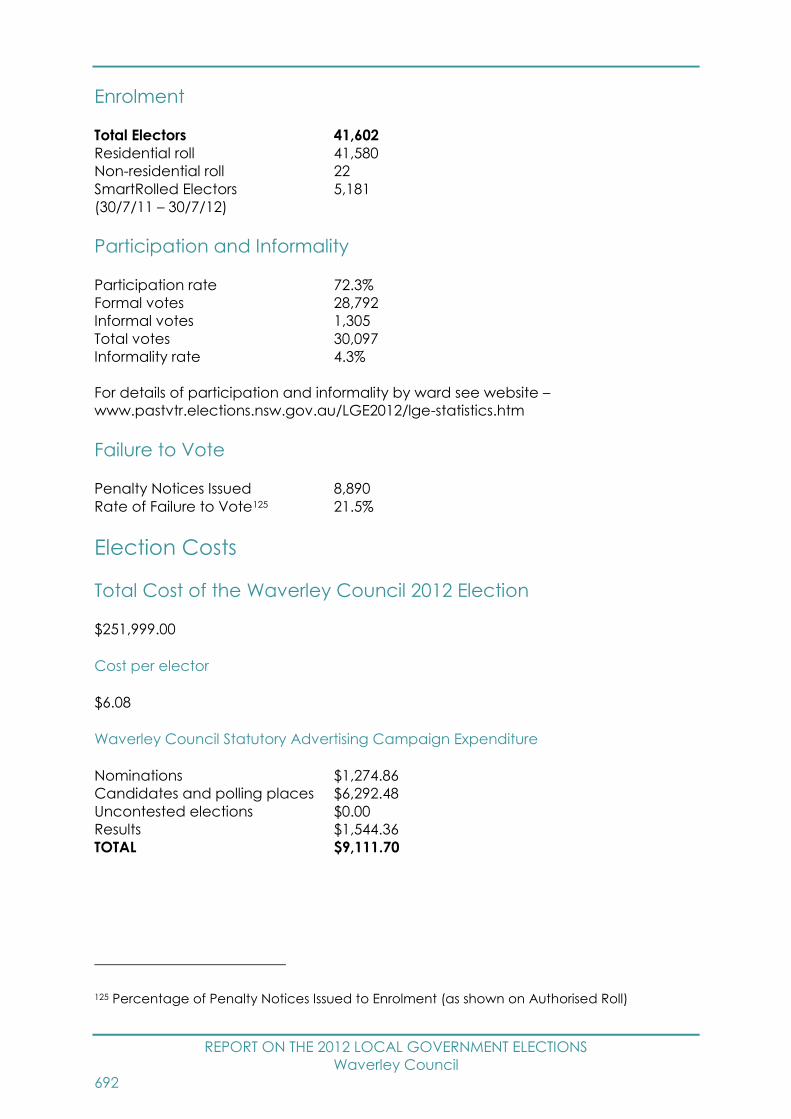
REPORT ON THE 2012 LOCAL GOVERNMENT ELECTIONS
Waverley Council
692
Enrolment
Total Electors 41,602
Residential roll 41,580
Non-residential roll 22
SmartRolled Electors 5,181
(30/7/11 – 30/7/12)
Participation and Informality
Participation rate 72.3%
Formal votes 28,792
Informal votes 1,305
Total votes 30,097
Informality rate 4.3%
For details of participation and informality by ward see website –
www.pastvtr.elections.nsw.gov.au/LGE2012/lge-statistics.htm
Failure to Vote
Penalty Notices Issued 8,890
Rate of Failure to Vote125 21.5%
Election Costs
Total Cost of the Waverley Council 2012 Election
$251,999.00
Cost per elector
$6.08
Waverley Council Statutory Advertising Campaign Expenditure
Nominations $1,274.86
Candidates and polling places $6,292.48
Uncontested elections $0.00
Results $1,544.36
TOTAL $9,111.70
125 Percentage of Penalty Notices Issued to Enrolment (as shown on Authorised Roll)
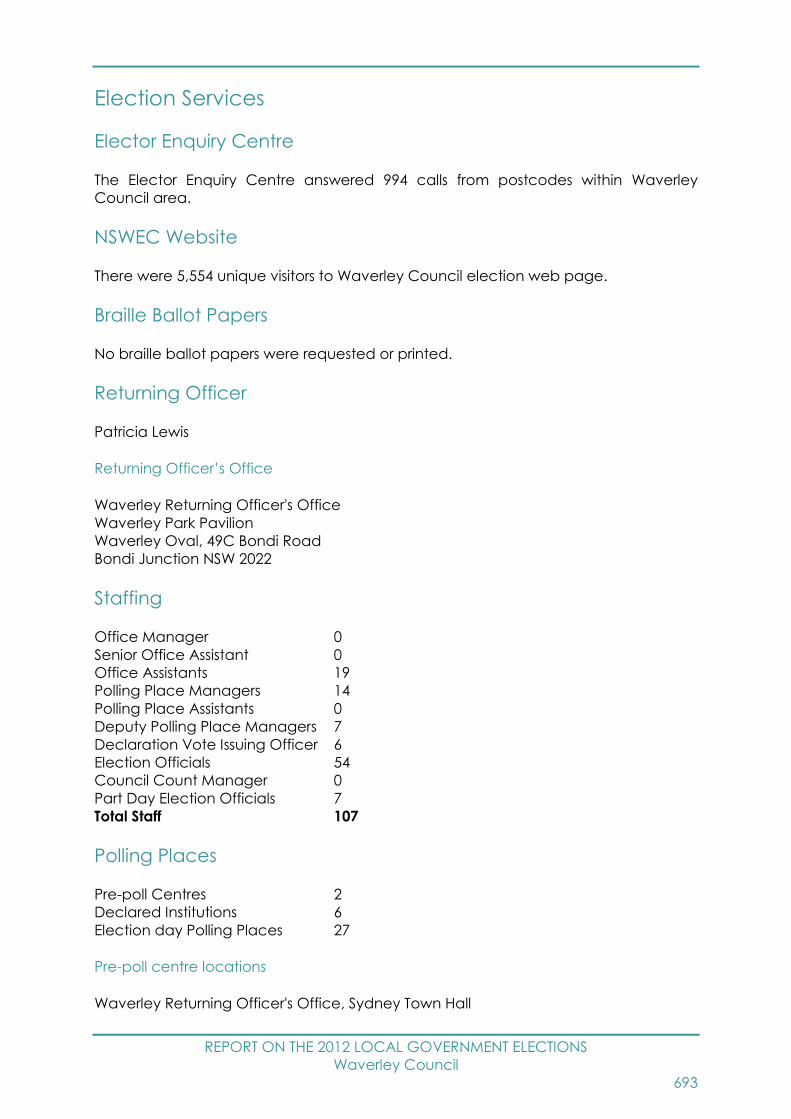
REPORT ON THE 2012 LOCAL GOVERNMENT ELECTIONS
Waverley Council
693
Election Services
Elector Enquiry Centre
The Elector Enquiry Centre answered 994 calls from postcodes within Waverley
Council area.
NSWEC Website
There were 5,554 unique visitors to Waverley Council election web page.
Braille Ballot Papers
No braille ballot papers were requested or printed.
Returning Officer
Patricia Lewis
Returning Officer’s Office
Waverley Returning Officer's Office
Waverley Park Pavilion
Waverley Oval, 49C Bondi Road
Bondi Junction NSW 2022
Staffing
Office Manager 0
Senior Office Assistant 0
Office Assistants 19
Polling Place Managers 14
Polling Place Assistants 0
Deputy Polling Place Managers 7
Declaration Vote Issuing Officer 6
Election Officials 54
Council Count Manager 0
Part Day Election Officials 7
Total Staff 107
Polling Places
Pre-poll Centres 2
Declared Institutions 6
Election day Polling Places 27
Pre-poll centre locations
Waverley Returning Officer's Office, Sydney Town Hall

REPORT ON THE 2012 LOCAL GOVERNMENT ELECTIONS
Waverley Council
694
Polling place locations
For 2012 map and polling places see –
www.pastvtr.elections.nsw.gov.au/LGE2012/waverley-council.html
Advertising
Statutory Campaign
The Council requested that the statutory advertisements be placed in the following
press:
Wentworth Courier
Candidates
Nominations withdrawn
No Councillor nominations were withdrawn.
Councillor Candidates
Total Candidates 40
Female Candidates 17
Male Candidates 23
Bondi Ward Councillor Candidates
Total Candidates 10
Female Candidates 4
Male Candidates 6
Hunter Ward Councillor Candidates
Total Candidates 12
Female Candidates 5
Male Candidates 7
Lawson Ward Councillor Candidates
Total Candidates 9
Female Candidates 5
Male Candidates 4
Waverley Ward Councillor Candidates
Total Candidates 9
Female Candidates 3
Male Candidates 6

REPORT ON THE 2012 LOCAL GOVERNMENT ELECTIONS
Waverley Council
695
Names of all candidates
Councillor Candidates Party Affiliation
Bondi Ward
CHARLTON, Colin The Greens
CLAYTON, Joy Liberal Party of Australia New South Wales Division
JEFFREY, David Liberal Party of Australia New South Wales Division
KULAKAUSKAS, Lenore Australian Labor Party (NSW Branch)
LEAHY, Mary-Jane The Greens
MAKSIMOVICH, Brent Liberal Party of Australia New South Wales Division
SMITH, Di Australian Labor Party (NSW Branch)
STANFORD, Charles -
WAKEFIELD, John Australian Labor Party (NSW Branch)
WY KANAK, Dominic The Greens
Hunter Ward
BETTS, Sally Liberal Party of Australia New South Wales Division
CUNIO, Stephanie Australian Labor Party (NSW Branch)
DAVIES, Tom Australian Labor Party (NSW Branch)
FRAZER, Dov -
GOLTSMAN, Leon Liberal Party of Australia New South Wales Division
GUERRY, Annette -
GUTTMAN-JONES, Miriam -
HENRY, Paul The Greens
MEWTON, Ross The Greens
MILSON, Virginia The Greens
PEARCE, Paul Australian Labor Party (NSW Branch)
VALENZA, Dario Liberal Party of Australia New South Wales Division
Lawson Ward
BRASS, Adam The Greens
BURRILL, Angela Liberal Party of Australia New South Wales Division
CUSACK, Andrew Liberal Party of Australia New South Wales Division
JOSLYN, Lynne The Greens
MAIN, Mora The Greens
MASSELOS, Paula Australian Labor Party (NSW Branch)
O'NEILL, Brian Australian Labor Party (NSW Branch)
PAPPAS, Alexander Liberal Party of Australia New South Wales Division
PENA, Eileen Australian Labor Party (NSW Branch)

REPORT ON THE 2012 LOCAL GOVERNMENT ELECTIONS
Waverley Council
696
Waverley Ward
CANCIAN, Prue The Greens
COMNINOS, Byron The Greens
COPELAND, George The Greens
JAEGER, Michael Liberal Party of Australia New South Wales Division
KAY, Tony Liberal Party of Australia New South Wales Division
MORTIMER, Luke Australian Labor Party (NSW Branch)
MOUROUKAS, Bill Liberal Party of Australia New South Wales Division
O'NEILL, Marjorie Australian Labor Party (NSW Branch)
STREWE, Ingrid Australian Labor Party (NSW Branch)
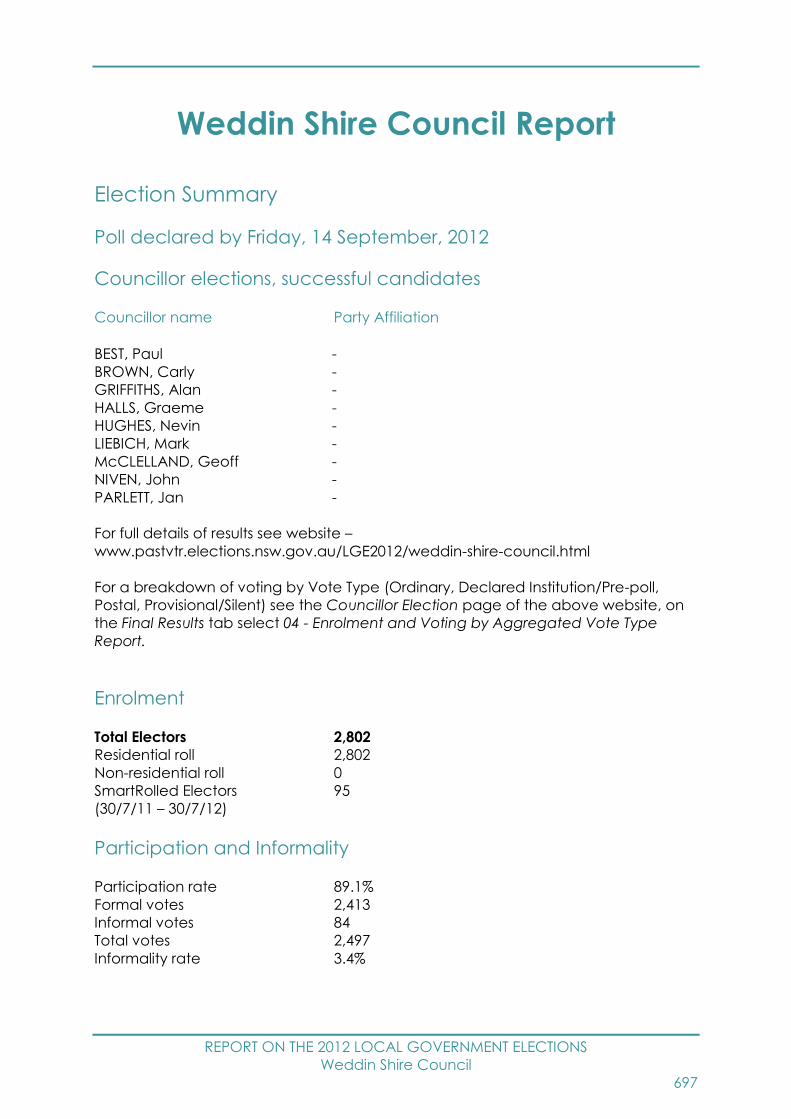
REPORT ON THE 2012 LOCAL GOVERNMENT ELECTIONS
Weddin Shire Council
697
Weddin Shire Council Report
Election Summary
Poll declared by Friday, 14 September, 2012
Councillor elections, successful candidates
Councillor name Party Affiliation
BEST, Paul -
BROWN, Carly -
GRIFFITHS, Alan -
HALLS, Graeme -
HUGHES, Nevin -
LIEBICH, Mark -
McCLELLAND, Geoff -
NIVEN, John -
PARLETT, Jan -
For full details of results see website –
www.pastvtr.elections.nsw.gov.au/LGE2012/weddin-shire-council.html
For a breakdown of voting by Vote Type (Ordinary, Declared Institution/Pre-poll,
Postal, Provisional/Silent) see the Councillor Election page of the above website, on
the Final Results tab select 04 - Enrolment and Voting by Aggregated Vote Type
Report.
Enrolment
Total Electors 2,802
Residential roll 2,802
Non-residential roll 0
SmartRolled Electors 95
(30/7/11 – 30/7/12)
Participation and Informality
Participation rate 89.1%
Formal votes 2,413
Informal votes 84
Total votes 2,497
Informality rate 3.4%
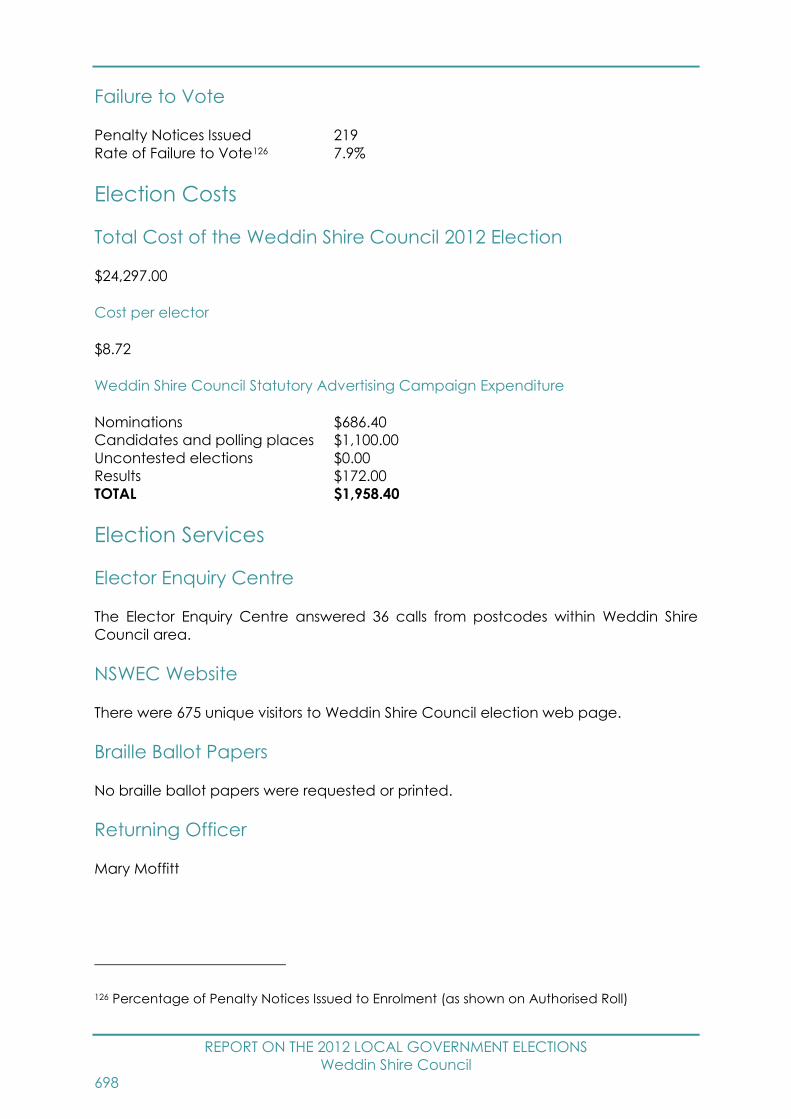
REPORT ON THE 2012 LOCAL GOVERNMENT ELECTIONS
Weddin Shire Council
698
Failure to Vote
Penalty Notices Issued 219
Rate of Failure to Vote126 7.9%
Election Costs
Total Cost of the Weddin Shire Council 2012 Election
$24,297.00
Cost per elector
$8.72
Weddin Shire Council Statutory Advertising Campaign Expenditure
Nominations $686.40
Candidates and polling places $1,100.00
Uncontested elections $0.00
Results $172.00
TOTAL $1,958.40
Election Services
Elector Enquiry Centre
The Elector Enquiry Centre answered 36 calls from postcodes within Weddin Shire
Council area.
NSWEC Website
There were 675 unique visitors to Weddin Shire Council election web page.
Braille Ballot Papers
No braille ballot papers were requested or printed.
Returning Officer
Mary Moffitt
126 Percentage of Penalty Notices Issued to Enrolment (as shown on Authorised Roll)
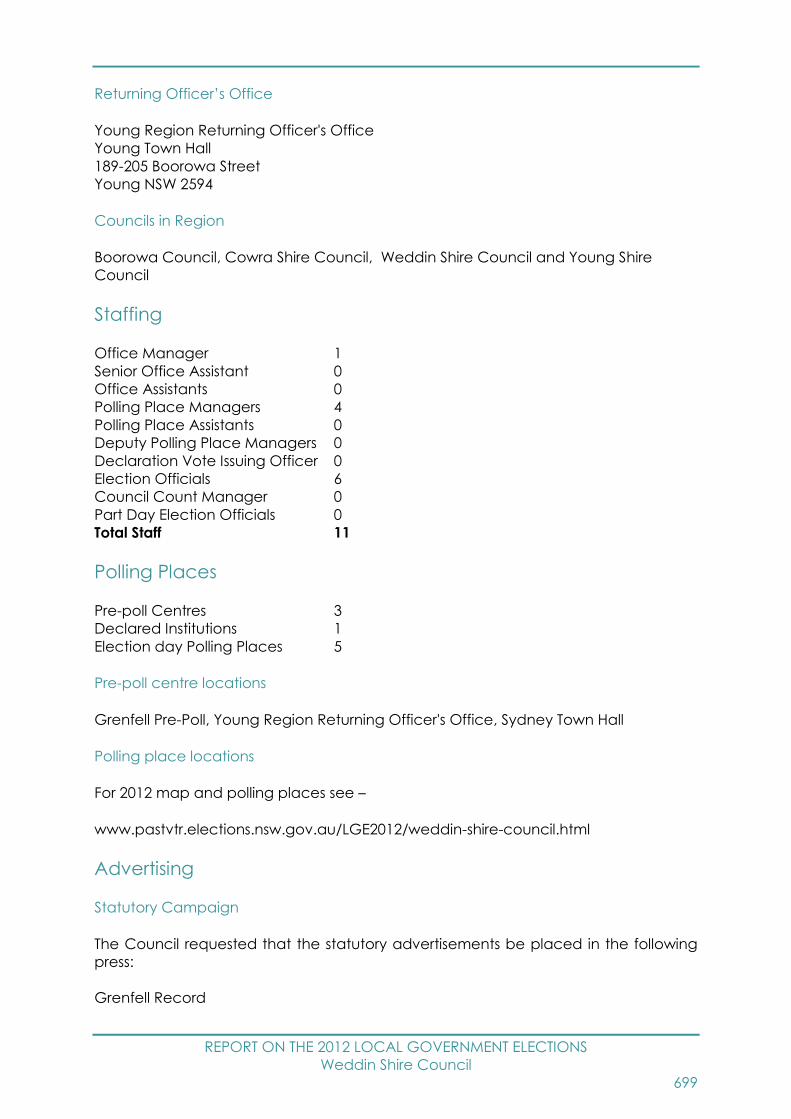
REPORT ON THE 2012 LOCAL GOVERNMENT ELECTIONS
Weddin Shire Council
699
Returning Officer’s Office
Young Region Returning Officer's Office
Young Town Hall
189-205 Boorowa Street
Young NSW 2594
Councils in Region
Boorowa Council, Cowra Shire Council, Weddin Shire Council and Young Shire
Council
Staffing
Office Manager 1
Senior Office Assistant 0
Office Assistants 0
Polling Place Managers 4
Polling Place Assistants 0
Deputy Polling Place Managers 0
Declaration Vote Issuing Officer 0
Election Officials 6
Council Count Manager 0
Part Day Election Officials 0
Total Staff 11
Polling Places
Pre-poll Centres 3
Declared Institutions 1
Election day Polling Places 5
Pre-poll centre locations
Grenfell Pre-Poll, Young Region Returning Officer's Office, Sydney Town Hall
Polling place locations
For 2012 map and polling places see –
www.pastvtr.elections.nsw.gov.au/LGE2012/weddin-shire-council.html
Advertising
Statutory Campaign
The Council requested that the statutory advertisements be placed in the following
press:
Grenfell Record

REPORT ON THE 2012 LOCAL GOVERNMENT ELECTIONS
Weddin Shire Council
700
Candidates
Nominations withdrawn
No Councillor nominations were withdrawn.
Councillor Candidates
Total Candidates 23
Female Candidates 7
Male Candidates 16
Names of all candidates
Councillor Candidates Party Affiliation
ATCHISON, Bill -
BEST, Paul -
BRANDT, Noelene -
BROWN, Carly -
BURN, Leslie -
EDWARDS, Ken -
GREEN, Bill -
GRIFFITHS, Alan -
GRIMM, Graham -
HALLS, Graeme -
HINDE, Barry -
HUGHES, Nevin -
LIEBICH, Mark -
LOBB, Chris -
McCLELLAND, Geoff -
McSPADDEN, Bill -
MELLON, Valerie -
MITTON, Katie -
NIVEN, John -
O'LOUGHLIN, James -
PARLETT, Jan -
THOROUGHGOOD, Brian -
THOROUGHGOOD, Dale -

REPORT ON THE 2012 LOCAL GOVERNMENT ELECTIONS
Wellington Council
701
Wellington Council Report
Election Summary
Poll declared by Thursday, 13 September, 2012
Councillor elections, successful candidates
Councillor name Party Affiliation
BUHR, Rod -
CONN, Alison -
CROSS, Graham -
DRAY, Terry -
GRANT, David -
GRIGGS, Mark -
HANNEY, Marcus -
JONES, Anne -
SMITH, Pip -
For full details of results see website –
www.pastvtr.elections.nsw.gov.au/LGE2012/wellington-council.html
For a breakdown of voting by Vote Type (Ordinary, Declared Institution/Pre-poll,
Postal, Provisional/Silent) see the Councillor Election page of the above website, on
the Final Results tab select 04 - Enrolment and Voting by Aggregated Vote Type
Report.
Enrolment
Total Electors 5,703
Residential roll 5,701
Non-residential roll 2
SmartRolled Electors 439
(30/7/11 – 30/7/12)
Participation and Informality
Participation rate 86.2%
Formal votes 4,451
Informal votes 463
Total votes 4,914
Informality rate 9.4%
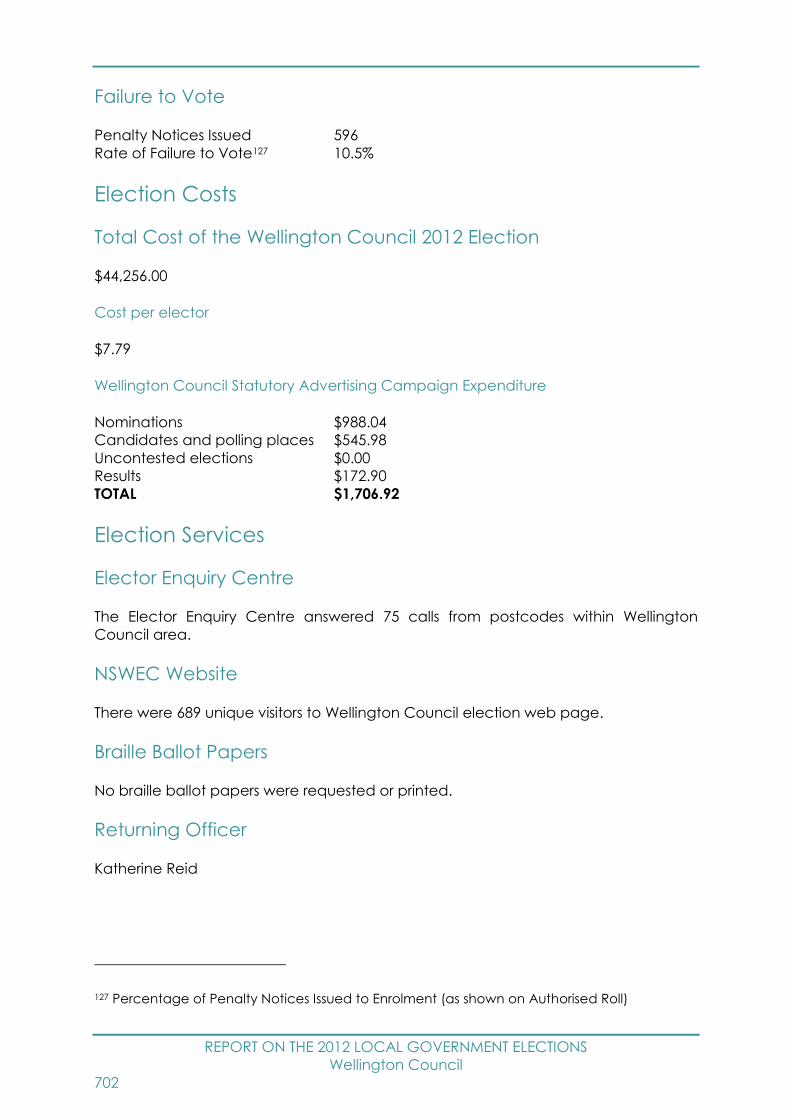
REPORT ON THE 2012 LOCAL GOVERNMENT ELECTIONS
Wellington Council
702
Failure to Vote
Penalty Notices Issued 596
Rate of Failure to Vote127 10.5%
Election Costs
Total Cost of the Wellington Council 2012 Election
$44,256.00
Cost per elector
$7.79
Wellington Council Statutory Advertising Campaign Expenditure
Nominations $988.04
Candidates and polling places $545.98
Uncontested elections $0.00
Results $172.90
TOTAL $1,706.92
Election Services
Elector Enquiry Centre
The Elector Enquiry Centre answered 75 calls from postcodes within Wellington
Council area.
NSWEC Website
There were 689 unique visitors to Wellington Council election web page.
Braille Ballot Papers
No braille ballot papers were requested or printed.
Returning Officer
Katherine Reid
127 Percentage of Penalty Notices Issued to Enrolment (as shown on Authorised Roll)

REPORT ON THE 2012 LOCAL GOVERNMENT ELECTIONS
Wellington Council
703
Returning Officer’s Office
Dubbo Region Returning Officer's Office
108 Macquarie Street
Dubbo NSW 2830
Councils in Region
Dubbo City Council, Narromine Shire Council and Wellington Council
Staffing
Office Manager 1
Senior Office Assistant 0
Office Assistants 0
Polling Place Managers 8
Polling Place Assistants 0
Deputy Polling Place Managers 0
Declaration Vote Issuing Officer 0
Election Officials 10
Council Count Manager 0
Part Day Election Officials 0
Total Staff 19
Polling Places
Pre-poll Centres 3
Declared Institutions 3
Election day Polling Places 9
Pre-poll centre locations
Dubbo Region Returning Officer's Office, Wellington Pre-Poll, Sydney Town Hall
Polling place locations
For 2012 map and polling places see –
www.pastvtr.elections.nsw.gov.au/LGE2012/wellington-council.html
Advertising
Statutory Campaign
The Council requested that the statutory advertisements be placed in the following
press:
Wellington Times
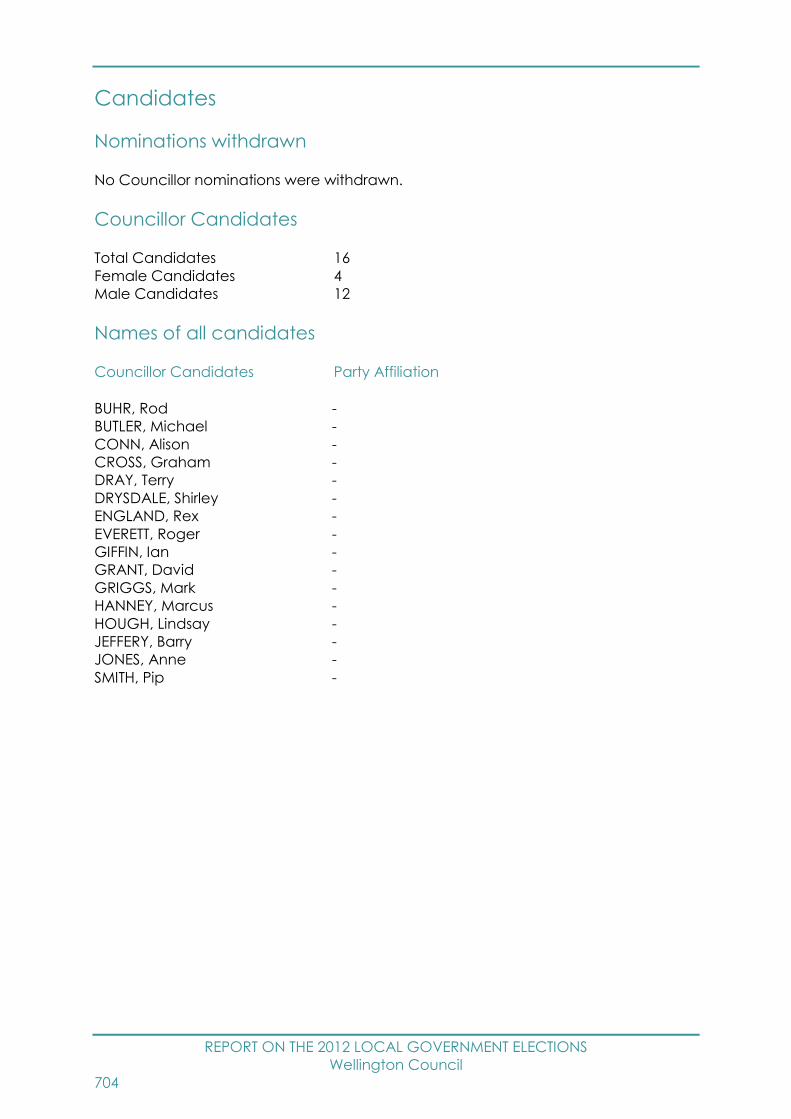
REPORT ON THE 2012 LOCAL GOVERNMENT ELECTIONS
Wellington Council
704
Candidates
Nominations withdrawn
No Councillor nominations were withdrawn.
Councillor Candidates
Total Candidates 16
Female Candidates 4
Male Candidates 12
Names of all candidates
Councillor Candidates Party Affiliation
BUHR, Rod -
BUTLER, Michael -
CONN, Alison -
CROSS, Graham -
DRAY, Terry -
DRYSDALE, Shirley -
ENGLAND, Rex -
EVERETT, Roger -
GIFFIN, Ian -
GRANT, David -
GRIGGS, Mark -
HANNEY, Marcus -
HOUGH, Lindsay -
JEFFERY, Barry -
JONES, Anne -
SMITH, Pip -
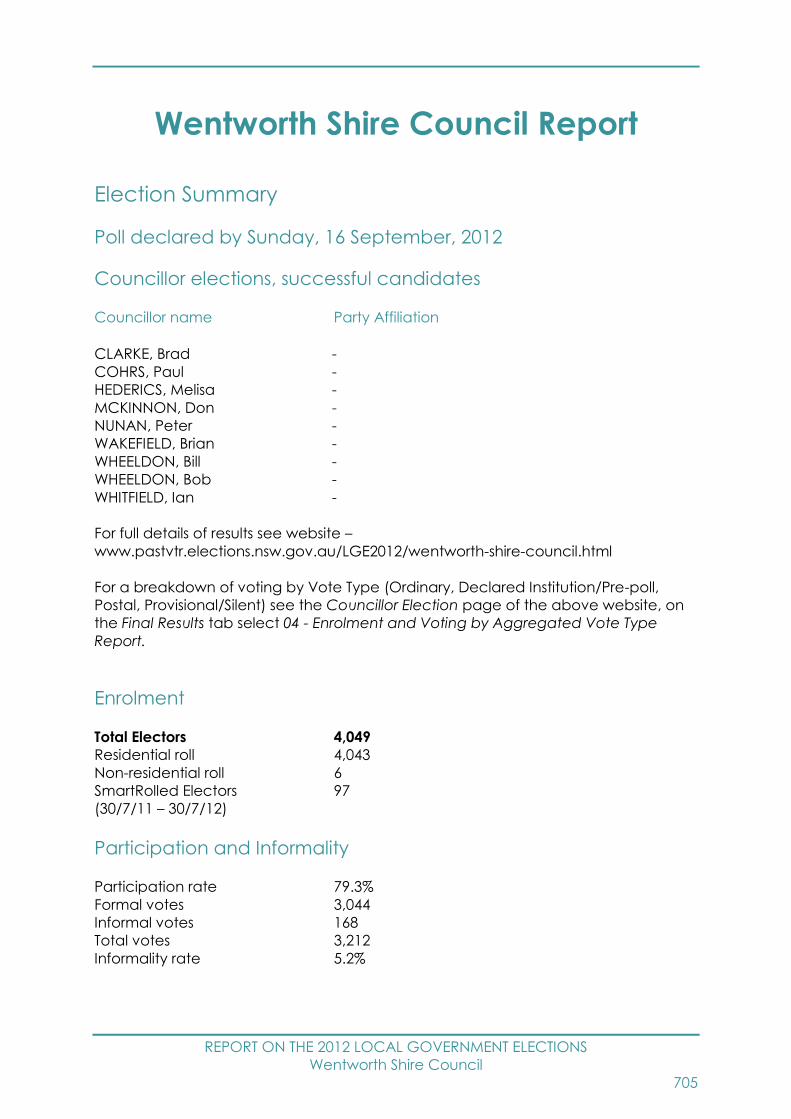
REPORT ON THE 2012 LOCAL GOVERNMENT ELECTIONS
Wentworth Shire Council
705
Wentworth Shire Council Report
Election Summary
Poll declared by Sunday, 16 September, 2012
Councillor elections, successful candidates
Councillor name Party Affiliation
CLARKE, Brad -
COHRS, Paul -
HEDERICS, Melisa -
MCKINNON, Don -
NUNAN, Peter -
WAKEFIELD, Brian -
WHEELDON, Bill -
WHEELDON, Bob -
WHITFIELD, Ian -
For full details of results see website –
www.pastvtr.elections.nsw.gov.au/LGE2012/wentworth-shire-council.html
For a breakdown of voting by Vote Type (Ordinary, Declared Institution/Pre-poll,
Postal, Provisional/Silent) see the Councillor Election page of the above website, on
the Final Results tab select 04 - Enrolment and Voting by Aggregated Vote Type
Report.
Enrolment
Total Electors 4,049
Residential roll 4,043
Non-residential roll 6
SmartRolled Electors 97
(30/7/11 – 30/7/12)
Participation and Informality
Participation rate 79.3%
Formal votes 3,044
Informal votes 168
Total votes 3,212
Informality rate 5.2%

REPORT ON THE 2012 LOCAL GOVERNMENT ELECTIONS
Wentworth Shire Council
706
Failure to Vote
Penalty Notices Issued 661
Rate of Failure to Vote128 16.4%
Election Costs
Total Cost of the Wentworth Shire Council 2012 Election
$39,401.00
Cost per elector
$9.77
Wentworth Shire Council Statutory Advertising Campaign Expenditure
Nominations $1,852.00
Candidates and polling places $1,824.00
Uncontested elections $0.00
Results $512.10
TOTAL $4,188.10
Election Services
Elector Enquiry Centre
The Elector Enquiry Centre answered 30 calls from postcodes within Wentworth Shire
Council area.
NSWEC Website
There were 691 unique visitors to Wentworth Shire Council election web page.
Braille Ballot Papers
No braille ballot papers were requested or printed.
Returning Officer
Darren Flowers
128 Percentage of Penalty Notices Issued to Enrolment (as shown on Authorised Roll)

REPORT ON THE 2012 LOCAL GOVERNMENT ELECTIONS
Wentworth Shire Council
707
Returning Officer’s Office
Broken Hill Region Returning Officer's Office
37-39 Oxide Street
Broken Hill NSW 2880
Councils in Region
Broken Hill City Council, Central Darling Shire Council and Wentworth Shire Council
Staffing
Office Manager 1
Senior Office Assistant 0
Office Assistants 0
Polling Place Managers 5
Polling Place Assistants 0
Deputy Polling Place Managers 0
Declaration Vote Issuing Officer 0
Election Officials 7
Council Count Manager 0
Part Day Election Officials 2
Total Staff 15
Polling Places
Pre-poll Centres 3
Declared Institutions 0
Election day Polling Places 6
Pre-poll centre locations
Broken Hill Region Returning Officer's Office, Wentworth Pre-Poll, Sydney Town Hall
Polling place locations
For 2012 map and polling places see –
www.pastvtr.elections.nsw.gov.au/LGE2012/wentworth-shire-council.html
Advertising
Statutory Campaign
The Council requested that the statutory advertisements be placed in the following
press:
Mildura Weekly
Sunraysia Daily
NSW Standard

REPORT ON THE 2012 LOCAL GOVERNMENT ELECTIONS
Wentworth Shire Council
708
Candidates
Nominations withdrawn
No Councillor nominations were withdrawn.
Councillor Candidates
Total Candidates 12
Female Candidates 2
Male Candidates 10
Names of all candidates
Councillor Candidates Party Affiliation
BROOK, Bill -
CLARKE, Brad -
COHRS, Paul -
HEDERICS, Melisa -
KING, Mark -
LAMB, Gaye -
MCKINNON, Don -
NUNAN, Peter -
WAKEFIELD, Brian -
WHEELDON, Bill -
WHEELDON, Bob -
WHITFIELD, Ian -

REPORT ON THE 2012 LOCAL GOVERNMENT ELECTIONS
Willoughby City Council
709
Willoughby City Council Report
Election Summary
Poll declared by Monday, 17 September, 2012
Mayoral election, successful candidate
Mayor name Party Affiliation
REILLY, Pat -
Councillor elections, successful candidates
Councillor name Party Affiliation
Middle Harbour Ward
NORTON, Wendy -
ROZOS, Angelo -
RUTHERFORD, Judith -
Naremburn Ward
COPPOCK, Stuart -
SLOANE, Michelle -
WRIGHT, Nic -
Sailors Bay Ward
ERIKSSON, Hugh -
GILES-GIDNEY, Gail -
HOOPER, John -
West Ward
MUSTACA, Tony -
SAVILLE, Lynne The Greens
STEVENS, Mandy -
For full details of results see website –
www.pastvtr.elections.nsw.gov.au/LGE2012/willoughby-city-council.html
For a breakdown of voting by Vote Type (Ordinary, Declared Institution/Pre-poll,
Postal, Provisional/Silent) see the Councillor Election page of the above website, on
the Final Results tab select 04 - Enrolment and Voting by Aggregated Vote Type
Report.

REPORT ON THE 2012 LOCAL GOVERNMENT ELECTIONS
Willoughby City Council
710
Enrolment
Total Electors 43,882
Residential roll 43,866
Non-residential roll 16
SmartRolled Electors 3,671
(30/7/11 – 30/7/12)
Participation and Informality
Participation rate 79.2%
Formal votes 31,611
Informal votes 3,128
Total votes 34,739
Informality rate 9.0%
For details of participation and informality by ward see website –
www.pastvtr.elections.nsw.gov.au/LGE2012/lge-statistics.htm
Failure to Vote
Penalty Notices Issued 6,574
Rate of Failure to Vote129 15.0%
Election Costs
Total Cost of the Willoughby City Council 2012 Election
$300,651.00
Cost per elector
$6.87
Willoughby City Council Statutory Advertising Campaign Expenditure
Nominations $500.00
Candidates and polling places $2,847.15
Uncontested elections $0.00
Results $632.70
TOTAL $3,979.85
129 Percentage of Penalty Notices Issued to Enrolment (as shown on Authorised Roll)
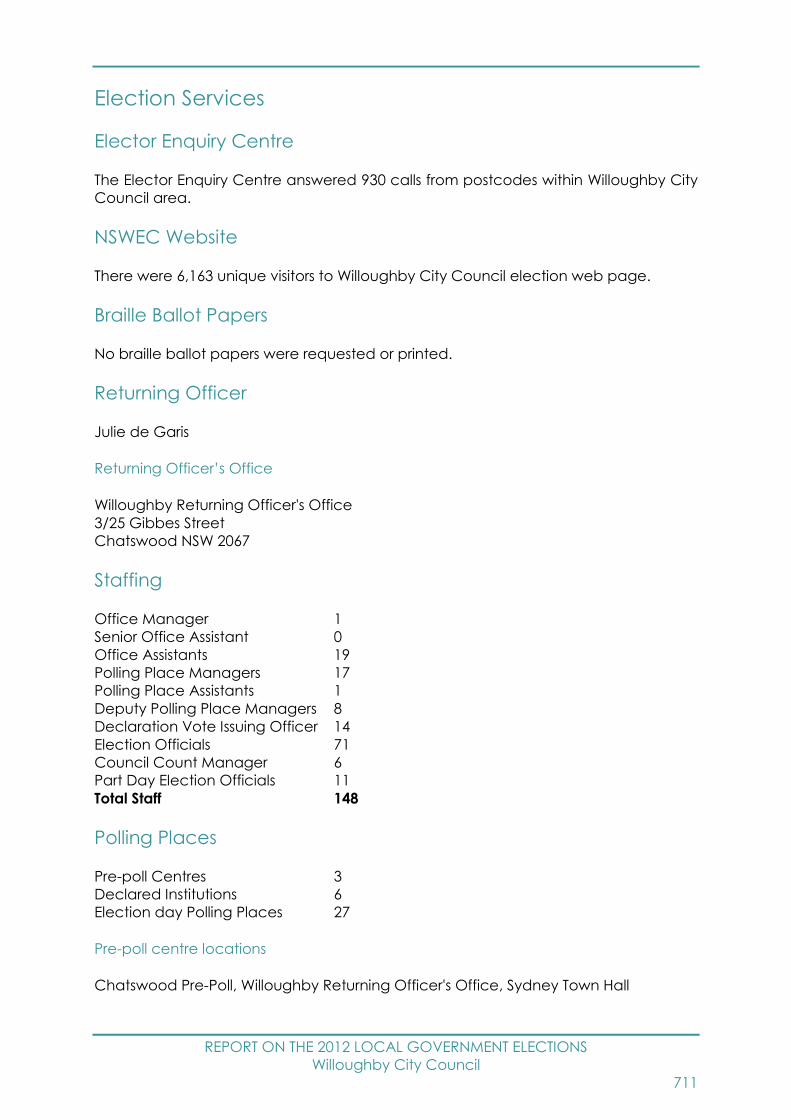
REPORT ON THE 2012 LOCAL GOVERNMENT ELECTIONS
Willoughby City Council
711
Election Services
Elector Enquiry Centre
The Elector Enquiry Centre answered 930 calls from postcodes within Willoughby City
Council area.
NSWEC Website
There were 6,163 unique visitors to Willoughby City Council election web page.
Braille Ballot Papers
No braille ballot papers were requested or printed.
Returning Officer
Julie de Garis
Returning Officer’s Office
Willoughby Returning Officer's Office
3/25 Gibbes Street
Chatswood NSW 2067
Staffing
Office Manager 1
Senior Office Assistant 0
Office Assistants 19
Polling Place Managers 17
Polling Place Assistants 1
Deputy Polling Place Managers 8
Declaration Vote Issuing Officer 14
Election Officials 71
Council Count Manager 6
Part Day Election Officials 11
Total Staff 148
Polling Places
Pre-poll Centres 3
Declared Institutions 6
Election day Polling Places 27
Pre-poll centre locations
Chatswood Pre-Poll, Willoughby Returning Officer's Office, Sydney Town Hall
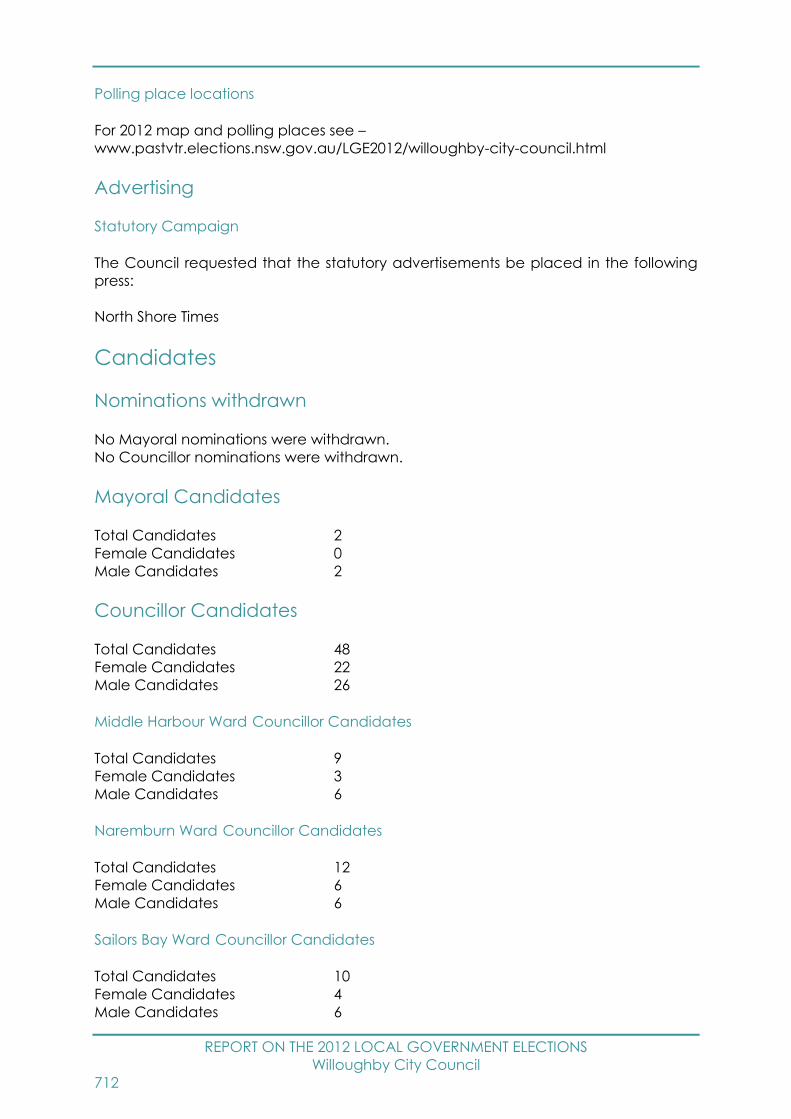
REPORT ON THE 2012 LOCAL GOVERNMENT ELECTIONS
Willoughby City Council
712
Polling place locations
For 2012 map and polling places see –
www.pastvtr.elections.nsw.gov.au/LGE2012/willoughby-city-council.html
Advertising
Statutory Campaign
The Council requested that the statutory advertisements be placed in the following
press:
North Shore Times
Candidates
Nominations withdrawn
No Mayoral nominations were withdrawn.
No Councillor nominations were withdrawn.
Mayoral Candidates
Total Candidates 2
Female Candidates 0
Male Candidates 2
Councillor Candidates
Total Candidates 48
Female Candidates 22
Male Candidates 26
Middle Harbour Ward Councillor Candidates
Total Candidates 9
Female Candidates 3
Male Candidates 6
Naremburn Ward Councillor Candidates
Total Candidates 12
Female Candidates 6
Male Candidates 6
Sailors Bay Ward Councillor Candidates
Total Candidates 10
Female Candidates 4
Male Candidates 6

REPORT ON THE 2012 LOCAL GOVERNMENT ELECTIONS
Willoughby City Council
713
West Ward Councillor Candidates
Total Candidates 17
Female Candidates 9
Male Candidates 8
Names of all candidates
Mayoral Candidates Party Affiliation
COPPOCK, Stuart -
REILLY, Pat -
Councillor Candidates Party Affiliation
Middle Harbour Ward
GROSS, Trevor -
NORTON, Wendy -
REILLY, Pat -
ROZOS, Angelo -
ROZOS, Megan -
RUTHERFORD, Judith -
TSANG, Michael -
VIRGONA, John -
WILSON, Robert -
Naremburn Ward
ABROON, Abbas -
ADAMS, Vanessa -
BIGGS, Susan -
COPPOCK, Stuart -
GARTRELL, Glenda -
MANNING, Robert -
MURPHY, Orla -
NEWMAN, Robert -
PRESSLER, April -
SLOANE, Michelle -
TOMLINSON, Alan -
WRIGHT, Nic -
Sailors Bay Ward
CARRION, Roxana -
CLIFFORD, Pam -
COHILJ, Peter -
DI CIANO, Miranda -
ERIKSSON, Hugh -
GILES-GIDNEY, Gail -
HOOPER, John -
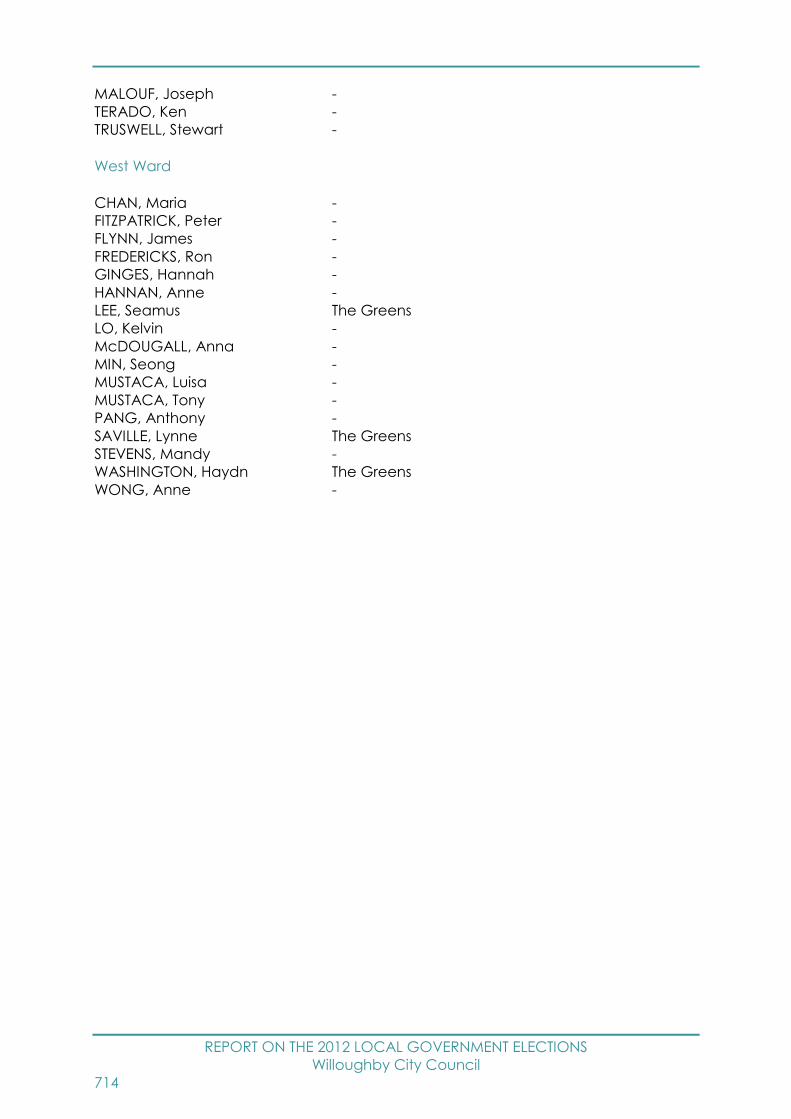
REPORT ON THE 2012 LOCAL GOVERNMENT ELECTIONS
Willoughby City Council
714
MALOUF, Joseph -
TERADO, Ken -
TRUSWELL, Stewart -
West Ward
CHAN, Maria -
FITZPATRICK, Peter -
FLYNN, James -
FREDERICKS, Ron -
GINGES, Hannah -
HANNAN, Anne -
LEE, Seamus The Greens
LO, Kelvin -
McDOUGALL, Anna -
MIN, Seong -
MUSTACA, Luisa -
MUSTACA, Tony -
PANG, Anthony -
SAVILLE, Lynne The Greens
STEVENS, Mandy -
WASHINGTON, Haydn The Greens
WONG, Anne -
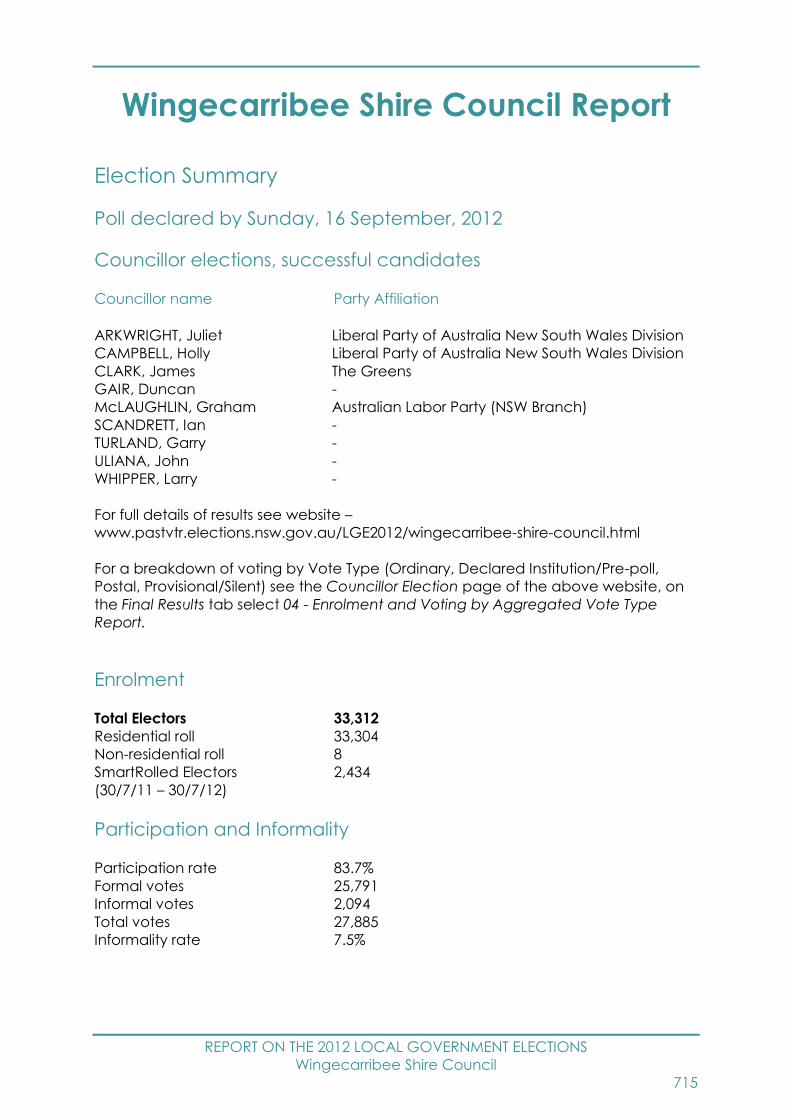
REPORT ON THE 2012 LOCAL GOVERNMENT ELECTIONS
Wingecarribee Shire Council
715
Wingecarribee Shire Council Report
Election Summary
Poll declared by Sunday, 16 September, 2012
Councillor elections, successful candidates
Councillor name Party Affiliation
ARKWRIGHT, Juliet Liberal Party of Australia New South Wales Division
CAMPBELL, Holly Liberal Party of Australia New South Wales Division
CLARK, James The Greens
GAIR, Duncan -
McLAUGHLIN, Graham Australian Labor Party (NSW Branch)
SCANDRETT, Ian -
TURLAND, Garry -
ULIANA, John -
WHIPPER, Larry -
For full details of results see website –
www.pastvtr.elections.nsw.gov.au/LGE2012/wingecarribee-shire-council.html
For a breakdown of voting by Vote Type (Ordinary, Declared Institution/Pre-poll,
Postal, Provisional/Silent) see the Councillor Election page of the above website, on
the Final Results tab select 04 - Enrolment and Voting by Aggregated Vote Type
Report.
Enrolment
Total Electors 33,312
Residential roll 33,304
Non-residential roll 8
SmartRolled Electors 2,434
(30/7/11 – 30/7/12)
Participation and Informality
Participation rate 83.7%
Formal votes 25,791
Informal votes 2,094
Total votes 27,885
Informality rate 7.5%
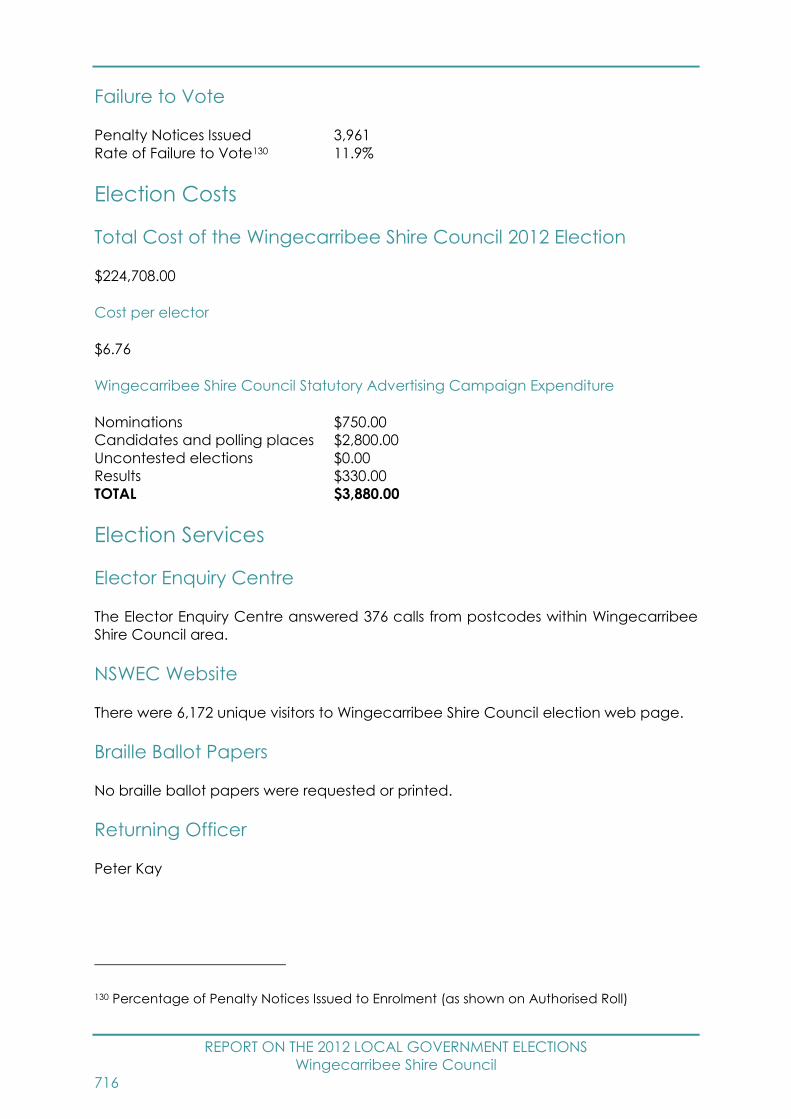
REPORT ON THE 2012 LOCAL GOVERNMENT ELECTIONS
Wingecarribee Shire Council
716
Failure to Vote
Penalty Notices Issued 3,961
Rate of Failure to Vote130 11.9%
Election Costs
Total Cost of the Wingecarribee Shire Council 2012 Election
$224,708.00
Cost per elector
$6.76
Wingecarribee Shire Council Statutory Advertising Campaign Expenditure
Nominations $750.00
Candidates and polling places $2,800.00
Uncontested elections $0.00
Results $330.00
TOTAL $3,880.00
Election Services
Elector Enquiry Centre
The Elector Enquiry Centre answered 376 calls from postcodes within Wingecarribee
Shire Council area.
NSWEC Website
There were 6,172 unique visitors to Wingecarribee Shire Council election web page.
Braille Ballot Papers
No braille ballot papers were requested or printed.
Returning Officer
Peter Kay
130 Percentage of Penalty Notices Issued to Enrolment (as shown on Authorised Roll)

REPORT ON THE 2012 LOCAL GOVERNMENT ELECTIONS
Wingecarribee Shire Council
717
Returning Officer’s Office
Wingecarribee Returning Officer's Office
Council Theatrette, Wingecarribee Shire Council
Elizabeth Street
Moss Vale NSW 2577
Staffing
Office Manager 1
Senior Office Assistant 0
Office Assistants 16
Polling Place Managers 20
Polling Place Assistants 0
Deputy Polling Place Managers 3
Declaration Vote Issuing Officer 2
Election Officials 49
Council Count Manager 0
Part Day Election Officials 3
Total Staff 94
Polling Places
Pre-poll Centres 3
Declared Institutions 6
Election day Polling Places 21
Pre-poll centre locations
Mittagong Pre-Poll, Wingecarribee Returning Officer's Office, Sydney Town Hall
Polling place locations
For 2012 map and polling places see –
www.pastvtr.elections.nsw.gov.au/LGE2012/wingecarribee-shire-council.html
Advertising
Statutory Campaign
The Council requested that the statutory advertisements be placed in the following
press:
Highland Post
Southern Highlands News
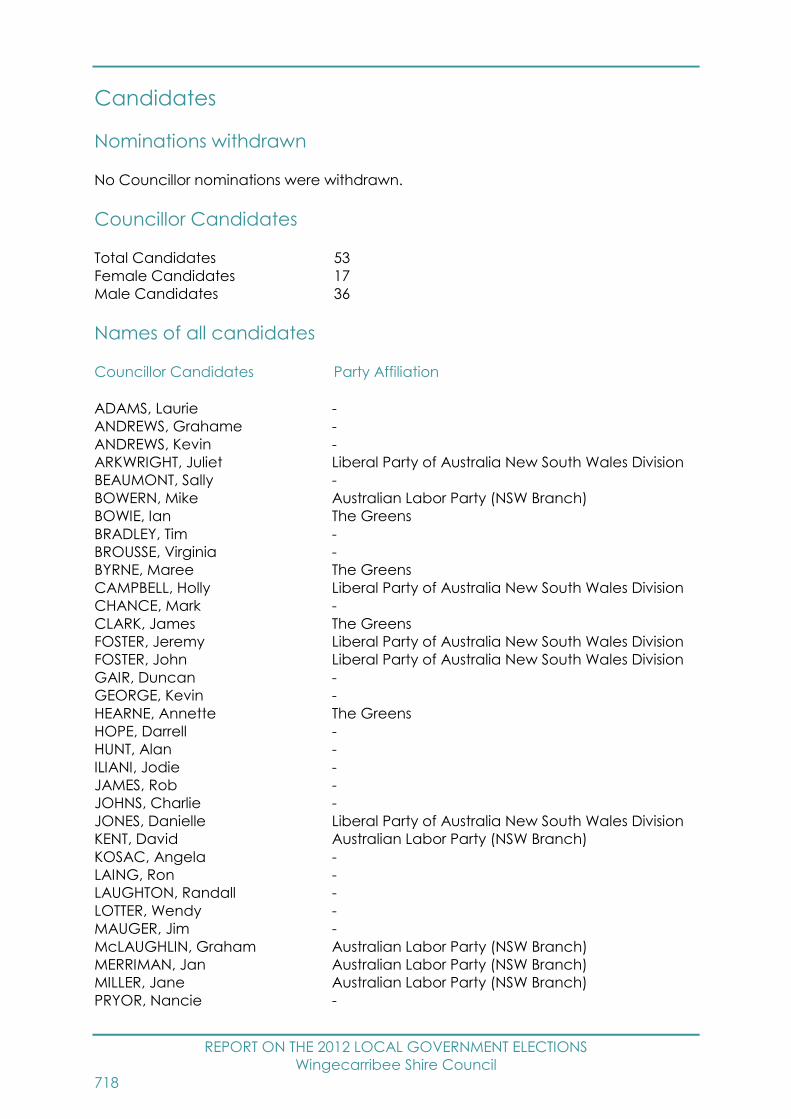
REPORT ON THE 2012 LOCAL GOVERNMENT ELECTIONS
Wingecarribee Shire Council
718
Candidates
Nominations withdrawn
No Councillor nominations were withdrawn.
Councillor Candidates
Total Candidates 53
Female Candidates 17
Male Candidates 36
Names of all candidates
Councillor Candidates Party Affiliation
ADAMS, Laurie -
ANDREWS, Grahame -
ANDREWS, Kevin -
ARKWRIGHT, Juliet Liberal Party of Australia New South Wales Division
BEAUMONT, Sally -
BOWERN, Mike Australian Labor Party (NSW Branch)
BOWIE, Ian The Greens
BRADLEY, Tim -
BROUSSE, Virginia -
BYRNE, Maree The Greens
CAMPBELL, Holly Liberal Party of Australia New South Wales Division
CHANCE, Mark -
CLARK, James The Greens
FOSTER, Jeremy Liberal Party of Australia New South Wales Division
FOSTER, John Liberal Party of Australia New South Wales Division
GAIR, Duncan -
GEORGE, Kevin -
HEARNE, Annette The Greens
HOPE, Darrell -
HUNT, Alan -
ILIANI, Jodie -
JAMES, Rob -
JOHNS, Charlie -
JONES, Danielle Liberal Party of Australia New South Wales Division
KENT, David Australian Labor Party (NSW Branch)
KOSAC, Angela -
LAING, Ron -
LAUGHTON, Randall -
LOTTER, Wendy -
MAUGER, Jim -
McLAUGHLIN, Graham Australian Labor Party (NSW Branch)
MERRIMAN, Jan Australian Labor Party (NSW Branch)
MILLER, Jane Australian Labor Party (NSW Branch)
PRYOR, Nancie -
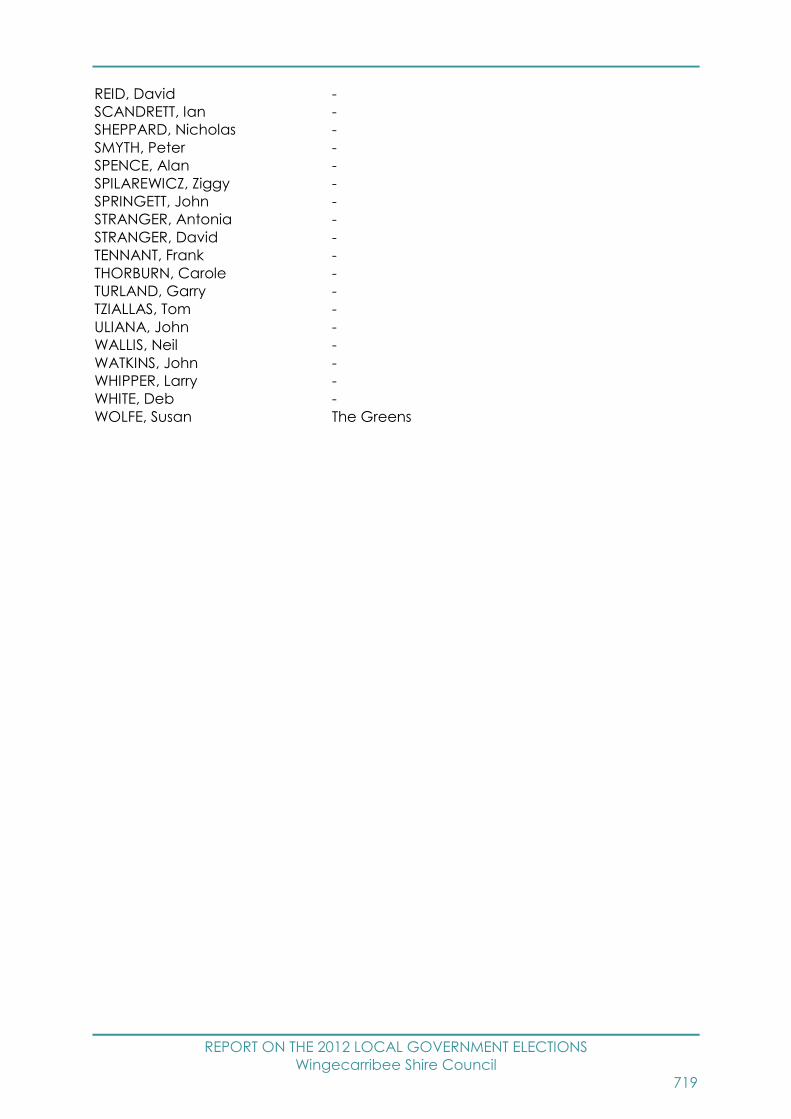
REPORT ON THE 2012 LOCAL GOVERNMENT ELECTIONS
Wingecarribee Shire Council
719
REID, David -
SCANDRETT, Ian -
SHEPPARD, Nicholas -
SMYTH, Peter -
SPENCE, Alan -
SPILAREWICZ, Ziggy -
SPRINGETT, John -
STRANGER, Antonia -
STRANGER, David -
TENNANT, Frank -
THORBURN, Carole -
TURLAND, Garry -
TZIALLAS, Tom -
ULIANA, John -
WALLIS, Neil -
WATKINS, John -
WHIPPER, Larry -
WHITE, Deb -
WOLFE, Susan The Greens

REPORT ON THE 2012 LOCAL GOVERNMENT ELECTIONS
Wollondilly Shire Council
720
Wollondilly Shire Council Report
Election Summary
Poll declared by Sunday, 16 September, 2012
Councillor elections, successful candidates
Councillor name Party Affiliation
Central Ward
AMATO, Lou -
BANASIK, Michael -
MITCHELL, Col -
East Ward
BANASIK, Benn -
LAW, Ray -
TERRY, Kate -
North Ward
GIBBS, Hilton -
HANNAN, Judy -
LANDOW, Simon -
For full details of results see website –
www.pastvtr.elections.nsw.gov.au/LGE2012/wollondilly-shire-council.html
For a breakdown of voting by Vote Type (Ordinary, Declared Institution/Pre-poll,
Postal, Provisional/Silent) see the Councillor Election page of the above website, on
the Final Results tab select 04 - Enrolment and Voting by Aggregated Vote Type
Report.
Enrolment
Total Electors 30,757
Residential roll 30,755
Non-residential roll 2
SmartRolled Electors 2,988
(30/7/11 – 30/7/12)

REPORT ON THE 2012 LOCAL GOVERNMENT ELECTIONS
Wollondilly Shire Council
721
Participation and Informality
Participation rate 87.2%
Formal votes 24,383
Informal votes 2,440
Total votes 26,823
Informality rate 9.1%
For details of participation and informality by ward see website –
www.pastvtr.elections.nsw.gov.au/LGE2012/lge-statistics.htm
Failure to Vote
Penalty Notices Issued 2,975
Rate of Failure to Vote131 9.7%
Election Costs
Total Cost of the Wollondilly Shire Council 2012 Election
$189,725.00
Cost per elector
$6.18
Wollondilly Shire Council Statutory Advertising Campaign Expenditure
Nominations $490.36
Candidates and polling places $1,500.00
Uncontested elections $0.00
Results $154.02
TOTAL $2,144.38
Election Services
Elector Enquiry Centre
The Elector Enquiry Centre answered 436 calls from postcodes within Wollondilly Shire
Council area.
NSWEC Website
There were 3,481 unique visitors to Wollondilly Shire Council election web page.
131 Percentage of Penalty Notices Issued to Enrolment (as shown on Authorised Roll)
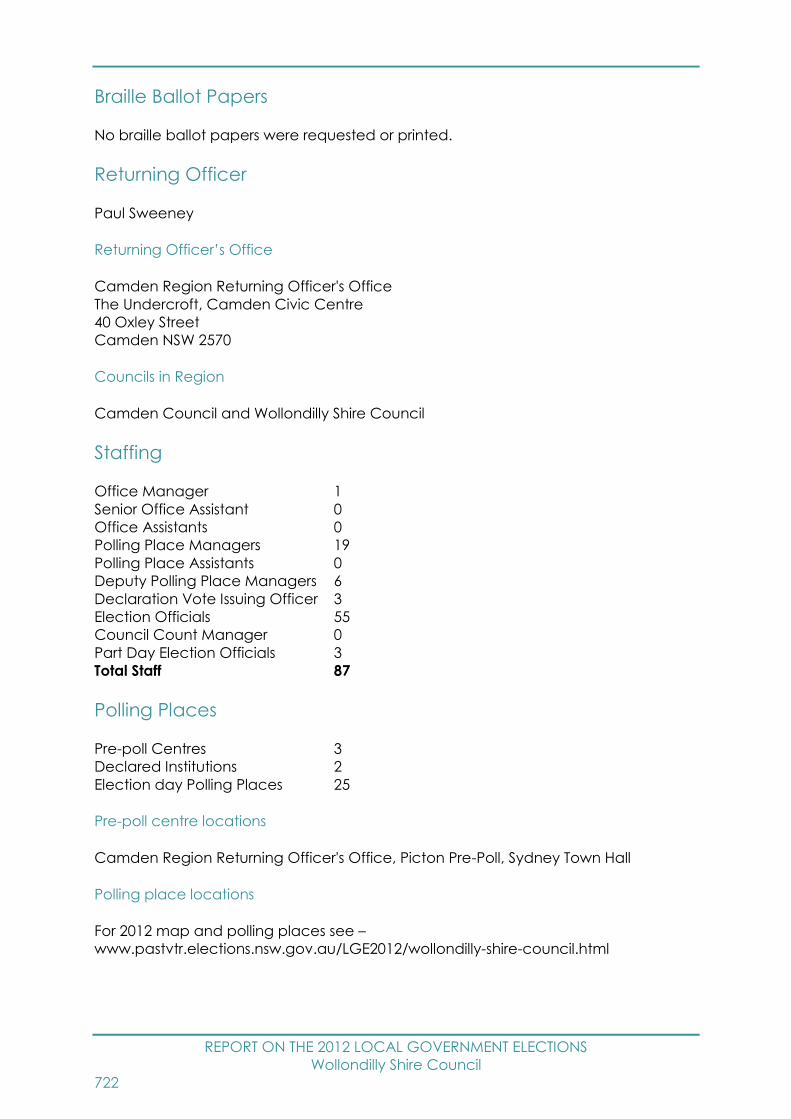
REPORT ON THE 2012 LOCAL GOVERNMENT ELECTIONS
Wollondilly Shire Council
722
Braille Ballot Papers
No braille ballot papers were requested or printed.
Returning Officer
Paul Sweeney
Returning Officer’s Office
Camden Region Returning Officer's Office
The Undercroft, Camden Civic Centre
40 Oxley Street
Camden NSW 2570
Councils in Region
Camden Council and Wollondilly Shire Council
Staffing
Office Manager 1
Senior Office Assistant 0
Office Assistants 0
Polling Place Managers 19
Polling Place Assistants 0
Deputy Polling Place Managers 6
Declaration Vote Issuing Officer 3
Election Officials 55
Council Count Manager 0
Part Day Election Officials 3
Total Staff 87
Polling Places
Pre-poll Centres 3
Declared Institutions 2
Election day Polling Places 25
Pre-poll centre locations
Camden Region Returning Officer's Office, Picton Pre-Poll, Sydney Town Hall
Polling place locations
For 2012 map and polling places see –
www.pastvtr.elections.nsw.gov.au/LGE2012/wollondilly-shire-council.html

REPORT ON THE 2012 LOCAL GOVERNMENT ELECTIONS
Wollondilly Shire Council
723
Advertising
Statutory Campaign
The Council requested that the statutory advertisements be placed in the following
press:
Camden Advertiser
District Reporter
Macarthur Chronicle
Wollondilly Advertiser
Candidates
Nominations withdrawn
No Councillor nominations were withdrawn.
Councillor Candidates
Total Candidates 47
Female Candidates 13
Male Candidates 34
Central Ward Councillor Candidates
Total Candidates 14
Female Candidates 3
Male Candidates 11
East Ward Councillor Candidates
Total Candidates 16
Female Candidates 4
Male Candidates 12
North Ward Councillor Candidates
Total Candidates 17
Female Candidates 6
Male Candidates 11

REPORT ON THE 2012 LOCAL GOVERNMENT ELECTIONS
Wollondilly Shire Council
724
Names of all candidates
Councillor Candidates Party Affiliation
Central Ward
AMATO, Lou -
BANASIK, Michael -
CROSSLING, Lisa -
DAVIS, Greg -
GLACKIN, Bryce -
HARDACRE, Mark -
HIGGS, Tony -
KHAN, Robert -
LANGE, Diana -
McLEAN, Tom -
MITCHELL, Col -
MOULAS, Arthur -
RIXON, Ted -
STYLES, Lynette -
East Ward
BANASIK, Benn -
BURT, Jason -
CHALKER, Glenda -
CICHOCKI, Stan -
DEETH, Matthew -
HARRISON, Lorri -
HUNT, Peter -
KRATTLI, Walter -
LAW, Ray -
LOWRY, Noel -
ROBERTS, Peter -
SCHAEFER, Paul -
SENIOR, Timothy -
SLEE, Ray -
TERRY, Kate -
ZAUTSEN, Leanne -
North Ward
ATKINS, Terry -
CARMODY, James Australia First Party (NSW) Incorporated (Councils)
CHEVIS, Jacqy -
COSTA, Phil -
GIBBS, Hilton -
GOULD, Matt -
HANNAN, Judy -
LANDOW, Simon -
McDONALD, Stephen -
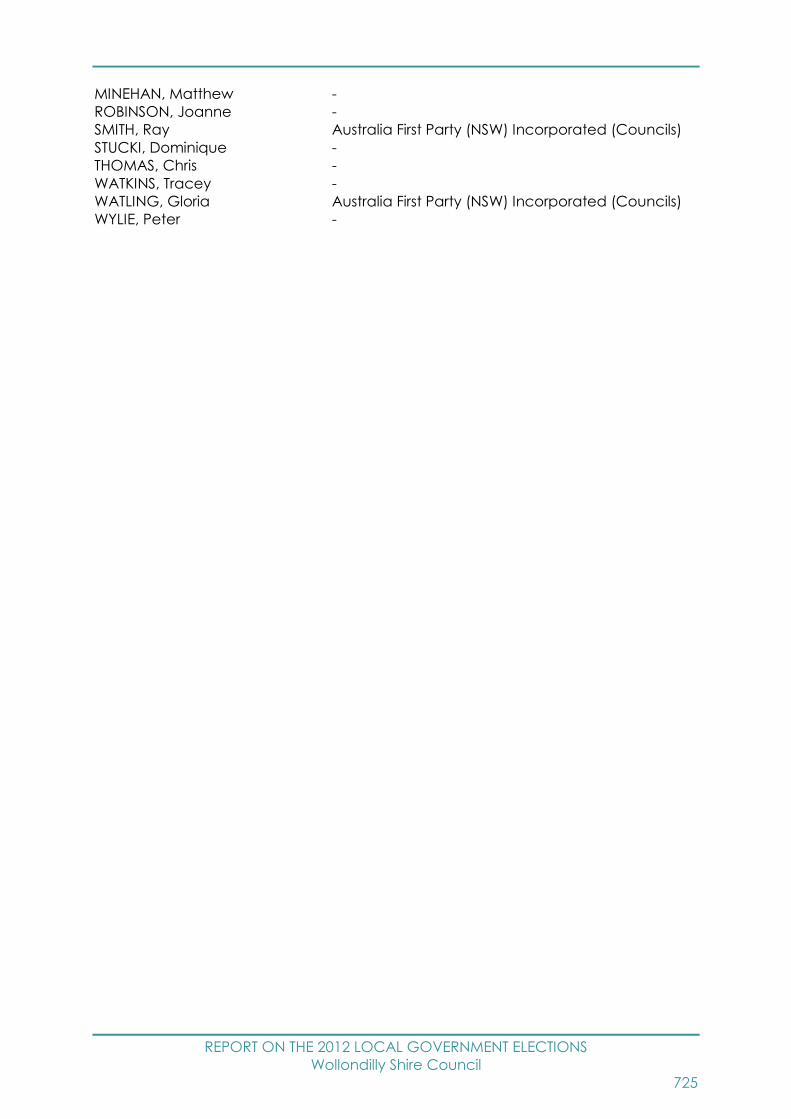
REPORT ON THE 2012 LOCAL GOVERNMENT ELECTIONS
Wollondilly Shire Council
725
MINEHAN, Matthew -
ROBINSON, Joanne -
SMITH, Ray Australia First Party (NSW) Incorporated (Councils)
STUCKI, Dominique -
THOMAS, Chris -
WATKINS, Tracey -
WATLING, Gloria Australia First Party (NSW) Incorporated (Councils)
WYLIE, Peter -

REPORT ON THE 2012 LOCAL GOVERNMENT ELECTIONS
Woollahra Municipal Council
726
Woollahra Municipal Council Report
Election Summary
Poll declared by Sunday, 16 September, 2012
Councillor elections, successful candidates
Councillor name Party Affiliation
Bellevue Hill Ward
LEVENSTON, Greg Liberal Party of Australia New South Wales Division
PETRIE, Andrew Liberal Party of Australia New South Wales Division
ZULMAN, Jeff Residents First Woollahra
Cooper Ward
ELSING, Luise Residents First Woollahra
MARANO, Anthony Liberal Party of Australia New South Wales Division
O'REGAN, Katherine Liberal Party of Australia New South Wales Division
Double Bay Ward
KIRILLOVA, Elena Residents First Woollahra
THOMAS, Deborah Liberal Party of Australia New South Wales Division
ZELTZER, Toni Liberal Party of Australia New South Wales Division
Paddington Ward
CAVANAGH, Peter Liberal Party of Australia New South Wales Division
ROBERTSON, Matthew The Greens
WISE, Elena Residents First Woollahra
Vaucluse Ward
BENNETT, Ted Liberal Party of Australia New South Wales Division
BOSKOVITZ, Anthony Liberal Party of Australia New South Wales Division
WYNNE, Susan Residents First Woollahra
For full details of results see website –
www.pastvtr.elections.nsw.gov.au/LGE2012/woollahra-municipal-council.html
For a breakdown of voting by Vote Type (Ordinary, Declared Institution/Pre-poll,
Postal, Provisional/Silent) see the Councillor Election page of the above website, on
the Final Results tab select 04 - Enrolment and Voting by Aggregated Vote Type
Report.

REPORT ON THE 2012 LOCAL GOVERNMENT ELECTIONS
Woollahra Municipal Council
727
Enrolment
Total Electors 37,400
Residential roll 37,395
Non-residential roll 5
SmartRolled Electors 3,989
(30/7/11 – 30/7/12)
Participation and Informality
Participation rate 69.7%
Formal votes 25,087
Informal votes 977
Total votes 26,064
Informality rate 3.7%
For details of participation and informality by ward see website –
www.pastvtr.elections.nsw.gov.au/LGE2012/lge-statistics.htm
Failure to Vote
Penalty Notices Issued 8,786
Rate of Failure to Vote132 23.6%
Election Costs
Total Cost of the Woollahra Municipal Council 2012 Election
$287,126.00
Cost per elector
$7.71
Woollahra Municipal Council Statutory Advertising Campaign Expenditure
Nominations $2,047.76
Candidates and polling places $3,400.00
Uncontested elections $0.00
Results $1,544.36
TOTAL $6,992.12
132 Percentage of Penalty Notices Issued to Enrolment (as shown on Authorised Roll)
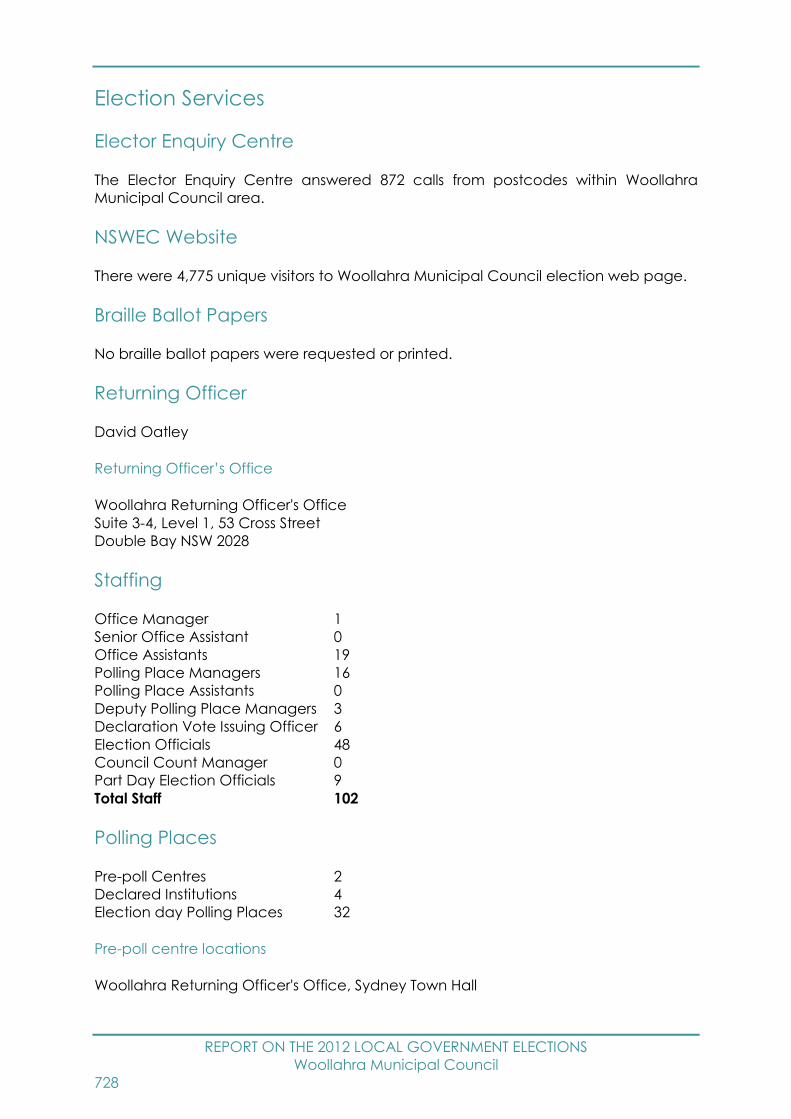
REPORT ON THE 2012 LOCAL GOVERNMENT ELECTIONS
Woollahra Municipal Council
728
Election Services
Elector Enquiry Centre
The Elector Enquiry Centre answered 872 calls from postcodes within Woollahra
Municipal Council area.
NSWEC Website
There were 4,775 unique visitors to Woollahra Municipal Council election web page.
Braille Ballot Papers
No braille ballot papers were requested or printed.
Returning Officer
David Oatley
Returning Officer’s Office
Woollahra Returning Officer's Office
Suite 3-4, Level 1, 53 Cross Street
Double Bay NSW 2028
Staffing
Office Manager 1
Senior Office Assistant 0
Office Assistants 19
Polling Place Managers 16
Polling Place Assistants 0
Deputy Polling Place Managers 3
Declaration Vote Issuing Officer 6
Election Officials 48
Council Count Manager 0
Part Day Election Officials 9
Total Staff 102
Polling Places
Pre-poll Centres 2
Declared Institutions 4
Election day Polling Places 32
Pre-poll centre locations
Woollahra Returning Officer's Office, Sydney Town Hall

REPORT ON THE 2012 LOCAL GOVERNMENT ELECTIONS
Woollahra Municipal Council
729
Polling place locations
For 2012 map and polling places see –
www.pastvtr.elections.nsw.gov.au/LGE2012/woollahra-municipal-council.html
Advertising
Statutory Campaign
The Council requested that the statutory advertisements be placed in the following
press:
Wentworth Courier
Candidates
Nominations withdrawn
No Councillor nominations were withdrawn.
Councillor Candidates
Total Candidates 45
Female Candidates 23
Male Candidates 22
Bellevue Hill Ward Councillor Candidates
Total Candidates 9
Female Candidates 5
Male Candidates 4
Cooper Ward Councillor Candidates
Total Candidates 9
Female Candidates 5
Male Candidates 4
Double Bay Ward Councillor Candidates
Total Candidates 6
Female Candidates 5
Male Candidates 1
Paddington Ward Councillor Candidates
Total Candidates 12
Female Candidates 4
Male Candidates 8

REPORT ON THE 2012 LOCAL GOVERNMENT ELECTIONS
Woollahra Municipal Council
730
Vaucluse Ward Councillor Candidates
Total Candidates 9
Female Candidates 4
Male Candidates 5
Names of all candidates
Councillor Candidates Party Affiliation
Bellevue Hill Ward
BRITTON, Susan The Greens
COHEN, Geoffrey Residents First Woollahra
EXCELL, Tanya The Greens
GRIEVE, Nicola The Greens
LEVENSTON, Greg Liberal Party of Australia New South Wales Division
OLAH, Karin Residents First Woollahra
PETRIE, Andrew Liberal Party of Australia New South Wales Division
RATCLIFFE, Fiona Liberal Party of Australia New South Wales Division
ZULMAN, Jeff Residents First Woollahra
Cooper Ward
ELSING, Luise Residents First Woollahra
MARANO, Anthony Liberal Party of Australia New South Wales Division
O'REGAN, Katherine Liberal Party of Australia New South Wales Division
PRICE, D'Arcy Residents First Woollahra
RAINE, Jeremy Liberal Party of Australia New South Wales Division
RHODES, Andrew The Greens
TSANG, Patricia The Greens
WHITE, Rosie The Greens
WIVELL PLATER, Claire Residents First Woollahra
Double Bay Ward
CARPENTER, Elizabeth Liberal Party of Australia New South Wales Division
CHRYSTAL, Lavinia Residents First Woollahra
COATES, Doug Residents First Woollahra
KIRILLOVA, Elena Residents First Woollahra
THOMAS, Deborah Liberal Party of Australia New South Wales Division
ZELTZER, Toni Liberal Party of Australia New South Wales Division
Paddington Ward
AMZALLAG, Daniel Liberal Party of Australia New South Wales Division
BRITTON-HARPER, Zoe The Greens
CAVANAGH, Peter Liberal Party of Australia New South Wales Division
HAEGE, Paul Liberal Party of Australia New South Wales Division
JARNASON, Susan The Greens
JENNINGS, Collin Australian Labor Party (NSW Branch)

REPORT ON THE 2012 LOCAL GOVERNMENT ELECTIONS
Woollahra Municipal Council
731
LEWIS, Ruark Australian Labor Party (NSW Branch)
NORMYLE, John Residents First Woollahra
ROBERTSON, Matthew The Greens
SCHWARTZ, Laelie Residents First Woollahra
TEMBY, Paul Australian Labor Party (NSW Branch)
WISE, Elena Residents First Woollahra
Vaucluse Ward
BENNETT, Ted Liberal Party of Australia New South Wales Division
BERKELMANS, Ron -
BLAND, Bruce Residents First Woollahra
BOSKOVITZ, Anthony Liberal Party of Australia New South Wales Division
CULLEN, Claudia Residents First Woollahra
MCELVOGUE, Louise -
NEMESH, William Liberal Party of Australia New South Wales Division
SHAND, Fiona -
WYNNE, Susan Residents First Woollahra
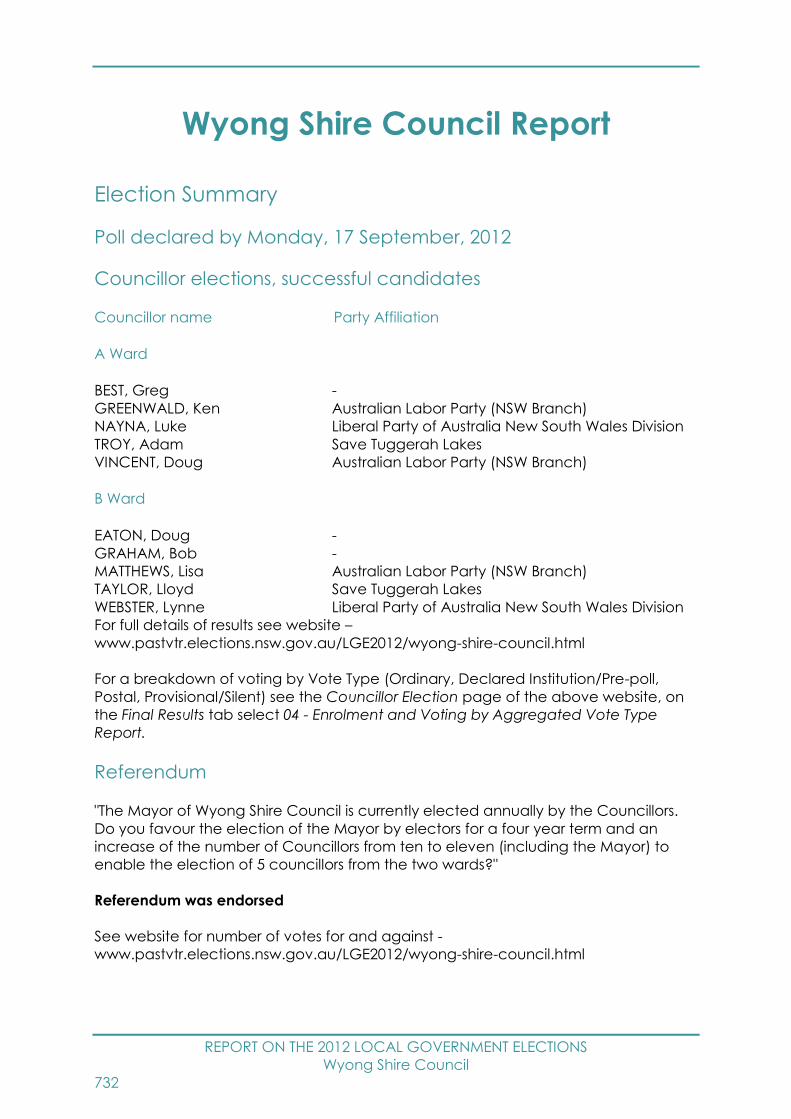
REPORT ON THE 2012 LOCAL GOVERNMENT ELECTIONS
Wyong Shire Council
732
Wyong Shire Council Report
Election Summary
Poll declared by Monday, 17 September, 2012
Councillor elections, successful candidates
Councillor name Party Affiliation
A Ward
BEST, Greg -
GREENWALD, Ken Australian Labor Party (NSW Branch)
NAYNA, Luke Liberal Party of Australia New South Wales Division
TROY, Adam Save Tuggerah Lakes
VINCENT, Doug Australian Labor Party (NSW Branch)
B Ward
EATON, Doug -
GRAHAM, Bob -
MATTHEWS, Lisa Australian Labor Party (NSW Branch)
TAYLOR, Lloyd Save Tuggerah Lakes
WEBSTER, Lynne Liberal Party of Australia New South Wales Division
For full details of results see website –
www.pastvtr.elections.nsw.gov.au/LGE2012/wyong-shire-council.html
For a breakdown of voting by Vote Type (Ordinary, Declared Institution/Pre-poll,
Postal, Provisional/Silent) see the Councillor Election page of the above website, on
the Final Results tab select 04 - Enrolment and Voting by Aggregated Vote Type
Report.
Referendum
"The Mayor of Wyong Shire Council is currently elected annually by the Councillors.
Do you favour the election of the Mayor by electors for a four year term and an
increase of the number of Councillors from ten to eleven (including the Mayor) to
enable the election of 5 councillors from the two wards?"
Referendum was endorsed
See website for number of votes for and against -
www.pastvtr.elections.nsw.gov.au/LGE2012/wyong-shire-council.html

REPORT ON THE 2012 LOCAL GOVERNMENT ELECTIONS
Wyong Shire Council
733
Enrolment
Total Electors 108,366
Residential roll 108,361
Non-residential roll 5
SmartRolled Electors 13,059
(30/7/11 – 30/7/12)
Participation and Informality
Participation rate 83.1%
Formal votes 82,611
Informal votes 7,453
Total votes 90,064
Informality rate 8.3%
For details of participation and informality by ward see website –
www.pastvtr.elections.nsw.gov.au/LGE2012/lge-statistics.htm
Failure to Vote
Penalty Notices Issued 14,143
Rate of Failure to Vote133 13.1%
Election Costs
Total Cost of the Wyong Shire Council 2012 Election
$637,178.00
Cost per elector
$5.89
Wyong Shire Council Statutory Advertising Campaign Expenditure
Nominations $234.84
Candidates and polling places $940.00
Uncontested elections $0.00
Results $234.84
TOTAL $1,409.68
133 Percentage of Penalty Notices Issued to Enrolment (as shown on Authorised Roll)
REPORT ON THE 2012 LOCAL GOVERNMENT ELECTIONS
Wyong Shire Council
734
Election Services
Elector Enquiry Centre
The Elector Enquiry Centre answered 1,947 calls from postcodes within Wyong Shire
Council area.
NSWEC Website
There were 4,701 unique visitors to Wyong Shire Council election web page.
Braille Ballot Papers
No braille ballot papers were requested or printed.
Returning Officer
Rhonda Bassett
Returning Officer’s Office
Wyong Returning Officer's Office
2A & 2B Amy Close
Wyong NSW 2259
Staffing
Office Manager 1
Senior Office Assistant 0
Office Assistants 35
Polling Place Managers 52
Polling Place Assistants 0
Deputy Polling Place Managers 17
Declaration Vote Issuing Officer 15
Election Officials 171
Council Count Manager 0
Part Day Election Officials 19
Total Staff 310
Polling Places
Pre-poll Centres 4
Declared Institutions 12
Election day Polling Places 56
Pre-poll centre locations
Blue Haven Pre-Poll, The Entrance Pre-Poll, Wyong Returning Officer's Office, Sydney
Town Hall
REPORT ON THE 2012 LOCAL GOVERNMENT ELECTIONS
Wyong Shire Council
735
Polling place locations
For 2012 map and polling places see –
www.pastvtr.elections.nsw.gov.au/LGE2012/wyong-shire-council.html
Advertising
Statutory Campaign
The Council requested that the statutory advertisements be placed in the following
press:
Central Coast Express Advocate
Candidates
Nominations withdrawn
No Councillor nominations were withdrawn.
Councillor Candidates
Total Candidates 55
Female Candidates 23
Male Candidates 32
A Ward Councillor Candidates
Total Candidates 25
Female Candidates 12
Male Candidates 13
B Ward Councillor Candidates
Total Candidates 30
Female Candidates 11
Male Candidates 19
Names of all candidates
Councillor Candidates Party Affiliation
A Ward
ANDERSON, Donna Liberal Party of Australia New South Wales Division
ARNEIL, Scott Liberal Party of Australia New South Wales Division
BEST, Greg -
BEST, Jess -
BEST, Joshua -
BEST, Maree -

REPORT ON THE 2012 LOCAL GOVERNMENT ELECTIONS
Wyong Shire Council
736
DAVIS, Amber Save Tuggerah Lakes
DRINAN, Karen Liberal Party of Australia New South Wales Division
GREENWALD, Ken Australian Labor Party (NSW Branch)
HALE, Lesley The Greens
HENDERSON, Chris The Greens
HITCHENS, Michael Australian Labor Party (NSW Branch)
HOOK, Jessica Australian Labor Party (NSW Branch)
NAYNA, Luke Liberal Party of Australia New South Wales Division
RICKARD, Scott The Greens
SCHWARTZ, Kaye Australian Labor Party (NSW Branch)
STOLZ, Troy Liberal Party of Australia New South Wales Division
TROY, Adam Save Tuggerah Lakes
TROY, Courtney Save Tuggerah Lakes
TROY, Joshua Save Tuggerah Lakes
TROY, Kaylene Save Tuggerah Lakes
VINCENT, Doug Australian Labor Party (NSW Branch)
WALLISCH, John -
WYNN, Ben The Greens
WYNN, Sue The Greens
B Ward
BARTON, Bob -
CASTLES, Margot Australian Labor Party (NSW Branch)
EATON, Doug -
GAUT, Leonard Save Tuggerah Lakes
GRAHAM, Bob -
HEY, Ken -
JINKS, Deidrie The Greens
MATTHEWS, Lisa Australian Labor Party (NSW Branch)
MAY, Tyson Liberal Party of Australia New South Wales Division
McCULLY, Bill -
McKINNON, Ian The Greens
McKINNON, Jean The Greens
MEHAN, David Australian Labor Party (NSW Branch)
MORLEY, Mick -
MULVEY, Robert Australian Labor Party (NSW Branch)
NEWMAN, Tony The Greens
PERCEVAL, Bob -
PERICLEOUS, Laurinda -
SARGEANT, Clive Liberal Party of Australia New South Wales Division
SCOTT, Vivienne Liberal Party of Australia New South Wales Division
SLATER, Rod Liberal Party of Australia New South Wales Division
SOHIER, Brandon Australian Labor Party (NSW Branch)
TAYLOR, Charles Save Tuggerah Lakes
TAYLOR, Helaine Save Tuggerah Lakes
TAYLOR, Lloyd Save Tuggerah Lakes
TURNER, Vanessa The Greens
WACHER, Edna -
WEBSTER, Lynne Liberal Party of Australia New South Wales Division
WEST, John -
WILLIAMS, Tina Save Tuggerah Lakes

REPORT ON THE 2012 LOCAL GOVERNMENT ELECTIONS
Yass Valley Council
737
Yass Valley Council Report
Election Summary
Poll declared by Friday, 14 September, 2012
Councillor elections, successful candidates
Councillor name Party Affiliation
ABBEY, Rowena -
BURGESS, Cecil -
BUTLER, Greg -
DANIEL, Ann -
FROST, Geoff -
JONES, Jasmin -
McMANUS, Michael -
NEEDHAM, David -
WARE, Garry -
For full details of results see website –
www.pastvtr.elections.nsw.gov.au/LGE2012/yass-valley-council.html
For a breakdown of voting by Vote Type (Ordinary, Declared Institution/Pre-poll,
Postal, Provisional/Silent) see the Councillor Election page of the above
website, on the Final Results tab select 04 - Enrolment and Voting by
Aggregated Vote Type Report.
Enrolment
Total Electors 10,670
Residential roll 10,669
Non-residential roll 1
SmartRolled Electors 490
(30/7/11 – 30/7/12)
Participation and Informality
Participation rate 80.0%
Formal votes 7,976
Informal votes 564
Total votes 8,540
Informality rate 6.6%
REPORT ON THE 2012 LOCAL GOVERNMENT ELECTIONS
Yass Valley Council
738
Failure to Vote
Penalty Notices Issued 1,610
Rate of Failure to Vote134 15.2%
Election Costs
Total Cost of the Yass Valley Council 2012 Election
$81,469.00
Cost per elector
$7.71
Yass Valley Council Statutory Advertising Campaign Expenditure
Nominations $643.50
Candidates and polling places $1,086.80
Uncontested elections $0.00
Results $150.00
TOTAL $1,880.30
Election Services
Elector Enquiry Centre
The Elector Enquiry Centre answered 145 calls from postcodes within Yass Valley
Council area.
NSWEC Website
There were 1,942 unique visitors to Yass Valley Council election web page.
Braille Ballot Papers
No braille ballot papers were requested or printed.
Returning Officer
Brenda Hangilias
134 Percentage of Penalty Notices Issued to Enrolment (as shown on Authorised Roll)
REPORT ON THE 2012 LOCAL GOVERNMENT ELECTIONS
Yass Valley Council
739
Returning Officer’s Office
Goulburn Region Returning Officer's Office
104 Clinton Street
Goulburn NSW 2580
Councils in Region
Goulburn Mulwaree Council, Upper Lachlan Shire Council and Yass Valley
Council
Staffing
Office Manager 1
Senior Office Assistant 0
Office Assistants 0
Polling Place Managers 10
Polling Place Assistants 0
Deputy Polling Place Managers 1
Declaration Vote Issuing Officer 1
Election Officials 18
Council Count Manager 0
Part Day Election Officials 2
Total Staff 33
Polling Places
Pre-poll Centres 3
Declared Institutions 3
Election day Polling Places 11
Pre-poll centre locations
Goulburn Region Returning Officer's Office, Yass Pre-Poll, Sydney Town Hall
Polling place locations
For 2012 map and polling places see –
www.pastvtr.elections.nsw.gov.au/LGE2012/yass-valley-council.html
Advertising
Statutory Campaign
The Council requested that the statutory advertisements be placed in the
following press:
Yass Tribune

REPORT ON THE 2012 LOCAL GOVERNMENT ELECTIONS
Yass Valley Council
740
Candidates
Nominations withdrawn
No Councillor nominations were withdrawn.
Councillor Candidates
Total Candidates 21
Female Candidates 8
Male Candidates 13
Names of all candidates
Councillor Candidates Party Affiliation
ABBEY, Rowena -
BAKER, Kevin -
BHATIA, Manish -
BHATIA, Perminder -
BURGESS, Cecil -
BUTLER, Greg -
CASSIDY, David -
DANIEL, Ann -
FROST, Geoff -
HELDON, Karen -
HEWLETT, Ginny -
INKSTER, Mike -
JONES, Jasmin -
McCLINTOCK, Sara -
McMANUS, Michael -
NEEDHAM, David -
REYNOLDS-FURRY, Nathan -
STOREY, Edward -
TEMPLEMAN, Julieanne -
TURNER, Kim -
WARE, Garry -

REPORT ON THE 2012 LOCAL GOVERNMENT ELECTIONS
Young Shire Council
741
Young Shire Council Report
Election Summary
Poll declared by Thursday, 13 September, 2012
Councillor elections, successful candidates
Councillor name Party Affiliation
COOPER, Ben -
FREUDENSTEIN, Sandy -
FREUDENSTEIN, Stuart -
INGRAM, Brian -
MILLER, Allan -
MULLANY, Brian -
McGREGOR, John -
WALKER, John -
WALLACE, Tony -
For full details of results see website –
www.pastvtr.elections.nsw.gov.au/LGE2012/young-shire-council.html
For a breakdown of voting by Vote Type (Ordinary, Declared Institution/Pre-poll,
Postal, Provisional/Silent) see the Councillor Election page of the above
website, on the Final Results tab select 04 - Enrolment and Voting by
Aggregated Vote Type Report.
Enrolment
Total Electors 8,847
Residential roll 8,847
Non-residential roll 0
SmartRolled Electors 735
(30/7/11 – 30/7/12)
Participation and Informality
Participation rate 85.4%
Formal votes 7,229
Informal votes 324
Total votes 7,553
Informality rate 4.3%

REPORT ON THE 2012 LOCAL GOVERNMENT ELECTIONS
Young Shire Council
742
Failure to Vote
Penalty Notices Issued 1,120
Rate of Failure to Vote135 12.7%
Election Costs
Total Cost of the Young Shire Council 2012 Election
$73,002.00
Cost per elector
$8.28
Young Shire Council Statutory Advertising Campaign Expenditure
Nominations $159.52
Candidates and polling places $600.86
Uncontested elections $0.00
Results $68.00
TOTAL $828.38
Election Services
Elector Enquiry Centre
The Elector Enquiry Centre answered 60 calls from postcodes within Young Shire
Council area.
NSWEC Website
There were 1,565 unique visitors to Young Shire Council election web page.
Braille Ballot Papers
No braille ballot papers were requested or printed.
Returning Officer
Mary Moffitt
135 Percentage of Penalty Notices Issued to Enrolment (as shown on Authorised Roll)

REPORT ON THE 2012 LOCAL GOVERNMENT ELECTIONS
Young Shire Council
743
Returning Officer’s Office
Young Region Returning Officer's Office
Young Town Hall
189-205 Boorowa Street
Young NSW 2594
Councils in Region
Boorowa Council, Cowra Shire Council, Weddin Shire Council and Young Shire
Council
Staffing
Office Manager 1
Senior Office Assistant 0
Office Assistants 24
Polling Place Managers 8
Polling Place Assistants 0
Deputy Polling Place Managers 1
Declaration Vote Issuing Officer 1
Election Officials 15
Council Count Manager 0
Part Day Election Officials 1
Total Staff 51
Polling Places
Pre-poll Centres 2
Declared Institutions 4
Election day Polling Places 9
Pre-poll centre locations
Young Region Returning Officer's Office, Sydney Town Hall
Polling place locations
For 2012 map and polling places see –
www.pastvtr.elections.nsw.gov.au/LGE2012/young-shire-council.html
Advertising
Statutory Campaign
The Council requested that the statutory advertisements be placed in the
following press:
Young Witness
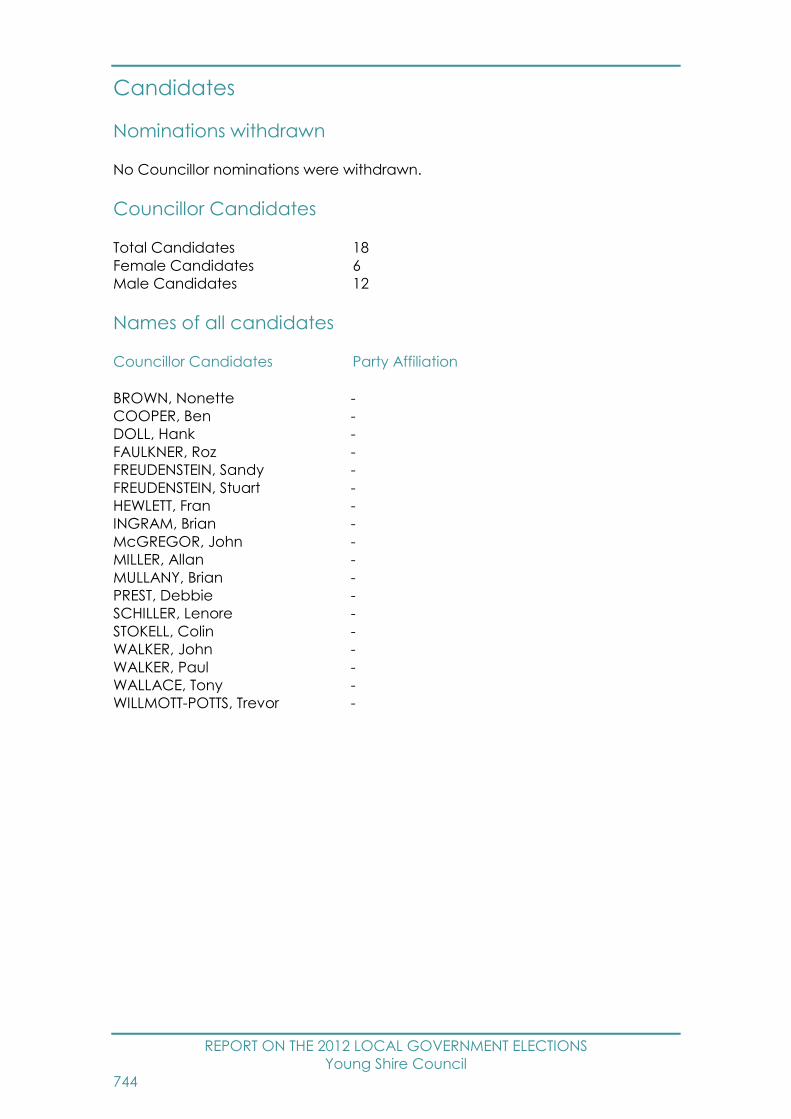
REPORT ON THE 2012 LOCAL GOVERNMENT ELECTIONS
Young Shire Council
744
Candidates
Nominations withdrawn
No Councillor nominations were withdrawn.
Councillor Candidates
Total Candidates 18
Female Candidates 6
Male Candidates 12
Names of all candidates
Councillor Candidates Party Affiliation
BROWN, Nonette -
COOPER, Ben -
DOLL, Hank -
FAULKNER, Roz -
FREUDENSTEIN, Sandy -
FREUDENSTEIN, Stuart -
HEWLETT, Fran -
INGRAM, Brian -
McGREGOR, John -
MILLER, Allan -
MULLANY, Brian -
PREST, Debbie -
SCHILLER, Lenore -
STOKELL, Colin -
WALKER, John -
WALKER, Paul -
WALLACE, Tony -
WILLMOTT-POTTS, Trevor -
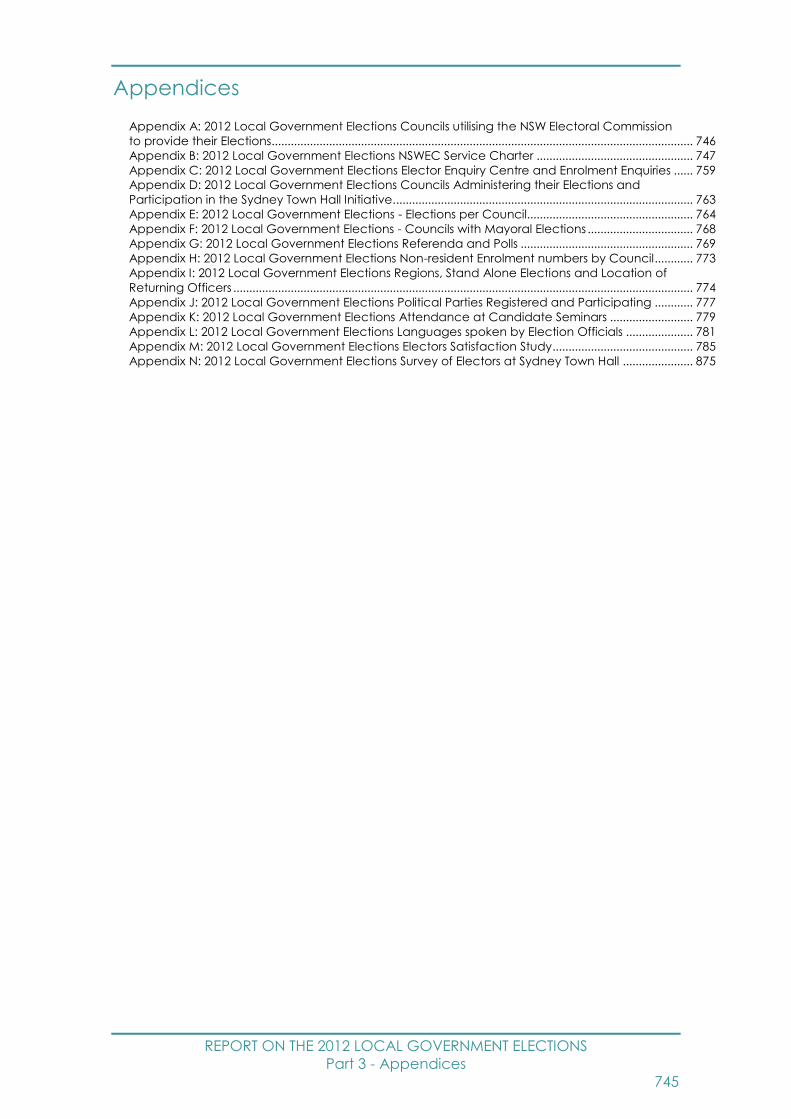
REPORT ON THE 2012 LOCAL GOVERNMENT ELECTIONS
Part 3 - Appendices
745
Appendices
Appendix A: 2012 Local Government Elections Councils utilising the NSW Electoral Commission
to provide their Elections .................................................................................................................................... 746 Appendix B: 2012 Local Government Elections NSWEC Service Charter ................................................. 747 Appendix C: 2012 Local Government Elections Elector Enquiry Centre and Enrolment Enquiries ...... 759 Appendix D: 2012 Local Government Elections Councils Administering their Elections and
Participation in the Sydney Town Hall Initiative. ............................................................................................. 763 Appendix E: 2012 Local Government Elections - Elections per Council.................................................... 764 Appendix F: 2012 Local Government Elections - Councils with Mayoral Elections ................................. 768 Appendix G: 2012 Local Government Elections Referenda and Polls ...................................................... 769 Appendix H: 2012 Local Government Elections Non-resident Enrolment numbers by Council ............ 773 Appendix I: 2012 Local Government Elections Regions, Stand Alone Elections and Location of
Returning Officers ................................................................................................................................................ 774 Appendix J: 2012 Local Government Elections Political Parties Registered and Participating ............ 777 Appendix K: 2012 Local Government Elections Attendance at Candidate Seminars .......................... 779 Appendix L: 2012 Local Government Elections Languages spoken by Election Officials ..................... 781 Appendix M: 2012 Local Government Elections Electors Satisfaction Study ............................................ 785 Appendix N: 2012 Local Government Elections Survey of Electors at Sydney Town Hall ...................... 875
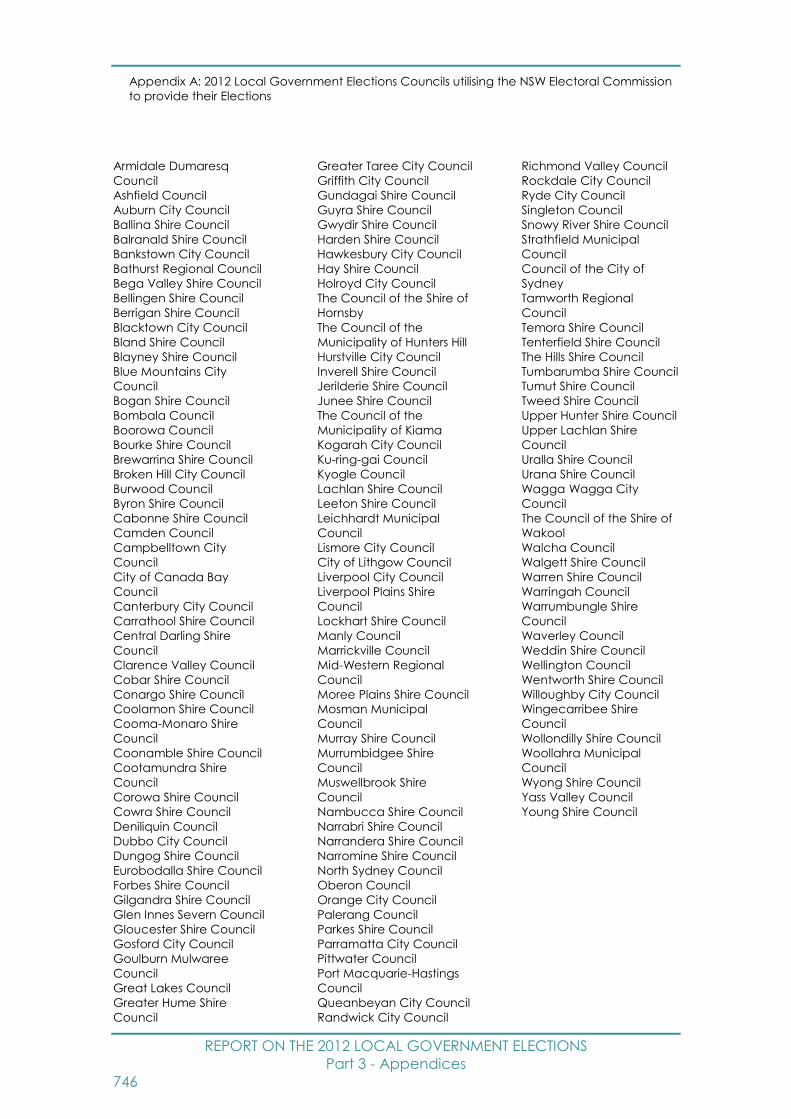
REPORT ON THE 2012 LOCAL GOVERNMENT ELECTIONS
Part 3 - Appendices
746
Appendix A: 2012 Local Government Elections Councils utilising the NSW Electoral Commission
to provide their Elections
Armidale Dumaresq
Council
Ashfield Council
Auburn City Council
Ballina Shire Council
Balranald Shire Council
Bankstown City Council
Bathurst Regional Council
Bega Valley Shire Council
Bellingen Shire Council
Berrigan Shire Council
Blacktown City Council
Bland Shire Council
Blayney Shire Council
Blue Mountains City
Council
Bogan Shire Council
Bombala Council
Boorowa Council
Bourke Shire Council
Brewarrina Shire Council
Broken Hill City Council
Burwood Council
Byron Shire Council
Cabonne Shire Council
Camden Council
Campbelltown City
Council
City of Canada Bay
Council
Canterbury City Council
Carrathool Shire Council
Central Darling Shire
Council
Clarence Valley Council
Cobar Shire Council
Conargo Shire Council
Coolamon Shire Council
Cooma-Monaro Shire
Council
Coonamble Shire Council
Cootamundra Shire
Council
Corowa Shire Council
Cowra Shire Council
Deniliquin Council
Dubbo City Council
Dungog Shire Council
Eurobodalla Shire Council
Forbes Shire Council
Gilgandra Shire Council
Glen Innes Severn Council
Gloucester Shire Council
Gosford City Council
Goulburn Mulwaree
Council
Great Lakes Council
Greater Hume Shire
Council
Greater Taree City Council
Griffith City Council
Gundagai Shire Council
Guyra Shire Council
Gwydir Shire Council
Harden Shire Council
Hawkesbury City Council
Hay Shire Council
Holroyd City Council
The Council of the Shire of
Hornsby
The Council of the
Municipality of Hunters Hill
Hurstville City Council
Inverell Shire Council
Jerilderie Shire Council
Junee Shire Council
The Council of the
Municipality of Kiama
Kogarah City Council
Ku-ring-gai Council
Kyogle Council
Lachlan Shire Council
Leeton Shire Council
Leichhardt Municipal
Council
Lismore City Council
City of Lithgow Council
Liverpool City Council
Liverpool Plains Shire
Council
Lockhart Shire Council
Manly Council
Marrickville Council
Mid-Western Regional
Council
Moree Plains Shire Council
Mosman Municipal
Council
Murray Shire Council
Murrumbidgee Shire
Council
Muswellbrook Shire
Council
Nambucca Shire Council
Narrabri Shire Council
Narrandera Shire Council
Narromine Shire Council
North Sydney Council
Oberon Council
Orange City Council
Palerang Council
Parkes Shire Council
Parramatta City Council
Pittwater Council
Port Macquarie-Hastings
Council
Queanbeyan City Council
Randwick City Council
Richmond Valley Council
Rockdale City Council
Ryde City Council
Singleton Council
Snowy River Shire Council
Strathfield Municipal
Council
Council of the City of
Sydney
Tamworth Regional
Council
Temora Shire Council
Tenterfield Shire Council
The Hills Shire Council
Tumbarumba Shire Council
Tumut Shire Council
Tweed Shire Council
Upper Hunter Shire Council
Upper Lachlan Shire
Council
Uralla Shire Council
Urana Shire Council
Wagga Wagga City
Council
The Council of the Shire of
Wakool
Walcha Council
Walgett Shire Council
Warren Shire Council
Warringah Council
Warrumbungle Shire
Council
Waverley Council
Weddin Shire Council
Wellington Council
Wentworth Shire Council
Willoughby City Council
Wingecarribee Shire
Council
Wollondilly Shire Council
Woollahra Municipal
Council
Wyong Shire Council
Yass Valley Council
Young Shire Council

REPORT ON THE 2012 LOCAL GOVERNMENT ELECTIONS
Part 3 - Appendices
747
Appendix B: 2012 Local Government Elections NSWEC Service Charter

Contents
1. A Message from the NSW Electoral Commissioner 3
2. Service Standards for the 2012 Local Government Elections 4 The Legislative Context for Local Government Elections 2012 4
Service Charter Principles 4
Councils’ Rights 4
Communication with Councils 5
3. NSWEC Proposed Service Standards for Council Elections 6 Service Standards for Results 6
Service Standards for Budget 7
Service targets 7
4. Service Standards for Electors 8 Service targets 8
5. Service Standards for Candidates and Registered Political Parties 9 Service targets 9
6. Council enquiries, feedback and complaints 10 Contact details for the NSWEC 10
Councils for whom the NSWEC will provide electoral services, 2012 Local Government Elections 11
Councils providing their own electoral services, 2012 Local Government Elections 11
2
1. A Message from the NSW Electoral Commissioner
Impartial, well conducted elections build a stronger Local Government sector and contribute to building stronger communities. The NSW Electoral Commission aims to make the 2012 Local Government Elections, which it has been engaged by councils to conduct, the best in NSW’s history.
Local government is an elected system of government directly accountable to the local community. With each council being an independent, statutory corporation responsible for administering the local government area over which it has jurisdiction, the proper election of councillors who oversee the functioning of the council, is important. Maximising the participation of local communities in Local Government elections is a goal that both councils and the NSW Electoral Commission (NSWEC) share.
The NSWEC’s objectives for the 2012 Local Government Elections which it is engaged to conduct, are to:
• Protect the institution of Local Government by conducting fair and impartial elections
• Conduct elections in accordance with the law
• Ensure community confidence in the election of local representatives to councils
• Work with councils to maximise the participation of the local community in the elections
The Service Charter:
• promotes open and timely communication and consultation between councils and the NSWEC on election services
• recognises the interests of each in the elections
• sets out the NSWEC’s accountability in providing election services for councils and areas where councils’ assistance is sought
• outlines the targets for efficiency, effectiveness and co-ordination of elections for which we are accountable
• promotes transparency and customer service commitment to successful elections in 2012
I undertake that the NSWEC will provide impartial and quality election services for those councils who are utilising the NSWEC’s services in 2012. I understand how important proper electoral processes are to safeguarding the standing of Local Government in NSW.
For those councils that select the NSWEC to conduct their elections, the following key components will be provided:
• consultation with councils on election services and timely provision of budgets
• single point of contact Client Service Officers assigned to be the councils’ dedicated contact within the NSWEC on all aspects of their elections
• Returning Officers recruited on expertise and capacity to deliver successful elections for the NSWEC and councils
• well publicised information on election services for electors, candidates, groups of candidates and registered political parties
• accurate vote counting • results on election night from
polling places as soon as they become available and timely publication of provisional and final results
• public accountability by reporting to the NSW Parliament and councils on the conduct of the elections.
The detail of election services and specific service level targets are outlined in the Charter.
In 2011 in our initial meeting with each council we discussed the Charter as part of our dialogue on the elections. Following on from these discussions, I am re-issuing this Election Services Charter as part of our commitment to provide impartial, high quality and efficient election services to those councils who have resolved to use the NSWEC to provide their elections in September 2012.
Colin Barry
NSW Electoral Commissioner
3
2. Service Standards for the 2012 Local Government Elections
The NSWEC has established service standards against which its performance can be measured for the Local Government Elections in 2012. Service standards also applied to the NSWEC for the 2011 NSW State General Election.
The Service Charter covers the services to be provided and the standards to be applied in providing these services. The principles underpinning these are set out below as are the specific standards for budget delivery, election services for electors and for candidate/registered political party stakeholders.
The Legislative Context for Local Government Elections 2012
The parameters for the conduct of the Local Government elections are set down in legislation (the Local Government Act 1993), and the Local Government (General) Regulation 2005 and policy decisions that have given effect to these provisions.
The election of individuals to civic office at a Local Government level is set down in Chapter 10 of the Local Government Act 1993. In the conduct of elections the NSW Electoral Commissioner is accountable to the Governor, Premier and Parliament by section 21AB of the Parliamentary Electorates and Elections Act 1912. The Electoral Commissioner is also oversighted by the Joint Standing Committee on Electoral Matters of the NSW Parliament.
Recent legislative change has made councils responsible for the conduct of their elections. Councils can now choose to conduct their elections themselves using their own resources or by engaging the NSWEC. If the NSWEC is selected, then the Electoral Commission is responsible for the elections.
Elections whether Federal, State or Local Government must be conducted at arms length from the elected representatives. This is a key pillar on which to build public confidence in the impartiality of the election processes and the outcome. The NSWEC is well placed to ensure that councils’ elections are conducted with absolute impartiality.
Service Charter Principles
Both the NSWEC and the councils in NSW have the right to:
• undertake their respective roles and responsibilities for these elections as set out in relevant legislation and administrative instruments
• receive services, facilities and information which meet their respective needs and responsibilities in a timely manner
• access relevant, current and timely information about the elections
• raise issues and have these considered courteously and confidentially.
Councils’ Rights
Councils can expect:
• their elections to be conducted impartially, effectively, efficiently and according to law
• consultation on key aspects of the elections including their budget, polling places, timetable for the counts and results
• access to information on the planning, progress and timetable for the elections
• regular and timely updates of progress on the preparation for the elections
4

1. The NSW Electoral Commission’s responsibilities are different for the Council of the City of Sydney. For this council the NSW Electoral Commission prepares the non-residents’ rolls.
2. Both Wollongong and Shellharbour Councils will not be holding elections in 2012.
• dedicated Client Service Officers for all councils who will consider councils’ requests and advice seriously and courteously
• Returning Officers equipped to undertake the complex responsibility of conducting Local Government elections
• enquiries and correspondence answered within a reasonable timeframe and interim responses where a delay is anticipated
• information on how to prepare the non-residents’ rolls1
• electors and those seeking election, informed of arrangements for the elections, the electoral services being provided and how to utilise these
• options for electors with particular needs on how they participate in the elections
• results of surveys seeking feedback on the conduct of the elections included in the NSWEC’s report provided to the NSW Parliament, Minister for Local Government and councils.
The assistance of councils is sought for:
• advising the NSWEC in a timely manner of any ward boundary changes
• providing information on accessible, available and cost effective office accommodation and suitable polling place venues
• commenting on proposed pre-poll and polling place locations
• placing advertisements in local newspapers about the elections
• in certain locations, accepting candidates’ nominations and deposits
• responding to requests for information by the NSWEC accurately, thoroughly and in a timely manner
• abiding by any legal requirements and other obligations regarding payment for electoral services
• treating NSWEC election staff courteously.
Communication with Councils
From mid to late 2011 the NSWEC met with councils participating in the 2012 Local Government Elections.2
The purpose of these meetings was to:
• discuss the timetable for councils to select the NSWEC to conduct their elections
• assist councils make an informed decision whether to conduct their own elections or to contract the NSWEC
• outline the election services the NSWEC can provide and the expertise and experience held by the NSWEC.
Since the conclusion of these discussions 136 councils resolved to utilise the NSWEC to provide their 2012 Local Government Election services. These councils and those who have resolved to provide their own elections are listed at the back of this Charter.
5
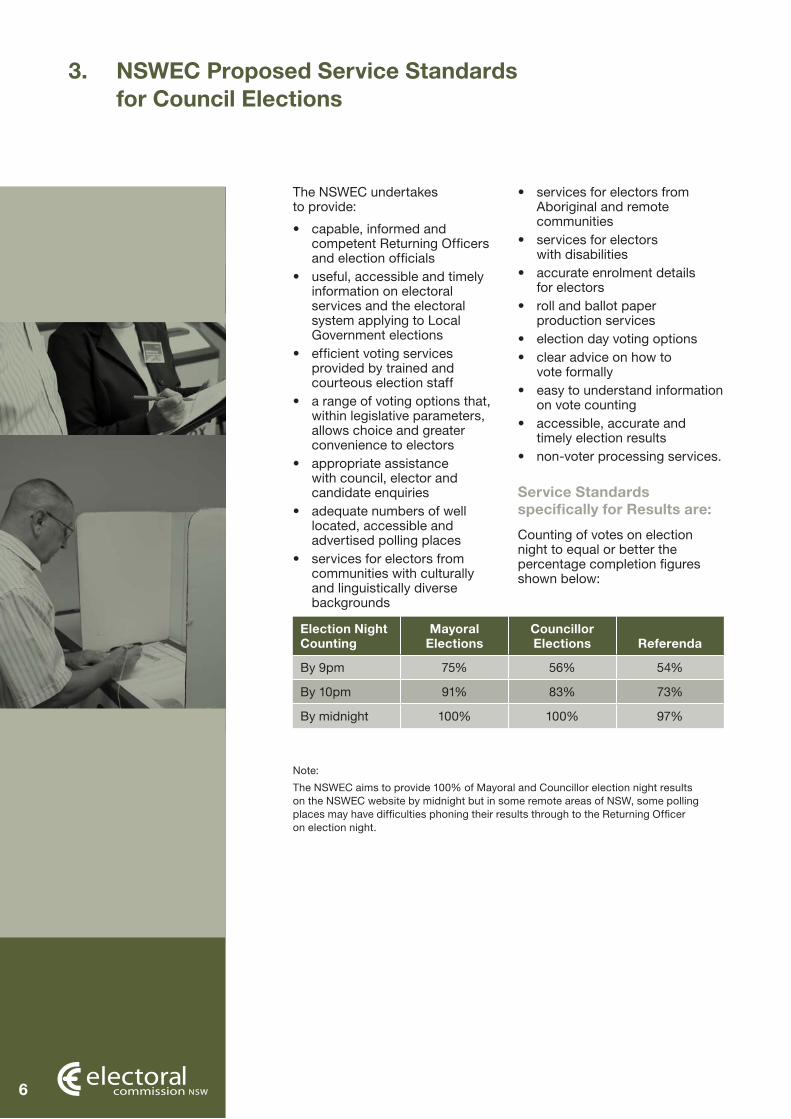
3. NSWEC Proposed Service Standards for Council Elections
Election Night Counting
Mayoral Elections
Councillor Elections Referenda
By 9pm 75% 56% 54%
By 10pm 91% 83% 73%
By midnight 100% 100% 97%
The NSWEC undertakes to provide:
• capable, informed and competent Returning Officers and election officials
• useful, accessible and timely information on electoral services and the electoral system applying to Local Government elections
• efficient voting services provided by trained and courteous election staff
• a range of voting options that, within legislative parameters, allows choice and greater convenience to electors
• appropriate assistance with council, elector and candidate enquiries
• adequate numbers of well located, accessible and advertised polling places
• services for electors from communities with culturally and linguistically diverse backgrounds
• services for electors from Aboriginal and remote communities
• services for electors with disabilities
• accurate enrolment details for electors
• roll and ballot paper production services
• election day voting options• clear advice on how to
vote formally• easy to understand information
on vote counting • accessible, accurate and
timely election results• non-voter processing services.
Service Standards specifically for Results are:
Counting of votes on election night to equal or better the percentage completion figures shown below:
Note:
The NSWEC aims to provide 100% of Mayoral and Councillor election night results on the NSWEC website by midnight but in some remote areas of NSW, some polling places may have difficulties phoning their results through to the Returning Officer on election night.
6
Service Standards specifically for Budget delivery for councils are:
• final budget and payment schedule to councils by date agreed with councils or by the 31 May 2012
• final invoice to councils by 31 January 2013
Service targets are:
• General Managers who state that Local Government Elections of 2012 were conducted impartially, fairly and in accordance with the law equal or exceed the 2008 Local Government Elections figure of 87.0%
• General Managers’ satisfaction with the quality of services provided by and professionalism of Returning Officers equals or exceeds the 2008 Local Government Elections figures of 83.8% and 82.0%
• General Managers’ satisfaction with accuracy of the electoral roll for their council equals or exceeds the 2008 Local Government Elections figure of 63.1%
• General Managers’ satisfaction with the location and number of pre-poll and polling places equals or exceeds the 2008 Local Government Elections figures of pre-poll places 81.1% (location) and 83.2% (number), and polling places 84.2% (location) and 81.0% (number)
• General Managers’ satisfaction with the efficiency of the 2012 Local Government Elections significantly exceeds the 2008 Local Government Elections figure of 25.2%
• General Managers’ satisfaction with time taken to announce the results on the NSWEC website significantly exceeds the 2008 Local Government Elections figure of 38.2%.
7
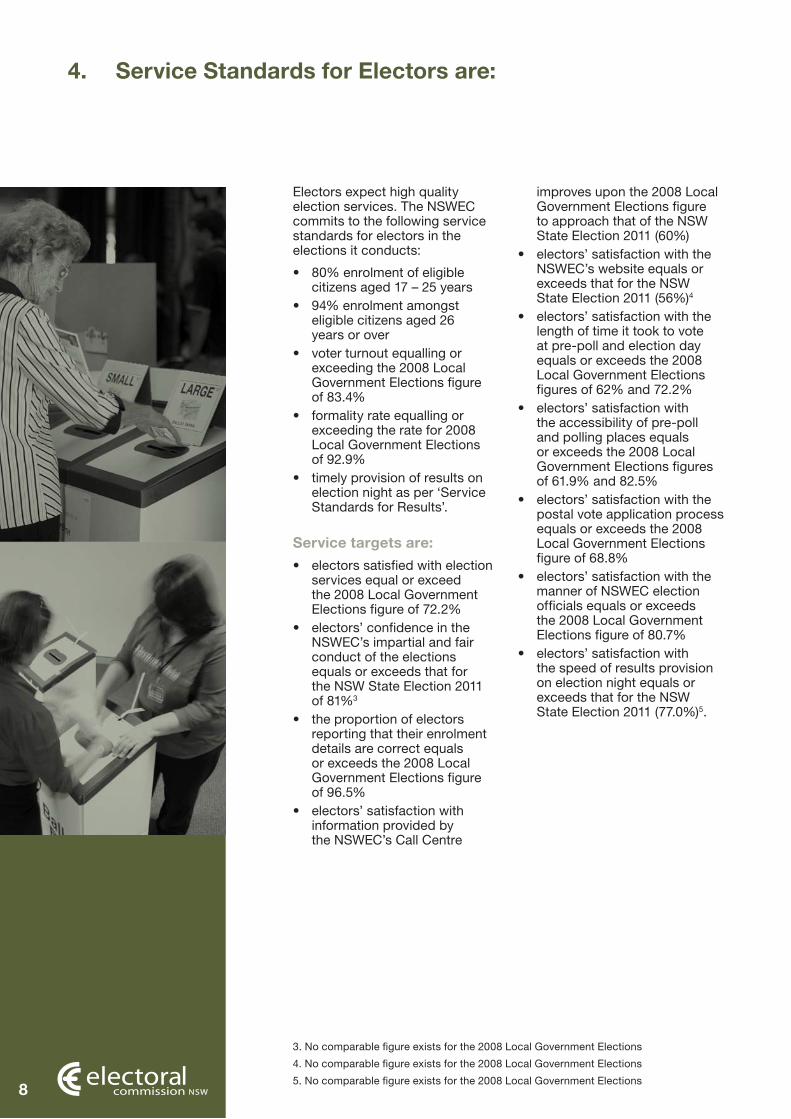
4. Service Standards for Electors are:
Electors expect high quality election services. The NSWEC commits to the following service standards for electors in the elections it conducts:
• 80% enrolment of eligible citizens aged 17 – 25 years
• 94% enrolment amongst eligible citizens aged 26 years or over
• voter turnout equalling or exceeding the 2008 Local Government Elections figure of 83.4%
• formality rate equalling or exceeding the rate for 2008 Local Government Elections of 92.9%
• timely provision of results on election night as per ‘Service Standards for Results’.
Service targets are:
• electors satisfied with election services equal or exceed the 2008 Local Government Elections figure of 72.2%
• electors’ confidence in the NSWEC’s impartial and fair conduct of the elections equals or exceeds that for the NSW State Election 2011 of 81%3
• the proportion of electors reporting that their enrolment details are correct equals or exceeds the 2008 Local Government Elections figure of 96.5%
• electors’ satisfaction with information provided by the NSWEC’s Call Centre
improves upon the 2008 Local Government Elections figure to approach that of the NSW State Election 2011 (60%)
• electors’ satisfaction with the NSWEC’s website equals or exceeds that for the NSW State Election 2011 (56%)4
• electors’ satisfaction with the length of time it took to vote at pre-poll and election day equals or exceeds the 2008 Local Government Elections figures of 62% and 72.2%
• electors’ satisfaction with the accessibility of pre-poll and polling places equals or exceeds the 2008 Local Government Elections figures of 61.9% and 82.5%
• electors’ satisfaction with the postal vote application process equals or exceeds the 2008 Local Government Elections figure of 68.8%
• electors’ satisfaction with the manner of NSWEC election officials equals or exceeds the 2008 Local Government Elections figure of 80.7%
• electors’ satisfaction with the speed of results provision on election night equals or exceeds that for the NSW State Election 2011 (77.0%)5.
3. No comparable figure exists for the 2008 Local Government Elections
4. No comparable figure exists for the 2008 Local Government Elections
5. No comparable figure exists for the 2008 Local Government Elections8

5. Service Standards for Candidates and Registered Political Parties are:
The NSWEC commits to the following election service standards for candidates, groups of candidates and registered political parties in the elections it conducts:
• useful, accessible and timely information on election services and the electoral system applying to Local Government elections
• timely, clear instructions on the rules of the elections such as how to register electoral material
• efficient electoral services provided by trained and courteous election staff
• appropriate assistance with enquiries
• efficient nominations process • refunding of candidates’
nomination deposits within 14 days of the declaration of the poll
• advice as to how to appoint scrutineers and receive information specific to the role of scrutineers
• easy to grasp information on timetable and processes for vote counting
• timely response to complaints including allegations of breaches of electoral requirements
• timely information of status of counts, any recount and declaration of polls
• accessible, accurate and timely election results with provision of results on election night as per ‘Service Standards for Results’.
Service targets are:
• candidates’ satisfaction with electoral services provided equals or exceeds the 2008 Local Government Elections figure of 76.7%
• candidates who believe the 2012 Local Government Elections were conducted impartially, fairly and in accordance with the law equal or exceed the 2008 Local Government Elections figure of 91.4%
• candidates’ satisfaction with information provided regarding election funding and disclosure requirements equals or exceeds the 2008 Local Government Elections figure of 84.7%
• candidates’ satisfaction with information provided by the Candidates’ Enquiry and Help Desk equals or exceeds the 2008 Local Government Elections figure of 80.6%
• candidates’ satisfaction with local result counts equals or exceeds the 2008 Local Government Elections figure of 87.5%
• candidates’ satisfaction with the NSWEC’s website equals or exceeds the 2008 Local Government Elections figure of 72.2%
• ability to confirm candidate details on the NSWEC website
• candidate information sheets placed on the NSWEC website
• registration of electoral material occurs within a short time frame (usually 24 hours) and reasons are provided for any refusal to register electoral material
• 100% of Local Government areas complete the distribution of preferences for Mayoral elections by the Thursday 6pm following the election and for all councillor counts by Monday 6pm of the following week
• for any vote recount, the difference between the count and the recount for any candidate is less than ten votes.
These standards also apply for registered political parties with the additional standard that the registration and re-registration services conducted 12 months before the 2012 Local Government Elections are well communicated and conducted in a timely manner.
9
6. Council enquiries, feedback and complaints
The NSWEC welcomes feedback, whether this is in the form of complaints, compliments or suggestions.
The NSWEC has established an on-line complaint facility located on the website www.elections.nsw.gov.au under ‘About Us’. The NSW Election Funding Authority’s (EFA) enquiry email is [email protected]
If correspondence is preferred, the postal address for the NSWEC is GPO Box 832, Sydney 2001. Correspondence should be marked to the Attention: Ms Helen Robinson, NSW Electoral Commission.
Councils can request a review of a decision and lodge a complaint with the NSWEC via its formal complaint process.
The NSWEC records data on complaints, compliments and suggestions and this is used to help improve services.
The NSWEC will also be undertaking post elections surveys to obtain feedback from councils that will assist the planning of future elections.
10
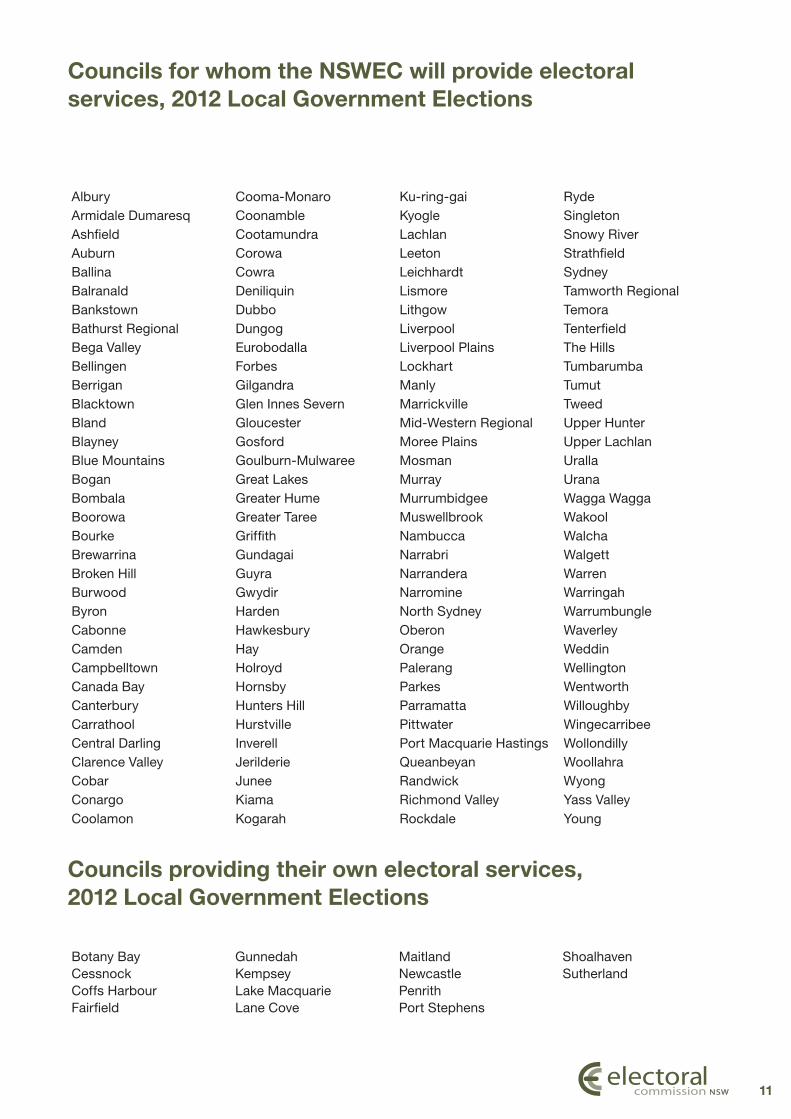
Councils for whom the NSWEC will provide electoral services, 2012 Local Government Elections
Albury Cooma-Monaro Ku-ring-gai RydeArmidale Dumaresq Coonamble Kyogle SingletonAshfield Cootamundra Lachlan Snowy RiverAuburn Corowa Leeton StrathfieldBallina Cowra Leichhardt SydneyBalranald Deniliquin Lismore Tamworth RegionalBankstown Dubbo Lithgow TemoraBathurst Regional Dungog Liverpool TenterfieldBega Valley Eurobodalla Liverpool Plains The HillsBellingen Forbes Lockhart TumbarumbaBerrigan Gilgandra Manly TumutBlacktown Glen Innes Severn Marrickville TweedBland Gloucester Mid-Western Regional Upper HunterBlayney Gosford Moree Plains Upper LachlanBlue Mountains Goulburn-Mulwaree Mosman UrallaBogan Great Lakes Murray UranaBombala Greater Hume Murrumbidgee Wagga WaggaBoorowa Greater Taree Muswellbrook WakoolBourke Griffith Nambucca WalchaBrewarrina Gundagai Narrabri WalgettBroken Hill Guyra Narrandera WarrenBurwood Gwydir Narromine WarringahByron Harden North Sydney WarrumbungleCabonne Hawkesbury Oberon WaverleyCamden Hay Orange WeddinCampbelltown Holroyd Palerang WellingtonCanada Bay Hornsby Parkes WentworthCanterbury Hunters Hill Parramatta WilloughbyCarrathool Hurstville Pittwater WingecarribeeCentral Darling Inverell Port Macquarie Hastings WollondillyClarence Valley Jerilderie Queanbeyan WoollahraCobar Junee Randwick WyongConargo Kiama Richmond Valley Yass ValleyCoolamon Kogarah Rockdale Young
Councils providing their own electoral services, 2012 Local Government Elections
Botany Bay Gunnedah Maitland ShoalhavenCessnock Kempsey Newcastle SutherlandCoffs Harbour Lake Macquarie PenrithFairfield Lane Cove Port Stephens
11
L O C A L G O V E R N M E N T E L E C T I O N S
2012
The NSW Electoral Commission’s contact details are:
Address: Level 25, 201 Kent Street, Sydney NSW 2000 Australia
Postal: GPO BOX 832, Sydney NSW 2001 Australia
Telephone: +61 2 9290 5999
Fax: +61 2 9290 5991
Website: www.elections.nsw.gov.au
Office hours: Monday – Friday, 9am – 5pm
Further copies of the NSW Electoral Commission’s 2012 Local Government Elections Service Charter for NSW Councils can be obtained from the website www.elections.nsw.gov.au

REPORT ON THE 2012 LOCAL GOVERNMENT ELECTIONS
Part 3 - Appendices
759
Appendix C: 2012 Local Government Elections Elector Enquiry Centre and Enrolment
Enquiries
Council Elector Enquiry
Centre Total Enrolment Grand Total
Albury 253 74 327
Armidale Dumaresq 222 60 282
Ashfield 455 158 613
Auburn 604 180 784
Ballina 599 159 758
Balranald 18 7 25
Bankstown 1,578 417 1,995
Bathurst 129 55 184
Bega Valley 342 73 415
Bellingen 107 25 132
Berrigan 79 36 115
Blacktown 3,306 1,079 4,385
Bland 84 18 102
Blayney Shire 60 16 76
Blue Mountains 824 191 1,015
Bogan 30 8 38
Bombala 26 9 35
Boorowa 24 8 32
Botany Bay 365 186 551
Bourke 17 3 20
Brewarrina 9 3 12
Broken Hill 63 35 98
Burwood 505 133 638
Byron 247 81 328
Cabonne 202 44 246
Camden 438 112 550
Campbelltown 995 198 1,193
Canada Bay 803 251 1,054
Canterbury 1,057 320 1,377
Carrathool 18 4 22
Central Darling 17 9 26
Cessnock 149 48 197
Clarence Valley 361 104 465
Cobar 5 5
Coffs Harbour 129 35 164
Conargo 3 3
Coolamon 46 14 60
Cooma-Monaro 98 29 127
Coonamble 19 6 25
Cootamundra 44 13 57
Corowa 5 2 7
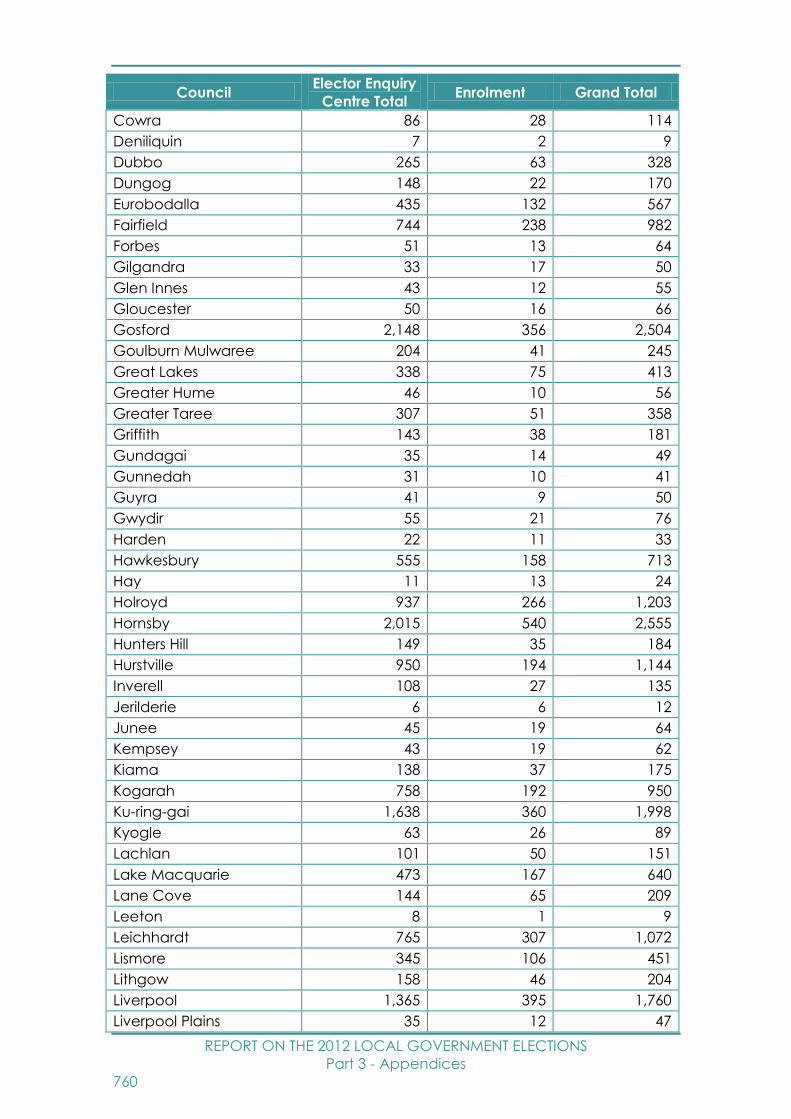
REPORT ON THE 2012 LOCAL GOVERNMENT ELECTIONS
Part 3 - Appendices
760
Council Elector Enquiry
Centre Total Enrolment Grand Total
Cowra 86 28 114
Deniliquin 7 2 9
Dubbo 265 63 328
Dungog 148 22 170
Eurobodalla 435 132 567
Fairfield 744 238 982
Forbes 51 13 64
Gilgandra 33 17 50
Glen Innes 43 12 55
Gloucester 50 16 66
Gosford 2,148 356 2,504
Goulburn Mulwaree 204 41 245
Great Lakes 338 75 413
Greater Hume 46 10 56
Greater Taree 307 51 358
Griffith 143 38 181
Gundagai 35 14 49
Gunnedah 31 10 41
Guyra 41 9 50
Gwydir 55 21 76
Harden 22 11 33
Hawkesbury 555 158 713
Hay 11 13 24
Holroyd 937 266 1,203
Hornsby 2,015 540 2,555
Hunters Hill 149 35 184
Hurstville 950 194 1,144
Inverell 108 27 135
Jerilderie 6 6 12
Junee 45 19 64
Kempsey 43 19 62
Kiama 138 37 175
Kogarah 758 192 950
Ku-ring-gai 1,638 360 1,998
Kyogle 63 26 89
Lachlan 101 50 151
Lake Macquarie 473 167 640
Lane Cove 144 65 209
Leeton 8 1 9
Leichhardt 765 307 1,072
Lismore 345 106 451
Lithgow 158 46 204
Liverpool 1,365 395 1,760
Liverpool Plains 35 12 47
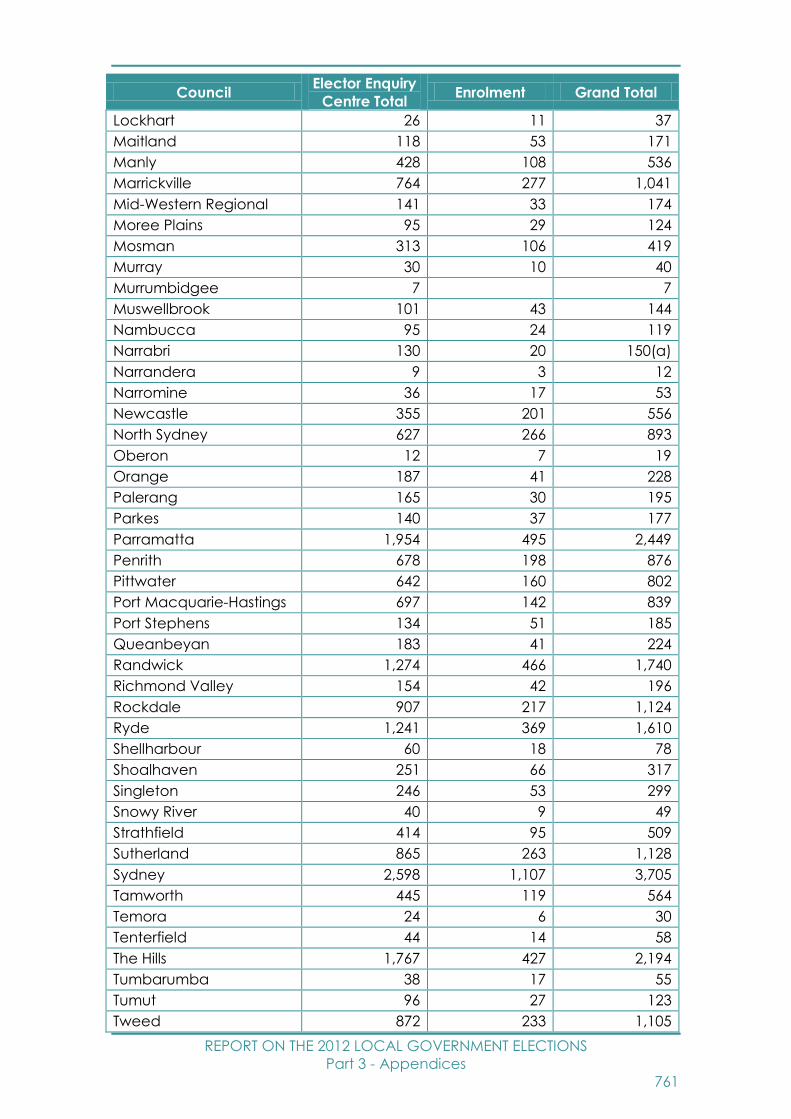
REPORT ON THE 2012 LOCAL GOVERNMENT ELECTIONS
Part 3 - Appendices
761
Council Elector Enquiry
Centre Total Enrolment Grand Total
Lockhart 26 11 37
Maitland 118 53 171
Manly 428 108 536
Marrickville 764 277 1,041
Mid-Western Regional 141 33 174
Moree Plains 95 29 124
Mosman 313 106 419
Murray 30 10 40
Murrumbidgee 7 7
Muswellbrook 101 43 144
Nambucca 95 24 119
Narrabri 130 20 150(a)
Narrandera 9 3 12
Narromine 36 17 53
Newcastle 355 201 556
North Sydney 627 266 893
Oberon 12 7 19
Orange 187 41 228
Palerang 165 30 195
Parkes 140 37 177
Parramatta 1,954 495 2,449
Penrith 678 198 876
Pittwater 642 160 802
Port Macquarie-Hastings 697 142 839
Port Stephens 134 51 185
Queanbeyan 183 41 224
Randwick 1,274 466 1,740
Richmond Valley 154 42 196
Rockdale 907 217 1,124
Ryde 1,241 369 1,610
Shellharbour 60 18 78
Shoalhaven 251 66 317
Singleton 246 53 299
Snowy River 40 9 49
Strathfield 414 95 509
Sutherland 865 263 1,128
Sydney 2,598 1,107 3,705
Tamworth 445 119 564
Temora 24 6 30
Tenterfield 44 14 58
The Hills 1,767 427 2,194
Tumbarumba 38 17 55
Tumut 96 27 123
Tweed 872 233 1,105
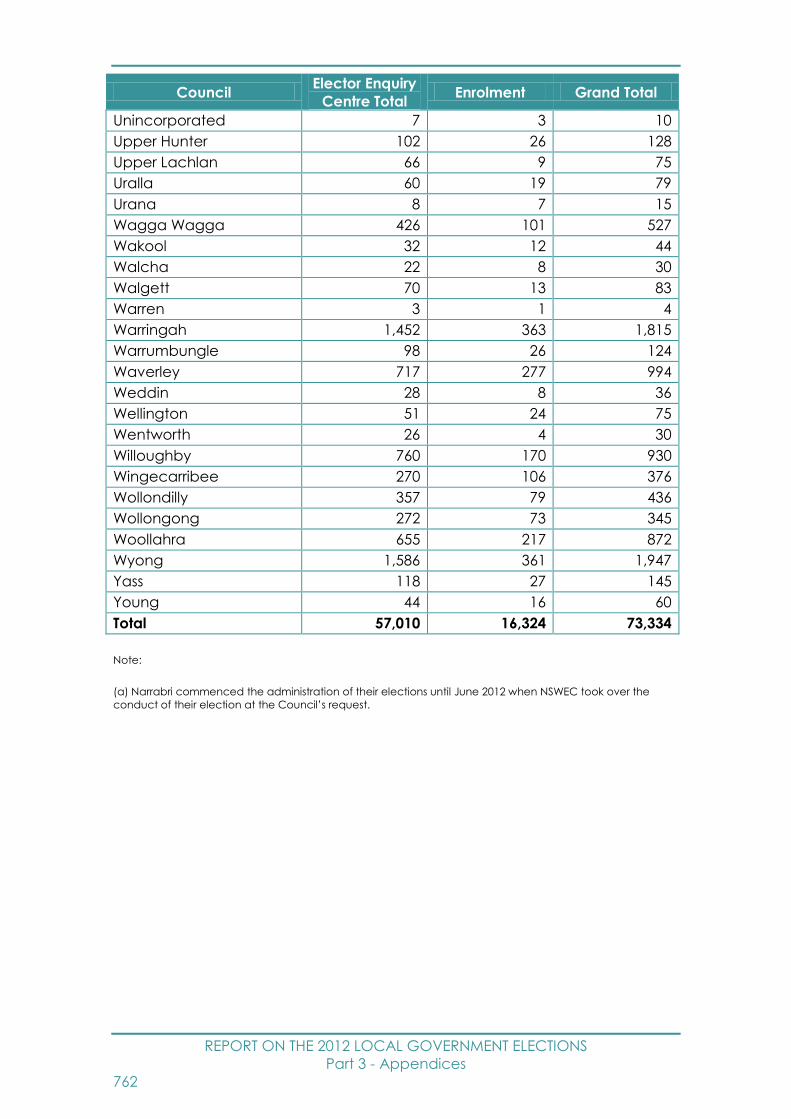
REPORT ON THE 2012 LOCAL GOVERNMENT ELECTIONS
Part 3 - Appendices
762
Council Elector Enquiry
Centre Total Enrolment Grand Total
Unincorporated 7 3 10
Upper Hunter 102 26 128
Upper Lachlan 66 9 75
Uralla 60 19 79
Urana 8 7 15
Wagga Wagga 426 101 527
Wakool 32 12 44
Walcha 22 8 30
Walgett 70 13 83
Warren 3 1 4
Warringah 1,452 363 1,815
Warrumbungle 98 26 124
Waverley 717 277 994
Weddin 28 8 36
Wellington 51 24 75
Wentworth 26 4 30
Willoughby 760 170 930
Wingecarribee 270 106 376
Wollondilly 357 79 436
Wollongong 272 73 345
Woollahra 655 217 872
Wyong 1,586 361 1,947
Yass 118 27 145
Young 44 16 60
Total 57,010 16,324 73,334
Note:
(a) Narrabri commenced the administration of their elections until June 2012 when NSWEC took over the
conduct of their election at the Council’s request.
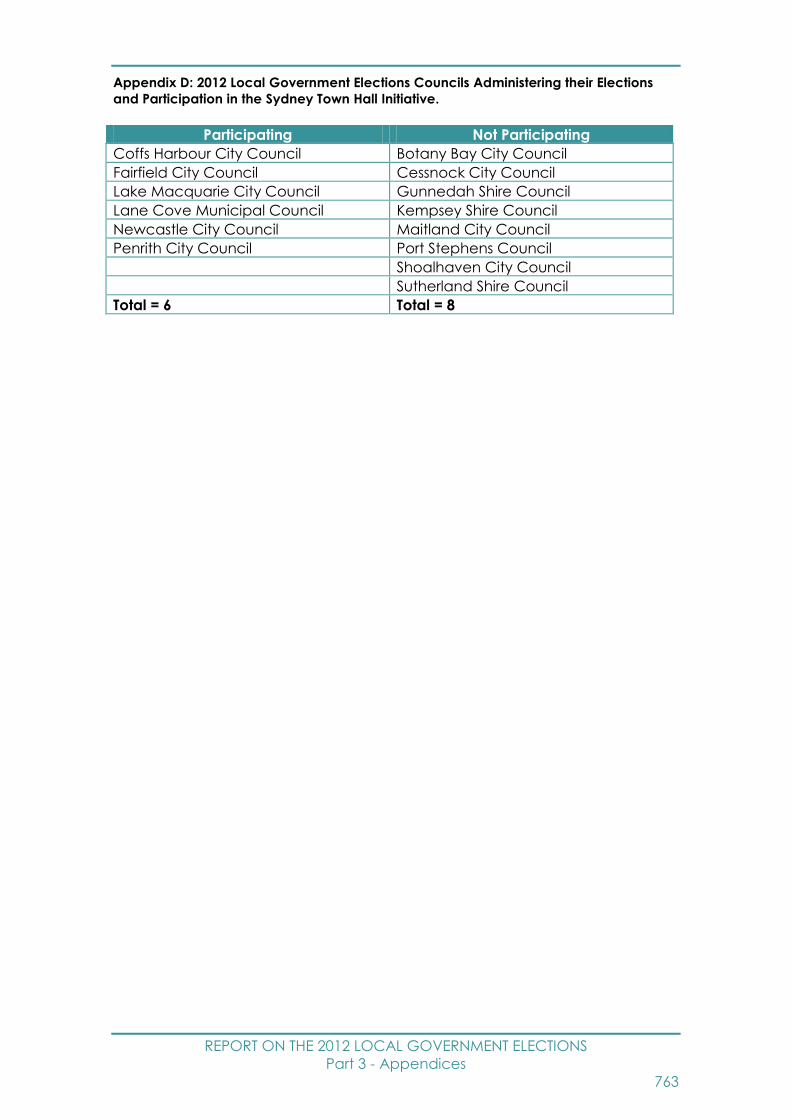
REPORT ON THE 2012 LOCAL GOVERNMENT ELECTIONS
Part 3 - Appendices
763
Appendix D: 2012 Local Government Elections Councils Administering their Elections
and Participation in the Sydney Town Hall Initiative.
Participating Not Participating
Coffs Harbour City Council Botany Bay City Council
Fairfield City Council Cessnock City Council
Lake Macquarie City Council Gunnedah Shire Council
Lane Cove Municipal Council Kempsey Shire Council
Newcastle City Council Maitland City Council
Penrith City Council Port Stephens Council
Shoalhaven City Council
Sutherland Shire Council
Total = 6 Total = 8
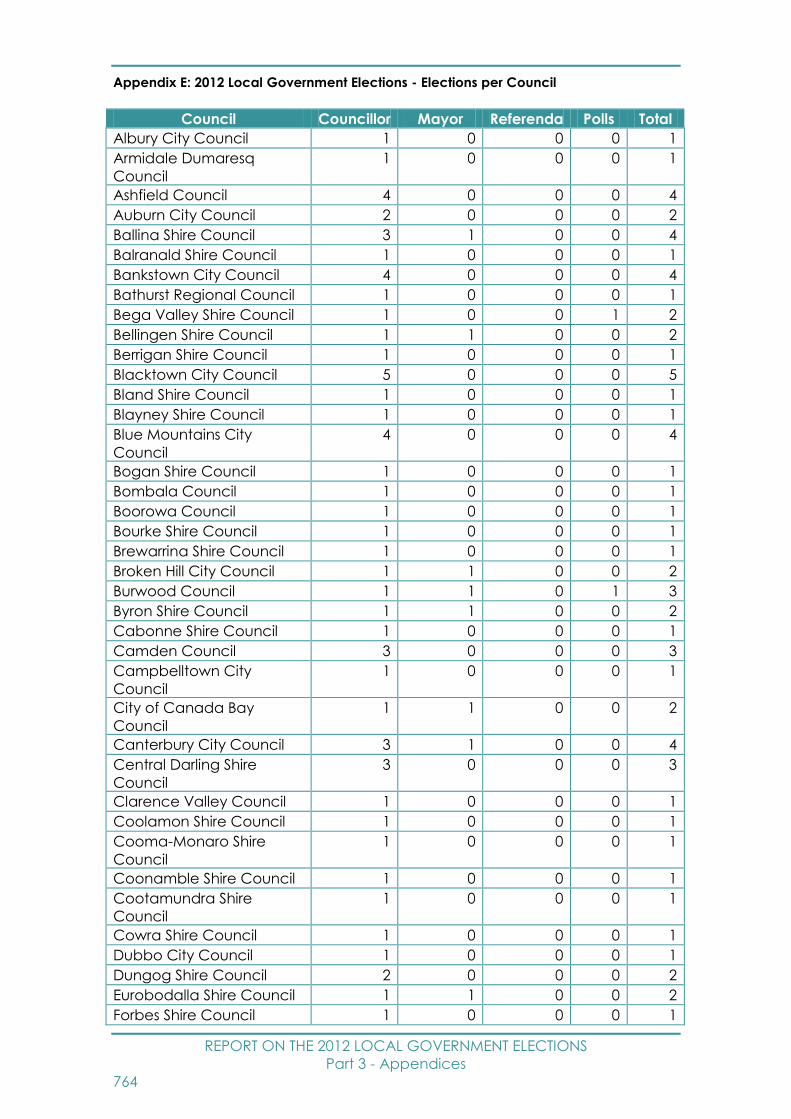
REPORT ON THE 2012 LOCAL GOVERNMENT ELECTIONS
Part 3 - Appendices
764
Appendix E: 2012 Local Government Elections - Elections per Council
Council Councillor Mayor Referenda Polls Total
Albury City Council 1 0 0 0 1
Armidale Dumaresq
Council
1 0 0 0 1
Ashfield Council 4 0 0 0 4
Auburn City Council 2 0 0 0 2
Ballina Shire Council 3 1 0 0 4
Balranald Shire Council 1 0 0 0 1
Bankstown City Council 4 0 0 0 4
Bathurst Regional Council 1 0 0 0 1
Bega Valley Shire Council 1 0 0 1 2
Bellingen Shire Council 1 1 0 0 2
Berrigan Shire Council 1 0 0 0 1
Blacktown City Council 5 0 0 0 5
Bland Shire Council 1 0 0 0 1
Blayney Shire Council 1 0 0 0 1
Blue Mountains City
Council
4 0 0 0 4
Bogan Shire Council 1 0 0 0 1
Bombala Council 1 0 0 0 1
Boorowa Council 1 0 0 0 1
Bourke Shire Council 1 0 0 0 1
Brewarrina Shire Council 1 0 0 0 1
Broken Hill City Council 1 1 0 0 2
Burwood Council 1 1 0 1 3
Byron Shire Council 1 1 0 0 2
Cabonne Shire Council 1 0 0 0 1
Camden Council 3 0 0 0 3
Campbelltown City
Council
1 0 0 0 1
City of Canada Bay
Council
1 1 0 0 2
Canterbury City Council 3 1 0 0 4
Central Darling Shire
Council
3 0 0 0 3
Clarence Valley Council 1 0 0 0 1
Coolamon Shire Council 1 0 0 0 1
Cooma-Monaro Shire
Council
1 0 0 0 1
Coonamble Shire Council 1 0 0 0 1
Cootamundra Shire
Council
1 0 0 0 1
Cowra Shire Council 1 0 0 0 1
Dubbo City Council 1 0 0 0 1
Dungog Shire Council 2 0 0 0 2
Eurobodalla Shire Council 1 1 0 0 2
Forbes Shire Council 1 0 0 0 1
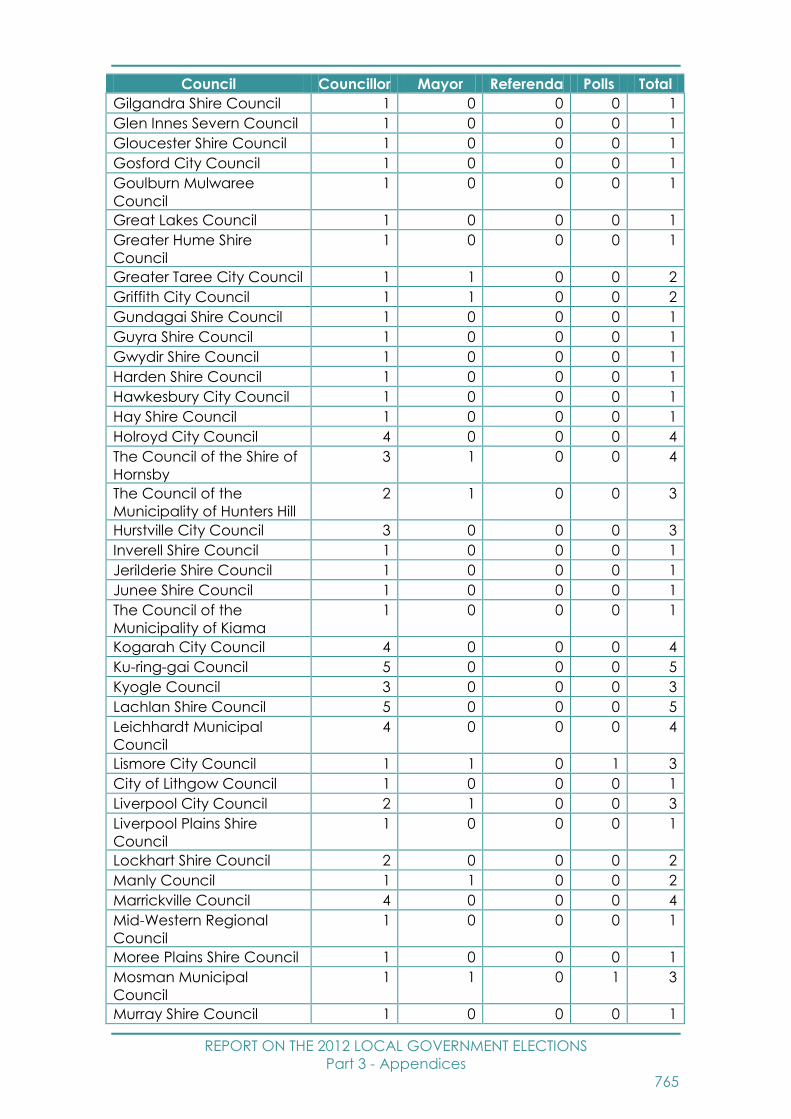
REPORT ON THE 2012 LOCAL GOVERNMENT ELECTIONS
Part 3 - Appendices
765
Council Councillor Mayor Referenda Polls Total
Gilgandra Shire Council 1 0 0 0 1
Glen Innes Severn Council 1 0 0 0 1
Gloucester Shire Council 1 0 0 0 1
Gosford City Council 1 0 0 0 1
Goulburn Mulwaree
Council
1 0 0 0 1
Great Lakes Council 1 0 0 0 1
Greater Hume Shire
Council
1 0 0 0 1
Greater Taree City Council 1 1 0 0 2
Griffith City Council 1 1 0 0 2
Gundagai Shire Council 1 0 0 0 1
Guyra Shire Council 1 0 0 0 1
Gwydir Shire Council 1 0 0 0 1
Harden Shire Council 1 0 0 0 1
Hawkesbury City Council 1 0 0 0 1
Hay Shire Council 1 0 0 0 1
Holroyd City Council 4 0 0 0 4
The Council of the Shire of
Hornsby
3 1 0 0 4
The Council of the
Municipality of Hunters Hill
2 1 0 0 3
Hurstville City Council 3 0 0 0 3
Inverell Shire Council 1 0 0 0 1
Jerilderie Shire Council 1 0 0 0 1
Junee Shire Council 1 0 0 0 1
The Council of the
Municipality of Kiama
1 0 0 0 1
Kogarah City Council 4 0 0 0 4
Ku-ring-gai Council 5 0 0 0 5
Kyogle Council 3 0 0 0 3
Lachlan Shire Council 5 0 0 0 5
Leichhardt Municipal
Council
4 0 0 0 4
Lismore City Council 1 1 0 1 3
City of Lithgow Council 1 0 0 0 1
Liverpool City Council 2 1 0 0 3
Liverpool Plains Shire
Council
1 0 0 0 1
Lockhart Shire Council 2 0 0 0 2
Manly Council 1 1 0 0 2
Marrickville Council 4 0 0 0 4
Mid-Western Regional
Council
1 0 0 0 1
Moree Plains Shire Council 1 0 0 0 1
Mosman Municipal
Council
1 1 0 1 3
Murray Shire Council 1 0 0 0 1
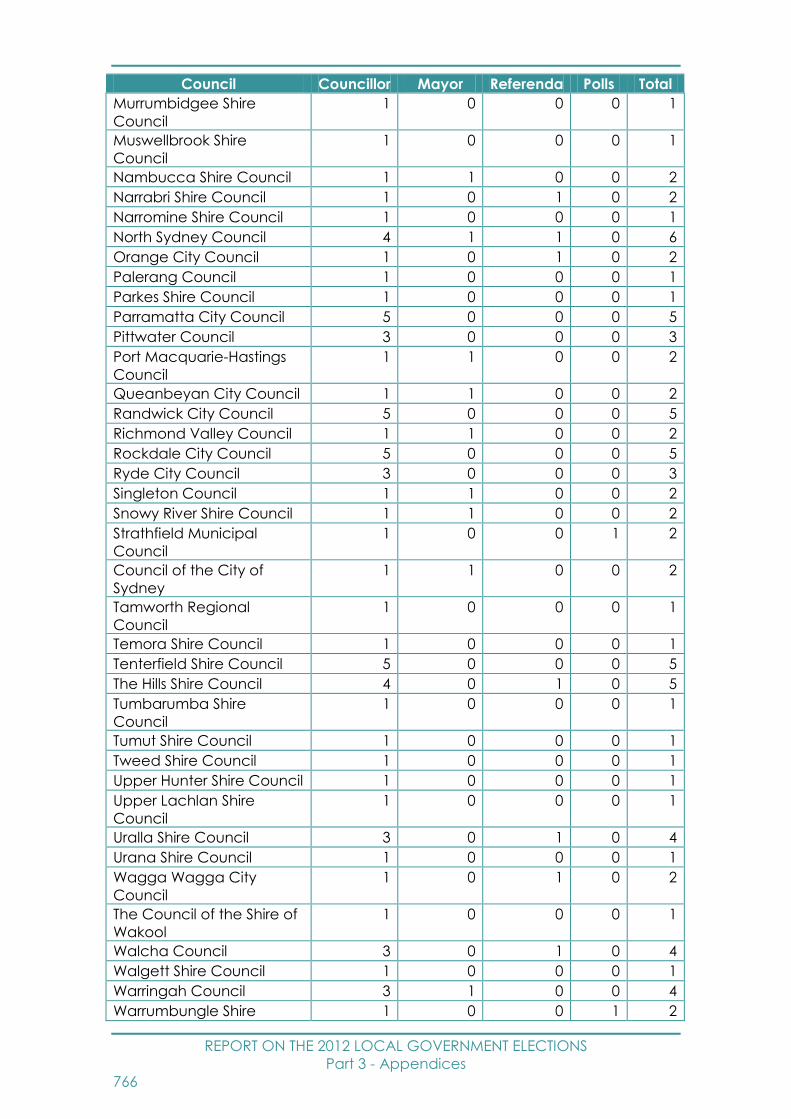
REPORT ON THE 2012 LOCAL GOVERNMENT ELECTIONS
Part 3 - Appendices
766
Council Councillor Mayor Referenda Polls Total
Murrumbidgee Shire
Council
1 0 0 0 1
Muswellbrook Shire
Council
1 0 0 0 1
Nambucca Shire Council 1 1 0 0 2
Narrabri Shire Council 1 0 1 0 2
Narromine Shire Council 1 0 0 0 1
North Sydney Council 4 1 1 0 6
Orange City Council 1 0 1 0 2
Palerang Council 1 0 0 0 1
Parkes Shire Council 1 0 0 0 1
Parramatta City Council 5 0 0 0 5
Pittwater Council 3 0 0 0 3
Port Macquarie-Hastings
Council
1 1 0 0 2
Queanbeyan City Council 1 1 0 0 2
Randwick City Council 5 0 0 0 5
Richmond Valley Council 1 1 0 0 2
Rockdale City Council 5 0 0 0 5
Ryde City Council 3 0 0 0 3
Singleton Council 1 1 0 0 2
Snowy River Shire Council 1 1 0 0 2
Strathfield Municipal
Council
1 0 0 1 2
Council of the City of
Sydney
1 1 0 0 2
Tamworth Regional
Council
1 0 0 0 1
Temora Shire Council 1 0 0 0 1
Tenterfield Shire Council 5 0 0 0 5
The Hills Shire Council 4 0 1 0 5
Tumbarumba Shire
Council
1 0 0 0 1
Tumut Shire Council 1 0 0 0 1
Tweed Shire Council 1 0 0 0 1
Upper Hunter Shire Council 1 0 0 0 1
Upper Lachlan Shire
Council
1 0 0 0 1
Uralla Shire Council 3 0 1 0 4
Urana Shire Council 1 0 0 0 1
Wagga Wagga City
Council
1 0 1 0 2
The Council of the Shire of
Wakool
1 0 0 0 1
Walcha Council 3 0 1 0 4
Walgett Shire Council 1 0 0 0 1
Warringah Council 3 1 0 0 4
Warrumbungle Shire 1 0 0 1 2

REPORT ON THE 2012 LOCAL GOVERNMENT ELECTIONS
Part 3 - Appendices
767
Council Councillor Mayor Referenda Polls Total
Council
Waverley Council 4 0 0 0 4
Weddin Shire Council 1 0 0 0 1
Wellington Council 1 0 0 0 1
Wentworth Shire Council 1 0 0 0 1
Willoughby City Council 4 1 0 0 5
Wingecarribee Shire
Council
1 0 0 0 1
Wollondilly Shire Council 3 0 0 0 3
Woollahra Municipal
Council
5 0 0 0 5
Wyong Shire Council 2 0 1 0 3
Yass Valley Council 1 0 0 0 1
Young Shire Council 1 0 0 0 1
TOTAL 224 26 8 6 264
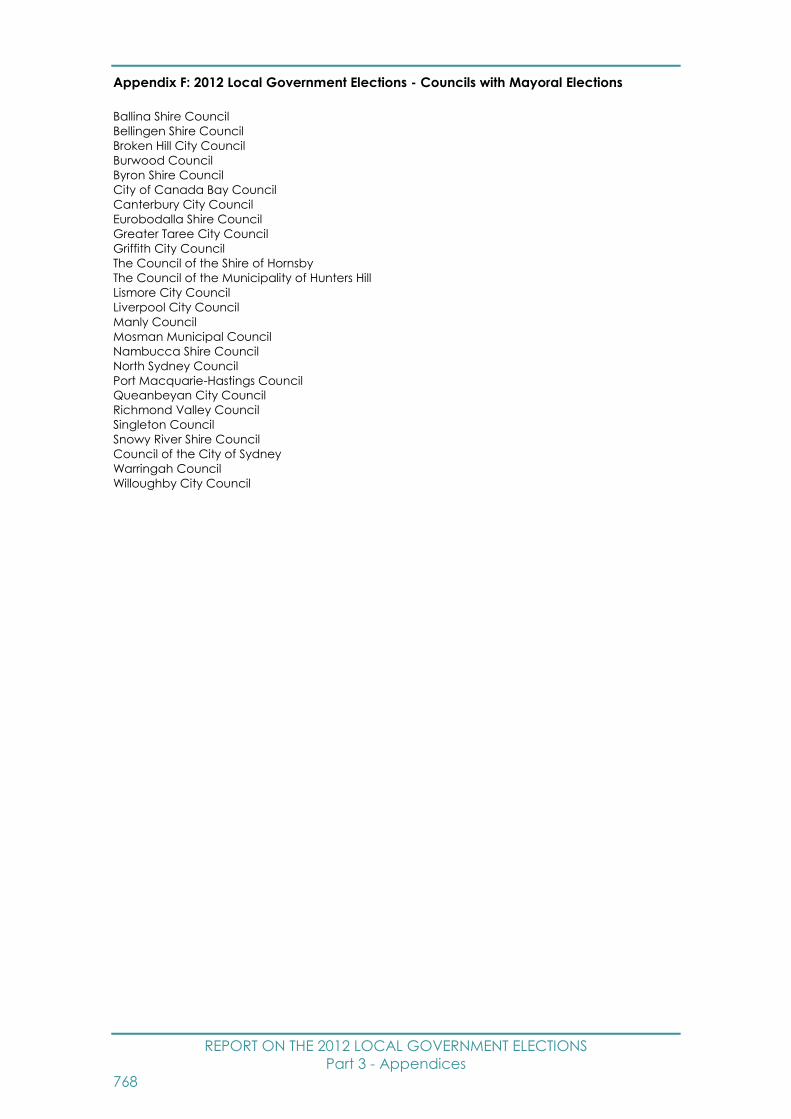
REPORT ON THE 2012 LOCAL GOVERNMENT ELECTIONS
Part 3 - Appendices
768
Appendix F: 2012 Local Government Elections - Councils with Mayoral Elections
Ballina Shire Council
Bellingen Shire Council
Broken Hill City Council
Burwood Council
Byron Shire Council
City of Canada Bay Council
Canterbury City Council
Eurobodalla Shire Council
Greater Taree City Council
Griffith City Council
The Council of the Shire of Hornsby
The Council of the Municipality of Hunters Hill
Lismore City Council
Liverpool City Council
Manly Council
Mosman Municipal Council
Nambucca Shire Council
North Sydney Council
Port Macquarie-Hastings Council
Queanbeyan City Council
Richmond Valley Council
Singleton Council
Snowy River Shire Council
Council of the City of Sydney
Warringah Council
Willoughby City Council

REPORT ON THE 2012 LOCAL GOVERNMENT ELECTIONS
Part 3 - Appendices
769
Appendix G: 2012 Local Government Elections Referenda and Polls
Council Number of
Voters Referendum Question
1 The Hills 114,300 Do you favour the election of
the Mayor by electors for a
four year term which
necessarily increases the
number of Councillors by 1?
2 Narrabri 8,800 Do you favour the number of
Narrabri Shire councillors
being reduced from twelve
(12) to nine (9)?
3 North Sydney 40,600 Currently North Sydney
Council has four wards and
12 councillors (three per
ward), plus the popularly
elected mayor, elected for a
four year term.
Do you favour a reduction in
the number of wards from
four to three and the number
of councillors from 13 to 10,
inclusive of the popularly
elected mayor?
If there is majority support for
the proposal, the changes
will take effect from the 2016
election.
4 Orange 25,100 The Mayor of Orange is
currently elected each year
by the 12 Councillors.
Do you approve of the direct
election of the Mayor by the
voters of Orange, for a four
year term?
5 Uralla 4,200 The Mayor of the Uralla
Shire Council is currently
elected by the Councillors.
Do you favour the election of
the Mayor by the electors for
a four year term, reducing
the number of wards from
three to two (one Urban and
one Rural) and maintaining
nine Councillors (including

REPORT ON THE 2012 LOCAL GOVERNMENT ELECTIONS
Part 3 - Appendices
770
Council Number of
Voters Referendum Question
the mayor) to enable the
election of four Councillors
from the two wards?
6 Wagga Wagga 39,400 Do you support a reduction
in the number of Councillors
for the City of Wagga
Wagga from 11 to 9?
7 Walcha 2,300 Currently, Walcha council is
divided into 4 Wards. 2
Councillors are elected from
each Ward by the electors
enrolled in that Ward.
Candidates must be enrolled
in the council area but not
necessarily in the Ward they
are nominating as a
candidate. Elections are only
held if more than 2
nominations are received in
each Ward.
Do you favour Walcha
Council abolishing Wards so
that all electors vote for all
Eight (8) Councillors?
8 Wyong 53,900 The Mayor of Wyong Shire
Council is currently elected
annually by the Councillors.
Do you favour the election of
the Mayor by electors for a
four year term and an
increase of the number of
Councillors from ten to
eleven (including the Mayor)
to enable the election of 5
councillors from the two
wards?
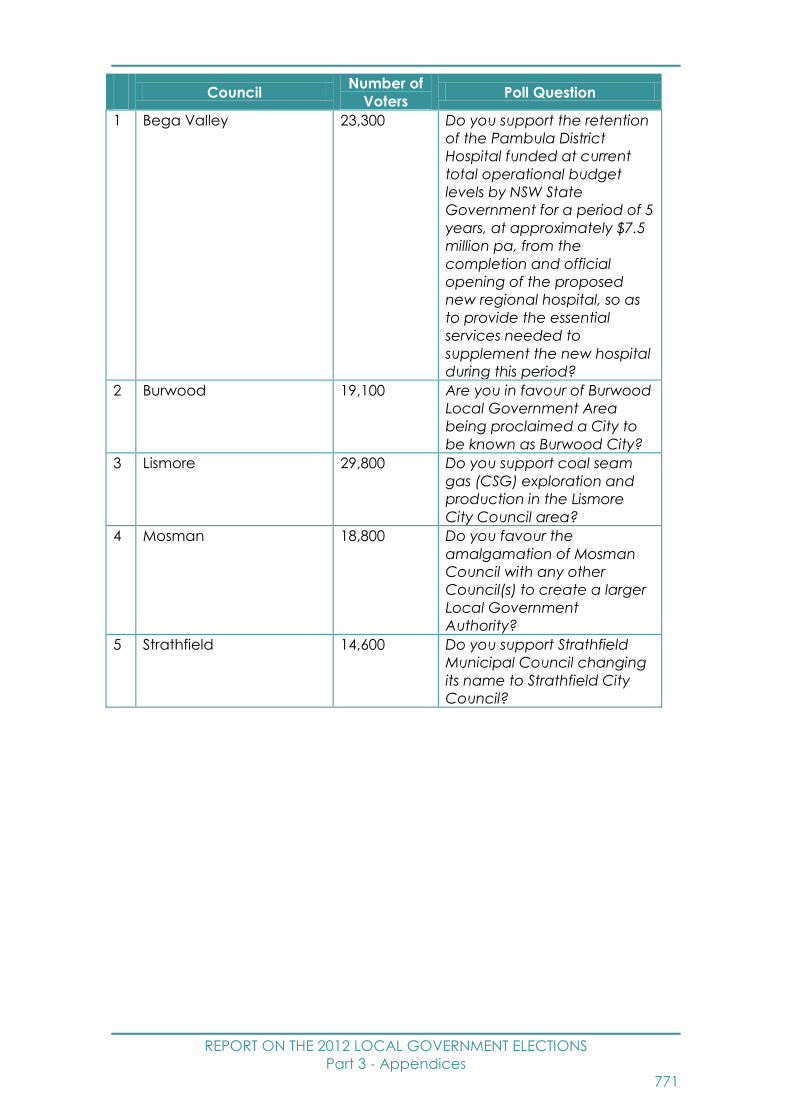
REPORT ON THE 2012 LOCAL GOVERNMENT ELECTIONS
Part 3 - Appendices
771
Council
Number of
Voters Poll Question
1 Bega Valley 23,300 Do you support the retention
of the Pambula District
Hospital funded at current
total operational budget
levels by NSW State
Government for a period of 5
years, at approximately $7.5
million pa, from the
completion and official
opening of the proposed
new regional hospital, so as
to provide the essential
services needed to
supplement the new hospital
during this period?
2 Burwood 19,100 Are you in favour of Burwood
Local Government Area
being proclaimed a City to
be known as Burwood City?
3 Lismore 29,800 Do you support coal seam
gas (CSG) exploration and
production in the Lismore
City Council area?
4 Mosman 18,800 Do you favour the
amalgamation of Mosman
Council with any other
Council(s) to create a larger
Local Government
Authority?
5 Strathfield 14,600 Do you support Strathfield
Municipal Council changing
its name to Strathfield City
Council?

REPORT ON THE 2012 LOCAL GOVERNMENT ELECTIONS
Part 3 - Appendices
772
Council
Number of
Voters Poll Question
6 Warrumbungle 7,100 The idea of changing the
name of the Warrumbungle
Shire Council to that of
Warrumbungle Regional
Council has been discussed
on numerous occasions since
the amalgamation of the
Coolah Shire Council with
the Coonabarabran Shire
Council .This subject was
again raised at the
Community Strategic
Planning meetings held in
various locations around the
Shire in 2011.
Are you in favour of
changing the name of
Warrumbungle Shire Council
to Warrumbungle Regional
Council?

REPORT ON THE 2012 LOCAL GOVERNMENT ELECTIONS
Part 3 - Appendices
773
Appendix H: 2012 Local Government Elections Non-resident Enrolment numbers by
Council
Albury 4
Armidale Dumaresq 2
Ashfield 10
Auburn 5
Ballina 1
Bankstown 7
Bathurst 10
Bega Valley 7
Bellingen 4
Berrigan 1
Blacktown 2
Bland 1
Blayney Shire 1
Blue Mountains 8
Bogan 2
Bombala 2
Boorowa 13
Botany Bay 2
Broken Hill 6
Burwood 47
Byron 59
Cabonne 5
Camden 5
Campbelltown 10
Canada Bay 3
Canterbury 1
Central Darling 42
Cessnock 5
Clarence Valley 3
Cobar 1
Coffs Harbour 4
Conargo 1
Cooma-Monaro 10
Cootamundra 1
Corowa 1
Cowra 1
Deniliquin 1
Eurobodalla 376
Fairfield 6
Glen Innes 3
Gloucester 7
Gosford 3
Great Lakes 13
Greater Hume 2
Greater Taree 5
Gunnedah 1
Gwydir 1
Harden 1
Hawkesbury 29
Hay 5
Holroyd 5
Hornsby 4
Hunters Hill 1
Hurstville 12
Inverell 1
Junee 2
Kempsey 5
Kogarah 3
Ku-ring-gai 3
Kyogle 3
Lake Macquarie 4
Lane Cove 4
Leichhardt 88
Lismore 7
Lithgow 24
Liverpool 28
Liverpool Plains 2
Lockhart 1
Maitland 3
Manly 9
Marrickville 150
Mid-Western Regional 6
Moree Plains 1
Mosman 4
Murray 3
Murrumbidgee 3
Newcastle 8
North Sydney 87
Orange 10
Palerang 8
Parramatta 13
Penrith 7
Pittwater 3
Port Macquarie-Hastings 1
Port Stephens 2
Queanbeyan 7
Randwick 9
Richmond Valley 7
Rockdale 7
Ryde 11
Shoalhaven 32
Singleton 5
Snowy River 3
Strathfield 5
Sutherland 4
Sydney 1709
Temora 7
Tenterfield 2
The Hills 1
Tumbarumba 19
Tumut 1
Tweed 8
Upper Hunter 2
Upper Lachlan 10
Uralla 1
Wagga Wagga 3
Warringah 3
Waverley 22
Wellington 2
Wentworth 6
Willoughby 16
Wingecarribee 8
Wollondilly 2
Woollahra 5
Wyong 5
Yass 1
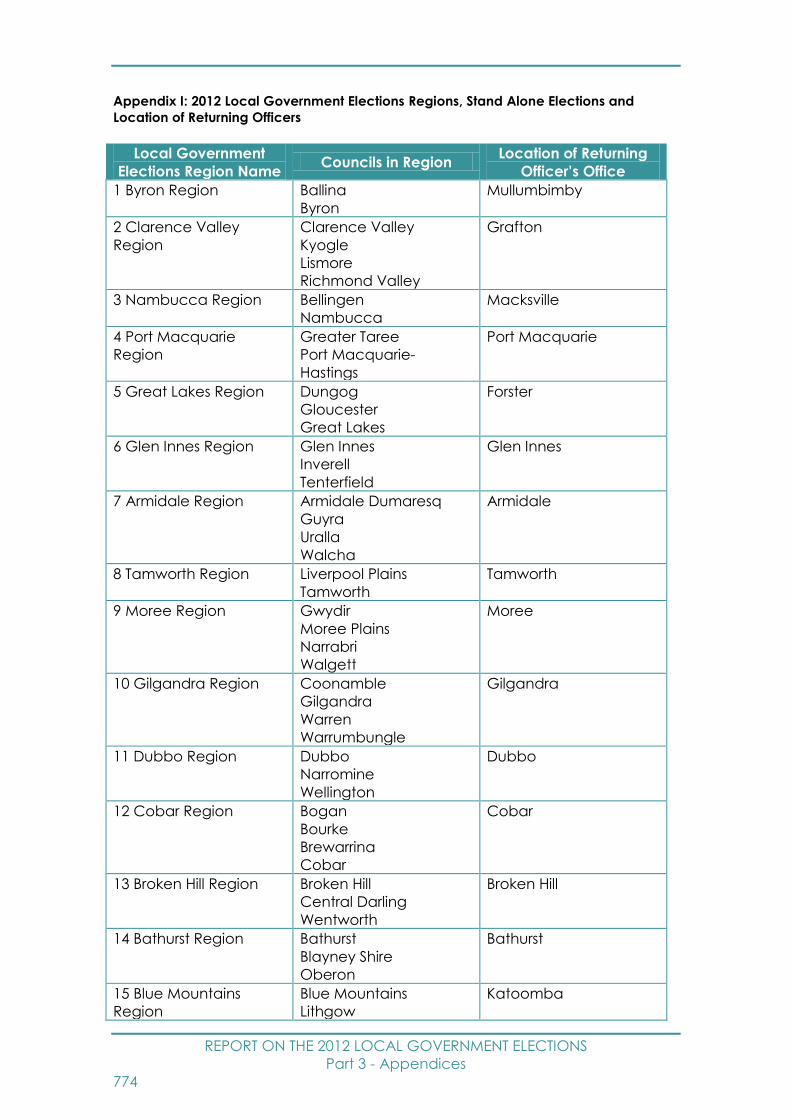
REPORT ON THE 2012 LOCAL GOVERNMENT ELECTIONS
Part 3 - Appendices
774
Appendix I: 2012 Local Government Elections Regions, Stand Alone Elections and
Location of Returning Officers
Local Government
Elections Region Name Councils in Region
Location of Returning
Officer’s Office
1 Byron Region Ballina
Byron
Mullumbimby
2 Clarence Valley
Region
Clarence Valley
Kyogle
Lismore
Richmond Valley
Grafton
3 Nambucca Region Bellingen
Nambucca
Macksville
4 Port Macquarie
Region
Greater Taree
Port Macquarie-
Hastings
Port Macquarie
5 Great Lakes Region Dungog
Gloucester
Great Lakes
Forster
6 Glen Innes Region Glen Innes
Inverell
Tenterfield
Glen Innes
7 Armidale Region Armidale Dumaresq
Guyra
Uralla
Walcha
Armidale
8 Tamworth Region Liverpool Plains
Tamworth
Tamworth
9 Moree Region Gwydir
Moree Plains
Narrabri
Walgett
Moree
10 Gilgandra Region Coonamble
Gilgandra
Warren
Warrumbungle
Gilgandra
11 Dubbo Region Dubbo
Narromine
Wellington
Dubbo
12 Cobar Region Bogan
Bourke
Brewarrina
Cobar
Cobar
13 Broken Hill Region Broken Hill
Central Darling
Wentworth
Broken Hill
14 Bathurst Region Bathurst
Blayney Shire
Oberon
Bathurst
15 Blue Mountains
Region
Blue Mountains
Lithgow
Katoomba

REPORT ON THE 2012 LOCAL GOVERNMENT ELECTIONS
Part 3 - Appendices
775
Region Name Councils in Region Location of Returning
Officer’s Office
16 Orange Region Cabonne
Orange
Orange
17 Forbes Region Bland
Forbes
Lachlan
Parkes
Forbes
18 Young Region Boorowa
Cowra
Weddin
Young
Young
19 Cootamundra
Region
Coolamon
Cootamundra
Harden
Junee
Temora
Cootamundra
20 Wagga Wagga
Region
Gundagai
Lockhart
Tumut
Urana
Wagga Wagga
Wagga Wagga
21 Singleton Region Muswellbrook
Singleton
Upper Hunter
Singleton
22 Camden Region Camden
Wollondilly
Camden
23 Goulburn Region Goulburn Mulwaree
Upper Lachlan
Yass
Goulburn
24 Queanbeyan Region Palerang
Queanbeyan
Queanbeyan
25 Cooma Region Bombala
Cooma-Monaro
Snowy River
Cooma
26 Bega Region Bega Valley
Eurobodalla
Bega
27 Albury Region Albury
Corowa
Greater Hume
Tumbarumba
Albury
Stand Alone Councils Location of Returning Officer’s Office
35 Auburn Auburn
36 Bankstown Bankstown
37 Blacktown Seven Hills
38 Campbelltown Campbelltown
39 Canterbury Canterbury

REPORT ON THE 2012 LOCAL GOVERNMENT ELECTIONS
Part 3 - Appendices
776
Stand Alone Councils Location of Returning Officer’s Office
40 Gosford Gosford
41 Hawkesbury Windsor
42 The Hills Castle Hill
43 Holroyd Merrylands
44 Hornsby Hornsby
45 Hurstville Hurstville
46 Kiama Kiama
47 Kogarah Kogarah
48 Ku-ring-gai Gordon
49 Liverpool Liverpool
50 Mid-Western Mudgee
51 North Sydney North Sydney
52 Parramatta Parramatta
53 Pittwater Newport
54 Randwick Randwick
55 Rockdale Brighton-Le-Sands
56 Ryde Ryde
57 Sydney Sydney CBD
58 Tweed Tweed Heads
59 Warringah Brookvale
60 Waverley Bondi Junction
61 Willoughby Chatswood
62 Wingecarribee Moss Vale
63 Woollahra Double Bay
64 Wyong Wyong

REPORT ON THE 2012 LOCAL GOVERNMENT ELECTIONS
Part 3 - Appendices
777
Appendix J: 2012 Local Government Elections Political Parties Registered and
Participating
State Registered Parties
Party Name Abbreviated Party
Name
Australian Democrats (NSW Division) Australian Democrats
Australian Labor Party (NSW Branch) Labor
Building Australia Party Building Australia
Christian Democratic Party (Fred Nile Group) Christian Democractic
Party
Country Labor Party Country Labor
Family First NSW Inc Family First
Liberal Party of Australia (New South Wales
Division)
Liberal
National Party of Australia-NSW Nationals
No Parking Meters Party
Outdoor Recreation Party ORP
Save Our State SOS
Shooters and Fishers Party Shooters and Fishers
Socialist Alliance
The Fishing Party
The Greens
Unity Party
Local Government Registered Parties
Party Name Abbreviated Party
Name
Albury Citizens And Ratepayers Movement
Australia First Party (NSW) Incorporated
(Councils)
Australia First Party
Australian Protectionist Party
Australian Sex Party NSW Sex Party
Bob Thompson's Independent Team
Burwood Community Voice BCV
Clover Moore Independent Team Clover Moore
Independents
Community Service "Environment" Save
Campbelltown Koalas
Community First Team Community First
Democratic Labor Party DLP
Eurobodalla First
Eurobodalla Ratepayers Action ERA
Holroyd Independents
Keep Coogee a Village
Kogarah Residents' Association
Liberal Democratic Party Liberal Democrats
Liverpool Community Independents Team
Lorraine Wearne Independents

REPORT ON THE 2012 LOCAL GOVERNMENT ELECTIONS
Part 3 - Appendices
778
Party Name Abbreviated Party
Name
Manly Independents - Putting Residents First Manly Independents
Our Sustainable Future OSF
Parramatta Better Local Government Party
Residents Action Group For Auburn Area RAGAA
Residents First Woollahra Residents First
Residents For Mosman RFM
Save Tuggerah Lakes STL
Serving Mosman
Shire Watch Independents SWI
Shire Wide Action Group SWAG
Shoalhaven Independents Group Shoal Independents
The Living Sydney Team Living Sydney
The Parramatta Independents
Totally Locally Committed Party TLC
Woodville Independents WIP
Your Warringah Your Warringah
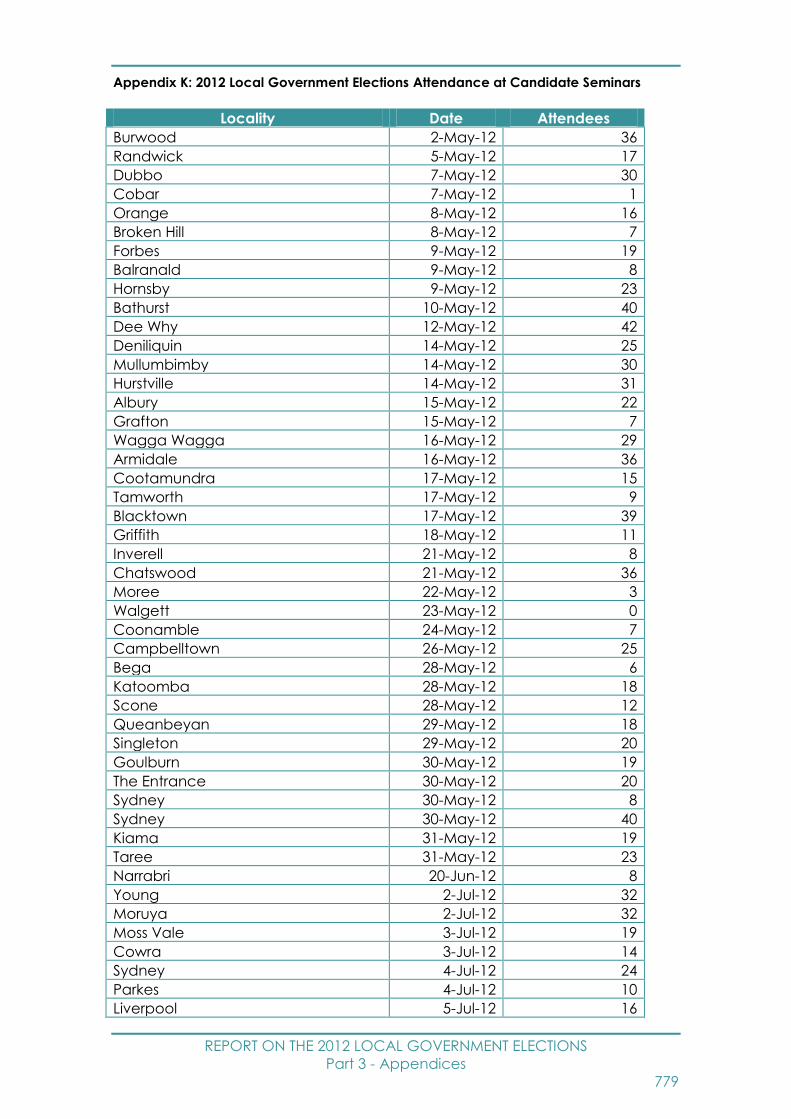
REPORT ON THE 2012 LOCAL GOVERNMENT ELECTIONS
Part 3 - Appendices
779
Appendix K: 2012 Local Government Elections Attendance at Candidate Seminars
Locality Date Attendees
Burwood 2-May-12 36
Randwick 5-May-12 17
Dubbo 7-May-12 30
Cobar 7-May-12 1
Orange 8-May-12 16
Broken Hill 8-May-12 7
Forbes 9-May-12 19
Balranald 9-May-12 8
Hornsby 9-May-12 23
Bathurst 10-May-12 40
Dee Why 12-May-12 42
Deniliquin 14-May-12 25
Mullumbimby 14-May-12 30
Hurstville 14-May-12 31
Albury 15-May-12 22
Grafton 15-May-12 7
Wagga Wagga 16-May-12 29
Armidale 16-May-12 36
Cootamundra 17-May-12 15
Tamworth 17-May-12 9
Blacktown 17-May-12 39
Griffith 18-May-12 11
Inverell 21-May-12 8
Chatswood 21-May-12 36
Moree 22-May-12 3
Walgett 23-May-12 0
Coonamble 24-May-12 7
Campbelltown 26-May-12 25
Bega 28-May-12 6
Katoomba 28-May-12 18
Scone 28-May-12 12
Queanbeyan 29-May-12 18
Singleton 29-May-12 20
Goulburn 30-May-12 19
The Entrance 30-May-12 20
Sydney 30-May-12 8
Sydney 30-May-12 40
Kiama 31-May-12 19
Taree 31-May-12 23
Narrabri 20-Jun-12 8
Young 2-Jul-12 32
Moruya 2-Jul-12 32
Moss Vale 3-Jul-12 19
Cowra 3-Jul-12 14
Sydney 4-Jul-12 24
Parkes 4-Jul-12 10
Liverpool 5-Jul-12 16
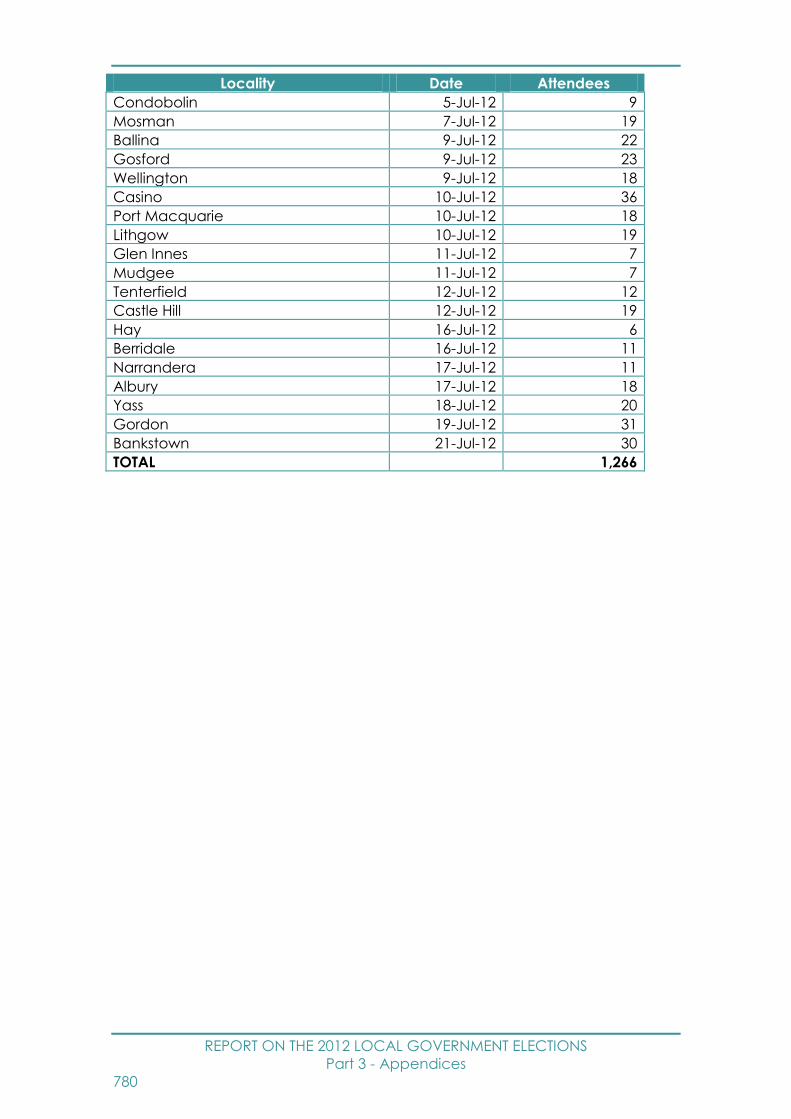
REPORT ON THE 2012 LOCAL GOVERNMENT ELECTIONS
Part 3 - Appendices
780
Locality Date Attendees
Condobolin 5-Jul-12 9
Mosman 7-Jul-12 19
Ballina 9-Jul-12 22
Gosford 9-Jul-12 23
Wellington 9-Jul-12 18
Casino 10-Jul-12 36
Port Macquarie 10-Jul-12 18
Lithgow 10-Jul-12 19
Glen Innes 11-Jul-12 7
Mudgee 11-Jul-12 7
Tenterfield 12-Jul-12 12
Castle Hill 12-Jul-12 19
Hay 16-Jul-12 6
Berridale 16-Jul-12 11
Narrandera 17-Jul-12 11
Albury 17-Jul-12 18
Yass 18-Jul-12 20
Gordon 19-Jul-12 31
Bankstown 21-Jul-12 30
TOTAL 1,266
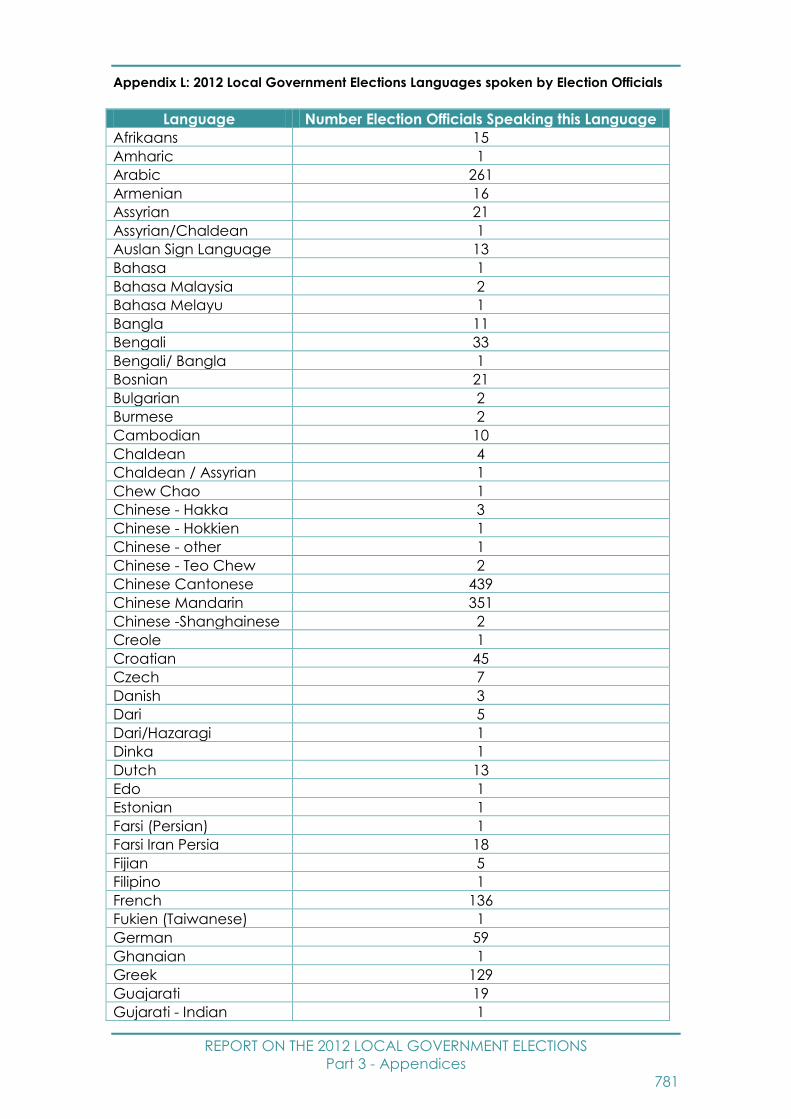
REPORT ON THE 2012 LOCAL GOVERNMENT ELECTIONS
Part 3 - Appendices
781
Appendix L: 2012 Local Government Elections Languages spoken by Election Officials
Language Number Election Officials Speaking this Language
Afrikaans 15
Amharic 1
Arabic 261
Armenian 16
Assyrian 21
Assyrian/Chaldean 1
Auslan Sign Language 13
Bahasa 1
Bahasa Malaysia 2
Bahasa Melayu 1
Bangla 11
Bengali 33
Bengali/ Bangla 1
Bosnian 21
Bulgarian 2
Burmese 2
Cambodian 10
Chaldean 4
Chaldean / Assyrian 1
Chew Chao 1
Chinese - Hakka 3
Chinese - Hokkien 1
Chinese - other 1
Chinese - Teo Chew 2
Chinese Cantonese 439
Chinese Mandarin 351
Chinese -Shanghainese 2
Creole 1
Croatian 45
Czech 7
Danish 3
Dari 5
Dari/Hazaragi 1
Dinka 1
Dutch 13
Edo 1
Estonian 1
Farsi (Persian) 1
Farsi Iran Persia 18
Fijian 5
Filipino 1
French 136
Fukien (Taiwanese) 1
German 59
Ghanaian 1
Greek 129
Guajarati 19
Gujarati - Indian 1
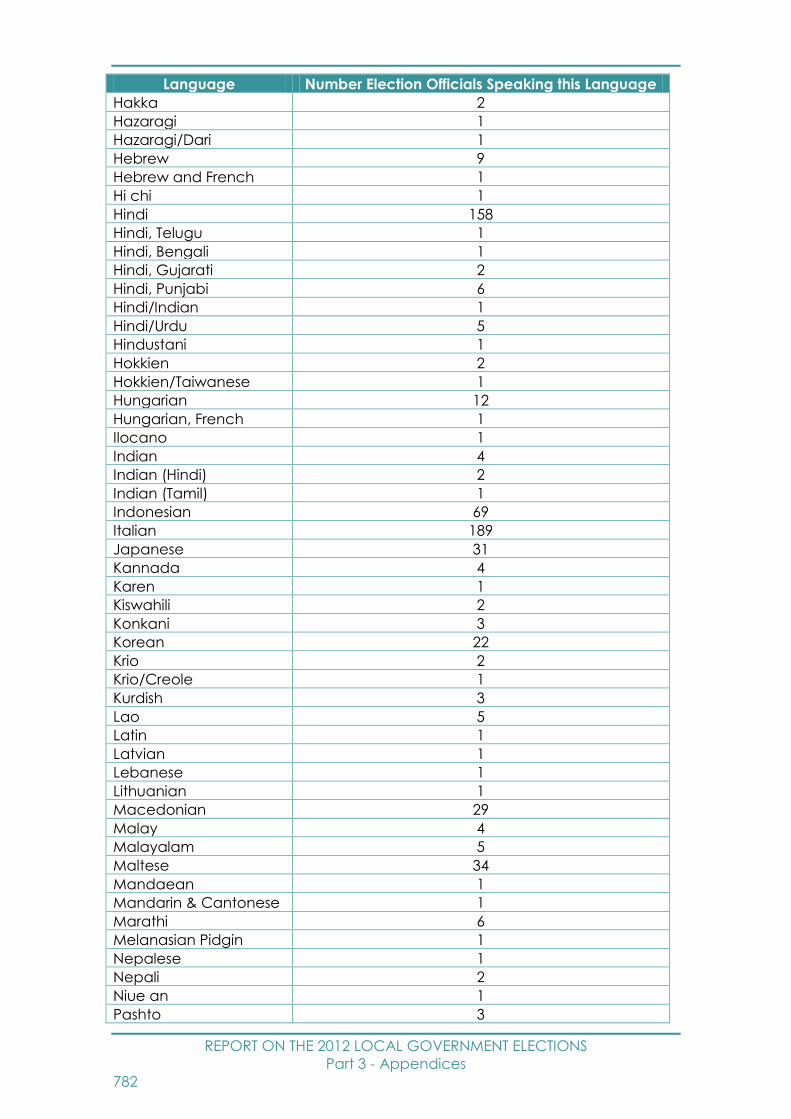
REPORT ON THE 2012 LOCAL GOVERNMENT ELECTIONS
Part 3 - Appendices
782
Language Number Election Officials Speaking this Language
Hakka 2
Hazaragi 1
Hazaragi/Dari 1
Hebrew 9
Hebrew and French 1
Hi chi 1
Hindi 158
Hindi, Telugu 1
Hindi, Bengali 1
Hindi, Gujarati 2
Hindi, Punjabi 6
Hindi/Indian 1
Hindi/Urdu 5
Hindustani 1
Hokkien 2
Hokkien/Taiwanese 1
Hungarian 12
Hungarian, French 1
Ilocano 1
Indian 4
Indian (Hindi) 2
Indian (Tamil) 1
Indonesian 69
Italian 189
Japanese 31
Kannada 4
Karen 1
Kiswahili 2
Konkani 3
Korean 22
Krio 2
Krio/Creole 1
Kurdish 3
Lao 5
Latin 1
Latvian 1
Lebanese 1
Lithuanian 1
Macedonian 29
Malay 4
Malayalam 5
Maltese 34
Mandaean 1
Mandarin & Cantonese 1
Marathi 6
Melanasian Pidgin 1
Nepalese 1
Nepali 2
Niue an 1
Pashto 3
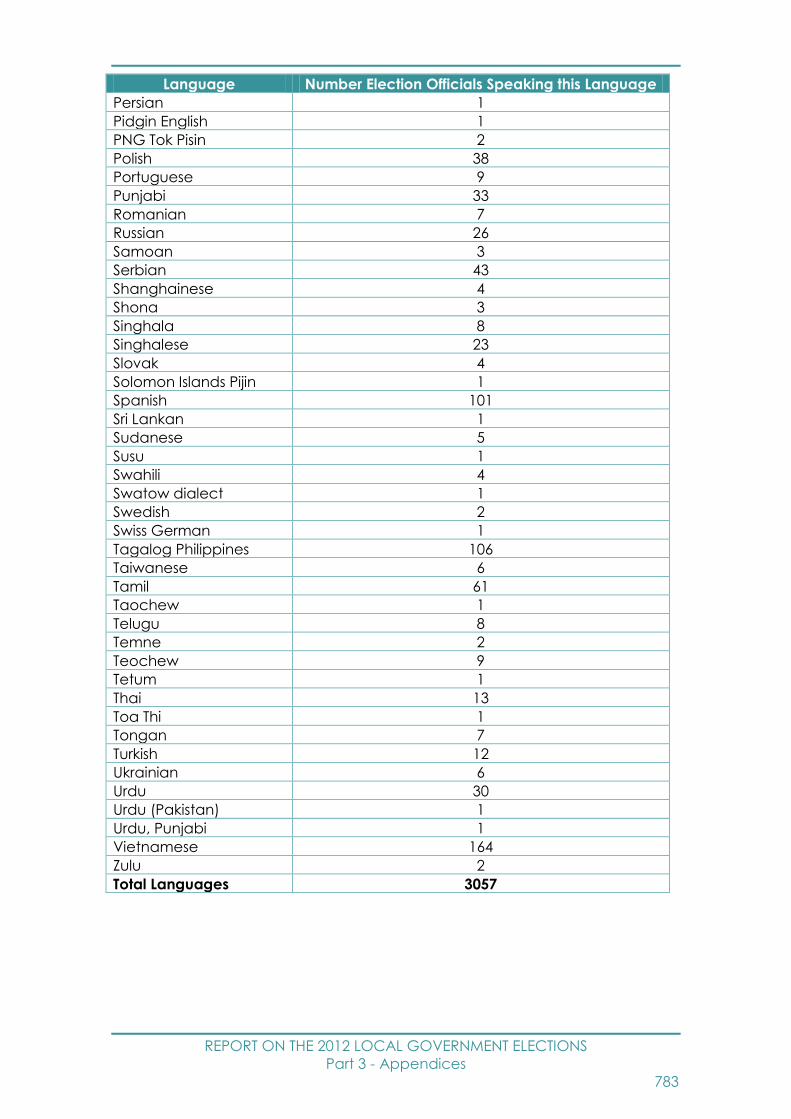
REPORT ON THE 2012 LOCAL GOVERNMENT ELECTIONS
Part 3 - Appendices
783
Language Number Election Officials Speaking this Language
Persian 1
Pidgin English 1
PNG Tok Pisin 2
Polish 38
Portuguese 9
Punjabi 33
Romanian 7
Russian 26
Samoan 3
Serbian 43
Shanghainese 4
Shona 3
Singhala 8
Singhalese 23
Slovak 4
Solomon Islands Pijin 1
Spanish 101
Sri Lankan 1
Sudanese 5
Susu 1
Swahili 4
Swatow dialect 1
Swedish 2
Swiss German 1
Tagalog Philippines 106
Taiwanese 6
Tamil 61
Taochew 1
Telugu 8
Temne 2
Teochew 9
Tetum 1
Thai 13
Toa Thi 1
Tongan 7
Turkish 12
Ukrainian 6
Urdu 30
Urdu (Pakistan) 1
Urdu, Punjabi 1
Vietnamese 164
Zulu 2
Total Languages 3057
REPORT ON THE 2012 LOCAL GOVERNMENT ELECTIONS
Part 3 - Appendices
784
This page intentionally left blank
REPORT ON THE 2012 LOCAL GOVERNMENT ELECTIONS
Part 3 – Elector Surveys
785
Appendix M: 2012 Local Government Elections Electors Satisfaction Study
2
1. EXECUTIVE SUMMARY ........................................................................................ 2
2. BACKGROUND AND RESEARCH OBJECTIVES ..................................................... 10
2.1 BACKGROUND ............................................................................................................................. 10 2.2 RESEARCH OBJECTIVES .................................................................................................... 13
3. METHODOLOGY ................................................................................................. 14
4. RESULTS ON SERVICE CHARTER STANDARDS ................................................... 18
4.1 PERFORMANCE AGAINST SERVICE TARGETS ................................................. 18
5. MAIN FINDINGS ............................................................................................... 20
5.1 VOTING BEHAVIOUR ............................................................................................................ 20 5.2 ENROLMENT ................................................................................................................................. 26 5.3 TIMING/DELAYS ...................................................................................................................... 27 5.4 OVERALL SATISACTION WITH VOTING PROCESS ..................................... 28 5.5 SATISFACTION WITH PRE-POLL ............................................................................... 32 5.6 SATISFACTION WITH POLLING PLACE VOTING .......................................... 34 5.7 DRIVERS OF OVERALL SATISFACTION ................................................................ 38 5.8 SATISFACTION WITH ELECTION OFFICIALS ................................................. 39 5.8 SATISFACTION WITH POSTAL VOTING .............................................................. 44 5.9 SATISFACTION WITH ELECTORAL SERVICES ................................................ 46
6. NSWEC INFORMATION SOURCES AND INITIATIVES ......................................... 54
7. KEY VOTER GROUPS ......................................................................................... 63
APPENDIX A: THE QUESTIONNAIRE ..................................................................... 66
APPENDIX B: SAMPLE PROFILE ............................................................................ 84
APPENDIX C: DEFINITION OF ROCS ..................................................................... 86
TABLE OF CONTENTS

2
Background and objectives
instinct and reason was appointed by the New South Wales Electoral Commission (NSWEC)
to conduct research looking at elector satisfaction with the administration of the 2012 Local
Government Elections, held on Saturday 8 September 2012.
The New South Wales Electoral Commission (NSWEC) is responsible for the conduct of
elections for the State of NSW, local government and the NSW Aboriginal Land Council.
It is committed not just to ensuring that elections are conducted in accordance with the law,
but also to the delivery of high quality election services. This includes ensuring that
elections meet required service standards in the provision of information services, pre-poll
and polling day services, and voter assistance services.
The NSWEC issued a ‘NSW Local Government Elections 2012 Service Commitment Charter’
containing targets and indicators for measuring its effectiveness in providing election
services. These standards were based on the results of the elector feedback surveys carried
out in 2008 (NSW Local Government Elections) and 2011 (NSW State Election).
The main goal of this latest research was to provide the NSWEC with information on
electors’ perceptions of and satisfaction with the NSWEC’s election services, with a view to
assist the NSWEC in evaluating its performance against its service standards, to identify
areas for service improvement, and to help the NSWEC to establish service benchmarks for
future elections.
To meet these overall objectives, instinct and reason conducted a survey of electors to
measure satisfaction with:
Voting services (pre-poll and polling day services)
Quality of assistance provided by NSW election officials
Services to electors (telephone enquiry service and website)
Services to key voter groups (including voters of CALD backgrounds, Indigenous
voters, and visually impaired voters)
In addition, the survey looked at the appeal of various service development initiatives and
potential information sources for future elections.
1. EXECUTIVE SUMMARY
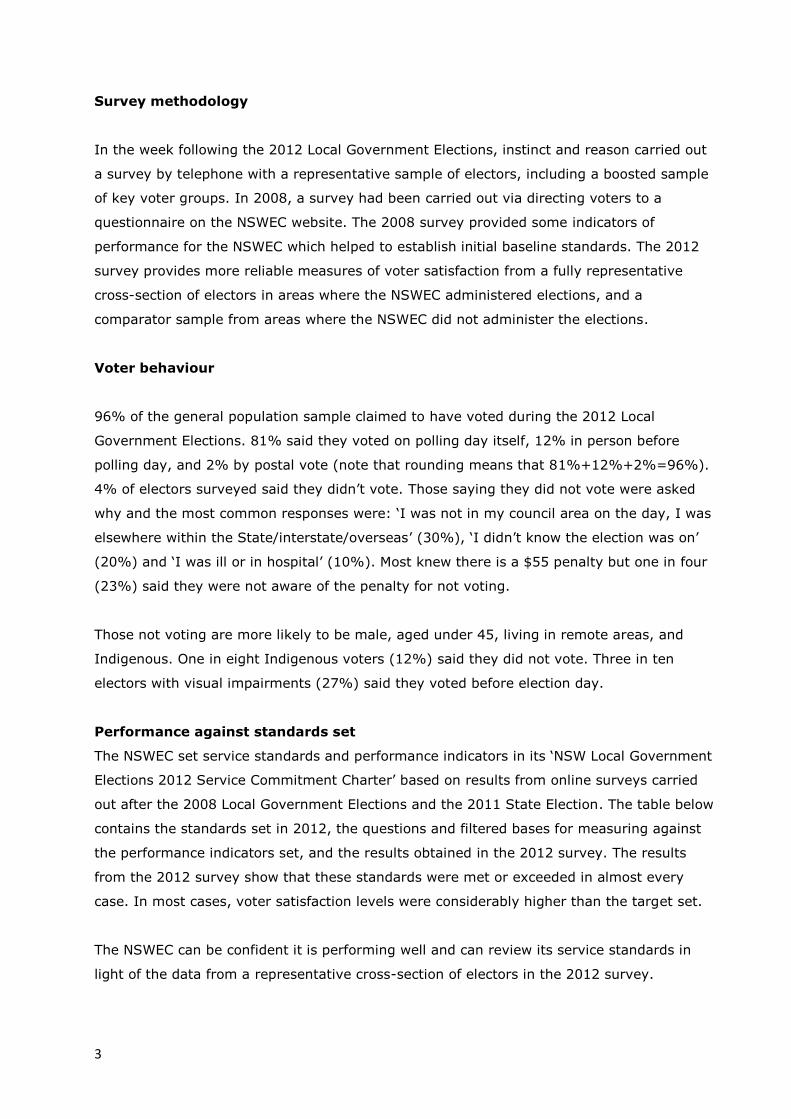
3
Survey methodology
In the week following the 2012 Local Government Elections, instinct and reason carried out
a survey by telephone with a representative sample of electors, including a boosted sample
of key voter groups. In 2008, a survey had been carried out via directing voters to a
questionnaire on the NSWEC website. The 2008 survey provided some indicators of
performance for the NSWEC which helped to establish initial baseline standards. The 2012
survey provides more reliable measures of voter satisfaction from a fully representative
cross-section of electors in areas where the NSWEC administered elections, and a
comparator sample from areas where the NSWEC did not administer the elections.
Voter behaviour
96% of the general population sample claimed to have voted during the 2012 Local
Government Elections. 81% said they voted on polling day itself, 12% in person before
polling day, and 2% by postal vote (note that rounding means that 81%+12%+2%=96%).
4% of electors surveyed said they didn’t vote. Those saying they did not vote were asked
why and the most common responses were: ‘I was not in my council area on the day, I was
elsewhere within the State/interstate/overseas’ (30%), ‘I didn’t know the election was on’
(20%) and ‘I was ill or in hospital’ (10%). Most knew there is a $55 penalty but one in four
(23%) said they were not aware of the penalty for not voting.
Those not voting are more likely to be male, aged under 45, living in remote areas, and
Indigenous. One in eight Indigenous voters (12%) said they did not vote. Three in ten
electors with visual impairments (27%) said they voted before election day.
Performance against standards set
The NSWEC set service standards and performance indicators in its ‘NSW Local Government
Elections 2012 Service Commitment Charter’ based on results from online surveys carried
out after the 2008 Local Government Elections and the 2011 State Election. The table below
contains the standards set in 2012, the questions and filtered bases for measuring against
the performance indicators set, and the results obtained in the 2012 survey. The results
from the 2012 survey show that these standards were met or exceeded in almost every
case. In most cases, voter satisfaction levels were considerably higher than the target set.
The NSWEC can be confident it is performing well and can review its service standards in
light of the data from a representative cross-section of electors in the 2012 survey.
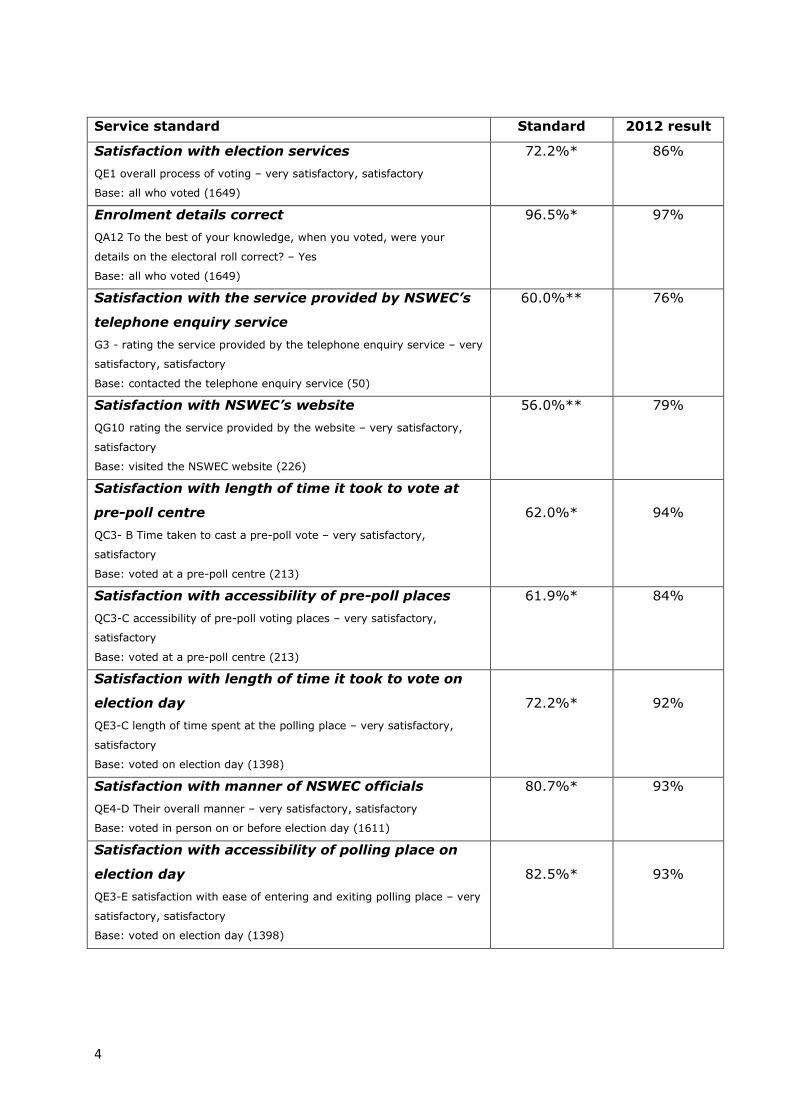
4
Service standard Standard 2012 result
Satisfaction with election services
QE1 overall process of voting – very satisfactory, satisfactory
Base: all who voted (1649)
72.2%* 86%
Enrolment details correct
QA12 To the best of your knowledge, when you voted, were your
details on the electoral roll correct? – Yes
Base: all who voted (1649)
96.5%* 97%
Satisfaction with the service provided by NSWEC’s
telephone enquiry service
G3 - rating the service provided by the telephone enquiry service – very
satisfactory, satisfactory
Base: contacted the telephone enquiry service (50)
60.0%** 76%
Satisfaction with NSWEC’s website
QG10 rating the service provided by the website – very satisfactory,
satisfactory
Base: visited the NSWEC website (226)
56.0%** 79%
Satisfaction with length of time it took to vote at
pre-poll centre
QC3- B Time taken to cast a pre-poll vote – very satisfactory,
satisfactory
Base: voted at a pre-poll centre (213)
62.0%*
94%
Satisfaction with accessibility of pre-poll places
QC3-C accessibility of pre-poll voting places – very satisfactory,
satisfactory
Base: voted at a pre-poll centre (213)
61.9%* 84%
Satisfaction with length of time it took to vote on
election day
QE3-C length of time spent at the polling place – very satisfactory,
satisfactory
Base: voted on election day (1398)
72.2%*
92%
Satisfaction with manner of NSWEC officials
QE4-D Their overall manner – very satisfactory, satisfactory
Base: voted in person on or before election day (1611)
80.7%* 93%
Satisfaction with accessibility of polling place on
election day
QE3-E satisfaction with ease of entering and exiting polling place – very
satisfactory, satisfactory
Base: voted on election day (1398)
82.5%*
93%
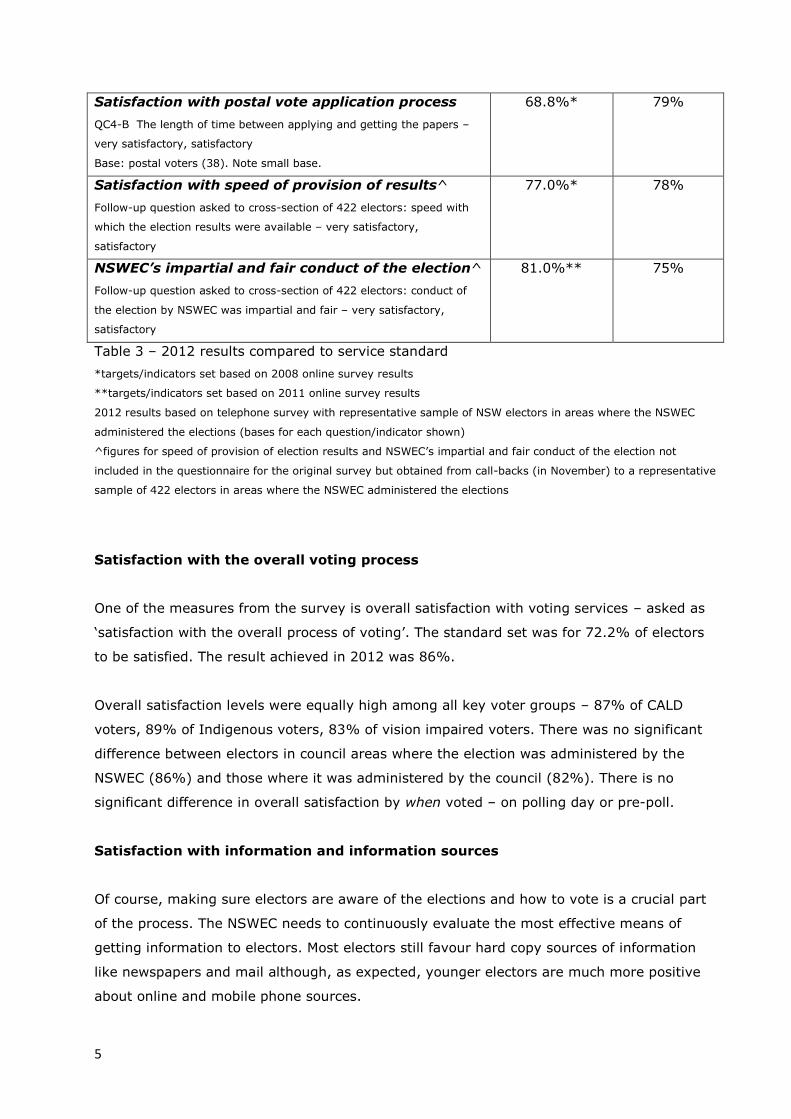
5
Satisfaction with postal vote application process
QC4-B The length of time between applying and getting the papers –
very satisfactory, satisfactory
Base: postal voters (38). Note small base.
68.8%* 79%
Satisfaction with speed of provision of results^
Follow-up question asked to cross-section of 422 electors: speed with
which the election results were available – very satisfactory,
satisfactory
77.0%* 78%
NSWEC’s impartial and fair conduct of the election^
Follow-up question asked to cross-section of 422 electors: conduct of
the election by NSWEC was impartial and fair – very satisfactory,
satisfactory
81.0%** 75%
Table 3 – 2012 results compared to service standard
*targets/indicators set based on 2008 online survey results
**targets/indicators set based on 2011 online survey results
2012 results based on telephone survey with representative sample of NSW electors in areas where the NSWEC
administered the elections (bases for each question/indicator shown)
^figures for speed of provision of election results and NSWEC’s impartial and fair conduct of the election not
included in the questionnaire for the original survey but obtained from call-backs (in November) to a representative
sample of 422 electors in areas where the NSWEC administered the elections
Satisfaction with the overall voting process
One of the measures from the survey is overall satisfaction with voting services – asked as
‘satisfaction with the overall process of voting’. The standard set was for 72.2% of electors
to be satisfied. The result achieved in 2012 was 86%.
Overall satisfaction levels were equally high among all key voter groups – 87% of CALD
voters, 89% of Indigenous voters, 83% of vision impaired voters. There was no significant
difference between electors in council areas where the election was administered by the
NSWEC (86%) and those where it was administered by the council (82%). There is no
significant difference in overall satisfaction by when voted – on polling day or pre-poll.
Satisfaction with information and information sources
Of course, making sure electors are aware of the elections and how to vote is a crucial part
of the process. The NSWEC needs to continuously evaluate the most effective means of
getting information to electors. Most electors still favour hard copy sources of information
like newspapers and mail although, as expected, younger electors are much more positive
about online and mobile phone sources.
6
One in eight electors (13%) said they referred to the NSWEC website at some point before
or during the elections. These electors were particularly likely to be younger voters, and
also more likely to vote in person at a pre-poll centre. Four in five (79%) were satisfied with
the website which is much higher than the standard set of 56%.
A relatively small number of electors said they contacted the telephone enquiry service, just
3% (50 electors in our survey sample). However, the value of this service is demonstrated
by the survey data as this 3% are more likely than the norm to be new voters or just turned
18, to not have their electoral roll details correct, and to be voting before election day.
Three in four callers (76%) were satisfied with the service, which again is much higher than
the standard set of 60%. One in four callers (26%) said they got straight through and a
further half (46%) got through within 5 minutes. Satisfaction levels are very high for staff
being courteous and polite, professional, informative; for their overall manner; and for
resolving the issue or answering the question. Telephone operators score higher than staff
at polling places for being informative and resolving issues.
There are lower levels of satisfaction with regard to information about pre-poll voting (54%
positive and 23% negative among those voting pre-poll in person); information available to
locate the polling place (67% positive, 12% negative among those voting on election day),
and information about postal voting (55% of postal voters positive and 16% negative).
Information provision is therefore a potential area for improvement, although it should be
noted that it did not feature in the Charter standards for the 2012 elections.
Satisfaction with pre-poll services
There are high levels of satisfaction with the location of pre-poll voting centres (82% rating
satisfactory or very satisfactory), accessibility to pre-poll voting centres (84%), time taken
to cast a pre-poll vote (94%), and the helpfulness of election officials (88%).
Time taken to cast a vote pre-poll was another key service standard with a target for 2012
set at 62% so this was well exceeded with the 94% result.
Although it was not one of the service targets in the Charter, 54% were satisfied with the
information provided about pre-poll voting among those who voted in person and 23% were
critical of performance; 19% neutral and 4% not sure.
7
Satisfaction with polling place voting
There are very high levels of satisfaction with the convenience of the polling place (92%
rating satisfactory or very satisfactory), ease of entering and exiting the polling place
(92%), simplicity of the polling place layout (94%), ease of the voting process (91%),
clarity and simplicity of ballot paper instructions (83%) and length of time spent at the
polling place (91%). Electors want the process to be quick and easy, and this appears to be
the case with three in four giving ratings of very satisfactory on all four dimensions.
A standard was set for satisfaction with ‘accessibility of polling place’ of 82.5% and the
survey shows that satisfaction with ‘ease of entering and exiting the polling place’ was 92%
amongst those who voted on or before the day, and 93% amongst those who voted on
election day.
Length of time spent at the polling place was another key standard with a target set for
2012 of 72.2%. This was comfortably exceeded with the result of 91% amongst those who
voted on the day or before the day and 92% amongst those who voted on election day.
Those who voted on election day are generally more positive about their experience with
the polling place. The exception is ‘assistance provided by election officials’ but this is
probably because those voting on election day were less likely to have queries or need
assistance so fewer make a comment, ie more neutral or ‘not sure’ responses.
Satisfaction with election officials
Four in five electors (79%) were satisfied with ‘assistance provided by election officials’ at
polling places, with only 3% critical of staff. One in eight (13%) were ‘not sure’, in part
because they had minimal interaction with staff.
Another question was asked about satisfaction with election officials overall, and these
results are positive – nine in ten satisfied, including those who voted on election day (89%)
and those who voted before election day (88%). NSWEC council voters were more likely to
be satisfied with the overall experience of election officials than non-NSWEC council voters
(89% versus 84%).
On this particular question, CALD voters were less positive – 58% giving a top rating of very
satisfactory, compared with 67% of the total sample – although still generally satisfied.
8
Electors who voted on or before election day were asked to rate the ‘manner’ of election
officials. A standard for this service dimension was set by the NSWEC for 2012, at 80.7%
satisfied. The result in the 2012 survey was 93% satisfied. In the 2008 survey, just 45%
gave a rating of very satisfactory for the manner of election officials. In the 2012 survey,
this figure is 74%. This difference is in part due to the different methodology used of course
but it suggests that there has probably been an improvement in performance since 2008.
As well as ‘overall manner’ being highly rated, nine in ten voters were satisfied with staff
being ‘courteous and polite’ (92%) and ‘professional’ (89%). Whilst still high, satisfaction
ratings are relatively low for ‘being informative’ (70%) and ‘answering your question or
resolving your issue’ (60%).
Satisfaction with postal voting
The survey only had 38 respondents who had voted by post so the results need to be
treated with caution. The proportion of postal voters satisfied with information about postal
voting is relatively low, although still a majority satisfied (55% satisfied, 16% negative,
24% neutral, 8% not sure). Results are more positive for ‘the length of time between
applying and getting papers’ (79% satisfied) and ‘instructions on how to complete the ballot
papers and declaration envelope’ (87%).
Alternative methods of voting
Almost half the electors surveyed (45%) said they would find online voting most appealing,
including a majority (57%) of electors aged under 35 and many of those aged 35 or over
(40%). One in eight younger electors (13% of those aged under 35) find voting via their
mobile devices most appealing. Whilst only 3% of all electors find voting over the telephone
most appealing, this is 10% among those who say they did not vote this time.
Particularly likely to want to vote in person are Indigenous electors (56% find this most
appealing and only 29% for online) and vision impaired electors (61% and 25%
respectively). Some vision impaired voters also find postal voting appealing (18%).
Those who do not want to vote online raise concerns around privacy (40% said this), not
being computer literate or having access to a computer/internet connection (40%),
potential for manipulation (25%), and potential for hacking (24%).
9
Of course, there is generational change taking place and the NSWEC needs to keep moving
at the pace of new established means of communication, both for informing electors and for
voting.
Conclusions and recommendations
The results from the 2012 survey demonstrate that when a fully representative sample of
electors is surveyed, the NSWEC is clearly performing to very high standards of service
delivery and – in most cases – much higher than the standards set prior to the 2012 Local
Government Elections.
On the key service standards, around 80-90% of electors are positive about the
performance of the NSWEC in administering the elections.
With these 2012 results now available, the NSWEC needs to review its service standards
and set appropriate targets for future elections, agreeing where to try and maintain these
high standards and where to aim even higher.
The main area where there is room for improvement is in information provision and
communication. Lower ratings were obtained on several aspects of information provision,
including CALD electors being less positively disposed to election officials. Also the main
reasons given for not voting are ‘not in council area due to travelling’ and ‘didn’t know there
was an election’. The NSWEC needs to continuously improve its use of all available media
and communications channels to inform electors about when to vote, where to vote, and
how to vote. Whenever a new channel is established, including social media, it should be
embraced by the NSWEC as well as improving existing channels. Technological
developments will provide new opportunities but it also needs a human touch, especially for
the key voter groups.
Methods of voting should also change with the times, including the availability of secure
online voting (which almost half of electors now favour), voting via mobile devices (growing
demand from younger voters), and perhaps automated telephone voting.
10
2.1 BACKGROUND
The key responsibilities of the NSW Electoral Commission (NSWEC) are to:
1. conduct elections and by-elections for the Parliament of New South Wales;
2. conduct elections for local government councils;
3. conduct elections for registered clubs, statutory boards and State registered
industrial organisations;
4. prepare the New South Wales electoral roll in conjunction with the Australian
Electoral Commission;
5. provide administrative support to the Election Funding Authority;
6. provide advice to the Premier on issues affecting the conduct of parliamentary
elections, including:
administrative issues requiring legislative remedy;
public understanding and awareness of elections and electoral matters;
and
reporting to the NSW Parliament on the NSWEC’s activities.
Local government elections are held every four years. The latest local government elections
were held on Saturday 8 September 2012. Councils had the option of administering their
own election or using the NSWEC to conduct the election. Previously, all councils were
required to use the NSWEC. 150 of the 152 NSW councils participated in the 2012 Elections.
136 councils chose to use the NSWEC and 14 councils provided their own electoral services.
This report compares voter perceptions of the performance of the NSWEC and council
provided services where appropriate.
2. BACKGROUND AND RESEARCH OBJECTIVES
11
The purpose of the NSWEC is to provide information services and voter assistance services.
Information services include:
Advertising
Telephone enquiry service
Website
Information to the news media
Material for certain communities such as culturally or linguistically diverse electors
Voting services
Voting before election day (pre-poll)
Voters can vote either in person, by post or by Braille if they meet certain criteria.
Early voters are able to vote at pre-poll centres in the two weeks leading up to
election day. Recent elections have seen a growth in the use of pre-poll or early
voting.
Postal voters can obtain a postal vote application from NSWEC, and then have ballot
papers sent to them for completion and return.
Voting on election day (poll day)
There are two types of election day voters:
voters who vote in their electorate on election day. Ordinary voting on election day is
the most common form of voting;
voters who cannot be found on the roll when they come to vote. For the first time
unenrolled electors were able to enrol and vote on polling day itself (with the
appropriate proof of identity).
Services to key voter groups
Assistance in polling places
The NSWEC makes every effort to ensure that as many voting centres as possible have
wheelchair access, and that these are clearly publicised to voters. Voting centres are
equipped with maxi-pencils (for voters who have difficulty grasping ordinary pencils) and
magnifying sheets.

12
Voters from culturally and linguistically diverse (CALD) backgrounds
The NSWEC makes every effort to ensure that people from CALD backgrounds have the
information they require to be able to vote. It offers telephone and online translation
services as well as voting instructions in a wide number of languages.
2012 Initiatives
In 2012, the elections included a number of important new initiatives including:
a ‘self-service check in’ facility at Sydney Town Hall
‘on day’ enrolment and voting;
on-line submission of postal vote applications; and
polling place accessibility rating system.
Technologically assisted voting (iVote) was introduced for the 2011 NSW State Election and
the 2011 Clarence By-election held in November 2011. iVote is currently not provided in
local government elections but this survey provided an opportunity to gauge demand.
NSW Local Government Elections 2012 Service Commitment Charter
The NSWEC issued a ‘NSW Local Government Elections 2012 Service Commitment Charter’
containing targets and indicators for measuring its effectiveness in providing election
services. These include standard indicators such as voter participation and informal voting
rates as well as indicators specific to the above initiatives.
This report details:
Elector satisfaction compared to targets in the NSWEC’s 2012 Service Commitment
Charter
Claimed voter participation
Elector satisfaction with the NSWEC election services and officials
Elector satisfaction with services provided to key voter groups
Elector satisfaction with the telephone enquiry service and web site
Assessment of 2012 initiatives where possible (note that we only had 15 voting at
Sydney Town Hall so cannot evaluate the initiatives there)
Interest and acceptability of technologically assisted voting (iVote)
13
2.2 RESEARCH OBJECTIVES
The overall objectives of the research were to provide a robust and reliable measurement of
the delivery of voter services across the community, including key voter groups, and the
NSWEC performance against its Service Charter.
This report addresses each of the following objectives:
To provide reliable information about:
o Electors’ perceptions of and satisfaction with the NSWEC’s election services
covering pre-poll and polling day services, including telephone enquiry services.
o Voters’ perceptions of and satisfaction with the quality of assistance received
from election officials.
To provide reliable information about voters from culturally and linguistically diverse
(CALD) backgrounds; Indigenous voters and visually impaired voters in terms of their
perceptions of and satisfaction with assistance the NSWEC provided.
To provide reliable results that can be used by the NSWEC to establish service
benchmarks for future elections.
To assist the NSWEC to identify areas for service improvement and, where appropriate,
for which groups of electors.

14
The research methodology for the 2012 survey was as follows:
instinct and reason and the NSWEC met on 22nd May to share existing knowledge about the
satisfaction study and past research, as well as past and current strategies and initiatives.
The final methodology and sampling was agreed upon.
A CATI (telephone) survey was used for the following reasons:
Telephone interviewing allowed for a high level of quality control (including 10%
validation of all interviews)
It allowed for random sampling of households (within each council area), with quotas
for each Regional Organisation of Councils (ROC) to ensure representative numbers
by ROC. See appendix for definition of ROCs and which councils in each ROC.
Telephone contact details were provided via the electronic white pages, random
number generation based on geographic area, and 15% mobile phone numbers. This
helped to ensure a representative sample.
Quotas were also set for age and gender to be representative of the NSW population.
The survey took 10 minutes to complete. The average questionnaire length as measured by
our field agency (Action Market Research) was 9 minutes and 47 seconds.
Sample composition
All respondents were screened to ensure their eligibility; all had to be Australian
citizens, aged 18+, and currently living in NSW.
The achieved sample was not weighted as it was representative of the NSW
population in terms of age, gender and location.
Booster interviews were conducted to ensure a robust sample of visually impaired
voters, Indigenous voters and people from a CALD background.
Sample structure
Our sampling approach took into account the whole of State and covered every Local
Government Area (LGA). We randomly collected a population sample at the electoral
boundary level and undertook analysis at the Regional Organising Council (ROC)
level.
3. METHODOLOGY
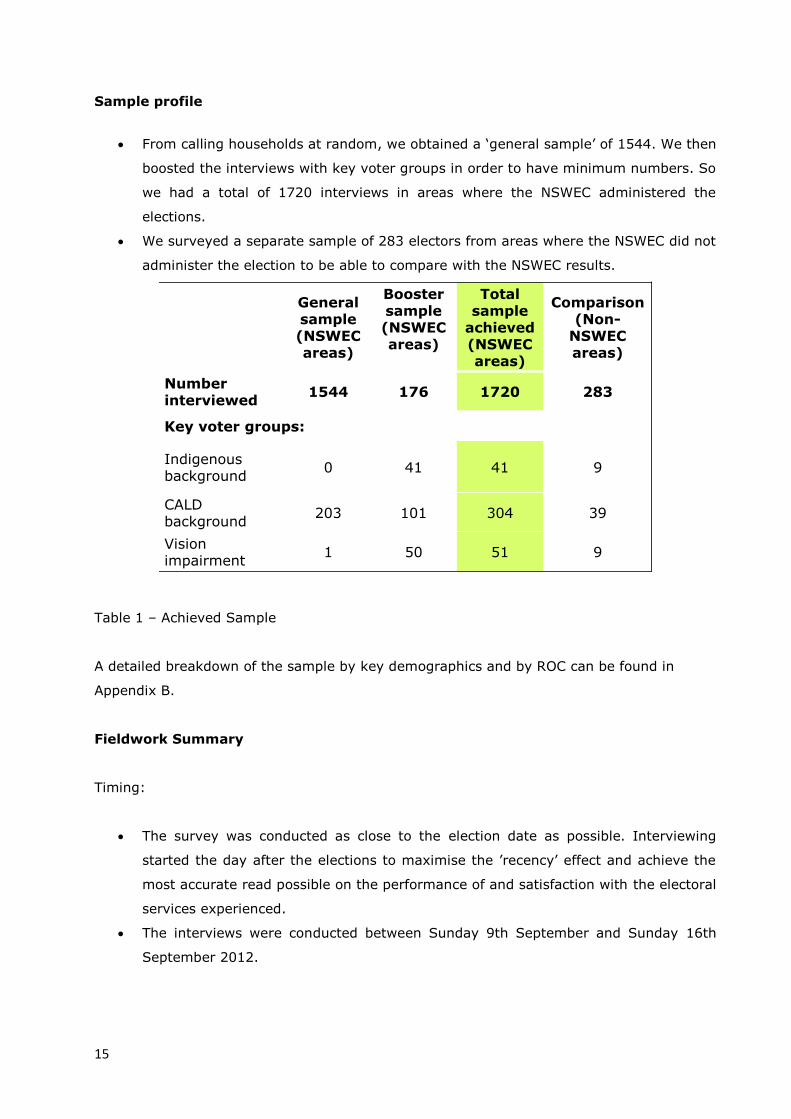
15
Sample profile
From calling households at random, we obtained a ‘general sample’ of 1544. We then
boosted the interviews with key voter groups in order to have minimum numbers. So
we had a total of 1720 interviews in areas where the NSWEC administered the
elections.
We surveyed a separate sample of 283 electors from areas where the NSWEC did not
administer the election to be able to compare with the NSWEC results.
Table 1 – Achieved Sample
A detailed breakdown of the sample by key demographics and by ROC can be found in
Appendix B.
Fieldwork Summary
Timing:
The survey was conducted as close to the election date as possible. Interviewing
started the day after the elections to maximise the ’recency’ effect and achieve the
most accurate read possible on the performance of and satisfaction with the electoral
services experienced.
The interviews were conducted between Sunday 9th September and Sunday 16th
September 2012.
General sample(NSWEC areas)
Boostersample(NSWEC areas)
Total sample
achieved(NSWEC areas)
Comparison(Non-
NSWECareas)
Numberinterviewed
1544 176 1720 283
Key voter groups:
Indigenous background
0 41 41 9
CALD background
203 101 304 39
Vision impairment
1 50 51 9
16
Response rates
The response rate for this study was 1 completed interview for every 4.8 calls made
– these calls included non-connections (Answering Machines, No Answer, Engaged)
and connections (Interviews, Call backs, Not suitable, Refusals). One outright refusal
occurred in every 7.4 connections.
The willingness to participate was high given the top-of-mind awareness of the
survey topic. It was further improved by the mention that the survey was being
conducted on behalf of the NSW Electoral Commission.
Methodology used in the 2008 study
The methodology used in 2008 and the methodology used in 2012 were different and so the
results are not directly comparable.
In 2008, leaflets were distributed to voters at polling places on election day, directing them
to the survey on the NSWEC website which could then be completed online. The online
survey was open to these and other voters, accessible to any individual, from Saturday 13th
September to Tuesday 7th October 2008.
In 2012, rigorous steps were taken to ensure a fully representative sample of electors was
surveyed. A random sample of households was contacted, along with a targeted sample of
key voter groups, and interviews took place by telephone. The survey took place over just
one week immediately following polling day.
Analysis notes
Reliability
All survey estimates have a sampling error attached to them and can be calculated
from the variability of the observations in the sample. From this, a margin of error
(confidence interval) is derived.
A small margin of error will result in a narrow interval, and hence a more precise
estimate of where the true value lies.
The technical calculation of sampling errors (and thus confidence intervals) is based
on an assumption of a simple random sampling method. This survey did not use a
simple random sample, however it is common practice in such surveys to use the
formulae applicable to simple random samples to estimate confidence intervals.
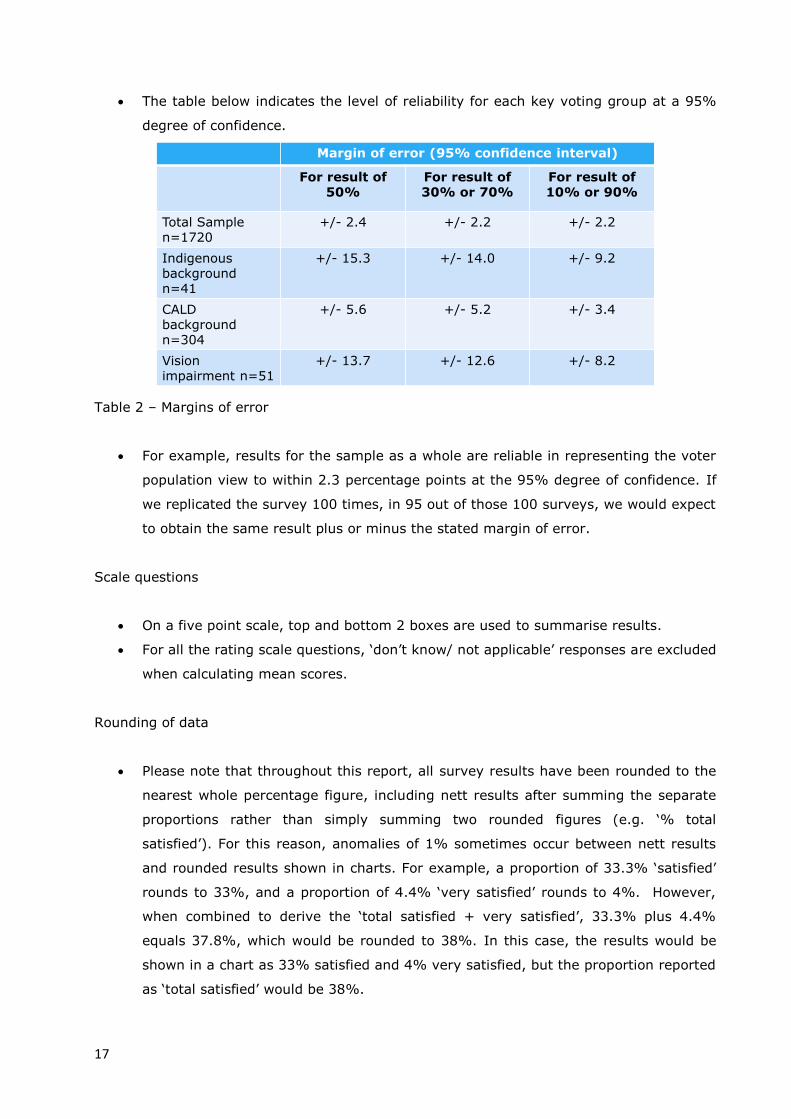
17
The table below indicates the level of reliability for each key voting group at a 95%
degree of confidence.
Table 2 – Margins of error
For example, results for the sample as a whole are reliable in representing the voter
population view to within 2.3 percentage points at the 95% degree of confidence. If
we replicated the survey 100 times, in 95 out of those 100 surveys, we would expect
to obtain the same result plus or minus the stated margin of error.
Scale questions
On a five point scale, top and bottom 2 boxes are used to summarise results.
For all the rating scale questions, ‘don’t know/ not applicable’ responses are excluded
when calculating mean scores.
Rounding of data
Please note that throughout this report, all survey results have been rounded to the
nearest whole percentage figure, including nett results after summing the separate
proportions rather than simply summing two rounded figures (e.g. ‘% total
satisfied’). For this reason, anomalies of 1% sometimes occur between nett results
and rounded results shown in charts. For example, a proportion of 33.3% ‘satisfied’
rounds to 33%, and a proportion of 4.4% ‘very satisfied’ rounds to 4%. However,
when combined to derive the ‘total satisfied + very satisfied’, 33.3% plus 4.4%
equals 37.8%, which would be rounded to 38%. In this case, the results would be
shown in a chart as 33% satisfied and 4% very satisfied, but the proportion reported
as ‘total satisfied’ would be 38%.
Margin of error (95% confidence interval)
For result of 50%
For result of 30% or 70%
For result of 10% or 90%
Total Sample n=1720
+/- 2.4 +/- 2.2 +/- 2.2
Indigenous background n=41
+/- 15.3 +/- 14.0 +/- 9.2
CALD background n=304
+/- 5.6 +/- 5.2 +/- 3.4
Vision impairment n=51
+/- 13.7 +/- 12.6 +/- 8.2

18
The NSWEC set service standards and performance indicators in its ‘NSW Local Government
Elections 2012 Service Commitment Charter’. The results of the 2012 survey show that
these standards were met or exceeded in almost every case.
4.1 PERFORMANCE AGAINST SERVICE TARGETS
Electors expect high quality election services. NSWEC committed itself to a number of
service standards. These standards included voter enrolment, turnout, percentage of formal
votes and the timely provision of results. Standards were also set for elector satisfaction
and perception of the performance of electoral officials. Table 2 below lists the results of
elector satisfaction and perceptions for the 2012 Election against the agreed standards.
Service standard Standard 2012 result
Satisfaction with election services
QE1 overall process of voting – very satisfactory, satisfactory
Base: all who voted (1649)
72.2%* 86%
Enrolment details correct
QA12 To the best of your knowledge, when you voted, were your
details on the electoral roll correct? – Yes
Base: all who voted (1649)
96.5%* 97%
Satisfaction with the service provided by NSWEC’s
telephone enquiry service
G3 - rating the service provided by the telephone enquiry service – very
satisfactory, satisfactory
Base: contacted the telephone enquiry service (50)
60.0%**
76%
Satisfaction with NSWEC’s website
QG10 rating the service provided by the website – very satisfactory,
satisfactory
Base: visited the NSWEC website (226)
56.0%** 79%
Satisfaction with length of time it took to vote at
pre-poll centre
QC3- B Time taken to cast a pre-poll vote – very satisfactory,
satisfactory
Base: voted at a pre-poll centre (213)
62.0%*
94%
Satisfaction with accessibility of pre-poll places
QC3-C accessibility of pre-poll voting places – very satisfactory,
satisfactory
Base: voted at a pre-poll centre (213)
61.9%* 84%
4. RESULTS ON SERVICE CHARTER STANDARDS
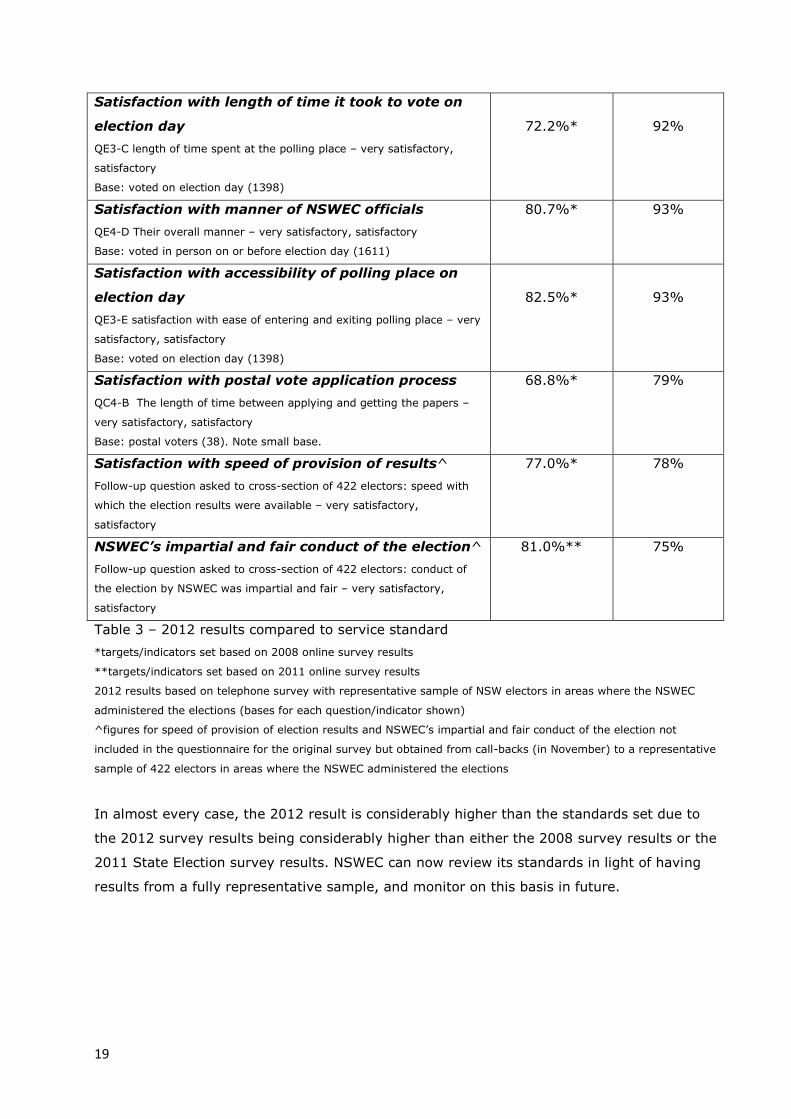
19
Satisfaction with length of time it took to vote on
election day
QE3-C length of time spent at the polling place – very satisfactory,
satisfactory
Base: voted on election day (1398)
72.2%*
92%
Satisfaction with manner of NSWEC officials
QE4-D Their overall manner – very satisfactory, satisfactory
Base: voted in person on or before election day (1611)
80.7%* 93%
Satisfaction with accessibility of polling place on
election day
QE3-E satisfaction with ease of entering and exiting polling place – very
satisfactory, satisfactory
Base: voted on election day (1398)
82.5%*
93%
Satisfaction with postal vote application process
QC4-B The length of time between applying and getting the papers –
very satisfactory, satisfactory
Base: postal voters (38). Note small base.
68.8%* 79%
Satisfaction with speed of provision of results^
Follow-up question asked to cross-section of 422 electors: speed with
which the election results were available – very satisfactory,
satisfactory
77.0%* 78%
NSWEC’s impartial and fair conduct of the election^
Follow-up question asked to cross-section of 422 electors: conduct of
the election by NSWEC was impartial and fair – very satisfactory,
satisfactory
81.0%** 75%
Table 3 – 2012 results compared to service standard
*targets/indicators set based on 2008 online survey results
**targets/indicators set based on 2011 online survey results
2012 results based on telephone survey with representative sample of NSW electors in areas where the NSWEC
administered the elections (bases for each question/indicator shown)
^figures for speed of provision of election results and NSWEC’s impartial and fair conduct of the election not
included in the questionnaire for the original survey but obtained from call-backs (in November) to a representative
sample of 422 electors in areas where the NSWEC administered the elections
In almost every case, the 2012 result is considerably higher than the standards set due to
the 2012 survey results being considerably higher than either the 2008 survey results or the
2011 State Election survey results. NSWEC can now review its standards in light of having
results from a fully representative sample, and monitor on this basis in future.
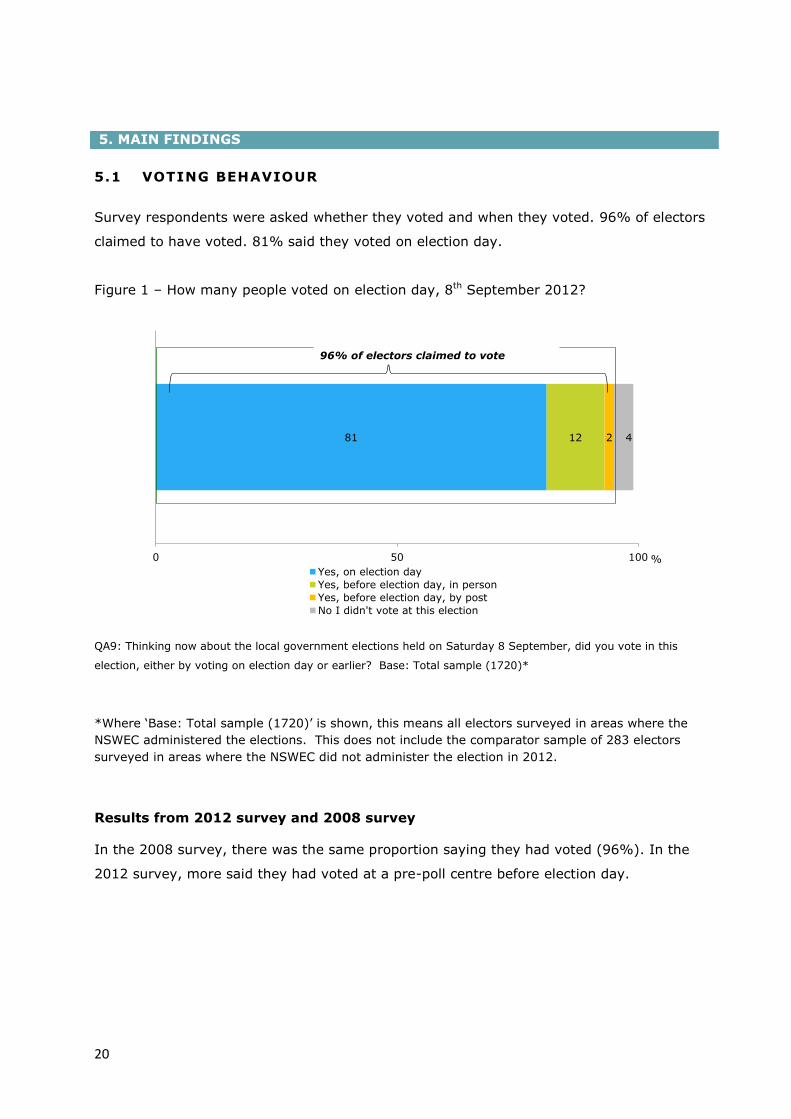
20
5.1 VOTING BEHAVIOUR
Survey respondents were asked whether they voted and when they voted. 96% of electors
claimed to have voted. 81% said they voted on election day.
Figure 1 – How many people voted on election day, 8th September 2012?
QA9: Thinking now about the local government elections held on Saturday 8 September, did you vote in this
election, either by voting on election day or earlier? Base: Total sample (1720)*
*Where ‘Base: Total sample (1720)’ is shown, this means all electors surveyed in areas where the
NSWEC administered the elections. This does not include the comparator sample of 283 electors
surveyed in areas where the NSWEC did not administer the election in 2012.
Results from 2012 survey and 2008 survey
In the 2008 survey, there was the same proportion saying they had voted (96%). In the
2012 survey, more said they had voted at a pre-poll centre before election day.
81 12 2 4
0 50 100
Yes, on election day
Yes, before election day, in person
Yes, before election day, by post
No I didn't vote at this election
96% of electors claimed to vote
%
5. MAIN FINDINGS
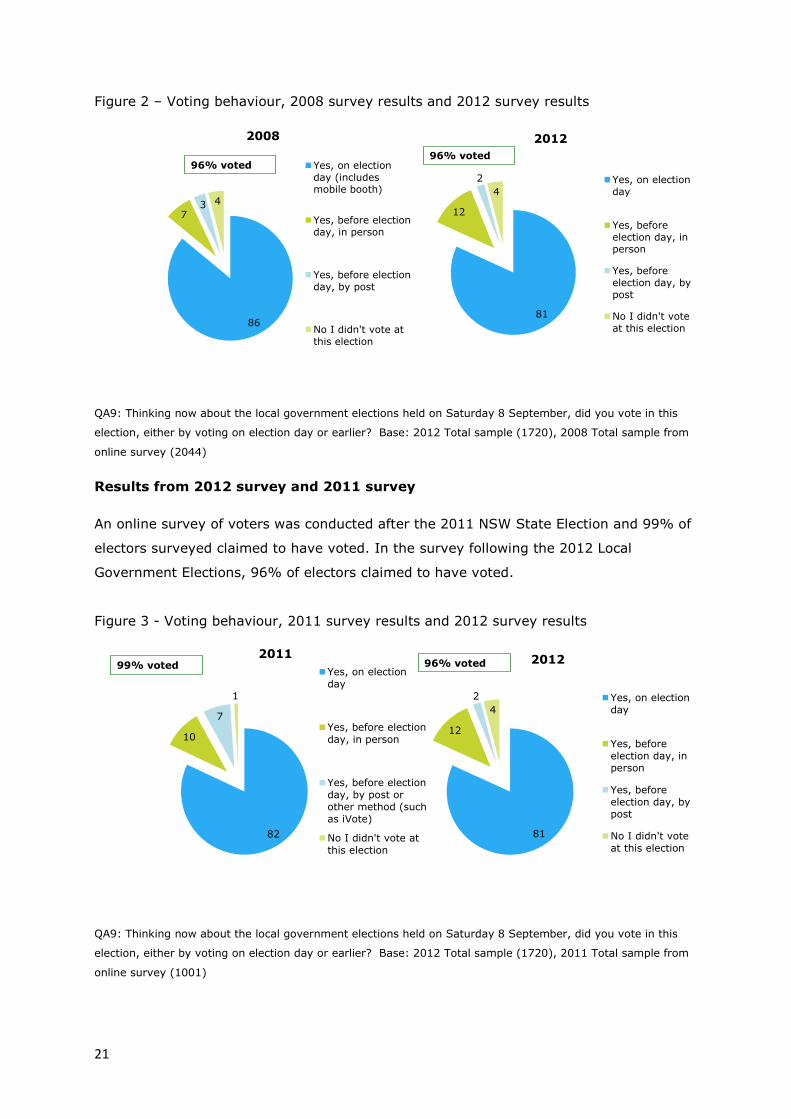
21
Figure 2 – Voting behaviour, 2008 survey results and 2012 survey results
QA9: Thinking now about the local government elections held on Saturday 8 September, did you vote in this
election, either by voting on election day or earlier? Base: 2012 Total sample (1720), 2008 Total sample from
online survey (2044)
Results from 2012 survey and 2011 survey
An online survey of voters was conducted after the 2011 NSW State Election and 99% of
electors surveyed claimed to have voted. In the survey following the 2012 Local
Government Elections, 96% of electors claimed to have voted.
Figure 3 - Voting behaviour, 2011 survey results and 2012 survey results
QA9: Thinking now about the local government elections held on Saturday 8 September, did you vote in this
election, either by voting on election day or earlier? Base: 2012 Total sample (1720), 2011 Total sample from
online survey (1001)
81
12
2
4
2012
Yes, on election
day
Yes, before
election day, inperson
Yes, before
election day, bypost
No I didn't vote
at this election86
73 4
2008
Yes, on election
day (includesmobile booth)
Yes, before election
day, in person
Yes, before election
day, by post
No I didn't vote at
this election
96% voted96% voted
81
12
2
4
2012
Yes, on election
day
Yes, before
election day, inperson
Yes, before
election day, bypost
No I didn't vote
at this election
82
10
7
1
2011
Yes, on election
day
Yes, before election
day, in person
Yes, before election
day, by post orother method (such
as iVote)
No I didn't vote at
this election
96% voted99% voted

22
51 vision impaired electors, 41 Indigenous electors and 304 CALD electors (in areas where
the NSWEC administered the elections) participated in the survey. Indigenous electors were
significantly less likely to claim to vote in this election than the total sample. Electors with
vision impairment were more likely to claim to vote before election day.
Figure 4 - When did various key voter groups vote?
QA9: Thinking now about the local government elections held on Saturday 8 September, did you vote in this
election, either by voting on election day or earlier? Base: 2012 Total sample (1720), Electors with vision
impairment or blindness (51), Indigenous electors (41), CALD electors (304)
There were no significant differences in claimed voting behaviours between the NSWEC
council electors and non-NSWEC council electors across the State as a whole. Within the
Hunter ROC specifically – where there were a number of councils administering the election
themselves – there was one significant difference in claimed voting behaviour. In areas
where the NSWEC administered the elections, 30% of those surveyed said they voted
before election day, compared with just 8% of those from areas where the councils
administered their elections.
Electors who voted before election day
There were 251 electors in our survey who voted before election day, around 15% of all
electors. Electors who voted before election day were asked in which way they voted and
their reasons for opting to vote before election day.
Of the 251 electors who voted before election day, 15% said they voted by post, 77% said
they voted at a pre-poll centre within NSW, 2% said they voted at Sydney Town Hall, and
5% said they voted via another method (e.g. through an aged care facility).
90
73
65
81
9
15
27
15
2
12
8
4
0 50 100
CALD electors
Indigenous electors
Electors with visionimpairment
Total sample
Yes, on election day Yes, before election day No, didn't vote in this election
Indicates result is statistically greater than the total sample
92
96
88
98
%
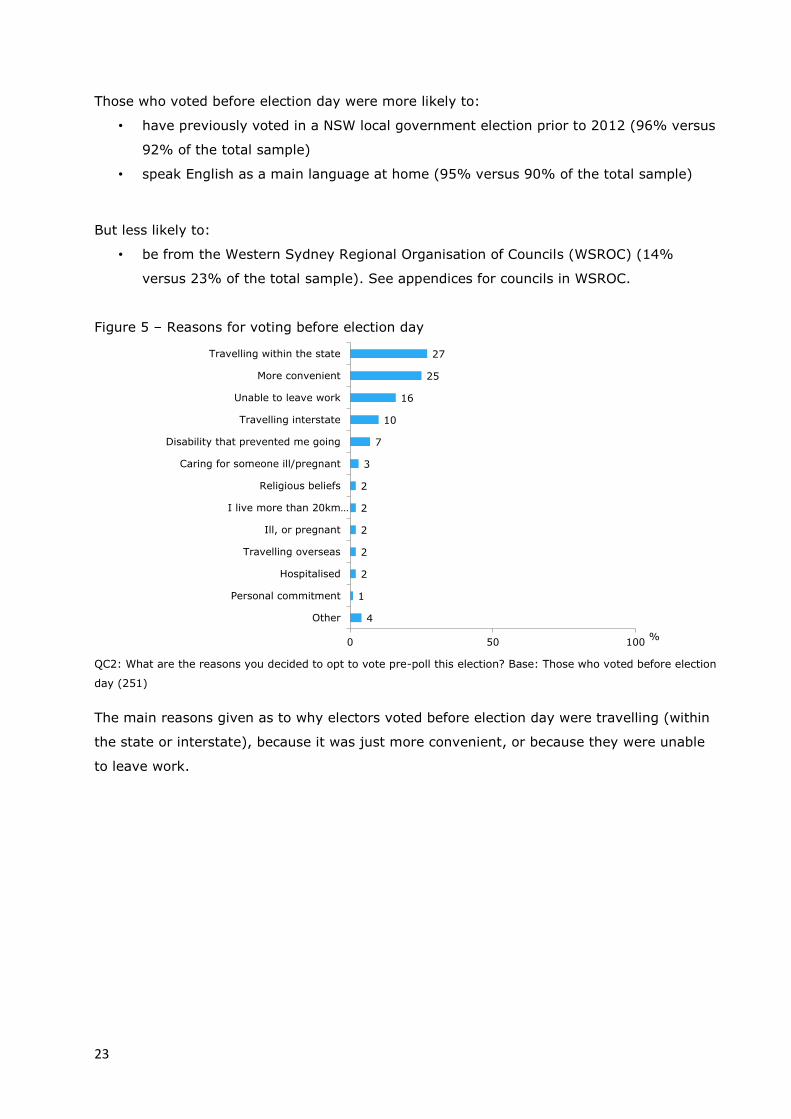
23
Those who voted before election day were more likely to:
• have previously voted in a NSW local government election prior to 2012 (96% versus
92% of the total sample)
• speak English as a main language at home (95% versus 90% of the total sample)
But less likely to:
• be from the Western Sydney Regional Organisation of Councils (WSROC) (14%
versus 23% of the total sample). See appendices for councils in WSROC.
Figure 5 – Reasons for voting before election day
QC2: What are the reasons you decided to opt to vote pre-poll this election? Base: Those who voted before election
day (251)
The main reasons given as to why electors voted before election day were travelling (within
the state or interstate), because it was just more convenient, or because they were unable
to leave work.
4
1
2
2
2
2
2
3
7
10
16
25
27
0 50 100
Other
Personal commitment
Hospitalised
Travelling overseas
Ill, or pregnant
I live more than 20km…
Religious beliefs
Caring for someone ill/pregnant
Disability that prevented me going
Travelling interstate
Unable to leave work
More convenient
Travelling within the state
%

24
Electors who did not vote
4% of all electors surveyed said that they did not vote. These 71 electors who did not vote
were asked to give their reasons for not voting and to indicate whether or not they were
aware of the $55 penalty for failure to vote.
Those who did not vote were more likely to:
• be under the age of 44 (66% versus 45% of the total)
• be male (61% versus 49% of the total)
• be from the Southern ROC (21% versus 8% of the total)
• live more than 20km from a polling place/remote area (7% versus 1% of the total)
• be Indigenous (7% versus 2% of the total)
Figure 6 – Reasons for not voting
B1b. What prevented you from voting at the election? Base: Electors that didn’t vote (71)
The main reasons given for not voting were ‘being out of council area, travelling within
state, interstate or overseas ’ claimed by three in ten who didn’t vote and ‘not knowing the
election was on’, claimed by two in ten who didn’t vote.
15
1
1
3
3
3
4
4
6
7
10
20
30
0 50 100
Other
Don't think my vote counts
Believed it was a religious duty not to vote
I was caring for someone ill/in hospital
I live more than 20km away from a polling place
I was at work
I was ineligble to vote
Couldn't get to a polling place /
I was away
I don't believe in the voting/political system
I forgot
I was ill/in hospital
I didn't know the election was on
I was out of the council area on election day/
travelling within the state /travelling interstate…
Reasons for not voting
%

25
Figure 7 – Awareness of penalty for failure to vote and potential impact if aware
QB3: Were you aware that a $55 penalty applies for not voting? Base: Those who didn’t vote (71), Those who
didn’t vote and were not aware of the penalty (16)
A quarter of electors who did not vote were not aware of the $55 penalty for not voting.
Of the sixteen voters who did not vote and were not aware of the penalty, eight of them
claim they would have voted had they known about the penalty.
8 8
0
6
11
Yes No
Would have voted if had been aware of penalty
77
23
Awareness of penalty for not voting
Yes No
% raw numbers
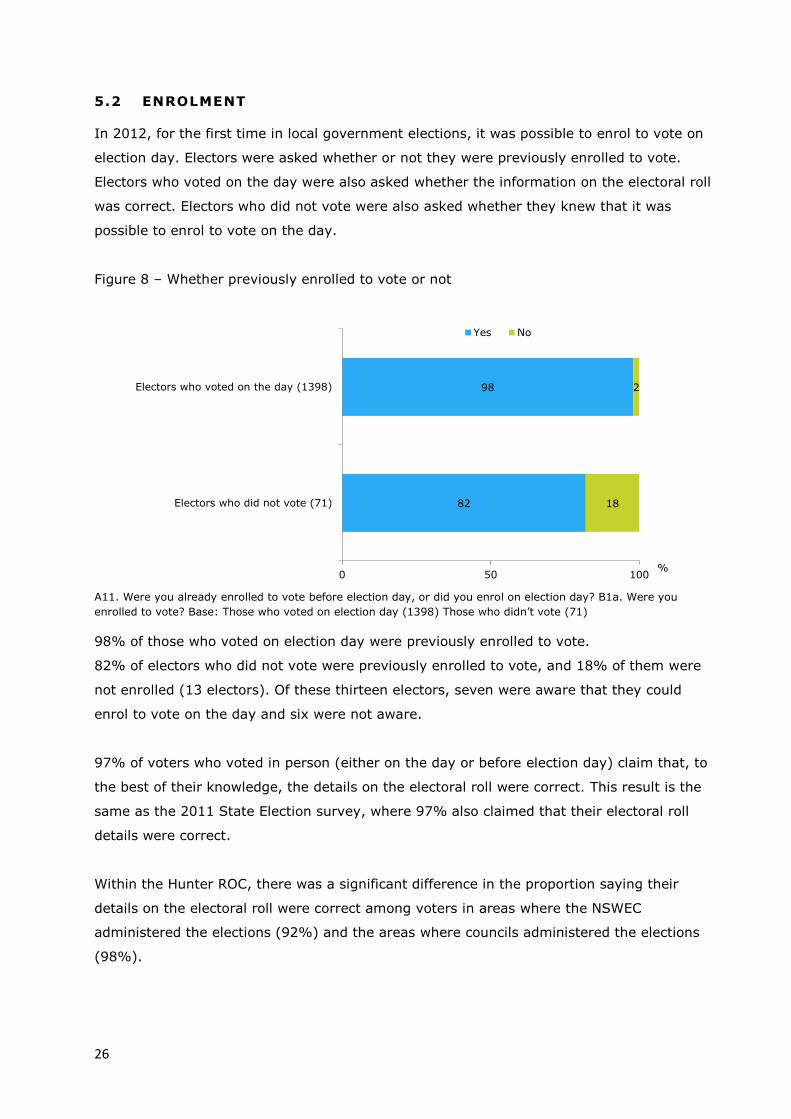
26
5.2 ENROLMENT
In 2012, for the first time in local government elections, it was possible to enrol to vote on
election day. Electors were asked whether or not they were previously enrolled to vote.
Electors who voted on the day were also asked whether the information on the electoral roll
was correct. Electors who did not vote were also asked whether they knew that it was
possible to enrol to vote on the day.
Figure 8 – Whether previously enrolled to vote or not
A11. Were you already enrolled to vote before election day, or did you enrol on election day? B1a. Were you
enrolled to vote? Base: Those who voted on election day (1398) Those who didn’t vote (71)
98% of those who voted on election day were previously enrolled to vote.
82% of electors who did not vote were previously enrolled to vote, and 18% of them were
not enrolled (13 electors). Of these thirteen electors, seven were aware that they could
enrol to vote on the day and six were not aware.
97% of voters who voted in person (either on the day or before election day) claim that, to
the best of their knowledge, the details on the electoral roll were correct. This result is the
same as the 2011 State Election survey, where 97% also claimed that their electoral roll
details were correct.
Within the Hunter ROC, there was a significant difference in the proportion saying their
details on the electoral roll were correct among voters in areas where the NSWEC
administered the elections (92%) and the areas where councils administered the elections
(98%).
82
98
18
2
Electors who did not vote (71)
Electors who voted on the day (1398)
0 50 100
Yes No
%
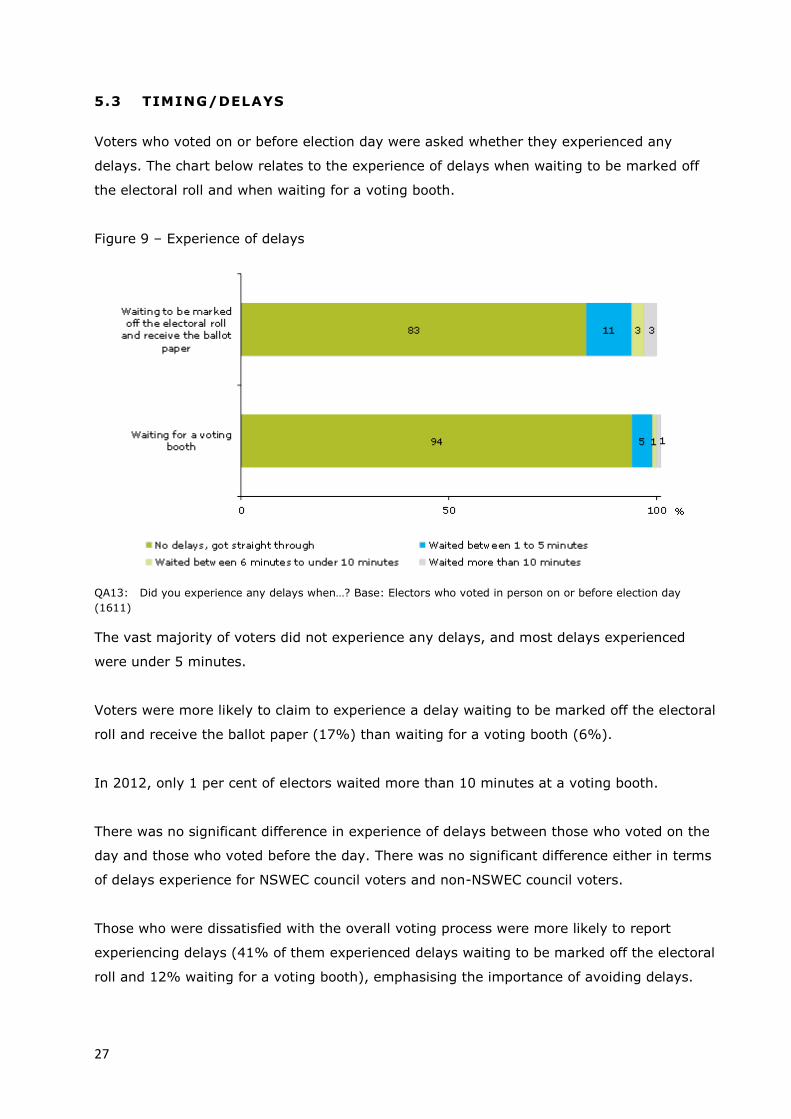
27
5.3 TIMING/DELAYS
Voters who voted on or before election day were asked whether they experienced any
delays. The chart below relates to the experience of delays when waiting to be marked off
the electoral roll and when waiting for a voting booth.
Figure 9 – Experience of delays
QA13: Did you experience any delays when…? Base: Electors who voted in person on or before election day
(1611)
The vast majority of voters did not experience any delays, and most delays experienced
were under 5 minutes.
Voters were more likely to claim to experience a delay waiting to be marked off the electoral
roll and receive the ballot paper (17%) than waiting for a voting booth (6%).
In 2012, only 1 per cent of electors waited more than 10 minutes at a voting booth.
There was no significant difference in experience of delays between those who voted on the
day and those who voted before the day. There was no significant difference either in terms
of delays experience for NSWEC council voters and non-NSWEC council voters.
Those who were dissatisfied with the overall voting process were more likely to report
experiencing delays (41% of them experienced delays waiting to be marked off the electoral
roll and 12% waiting for a voting booth), emphasising the importance of avoiding delays.
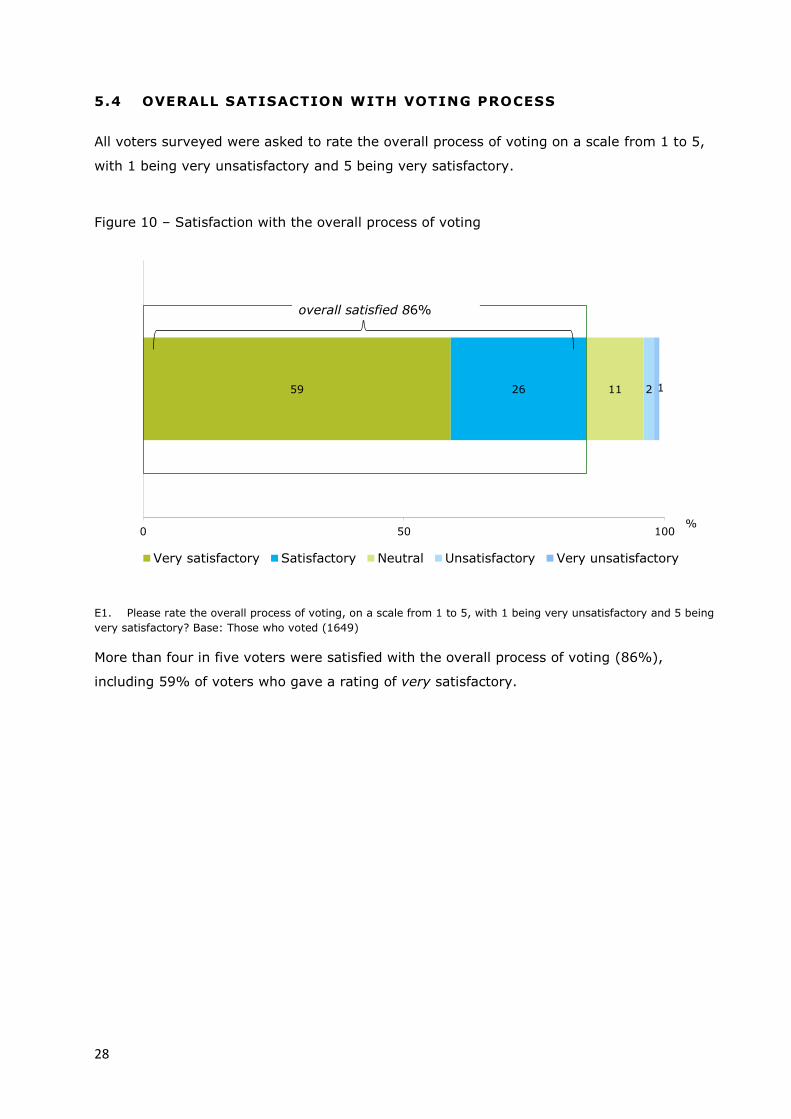
28
5.4 OVERALL SATISACTION WITH VOTING PROCESS
All voters surveyed were asked to rate the overall process of voting on a scale from 1 to 5,
with 1 being very unsatisfactory and 5 being very satisfactory.
Figure 10 – Satisfaction with the overall process of voting
E1. Please rate the overall process of voting, on a scale from 1 to 5, with 1 being very unsatisfactory and 5 being
very satisfactory? Base: Those who voted (1649)
More than four in five voters were satisfied with the overall process of voting (86%),
including 59% of voters who gave a rating of very satisfactory.
59 26 11 2 1
0 50 100
Very satisfactory Satisfactory Neutral Unsatisfactory Very unsatisfactory
overall satisfied 86%
%

29
Satisfaction in 2012 survey and 2008 survey
The graph below shows the responses to the question about satisfaction with the overall
process in the 2012 survey and in the 2008 survey.
Figure 11 – Satisfaction with process, 2012 survey and 2008 survey
E1. Please rate the overall process of voting, on a scale from 1 to 5, with 1 being very unsatisfactory and 5 being
very satisfactory? Base: Those who voted 2012 (1649), 2008 (1828)
The results from the 2012 survey are much more positive than the results obtained from
the online feedback survey carried out in 2008.
Since 2008, the NSWEC has taken numerous steps to improve its services, including:
the Service Charter
review of methodology used to calculate ballot paper requirements
out of council voting at Sydney Town Hall
more thorough assessment of polling places and pre-polling places
use of social media and digital advertising
In 2012, the vast majority of voters were satisfied with the overall process of voting
regardless of when they voted.
Figure 12 – Satisfaction depending on when they voted
21
59
35
26
17
11
12
2
12
1
3
0 50 100
2008
2012
Very satisfactory Satisfactory Neutral Unsatisfactory Very unsatisfactory Missing
overall satisfied 56%
overall satisfied 86%
%
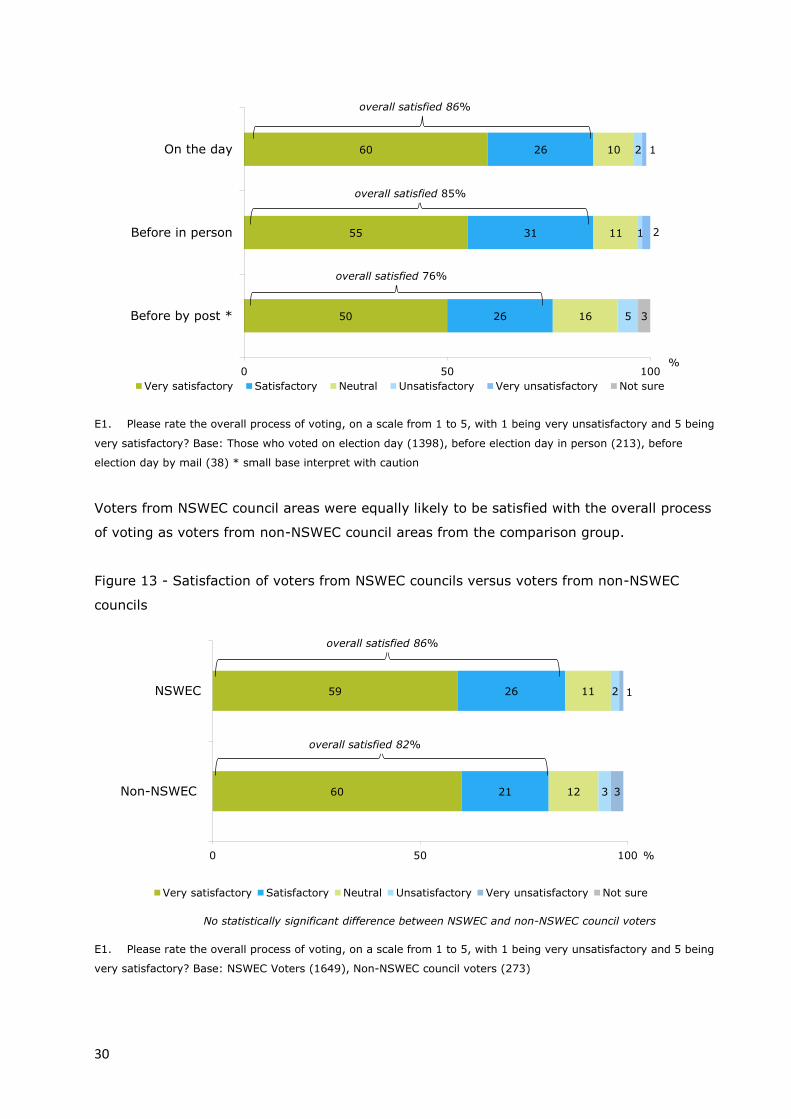
30
E1. Please rate the overall process of voting, on a scale from 1 to 5, with 1 being very unsatisfactory and 5 being
very satisfactory? Base: Those who voted on election day (1398), before election day in person (213), before
election day by mail (38) * small base interpret with caution
Voters from NSWEC council areas were equally likely to be satisfied with the overall process
of voting as voters from non-NSWEC council areas from the comparison group.
Figure 13 - Satisfaction of voters from NSWEC councils versus voters from non-NSWEC
councils
E1. Please rate the overall process of voting, on a scale from 1 to 5, with 1 being very unsatisfactory and 5 being
very satisfactory? Base: NSWEC Voters (1649), Non-NSWEC council voters (273)
50
55
60
26
31
26
16
11
10
5
1
2
2
1
3
0 50 100
Before by post *
Before in person
On the day
Very satisfactory Satisfactory Neutral Unsatisfactory Very unsatisfactory Not sure
overall satisfied 86%
overall satisfied 76%
overall satisfied 85%
%
60
59
21
26
12
11
3
2
3
1
0 50 100
Non-NSWEC
NSWEC
Very satisfactory Satisfactory Neutral Unsatisfactory Very unsatisfactory Not sure
overall satisfied 82%
overall satisfied 86%
%
No statistically significant difference between NSWEC and non-NSWEC council voters

31
Key voter groups were asked about their satisfaction with the overall voting process. The
results can be seen in Figure 14.
Figure 14 – Satisfaction amongst key voter groups
E1. Please rate the overall process of voting, on a scale from 1 to 5, with 1 being very unsatisfactory and 5 being
very satisfactory? Base: Vision impaired voters (47), CALD voters (299), Indigenous voters (36)
Vision impaired voters, CALD voters and Indigenous voters were equally likely to be
satisfied with the overall process of voting as the total sample.
There were no Indigenous voters giving ratings of unsatisfactory or very unsatisfactory and
there were no vision impaired voters giving negative ratings of the overall process.
57
57
56
59
26
31
33
26
17
9
11
11
3
2 1
0 50 100
Vision impairedvoters
CALD voters
Indigenous voters
Total
Very satisfactory Satisfactory Neutral Unsatisfactory Very unsatisfactory
overall satisfied 87%
overall satisfied 83%
overall satisfied 89%
overall satisfied 86%
%
No statistically significant difference between key voter groups
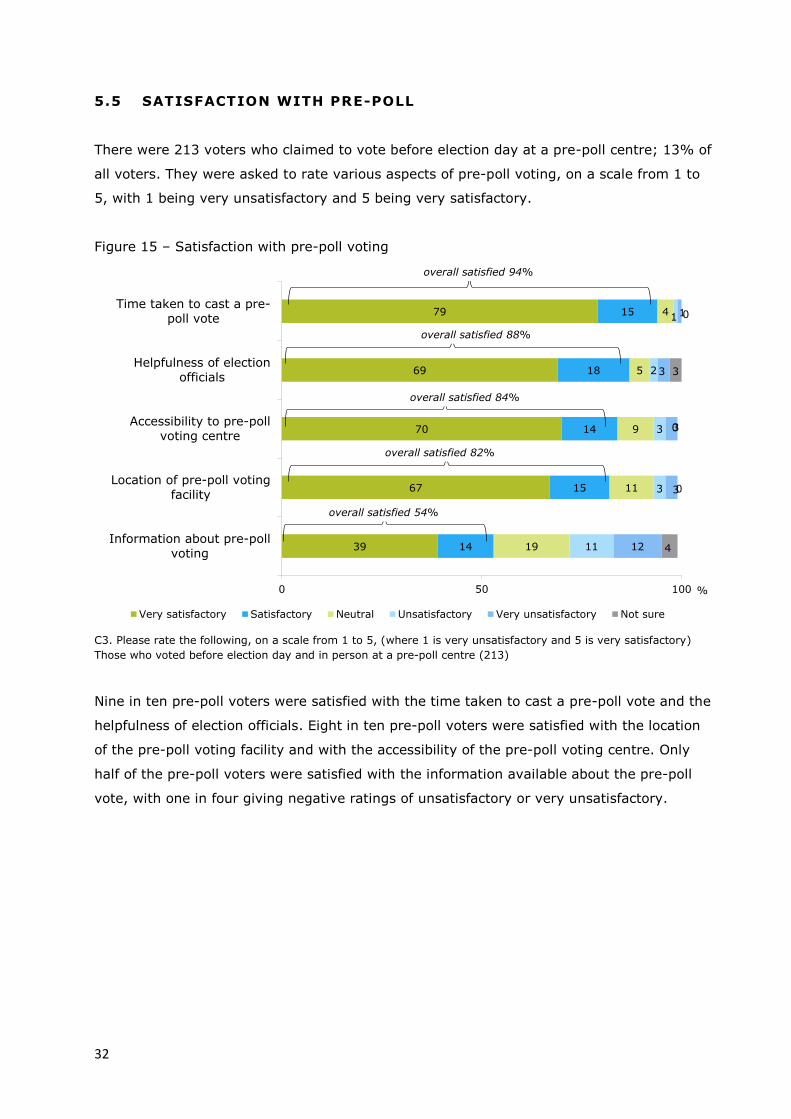
32
5.5 SATISFACTION WITH PRE-POLL
There were 213 voters who claimed to vote before election day at a pre-poll centre; 13% of
all voters. They were asked to rate various aspects of pre-poll voting, on a scale from 1 to
5, with 1 being very unsatisfactory and 5 being very satisfactory.
Figure 15 – Satisfaction with pre-poll voting
C3. Please rate the following, on a scale from 1 to 5, (where 1 is very unsatisfactory and 5 is very satisfactory)
Those who voted before election day and in person at a pre-poll centre (213)
Nine in ten pre-poll voters were satisfied with the time taken to cast a pre-poll vote and the
helpfulness of election officials. Eight in ten pre-poll voters were satisfied with the location
of the pre-poll voting facility and with the accessibility of the pre-poll voting centre. Only
half of the pre-poll voters were satisfied with the information available about the pre-poll
vote, with one in four giving negative ratings of unsatisfactory or very unsatisfactory.
39
67
70
69
79
14
15
14
18
15
19
11
9
5
4
11
3
3
2
1
12
3
3
3
1
4
0
0
3
0
0 50 100
Information about pre-pollvoting
Location of pre-poll voting
facility
Accessibility to pre-pollvoting centre
Helpfulness of election
officials
Time taken to cast a pre-poll vote
Very satisfactory Satisfactory Neutral Unsatisfactory Very unsatisfactory Not sure
overall satisfied 94%
overall satisfied 88%
overall satisfied 84%
overall satisfied 82%
overall satisfied 54%
%
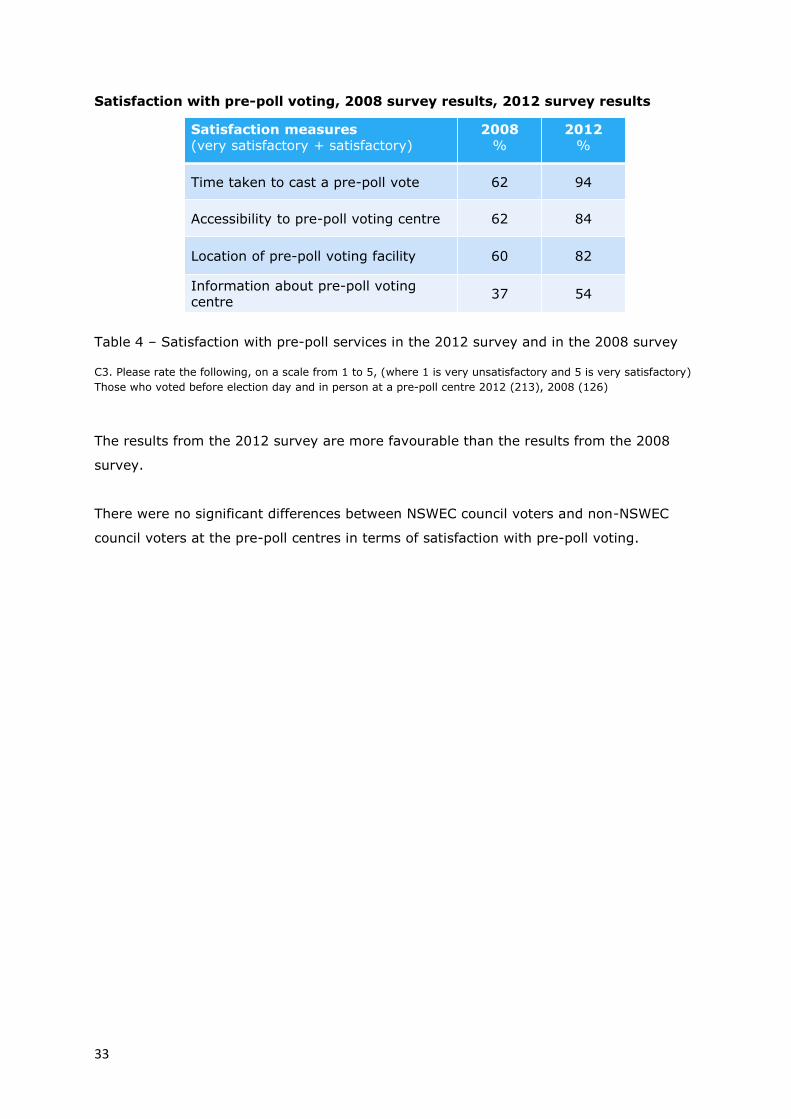
33
Satisfaction with pre-poll voting, 2008 survey results, 2012 survey results
Table 4 – Satisfaction with pre-poll services in the 2012 survey and in the 2008 survey
C3. Please rate the following, on a scale from 1 to 5, (where 1 is very unsatisfactory and 5 is very satisfactory)
Those who voted before election day and in person at a pre-poll centre 2012 (213), 2008 (126)
The results from the 2012 survey are more favourable than the results from the 2008
survey.
There were no significant differences between NSWEC council voters and non-NSWEC
council voters at the pre-poll centres in terms of satisfaction with pre-poll voting.
Satisfaction measures(very satisfactory + satisfactory)
2008%
2012%
Time taken to cast a pre-poll vote 62 94
Accessibility to pre-poll voting centre 62 84
Location of pre-poll voting facility 60 82
Information about pre-poll voting centre
37 54

34
5.6 SATISFACTION WITH POLLING PLACE VOTING
There were 1611 electors in the survey who voted either on or before election day at a
polling place. They were asked to rate various aspects of polling place voting, on a scale
from 1 to 5, with 1 being very unsatisfactory and 5 being very satisfactory.
The results are positive with nine in ten voters being satisfied with the convenience of
voting, with the length of time spent at the polling place, with the simplicity of the polling
place layout and with the ease of entering and exiting the polling place.
Figure 16a – Satisfaction with various aspects of polling place voting
E3. Please indicate, on a scale from 1 to 5, (where 1 is very unsatisfactory and 5 is very satisfactory), your
satisfaction with each of the following. Those who voted on or before election day in person at a polling place
(1611)
76
73
77
74
16
19
15
20
5
5
5
3
2
2
1
1
1
1
1
1
0 50 100
Length of time spentat the polling place
Ease of entering andexiting the polling place
Convenience of thevoting or polling location
Simplicity of thepolling place layout
Very satisfactory Satisfactory Neutral Unsatisfactory Very unsatisfactory Not sure
overall satisfied 94%
overall satisfied 92%
overall satisfied 92%
overall satisfied 91%
%
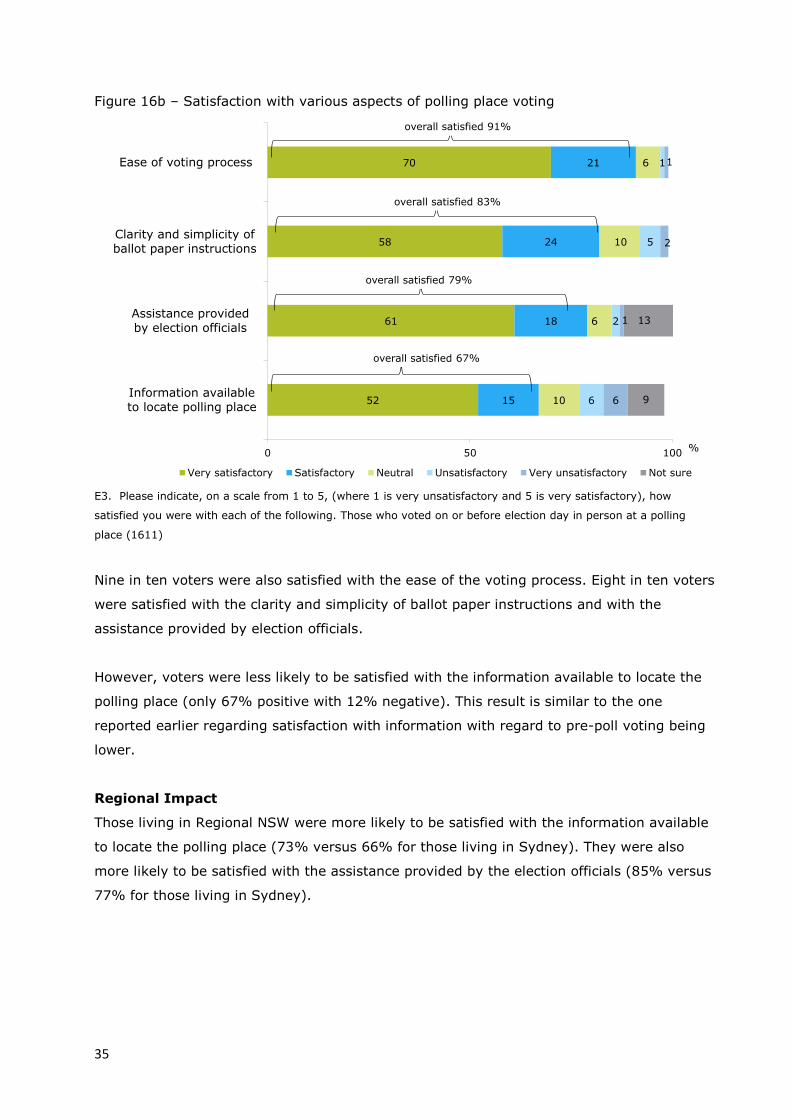
35
Figure 16b – Satisfaction with various aspects of polling place voting
E3. Please indicate, on a scale from 1 to 5, (where 1 is very unsatisfactory and 5 is very satisfactory), how
satisfied you were with each of the following. Those who voted on or before election day in person at a polling
place (1611)
Nine in ten voters were also satisfied with the ease of the voting process. Eight in ten voters
were satisfied with the clarity and simplicity of ballot paper instructions and with the
assistance provided by election officials.
However, voters were less likely to be satisfied with the information available to locate the
polling place (only 67% positive with 12% negative). This result is similar to the one
reported earlier regarding satisfaction with information with regard to pre-poll voting being
lower.
Regional Impact
Those living in Regional NSW were more likely to be satisfied with the information available
to locate the polling place (73% versus 66% for those living in Sydney). They were also
more likely to be satisfied with the assistance provided by the election officials (85% versus
77% for those living in Sydney).
52
61
58
70
15
18
24
21
10
6
10
6
6
2
5
1
6
1
2
1
9
13
0 50 100
Information availableto locate polling place
Assistance provided
by election officials
Clarity and simplicity ofballot paper instructions
Ease of voting process
Very satisfactory Satisfactory Neutral Unsatisfactory Very unsatisfactory Not sure
overall satisfied 83%
overall satisfied 79%
overall satisfied 67%
overall satisfied 91%
%
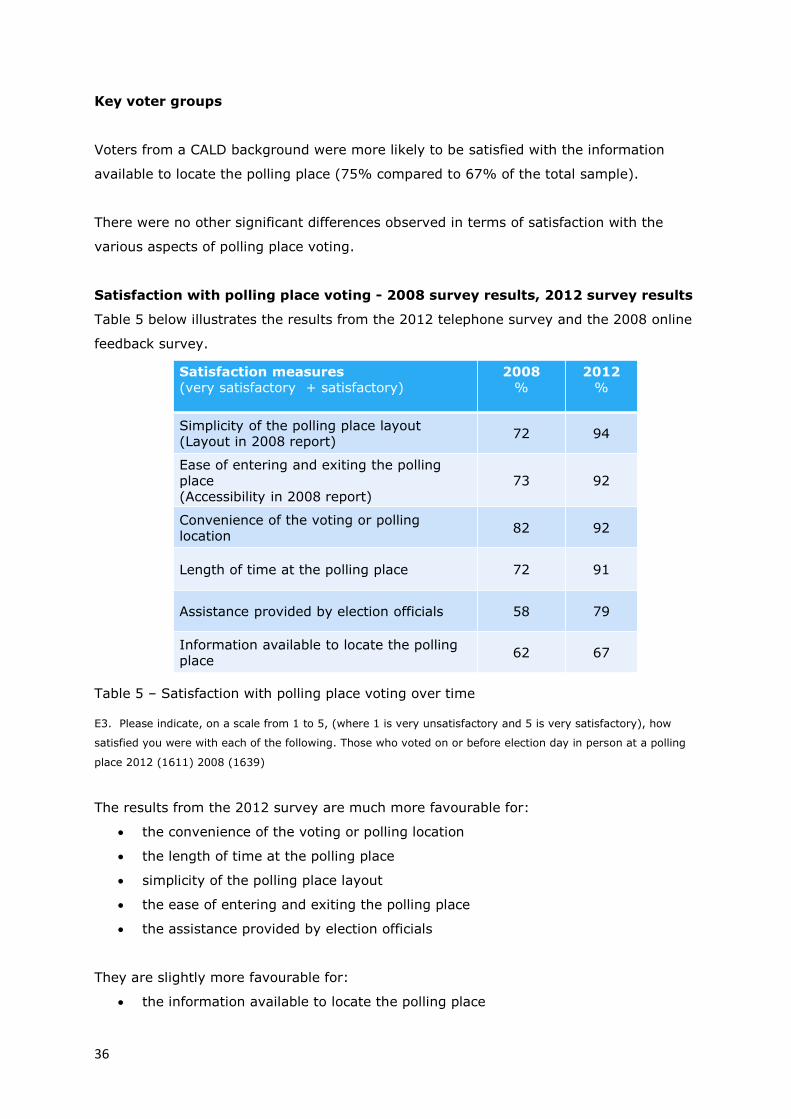
36
Key voter groups
Voters from a CALD background were more likely to be satisfied with the information
available to locate the polling place (75% compared to 67% of the total sample).
There were no other significant differences observed in terms of satisfaction with the
various aspects of polling place voting.
Satisfaction with polling place voting - 2008 survey results, 2012 survey results
Table 5 below illustrates the results from the 2012 telephone survey and the 2008 online
feedback survey.
Table 5 – Satisfaction with polling place voting over time
E3. Please indicate, on a scale from 1 to 5, (where 1 is very unsatisfactory and 5 is very satisfactory), how
satisfied you were with each of the following. Those who voted on or before election day in person at a polling
place 2012 (1611) 2008 (1639)
The results from the 2012 survey are much more favourable for:
the convenience of the voting or polling location
the length of time at the polling place
simplicity of the polling place layout
the ease of entering and exiting the polling place
the assistance provided by election officials
They are slightly more favourable for:
the information available to locate the polling place
Satisfaction measures(very satisfactory + satisfactory)
2008%
2012%
Simplicity of the polling place layout(Layout in 2008 report)
72 94
Ease of entering and exiting the polling place(Accessibility in 2008 report)
73 92
Convenience of the voting or polling location
82 92
Length of time at the polling place 72 91
Assistance provided by election officials 58 79
Information available to locate the polling place
62 67
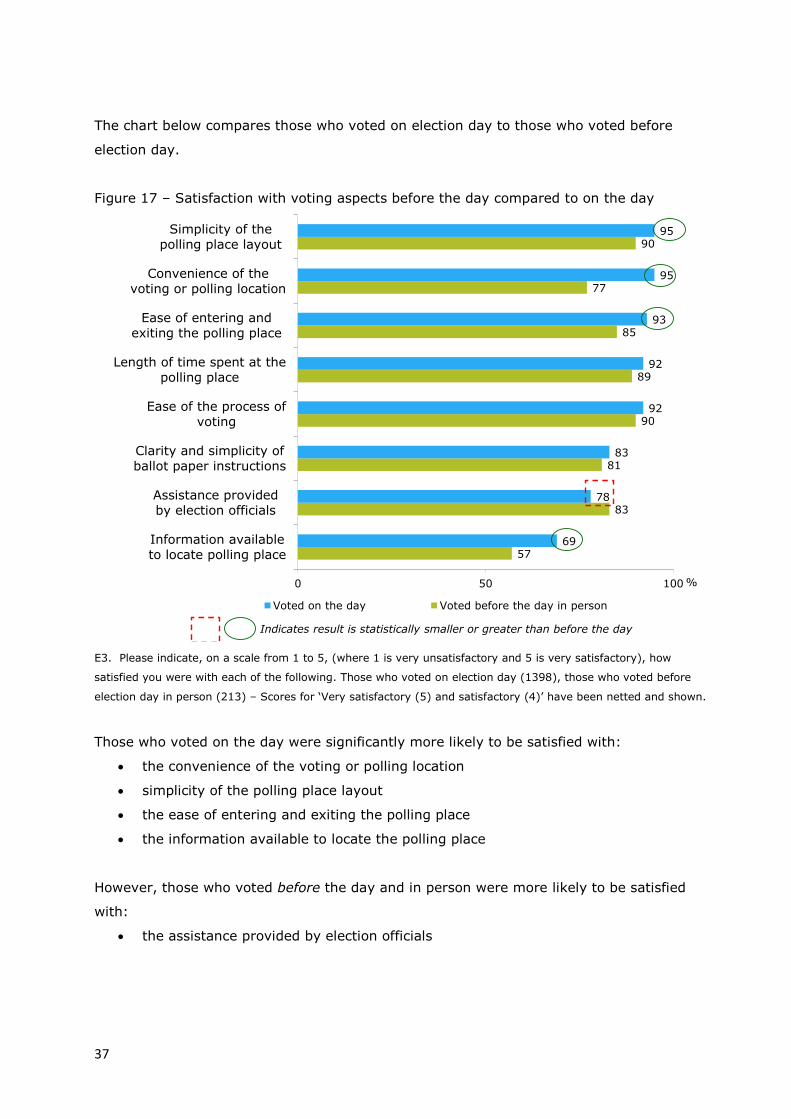
37
The chart below compares those who voted on election day to those who voted before
election day.
Figure 17 – Satisfaction with voting aspects before the day compared to on the day
E3. Please indicate, on a scale from 1 to 5, (where 1 is very unsatisfactory and 5 is very satisfactory), how
satisfied you were with each of the following. Those who voted on election day (1398), those who voted before
election day in person (213) – Scores for ‘Very satisfactory (5) and satisfactory (4)’ have been netted and shown.
Those who voted on the day were significantly more likely to be satisfied with:
the convenience of the voting or polling location
simplicity of the polling place layout
the ease of entering and exiting the polling place
the information available to locate the polling place
However, those who voted before the day and in person were more likely to be satisfied
with:
the assistance provided by election officials
57
83
81
90
89
85
77
90
69
78
83
92
92
93
95
95
0 50 100
Information availableto locate polling place
Assistance providedby election officials
Clarity and simplicity ofballot paper instructions
Ease of the process ofvoting
Length of time spent at thepolling place
Ease of entering andexiting the polling place
Convenience of thevoting or polling location
Simplicity of thepolling place layout
Voted on the day Voted before the day in person
%
Indicates result is statistically smaller or greater than before the day
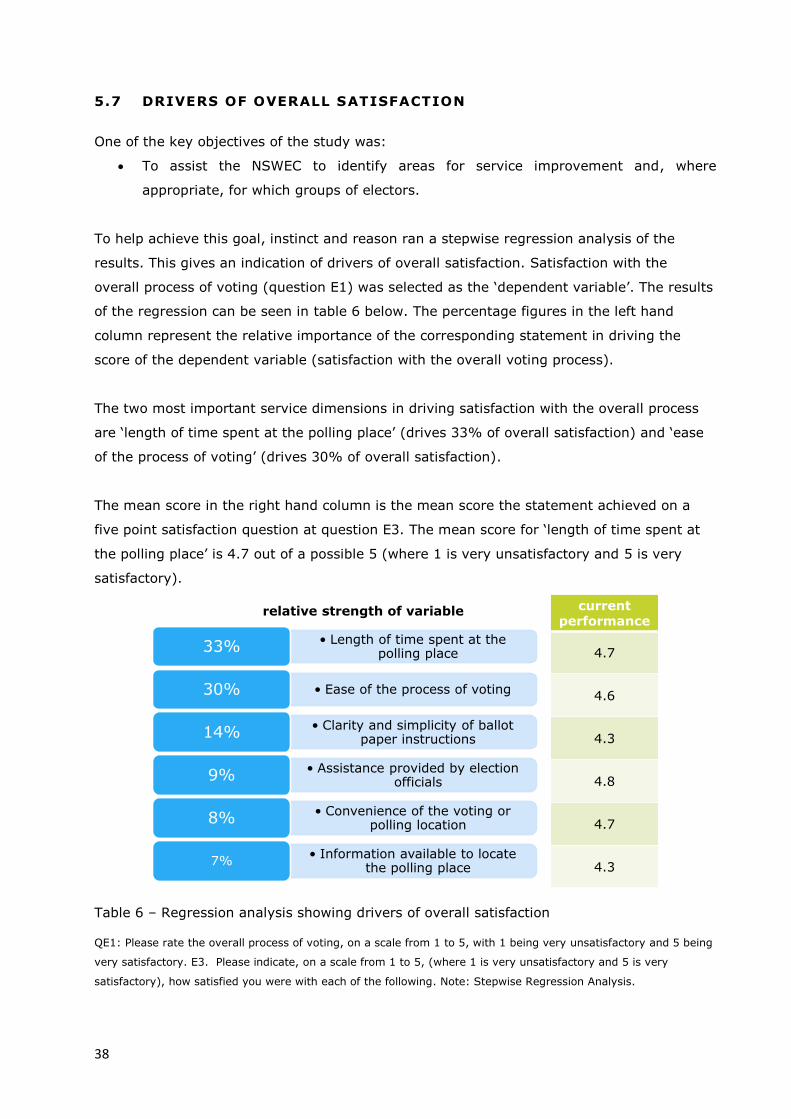
38
5.7 DRIVERS OF OVERALL SATISFACTION
One of the key objectives of the study was:
To assist the NSWEC to identify areas for service improvement and, where
appropriate, for which groups of electors.
To help achieve this goal, instinct and reason ran a stepwise regression analysis of the
results. This gives an indication of drivers of overall satisfaction. Satisfaction with the
overall process of voting (question E1) was selected as the ‘dependent variable’. The results
of the regression can be seen in table 6 below. The percentage figures in the left hand
column represent the relative importance of the corresponding statement in driving the
score of the dependent variable (satisfaction with the overall voting process).
The two most important service dimensions in driving satisfaction with the overall process
are ‘length of time spent at the polling place’ (drives 33% of overall satisfaction) and ‘ease
of the process of voting’ (drives 30% of overall satisfaction).
The mean score in the right hand column is the mean score the statement achieved on a
five point satisfaction question at question E3. The mean score for ‘length of time spent at
the polling place’ is 4.7 out of a possible 5 (where 1 is very unsatisfactory and 5 is very
satisfactory).
Table 6 – Regression analysis showing drivers of overall satisfaction
QE1: Please rate the overall process of voting, on a scale from 1 to 5, with 1 being very unsatisfactory and 5 being
very satisfactory. E3. Please indicate, on a scale from 1 to 5, (where 1 is very unsatisfactory and 5 is very
satisfactory), how satisfied you were with each of the following. Note: Stepwise Regression Analysis.
relative strength of variable
• Length of time spent at the polling place33%
• Ease of the process of voting30%
• Clarity and simplicity of ballot paper instructions14%
• Assistance provided by election officials9%
• Convenience of the voting or polling location8%
• Information available to locate the polling place
7%
current performance
4.7
4.6
4.3
4.8
4.7
4.3
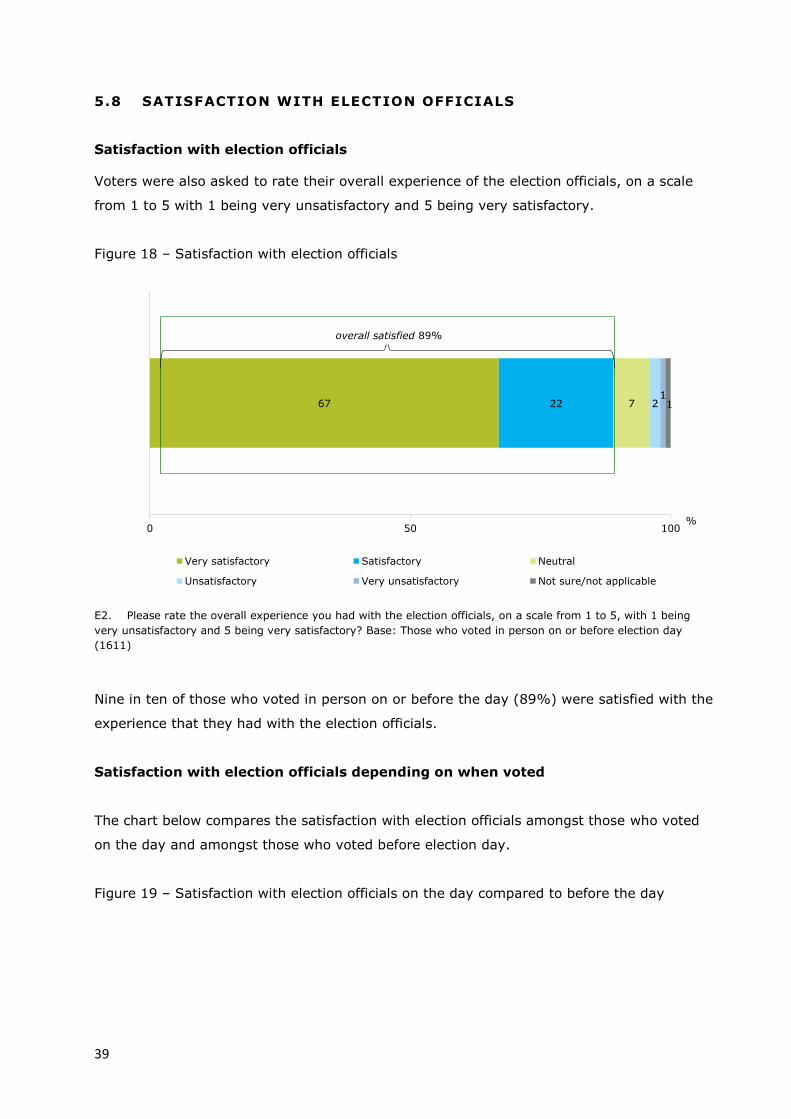
39
5.8 SATISFACTION WITH ELECTION OFFICIALS
Satisfaction with election officials
Voters were also asked to rate their overall experience of the election officials, on a scale
from 1 to 5 with 1 being very unsatisfactory and 5 being very satisfactory.
Figure 18 – Satisfaction with election officials
E2. Please rate the overall experience you had with the election officials, on a scale from 1 to 5, with 1 being
very unsatisfactory and 5 being very satisfactory? Base: Those who voted in person on or before election day
(1611)
Nine in ten of those who voted in person on or before the day (89%) were satisfied with the
experience that they had with the election officials.
Satisfaction with election officials depending on when voted
The chart below compares the satisfaction with election officials amongst those who voted
on the day and amongst those who voted before election day.
Figure 19 – Satisfaction with election officials on the day compared to before the day
67 22 7 211
0 50 100
Very satisfactory Satisfactory Neutral
Unsatisfactory Very unsatisfactory Not sure/not applicable
overall satisfied 89%
%

40
E2. Please rate the overall experience you had with the election officials, on a scale from 1 to 5, with 1 being
very unsatisfactory and 5 being very satisfactory? Base: Those who voted on election day in person (1398), those
who voted before election day in person (213)
Those who voted on election day were equally as likely to be satisfied as those who voted
before election day.
Other sub-groups
There was no significant difference in satisfaction with election officials between urban and
regional areas.
However, CALD voters were less likely to be very satisfied with election officials (58% giving
ratings of very satisfactory compared to 67% amongst the total sample).
Satisfaction with election officials – 2012 survey and 2011 survey
The question around ‘overall satisfaction with election officials’ was not asked in the 2008
survey. However, it was asked in the survey following the 2011 State Election. The chart
below compares the result regarding satisfaction with staff at the last State Election to the
result from the 2012 Local Government Elections on satisfaction with election officials.
Figure 20a – Satisfaction with election officials - 2012 survey and 2011 survey
64
67
23
22
8
7
1
2
1
1
1
0 50 100
Those who votedbefore the election
Those who voted on the day
Very satisfactory Satisfactory Neutral Unsatisfactory Very unsatisfactory Not sure/not applicable
overall satisfied 89%
overall satisfied 88%
1
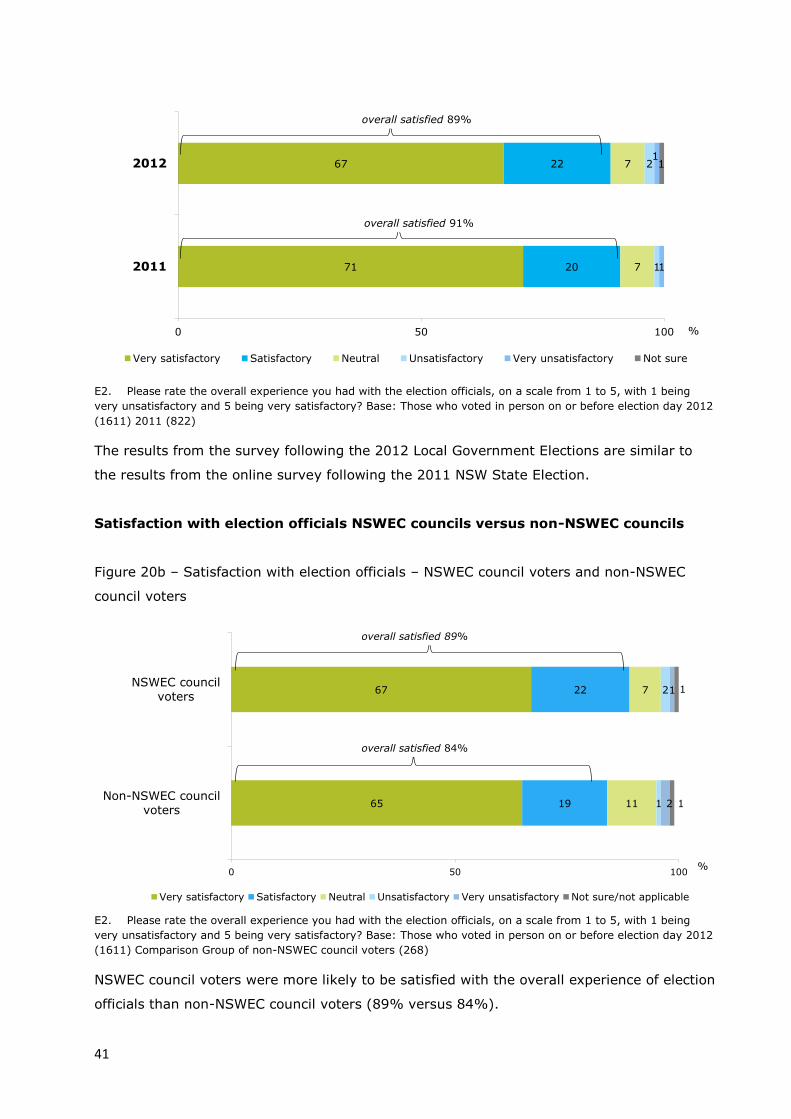
41
E2. Please rate the overall experience you had with the election officials, on a scale from 1 to 5, with 1 being
very unsatisfactory and 5 being very satisfactory? Base: Those who voted in person on or before election day 2012
(1611) 2011 (822)
The results from the survey following the 2012 Local Government Elections are similar to
the results from the online survey following the 2011 NSW State Election.
Satisfaction with election officials NSWEC councils versus non-NSWEC councils
Figure 20b – Satisfaction with election officials – NSWEC council voters and non-NSWEC
council voters
E2. Please rate the overall experience you had with the election officials, on a scale from 1 to 5, with 1 being
very unsatisfactory and 5 being very satisfactory? Base: Those who voted in person on or before election day 2012
(1611) Comparison Group of non-NSWEC council voters (268)
NSWEC council voters were more likely to be satisfied with the overall experience of election
officials than non-NSWEC council voters (89% versus 84%).
71
67
20
22
7
7
1
2
1
1
0 50 100
2011
2012
Very satisfactory Satisfactory Neutral Unsatisfactory Very unsatisfactory Not sure
overall satisfied 91%
overall satisfied 89%
1
%
65
67
19
22
11
7
1
2
2
1
1
0 50 100
Non-NSWEC councilvoters
NSWEC councilvoters
Very satisfactory Satisfactory Neutral Unsatisfactory Very unsatisfactory Not sure/not applicable
overall satisfied 89%
overall satisfied 84%
1
%

42
Satisfaction with various aspects of election officials
Voters were asked to rate the election officials on various aspects of service on a scale from
1 to 5 with 1 being very unsatisfactory and 5 being very satisfactory.
Figure 21 – Satisfaction with various aspects of election officials
E4. On a scale from 1 to 5, (where 1 is very unsatisfactory, and 5 is very satisfactory), how would rate your
satisfaction with the election officials on each of the following? Base: Those who voted on or before election day in
person 2012 (1611)
Nine in ten voters were satisfied with the overall manner of election officials (93%), with
them being courteous and polite (92%) and with them being professional (89%).
Although seven out of ten voters were satisfied with how informative election officials were,
only half (51%) were very satisfied with how informative they were. Similarly, only 47% of
electors were very satisfied with the ability of election officials to answer their queries and
resolve their issues.
47
51
68
74
74
13
20
21
18
19
6
10
7
5
5
1
2
1
1
1
1
1
1
1
1
32
16
2
2
2
0 50 100
Answering yourquestion/
resolving your issue
Being informative
Being professional
Being courteous andpolite
Their overall manner
Very satisfactory Satisfactory Neutral
Unsatisfactory Very unsatisfactory Not sure
overall satisfied 93%
overall satisfied 92%
overall satisfied 89%
overall satisfied 70%
overall satisfied 60%
%

43
Satisfaction with election officials amongst sub-groups
There were no significant differences between those who voted on the day and those who
voted before the day in terms of satisfaction with various aspects of election officials. Nor
between NSWEC councils and non NWSEC councils.
Satisfaction with various aspects of election officials – 2012 survey and 2008
survey
When rating the overall manner of election officials, the 2012 survey has much more
favourable results than the 2008 survey (74% giving a rating of very satisfactory in 2012,
just 45% in 2008).
Figure 22 – Satisfaction with the manner of staff
E4. On a scale from 1 to 5, (where 1 is very unsatisfactory, and 5 is very satisfactory), how would rate your
satisfaction with the election officials on each of the following? Base: Those who voted on or before election day in
person 2012 (1611) 2008 (1639)
45
74
36
19
9
5
3
1
6
1
1
2
0 50 100
2008
2012
Very satisfactory Satisfactory Neutral
Unsatisfactory Very unsatisfactory Not sure
overall satisfied 93%
overall satisfied 81%
%
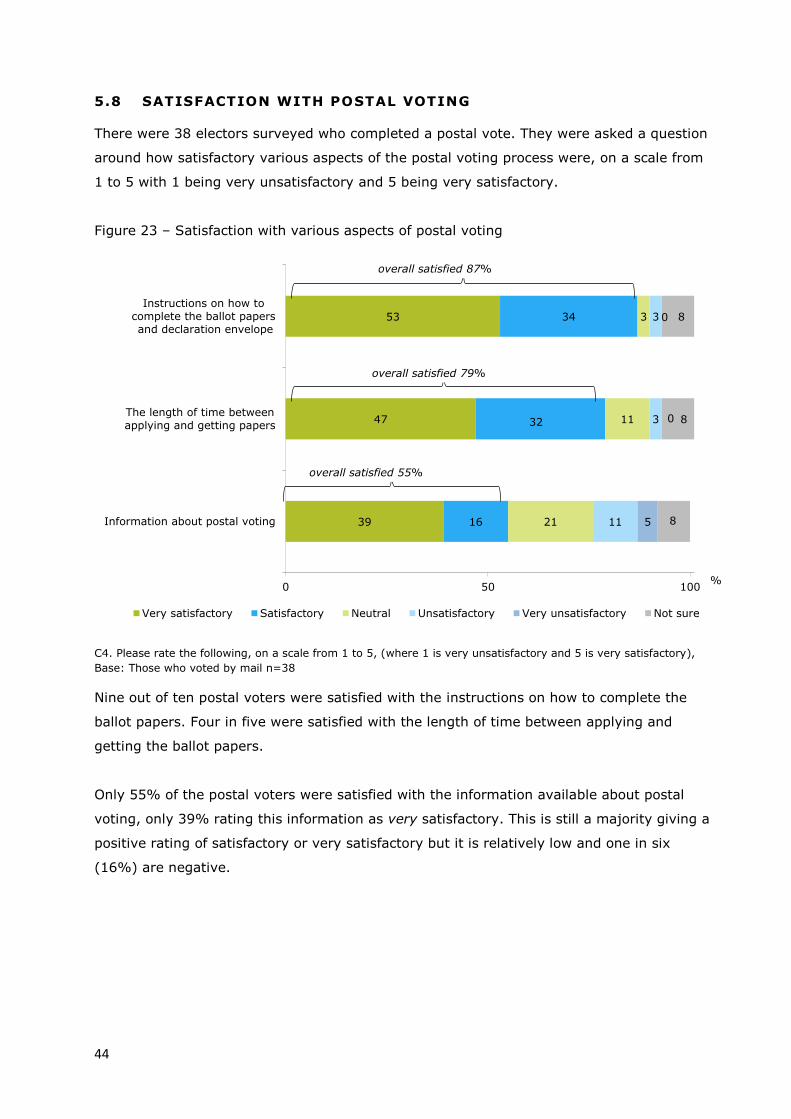
44
5.8 SATISFACTION WITH POSTAL VOTING
There were 38 electors surveyed who completed a postal vote. They were asked a question
around how satisfactory various aspects of the postal voting process were, on a scale from
1 to 5 with 1 being very unsatisfactory and 5 being very satisfactory.
Figure 23 – Satisfaction with various aspects of postal voting
C4. Please rate the following, on a scale from 1 to 5, (where 1 is very unsatisfactory and 5 is very satisfactory),
Base: Those who voted by mail n=38
Nine out of ten postal voters were satisfied with the instructions on how to complete the
ballot papers. Four in five were satisfied with the length of time between applying and
getting the ballot papers.
Only 55% of the postal voters were satisfied with the information available about postal
voting, only 39% rating this information as very satisfactory. This is still a majority giving a
positive rating of satisfactory or very satisfactory but it is relatively low and one in six
(16%) are negative.
39
47
53
16
32
34
21
11
3
11
3
3
5
0
8
8
8
0 50 100
Information about postal voting
The length of time between
applying and getting papers
Instructions on how to
complete the ballot papers and declaration envelope
Very satisfactory Satisfactory Neutral Unsatisfactory Very unsatisfactory Not sure
overall satisfied 87%
overall satisfied 79%
overall satisfied 55%
%
0
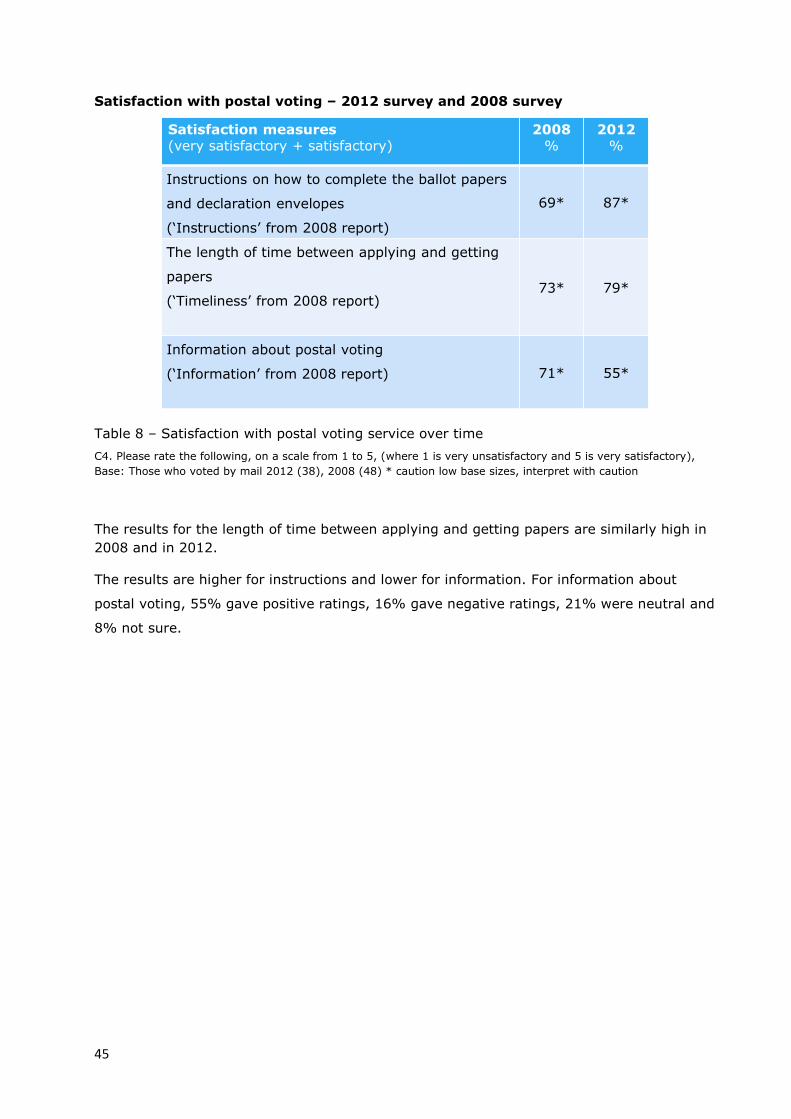
45
Satisfaction with postal voting – 2012 survey and 2008 survey
Table 8 – Satisfaction with postal voting service over time
C4. Please rate the following, on a scale from 1 to 5, (where 1 is very unsatisfactory and 5 is very satisfactory),
Base: Those who voted by mail 2012 (38), 2008 (48) * caution low base sizes, interpret with caution
The results for the length of time between applying and getting papers are similarly high in
2008 and in 2012.
The results are higher for instructions and lower for information. For information about
postal voting, 55% gave positive ratings, 16% gave negative ratings, 21% were neutral and
8% not sure.
Satisfaction measures(very satisfactory + satisfactory)
2008%
2012%
Instructions on how to complete the ballot papers
and declaration envelopes
(‘Instructions’ from 2008 report)
69* 87*
The length of time between applying and getting
papers
(‘Timeliness’ from 2008 report)73* 79*
Information about postal voting
(‘Information’ from 2008 report) 71* 55*
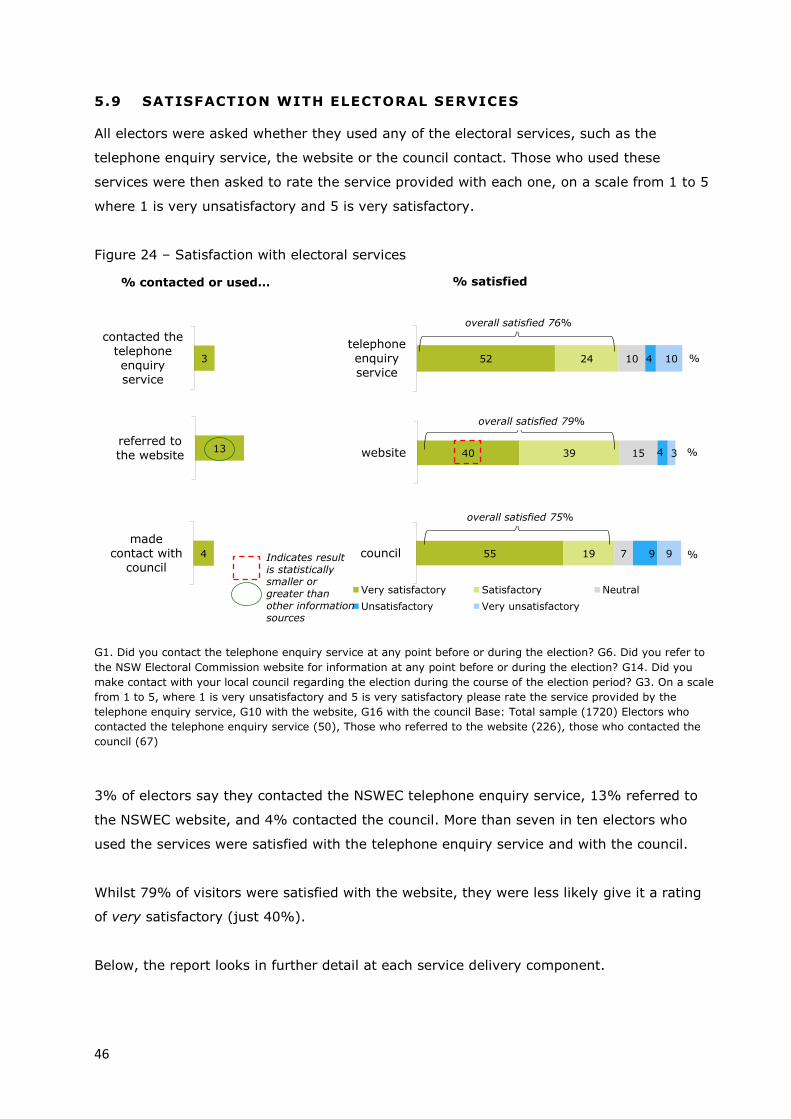
46
5.9 SATISFACTION WITH ELECTORAL SERVICES
All electors were asked whether they used any of the electoral services, such as the
telephone enquiry service, the website or the council contact. Those who used these
services were then asked to rate the service provided with each one, on a scale from 1 to 5
where 1 is very unsatisfactory and 5 is very satisfactory.
Figure 24 – Satisfaction with electoral services
G1. Did you contact the telephone enquiry service at any point before or during the election? G6. Did you refer to
the NSW Electoral Commission website for information at any point before or during the election? G14. Did you
make contact with your local council regarding the election during the course of the election period? G3. On a scale
from 1 to 5, where 1 is very unsatisfactory and 5 is very satisfactory please rate the service provided by the
telephone enquiry service, G10 with the website, G16 with the council Base: Total sample (1720) Electors who
contacted the telephone enquiry service (50), Those who referred to the website (226), those who contacted the
council (67)
3% of electors say they contacted the NSWEC telephone enquiry service, 13% referred to
the NSWEC website, and 4% contacted the council. More than seven in ten electors who
used the services were satisfied with the telephone enquiry service and with the council.
Whilst 79% of visitors were satisfied with the website, they were less likely give it a rating
of very satisfactory (just 40%).
Below, the report looks in further detail at each service delivery component.
52 24 10 4 10
telephoneenquiry
service
40 39 15 4 3website
55 19 7 9 9council
Very satisfactory Satisfactory Neutral
Unsatisfactory Very unsatisfactory
4
madecontact with
council
13referred tothe website
Indicates result is statistically smaller or greater than other information sources
3
contacted the
telephoneenquiryservice
overall satisfied 76%
overall satisfied 79%
overall satisfied 75%
%
%
%
% contacted or used… % satisfied
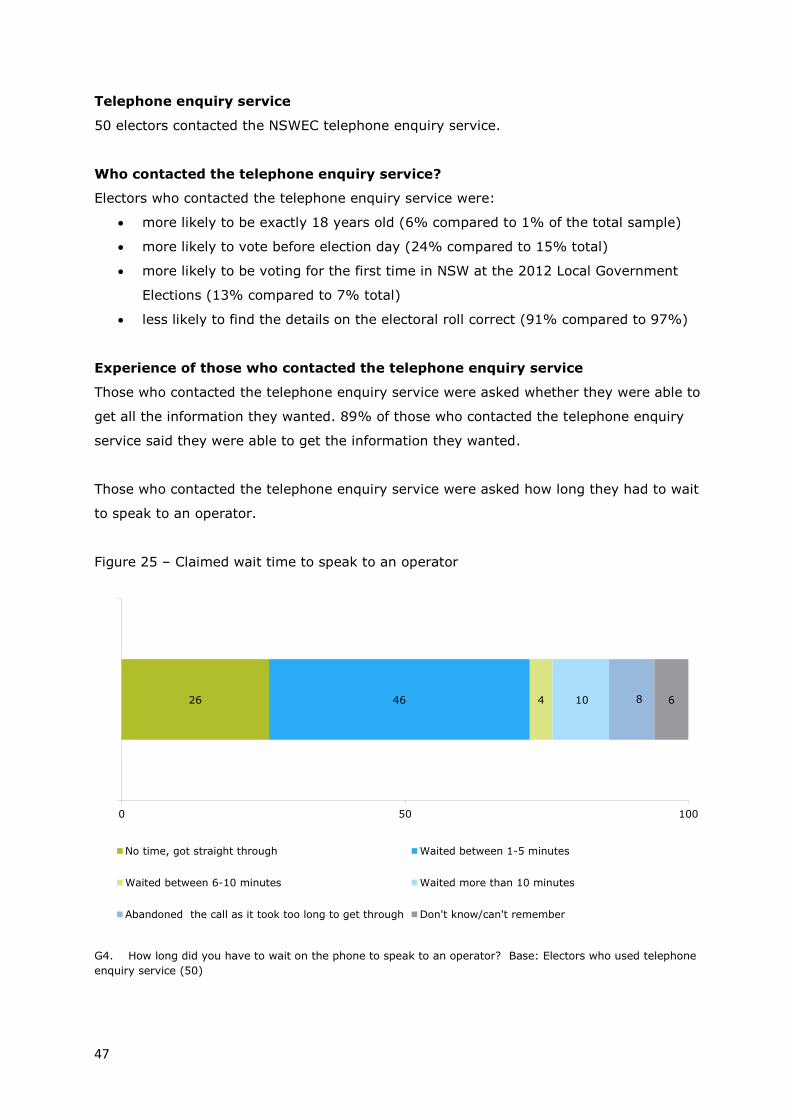
47
Telephone enquiry service
50 electors contacted the NSWEC telephone enquiry service.
Who contacted the telephone enquiry service?
Electors who contacted the telephone enquiry service were:
more likely to be exactly 18 years old (6% compared to 1% of the total sample)
more likely to vote before election day (24% compared to 15% total)
more likely to be voting for the first time in NSW at the 2012 Local Government
Elections (13% compared to 7% total)
less likely to find the details on the electoral roll correct (91% compared to 97%)
Experience of those who contacted the telephone enquiry service
Those who contacted the telephone enquiry service were asked whether they were able to
get all the information they wanted. 89% of those who contacted the telephone enquiry
service said they were able to get the information they wanted.
Those who contacted the telephone enquiry service were asked how long they had to wait
to speak to an operator.
Figure 25 – Claimed wait time to speak to an operator
G4. How long did you have to wait on the phone to speak to an operator? Base: Electors who used telephone
enquiry service (50)
26 46 4 10 8 6
0 50 100
No time, got straight through Waited between 1-5 minutes
Waited between 6-10 minutes Waited more than 10 minutes
Abandoned the call as it took too long to get through Don't know/can't remember

48
A quarter of electors who contacted the telephone enquiry service say they got straight
through. Three quarters experienced some kind of delay, the most common type of delay
being 1 to 5 minutes (experienced by around half of all callers).
The delays experienced by those who contacted the telephone enquiry service exceed the
delays experienced by those at the polling centre.
Those who called the telephone enquiry service were asked to rate the service provided
from the operator they spoke to, on a variety of service dimensions, on a scale from 1 to 5
with 1 being very unsatisfactory and 5 being very satisfactory.
Figure 26 – Satisfaction with telephone operators from telephone enquiry service
G5. Please rate the electoral official you spoke to, on each of the following attributes, on a scale from 1 to 5, with 1
being very unsatisfactory and 5 being very satisfactory. Base: Electors who used telephone enquiry service (50)
More than eight in ten electors were satisfied with each aspect of service from the telephone
operator they spoke to. Electors were equally likely to be satisfied with each service
dimension.
The chart below shows the difference between satisfaction with election officials at the
polling place and satisfaction with the operator from the telephone enquiry service.
64
62
66
66
66
18
20
18
20
20
4
4
4
4
4
2
2
2
8
8
6
6
6
4
4
4
4
4
0 50 100
Answering yourquestion/
resolving your issue
Being informative
Being professional
Being courteous andpolite
Their overall manner
Very satisfactory Satisfactory Neutral
Unsatisfactory Very unsatisfactory Not sure
overall satisfied 86%
overall satisfied 86%
overall satisfied 84%
overall satisfied 82%
overall satisfied 82%
%
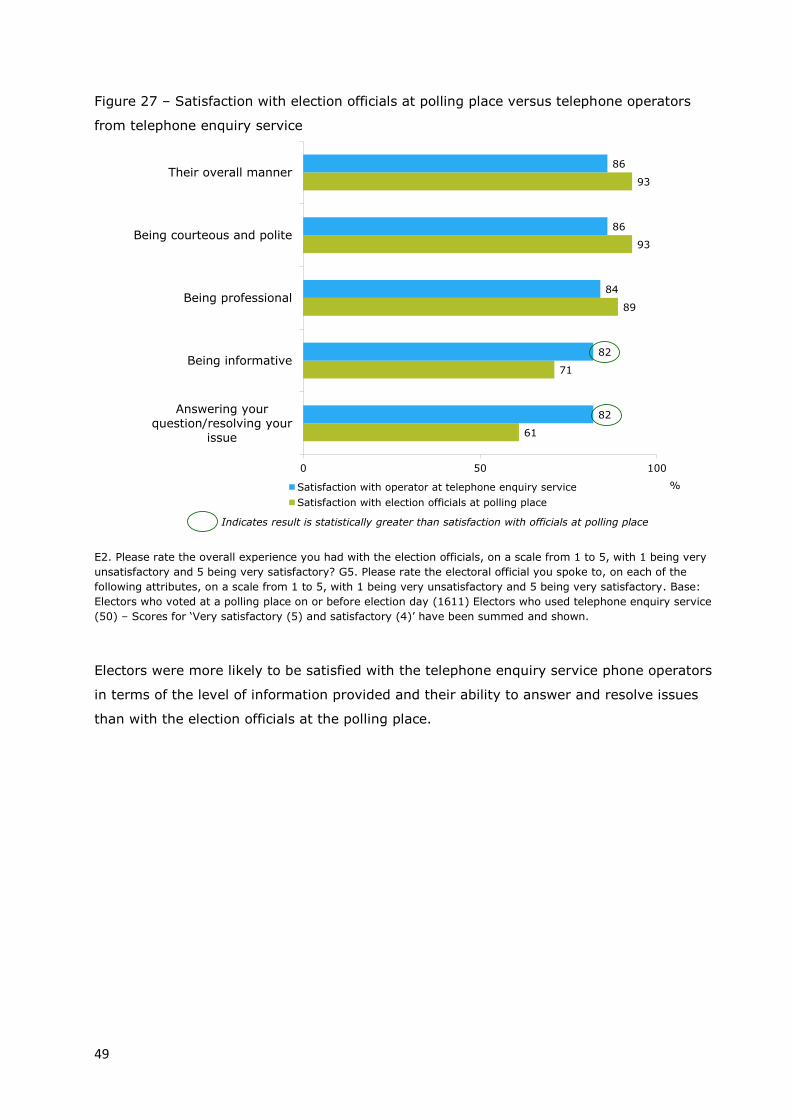
49
Figure 27 – Satisfaction with election officials at polling place versus telephone operators
from telephone enquiry service
E2. Please rate the overall experience you had with the election officials, on a scale from 1 to 5, with 1 being very
unsatisfactory and 5 being very satisfactory? G5. Please rate the electoral official you spoke to, on each of the
following attributes, on a scale from 1 to 5, with 1 being very unsatisfactory and 5 being very satisfactory. Base:
Electors who voted at a polling place on or before election day (1611) Electors who used telephone enquiry service
(50) – Scores for ‘Very satisfactory (5) and satisfactory (4)’ have been summed and shown.
Electors were more likely to be satisfied with the telephone enquiry service phone operators
in terms of the level of information provided and their ability to answer and resolve issues
than with the election officials at the polling place.
61
71
89
93
93
82
82
84
86
86
0 50 100
Answering yourquestion/resolving your
issue
Being informative
Being professional
Being courteous and polite
Their overall manner
Satisfaction with operator at telephone enquiry service
Satisfaction with election officials at polling place
%
Indicates result is statistically greater than satisfaction with officials at polling place
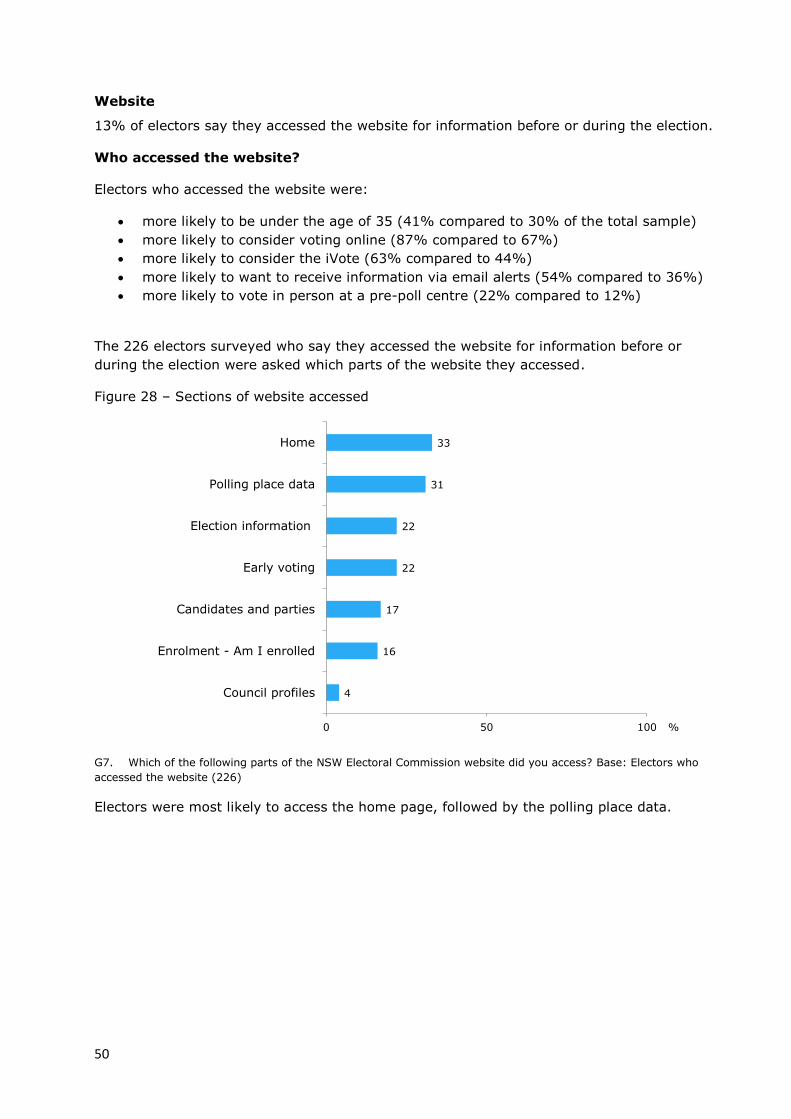
50
Website
13% of electors say they accessed the website for information before or during the election.
Who accessed the website?
Electors who accessed the website were:
more likely to be under the age of 35 (41% compared to 30% of the total sample)
more likely to consider voting online (87% compared to 67%)
more likely to consider the iVote (63% compared to 44%)
more likely to want to receive information via email alerts (54% compared to 36%)
more likely to vote in person at a pre-poll centre (22% compared to 12%)
The 226 electors surveyed who say they accessed the website for information before or
during the election were asked which parts of the website they accessed.
Figure 28 – Sections of website accessed
G7. Which of the following parts of the NSW Electoral Commission website did you access? Base: Electors who
accessed the website (226)
Electors were most likely to access the home page, followed by the polling place data.
4
16
17
22
22
31
33
0 50 100
Council profiles
Enrolment - Am I enrolled
Candidates and parties
Early voting
Election information
Polling place data
Home
%
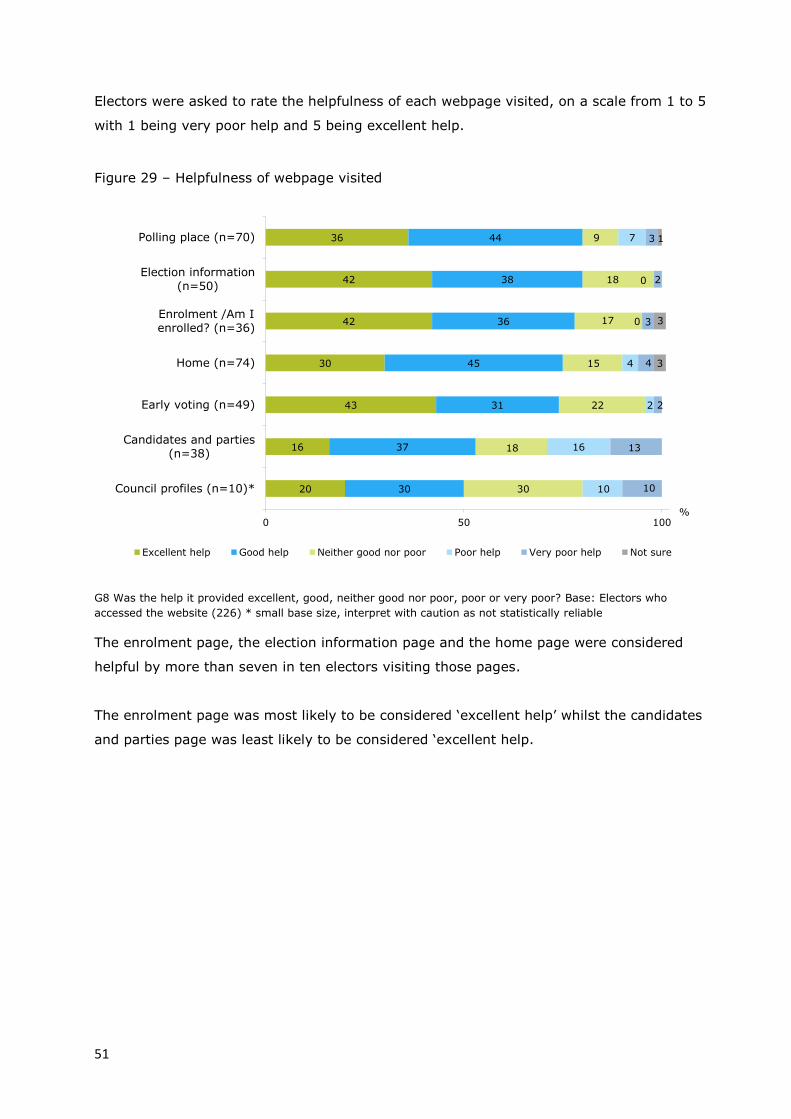
51
Electors were asked to rate the helpfulness of each webpage visited, on a scale from 1 to 5
with 1 being very poor help and 5 being excellent help.
Figure 29 – Helpfulness of webpage visited
G8 Was the help it provided excellent, good, neither good nor poor, poor or very poor? Base: Electors who
accessed the website (226) * small base size, interpret with caution as not statistically reliable
The enrolment page, the election information page and the home page were considered
helpful by more than seven in ten electors visiting those pages.
The enrolment page was most likely to be considered ‘excellent help’ whilst the candidates
and parties page was least likely to be considered ‘excellent help.
20
16
43
30
42
42
36
30
37
31
45
36
38
44
30
18
22
15
17
18
9
10
16
2
4
0
0
7
10
13
2
4
3
2
3
3
3
1
0 50 100
Council profiles (n=10)*
Candidates and parties(n=38)
Early voting (n=49)
Home (n=74)
Enrolment /Am I
enrolled? (n=36)
Election information
(n=50)
Polling place (n=70)
Excellent help Good help Neither good nor poor Poor help Very poor help Not sure
%
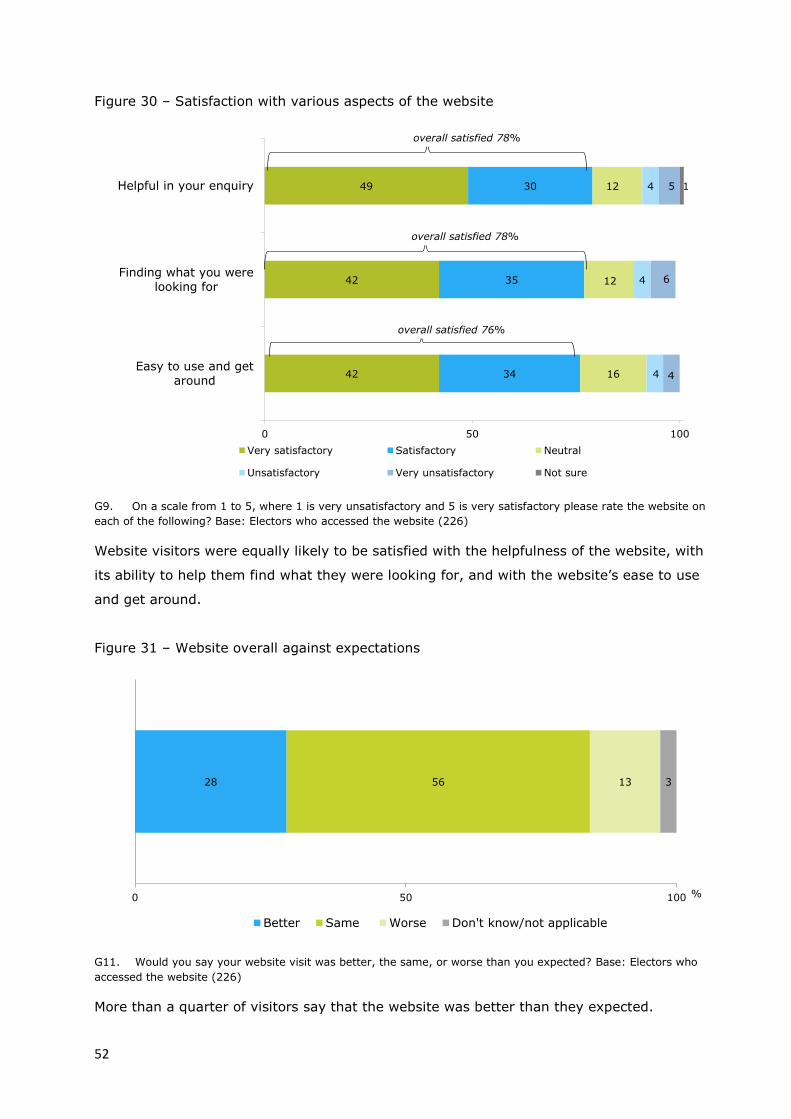
52
Figure 30 – Satisfaction with various aspects of the website
G9. On a scale from 1 to 5, where 1 is very unsatisfactory and 5 is very satisfactory please rate the website on
each of the following? Base: Electors who accessed the website (226)
Website visitors were equally likely to be satisfied with the helpfulness of the website, with
its ability to help them find what they were looking for, and with the website’s ease to use
and get around.
Figure 31 – Website overall against expectations
G11. Would you say your website visit was better, the same, or worse than you expected? Base: Electors who
accessed the website (226)
More than a quarter of visitors say that the website was better than they expected.
42
42
49
34
35
30
16
12
12
4
4
4
4
6
5 1
0 50 100
Easy to use and getaround
Finding what you werelooking for
Helpful in your enquiry
Very satisfactory Satisfactory Neutral
Unsatisfactory Very unsatisfactory Not sure
overall satisfied 78%
overall satisfied 78%
overall satisfied 76%
28 56 13 3
0 50 100
Better Same Worse Don't know/not applicable
%
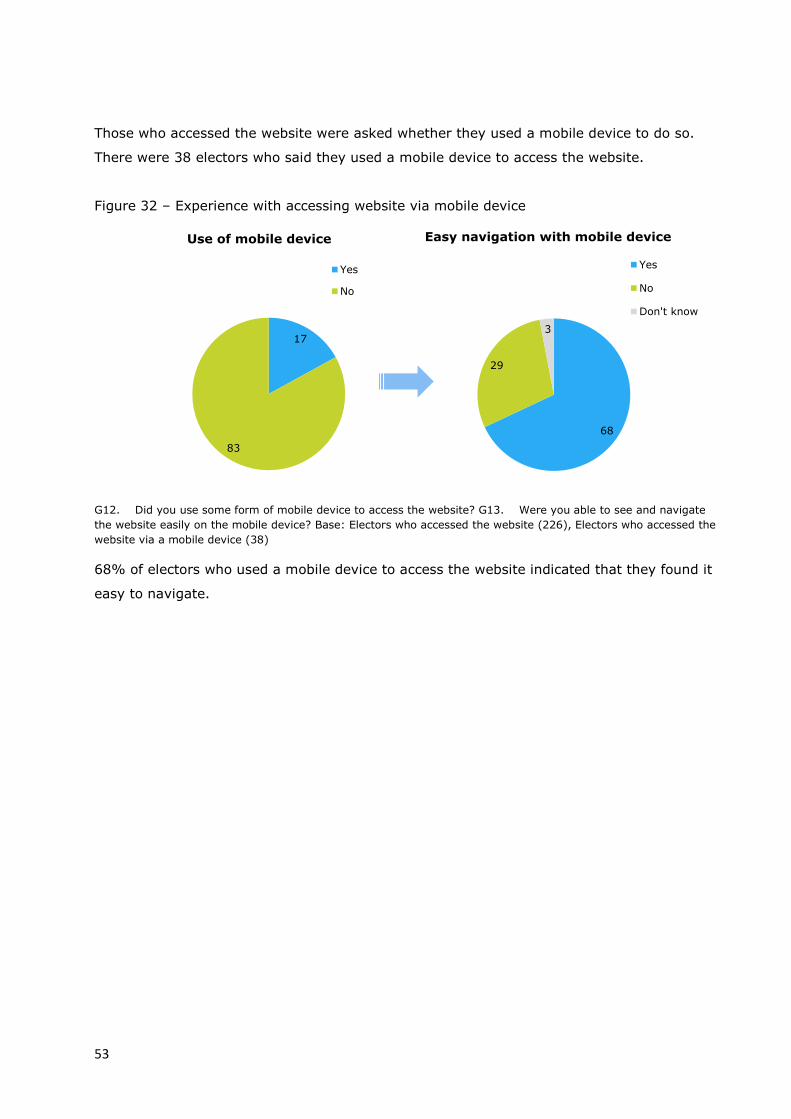
53
Those who accessed the website were asked whether they used a mobile device to do so.
There were 38 electors who said they used a mobile device to access the website.
Figure 32 – Experience with accessing website via mobile device
G12. Did you use some form of mobile device to access the website? G13. Were you able to see and navigate
the website easily on the mobile device? Base: Electors who accessed the website (226), Electors who accessed the
website via a mobile device (38)
68% of electors who used a mobile device to access the website indicated that they found it
easy to navigate.
17
83
Use of mobile device
Yes
No
68
29
3
Easy navigation with mobile device
Yes
No
Don't know
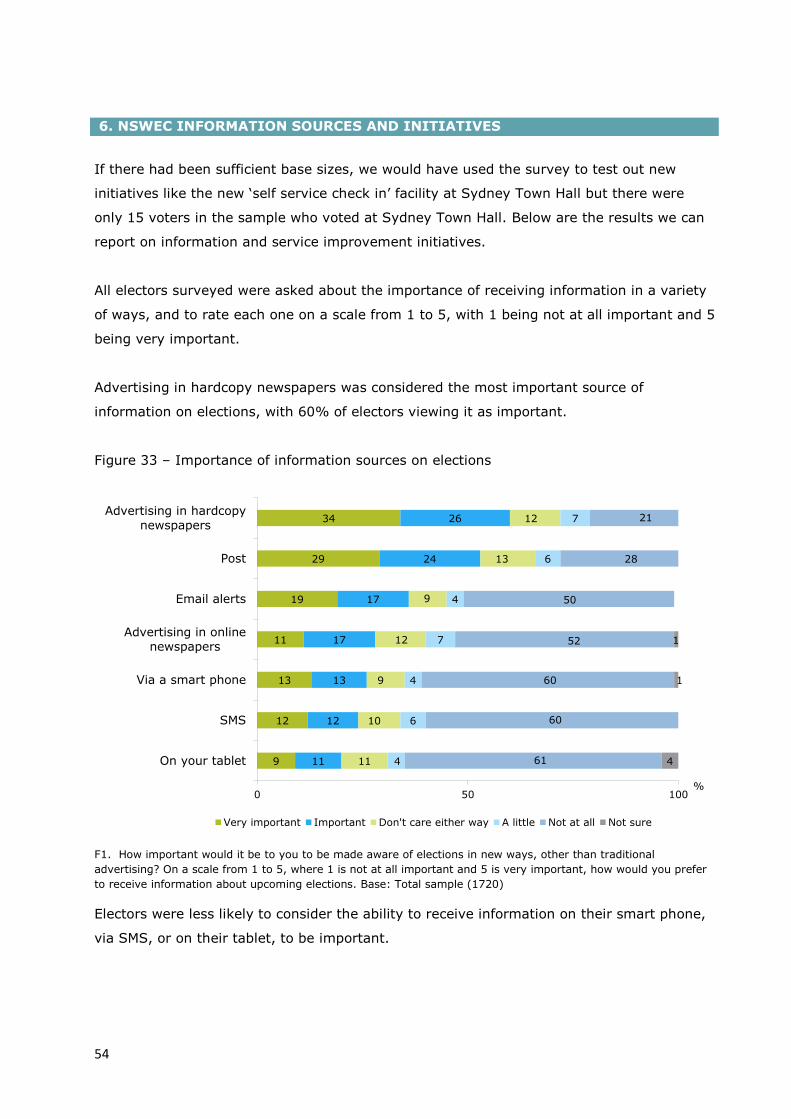
54
If there had been sufficient base sizes, we would have used the survey to test out new
initiatives like the new ‘self service check in’ facility at Sydney Town Hall but there were
only 15 voters in the sample who voted at Sydney Town Hall. Below are the results we can
report on information and service improvement initiatives.
All electors surveyed were asked about the importance of receiving information in a variety
of ways, and to rate each one on a scale from 1 to 5, with 1 being not at all important and 5
being very important.
Advertising in hardcopy newspapers was considered the most important source of
information on elections, with 60% of electors viewing it as important.
Figure 33 – Importance of information sources on elections
F1. How important would it be to you to be made aware of elections in new ways, other than traditional
advertising? On a scale from 1 to 5, where 1 is not at all important and 5 is very important, how would you prefer
to receive information about upcoming elections. Base: Total sample (1720)
Electors were less likely to consider the ability to receive information on their smart phone,
via SMS, or on their tablet, to be important.
9
12
13
11
19
29
34
11
12
13
17
17
24
26
11
10
9
12
9
13
12
4
6
4
7
4
6
7
61
60
60
52
50
28
21
4
1
1
0 50 100
On your tablet
SMS
Via a smart phone
Advertising in onlinenewspapers
Email alerts
Post
Advertising in hardcopynewspapers
Very important Important Don't care either way A little Not at all Not sure
%
6. NSWEC INFORMATION SOURCES AND INITIATIVES
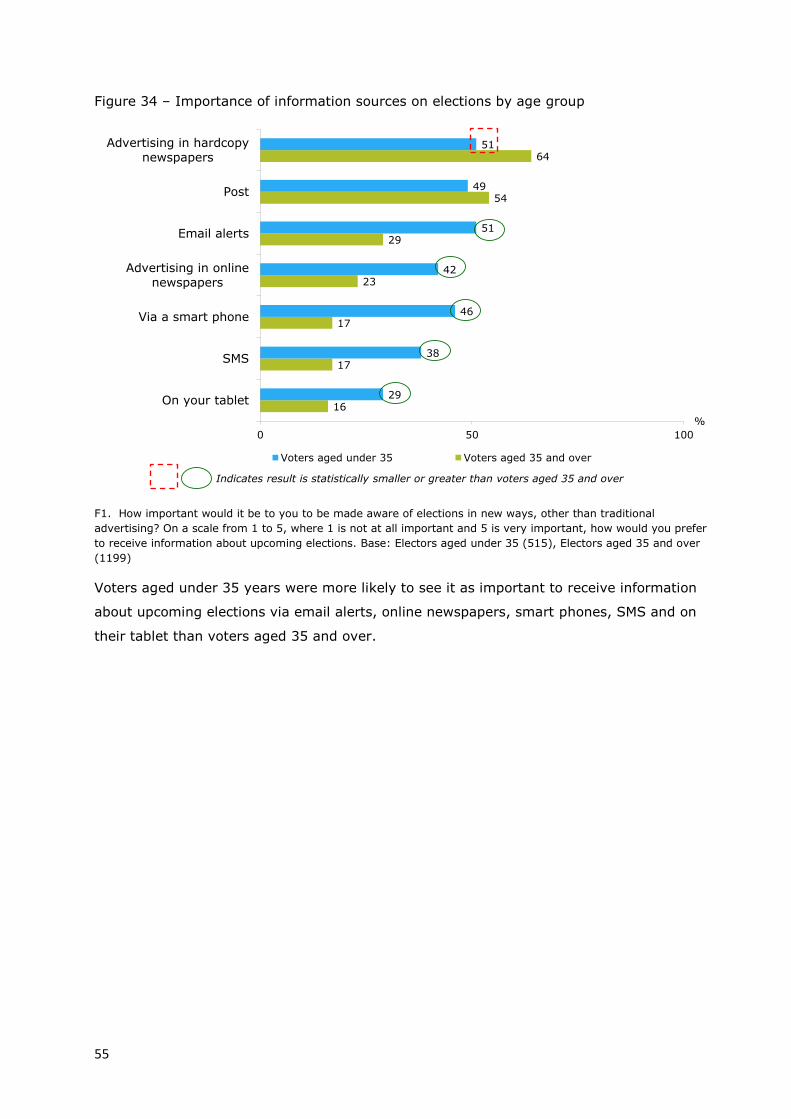
55
Figure 34 – Importance of information sources on elections by age group
F1. How important would it be to you to be made aware of elections in new ways, other than traditional
advertising? On a scale from 1 to 5, where 1 is not at all important and 5 is very important, how would you prefer
to receive information about upcoming elections. Base: Electors aged under 35 (515), Electors aged 35 and over
(1199)
Voters aged under 35 years were more likely to see it as important to receive information
about upcoming elections via email alerts, online newspapers, smart phones, SMS and on
their tablet than voters aged 35 and over.
16
17
17
23
29
54
64
29
38
46
42
51
49
51
0 50 100
On your tablet
SMS
Via a smart phone
Advertising in onlinenewspapers
Email alerts
Post
Advertising in hardcopy
newspapers
Voters aged under 35 Voters aged 35 and over
%
Indicates result is statistically smaller or greater than voters aged 35 and over
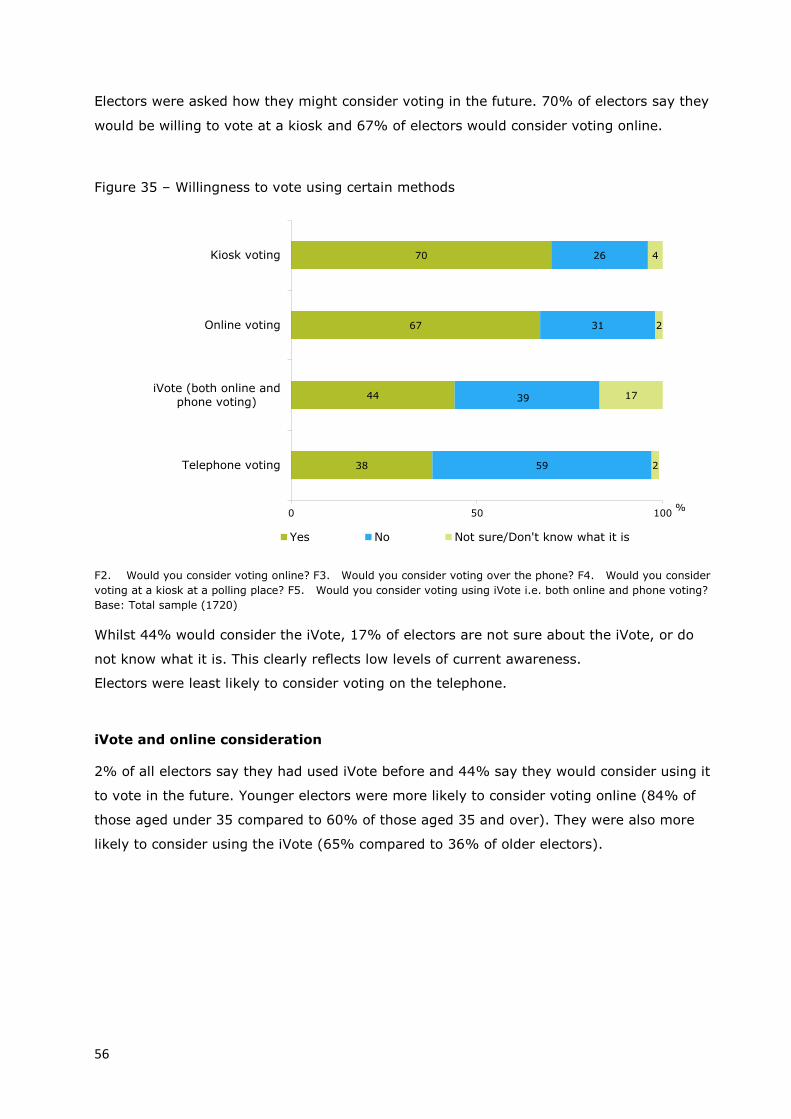
56
Electors were asked how they might consider voting in the future. 70% of electors say they
would be willing to vote at a kiosk and 67% of electors would consider voting online.
Figure 35 – Willingness to vote using certain methods
F2. Would you consider voting online? F3. Would you consider voting over the phone? F4. Would you consider
voting at a kiosk at a polling place? F5. Would you consider voting using iVote i.e. both online and phone voting?
Base: Total sample (1720)
Whilst 44% would consider the iVote, 17% of electors are not sure about the iVote, or do
not know what it is. This clearly reflects low levels of current awareness.
Electors were least likely to consider voting on the telephone.
iVote and online consideration
2% of all electors say they had used iVote before and 44% say they would consider using it
to vote in the future. Younger electors were more likely to consider voting online (84% of
those aged under 35 compared to 60% of those aged 35 and over). They were also more
likely to consider using the iVote (65% compared to 36% of older electors).
38
44
67
70
59
39
31
26
2
17
2
4
0 50 100
Telephone voting
iVote (both online andphone voting)
Online voting
Kiosk voting
Yes No Not sure/Don't know what it is
%
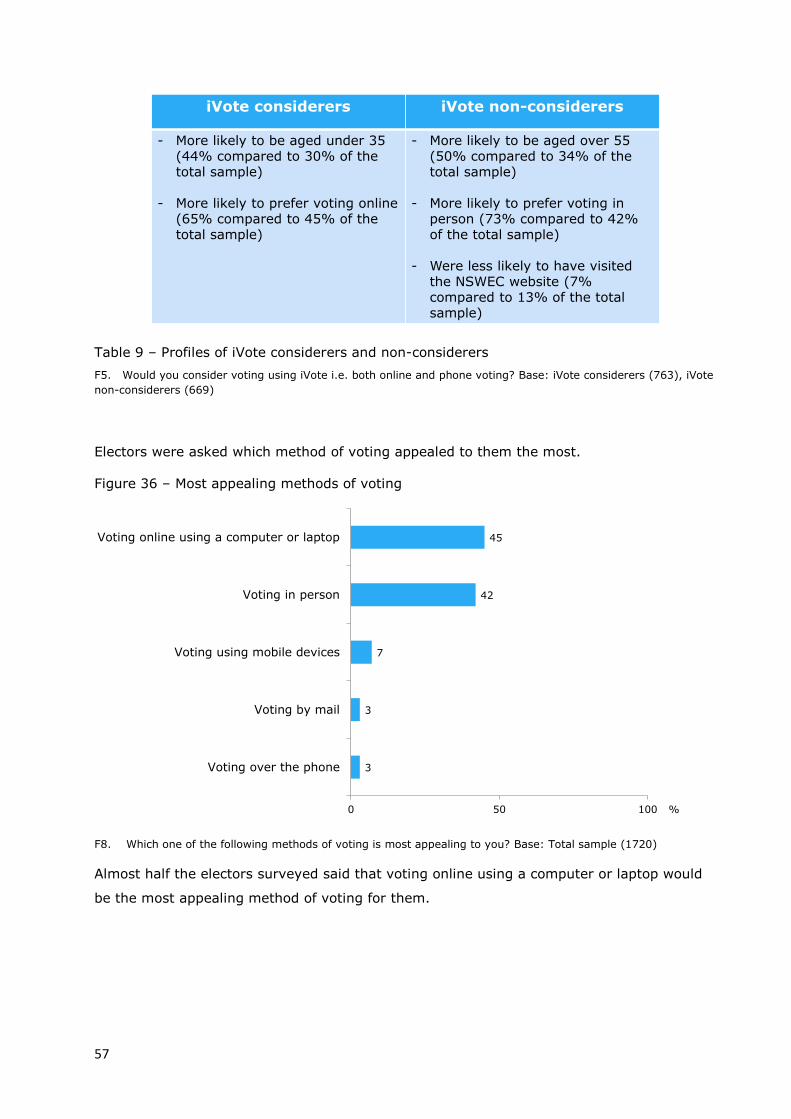
57
Table 9 – Profiles of iVote considerers and non-considerers
F5. Would you consider voting using iVote i.e. both online and phone voting? Base: iVote considerers (763), iVote
non-considerers (669)
Electors were asked which method of voting appealed to them the most.
Figure 36 – Most appealing methods of voting
F8. Which one of the following methods of voting is most appealing to you? Base: Total sample (1720)
Almost half the electors surveyed said that voting online using a computer or laptop would
be the most appealing method of voting for them.
iVote considerers iVote non-considerers
- More likely to be aged under 35(44% compared to 30% of the total sample)
- More likely to prefer voting online (65% compared to 45% of the total sample)
- More likely to be aged over 55 (50% compared to 34% of the total sample)
- More likely to prefer voting in person (73% compared to 42% of the total sample)
- Were less likely to have visited the NSWEC website (7% compared to 13% of the total sample)
3
3
7
42
45
0 50 100
Voting over the phone
Voting by mail
Voting using mobile devices
Voting in person
Voting online using a computer or laptop
%

58
Older electors (35 years plus) and younger electors (under 35 years)
Figure 37 – Most appealing methods of voting by age group
F8. Which one of the following methods of voting is most appealing to you? Base: Electors aged under 35 (515),
Electors aged 35 and over (1199)
Younger electors were more likely to find voting online using a computer or laptop to be the
most appealing method of voting.
Electors who did not vote in this election were more likely to find voting over the phone to
be the most appealing method of voting (10% compared to 3%).
Appeal of various information sources and methods of voting to key voter groups
Electors with vision impairment
Electors with vision impairment were less likely to attach importance to information via
email alerts (12% compared to 36% of the total sample), via smart phone (6% compared
to 25%), on their tablet (6% compared to 20% of the total sample) and SMS (8% versus
23%). However, they were significantly more likely to value the post to receive information
about upcoming elections (75% compared to 53%). Whilst online voting may work for
broader audiences, 61% of vision impaired voters prefer voting in person, followed by mail
at 18%. Only 25% of vision impaired voters would consider voting online (compared to 67%
of the total sample).
3
5
4
48
40
3
1
13
27
57
0 50 100
Voting over the phone
Voting by mail
Voting using mobile devices
Voting in person
Voting online using a computer or laptop
Younger electors Older electors
%
Indicates result is statistically smaller or greater than voters aged 35 and over
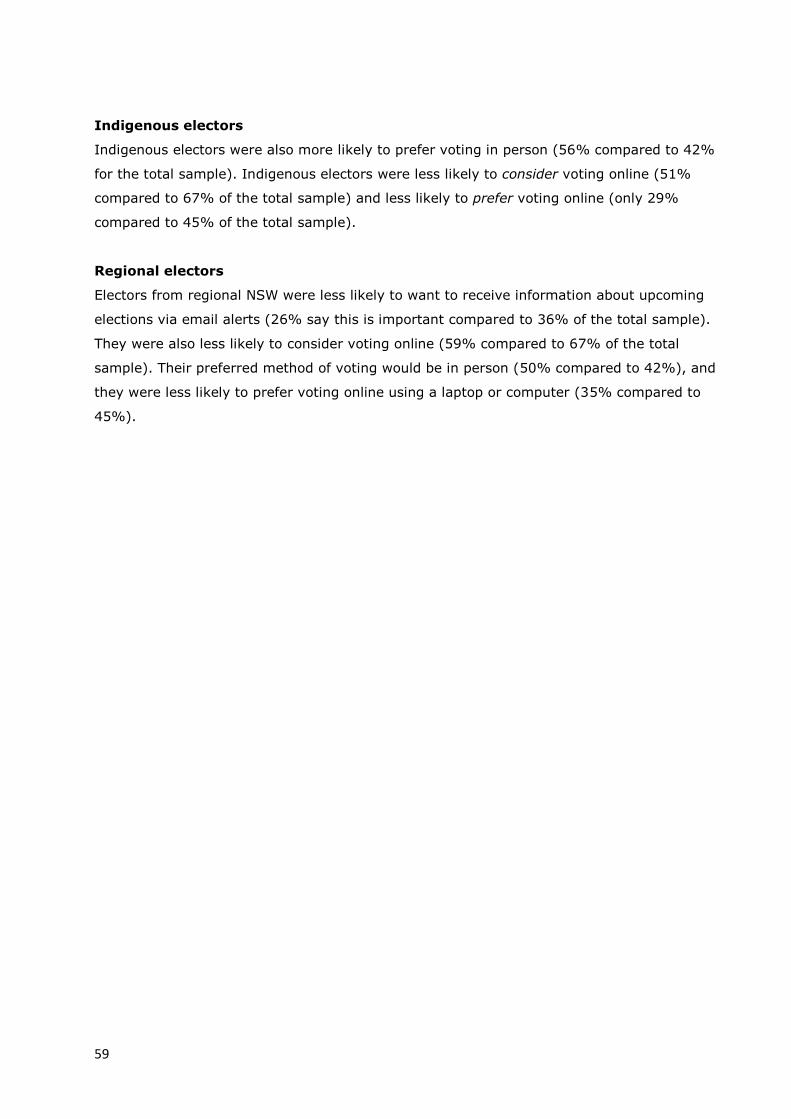
59
Indigenous electors
Indigenous electors were also more likely to prefer voting in person (56% compared to 42%
for the total sample). Indigenous electors were less likely to consider voting online (51%
compared to 67% of the total sample) and less likely to prefer voting online (only 29%
compared to 45% of the total sample).
Regional electors
Electors from regional NSW were less likely to want to receive information about upcoming
elections via email alerts (26% say this is important compared to 36% of the total sample).
They were also less likely to consider voting online (59% compared to 67% of the total
sample). Their preferred method of voting would be in person (50% compared to 42%), and
they were less likely to prefer voting online using a laptop or computer (35% compared to
45%).

60
Reasons for not wanting to vote online
Electors who said they were not willing to vote online were asked what would hold them
back from voting online.
Figure 38 – Reasons for not wanting to vote online
F7. What would hold you back from voting online? Base: Those who would not vote online (534)
Of the 31% of electors who would not consider online voting, the main reasons given were
privacy concerns, not being computer literate or confident with a computer (for some, not
having access to a computer to the internet), fear of results manipulation, and concerns
about hacking and viruses.
8
2
1
4
4
24
25
40
40
0 50 100
Don't know/not sure
Other
Poor eyesight on computer
Prefer hardcopy paper/the old ways
Enjoy the outing to the polling place/
Social and community event
Concerns about hacking/viruses
Results manipulation
Not literate or confident with computer/
No access to internet
Privacy issues
%

61
Social media
Electors were asked whether they would personally consider using social media to access
information about upcoming elections.
Figure 39 – Consideration of use of social media for information about the election
F9. Thinking about the use of social media and electronic communications; which of the following ways of getting
information about elections being conducted by the NSW Electoral Commission would you personally consider
using? Base: Total sample (1720)
38% of electors say they would consider using online newspapers to get information about
elections.
Also popular are Facebook, YouTube, and blogs and community forums.
Only one in twenty would consider using Twitter.
3
5
14
17
21
38
0 50 100
Other
Blogs and community forums
YouTube
Online newspapers
%

62
Appeal of social media by age
Figure 40 – Consideration of use of social media by age
F9. Thinking about the use of social media and electronic communications; which of the following ways of getting
information about elections being conducted by the NSW Electoral Commission would you personally consider
using? Base: Electors aged under 35 (515), Electors aged 35 and over (1199)
Younger electors (under 35 years of age) were more likely to consider online newspapers,
Facebook, YouTube and blogs and community forums as ways of getting information about
NSWEC administered elections.
4
3
9
9
13
31
3
10
26
34
42
55
0 50 100
Other
Blogs and community forums
YouTube
Online newspapers
Younger electors Older electors
%
Indicates result is statistically smaller or greater than voters aged 35 and over
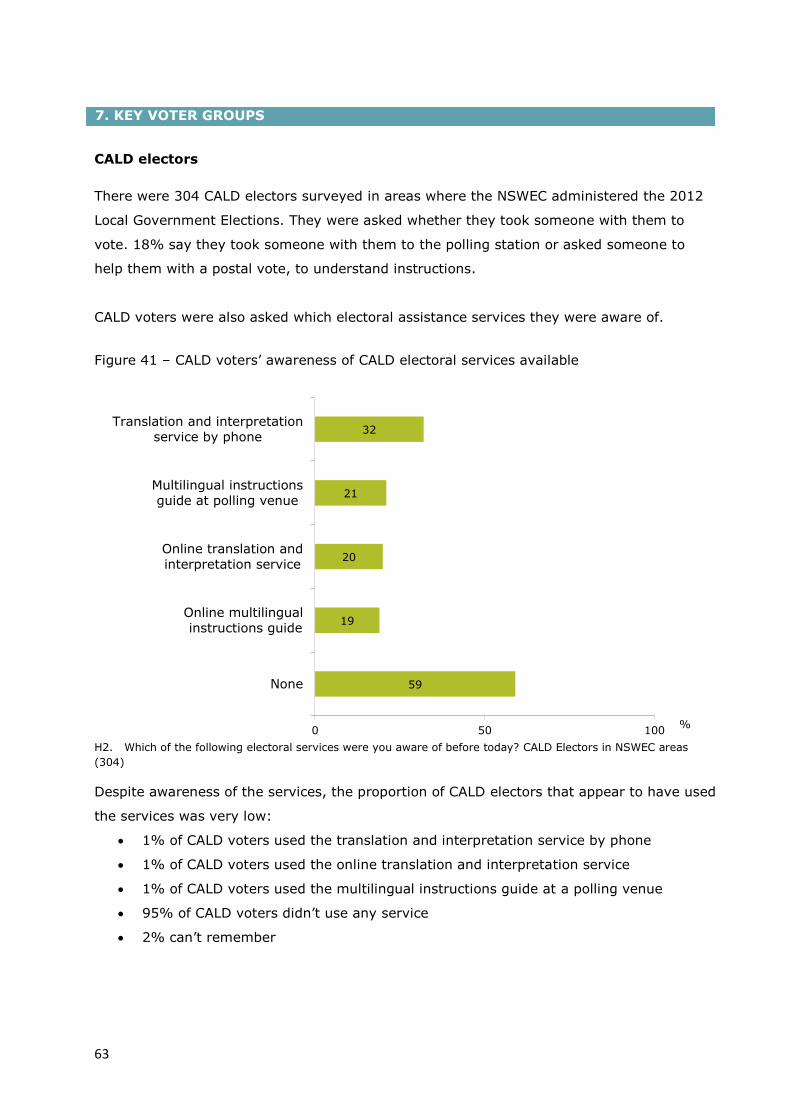
63
CALD electors
There were 304 CALD electors surveyed in areas where the NSWEC administered the 2012
Local Government Elections. They were asked whether they took someone with them to
vote. 18% say they took someone with them to the polling station or asked someone to
help them with a postal vote, to understand instructions.
CALD voters were also asked which electoral assistance services they were aware of.
Figure 41 – CALD voters’ awareness of CALD electoral services available
H2. Which of the following electoral services were you aware of before today? CALD Electors in NSWEC areas
(304)
Despite awareness of the services, the proportion of CALD electors that appear to have used
the services was very low:
1% of CALD voters used the translation and interpretation service by phone
1% of CALD voters used the online translation and interpretation service
1% of CALD voters used the multilingual instructions guide at a polling venue
95% of CALD voters didn’t use any service
2% can’t remember
59
19
20
21
32
0 50 100
None
Online multilingual
instructions guide
Online translation andinterpretation service
Multilingual instructionsguide at polling venue
Translation and interpretationservice by phone
%
7. KEY VOTER GROUPS

64
Four CALD electors say they used the translation and interpretation service by phone. Three
used the online translation and interpretation service. Two used the multilingual instructions
guide at a polling venue and one used the online multilingual instructions guide.
Visually impaired electors
There were 51 electors with vision impairment taking part in the survey. Electors with vision
impairment were asked whether they asked for help. 45% of electors with a vision
impairment say they took someone with them to help them at the polling station or with a
postal vote or Braille ballot papers and voting.
Figure 42 – Vision impaired electors’ awareness of services available
H3. For this election, which of the following services did you use, if any? Vision Impaired Voters in NSWEC areas
(51)
Seven of the 51 vision impaired voters used the magnifying glasses. One vision impaired
voter used the Braille voting service and one vision impaired voter used a maxi pencil.
Mobility restrictions
There were 64 electors with mobility restrictions taking part in the survey. They were asked
whether they took someone with them to vote or asked for help and whether they checked
the accessibility of the polling place in any way.
25% of electors with mobility restrictions took someone with them to the polling
station or asked for help
25% checked the accessibility of the polling place
71
2
2
2
14
0 50
None
Braille voting
instructions and ballot papers
Information on Braille voting
Braille votinginstructions and ballot papers
Hand held magnifiersguide at polling venue
%

65
Figure 43 – Electors with mobility restrictions’ satisfaction with services available
H10. On a scale from 1 to 5, with 1 being very unsatisfactory and 5 being very satisfactory, please rate how
satisfied you were overall with…? Electors with mobility restrictions n=64
Over half the electors with mobility restrictions were satisfied with information on the
accessibility of the polling place (55%), with 36% giving a rating of very satisfactory. 38%
were satisfied with the wheelchair accessibility screen. Around a third answered ‘not sure’,
suggesting that they may not have used these services.
30
36
30
36
8
8
14
19
16
9
14
8
3
2
5
3
3
5
3
6
41
41
34
28
0 50 100
Wheelchair accessibilityscreen
Actual wheelchairaccess on the day
Information onwheelchair access
Information on theaccessibility of the
polling place
Very satisfactory Satisfactory Neutral
Unsatisfactory Very unsatisfactory Not sure
overall satisfied 55%
overall satisfied 44%
overall satisfied 44%
overall satisfied 38%
%
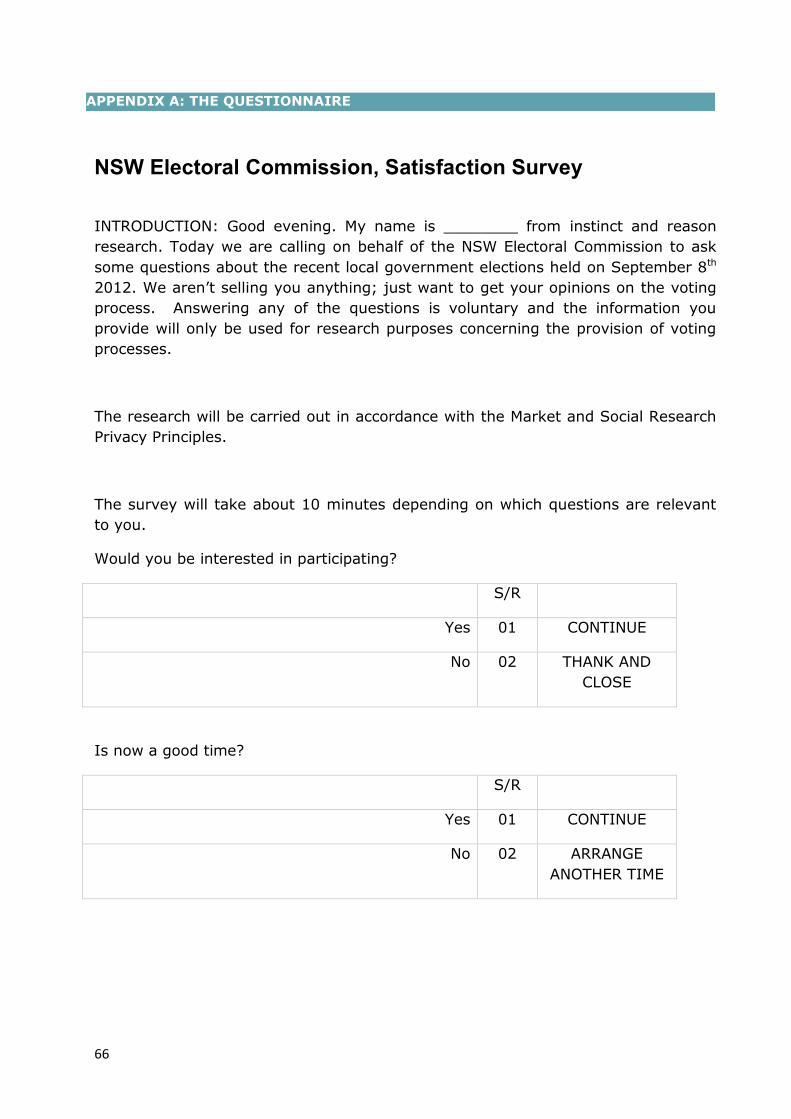
66
NSW Electoral Commission, Satisfaction Survey
INTRODUCTION: Good evening. My name is ________ from instinct and reason
research. Today we are calling on behalf of the NSW Electoral Commission to ask
some questions about the recent local government elections held on September 8th
2012. We aren’t selling you anything; just want to get your opinions on the voting
process. Answering any of the questions is voluntary and the information you
provide will only be used for research purposes concerning the provision of voting
processes.
The research will be carried out in accordance with the Market and Social Research
Privacy Principles.
The survey will take about 10 minutes depending on which questions are relevant
to you.
Would you be interested in participating?
S/R
Yes 01 CONTINUE
No 02 THANK AND
CLOSE
Is now a good time?
S/R
Yes 01 CONTINUE
No 02 ARRANGE
ANOTHER TIME
APPENDIX A: THE QUESTIONNAIRE
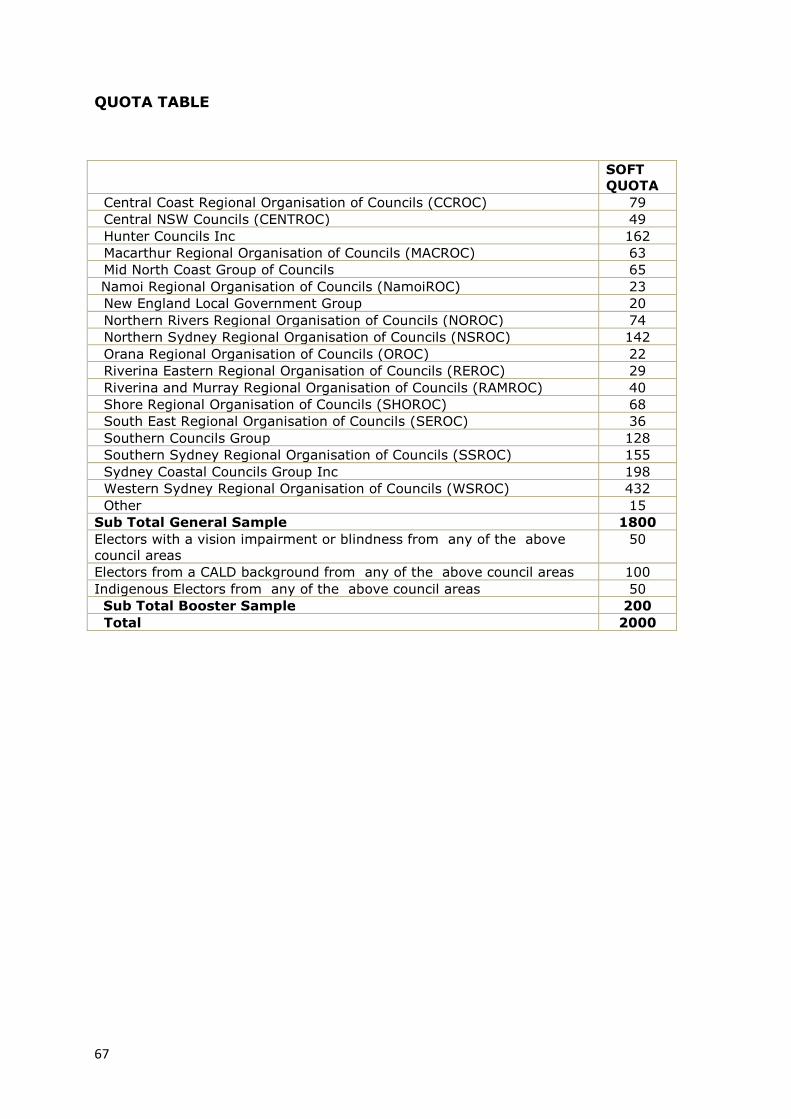
67
QUOTA TABLE
Council LGAs SOFT
QUOTA
Central Coast Regional Organisation of Councils (CCROC) 79
Central NSW Councils (CENTROC) 49
Hunter Councils Inc 162
Macarthur Regional Organisation of Councils (MACROC) 63
Mid North Coast Group of Councils 65
Namoi Regional Organisation of Councils (NamoiROC) 23
New England Local Government Group 20
Northern Rivers Regional Organisation of Councils (NOROC) 74
Northern Sydney Regional Organisation of Councils (NSROC) 142
Orana Regional Organisation of Councils (OROC) 22
Riverina Eastern Regional Organisation of Councils (REROC) 29
Riverina and Murray Regional Organisation of Councils (RAMROC) 40
Shore Regional Organisation of Councils (SHOROC) 68
South East Regional Organisation of Councils (SEROC) 36
Southern Councils Group 128
Southern Sydney Regional Organisation of Councils (SSROC) 155
Sydney Coastal Councils Group Inc 198
Western Sydney Regional Organisation of Councils (WSROC) 432
Other 15
Sub Total General Sample 1800
Electors with a vision impairment or blindness from any of the above
council areas
50
Electors from a CALD background from any of the above council areas 100
Indigenous Electors from any of the above council areas 50
Sub Total Booster Sample 200
Total 2000
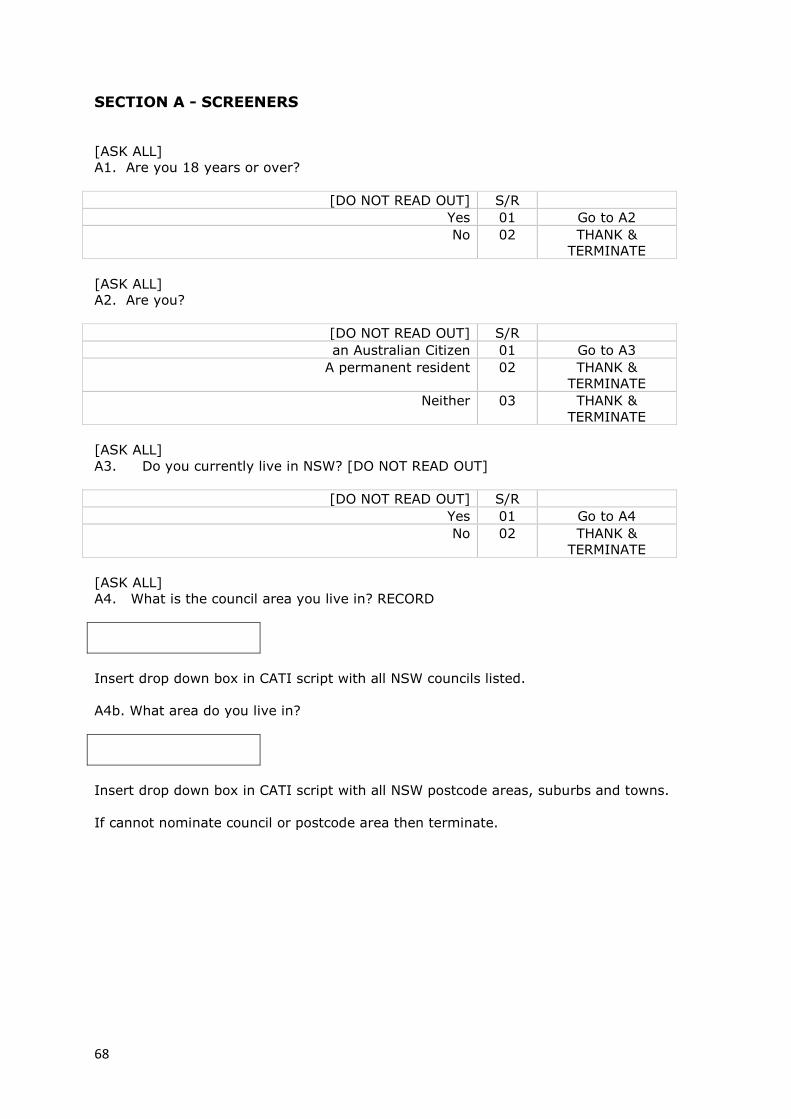
68
SECTION A - SCREENERS
[ASK ALL]
A1. Are you 18 years or over?
[DO NOT READ OUT] S/R
Yes 01 Go to A2
No 02 THANK &
TERMINATE
[ASK ALL]
A2. Are you?
[DO NOT READ OUT] S/R
an Australian Citizen 01 Go to A3
A permanent resident 02 THANK &
TERMINATE
Neither 03 THANK &
TERMINATE
[ASK ALL]
A3. Do you currently live in NSW? [DO NOT READ OUT]
[DO NOT READ OUT] S/R
Yes 01 Go to A4
No 02 THANK &
TERMINATE
[ASK ALL]
A4. What is the council area you live in? RECORD
Insert drop down box in CATI script with all NSW councils listed.
A4b. What area do you live in?
Insert drop down box in CATI script with all NSW postcode areas, suburbs and towns.
If cannot nominate council or postcode area then terminate.

69
A5. INTERVIEWER MAKE RECORD OF COUNCIL USING MATCHED LIST
[DO NOT READ OUT] RECORD SoftQuotas
Central Coast Regional Organisation of Councils (CCROC) 01 79
Central NSW Councils (CENTROC) 02 49
Hunter Councils Inc 03 162
Macarthur Regional Organisation of Councils (MACROC) 04 63
Mid North Coast Group of Councils 05 65
Namoi Regional Organisation of Councils (NamoiROC)
07 23
New England Local Government Group 08 20
Northern Rivers Regional Organisation of Councils (NOROC) 09 74
Northern Sydney Regional Organisation of Councils
(NSROC)
10 142
Orana Regional Organisation of Councils (OROC) 11 22
Riverina Eastern Regional Organisation of Councils (REROC) 12 29
Riverina and Murray Regional Organisation of Councils
(RAMROC)
13 40
Shore Regional Organisation of Councils (SHOROC) 14 68
South East Regional Organisation of Councils (SEROC) 15 36
Southern Councils Group 16 128
Southern Sydney Regional Organisation of Councils
(SSROC)
17 155
Sydney Coastal Councils Group Inc 18 198
Western Sydney Regional Organisation of Councils
(WSROC)
19 432
Other 20 15
Total 1800
[ASK ALL]
A6. Do you speak a language other than English at home?
[DO NOT READ OUT] S/R Quota
Yes 01 n=100
No 02 n=1900
[ASK ALL]
A7. Are you an Aboriginal or Torres Strait Islander?
[DO NOT READ OUT] S/R Quota
Yes 01 n=50
No 02 n=1950
Prefer not to say 03 Continue code
with ‘no’
[ASK ALL]
A8. Do any of the following conditions or situations apply to you?
[READ OUT] S/R Quota
Blindness or vision impairment 01 n=50
Hearing impairment, including deafness 02 No minimum
quota
restrictions, just
as data falls
Mobility Restrictions 03
I have another disability that makes it difficult to get to
a polling place on election day? [Please Specify]
04
I find it difficult to read 05 Continue
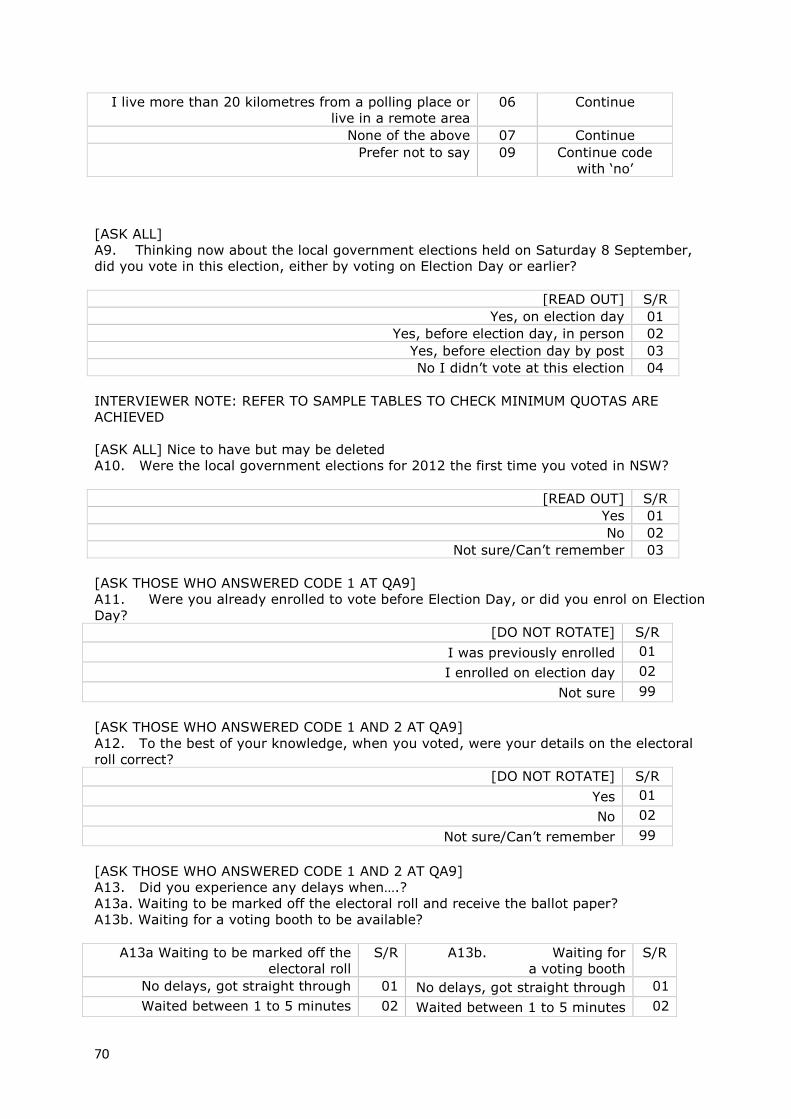
70
I live more than 20 kilometres from a polling place or
live in a remote area
06 Continue
None of the above 07 Continue
Prefer not to say 09 Continue code
with ‘no’
[ASK ALL]
A9. Thinking now about the local government elections held on Saturday 8 September,
did you vote in this election, either by voting on Election Day or earlier?
[READ OUT] S/R
Yes, on election day 01
Yes, before election day, in person 02
Yes, before election day by post 03
No I didn’t vote at this election 04
INTERVIEWER NOTE: REFER TO SAMPLE TABLES TO CHECK MINIMUM QUOTAS ARE
ACHIEVED
[ASK ALL] Nice to have but may be deleted
A10. Were the local government elections for 2012 the first time you voted in NSW?
[READ OUT] S/R
Yes 01
No 02
Not sure/Can’t remember 03
[ASK THOSE WHO ANSWERED CODE 1 AT QA9]
A11. Were you already enrolled to vote before Election Day, or did you enrol on Election
Day?
[DO NOT ROTATE] S/R
I was previously enrolled 01
I enrolled on election day 02
Not sure 99
[ASK THOSE WHO ANSWERED CODE 1 AND 2 AT QA9]
A12. To the best of your knowledge, when you voted, were your details on the electoral
roll correct?
[DO NOT ROTATE] S/R
Yes 01
No 02
Not sure/Can’t remember 99
[ASK THOSE WHO ANSWERED CODE 1 AND 2 AT QA9]
A13. Did you experience any delays when….?
A13a. Waiting to be marked off the electoral roll and receive the ballot paper?
A13b. Waiting for a voting booth to be available?
A13a Waiting to be marked off the
electoral roll
S/R A13b. Waiting for
a voting booth
S/R
No delays, got straight through 01 No delays, got straight through 01
Waited between 1 to 5 minutes 02 Waited between 1 to 5 minutes 02
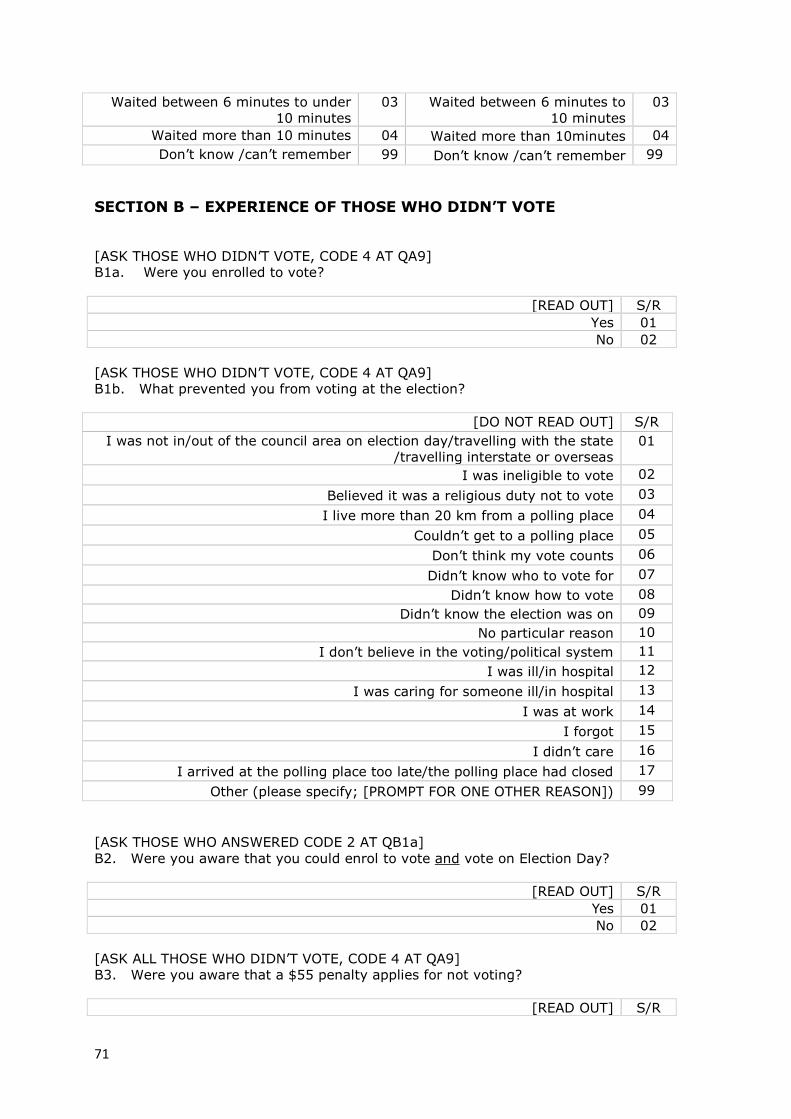
71
Waited between 6 minutes to under
10 minutes
03 Waited between 6 minutes to
10 minutes
03
Waited more than 10 minutes 04 Waited more than 10minutes 04
Don’t know /can’t remember 99 Don’t know /can’t remember 99
SECTION B – EXPERIENCE OF THOSE WHO DIDN’T VOTE
[ASK THOSE WHO DIDN’T VOTE, CODE 4 AT QA9]
B1a. Were you enrolled to vote?
[READ OUT] S/R
Yes 01
No 02
[ASK THOSE WHO DIDN’T VOTE, CODE 4 AT QA9]
B1b. What prevented you from voting at the election?
[DO NOT READ OUT] S/R
I was not in/out of the council area on election day/travelling with the state
/travelling interstate or overseas
01
I was ineligible to vote 02
Believed it was a religious duty not to vote 03
I live more than 20 km from a polling place 04
Couldn’t get to a polling place 05
Don’t think my vote counts 06
Didn’t know who to vote for 07
Didn’t know how to vote 08
Didn’t know the election was on 09
No particular reason 10
I don’t believe in the voting/political system 11
I was ill/in hospital 12
I was caring for someone ill/in hospital 13
I was at work 14
I forgot 15
I didn’t care 16
I arrived at the polling place too late/the polling place had closed 17
Other (please specify; [PROMPT FOR ONE OTHER REASON]) 99
[ASK THOSE WHO ANSWERED CODE 2 AT QB1a]
B2. Were you aware that you could enrol to vote and vote on Election Day?
[READ OUT] S/R
Yes 01
No 02
[ASK ALL THOSE WHO DIDN’T VOTE, CODE 4 AT QA9]
B3. Were you aware that a $55 penalty applies for not voting?
[READ OUT] S/R

72
Yes 01
No 02
[ASK THOSE WHO WEREN’T AWARE OF THE FINE AT B3, CODE 2]
B3b. If you had been aware of the $55 fine would you have voted?
[READ OUT] S/R
Yes 01
No 02
SECTION C – EXPERIENCE OF THOSE WHO VOTED BEFORE ELECTION DAY
[ASK THOSE WHO VOTED PRIOR TO ELECTION DAY, CODE 2 AT QA9]
C1. In which way did you vote before Election Day in person?
[DO NOT ROTATE] S/R
At Sydney Town Hall 01
At a pre-poll centre within NSW 02
By post/mail 03
Other (please specify e.g. aged care facility…………………………………………) 09
[DO NOT READ OUT] Can’t remember/don’t know 09
[ASK THOSE WHO VOTED PRIOR TO ELECTION DAY, CODE 2 OR 3 AT QA9]
C2. What are the reasons you decided to opt to vote pre-poll this election?
[ROTATE] M/R
Travelling within the state 01
Travelling interstate 02
Travelling overseas 03
I live more than 20 km from a polling place 04
Ill, or pregnant 05
Caring for someone who was ill, or pregnant 06
Hospitalised 07
Religious beliefs 08
Silent elector 09
Fear for my safety 10
Unable to leave work 11
More convenient 12
Disability that prevented me going 13
Other [PROMPT ONCE FOR OTHER REASONS- Please specify _______ 98
Can’t remember/don’t know 99
Pre poll
[ASK THOSE WHO VOTED PRE-POLL, CODES 2 or 3AT QA9]
C3. Please rate the following, on a scale from 1 to 5, with 1 being very unsatisfactory and
5 being very satisfactory:
ROTATE CODES A-D [READ OUT] S/R per row
A Location of pre-poll voting facility 01 02 03 04 05 99
B Time taken to cast a pre-poll vote 01 02 03 04 05 99
C Accessibility of pre-poll voting centre 01 02 03 04 05 99
D Information about pre-poll voting 01 02 03 04 05 99
E Helpfulness of election officials 01 02 03 04 05 99

73
[ASK THOSE WHO VOTED BY POST, CODE 3 AT QC1]
C4. Please rate the following, on a scale from 1 to 5, with 1 being very unsatisfactory and
5 being very satisfactory:
ROTATE CODES A-C[READ OUT] S/R per row
A Information about postal voting 01 02 03 04 05 99
B The length of time between applying and
getting the papers
01 02 03 04 05 99
C Instructions on how to complete the ballot
papers and declaration envelope
01 02 03 04 05 99
Section D–THOSE WHO VOTED ON ELECTION DAY
[ASK THOSE WHO ANSWERED CODE 1 AT QA9]
D1. Where did you vote on Election Day?
[READ OUT DO NOT ROTATE; STOP WHEN ANSWER GIVEN] S/R
At a local polling place 01
At Sydney Town Hall 02
Other (please specify e.g. hospital…………………………………………) 09
Don’t know 99
SECTION E–GENERAL SATISFACTION WITH VOTING PROCESS
For all that voted either before or on Election Day
[ASK ALL WHO ANSWERED CODES 1 OR 2 OR 3 AT QA9]
E1. Please rate the overall process of voting, on a scale from 1 to 5, with 1 being very
unsatisfactory and 5 being very satisfactory?
[READ OUT CODES 01-05] S/R
Very Satisfactory 05
Satisfactory 04
Neutral 03
Unsatisfactory 02
Very unsatisfactory 01
[DON’T READ] Don’t know / not applicable 99
[ASK ALL WHO ANSWERED CODES 1 OR 2 OR 3 AT QA9]
E2. Please rate the overall experience you had with the election officials, on a scale from 1
to 5, with 1 being very unsatisfactory and 5 being very satisfactory?
[READ OUT CODES 01-05] S/R
Very Satisfactory 05
Satisfactory 04
Neutral 03
Unsatisfactory 02
Very unsatisfactory 01
[DON’T READ] Don’t know / not applicable 99
[ASK ALL WHO ANSWERED CODES 1 OR 2 OR 3 AT QA9]
E3. Please indicate, on a scale from 1 to 5, (where 1 is very unsatisfactory and 5 is very
satisfactory), how satisfied you were with each of the following:

74
[ASK ALL WHO ANSWERED CODES 1 OR 2 AT QA9]
E4. On a scale from 1 to 5, (where 1 is very unsatisfactory, and 5 is very satisfactory),
how would rate your satisfaction with the election officials on each of the following?
SECTIO
N F:
NSW
ELECTO
RAL
COMMIS
SION
INITIAT
IVES
[ASK ALL]
F1. How important would it be to you to be made aware of elections in new ways, other
than traditional advertising? On a scale from 1 to 5, where 1 is not at all important and 5 is
very important, how would you prefer to receive information about upcoming elections.
ROTATE CODES A-I Very
unsati
sfactor
y
Very
satisfa
ctory
Not
sure
or
applica
ble
A. Information available to
locate the polling place
01 02 03 04 05 99
B. Convenience of the voting
or polling location
01 02 03 04 05 99
C. Length of time spent at
the polling place
01 02 03 04 05 99
D. Simplicity of the polling
place layout
01 02 03 04 05 99
E. Ease of entering and
exiting the polling place
01 02 03 04 05 99
F. Ease of the process of
voting (we are not asking about
the ballot paper itself but of the
process you went through)
01 02 03 04 05 99
G. Assistance provided by
election officials
01 02 03 04 05 99
H. Clarity and simplicity of
ballot paper instructions
01 02 03 04 05 99
[ROTATE CODES A-D] Very
unsatis
factory
Very
satis
fact
ory
Not
sure
a. Being informative 01 02 03 04 05 99
b. Being professional 01 02 03 04 05 99
c. Being courteous & polite 01 02 03 04 05 99
d. Their overall manner 01 02 03 04 05 99
e. Answering your question, or
resolving your issue
01 02 03 04 05 99
[ROTATE CODES A-E] Not at
all
A
little
Don’t
care
either
way
Impo
rtant
Very
Impor
tant
Not
sure
what it
is
a. on your tablet 01 02 03 04 05 99
b. via your smart phone 01 02 03 04 05 99
c. email alerts 01 02 03 04 05 99
d. post 01 02 03 04 05 99
e. sms 01 02 03 04 05 99
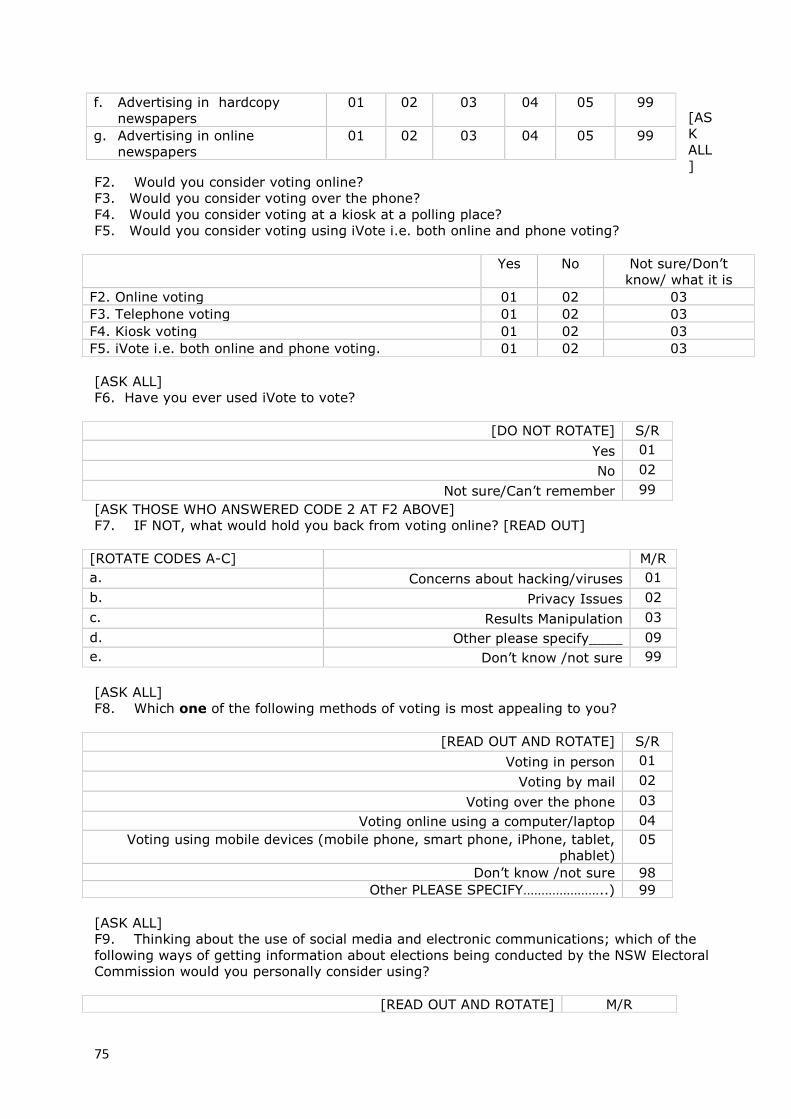
75
[AS
K
ALL
]
F2. Would you consider voting online?
F3. Would you consider voting over the phone?
F4. Would you consider voting at a kiosk at a polling place?
F5. Would you consider voting using iVote i.e. both online and phone voting?
Yes No Not sure/Don’t
know/ what it is
F2. Online voting 01 02 03
F3. Telephone voting 01 02 03
F4. Kiosk voting 01 02 03
F5. iVote i.e. both online and phone voting. 01 02 03
[ASK ALL]
F6. Have you ever used iVote to vote?
[DO NOT ROTATE] S/R
Yes 01
No 02
Not sure/Can’t remember 99
[ASK THOSE WHO ANSWERED CODE 2 AT F2 ABOVE]
F7. IF NOT, what would hold you back from voting online? [READ OUT]
[ROTATE CODES A-C] M/R
a. Concerns about hacking/viruses 01
b. Privacy Issues 02
c. Results Manipulation 03
d. Other please specify____ 09
e. Don’t know /not sure 99
[ASK ALL]
F8. Which one of the following methods of voting is most appealing to you?
[READ OUT AND ROTATE] S/R
Voting in person 01
Voting by mail 02
Voting over the phone 03
Voting online using a computer/laptop 04
Voting using mobile devices (mobile phone, smart phone, iPhone, tablet,
phablet)
05
Don’t know /not sure 98
Other PLEASE SPECIFY…………………..) 99
[ASK ALL]
F9. Thinking about the use of social media and electronic communications; which of the
following ways of getting information about elections being conducted by the NSW Electoral
Commission would you personally consider using?
[READ OUT AND ROTATE] M/R
f. Advertising in hardcopy
newspapers
01 02 03 04 05 99
g. Advertising in online
newspapers
01 02 03 04 05 99
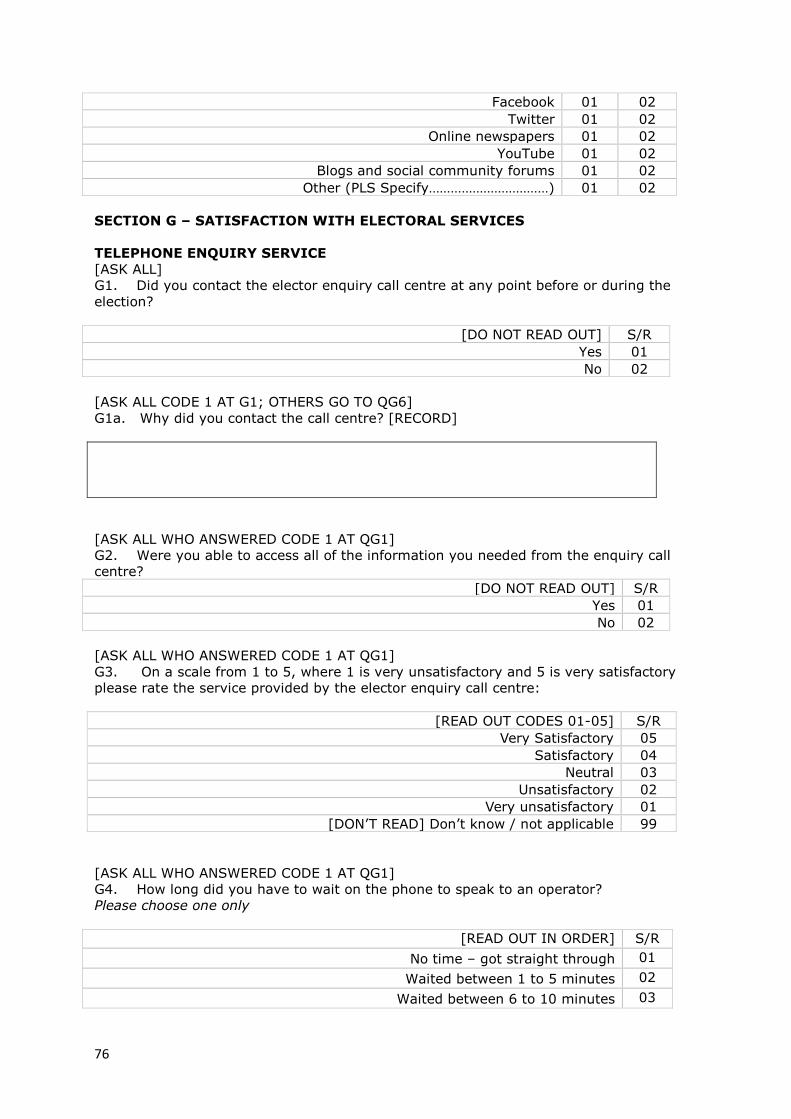
76
Facebook 01 02
Twitter 01 02
Online newspapers 01 02
YouTube 01 02
Blogs and social community forums 01 02
Other (PLS Specify……………………………) 01 02
SECTION G – SATISFACTION WITH ELECTORAL SERVICES
TELEPHONE ENQUIRY SERVICE
[ASK ALL]
G1. Did you contact the elector enquiry call centre at any point before or during the
election?
[DO NOT READ OUT] S/R
Yes 01
No 02
[ASK ALL CODE 1 AT G1; OTHERS GO TO QG6]
G1a. Why did you contact the call centre? [RECORD]
[ASK ALL WHO ANSWERED CODE 1 AT QG1]
G2. Were you able to access all of the information you needed from the enquiry call
centre?
[DO NOT READ OUT] S/R
Yes 01
No 02
[ASK ALL WHO ANSWERED CODE 1 AT QG1]
G3. On a scale from 1 to 5, where 1 is very unsatisfactory and 5 is very satisfactory
please rate the service provided by the elector enquiry call centre:
[READ OUT CODES 01-05] S/R
Very Satisfactory 05
Satisfactory 04
Neutral 03
Unsatisfactory 02
Very unsatisfactory 01
[DON’T READ] Don’t know / not applicable 99
[ASK ALL WHO ANSWERED CODE 1 AT QG1]
G4. How long did you have to wait on the phone to speak to an operator?
Please choose one only
[READ OUT IN ORDER] S/R
No time – got straight through 01
Waited between 1 to 5 minutes 02
Waited between 6 to 10 minutes 03
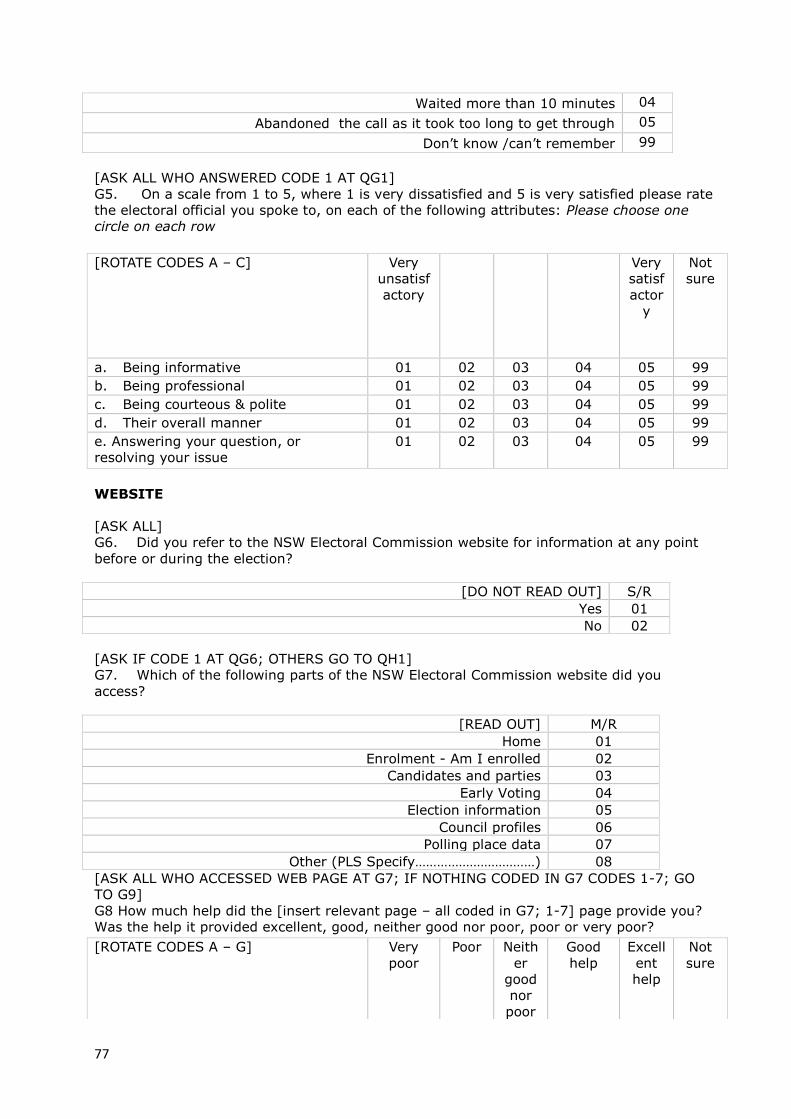
77
Waited more than 10 minutes 04
Abandoned the call as it took too long to get through 05
Don’t know /can’t remember 99
[ASK ALL WHO ANSWERED CODE 1 AT QG1]
G5. On a scale from 1 to 5, where 1 is very dissatisfied and 5 is very satisfied please rate
the electoral official you spoke to, on each of the following attributes: Please choose one
circle on each row
WEBSITE
[ASK ALL]
G6. Did you refer to the NSW Electoral Commission website for information at any point
before or during the election?
[DO NOT READ OUT] S/R
Yes 01
No 02
[ASK IF CODE 1 AT QG6; OTHERS GO TO QH1]
G7. Which of the following parts of the NSW Electoral Commission website did you
access?
[READ OUT] M/R
Home 01
Enrolment - Am I enrolled 02
Candidates and parties 03
Early Voting 04
Election information 05
Council profiles 06
Polling place data 07
Other (PLS Specify……………………………) 08
[ASK ALL WHO ACCESSED WEB PAGE AT G7; IF NOTHING CODED IN G7 CODES 1-7; GO
TO G9]
G8 How much help did the [insert relevant page – all coded in G7; 1-7] page provide you?
Was the help it provided excellent, good, neither good nor poor, poor or very poor?
[ROTATE CODES A – C] Very
unsatisf
actory
Very
satisf
actor
y
Not
sure
a. Being informative 01 02 03 04 05 99
b. Being professional 01 02 03 04 05 99
c. Being courteous & polite 01 02 03 04 05 99
d. Their overall manner 01 02 03 04 05 99
e. Answering your question, or
resolving your issue
01 02 03 04 05 99
[ROTATE CODES A – G] Very
poor
Poor Neith
er
good
nor
poor
Good
help
Excell
ent
help
Not
sure

78
[ASK ALL WHO ANSWERED CODE 1 AT QG6]
G9. On a scale from 1 to 5, where 1 is very dissatisfied and 5 is very satisfied please rate
the website on each of the following?
[ASK THOSE WHO ANSWERED CODE 1 AT QG6]
G10. On a scale from 1 to 5, with 1 being very unsatisfactory and 5 being very
satisfactory please rate how satisfied you were overall with the service provided by the
website:
[READ OUT CODES 01-05] S/R
Very Satisfactory 05
Satisfactory 04
Neutral 03
Unsatisfactory 02
Very unsatisfactory 01
[DON’T READ] Don’t know / not applicable 99
[ASK THOSE WHO ANSWERED CODE 1 AT QG6]
G11. Would you say your website visit was better, the same, or worse than you expected?
[READ OUT CODES 01-05] S/R
Better 03
Same 02
Worse 01
[DON’T READ] Don’t know / not applicable 99
[ASK THOSE WHO ANSWERED CODE 1 AT QG6]
G12. Did you use some form of mobile device to access the website?
[READ OUT CODES 01-05] S/R
Yes 03
No 02
[DON’T READ] Don’t know / not applicable 99
[ASK THOSE WHO ANSWERED CODE 1 AT QG6]
[ROTATE CODES A – G] 01 02 03 04 05 99
a. Home 01 02 03 04 05 99
b. Enrolment /Am I enrolled 01 02 03 04 05 99
c. Candidates and parties 01 02 03 04 05 99
d. Early Voting 01 02 03 04 05 99
e. Election information 01 02 03 04 05 99
f. Council profiles 01 02 03 04 05 99
g. Polling place 01 02 03 04 05 99
[ROTATE CODES A – F] Very
unsatisf
actory
Very
satisf
actor
y
Not
sure
a. Easy to use and get around 01 02 03 04 05 99
b. Finding what you were looking for 01 02 03 04 05 99
c. Helpful in your enquiry 01 02 03 04 05 99
ASK d ONLY OF VISION IMPAIRED
d. Accessible for the vision impaired
01 02 03 04 05 99
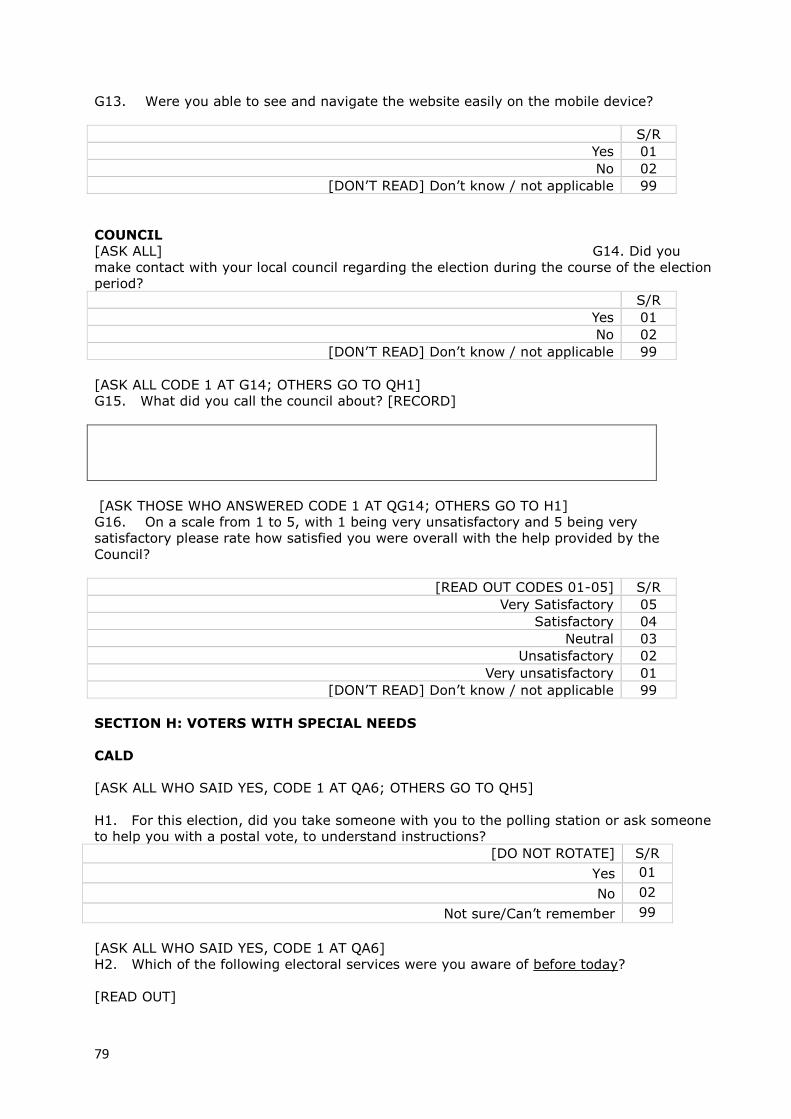
79
G13. Were you able to see and navigate the website easily on the mobile device?
S/R
Yes 01
No 02
[DON’T READ] Don’t know / not applicable 99
COUNCIL
[ASK ALL] G14. Did you
make contact with your local council regarding the election during the course of the election
period?
S/R
Yes 01
No 02
[DON’T READ] Don’t know / not applicable 99
[ASK ALL CODE 1 AT G14; OTHERS GO TO QH1]
G15. What did you call the council about? [RECORD]
[ASK THOSE WHO ANSWERED CODE 1 AT QG14; OTHERS GO TO H1]
G16. On a scale from 1 to 5, with 1 being very unsatisfactory and 5 being very
satisfactory please rate how satisfied you were overall with the help provided by the
Council?
[READ OUT CODES 01-05] S/R
Very Satisfactory 05
Satisfactory 04
Neutral 03
Unsatisfactory 02
Very unsatisfactory 01
[DON’T READ] Don’t know / not applicable 99
SECTION H: VOTERS WITH SPECIAL NEEDS
CALD
[ASK ALL WHO SAID YES, CODE 1 AT QA6; OTHERS GO TO QH5]
H1. For this election, did you take someone with you to the polling station or ask someone
to help you with a postal vote, to understand instructions?
[DO NOT ROTATE] S/R
Yes 01
No 02
Not sure/Can’t remember 99
[ASK ALL WHO SAID YES, CODE 1 AT QA6]
H2. Which of the following electoral services were you aware of before today?
[READ OUT]

80
[ROTATE CODES
A-D]
M/R
A. Translation and interpretation service by phone 01
B. Online translation and interpretation service 02
C. Online multilingual instructions guide 03
D. Multilingual instructions guide at the polling venue 04
E. None 09
F Don’t know/can’t remember 99
[ASK ALL WHO SAID YES, CODE 1 AT QA6]
H3. For this election, which of the following services did you use, if any?
[READ OUT]
[ROTATE CODES
A-D]
M/R
A. Translation and interpretation service by phone 01
B. Online translation and interpretation service 02
C. Online multilingual instructions guide 03
D. Multilingual instructions guide at the polling venue 04
E. None 09
F Don’t know/can’t remember 99
[ASKFOR EACH SERVICE USED AT QH3 CODES 1-4]
H4. On a scale from 1 to 5, with 1 being very unsatisfactory and 5 being very satisfactory,
please rate how satisfied you were overall with:
VIS
UAL
LY
IMP
AIR
ED
[AS
K
ALL
WH
O
SAI
D YES, CODE 1 AT QA8; OTHERS GO TO QH8]
H5: Did you take someone with you to help you at the polling station or ask someone to
help you with a postal vote or Braille ballot papers and voting?
[DO NOT ROTATE] S/R
Yes 01
No 02
Not sure/Can’t remember 09
[ASK ALL WHO SAID YES, CODE 1 AT QA8]
Very
unsatisf
actory
Very
satisf
actor
y
Translation and interpretation service
by phone
01 02 03 04 05
Online translation and interpretation
service
01 02 03 04 05
Online multilingual instructions guide 01 02 03 04 05
Multilingual instructions guide at the
polling venue
01 02 03 04 05
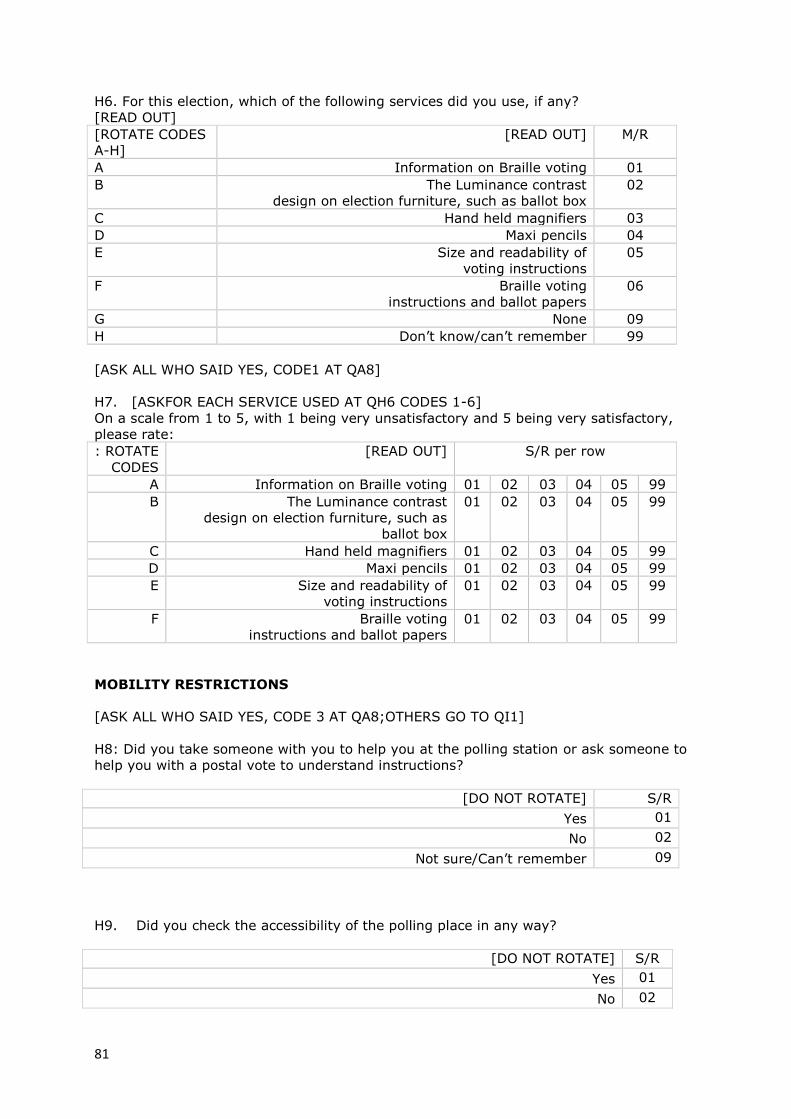
81
H6. For this election, which of the following services did you use, if any?
[READ OUT]
[ROTATE CODES
A-H]
[READ OUT] M/R
A Information on Braille voting 01
B The Luminance contrast
design on election furniture, such as ballot box
02
C Hand held magnifiers 03
D Maxi pencils 04
E Size and readability of
voting instructions
05
F Braille voting
instructions and ballot papers
06
G None 09
H Don’t know/can’t remember 99
[ASK ALL WHO SAID YES, CODE1 AT QA8]
H7. [ASKFOR EACH SERVICE USED AT QH6 CODES 1-6]
On a scale from 1 to 5, with 1 being very unsatisfactory and 5 being very satisfactory,
please rate:
: ROTATE
CODES
[READ OUT] S/R per row
A Information on Braille voting 01 02 03 04 05 99
B The Luminance contrast
design on election furniture, such as
ballot box
01 02 03 04 05 99
C Hand held magnifiers 01 02 03 04 05 99
D Maxi pencils 01 02 03 04 05 99
E Size and readability of
voting instructions
01 02 03 04 05 99
F Braille voting
instructions and ballot papers
01 02 03 04 05 99
MOBILITY RESTRICTIONS
[ASK ALL WHO SAID YES, CODE 3 AT QA8;OTHERS GO TO QI1]
H8: Did you take someone with you to help you at the polling station or ask someone to
help you with a postal vote to understand instructions?
[DO NOT ROTATE] S/R
Yes 01
No 02
Not sure/Can’t remember 09
H9. Did you check the accessibility of the polling place in any way?
[DO NOT ROTATE] S/R
Yes 01
No 02

82
Not sure/Can’t remember 99
[ASK ALL WHO SAID YES, CODE 3 AT QA8]
H10. On a scale from 1 to 5, with 1 being very unsatisfactory and 5 being very
satisfactory, please rate how satisfied you were overall with:
[READ OUT] S/R per row
A Information on the accessibility of the polling
place
01 02 03 04 05 99
B Information on wheelchair access 01 02 03 04 05 99
C Wheelchair accessibility
screen
01 02 03 04 05 99
D Actual wheelchair access on the day 01 02 03 04 05 99
Section I - Demographics
[ASK ALL]
I1. Which of the following age brackets do you fall into? [DO NOT READ OUT]
S/R
18 01
19-20 02
21-24 03
25-34 04
35-44 05
45-54 06
55-64 07
65-74 08
75-84 09
85-94 10
95+ 11
Don’t know/can’t remember 98
Refused 99
I2. Record gender
[DO NOT READ OUT] S/R
Male 01
Female 02
[ASK ALL]
I3. What is the main language spoken in your household?
[DO NOT READ OUT] S/R
English 01
Italian 02
Spanish 03
Chinese/Mandarin/Cantonese 04
Arabic 05
Portuguese 06

83
Greek 07
German 08
Vietnamese 09
Philippine /Tagalog 10
Maltese/ Turkish 11
Other (specify) 98
Refused 99
Thank you very much for your time today.
Thank you very much for your time. As part of our quality control process a supervisor may
need to check some of my work. 10% of all our work is checked in this way. If it is okay
with you, could I please just have your first name and permission to call back in case my
supervisor needs to re-contact you to check my work?
__________________________ RECORD NAME 01
REFUSED TO BE VALIDATED 02
I certify that this is a true, accurate and complete interview, conducted in accordance with
the ICC/ESOMAR code of ethics and the IQCA, and I will not disclose to any other person
the content of this questionnaire or any other information relating to this project.
INTERVIEWER’S SIGNATURE: ____________________ DATE: _____________
INTERVIEWER NO: _____________________________ TEL NO: _____________

84
Figure 44 - Sample Achieved
n= 1720 %
Gender Male 849 49
Female 871 51
Language spoken at
home
English1555 90
Chinese/Mandarin/
Cantonese48 3
Hindi 25 2
Arabic 15 1
Spanish 9 1
Maltese/ Turkish 6 0
Russian 6 0
Vietnamese 6 0
Greek 6 0
Serbian 4 0
Madeconian4 0
Philippine/Tagalog 4 0
Croatian 5 0
Other 25 2
Refused 4 0
n=1720 %
Age 18 24 1
19-20 88 5
21-24 118 7
25-34 285 17
35-44 251 15
45-54 361 21
55-64 283 16
65-74 170 10
75-84 88 5
85-94 38 2
95+ 1 0
Don’t know/can’t remember
1 0
Refused 6 0
sample profileactual sample achieved
APPENDIX B: SAMPLE PROFILE
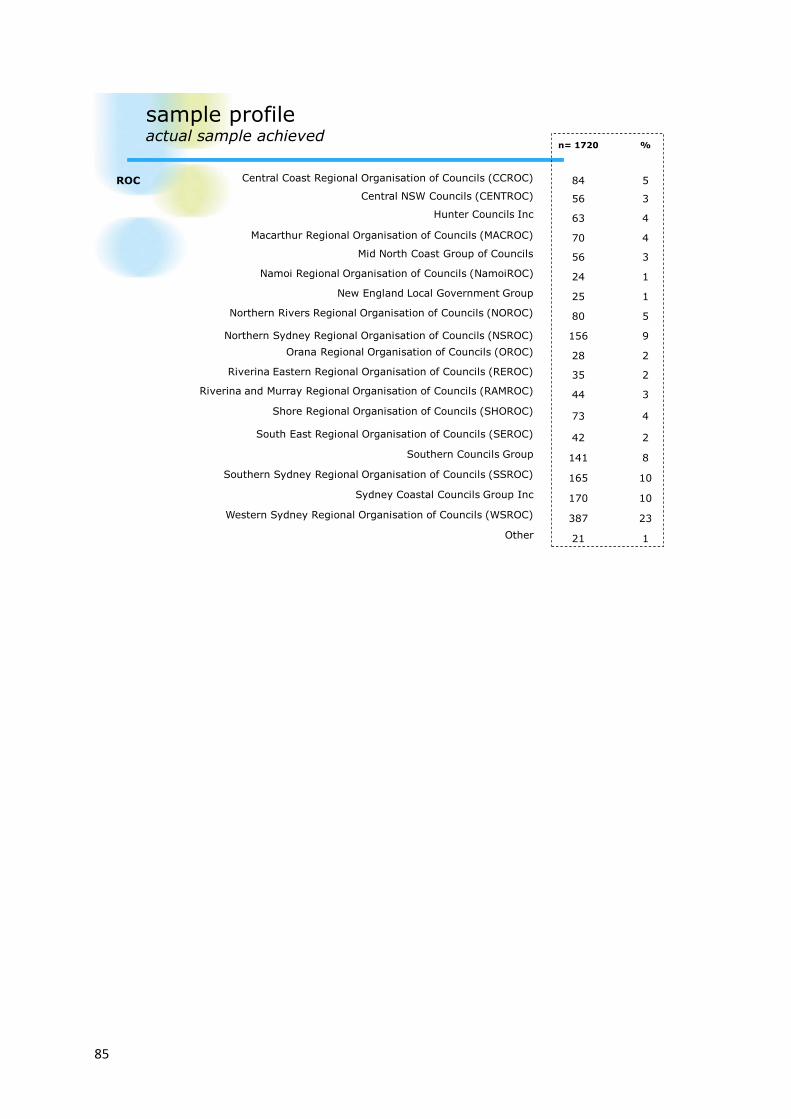
85
n= 1720 %
ROC Central Coast Regional Organisation of Councils (CCROC) 84 5
Central NSW Councils (CENTROC) 56 3
Hunter Councils Inc 63 4
Macarthur Regional Organisation of Councils (MACROC) 70 4
Mid North Coast Group of Councils 56 3
Namoi Regional Organisation of Councils (NamoiROC) 24 1
New England Local Government Group 25 1
Northern Rivers Regional Organisation of Councils (NOROC) 80 5
Northern Sydney Regional Organisation of Councils (NSROC) 156 9
Orana Regional Organisation of Councils (OROC) 28 2
Riverina Eastern Regional Organisation of Councils (REROC) 35 2
Riverina and Murray Regional Organisation of Councils (RAMROC) 44 3
Shore Regional Organisation of Councils (SHOROC)73 4
South East Regional Organisation of Councils (SEROC) 42 2
Southern Councils Group 141 8
Southern Sydney Regional Organisation of Councils (SSROC) 165 10
Sydney Coastal Councils Group Inc 170 10
Western Sydney Regional Organisation of Councils (WSROC) 387 23
Other 21 1
sample profileactual sample achieved

86
New South Wales has 17 Regional Organisations of Councils (ROCs) which are voluntary groupings of
councils in Australia. ROCs usually involve collaborative partnerships between neighbouring councils in a
particular region or area. ROCs form natural clusters of council areas for analysis purposes.
The table below shows which councils belong to which ROCs.
Regional Councils membership
Red bold underlined = Councils providing their own electoral services
Green text = Councils in more than 1 ROC
Note: Botany Bay and Sutherland are in more than 1 ROC and provided their own electoral services
Table – Councils and their respective ROCs
Regional councils 1. Central Coast Regional
Organisation of Councils (CCROC) [2]
Gosford Wyong
2. Central NSW Councils (CENTROC) [16]
Bathurst Blayney, Boorowa, Cabonne, Central Tblds Cnty,
Forbes, Harden, Lachlan, Lithgow, Oberon,
Cowra, Orange, Parkes, Weddin, Wellington,
Young
3. Hunter Councils Group [11]
Cessnock, Dungog, Gloucester, Great Lakes, Lake Macquarie,
Maitland, Muswellbrook, Newcastle, Port Stephens, Singleton,
Upper Hunter
4. Macarthur Regional Organisation of Councils (MACROC) [3]
Camden, Campbelltown, Wollondilly
5. Mid North Coast Group of Councils [9]
Bellingen, Coffs Harbour, Gloucester, Great Lakes, Greater Taree,
Kempsey, Nambucca, Port Macquarie Hastings
6. Namoi Regional Organisation of Councils (NamoiROC)
[5]
Gunnedah, Liverpool Plains, Narrabri, Tamworth
Walcha
7. New England Local Government Group [11]
Armidale Dumaresq, Glen Innes Severn,
Inverell, New England TablelandsCty, Tenterfield,
Walcha
APPENDIX C: DEFINITION OF ROCS

87
Guyra, Uralla, 8. Northern Rivers Regional
Organisation of Councils (NOROC) [10]
Ballina, Byron, Clarence Valley, Kyogle, Lismore,
Richmond River County, Richmond Valley, Rous Water,
Tweed
9. Northern Sydney Regional Organisation of Councils (NSROC) [7]
Hornsby, Hunters Hill, Ku-ring-gai, Lane Cove, North Sydney,
Ryde, Willoughby
10. Orana Regional Organisation of Councils (OROC) [11]
Bogan, Bourke, Brewarrina, Cobar, Coonamble,
Dubbo, Gilgandra, Narromine, Walgett, Warren,
Warrumbungle
11. Riverina Eastern Regional Organisation of Councils (REROC) [13]
Bland, Coolamon, Cootamundra, Goldenfields Water County, Gundagai,
Junee, Lockhart, Riverina Water County, Temora, Tumbarumba,
Tumut, Urana, Wagga Wagga
12. Riverina and Murray Regional Organisation of Councils (RAMROC) [16]
Albury, Balranald, Berrigan, Carrathool, Conargo
Corowa, Deniliquin, Greater Hume, Griffith, Hay
Jerilderie, Leeton, Murray, Murrumbidgee, Narrandera,
Wakool
13. Shore Regional Organisation of Councils (SHOROC) [4]
Manly, Mosman, Pittwater, Warringah
14. South East Regional Organisation of Councils (SEROC) [13]
Bombala, Boorowa, Cooma-Monaro (old), Eurobodalla, Goulburn
Mulwaree, Harden, Palerang, Queanbeyan (old), Snowy River,
Upper Lachlan, Yass Valley, Young
15. Southern Councils Group [7]
Bega Valley, Eurobodalla, Kiama, Shellharbour, Shoalhaven,
Wingecarribee, Wollongong
16. Southern Sydney Regional Organisation of Councils (SSROC) [15]
Ashfield, Botany Bay, Burwood, Canada Bay, Canterbury,
Hurstville, Kogarah, Leichhardt, Marrickville, Randwick,
Rockdale, Sutherland, Sydney, Waverley, Woollahra
17. Sydney Coastal Councils Group Inc
[15]
Botany Bay, Hornsby, Leichhardt, Manly,
North Sydney, Pittwater, Randwick, Rockdale,
Sydney, Warringah, Waverley, Willoughby,
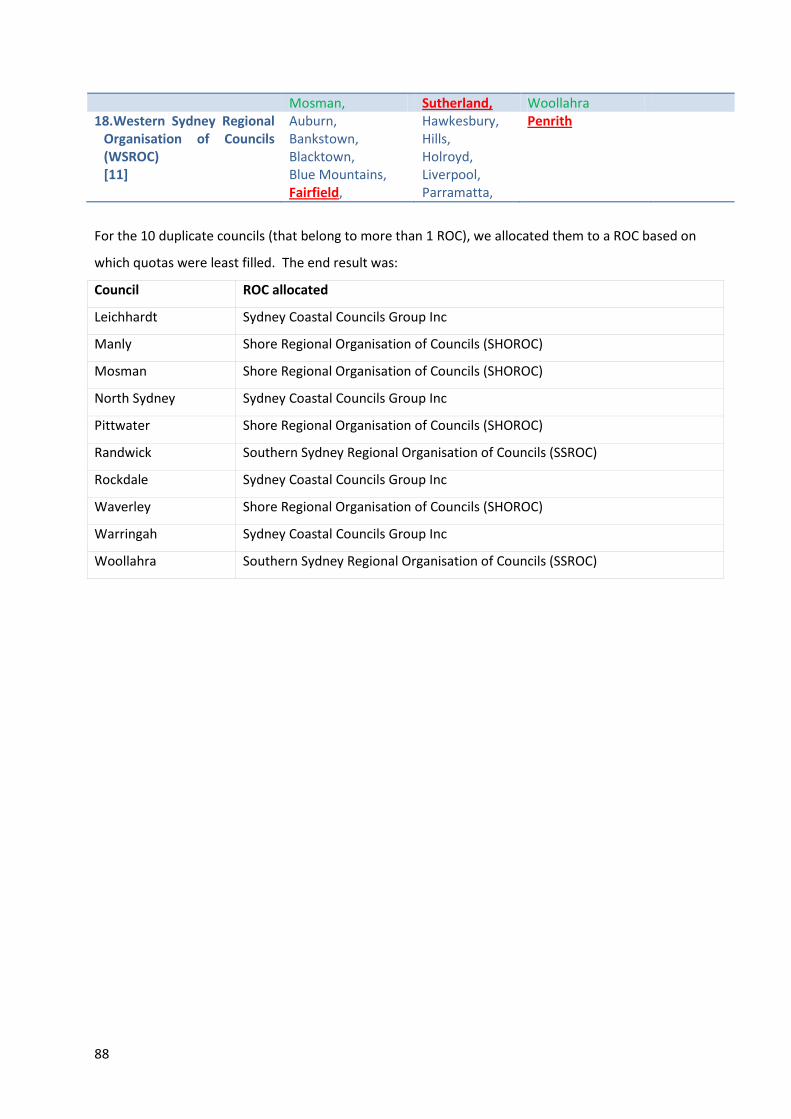
88
Mosman, Sutherland, Woollahra 18. Western Sydney Regional
Organisation of Councils (WSROC) [11]
Auburn, Bankstown, Blacktown, Blue Mountains, Fairfield,
Hawkesbury, Hills, Holroyd, Liverpool, Parramatta,
Penrith
For the 10 duplicate councils (that belong to more than 1 ROC), we allocated them to a ROC based on
which quotas were least filled. The end result was:
Council ROC allocated
Leichhardt Sydney Coastal Councils Group Inc
Manly Shore Regional Organisation of Councils (SHOROC)
Mosman Shore Regional Organisation of Councils (SHOROC)
North Sydney Sydney Coastal Councils Group Inc
Pittwater Shore Regional Organisation of Councils (SHOROC)
Randwick Southern Sydney Regional Organisation of Councils (SSROC)
Rockdale Sydney Coastal Councils Group Inc
Waverley Shore Regional Organisation of Councils (SHOROC)
Warringah Sydney Coastal Councils Group Inc
Woollahra Southern Sydney Regional Organisation of Councils (SSROC)
REPORT ON THE 2012 LOCAL GOVERNMENT ELECTIONS
Part 3 – Elector Surveys
874
This page intentionally left blank

REPORT ON THE 2012 LOCAL GOVERNMENT ELECTIONS
Part 3 – Elector Surveys
875
Appendix N: 2012 Local Government Elections Survey of Electors at Sydney Town Hall
Acknowledgements
The Ipsos Social Research Institute would like to thank the NSW Electoral Commission for funding
this study and for their help and assistance in the development of the project. We would also like
to thank the members of the public who took part in this study, without whose input, the research
would not have not been possible.

CONTENTS
1. Executive summary 1
2. Research context 3
2.1 Background .............................................................................................. 3
2.2 Research objectives .................................................................................. 4
3. Research design 6
3.1 Conduct of research .................................................................................. 6
3.2 Sample size and composition ...................................................................... 6
4. Research findings 10
4.1 Ratings of NSWEC at Sydney Town Hall ..................................................... 10
4.2 Voter behaviour ...................................................................................... 11
4.3 Ratings of STH ........................................................................................ 14
Appendix A – Survey Questionnaire 20

LIST OF FIGURES
Figure 1: Overall satisfaction with voting by time taken to vote .............................. 14
Figure 2: Satisfaction with specific elements of the day ......................................... 16
LIST OF TABLES
Table 1: Age ...................................................................................................... 7
Table 2: Gender ................................................................................................. 7
Table 3: Whether speak a language other than English at home ............................... 7
Table 4: Other languages spoken ......................................................................... 8
Table 5: Where survey participants lived ............................................................... 8
Table 6: Local Council of survey participants – Sydney Inner ................................... 8
Table 7: Local Council of survey participants – Sydney Outer ................................... 9
Table 8: Local Council of survey participants – Elsewhere in NSW ............................. 9
Table 9: Ratings of the NSWEC as fair and impartial ............................................. 10
Table 10: Prior voting at Sydney Town Hall - Federal ............................................ 11
Table 11: Prior voting at Sydney Town Hall - State ............................................... 11
Table 12: Prior voting at Sydney Town Hall – Local Government ............................. 12
Table 13: Reasons for voting at the Sydney Town Hall Polling Place ........................ 13
Table 14: Overall satisfaction with voting at Sydney Town Hall ............................... 15
Table 15: Time taken to vote ............................................................................. 15
Table 16: Satisfaction with time taken to vote ...................................................... 17
Table 17: Satisfaction with ease of voting ............................................................ 17
Table 18: Satisfaction with using the computer to check name of the electoral roll.... 18
Table 19: Satisfaction with using the docket to collect the ballot paper .................... 18
Table 20: New process compared to previous process ........................................... 19
Table 21: Support for using the new process in other polling places ........................ 19

NSW Electoral Commission
Survey of Electors, Sydney Town Hall | September 2012 | Page 1
1
1. EXECUTIVE SUMMARY
1.1 Research Context
The NSW Electoral Commission introduced a number of electoral initiatives at the Sydney Town
Hall Polling Place for the Local Government Elections, held on Saturday 8th September 2012.
These initiatives relate to the administration of electoral services; electronic self mark-off, and the
ability for electors to vote away from their council area. The aim of this project is to test elector
satisfaction with these initiatives.
1.2 Methodology
Face-to-face interviewing was conducted at Sydney Town Hall on Local Government Election day.
Interviewing was undertaken using a questionnaire designed in close consultation by Ipsos Social
Research Institute and the NSWEC. It utilised trend questions from the previous study undertaken
at the Sydney Town Hall, and was supplemented by new questions to address the current
initiatives.
Interviewers were present throughout the polling place opening hours, from 8am-6pm. The
survey instrument was executed using iPads, and a total sample of n=180 was achieved.
1.3 Key Findings
Satisfaction of electors with new innovations in administration
There was a high satisfaction with the new voting processes introduced at Sydney Town
Hall and a corresponding high degree of satisfaction with the ease of voting (both 93%).
In comparison to the traditional process of marking voters off the roll, 88% thought the
computerised process was better and an even higher proportion (95%) were satisfied with
using the printed docket to collect their ballot papers. Overall, 89% supported using the
new process in other polling places.
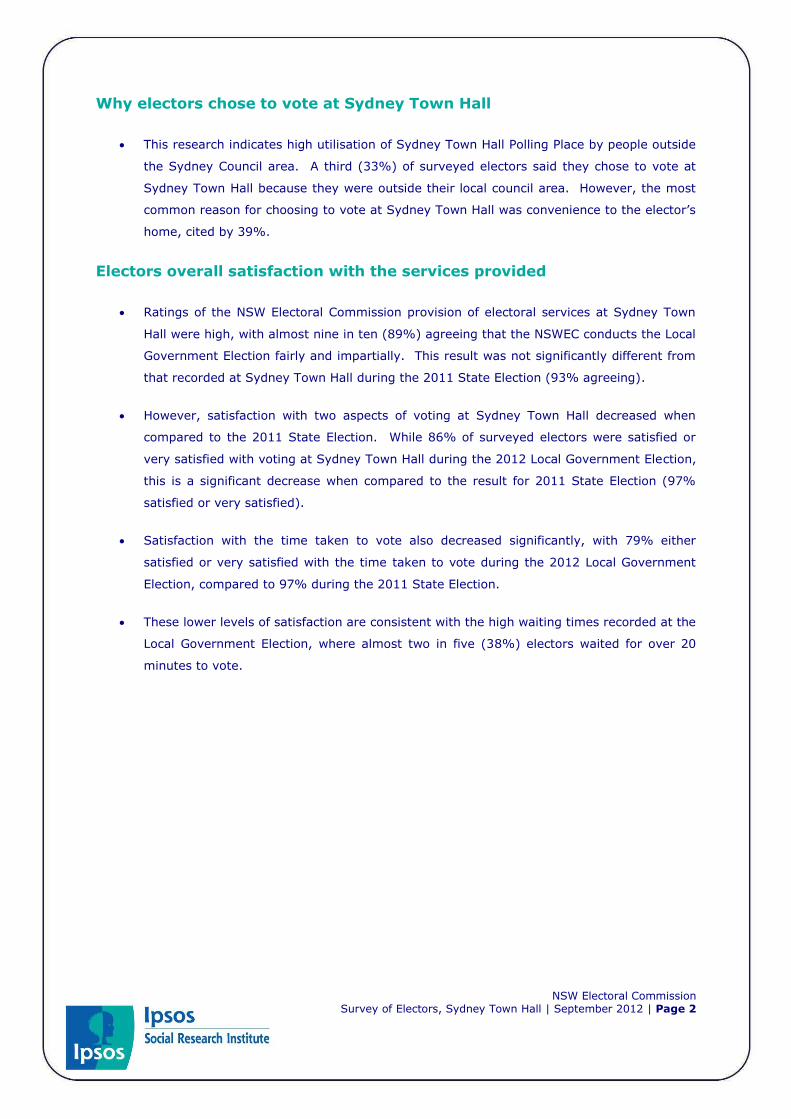
NSW Electoral Commission
Survey of Electors, Sydney Town Hall | September 2012 | Page 2
Why electors chose to vote at Sydney Town Hall
This research indicates high utilisation of Sydney Town Hall Polling Place by people outside
the Sydney Council area. A third (33%) of surveyed electors said they chose to vote at
Sydney Town Hall because they were outside their local council area. However, the most
common reason for choosing to vote at Sydney Town Hall was convenience to the elector’s
home, cited by 39%.
Electors overall satisfaction with the services provided
Ratings of the NSW Electoral Commission provision of electoral services at Sydney Town
Hall were high, with almost nine in ten (89%) agreeing that the NSWEC conducts the Local
Government Election fairly and impartially. This result was not significantly different from
that recorded at Sydney Town Hall during the 2011 State Election (93% agreeing).
However, satisfaction with two aspects of voting at Sydney Town Hall decreased when
compared to the 2011 State Election. While 86% of surveyed electors were satisfied or
very satisfied with voting at Sydney Town Hall during the 2012 Local Government Election,
this is a significant decrease when compared to the result for 2011 State Election (97%
satisfied or very satisfied).
Satisfaction with the time taken to vote also decreased significantly, with 79% either
satisfied or very satisfied with the time taken to vote during the 2012 Local Government
Election, compared to 97% during the 2011 State Election.
These lower levels of satisfaction are consistent with the high waiting times recorded at the
Local Government Election, where almost two in five (38%) electors waited for over 20
minutes to vote.

NSW Electoral Commission
Survey of Electors, Sydney Town Hall | September 2012 | Page 3
2
This section outlines the
background to the project, and
specifies our understanding of the research objectives
2. RESEARCH CONTEXT
2.1 Background
The New South Wales Electoral Commission (NSWEC) is an independent statutory authority
established under the Parliamentary Electorates and Elections Act 1912 and is responsible for:
Registration of political parties;
Enrolment of electors;
Electoral rolls; and
Conduct of elections.
The main functions of the NSWEC are to:
Conduct elections and by-elections for the State of NSW, local government councils and
the NSW Aboriginal Land Council;
Conduct statutory elections for registered clubs, statutory bodies and state registered
industrial organisations;
Manage the Commonwealth electoral roll with the Australian Electoral Commission (AEC);
Provide administrative support to the Election Funding Authority;
Research electoral issues; and
Advise the Premier, who in the current Parliament is the Minister responsible for matters
relating to the administration of enrolment and elections in NSW.
NSW Electoral Commission
Survey of Electors, Sydney Town Hall | September 2012 | Page 4
The NSWEC’s vision is to ‘administer an impartial and fair electoral system and ensure that
opportunities for the community to participate in the NSW electoral system are based on principles
of equity and access’. Its stated mission is ‘to deliver high quality election services which are
impartial, effective, efficient and in accordance with the law’. The values of integrity, impartiality,
transparency, respect for others, a learning culture and professionalism underpin its behaviour,
decisions and standards across services and how performance is assessed.
The NSWEC serves a broad range of stakeholders including:
The people and electors of NSW;
The Parliament of NSW;
Local councils;
The NSW Aboriginal Land Council;
Election candidates and participants;
Registered political parties;
Industrial organisations, registered clubs and statutory bodies;
The Election Funding Authority; and
The media.
In response to a number of challenges that have been identified by NSWEC, it has attempted to
meet the need of stakeholders through the introduction of a number of initiatives. These include
electronic mark off of voters from the electoral roll and the abilities for electors to vote ‘out of
area’, that is, at polling places that do not fall within their local government area.
2.2 Research objectives
Overall, the aim of this project is to test elector satisfaction with the services provided at the
Sydney Town Hall polling place during the recent Local Government Elections, held on Saturday
the 8th September.
Specifically this research aimed to establish an understanding of:
The Satisfaction of electors with two new innovations in administration:
a. Electronic self-mark off

NSW Electoral Commission
Survey of Electors, Sydney Town Hall | September 2012 | Page 5
b. Allowing electors away from their council area to vote
Why electors chose to vote at Sydney Town Hall; and
Electors’ overall satisfaction with the services provided.
The methodology used to address these objectives is detailed in the following section.
NSW Electoral Commission
Survey of Electors, Sydney Town Hall | September 2012 | Page 6
3
In this section, details of the
methodology of the research program
3. RESEARCH DESIGN
3.1 Conduct of research
In order to achieve the project objectives, a quantitative methodology was required.
A face-to-face methodology was used at Sydney Town Hall to gather feedback from electors on
services being trialled. The initiatives being trialled were electronic roll marking, ‘print on demand’
ballot papers, and the ability to vote ‘out of area’.
A questionnaire was designed by the Ipsos Social Research Institute in close consultation with
NSWEC, trending core questions from the previous 2011 study and designing new questions to
current initiatives. Ipsos SRI and NSWEC liaised with operations staff from Sydney Town Hall to
discuss the entry/exit points suitable for interviewing, and reviewed the previous experience of
interviewing there. These discussions informed the decision on where to locate the interviewers
for this project.
Interviewing at Sydney Town Hall was undertaken consistently between 8am and 6pm on polling
day, Saturday 8th September 2012. The interviewers used iPads to conduct the interviews. All
interviewing and data entry was undertaken by I-View.
3.2 Sample size and composition
The aim of the face-to-face survey was to conduct as many interviews with voters as possible
during the interviewing period. A total of n=180 was achieved.

NSW Electoral Commission
Survey of Electors, Sydney Town Hall | September 2012 | Page 7
As outlined below in Table 1 and Table 2, survey respondents were most commonly aged between
25 and 34 (31%), and were slightly more likely to be male than female (56% male, 44% female).
Table 1: Age
% n
18 – 20 10% 18
21 – 24 15% 27
25 – 34 31% 55
35 – 44 11% 20
45 - 54 13% 23
55 - 64 12% 21
65 - 74 6% 10
75+ 2% 4
Prefer not to say 1% 2
Base n=180, total sample.
Table 2: Gender
% n
Male 56% 101
Female 44% 79
Base n=180, total sample.
Almost a quarter (23%) of survey respondents spoke a language other than English in their home
as Table 3 shows, below. Of those who did speak another language at home, the top four
languages spoken were Mandarin (21%), Cantonese (18%), Hindi (13%) and Spanish (11%),
Table 4 overleaf.
Table 3: Whether speak a language other than English at home
% n
Yes 23% 41
No 77% 139
Base n=180, total sample.
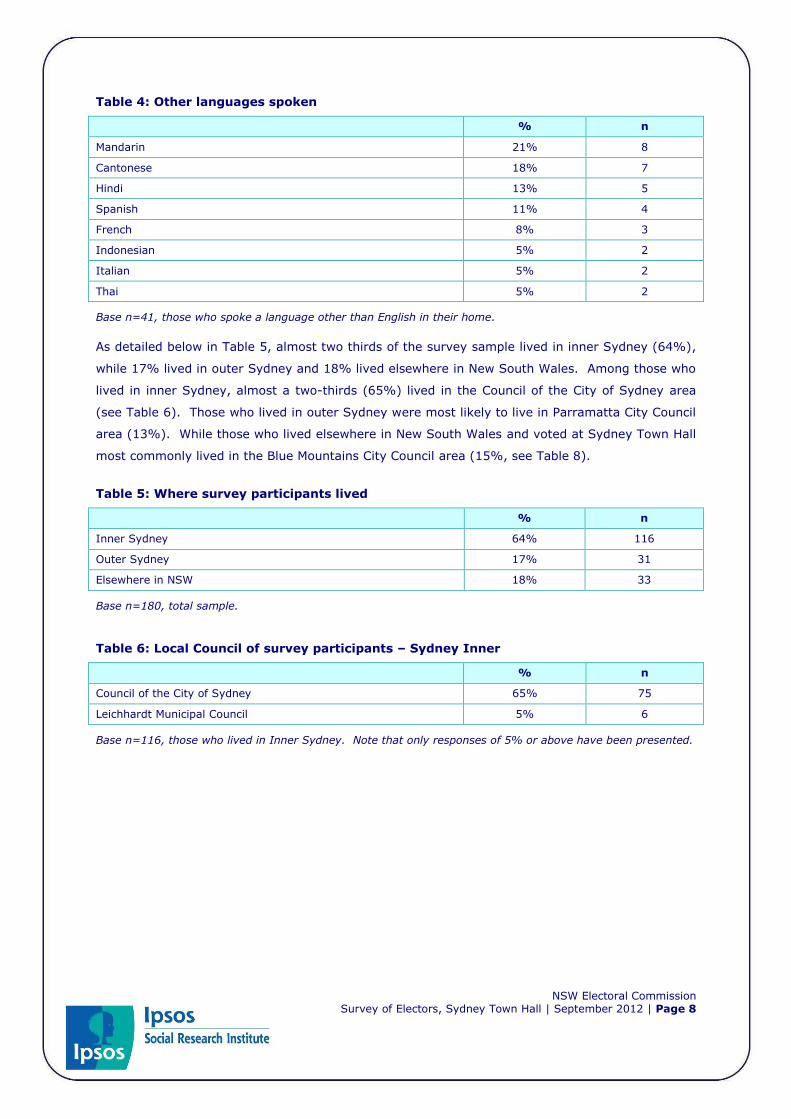
NSW Electoral Commission
Survey of Electors, Sydney Town Hall | September 2012 | Page 8
Table 4: Other languages spoken
% n
Mandarin 21% 8
Cantonese 18% 7
Hindi 13% 5
Spanish 11% 4
French 8% 3
Indonesian 5% 2
Italian 5% 2
Thai 5% 2
Base n=41, those who spoke a language other than English in their home.
As detailed below in Table 5, almost two thirds of the survey sample lived in inner Sydney (64%),
while 17% lived in outer Sydney and 18% lived elsewhere in New South Wales. Among those who
lived in inner Sydney, almost a two-thirds (65%) lived in the Council of the City of Sydney area
(see Table 6). Those who lived in outer Sydney were most likely to live in Parramatta City Council
area (13%). While those who lived elsewhere in New South Wales and voted at Sydney Town Hall
most commonly lived in the Blue Mountains City Council area (15%, see Table 8).
Table 5: Where survey participants lived
% n
Inner Sydney 64% 116
Outer Sydney 17% 31
Elsewhere in NSW 18% 33
Base n=180, total sample.
Table 6: Local Council of survey participants – Sydney Inner
% n
Council of the City of Sydney 65% 75
Leichhardt Municipal Council 5% 6
Base n=116, those who lived in Inner Sydney. Note that only responses of 5% or above have been presented.
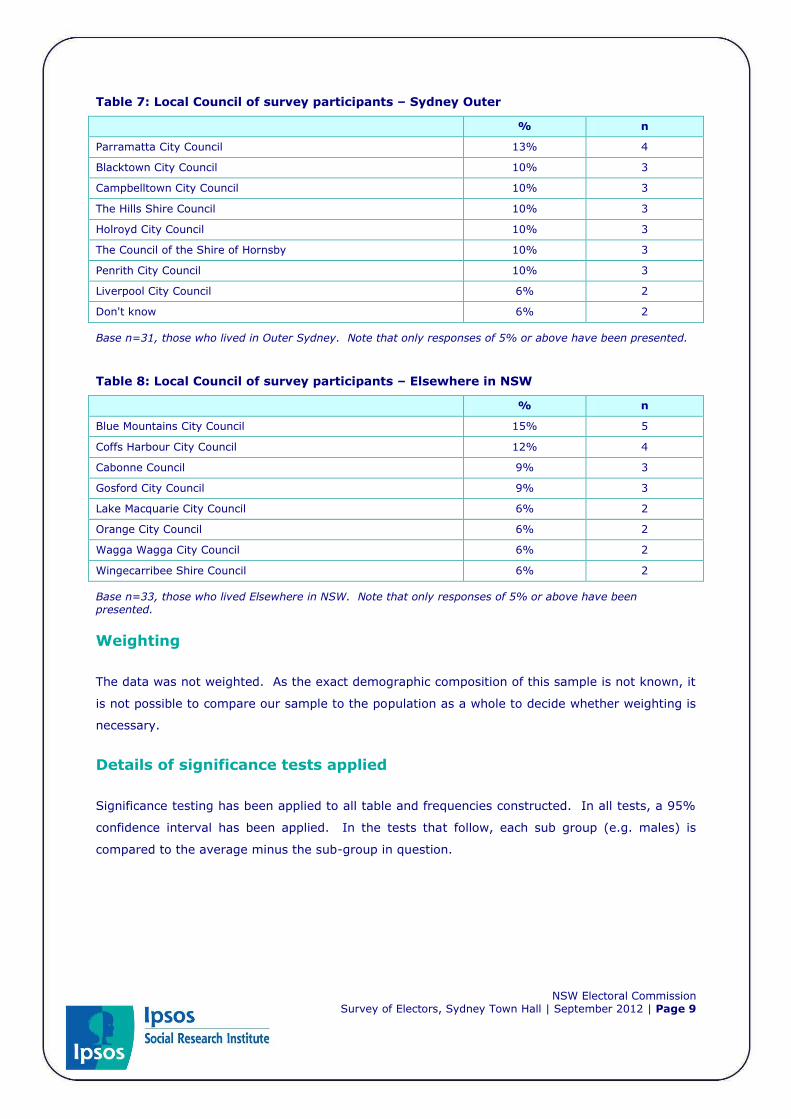
NSW Electoral Commission
Survey of Electors, Sydney Town Hall | September 2012 | Page 9
Table 7: Local Council of survey participants – Sydney Outer
% n
Parramatta City Council 13% 4
Blacktown City Council 10% 3
Campbelltown City Council 10% 3
The Hills Shire Council 10% 3
Holroyd City Council 10% 3
The Council of the Shire of Hornsby 10% 3
Penrith City Council 10% 3
Liverpool City Council 6% 2
Don't know 6% 2
Base n=31, those who lived in Outer Sydney. Note that only responses of 5% or above have been presented.
Table 8: Local Council of survey participants – Elsewhere in NSW
% n
Blue Mountains City Council 15% 5
Coffs Harbour City Council 12% 4
Cabonne Council 9% 3
Gosford City Council 9% 3
Lake Macquarie City Council 6% 2
Orange City Council 6% 2
Wagga Wagga City Council 6% 2
Wingecarribee Shire Council 6% 2
Base n=33, those who lived Elsewhere in NSW. Note that only responses of 5% or above have been presented.
Weighting
The data was not weighted. As the exact demographic composition of this sample is not known, it
is not possible to compare our sample to the population as a whole to decide whether weighting is
necessary.
Details of significance tests applied
Significance testing has been applied to all table and frequencies constructed. In all tests, a 95%
confidence interval has been applied. In the tests that follow, each sub group (e.g. males) is
compared to the average minus the sub-group in question.
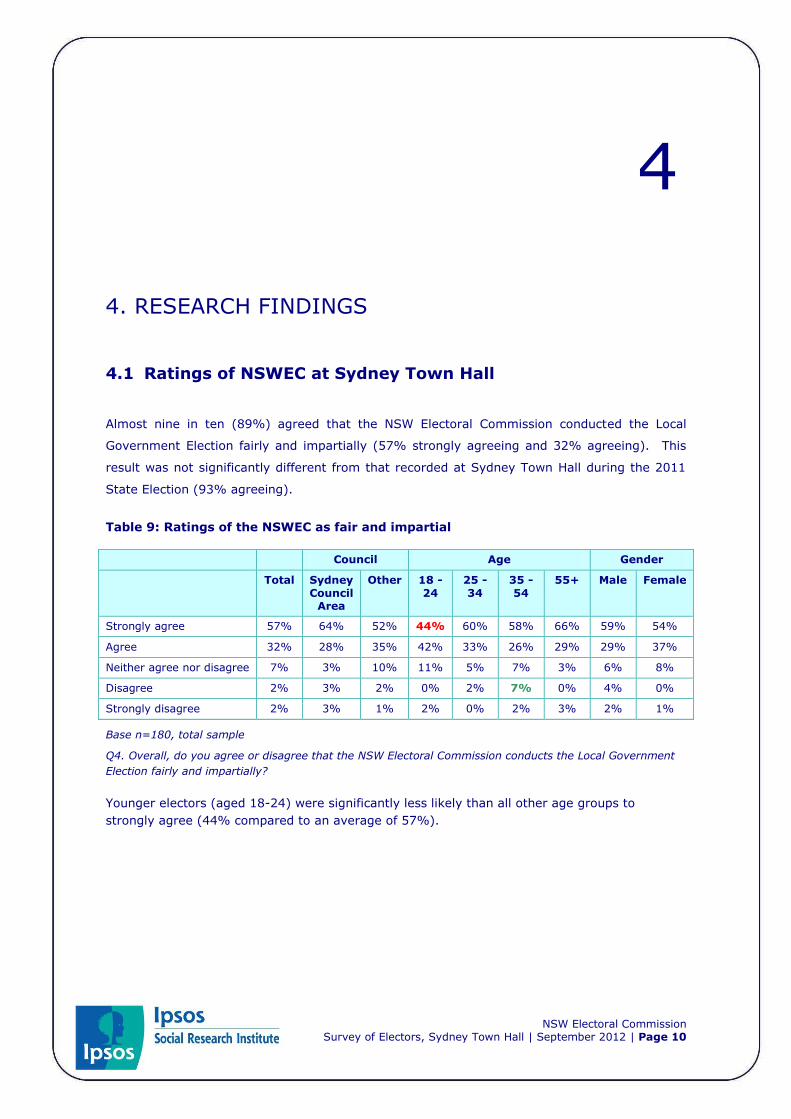
NSW Electoral Commission
Survey of Electors, Sydney Town Hall | September 2012 | Page 10
4
4. RESEARCH FINDINGS
4.1 Ratings of NSWEC at Sydney Town Hall
Almost nine in ten (89%) agreed that the NSW Electoral Commission conducted the Local
Government Election fairly and impartially (57% strongly agreeing and 32% agreeing). This
result was not significantly different from that recorded at Sydney Town Hall during the 2011
State Election (93% agreeing).
Table 9: Ratings of the NSWEC as fair and impartial
Council Age Gender
Total Sydney
Council Area
Other 18 -
24
25 -
34
35 -
54
55+ Male Female
Strongly agree 57% 64% 52% 44% 60% 58% 66% 59% 54%
Agree 32% 28% 35% 42% 33% 26% 29% 29% 37%
Neither agree nor disagree 7% 3% 10% 11% 5% 7% 3% 6% 8%
Disagree 2% 3% 2% 0% 2% 7% 0% 4% 0%
Strongly disagree 2% 3% 1% 2% 0% 2% 3% 2% 1%
Base n=180, total sample
Q4. Overall, do you agree or disagree that the NSW Electoral Commission conducts the Local Government
Election fairly and impartially?
Younger electors (aged 18-24) were significantly less likely than all other age groups to
strongly agree (44% compared to an average of 57%).

NSW Electoral Commission
Survey of Electors, Sydney Town Hall | September 2012 | Page 11
4.2 Voter behaviour
The same proportion of surveyed electors indicated that they had previously voted at Sydney
Town Hall in a Federal or State Election (28% for both), see Table 10 and Table 11 below.
As Table 10 shows, over a quarter of electors (28%) had voted previously at the Sydney Town
Hall in a Federal election. Those who lived in the Sydney Council Area were significantly more
likely than others to have voted at Sydney Town Hall in a Federal election before (55%
compared to 10% among all others), as were those middle-aged voters (aged 35-54, 42%).
Reflecting their reduced opportunity to do so, those aged 18-24 were significantly less likely to
have voted at Sydney Town Hall in a Federal election (11%).
Table 10: Prior voting at Sydney Town Hall – Federal
Council Age Gender
Total Sydney
Council Area
Other 18 -
24
25 -
34
35 -
54
55+ Male Female
Yes Voted 28% 55% 10% 11% 22% 42% 40% 31% 25%
No did not vote 71% 45% 90% 89% 76% 58% 60% 68% 75%
Can't remember/ Don’t
Know
1% 0% 1% 0% 2% 0% 0% 1% 0%
Q18. Not counting today’s election, have you voted before at the Sydney Town Hall in a Federal election?
Base n=180, total sample.
Over a quarter (28%) had also voted at Sydney Town Hall in a State Election. Again, these
electors were more likely to be local (from the Sydney Council area, 56%) and middle-aged
(aged 35-54, 47%).
Table 11: Prior voting at Sydney Town Hall – State
Council Age Gender
Total Sydney
Council Area
Other 18 -
24
25 -
34
35 -
54
55+ Male Female
Yes Voted 28% 56% 9% 9% 22% 47% 37% 34% 22%
No did not vote 71% 44% 90% 91% 76% 53% 63% 65% 78%
Can't remember / DK 1% 0% 1% 0% 2% 0% 0% 1% 0%
Q19. Not counting today’s election, have you voted before at the Sydney Town Hall in a State election?
Base n=180, total sample.
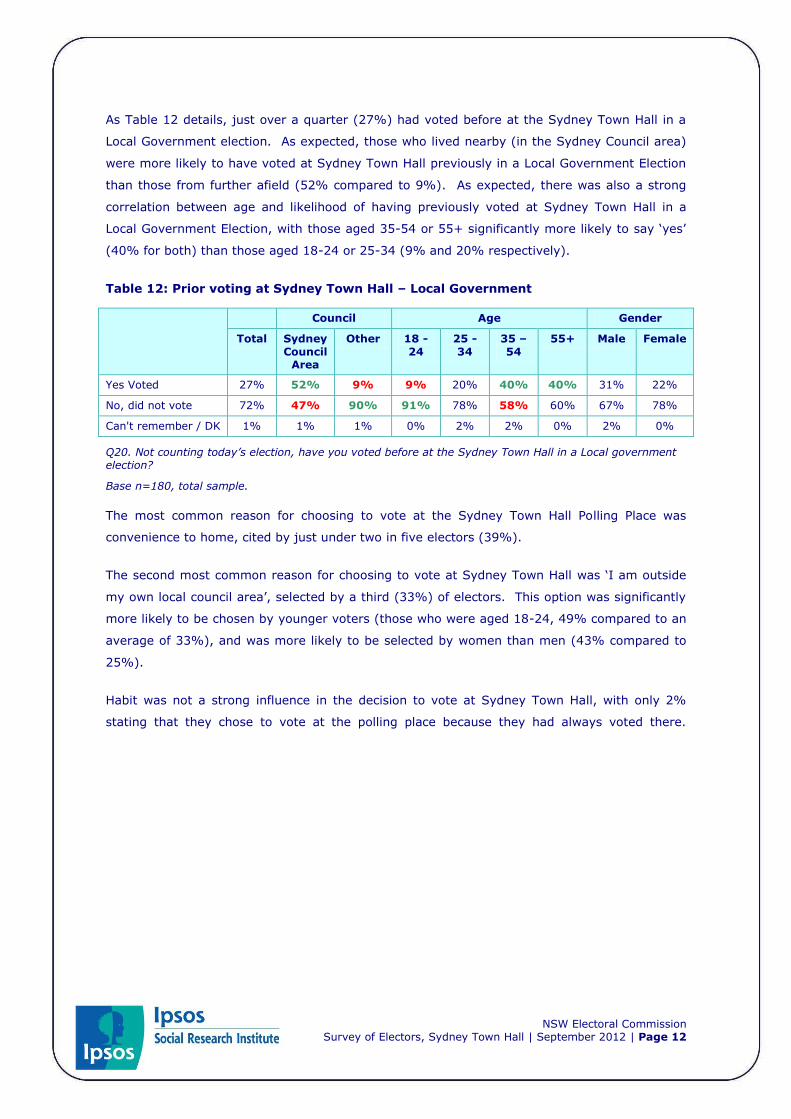
NSW Electoral Commission
Survey of Electors, Sydney Town Hall | September 2012 | Page 12
As Table 12 details, just over a quarter (27%) had voted before at the Sydney Town Hall in a
Local Government election. As expected, those who lived nearby (in the Sydney Council area)
were more likely to have voted at Sydney Town Hall previously in a Local Government Election
than those from further afield (52% compared to 9%). As expected, there was also a strong
correlation between age and likelihood of having previously voted at Sydney Town Hall in a
Local Government Election, with those aged 35-54 or 55+ significantly more likely to say ‘yes’
(40% for both) than those aged 18-24 or 25-34 (9% and 20% respectively).
Table 12: Prior voting at Sydney Town Hall – Local Government
Council Age Gender
Total Sydney
Council Area
Other 18 -
24
25 -
34
35 –
54
55+ Male Female
Yes Voted 27% 52% 9% 9% 20% 40% 40% 31% 22%
No, did not vote 72% 47% 90% 91% 78% 58% 60% 67% 78%
Can't remember / DK 1% 1% 1% 0% 2% 2% 0% 2% 0%
Q20. Not counting today’s election, have you voted before at the Sydney Town Hall in a Local government election?
Base n=180, total sample.
The most common reason for choosing to vote at the Sydney Town Hall Polling Place was
convenience to home, cited by just under two in five electors (39%).
The second most common reason for choosing to vote at Sydney Town Hall was ‘I am outside
my own local council area’, selected by a third (33%) of electors. This option was significantly
more likely to be chosen by younger voters (those who were aged 18-24, 49% compared to an
average of 33%), and was more likely to be selected by women than men (43% compared to
25%).
Habit was not a strong influence in the decision to vote at Sydney Town Hall, with only 2%
stating that they chose to vote at the polling place because they had always voted there.

NSW Electoral Commission
Survey of Electors, Sydney Town Hall | September 2012 | Page 13
Table 13: Reasons for voting at the Sydney Town Hall Polling Place
Council Age Gender
Total Sydney Council
Area
Other 18 - 24
25 - 34
35 - 54
55+ Male Fe-male
Convenient to my
home 39% 73% 15% 29% 33% 49% 49% 43% 35%
I am outside my own
local council area 33% 7% 51% 49% 27% 28% 29% 25% 43%
Convenient to my
workplace 14% 9% 17% 13% 16% 14% 11% 14% 14%
Convenient to leisure
activity (gym,
shopping etc) 8% 1% 13% 9% 11% 2% 11% 8% 9%
I have always voted
here 2% 4% 0% 0% 2% 2% 3% 3% 0%
Easy to get to by
public transport 1% 1% 1% 0% 4% 0% 0% 1% 1%
Easy to access by
wheelchair 0% 0% 0% 0% 0% 0% 0% 0% 0%
Other 8% 7% 9% 4% 11% 7% 9% 10% 5%
Q15. Why did you choose to vote at the Sydney Town Hall Polling Place?
Base n=180, total sample.
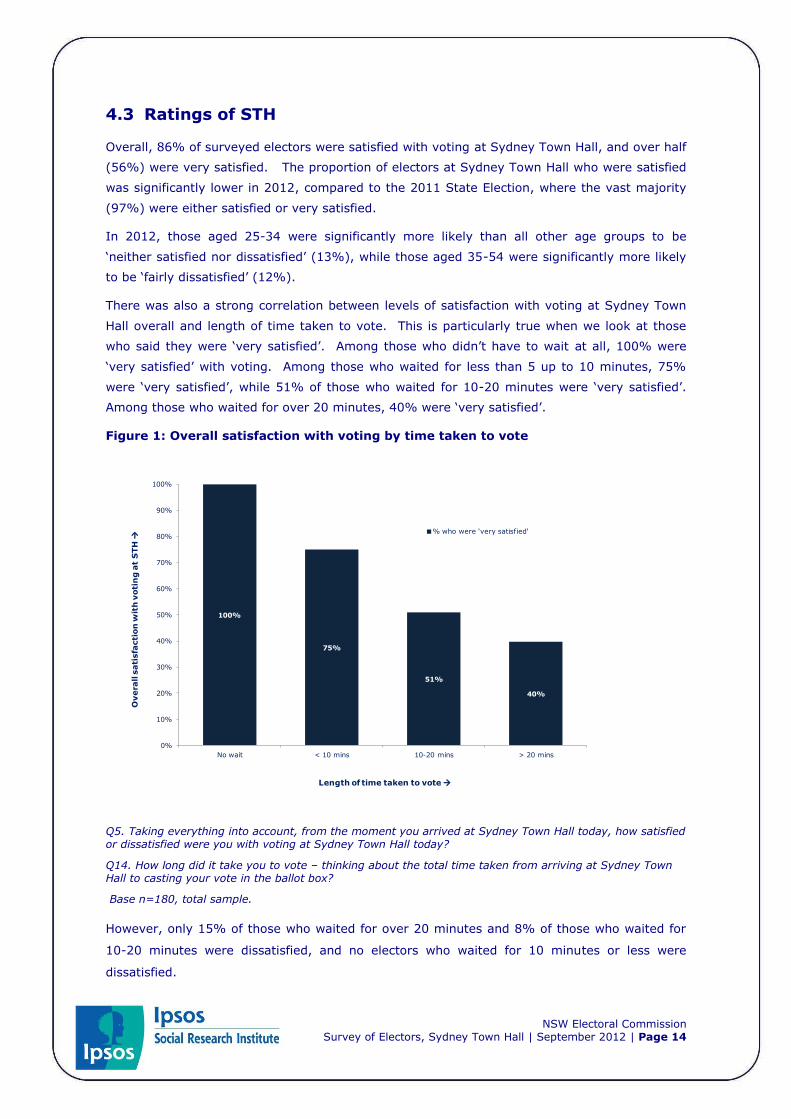
NSW Electoral Commission
Survey of Electors, Sydney Town Hall | September 2012 | Page 14
4.3 Ratings of STH
Overall, 86% of surveyed electors were satisfied with voting at Sydney Town Hall, and over half
(56%) were very satisfied. The proportion of electors at Sydney Town Hall who were satisfied
was significantly lower in 2012, compared to the 2011 State Election, where the vast majority
(97%) were either satisfied or very satisfied.
In 2012, those aged 25-34 were significantly more likely than all other age groups to be
‘neither satisfied nor dissatisfied’ (13%), while those aged 35-54 were significantly more likely
to be ‘fairly dissatisfied’ (12%).
There was also a strong correlation between levels of satisfaction with voting at Sydney Town
Hall overall and length of time taken to vote. This is particularly true when we look at those
who said they were ‘very satisfied’. Among those who didn’t have to wait at all, 100% were
‘very satisfied’ with voting. Among those who waited for less than 5 up to 10 minutes, 75%
were ‘very satisfied’, while 51% of those who waited for 10-20 minutes were ‘very satisfied’.
Among those who waited for over 20 minutes, 40% were ‘very satisfied’.
Figure 1: Overall satisfaction with voting by time taken to vote
100%
75%
51%
40%
0%
10%
20%
30%
40%
50%
60%
70%
80%
90%
100%
No wait < 10 mins 10-20 mins > 20 mins
% who were 'very satisf ied'
Length of time taken to vote
Overa
ll s
ati
sfa
cti
on
wit
h v
oti
ng
at
STH
Q5. Taking everything into account, from the moment you arrived at Sydney Town Hall today, how satisfied or dissatisfied were you with voting at Sydney Town Hall today?
Q14. How long did it take you to vote – thinking about the total time taken from arriving at Sydney Town Hall to casting your vote in the ballot box?
Base n=180, total sample.
However, only 15% of those who waited for over 20 minutes and 8% of those who waited for
10-20 minutes were dissatisfied, and no electors who waited for 10 minutes or less were
dissatisfied.

NSW Electoral Commission
Survey of Electors, Sydney Town Hall | September 2012 | Page 15
Table 14: Overall satisfaction with voting at Sydney Town Hall
Council Age Gender
Total Sydney
Council Area
Other 18 -
24
25 -
34
35 -
54
55+ Male Female
Very satisfied 56% 52% 58% 60% 53% 53% 54% 56% 54%
Fairly satisfied 31% 35% 28% 33% 31% 23% 37% 30% 32%
Neither satisfied nor
dissatisfied
6% 7% 6% 2% 13% 5% 3% 6% 6%
Fairly dissatisfied 4% 4% 4% 2% 0% 12% 3% 3% 5%
Very dissatisfied 4% 3% 5% 2% 4% 7% 3% 5% 3%
Q5. Taking everything into account, from the moment you arrived at Sydney Town Hall today, how satisfied or dissatisfied were you with voting at Sydney Town Hall today?
Base n=180, total sample.
As Table 15 outlines, below, the most common waiting time was over 20 minutes (38%).
Those who lived in the Sydney Council area were more likely than those who lived elsewhere to
have waited less than five minutes (21% compared to 10%).
Table 15: Time taken to vote
Council Age Gender
Total Sydney
Council Area
Other 18 -
24
25 -
34
35 -
54
55+ Male Female
I didn’t have to wait 3% 1% 4% 4% 2% 5% 0% 5% 0%
Less than 5 minutes 15% 21% 10% 16% 20% 9% 14% 17% 13%
Between 5 - 10 minutes 16% 13% 18% 16% 7% 21% 23% 15% 18%
Between 10 - 15 minutes 12% 11% 12% 13% 7% 12% 17% 9% 15%
Between 15 - 20 minutes 17% 21% 13% 16% 22% 12% 17% 15% 19%
Over 20 minutes 38% 32% 42% 36% 42% 42% 29% 40% 35%
Q14. How long did it take you to vote – thinking about the total time taken from arriving at Sydney Town Hall to casting your vote in the ballot box?
Base n=180, total sample.
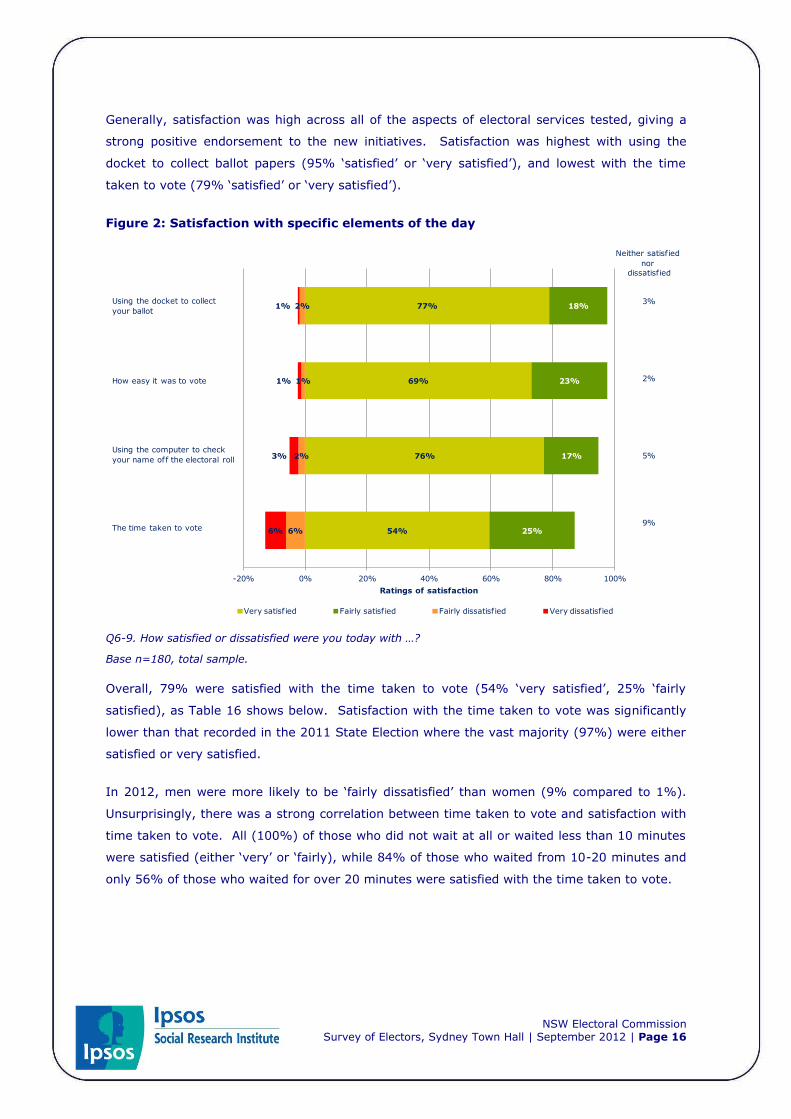
NSW Electoral Commission
Survey of Electors, Sydney Town Hall | September 2012 | Page 16
Generally, satisfaction was high across all of the aspects of electoral services tested, giving a
strong positive endorsement to the new initiatives. Satisfaction was highest with using the
docket to collect ballot papers (95% ‘satisfied’ or ‘very satisfied’), and lowest with the time
taken to vote (79% ‘satisfied’ or ‘very satisfied’).
Figure 2: Satisfaction with specific elements of the day
54%
76%
69%
77%
25%
17%
23%
18%
6%
2%
1%
2%
6%
3%
1%
1%
-20% 0% 20% 40% 60% 80% 100%
Ratings of satisfaction
Very satisf ied Fairly satisf ied Fairly dissatisf ied Very dissatisf ied
Neither satisf ied
nor
dissatisf ied
3%
2%
5%
9%
Using the docket to collect
your ballot
How easy it was to vote
Using the computer to check
your name off the electoral roll
The time taken to vote
Q6-9. How satisfied or dissatisfied were you today with …?
Base n=180, total sample.
Overall, 79% were satisfied with the time taken to vote (54% ‘very satisfied’, 25% ‘fairly
satisfied), as Table 16 shows below. Satisfaction with the time taken to vote was significantly
lower than that recorded in the 2011 State Election where the vast majority (97%) were either
satisfied or very satisfied.
In 2012, men were more likely to be ‘fairly dissatisfied’ than women (9% compared to 1%).
Unsurprisingly, there was a strong correlation between time taken to vote and satisfaction with
time taken to vote. All (100%) of those who did not wait at all or waited less than 10 minutes
were satisfied (either ‘very’ or ‘fairly), while 84% of those who waited from 10-20 minutes and
only 56% of those who waited for over 20 minutes were satisfied with the time taken to vote.

NSW Electoral Commission
Survey of Electors, Sydney Town Hall | September 2012 | Page 17
Table 16: Satisfaction with the time taken to vote
Council Age Gender
Total Sydney
Council Area
Other 18 -
24
25 -
34
35 -
54
55+ Male Female
Very satisfied 54% 59% 50% 60% 53% 51% 51% 50% 59%
Fairly satisfied 25% 19% 30% 24% 18% 30% 29% 23% 28%
Neither satisfied nor
dissatisfied
9% 9% 9% 7% 16% 7% 3% 12% 5%
Fairly dissatisfied 6% 9% 3% 2% 5% 5% 11% 9% 1%
Very dissatisfied 6% 4% 8% 4% 7% 7% 6% 6% 6%
Don’t know 1% 0% 1% 2% 0% 0% 0% 1% 0%
Q9 How satisfied or dissatisfied were you today with the time taken to vote?
Base n=180, total sample.
The vast majority of electors (93%) were satisfied with the ease of voting (69% ‘very satisfied’,
23% ‘fairly satisfied), with men slightly less positive than women.
Table 17: Satisfaction with ease of voting
Council Age Gender
Total Sydney
Council Area
Other 18 -
24
25 -
34
35 -
54
55+ Male Female
Very satisfied 69% 69% 70% 73% 69% 65% 71% 65% 75%
Fairly satisfied 23% 20% 26% 24% 22% 23% 23% 23% 24%
Neither satisfied nor dissatisfied 5% 8% 3% 0% 5% 9% 6% 9% 0%
Fairly dissatisfied 1% 0% 2% 0% 2% 2% 0% 1% 1%
Very dissatisfied 1% 3% 0% 2% 2% 0% 0% 2% 0%
Q6 How satisfied or dissatisfied were you today with how easy it was to vote?
Base n=180, total sample.
As outlined below in Table 18, satisfaction with using the computer to check name of the
electoral roll was high, with 93% stating that they were ‘very satisfied’ (76%) or ‘fairly
satisfied’ (17%). Reflecting likely greater familiarity with using information technology, there
was a correlation between high satisfaction with the computer-based system and age. Almost
nine in ten (87%) younger voters (aged 18-24) were ‘very satisfied’, compared to 57% of
those aged 55 and over.
Among the nine surveyed electors who were dissatisfied with using the computer to check their
name off the roll, the most common reasons for this were security or privacy concerns,
followed by the system being difficult to use or not user friendly.
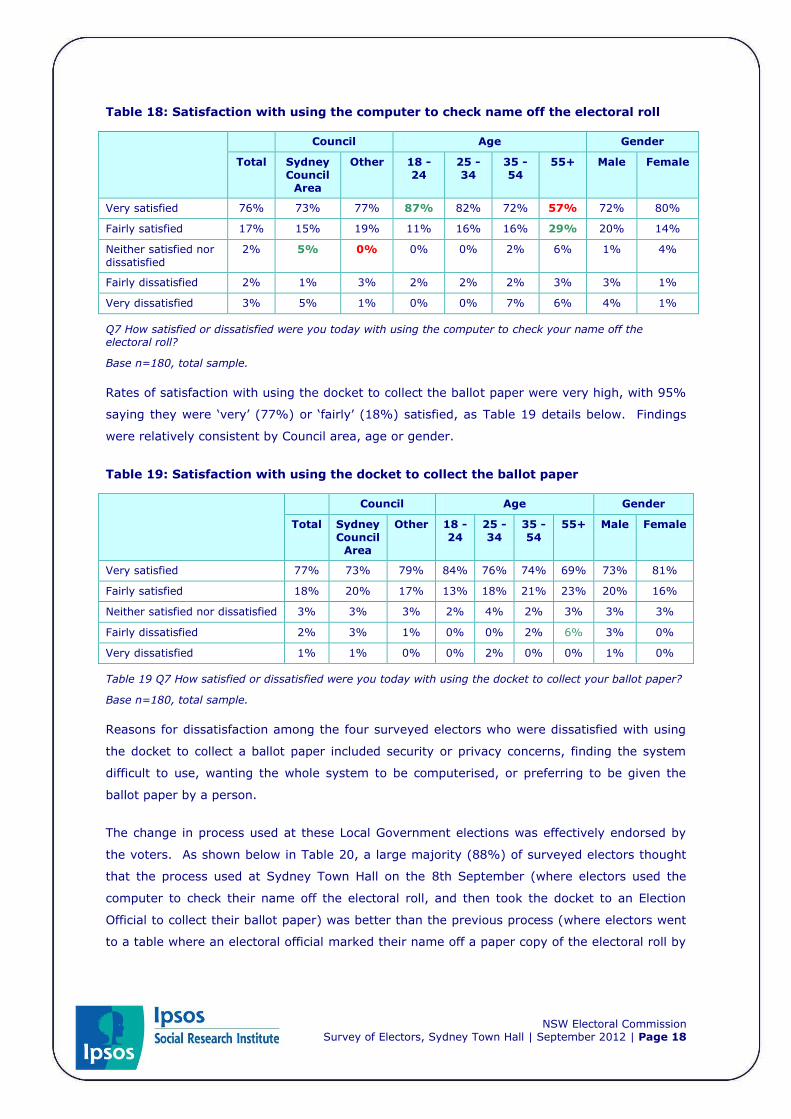
NSW Electoral Commission
Survey of Electors, Sydney Town Hall | September 2012 | Page 18
Table 18: Satisfaction with using the computer to check name off the electoral roll
Council Age Gender
Total Sydney
Council Area
Other 18 -
24
25 -
34
35 -
54
55+ Male Female
Very satisfied 76% 73% 77% 87% 82% 72% 57% 72% 80%
Fairly satisfied 17% 15% 19% 11% 16% 16% 29% 20% 14%
Neither satisfied nor
dissatisfied
2% 5% 0% 0% 0% 2% 6% 1% 4%
Fairly dissatisfied 2% 1% 3% 2% 2% 2% 3% 3% 1%
Very dissatisfied 3% 5% 1% 0% 0% 7% 6% 4% 1%
Q7 How satisfied or dissatisfied were you today with using the computer to check your name off the electoral roll?
Base n=180, total sample.
Rates of satisfaction with using the docket to collect the ballot paper were very high, with 95%
saying they were ‘very’ (77%) or ‘fairly’ (18%) satisfied, as Table 19 details below. Findings
were relatively consistent by Council area, age or gender.
Table 19: Satisfaction with using the docket to collect the ballot paper
Council Age Gender
Total Sydney
Council Area
Other 18 -
24
25 -
34
35 -
54
55+ Male Female
Very satisfied 77% 73% 79% 84% 76% 74% 69% 73% 81%
Fairly satisfied 18% 20% 17% 13% 18% 21% 23% 20% 16%
Neither satisfied nor dissatisfied 3% 3% 3% 2% 4% 2% 3% 3% 3%
Fairly dissatisfied 2% 3% 1% 0% 0% 2% 6% 3% 0%
Very dissatisfied 1% 1% 0% 0% 2% 0% 0% 1% 0%
Table 19 Q7 How satisfied or dissatisfied were you today with using the docket to collect your ballot paper?
Base n=180, total sample.
Reasons for dissatisfaction among the four surveyed electors who were dissatisfied with using
the docket to collect a ballot paper included security or privacy concerns, finding the system
difficult to use, wanting the whole system to be computerised, or preferring to be given the
ballot paper by a person.
The change in process used at these Local Government elections was effectively endorsed by
the voters. As shown below in Table 20, a large majority (88%) of surveyed electors thought
that the process used at Sydney Town Hall on the 8th September (where electors used the
computer to check their name off the electoral roll, and then took the docket to an Election
Official to collect their ballot paper) was better than the previous process (where electors went
to a table where an electoral official marked their name off a paper copy of the electoral roll by
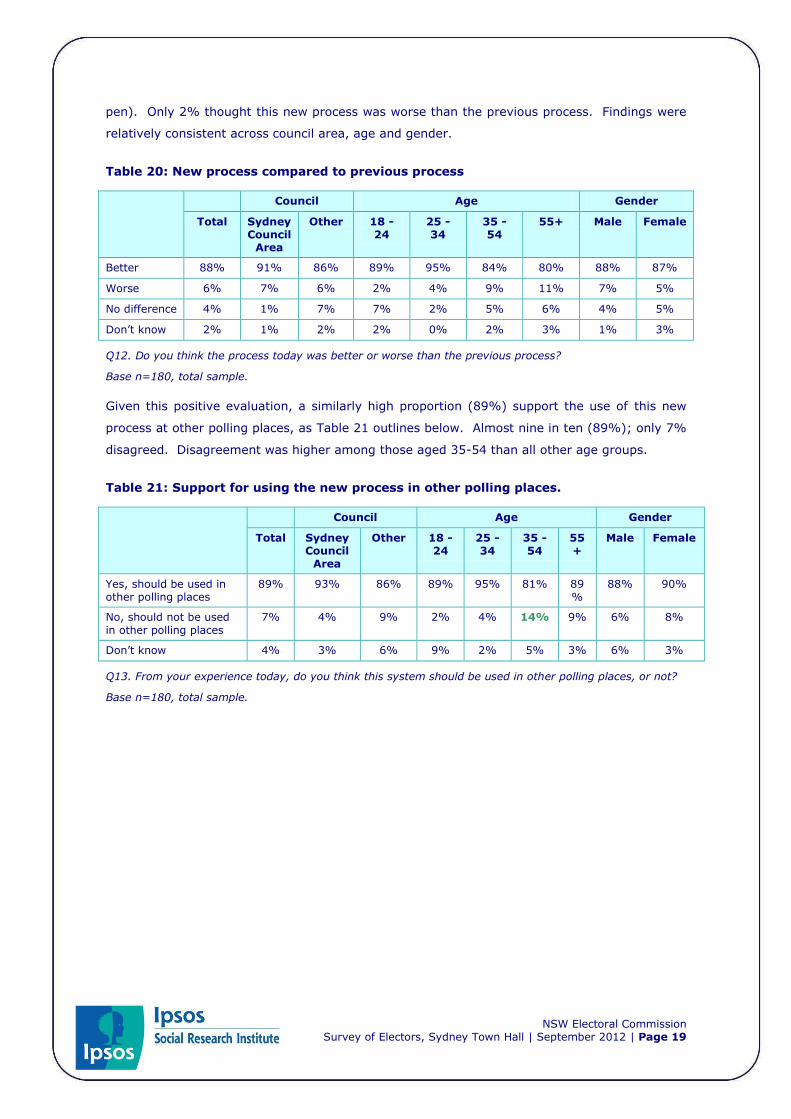
NSW Electoral Commission
Survey of Electors, Sydney Town Hall | September 2012 | Page 19
pen). Only 2% thought this new process was worse than the previous process. Findings were
relatively consistent across council area, age and gender.
Table 20: New process compared to previous process
Council Age Gender
Total Sydney Council
Area
Other 18 - 24
25 - 34
35 - 54
55+ Male Female
Better 88% 91% 86% 89% 95% 84% 80% 88% 87%
Worse 6% 7% 6% 2% 4% 9% 11% 7% 5%
No difference 4% 1% 7% 7% 2% 5% 6% 4% 5%
Don’t know 2% 1% 2% 2% 0% 2% 3% 1% 3%
Q12. Do you think the process today was better or worse than the previous process?
Base n=180, total sample.
Given this positive evaluation, a similarly high proportion (89%) support the use of this new
process at other polling places, as Table 21 outlines below. Almost nine in ten (89%); only 7%
disagreed. Disagreement was higher among those aged 35-54 than all other age groups.
Table 21: Support for using the new process in other polling places.
Council Age Gender
Total Sydney Council
Area
Other 18 - 24
25 - 34
35 - 54
55+
Male Female
Yes, should be used in other polling places
89% 93% 86% 89% 95% 81% 89%
88% 90%
No, should not be used
in other polling places
7% 4% 9% 2% 4% 14% 9% 6% 8%
Don’t know 4% 3% 6% 9% 2% 5% 3% 6% 3%
Q13. From your experience today, do you think this system should be used in other polling places, or not?
Base n=180, total sample.
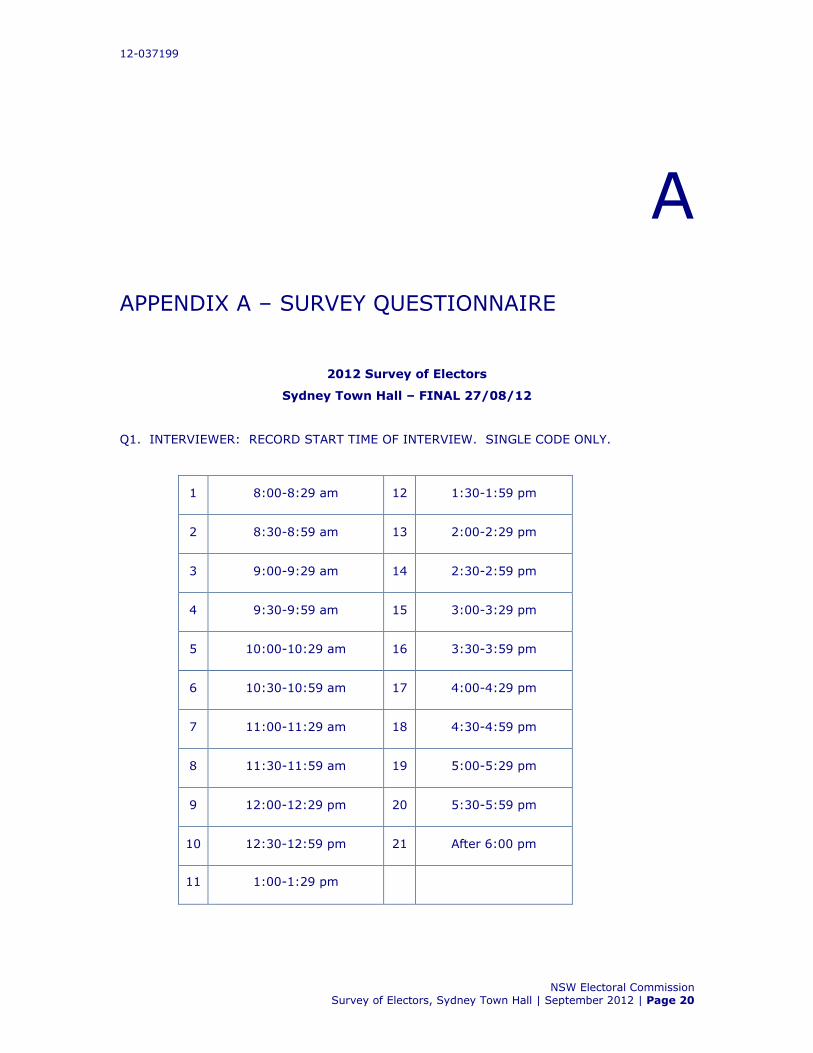
12-037199
NSW Electoral Commission
Survey of Electors, Sydney Town Hall | September 2012 | Page 20
A
APPENDIX A – SURVEY QUESTIONNAIRE
2012 Survey of Electors
Sydney Town Hall – FINAL 27/08/12
Q1. INTERVIEWER: RECORD START TIME OF INTERVIEW. SINGLE CODE ONLY.
1 8:00-8:29 am 12 1:30-1:59 pm
2 8:30-8:59 am 13 2:00-2:29 pm
3 9:00-9:29 am 14 2:30-2:59 pm
4 9:30-9:59 am 15 3:00-3:29 pm
5 10:00-10:29 am 16 3:30-3:59 pm
6 10:30-10:59 am 17 4:00-4:29 pm
7 11:00-11:29 am 18 4:30-4:59 pm
8 11:30-11:59 am 19 5:00-5:29 pm
9 12:00-12:29 pm 20 5:30-5:59 pm
10 12:30-12:59 pm 21 After 6:00 pm
11 1:00-1:29 pm

12-037199
NSW Electoral Commission
Survey of Electors, Sydney Town Hall | September 2012 | Page 21
We are undertaking a short survey to help the NSW Electoral Commission to provide
you with better electoral services. Please can you spare a few minutes? All
responses are anonymous and confidential.
SECTION A: VOTE SCREENING
Q2. Have you cast a vote today? SINGLE CODE ONLY.
Yes .......................................................................................... 1 GO TO Q3a
No ........................................................................................... 2 THANK AND CLOSE
Q3a. Do you live in Inner Sydney, Outer Sydney or elsewhere in New South Wales?
SINGLE CODE ONLY.
Inner Sydney ............................................................................ 1 GO TO Q3b
Outer Sydney ........................................................................... 2 GO TO Q3c
Elsewhere in NSW ..................................................................... 3 GO TO Q3d
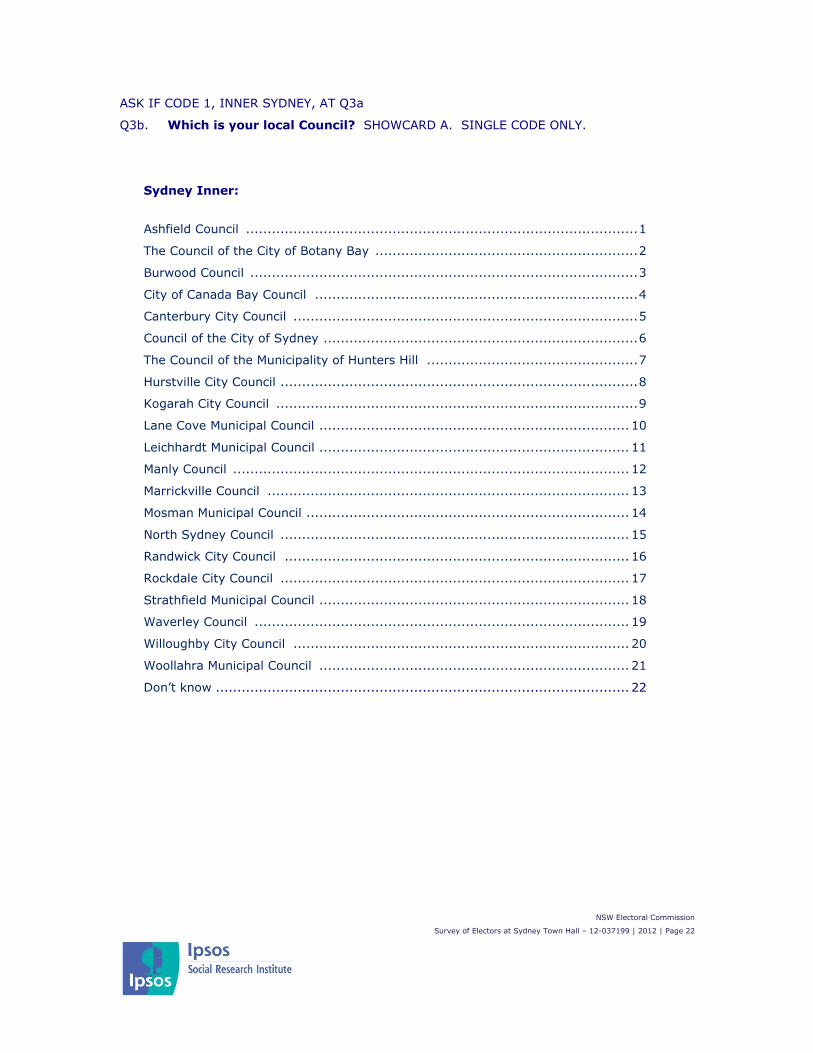
NSW Electoral Commission
Survey of Electors at Sydney Town Hall – 12-037199 | 2012 | Page 22
ASK IF CODE 1, INNER SYDNEY, AT Q3a
Q3b. Which is your local Council? SHOWCARD A. SINGLE CODE ONLY.
Sydney Inner:
Ashfield Council ........................................................................................... 1
The Council of the City of Botany Bay ............................................................. 2
Burwood Council .......................................................................................... 3
City of Canada Bay Council ........................................................................... 4
Canterbury City Council ................................................................................ 5
Council of the City of Sydney ......................................................................... 6
The Council of the Municipality of Hunters Hill ................................................. 7
Hurstville City Council ................................................................................... 8
Kogarah City Council .................................................................................... 9
Lane Cove Municipal Council ........................................................................ 10
Leichhardt Municipal Council ........................................................................ 11
Manly Council ............................................................................................ 12
Marrickville Council .................................................................................... 13
Mosman Municipal Council ........................................................................... 14
North Sydney Council ................................................................................. 15
Randwick City Council ................................................................................ 16
Rockdale City Council ................................................................................. 17
Strathfield Municipal Council ........................................................................ 18
Waverley Council ....................................................................................... 19
Willoughby City Council .............................................................................. 20
Woollahra Municipal Council ........................................................................ 21
Don’t know ................................................................................................ 22
NSW Electoral Commission
Survey of Electors at Sydney Town Hall – 12-037199 | 2012 | Page 23
ASK IF CODE 2, OUTER SYDNEY, AT Q3a
Q3c. Which is your local Council? SHOWCARD B. SINGLE CODE ONLY.
Sydney Outer:
Auburn City Council ...................................................................................... 1
Bankstown City Council ................................................................................ 2
Blacktown City Council ................................................................................. 3
Camden Council ........................................................................................... 4
Campbelltown City Council ............................................................................ 5
Fairfield City Council ..................................................................................... 6
The Hills Shire Council .................................................................................. 7
Holroyd City Council ..................................................................................... 8
The Council of the Shire of Hornsby ............................................................... 9
Ku-ring-gai Council .................................................................................... 10
Liverpool City Council ................................................................................. 11
Parramatta City Council .............................................................................. 12
Penrith City Council .................................................................................... 13
Pittwater Council ........................................................................................ 14
Ryde City Council ....................................................................................... 15
Sutherland Shire Council ............................................................................. 16
Warringah Council ...................................................................................... 17
Don’t know ................................................................................................ 18
ASK IF CODE 3, ELSEWHERE IN NSW, AT Q3a
Q3d. Which is your local Council? SHOWCARD C. SINGLE CODE ONLY.
Other NSW:
Albury City Council ....................................................................................... 1
Armidale Dumaresq Council .......................................................................... 2
Ballina Shire Council ..................................................................................... 3
Balranald Shire Council ................................................................................. 4
Bathurst Regional Council ............................................................................. 5
Bega Valley Shire Council .............................................................................. 6
Bellingen Shire Council ................................................................................. 7
Berrigan Shire Council .................................................................................. 8
NSW Electoral Commission
Survey of Electors at Sydney Town Hall – 12-037199 | 2012 | Page 24
Bland Shire Council ...................................................................................... 9
Blayney Shire Council ................................................................................. 10
Blue Mountains City Council ........................................................................ 11
Bogan Shire Council ................................................................................... 12
Bombala Council ........................................................................................ 13
Boorowa Council ........................................................................................ 14
Bourke Shire Council .................................................................................. 15
Brewarrina Shire Council ............................................................................. 16
Broken Hill City Council ............................................................................... 17
Byron Shire Council .................................................................................... 18
Cabonne Council ........................................................................................ 19
Carrathool Shire Council ............................................................................. 20
Central Darling Shire Council ....................................................................... 21
Cessnock City Council ................................................................................. 22
Clarence Valley Council ............................................................................... 23
Cobar Shire Council .................................................................................... 24
Coffs Harbour City Council .......................................................................... 25
Conargo Shire Council ................................................................................ 26
Coolamon Shire Council .............................................................................. 27
Cooma-Monaro Shire Council ....................................................................... 28
Coonamble Shire Council ............................................................................ 29
Cootamundra Shire Council ......................................................................... 30
Corowa Shire Council ................................................................................. 31
Cowra Shire Council ................................................................................... 32
Deniliquin Council ...................................................................................... 33
Dubbo City Council ..................................................................................... 34
Dungog Shire Council ................................................................................. 35
Eurobodalla Shire Council ........................................................................... 36
Forbes Shire Council ................................................................................... 37
Gilgandra Shire Council .............................................................................. 38
Glen Innes Severn Council .......................................................................... 39
Gloucester Shire Council ............................................................................. 40
Gosford City Council ................................................................................... 41
Goulburn Mulwaree Council ......................................................................... 42
Great Lakes Council ................................................................................... 43
Greater Hume Shire Council ........................................................................ 44
Greater Taree City Council .......................................................................... 45
NSW Electoral Commission
Survey of Electors at Sydney Town Hall – 12-037199 | 2012 | Page 25
Griffith City Council .................................................................................... 46
Gundagai Shire Council ............................................................................... 47
Gunnedah Shire Council .............................................................................. 48
Guyra Shire Council ................................................................................... 49
Gwydir Shire Council .................................................................................. 50
Harden Shire Council .................................................................................. 51
Hawkesbury City Council ............................................................................. 52
Hay Shire Council ...................................................................................... 53
Inverell Shire Council ................................................................................. 54
Jerilderie Shire Council ............................................................................... 55
Junee Shire Council .................................................................................... 56
Kempsey Shire Council ............................................................................... 57
The Council of the Municipality of Kiama ....................................................... 58
Kyogle Council ........................................................................................... 59
Lachlan Shire Council ................................................................................. 60
Lake Macquarie City Council ........................................................................ 61
Leeton Shire Council .................................................................................. 62
Lismore City Council ................................................................................... 63
City of Lithgow Council ............................................................................... 64
Liverpool Plains Shire Council ...................................................................... 65
Lockhart Shire Council ................................................................................ 66
Maitland City Council .................................................................................. 67
Mid-Western Regional Council ...................................................................... 68
Moree Plains Shire Council .......................................................................... 69
Murray Shire Council .................................................................................. 70
Murrumbidgee Shire Council ........................................................................ 71
Muswellbrook Shire Council ......................................................................... 72
Nambucca Shire Council ............................................................................. 73
Narrabri Shire Council ................................................................................ 74
Narrandera Shire Council ............................................................................ 75
Narromine Shire Council ............................................................................. 76
Newcastle City Council ................................................................................ 77
Oberon Council .......................................................................................... 78
Orange City Council .................................................................................... 79
Palerang Council ........................................................................................ 80
Parkes Shire Council ................................................................................... 81
Port Macquarie-Hastings Council .................................................................. 82

NSW Electoral Commission
Survey of Electors at Sydney Town Hall – 12-037199 | 2012 | Page 26
Port Stephens Council ................................................................................. 83
Queanbeyan City Council ............................................................................ 84
Richmond Valley Council ............................................................................. 85
Shellharbour City Council ............................................................................ 86
Shoalhaven City Council ............................................................................. 87
Singleton Council ....................................................................................... 88
Snowy River Shire Council .......................................................................... 89
Tamworth Regional Council ......................................................................... 90
Temora Shire Council ................................................................................. 91
Tenterfield Shire Council ............................................................................. 92
Tumbarumba Shire Council ......................................................................... 93
Tumut Shire Council ................................................................................... 94
Tweed Shire Council ................................................................................... 95
Upper Hunter Shire Council ......................................................................... 96
Upper Lachlan Shire Council ........................................................................ 97
Uralla Shire Council .................................................................................... 98
Urana Shire Council .................................................................................... 99
Wagga Wagga City Council ........................................................................ 100
The Council of the Shire of Wakool ............................................................. 101
Walcha Council ........................................................................................ 102
Walgett Shire Council ............................................................................... 103
Warren Shire Council ................................................................................ 104
Warrumbungle Shire Council ..................................................................... 105
Weddin Shire Council ............................................................................... 106
Wellington Council ................................................................................... 107
Wentworth Shire Council ........................................................................... 108
Wingecarribee Shire Council ...................................................................... 109
Wollondilly Shire Council ........................................................................... 110
Wollongong City Council ........................................................................... 111
Wyong Shire Council ................................................................................ 112
Yass Valley Council .................................................................................. 113
Young Shire Council .................................................................................. 114
Other (WRITE IN) ..................................................................................... 115
Don’t know/can’t remember ....................................................................... 116
NSW Electoral Commission
Survey of Electors at Sydney Town Hall – 12-037199 | 2012 | Page 27
SECTION B: VIEWS OF NSWEC
ASK ALL
Q4. SHOWCARD D (R) Overall, do you agree or disagree that the NSW Electoral Commission
conducts the Local Government Election fairly and impartially? SINGLE CODE ONLY.
Strongly agree .......................................................................... 1
Agree ...................................................................................... 2
Neither agree nor disagree ......................................................... 3
Disagree .................................................................................. 4
Strongly disagree ...................................................................... 5
Don’t know (DO NOT READ OUT) ................................................ 6
SECTION C: VOTING EXPERIENCE
Q5. SHOWCARD E (R) Taking everything into account, from the moment you arrived at
Sydney Town Hall today, how satisfied or dissatisfied were you with voting at Sydney
Town Hall today? SINGLE CODE ONLY.
Very satisfied............................................................................ 1
Fairly satisfied .......................................................................... 2
Neither satisfied nor dissatisfied .................................................. 3
Fairly dissatisfied ...................................................................... 4
Very dissatisfied ........................................................................ 5
Don’t know ............................................................................... 6
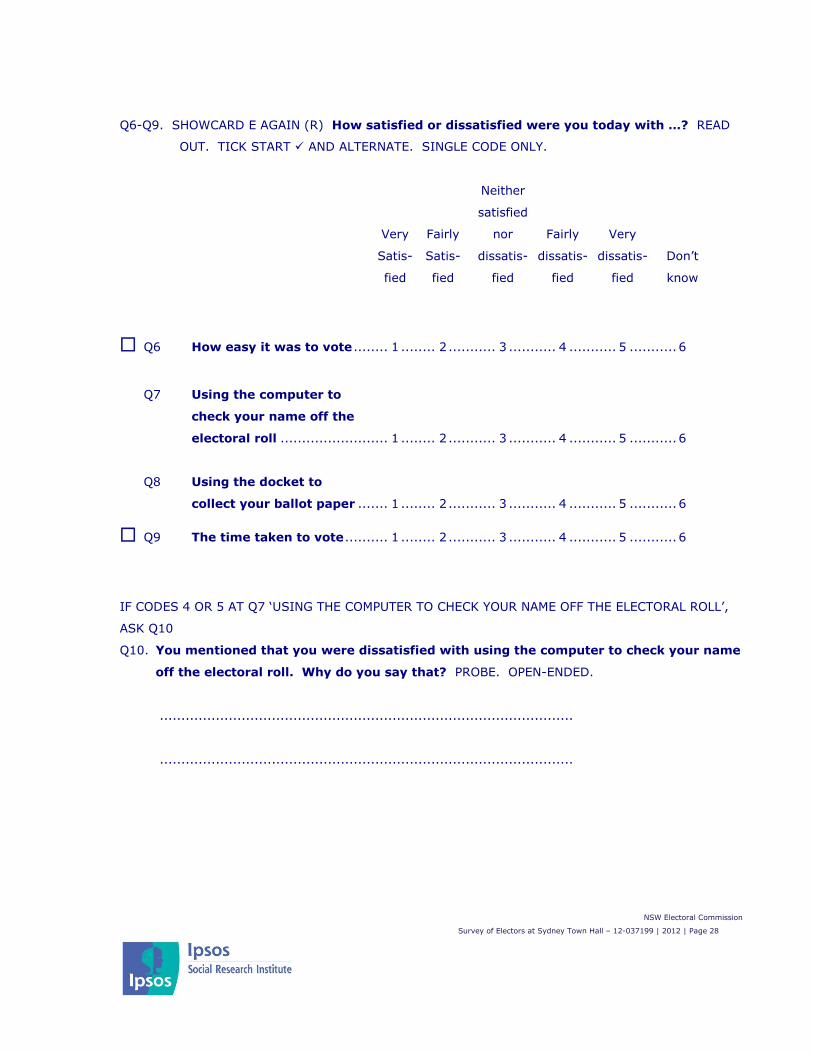
NSW Electoral Commission
Survey of Electors at Sydney Town Hall – 12-037199 | 2012 | Page 28
Q6-Q9. SHOWCARD E AGAIN (R) How satisfied or dissatisfied were you today with …? READ
OUT. TICK START AND ALTERNATE. SINGLE CODE ONLY.
Neither
satisfied
Very Fairly nor Fairly Very
Satis- Satis- dissatis- dissatis- dissatis- Don’t
fied fied fied fied fied know
Q6 How easy it was to vote ........ 1 ........ 2 ........... 3 ........... 4 ........... 5 ........... 6
Q7 Using the computer to
check your name off the
electoral roll ......................... 1 ........ 2 ........... 3 ........... 4 ........... 5 ........... 6
Q8 Using the docket to
collect your ballot paper ....... 1 ........ 2 ........... 3 ........... 4 ........... 5 ........... 6
Q9 The time taken to vote .......... 1 ........ 2 ........... 3 ........... 4 ........... 5 ........... 6
IF CODES 4 OR 5 AT Q7 ‘USING THE COMPUTER TO CHECK YOUR NAME OFF THE ELECTORAL ROLL’,
ASK Q10
Q10. You mentioned that you were dissatisfied with using the computer to check your name
off the electoral roll. Why do you say that? PROBE. OPEN-ENDED.
................................................................................................
................................................................................................
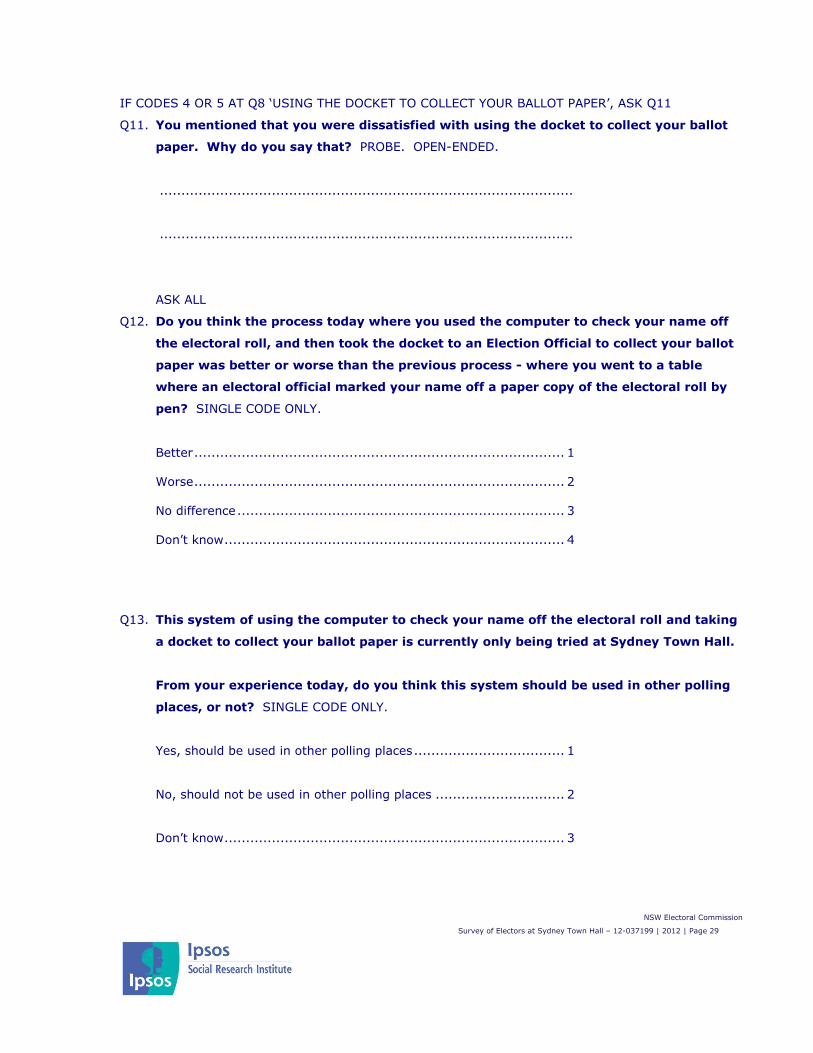
NSW Electoral Commission
Survey of Electors at Sydney Town Hall – 12-037199 | 2012 | Page 29
IF CODES 4 OR 5 AT Q8 ‘USING THE DOCKET TO COLLECT YOUR BALLOT PAPER’, ASK Q11
Q11. You mentioned that you were dissatisfied with using the docket to collect your ballot
paper. Why do you say that? PROBE. OPEN-ENDED.
................................................................................................
................................................................................................
ASK ALL
Q12. Do you think the process today where you used the computer to check your name off
the electoral roll, and then took the docket to an Election Official to collect your ballot
paper was better or worse than the previous process - where you went to a table
where an electoral official marked your name off a paper copy of the electoral roll by
pen? SINGLE CODE ONLY.
Better ...................................................................................... 1
Worse ...................................................................................... 2
No difference ............................................................................ 3
Don’t know ............................................................................... 4
Q13. This system of using the computer to check your name off the electoral roll and taking
a docket to collect your ballot paper is currently only being tried at Sydney Town Hall.
From your experience today, do you think this system should be used in other polling
places, or not? SINGLE CODE ONLY.
Yes, should be used in other polling places ................................... 1
No, should not be used in other polling places .............................. 2
Don’t know ............................................................................... 3
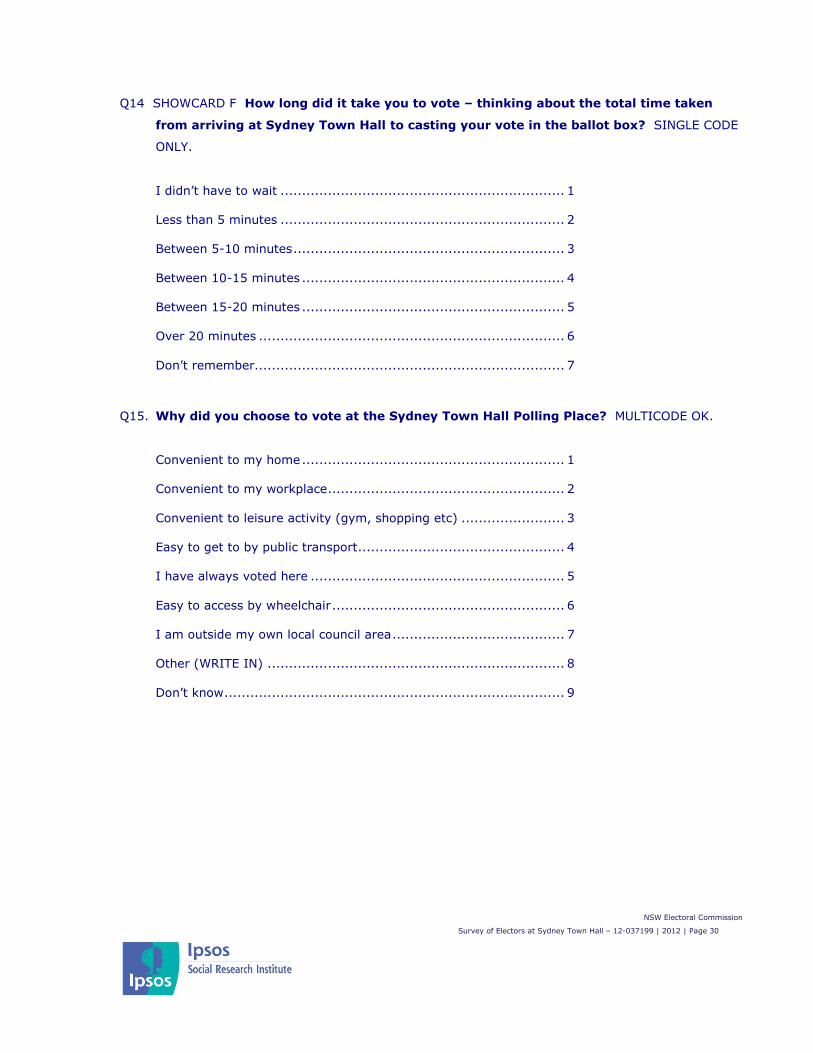
NSW Electoral Commission
Survey of Electors at Sydney Town Hall – 12-037199 | 2012 | Page 30
Q14 SHOWCARD F How long did it take you to vote – thinking about the total time taken
from arriving at Sydney Town Hall to casting your vote in the ballot box? SINGLE CODE
ONLY.
I didn’t have to wait .................................................................. 1
Less than 5 minutes .................................................................. 2
Between 5-10 minutes ............................................................... 3
Between 10-15 minutes ............................................................. 4
Between 15-20 minutes ............................................................. 5
Over 20 minutes ....................................................................... 6
Don’t remember........................................................................ 7
Q15. Why did you choose to vote at the Sydney Town Hall Polling Place? MULTICODE OK.
Convenient to my home ............................................................. 1
Convenient to my workplace ....................................................... 2
Convenient to leisure activity (gym, shopping etc) ........................ 3
Easy to get to by public transport ................................................ 4
I have always voted here ........................................................... 5
Easy to access by wheelchair ...................................................... 6
I am outside my own local council area ........................................ 7
Other (WRITE IN) ..................................................................... 8
Don’t know ............................................................................... 9
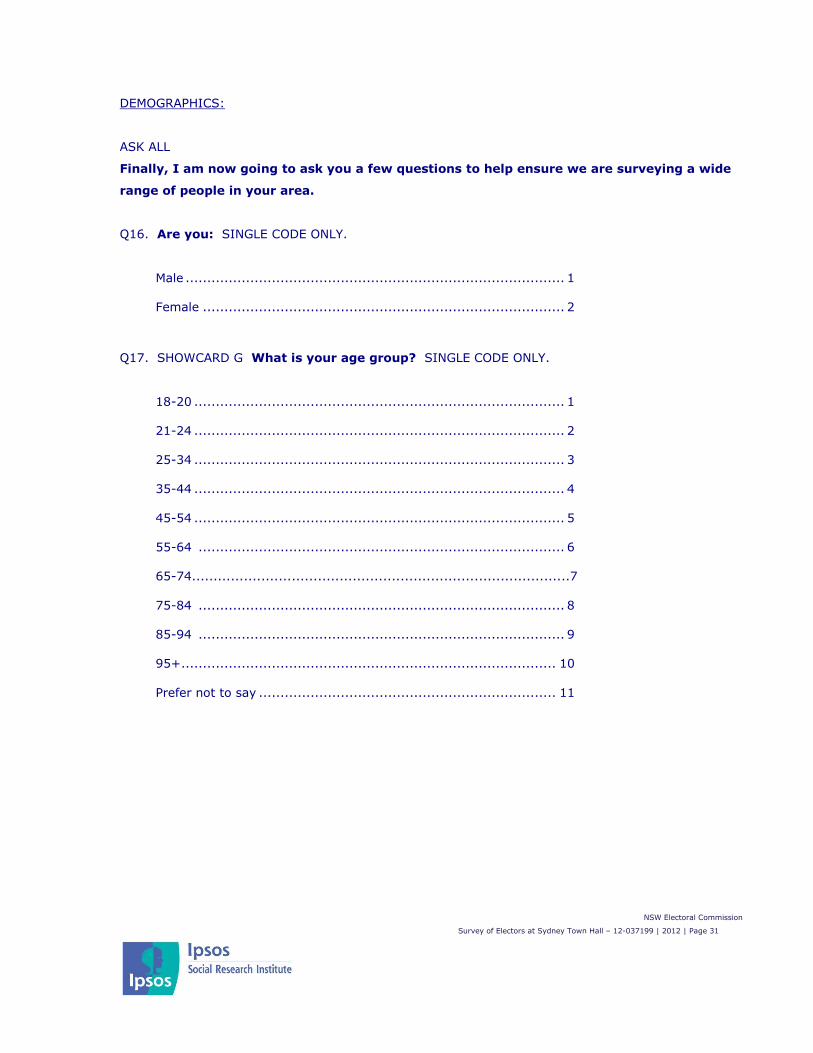
NSW Electoral Commission
Survey of Electors at Sydney Town Hall – 12-037199 | 2012 | Page 31
DEMOGRAPHICS:
ASK ALL
Finally, I am now going to ask you a few questions to help ensure we are surveying a wide
range of people in your area.
Q16. Are you: SINGLE CODE ONLY.
Male ........................................................................................ 1
Female .................................................................................... 2
Q17. SHOWCARD G What is your age group? SINGLE CODE ONLY.
18-20 ...................................................................................... 1
21-24 ...................................................................................... 2
25-34 ...................................................................................... 3
35-44 ...................................................................................... 4
45-54 ...................................................................................... 5
55-64 ..................................................................................... 6
65-74.......................................................................................7
75-84 ..................................................................................... 8
85-94 ..................................................................................... 9
95+ ....................................................................................... 10
Prefer not to say ..................................................................... 11
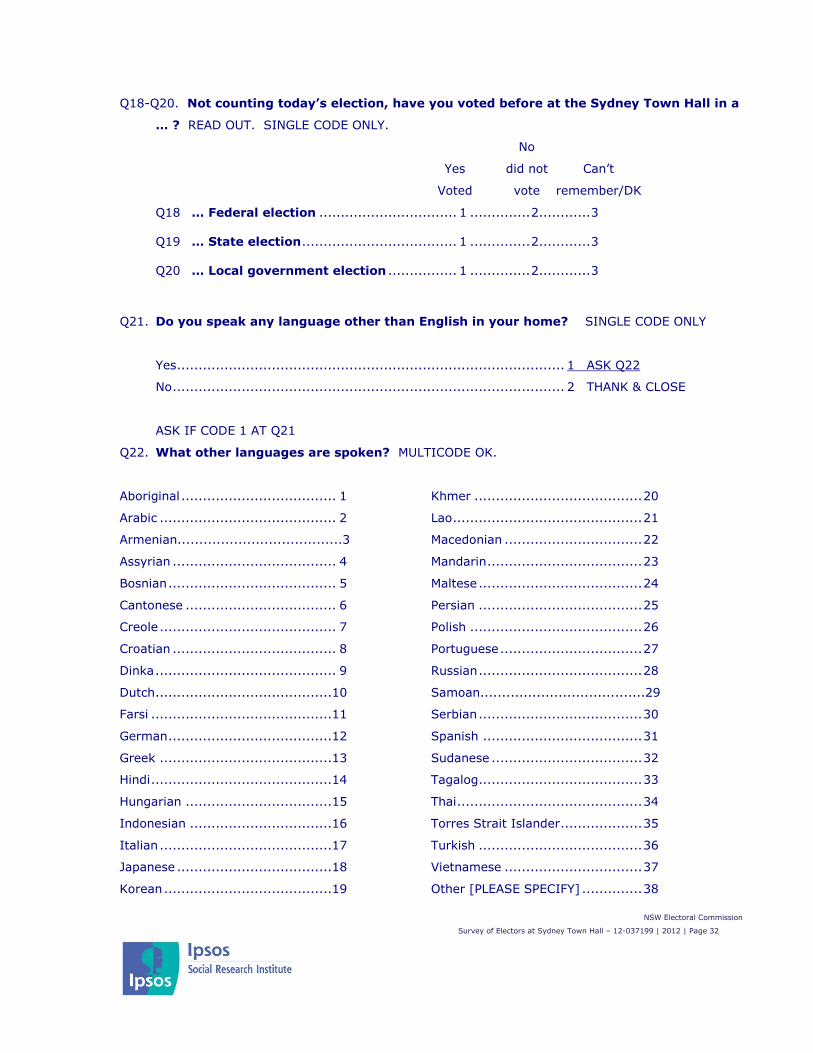
NSW Electoral Commission
Survey of Electors at Sydney Town Hall – 12-037199 | 2012 | Page 32
Q18-Q20. Not counting today’s election, have you voted before at the Sydney Town Hall in a
… ? READ OUT. SINGLE CODE ONLY.
No
Yes did not Can’t
Voted vote remember/DK
Q18 … Federal election ................................ 1 .............. 2............ 3
Q19 … State election .................................... 1 .............. 2............ 3
Q20 … Local government election ................ 1 .............. 2............ 3
Q21. Do you speak any language other than English in your home? SINGLE CODE ONLY
Yes .......................................................................................... 1 ASK Q22
No ........................................................................................... 2 THANK & CLOSE
ASK IF CODE 1 AT Q21
Q22. What other languages are spoken? MULTICODE OK.
Aboriginal .................................... 1
Arabic ......................................... 2
Armenian......................................3
Assyrian ...................................... 4
Bosnian ....................................... 5
Cantonese ................................... 6
Creole ......................................... 7
Croatian ...................................... 8
Dinka .......................................... 9
Dutch .........................................10
Farsi ..........................................11
German ......................................12
Greek ........................................13
Hindi ..........................................14
Hungarian ..................................15
Indonesian .................................16
Italian ........................................17
Japanese ....................................18
Korean .......................................19
Khmer ....................................... 20
Lao ............................................ 21
Macedonian ................................ 22
Mandarin .................................... 23
Maltese ...................................... 24
Persian ...................................... 25
Polish ........................................ 26
Portuguese ................................. 27
Russian ...................................... 28
Samoan......................................29
Serbian ...................................... 30
Spanish ..................................... 31
Sudanese ................................... 32
Tagalog ...................................... 33
Thai ........................................... 34
Torres Strait Islander ................... 35
Turkish ...................................... 36
Vietnamese ................................ 37
Other [PLEASE SPECIFY] .............. 38

NSW Electoral Commission
Survey of Electors at Sydney Town Hall – 12-037199 | 2012 | Page 33
Thank you very much for taking part in this survey – your help is appreciated.
As a Market Research company, we comply with the requirements of the Privacy Act.
Would you like me to read you our full Privacy Statement?
If NO:
In case you missed it earlier, my name is …. from I-view. If you would like to contact my
supervisor to check the validity of this study you can call I-view on: Hand PR card
Thank you very much for your co-operation with our survey. In case my supervisor
needs to contact you to check the validity of this interview, could I please ask for your
name and phone number?
If YES:
In accordance with the new Privacy Act, once information processing has been
completed, please be assured that your name and contact details will be removed from
your responses to this survey. After that time we will no longer be able to identify the
responses provided by you.
However, for the period that your name and contact details remain with your survey
responses, which will be approximately 6 weeks, you will be able to contact us to
request that some or all of your information be deleted.
Thank you very much for your co-operation with our survey. In case my supervisor
needs to contact you to check the validity of this interview, could I please ask for your
name and phone number?
NAME: __________________________________________________
PHONE:__________________________________________________
POSTCODE: _____________________

NSW Electoral Commission
Survey of Electors at Sydney Town Hall – 12-037199 | 2012 | Page 34
I CERTIFY THAT THIS INTERVIEW WAS CONDUCTED IN ACCORANCE WITH THE CODE OF
PROFESSIONAL BEHAVIOUR ICC/ESOMAR AND HAS BEEN CHECKED FOR
COMPLETENESS.
INTERVIEWER NAME: ____________________________ ID#__________
SIGNATURE: ____________________________DATE:_____________
INTERVIEW LENGTH: ________________________