Report on Single Parent Survey - mncourts.gov · Report on Single Parent Survey ... only nine...
40
Report on Single Parent Survey Prepared by: Fourth Judicial District Research Division April 2007 Questions can be referred to: Deborah A. Eckberg, Ph.D. Principal Research Associate 612-348-2811 [email protected]
Transcript of Report on Single Parent Survey - mncourts.gov · Report on Single Parent Survey ... only nine...

Report on Single Parent Survey
Prepared by:
Fourth Judicial District Research Division
April 2007
Questions can be referred to:
Deborah A. Eckberg, Ph.D.
Principal Research Associate
612-348-2811

2
Fourth Judicial District Research Division Staff
Marcy R. Podkopacz, Ph.D.
Research Director
Deborah A. Eckberg, Ph.D.
Principal Research Associate
Anne Caron, MLS
Research Analyst II
Gina Kubits
Research Analyst

3
Acknowledgements
First of all, we would like to acknowledge that this study was the brainchild of Judge
Bruce Peterson, presiding judge of the Family Court division of the Fourth Judicial
District. Judge Peterson identified a gap in the system – the fact that never married
parents were not receiving the same level of tailored services as divorcing parents – and
began putting in place measures to fill that gap. This survey is one of those measures and
is a prime example of Judge Peterson’s emphasis on using empirical data to make
important policy decisions.
From the beginning, Judge Peterson knew he could not effect change alone, and gathered
around himself a group of professionals known as the Unmarried Parent Working Group.
This group includes judicial officers, attorneys, child support case managers, and
community advocates, among others, and meets on a regular basis to address the issues
and concerns of single parents. This group was instrumental in helping us design our
survey, and provided feedback as to what data would be most critical to have.
Finally, we were extremely fortunate to have a group of 21 District Court employees who
volunteered to help us conduct the survey. These volunteers are: Vicki Albu, Ivy
Bambenek, Ann Basta, Patricia Chisolm, Tammie Davis, Heather Harper, Stepheni
Hubert, Kerri Mackenthun, Amy Micek, Laurie Middleton, Sherry Morris, Krystyna
Sills, Mary Stebbins, Michele Stenzel, Marquetta Stokes, Sue Striker, Wayne Thell, Judy
Ulrich, Marsha Unthank, Naomie Youngmark, George Zissos. We appreciate the time
they gave us out of their busy schedules to help accomplish this task; we could not have
done it without them.

4
Executive Summary
Services provided to divorcing couples are not generally available to couples who
share children but were never married.
The Fourth Judicial District Research Division conducted a survey of these single
parents who had cases on the child support and paternity calendars from January
through March of 2007. The primary purposes of the survey were as follows:
o To be able to clearly describe the characteristics of single parent litigants
o To identify the problems and needs of single parent litigants
o To recommend to the court and other agencies how we can make
appropriate resources more accessible to single parent litigants.
We interviewed 167 single parents. Survey respondents were evenly split by
gender, mostly in their 20’s and 30’s, and primarily African-American (61%).
Half of the respondents lived in Minneapolis.
Respondents were not highly educated (65% had a high school diploma or less),
and one-third were unemployed at the time of the survey. Of those that were
employed, nearly half worked part-time. Median wage for those employed was
$11.99/hour, or between $12,000 and $13,000 per year for those working twenty
hours per week. Many who were ordered to pay child support were experiencing
problems making those payments.
Almost half of respondents lacked stable housing.
One-quarter of respondents, representing one-half of the male respondents, had a
criminal record, mostly for drug and assault cases.
Respondents had anywhere from 1 to 8 children, and the most common age noted
was less than 1 year old (infant). There were, on average, two different biological
co-parents for each respondent’s children. Respondents’ relationships with co-
parents could be characterized as less than warm.
Although one-third of respondents said they would like to have more contact with
their child, only nine respondents had actually filed a custody or parenting time
case with the court.
We asked respondents about the services they needed, and discovered that the top
three services needed were help with education, help with finding a job, and help
with childcare. Men were significantly more likely to need help finding a job,
younger respondents were significantly more likely to need help finding a job and
with education, and respondents who were the sole custodians of their children
were significantly more likely to need help with childcare.

5
Table of Contents
Acknowledgements 3
Executive Summary 4
Background 6
The Calendars 6
Research Design 8
Basic Demographic Data 9
Socioeconomic Status 11
Employment Stability 15
Child Support Obligations 16
Housing 18
Court Involvement and Criminal History 20
Family Situation 22
Relationship with Co-Parent 25
Treatment 26
Services Needed 27
Conclusions 29
Appendix A: Introduction to Survey 30
Appendix B: Survey 31
Appendix C: Responses to Question about Why No Custody/Parenting
Time Case Filed
40
References
41
6
Background
Children born to parents who are not married to each other have become increasingly
common in our society. In 1960, only 6% of births were to single parents; in 2005, that
number had risen to 33% (Mathematica Policy Research, 2005). In Minneapolis, the non-
marital birth rate for U.S. born African-American women in 2005 was 86.6% (Minnesota
Department of Health, 2007). Individuals in these single relationships are often struggling
financially, which adds to the difficulties of childrearing and co-parenting. These children
in turn are at greater risk of poverty and problems with their health, behavior, and
academic performance (Mathematica Policy Research, 2005).
The Fourth Judicial District of Minnesota has worked to increase and improve services to
divorcing couples, in part to help them resolve child support and co-parenting issues (see,
for example, Family Court: Initial Case Management Conference Program Evaluation,
Hennepin County District Court Research Division, 2002); however, those individuals
who share children but were never married do not generally benefit from these recent
family court initiatives. To this end, the presiding Judge of Family Court, Judge Bruce
Peterson, spearheaded an effort in 2006 to begin paying more attention to the needs of the
unmarried parent population.
One of the steps Judge Peterson took was to convene a group of interested stakeholders to
meet on a regular basis and discuss the needs of the single parents seen on the child
support and paternity calendars. This group includes judicial officers, county attorneys,
defense attorneys, child support workers, and community advocates, among others. In the
fall of 2006, Judge Peterson invited the Research Division of the Fourth Judicial District
to meet with this group and work with them to develop a survey for single parent
litigants, with the hopes of better understanding and delivering services to this particular
population. The primary purposes of the survey were as follows:
1. To be able to clearly describe the characteristics of single parent litigants
2. To identify the problems and needs of single parent litigants
3. To recommend to the court and other agencies how we can make appropriate
resources more accessible to single parent litigants.
The Research Division surveyed 167 people between the end of January and the
beginning of March 2007. (See more about Research Design, below).
The Calendars
Family court cases for unmarried parents are typically seen on one of three types of
calendars: the Paternity Calendar, the County Attorney calendar (also known as the
“contempt” calendar), and the Child Support Magistrate calendar. On these calendars,
the County Attorney represents the Hennepin County Support and Collections division of
the Department of Economic Assistance, and is principally interested in financial issues;
thus parenting issues are typically not addressed.

7
Paternity Calendar (PA)
If a Recognition of Parentage form (ROP) does not exist, a single parent must begin on
the Paternity calendar. The Paternity calendar is a “triage” calendar where child support
case managers from the county’s Support and Collections division and county attorneys
work with litigants to establish parentage. Public defenders are also present to represent
the parties if they are deemed eligible.1 Adjudication of paternity may be as simple as
individuals agreeing that they are the parents of the child in question, or it may include a
genetic test to establish parentage (typically for the man assumed to be the father, which
is why the calendar is labeled a “paternity” calendar). Once paternity is established
(either via the results of genetic testing or an agreement), the case can move on to a
courtroom where a judicial officer officially adjudicates paternity and sets child support.
The child support amount is generally recommended by the Hennepin County Support
and Collections employees who have made an assessment of the individuals’ financial
background. The Paternity calendar handles cases on Wednesday mornings and
afternoons, and typically processes between 30 and 50 cases each week.
JOBS Calendar
The Jobs calendar is a calendar for non-custodial parents (virtually all fathers) who
cannot pay child support because they are unemployed. The calendar provides special
processing, regular monitoring, and employment and education services to help these
parents find and maintain steady employment. The calendar only meets once a month,
but can handle up to 92 cases each time.
Child Support Magistrate Calendars (CSM)
If a Recognition of Parentage (ROP) form has already been signed (e.g., at the hospital
when the child is born), cases can go directly to one of the two Child Support Magistrate
calendars to set child support. The cases are usually set on this calendar by the County
Attorney. The cases can also be set on these calendars by the litigants themselves, if a
review of or modification to child support is requested. For example, if a father loses his
job, he may request a modification to his child support payments until he has stable
income again.
Child Support Magistrate calendars are officiated by a magistrate2 and heard every
weekday, both mornings and afternoons. There are approximately 20 cases per day seen
on each of these two calendars.
1 Eligibility determination is somewhat subjective and takes into account family size and other current child
support orders. Typically, individuals need to make less than $8.00 per hour or $1,000 per month to be
eligible for a public defender. 2 Attorneys hired by contract to handle these types of cases.

8
County Attorney Calendars (CA)
Cases on these calendars are set by the County Attorney, usually because someone who
has been court ordered to pay child support is currently not paying. These calendars are
also often referred to as “contempt” calendars, as one of the parties is often in contempt
of court for refusal to make adequate child support payments. The calendars are officiated
by a judicial officer, and are heard Mondays and Thursdays, both mornings and
afternoons. Hennepin County Support and Collections workers and public defenders also
staff these calendars. There are a minimum of twelve cases scheduled on these calendars,
three times per week.
Research Design
Research staff and volunteers were present at as many calendars as possible during the
study period. We would arrive approximately fifteen minutes before the calendar was
scheduled to begin. The protocol was to approach litigants before their court hearing, at
times when they were not engaged in discussion with an attorney or child support case
manager. When approaching a potential survey respondent, researchers were instructed to
ask two screening questions and provide a brief introduction to the survey (see Appendix
A). The screening questions were designed to ensure that we were not interviewing any
previously married couples and also that we were interviewing individuals from the
appropriate calendars.3
After asking the screening questions, we asked litigants whether they would be willing to
answer some questions to help improve the services the court offers to people in similar
situations to their own. We informed them that the survey was completely anonymous,
and would only take 5-10 minutes.
A full copy of the survey can be found in Appendix B. We asked litigants questions
about their demographics, education, employment, children, involvement with the courts,
and personal struggles (e.g., physical and mental health, financial stress, etc.) as well as
specific questions about the types of services which might be most helpful to them. The
following sections provide descriptive analysis of the single parents’ responses to the
survey items.
3 Sometimes people wander down the hall to sit in a waiting area outside of a different courtroom. There
were at times individuals from, for example, domestic assault hearings outside the paternity calendar.

9
Basic Demographic Data
We interviewed a total of 167 single parents on four different types of calendars. Of
these respondents, 87 (52%) appeared on the Paternity calendar, 66 (40%) on the County
Attorney calendar, eleven (7%) on the JOBS calendar, and the remaining three (2%) on
either the Child Support Magistrate (CSM) or other type of calendar.4
Chart 1. Calendar Type
(N=167)
52%
40%
7%1% 1%
0%
20%
40%
60%
80%
100%
Paternity County Attorney JOBS Child Support
Magistrate
Other
% o
f sam
ple
Survey respondents were relatively young and were fairly evenly split by gender. Forty-
six percent were male and 54% were female; approximately half were under age thirty.
Over half the respondents (61%) were Black/African American, approximately one-
fourth (26%) were White, and the remainder (13%) were Asian, Native American, or
Multiracial/Other. Regardless of race, 7% indicated that they were of Hispanic descent;
more than half of these people did not self-report identifying with any other racial group.
Table 1. Demographic Data
Gender
(N=166)
Male 76 (45.8%)
Female 90 (54.2%)
Age (N=167)
18 or younger 4 (2.4%)
19 - 24 42 (25.1%)
25 - 29 40 (24.0%)
30 - 39 66 (39.5%)
40 or older 15 (9.0%)
Race
(N=165)
Black/African American 100 (60.6%)
White 43 (26.1%)
Other 22 (13.3%)
Hispanic
(N=166)
Yes 12 (7.2%)
No 154 (92.8%)
Most respondents (90%) spoke English as their primary language at home. For the 10%
that did not, seven spoke Spanish as their primary language, four Somali, three Hmong,
4 Due to the scheduling of CSM cases, we were not able to accomplish interviews on the paternity or
county attorney calendars and simultaneously on the CSM calendars.

10
one French, and one Swahili. Of the 16 who did not speak English most often at home,
all but one did speak English in addition to their primary language.
Over half of respondents (51%) lived in Minneapolis, and more than a third (37%) lived
in a Hennepin County suburb. Seven percent resided in St. Paul or a St. Paul suburb, and
5% outside of the Twin Cities. Of the 85 Minneapolis residents, over half (54%) lived in
North Minneapolis and the remainder lived in South Minneapolis (39%) or another area
of Minneapolis (7%)
Chart 2. Geographic Breakdown of the Sample
(N=166)
Not in
Tw in Cities
5%
Northern suburb
21%
Western suburb
8%
St. Paul/suburb
7%
Minneapolis
51%
Southern suburb
8%
Chart 3. Geographic Breakdown of the Minneapolis Residents
(N=85)
North Mpls
54%
South Mpls
39%
Mpls Other
7%

11
Socioeconomic Status
In the social sciences, socioeconomic status is generally interpreted as a three-pronged
construct which includes education, income, and occupation. Although we did not
collect information on specific occupations, we did ask the respondents to provide
employment status, as well as education and income data.
Overall, the survey respondents were not highly educated. More than one-fourth (28%)
did not complete high school, and another group of more than one-third (37%) had no
formal education beyond a high school diploma/GED. Although more than one-third
(35%) of respondents had some education beyond high school, only 10% obtained a
college degree or post-graduate education; an additional 6% graduated from a vocational
school program.
Table 2. Education
Level of Education
(N=163)
Less than high school 45
27.6%
High school graduate/GED 61
37.4%
Some vocational school 6
3.7%
Vocational school graduate 10
6.1%
Some college 25
15.3%
College graduate 13
8.0%
Post-graduate studies 3
1.8%

12
Two-thirds (66%) of respondents reported being employed; the remaining one-third
relied on public assistance (15%), Social Security payments (3%), relatives (7%), or
another unspecified source of support (9%). Nearly all (92%) of those who relied on
public assistance were women, although there were nearly as many women as men
employed. This is one of the largest gender differences we saw in all the survey data. The
eleven individuals who relied on friends/relatives for income were all men.
Chart 4. Primary Source of Income
(N=163)
66%
15%
3% 7% 9%
0%
20%
40%
60%
80%
100%
Employment Public
Assistance
Social Security Relatives Other
% o
f s
am
ple
Chart 5. Primary Source of Income by Gender
N=163
64%
3% 3%
15% 15%
66%
26%
3% 0%5%
0%
20%
40%
60%
80%
100%
Employment Public Assistance Social Security Relatives Other
% o
f s
am
ple
Men Women

13
Of the 66% of respondents who were employed, almost half (41%) of the employed
respondents worked less than full time. In other words, two-thirds of all respondents had
less than full-time employment. Approximately one-third (34%) worked between 20 and
39 hours per week, and 7% worked less than 20 hours per week.
Chart 6. If employed, number of hours per week
(N=106)
40 hrs/w k
or more
59%
Betw een
20-39 hrs/w k
34%
Less than
20 hrs/w k
7%

14
Overall, employed respondents were not highly paid. Although 10% of employed
respondents earned $21.00 or more per hour, two people (2%) reported earning the
minimum wage of $6.15/hour and more than two-thirds (69%) earned more than
minimum wage but less than $13.00 per hour. Eight people reported a figure other than
an hourly wage (e.g., commission, “varies”, a weekly or monthly figure, etc.). The
adjusted average hourly wage of those respondents who reported an hourly figure was
$12.81.5 The median, or midpoint, was $11.99. In addition, this salary figure only
represents two-thirds of our sample, as one-third are not working at all (See Chart 5 on
previous page).
Taking into consideration the data in the previous chart which shows that nearly half of
respondents work less than full-time, we can safely say that the income level of these
individuals is low. Specifically, at 20 hours a week we are looking at an average income
of between $12,000 and $13,000; even at 40 hours per week, average salary would be
approximately $25,000. In the last census, the median income for Minneapolis was
reported as $48,602 (Wikipedia 2007), putting our population well below the median. In
1999, 19% of Minneapolis families with children under the age of 18 fell below the
poverty level (City of Minneapolis 2007). This will be important as we look at the child
support payments required.
Chart 7. Hourly Wage of Employed Respondents
(N=94)
2%4%
12%
7%
18%
8%
20%
4%1%
4%1%
4%1% 1%
13%
0%
20%
40%
60%
80%
100%
Less
than
$7
$7-$
7.99
$8-$
8.99
$9-$
9.99
$10-
$10.
99
$11-
$11.
99
$12-
$12.
99
$13-
$13.
99
$14-
$14.
99
$15-
$15.
99
$16-
$16.
99
$17-
$17.
99
$18-
$18.
99
$19-
$19.
99
$20
or m
ore
% o
f e
mp
loy
ed
re
sp
on
de
nts
5 An adjusted average indicates that statistical outliers were removed for analysis. In this case, we removed
the individual who indicated that he earned $200/hour.

15
Employment Stability
Of employed respondents, nearly half had only been at their current jobs less than one
year, and half of those for three months or less. More than a third of respondents had
worked at their current job between one and three years, and one-fifth had done so for
four years or more. If we include all respondents in these figures (i.e., including those
who are unemployed), we find that half of all the respondents had been working three
months or less at the time that we conducted the interviews, and nearly two-thirds had
been working less than a full year.
Chart 8. Time at Current Job
(N=106)
24%
13%7%
37%
7% 9%5%
0%
20%
40%
60%
80%
100%
3 months
or less
4-6
months
7-11
months
1-3 yrs 4-5 yrs 6-10 yrs 11 yrs or
more
% o
f re
sp
on
de
nts
Fifteen percent of respondents had never held the same job for at least one year, and just
one third reported their longest period of regular employment at one job to have been
between one and three years.
Chart 9. Longest Time at One Job
(N=159)
5% 7%3%
38%
19% 19%
9%
0%
20%
40%
60%
80%
100%
3 months
or less
4-6
months
7-11
months
1-3 yrs 4-5 yrs 6-10 yrs 11 yrs or
more
% o
f res
pond
ents

16
Child Support Obligations
Nearly one-third of all respondents reported having a current child support obligation;
more than 60% of males and a very small percentage of females (3%) were currently
ordered to pay child support. Not all cases had a child support obligation imposed on at
least one parent. Because over half of respondents were appearing on the Paternity
calendar, where paternity was still in the process of being adjudicated, initial child
support may not yet have been set at the time the respondent completed the survey. In
addition, a respondent’s obligation may have been temporarily suspended due to a
financial hardship or other situation.
Chart 10. Have a Current Child Support Obligation?
(N=162)
Yes
30%No
70%
Chart 11. Have Current Child Support Obligation by Gender
(N=161)
Yes
Yes
No
No
0% 20% 40% 60% 80% 100%
Male
Female
Percentage
17
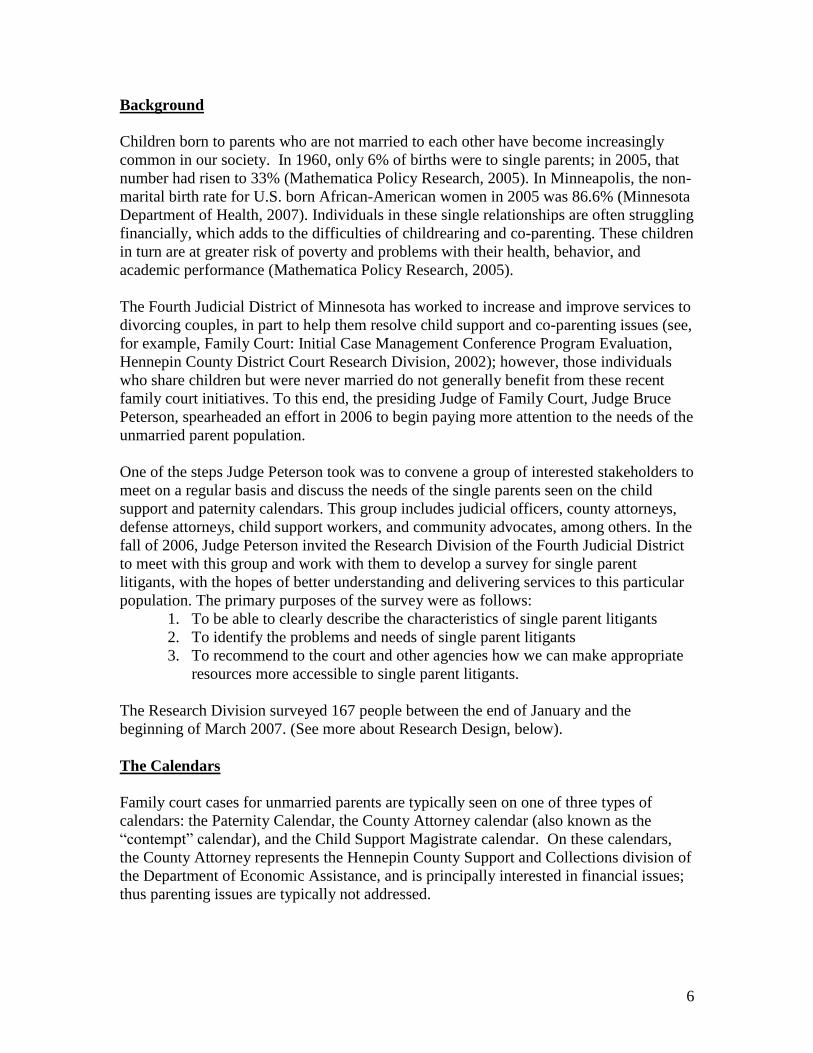
Approximately one-fifth (18%) of those ordered to pay child support were currently not
paying any of that ordered support. Nearly one-third (32%) reported paying less than
$300 per month, about another third (34%) reported paying between $300 and $499 per
month, and the remainder (16%) reported paying $500 or more per month in child
support. The average amount of child support respondents were currently paying per
month was $298. Calculating child support payment by monthly income, we determine
that for many of our respondents, court ordered child support payments are roughly one-
third of their monthly income for those who are working. Additionally, it is important to
bear in mind that 34% of our survey respondents were unemployed at the time we
interviewed them, making the child support payments a severe financial hardship.
Chart 12. Amount of Child Support Currently Paying per Month
(N=44)
18%
2%
11%
18% 18%16%
7%5%
2% 2%
0%
20%
40%
60%
80%
100%
None < $100 $100 to
$199
$200 to
$299
$300 to
$399
$400 to
$499
$500 to
$599
$600 to
$699
$700 to
$799
$800 to
$899
% o
f sam
ple
Half of those respondents who were required to pay child support reported that there were
life situations currently preventing them from paying their child support obligations in
full. Lack of employment was by far the most common reason, cited by more than three-
fourths (77%) of those currently unable to fully meet their child support obligations.
Other reasons given included medical and chemical dependency issues, being on
government assistance, and a general “lack of money.”

18
Housing
Almost half of respondents lacked stable housing; approximately a third lived with a
friend or relative. A small percentage of respondents reported being homeless, “couch
hopping,” or living in an “other” type of situation. Of those living independently in
stable housing, nearly three-fourths were renters.6 Significant gender differences
emerged with regard to housing; significantly more women than men lived in stable
housing, and significantly more men were staying with a friend or relative.
Chart 13. Current Housing Situation
(N=162)
With friend/relative
more than one night
35%
Independently in
stable housing
60%
Other
4%
Couch hopping
1%Homeless
1%
Chart 14. Housing by Gender
(N=162)
41%52%
1% 3% 3%
75%
21%
0% 0% 5%
0%
20%
40%
60%
80%
100%
Independently in
stable housing
With
friend/relative
more than one
night
Homeless Couch hopping Other
Men Women
6 Median home prices in Minneapolis in 2007 are nearly $300,000, making home ownership nearly
impossible for many of our respondents.

19
A small percentage of respondents (6% of those with stable housing) had lived at their
current address for less than one month; of these eight people, six reported living
independently in stable housing, one was living with a friend or relative, and one was
couch-hopping. Twenty people (15%) reported living at their current address for
between one and six months, either independently in stable housing (60%) or with a
friend or relative (35%).7
Chart 15. Time at Current Address
(N=135)
6%
15%
26% 26%
13%
0%
20%
40%
60%
80%
100%
Less than 1 mo. 1-6 mo. Over 6 mo. to 1 yr Over 1 yr to 3 yrs Over 3 yrs to 5
yrs
% o
f re
sp
on
de
nts
Table 3. Housing
Time at
Current
Address
(N=134)
Current Housing Situation
Couch
hopping
With friend or
relative for more
than 1 night
Independently
in stable
housing
Other housing
situation Total
Less than 1 mo. 1
12.5%
1
12.5%
6
75.0%
0
0.0%
8
100.0%
1-6 mos. 0
0.0%
7
35.0%
12
60.0%
1
5.0%
20
100.0&
Over 6 mo. – 1yr 0
0.0%
6
17.6%
26
76.5%
2
5.9%
34
100.0%
Over 1 yr – 3 yrs 0
0.0%
8
22.9%
26
74.3%
1
2.9%
35
100.0%
More than 3 yrs 0
0.0%
9
24.3%
27
73.0%
1
2.7%
37
100.0%
Three in five respondents (61%) did not live with anyone other than their children or a
significant other. Those who lived with people other than, or in addition to, their children
7 Does not total 100% because one person reported length of time at current address, but not their housing
situation.

20
or partners listed a variety of living situations - primarily parents, siblings, and extended
family (grandparents, aunts, cousins, nieces, and nephews). Other non-relatives with
whom respondents reported living with include friends and children of their partner.
Court Involvement and Criminal History
In addition to the case for which they were appearing on the day they were surveyed, 26
respondents (16%) self-reported having another pending case in the Hennepin County
court system. One person reported pending cases in both Family and Criminal court;
everyone else reported a pending case in either Family or Criminal Court, but not both.
Nearly three-fourths of people (70%) who reported additional pending court cases in
Hennepin County were involved in another Family Court case. The remaining 30% had a
pending Criminal Court case.
Chart 16. Self-Reported Additional Pending Cases in Hennepin County
(N=167)
Criminal
4%Family
11%
Both Family &
Criminal
1%
None/Not sure
84%
Approximately one-fourth of the sample (26%) reported having a criminal record; this
number actually represented 50% of the men in the sample.
Chart 17. Criminal Record by Gender
(N=165)
93.3%
0.0%1.3%
49.3%49.3%
6.7%
0%
20%
40%
60%
80%
100%
Yes No Not sure
Do you have a criminal record?
% o
f sam
ple
Male Female

21
Forty-two of the 44 respondents who stated that they had a criminal record detailed their
criminal history for us; the most commonly reported convictions were for Drug offenses
(36% of respondents with a criminal record) and Domestic offenses (29% of those with a
criminal record). All reported conviction types are listed in the table below.
Table 4. Criminal History
Criminal Record Type
(N=42)
Offense Category Percent of Cases8
Drug 15
35.7%
Domestic 12
28.6%
Non-domestic Person
(e.g., Assault)
7
16.7%
Traffic 5
11.9%
Property 4
9.5%
Unspecified Misdemeanor 4
9.5%
DWI/Alcohol-related 2
4.8%
Unspecified Felony 2
4.8%
Petty
(e.g., Litter, Disorderly Conduct)
2
4.8%
Weapons 1
2.4%
Child Protection 1
2.4%
8 Percentage will total more than 100% because the 42 people who admitted to having a criminal record
provided us with information about more than one offense type.
22
Family Situation
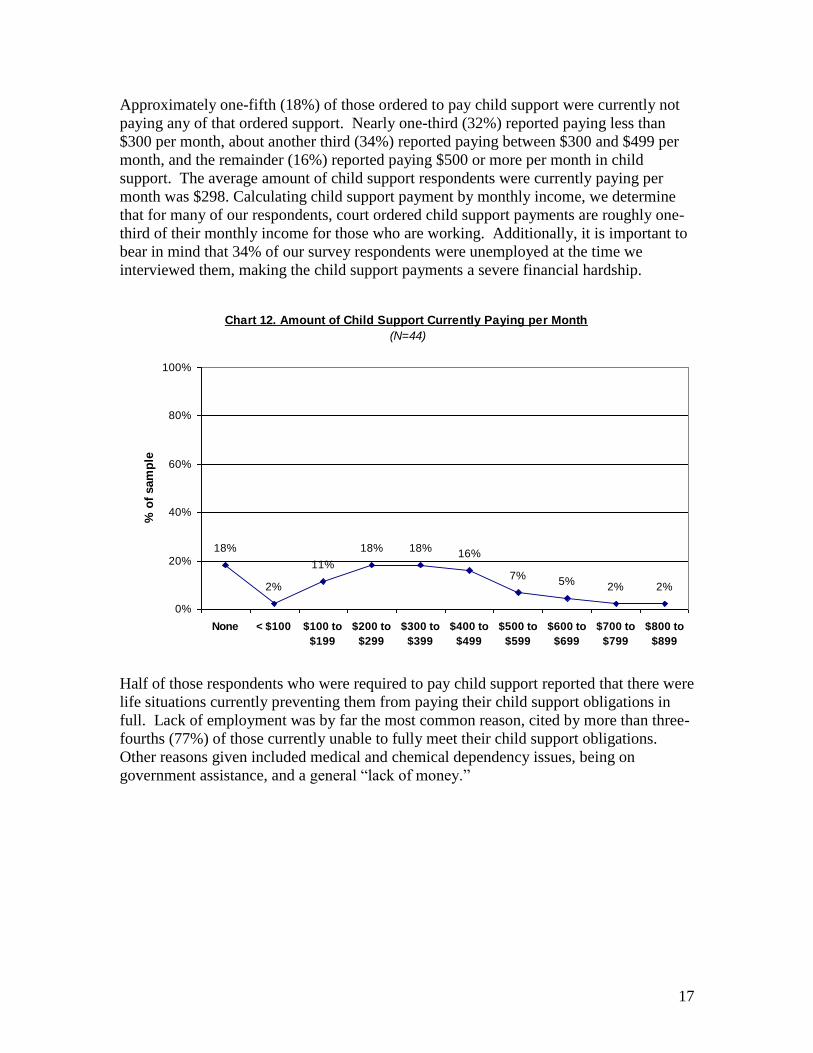
The litigants we surveyed had anywhere from 1 to 8 children.9 Average number of
children per respondent was 2.4. The children ranged in age from less than one year to 32
years old in the raw data. For the purpose of analysis, however, we capped the maximum
age at 18, leaving us with an average age of 6.5, and a midpoint of 5 years old.10
. The
mode, or most common response, was less than 1 (infant); twelve percent of respondents
reported having at least one infant. Fourteen percent said they were currently expecting a
baby.
Ten percent of respondents said they had at least one child with special needs, and 75%
of those said it was only one child that had special needs. Very few people (9) said their
children had other cases pending in the Hennepin County court system, and of those 9, all
but one were describing another Family Court (i.e., child support or custody) case. The
remaining case was a juvenile/child protection case.
Chart 18. Age of Respondents’ children
(N=366)11
0%
5%
10%
15%
20%
25%
<1 1 2 3 4 5 6 7 8 9 10 11 12 13 14 15 16 17 18
Child age
% o
f ch
ild
ren
We asked respondents with more than one child “not including yourself, how many total
biological parents do all of your children have?” Answers to this question ranged
between 1 and 4 for those who responded, with the average response being “2”. Thirty-
one percent of respondents said there was only one other biological parent for all their
children.
9 Two respondents said they had “zero” children, because they were on the paternity calendar and disputing
their paternity of the child in question. 10
The midpoint, or median, is somewhat different from the average, in that it indicates that 50% of the
children were five years old or less, and the other 50% were older than 5. 11
This number of children double counts children for whom both parents took the survey, and is thus
inflated.

23
Chart 19. Number of Children by Number of Co-Parents
(N=108)
0%
20%
40%
60%
80%
100%
2 kids 3 kids 4 kids 5 kids 6 kids 7 kids 8 kids
1 co-parent 2 co-parents 3 co-parents 4-co-parents
Percentages associated with Chart 19 can be found in Table 5 (below).
Table 5. Number of Children by Number of Co-Parents Number of
Children
(N=108)
Number of Co-Parents
1 2 3 4
2 19 23 0 0
45.2% 54.8% .0% .0%
3 6 17 7 0
20.0% 56.7% 23.3% .0%
4 5 4 4 3
31.3% 25.0% 25.0% 18.8%
5 2 3 4 3
16.7% 25.0% 33.3% 25.0%
6 0 1 2 1
.0% 25.0% 50.0% 25.0%
7 1 0 2 0
33.3% .0% 66.7% .0%
8 0 1 0 0
0% 100% 0% 0%
TOTAL
33 49 19 7
30.6% 45.4% 17.6% 6.5%

24
Thirty percent of respondents said they did not live in the same household with any of
their children. As we would expect, there was a significant gender difference (p<.001)
with regard to children living with the respondent; 88% of the respondents who said that
none of their children lived with them were men. The following graph provides detail
regarding with whom their children live; for this question, we focused on the child about
whom the respondent was in court the day we conducted the survey (“primary” child).
Ninety-five percent of the respondents that reported that their primary child lived only
with them were women.
Chart 20. With whom does your child reside the majority of the time? (N=166)
With me and partner
(not parent) 5%With me and other
parent 10%
Only with me 44%
Other
5%With other parent and
partner 5%
Only with other parent
31%
For those respondents who do not live with the child in question, 15% said they had no
contact at all with their children. Of the 68 respondents (41% of total) who said that their
child did not live with them at all, 19 said that they see their child either rarely or never.
In addition, 55 respondents (33% of total) said they would like to have more contact with
their child. However, only nine of those 55 people (16%) had ever tried to file a case
about custody or parenting time. When asked about their reluctance to file such a case,
respondents gave a variety of reasons (see Appendix C). There does seem to be a
common thread regarding lack of understanding of the court process and/or fear of
adding to his/her own involvement with the court. For example, some of the responses to
the question of “why have you not filed for a case about custody or parenting time?” were
as follows:
Not truly understand rights.
This is new; don't know how to.
Payments reasonable and father doesn't want to aggravate the situation.
25
Afraid courts will order more child support if they look too closely at his situation.
Don't want to go to court, mom's decision.
I don't want to start the legal battle, don't even want to be here today but she got pregnant again.
Finally, we asked respondents who else lives with them, aside from their children and/or
romantic partner (i.e., significant other). Six people were living with siblings, four people
were currently living with their parents, one with their partner’s children, one with his/her
partner’s parents, one with stepchildren, and one with a roommate.
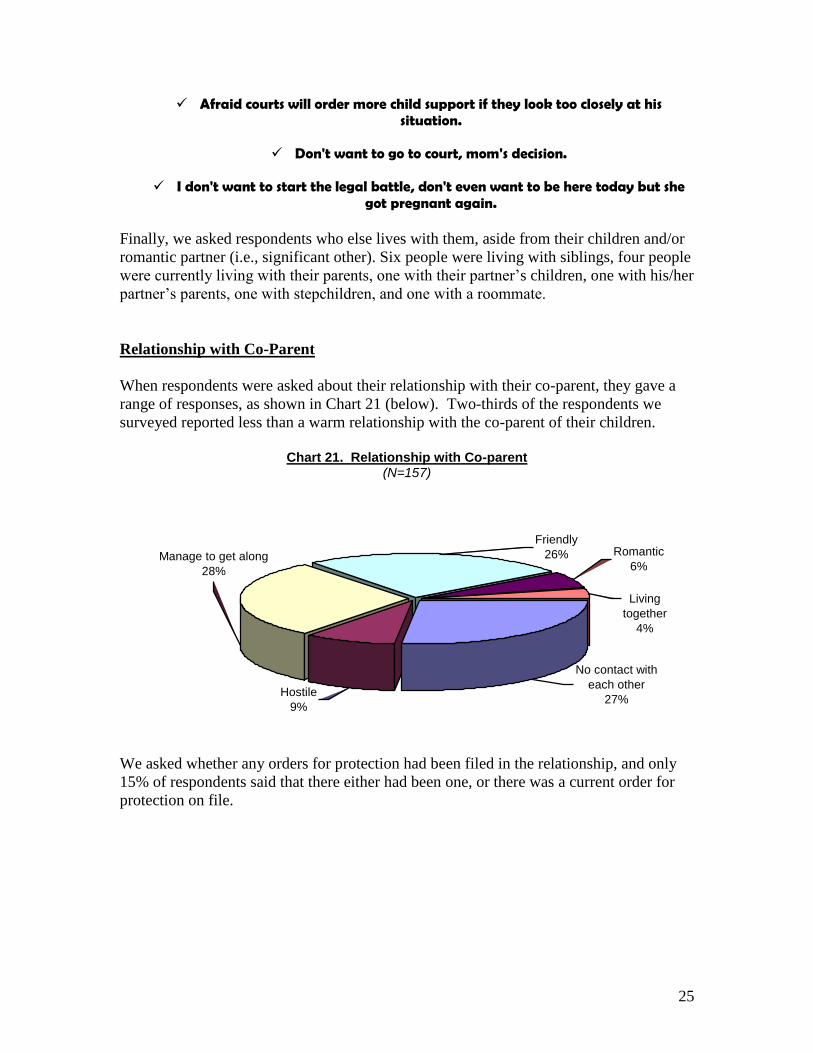
Relationship with Co-Parent
When respondents were asked about their relationship with their co-parent, they gave a
range of responses, as shown in Chart 21 (below). Two-thirds of the respondents we
surveyed reported less than a warm relationship with the co-parent of their children.
Chart 21. Relationship with Co-parent
(N=157)
Romantic
6%
Living
together
4%
No contact with
each other
27%Hostile
9%
Manage to get along
28%
Friendly
26%
We asked whether any orders for protection had been filed in the relationship, and only
15% of respondents said that there either had been one, or there was a current order for
protection on file.

26
Treatment
In attempting to determine struggles faced by our single parent respondents, we asked a
series of questions regarding physical and mental health, as well as chemical dependency.
Fourteen percent of respondents self-reported current physical or mental health problems,
and 11% said they were currently in some form of treatment (i.e., physical, mental, or
chemical dependency treatment). The breakdown of the reason for treatment appears
below in Chart 22.
Chart 22. Current Treatment
Currently in treatment for a physical, mental health, or chemical dependency issue
(N=18)12
39% (n=7) for physical 28% (n=5) for mental 17% (n=3) for chemical
Physical problems reported ranged from problems as minor as an eye infection to
problems as serious as a brain tumor. Mental health issues included depression, bipolar
disorder, anxiety, as well as other unnamed psychiatric issues. Twenty-two respondents
said that they were currently taking some form of prescribed medication.
We also asked whether or not respondents had undergone any treatment in the past for
physical health, mental health, or chemical dependency issues, and received more
positive responses as compared with the question regarding current treatment. Twenty
percent of respondents reported having undergone treatment in the past, the most
common type of treatment being for chemical dependency. (See Chart 23 below for a
breakdown.)
Chart 23. Prior Treatment
Past treatment for a physical, mental health, or chemical dependency issue (N=32)
22% (n=7) for physical 28% (n=9) for mental 50% (n=16) for chemical
12
The totals for the types of treatment do not add up to 18 because 3 respondents declined to give us
specific treatment information.

27
Services Needed
The primary reason for conducting this survey was to identify the gaps in service
provision to single parents in these types of cases. This section of the report details
responses to questions regarding the most critical needs for service.
Chart 24 shows all the “yes” responses to needs for services. Each response is noted,
even if one respondent said “yes” to 10 different services.
Chart 24. Percentage of “Yes” Responses to Services Needed
(N=166)
0 5 10 15 20 25 30 35 40 45 50 55 60
Job skills
Education
Find job
Financial assistance
Work w/co-parent
Help with childcare
Housing
Transportation
Clear criminal record/legal advice
Medical problem
Parenting
Anger
Mental Health
Getting out of abusive relationship
Drugs/alcohol
Pregnancy issues
Percentage of yes responses
When asked to give their top three services needed, respondents most often chose the
following:
Help with education or getting a GED
Help finding a job
Help with childcare

28
From these top responses, it appears that help finding a job is more critical for these
individuals than acquiring job skills, even though there were a high number of responses
for the question regarding job skills.13
We also asked respondents to tell us if there were any services they needed that were not
on the list we provided. Only a few people (n=12) answered this question, and of those
many restated in different words items that were in fact on the list. We list here the
services they named which were not on our list in any form:
Father’s support group
Getting help with custody case14
Healthcare for children
Help with restraining order15
Mediation
Safety inside the home (e.g., how to put out a fire, etc.)
There were some responses to this question which were actually comments on frustration
with the court process. For example:
Individualize cases, all judged and ruled upon circumstances. I’m judged as dead beat dad because kids don’t live with me.
(Need a) more interactive child support worker.
The concept that there are two parents.
13
We conclude that the order of the questions affected the responses; the first in the list of services needed
was the job skills question, and the second was the finding a job question. 14
Whenever possible, we referred people who gave these types of responses to the self-help center in the
lobby of the Family Justice Center. 15
Whenever possible, we referred people who gave these types of responses to the self-help center in the
lobby of the Family Justice Center.

29
Services Needed by Demographics
We analyzed whether the services needed the most had any significant relationships with
the demographic variables. In other words, logic would suggest that some of the more
pressing needs of these single parents are related to gender, age, and family and financial
circumstances. We found that men were significantly more likely to say they needed
help finding a job; younger respondents (18-24 years old) were significantly more likely
than older respondents to say they needed help finding a job, help furthering education,
and help with childcare; and individuals whose children live only with them were more
likely to need help with childcare.
Table 6. Significant Correlations16
(N=166)
Respondent Characteristic Help finding
job
Help furthering
education
Help with
childcare
Men .178* -- --
18-24 year olds .220** .157* --
Sole custodians of children -- -- .178* Significance levels
17: *p<.05 **p<.01
Conclusions
These data are useful in identifying who the single parent litigants are, and confirm our
suspicions that they have more needs than we are currently addressing in the court
system. They need help in their personal lives (i.e., finding jobs, furthering education,
etc.), but also need help navigating the court system. Many of these individuals need help
finding legal ways of gaining custody and/or parenting time, so that they can ultimately
be more effective parents. We recommend that the data provided in this report be used
to begin making changes in the system to help single parents with the most pressing
issues they face. In doing so, we will be ensuring better long-term outcomes for the
children in these relationships.
16
The smaller the sample size, the more difficult it is to find significant relationships between variables.
This sample is relatively small for social science research, and we thus did not expect to find many
instances of statistical significance. 17
Statistical significance levels indicate whether or not the observed relationship could have happened by
chance. In other words, a p<.05 means that there is less than a 5% chance that the observed relationship is
accidental, p<.01 means that there is less than a 1% chance that it is accidental, and so on. The lower the
significance level (or p value) the more confidence we can have in the observed relationship.

30
Appendix A. Introduction to Survey
Hello, my name is ______ and I am with District Court research.
We are conducting a survey of people that are involved in child
support and paternity cases. We are trying to see what needs
parents in these cases have that the court is not providing, trying to
do a better job of serving people like yourself. Are you directly
involved in a child support or paternity case today?
(if they ask what you mean by “directly involved,” clarify by
asking if they are one of the two parties – not a friend or
relative of someone involved in the case).
(if they are there for a different type of case – for example,
domestic abuse or divorce case – thank them anyway and
move on).
(If they say “yes”): Great. One other question: were you ever
married to the other parent in your case?
(if they say “yes”, explain that for right now we need to talk
with people who were never married. Thank them anyway
and move on.)
(if they say no): Ok, good. We want to talk with unmarried
parents. Would you be willing to answer some questions for me?
This survey will only take about 5 or 10 minutes and is completely
anonymous. I don’t want to know your name, case number or
anything like that, ok?

31
Appendix B. Survey
1. For what type of case were you in court today? (Don’t read options) SELECT ONE ANSWER ONLY.
Original paternity Reviewing or changing child support
Return paternity Don't know
Setting child support
2. How old are you? (Don’t read options)
Younger than 18 19-24 years old 25-29 years old
30-39 years old 40-49 years old 50 years old or more
3. Gender (Interviewer please observe, do not ask unless necessary)
Male Female
4. With which racial group(s) do you identify yourself (check all that apply):
White Black/African American Asian Native American Other
5. Are you Hispanic?
Yes No
6. What is your primary language, the one you speak at home most often? SELECT ONE ANSWER ONLY.
English Spanish Hmong Somali Other
7. Do you speak any other languages (in addition to the primary one)?
Yes No (skip next question)
*8. If yes, which ones? (check all that apply)
English Spanish Hmong Somali Other
9. Where do you live? (Don’t read options, wait for response)
North Minneapolis South Minneapolis Minneapolis other

32
Northern suburb Southern suburb Western suburb
St. Paul St. Paul suburb Outside of Twin Cities but in Minnesota
Other
10. Besides the case for which you appeared in court today, do you have any other pending cases in the
Hennepin County court system (e.g., criminal, civil, family, etc.?)
Yes No (skip next question) Unsure (skip next question)
*11. If yes, what type of case? (check all that apply)
Criminal Civil Another family case
Juvenile/child protection Mental health (civil
commitment court) Probate court
12. Do you have a criminal record?
Yes No Not sure
*13. If yes, please provide details here (open-ended; probe for charges or convictions, types
of crimes, where crimes committed, etc.):
Please tell us about your child/children. When we say “child” or “children,” we are talking about all
the children you consider yourself to be the parent of.
14. How many children do you have?
15. How many of your children live with you?

33
16. How old are your children? (please list all ages):
17. (Ask if more than one child) Not including yourself, how many total biological parents do all of
your children have?
18. Do any of your children have special needs?
Yes No (skip next question)
*19. If yes, how many children have special needs?
20. Does your child or children have other cases pending in the Hennepin County court system?
Yes No (skip next question) Unsure (skip next question)
*21. If yes, in what division of the court? (check all that apply)
Criminal Civil Another family case
Juvenile/Child protection Mental health (civil commitment court) Probate court
For the following questions, when we say “child”, we are talking about
the child about whom you are in court today.
22. Where does your child reside the majority of the time?
a. Only with you (skip next question) d. Only with their other biological parent
b. With you and their other biological parent
(skip next question)
e. With the child’s other biological parent and his/her
partner
c. With you and your partner who is not the child’s
parent (skip next question)
f. Other

34
(Only ask next question if answered d, e, f to above):
*23. How much contact do you have with your child that does not live with you?
You see him/her every day You hardly ever see him/her
You see him/her once or twice per week You have no contact with your child
You see him/her once or twice per month
24. Please choose the answer that best describes your feelings about the amount of contact you currently have
with your child:
a. You are comfortable with the amount of contact you
have with your child b. You would like to have less contact with your child
c. You would like to have more contact with your child
25. Have you ever filed or tried to file a case about custody or parenting time?
Yes No
(Ask only if they answered ‘c’ for #24 and ‘No’ to above).
26. If not, why have you not filed for a case about custody or parenting time?
We are looking for some information about your relationship with the other parent of
your child (i.e., the parent involved in the case you are in court for today):
27. Was there ever an order for protection against you or your co-parent, OR on behalf of one of
your children?
You once had an order for protection on file against him/her, but it has expired
S/he once had an order for protection on file against you, but it has expired
You have a current order for protection on file against him/her
S/he has a current order for protection on file against you
There is a pending order for protection case (no decision yet)
No orders for protection were filed in your relationship

35
28. Currently your relationship with the other parent of your child can be described as follows (choose only one):
You have no contact with each other. You are friendly toward each other.
You are hostile toward each other. You are involved in a romantic relationship with each other.
You manage to get along. You live with each other.
I am going to read a list of services that some people involved in these types of cases find helpful. For
each one I read, please answer yes or no to the question, “Is this something you would find helpful?”
Yes No
29. Job skills/vocational training
30. Help finding a job
31. Help furthering education or getting a GED
32. Help finding a place to live
33. Help with medical problems (physical)
34. Help with mental health issues
35. Help with parenting skills
36. Help with working with the other parent of my child/children
37. Financial assistance
38. Help getting out of an abusive relationship
39. Help with anger issues
40. Help with pregnancy issues
41. Help with clearing criminal record/legal advice
42. Help with getting off drugs or alcohol
43. Help with transportation (to work, school, court, etc.)
44. Help with childcare
45. Of the services you said yes to above, please tell us the top three services you feel you need the most:
46. Are there any services that you need that we forgot to list? (If no, leave blank)
47. How do you currently support yourself? SELECT ONE ANSWER ONLY.
a. Employment b. Social security (skip next three questions)
c. Public assistance (skip next three questions) d. Relatives (skip next three questions)
e. Veteran’s benefits (skip next three questions) f. Other
*48. (If answered “a” to last question): How many hours per week total do you work? If
you work at more than one job, please add up your hours from all of your jobs.

36
Less than 10 hours More than 20 but less than 40 hours
More than 10 but less than 20 hours 40 hours per week or more
*49. (If employed): What is your hourly wage? $/hour
*50. (If employed) How long have you been at your present
place of employment?
51. What has your longest period of regular employment been? (At 1 job)
52. Are you required to pay any form of child support (whether due to a court order or some
personal agreement between you and the other parent)?
Yes No (Skip to #55)
*53. If yes, is there anything preventing you from making those
payments in full? (If no, leave blank).
55. What is the highest grade of school you completed?
Less than high school Some college
High school graduate or GED College graduate
Some vocational school Post-graduate studies
Vocational school graduate
56. Are you currently expecting a baby?
Yes No (skip next question) Unsure (skip next question)
*54. If yes, how much are you paying per month? $/month .

37
*57. (If answered “yes” to above): When is the baby’s due date?
58. Please describe your current housing situation: (Only read categories if necessary)
a. Currently homeless (outdoors)
(skip next two questions)
d. Living with a friend or relative for more than one
night (skip next two questions)
b. Couch hopping (skip next two questions) e. Living independently in stable housing
(Answer next two questions) c. Staying in a shelter (skip next two questions) f. Other
59. If answered “e” to above, please choose the answer that best describes your residence:
You live in a single family house that you own. You live in an apartment.
You live in a single family house that you rent. You live in someone else’s home right now.
60. How long have you lived at your current address?
Less than one month Longer than 1 year to 3 years.
1-6 months Longer than 3 years to 5 years
Over 6 months to 1 year Longer than 5 years
61. Besides your children and/or significant other, does anyone else live with you right now?
Yes (please specify who:_______________________________) No
62. Are you suffering from any physical or mental health problems?
Yes No
63. Are you currently undergoing any form of treatment for a physical, mental health or chem dependency issue?
Yes No
*64. If yes, what type? (Interviewer: try to probe for what issue, in-patient, out-patient,
how long, etc.)
Treatment for a physical problem
(specify:___________________)
Treatment for drug or alcohol addiction
(specify:______________)
Treatment for a mental health issue
(specify: _________________)
Other treatment
(specify: ___________________________)

38
65. Are you currently on any prescribed medication?
Yes (try to probe-please specify:__________________________________) No
66. Did you undergo any form of treatment in the past for a physical, mental health or chem dependency issue?
Yes No (skip next question)
68. Is there any other information you would like to share with me at this time?
69. If a parenting education course were to be offered by the court, is that something that you would be
interested in attending?
Yes No Maybe
*67. If yes, what type? (Try to probe: inpatient, outpatient, how long, etc.)
Treatment for a physical problem
(specify:_____________________)
Treatment for drug or alcohol addiction
(specify:______________________)
Treatment for a mental health issue
(specify: ____________________)
Other treatment
(specify: __________________________)

39
Appendix C: Responses to Question about Why No Custody/Parenting Time Case Filed
Not necessary.
Established at birth- co-parent.
On probation.
We get along- working it out.
Don't know.
Just because mother and I have good relationship, can just talk to her and not go to
court.
Because they live with her the majority of the time.
At the time they were getting along.
I think she's a good mother, at time I wouldn't have won case because I didn't have a job
and no place to provide a home and care.
No time.
Not truly understand rights.
It was supposed to be I could pick them up whenever I want, but not now. But I don't
want to take them away from her.
Just determined paternity.
Current housing situation.
This is new- don't know how to.
Waiting for this case to get resolved- next step.
Going to do it today.
Husband of ex very (unreadable), want to avoid conflict.
No reason.
Payments reasonable and father doesn't want to aggravate the situation. Afraid courts
will order more child support if they look too closely at his situation.
Family thought "know the mother first"- child doesn't have his name- don't know how to
approach it.
Didn't feel need to.
Have not had any problems.
Don't want to go to court, mom's decision.
Nothing preventing
I don't want to start the legal battle, don't even want to be here today but she got
pregnant again.
Because I see her regularly.
Because we both get along.
Just starting case.
At the time, my life was not stable.
She would let me see him.
They'd make me pay $200 that I don't have- filing fee.
But I'm going downstairs now about visitation rights.
Her mom's supposed to have her, but she doesn't (her grandma does). So I'm trying not to
cause problems. The grandma is keeping her from me.
Set up agreement

40
References
Hennepin County District Court Research Division, 2002. “Family Court: Initial Case
Management Conference Program Evaluation.”
Mathematica Policy Research, Inc. 2005. “What We Know About Unmarried Parents:
Implications for Building Strong Families Programs.”
Hennepin County Health Protection Assessment Team, 2007. “Percent of Births to
Unmarried Women by Race/Ethnicity: Minneapolis Resident Live Births, 1990-2005.”
Data provided by the Minnesota Department of Health.
http://en.wikipedia.org/wiki/Demographics_of_Minneapolis,_Minnesota
http://www.ci.minneapolis.mn.us/neighborhoods/marcyholmes_poverty.asp