Data Mining CS 341, Spring 2007 Lecture 4: Data Mining Techniques (I)
Upload
fusion-publishing-media-incCategory
view
216download
0description

MORE OUNCES IN SIGHT
TSX-V:GUNwww.GunpointExploration.com
MORE OUNCES IN SIGHT
TSX-V:GUNwww.GunpointExploration.com
MORE OUNCES IN SIGHT
TSX-V:GUNwww.GunpointExploration.com
MORE OUNCES IN SIGHT
TSX-V:GUNwww.GunpointExploration.com
GunpointFeb2012.indd 1 03/02/2012 4:49:44 PM

The global market crisis is forcing investors and traders to take more personal control of their portfolios and to find new areas for opportunity and safety. Using the experts’ time-tested methods, some have protected, or even grown, their portfolios in these challenging market conditions. Don’t miss the most important investor gathering in 2012. This event will be your one-stop resource for the most comprehensive global market overview available from top experts that will lead you to a profitable 2012.
Marc Faber Linda Nazareth
John Stephenson Larry Berman
Marin Katusa Danielle Park
Attend
March 27-29, 2012 • Vancouver Vancouver Convention Centre East
Register FREE online at
www.WorldMoneyShowVancouver.ca or call 800/970-4355
Mention Priority Code 026073
Trading Tools SponsorDiamond Sponsor Marketing Partner
When Fear grips the global markets!
Gain insights into the next game changers from the experts by attending The World MoneyShow Vancouver 2012—FREE!
www.ReportOnMining.com Spring 2012 | Planning for Profits | Report on Mining 5
Volume 15 | Number 1 | Spring 2012Vancouver, British Columbia www.ReportOnMining.com
Planning for Profits - Report on Mining edition is published four times a year by Fusion Publishing Inc. All rights reserved. Any reproduction or duplication without prior written consent of Fusion Publishing Inc. is strictly prohibited. Published by Fusion Publishing Inc.
Canadian OfficeFusion Publishing Inc.#317 – 1489 Marine Dr.West Vancouver, BCCanada V7T 1B81.888.925.0313 (Toll Free)
USA OfficeFusion Publishing Inc.145 Tyee Dr.Pt. Roberts, WA USA 98281-9602 1.888.925.0313 (Toll Free)
PublisherTerry Tremaine
Associate Publisher & Editor Connie Ekelund
Production ManagerChristie Smith
Contributing EditorsJoëlle MiffreElvis PicardoMetals Economics Group
Account Managers1.888.925.0313 Terry Tremaine Ext: 1002Maureen O’Brien Ext: 2001Marie Richards Ext: 3002Garry Ferris Ext: 3005
Publication Mail Agreement #41124091
Circulation & DistributionCanada PostDistacor Inc.NewsstandDigital
Non-deliverables please return to:Fusion Publishing Inc.Report On Mining Magazine#317 – 1489 Marine DriveWest Vancouver, BC Canada V7T 1B8
Subscriptions:1 year $14.95 in Canada (+$8.00 in USA) 2 years $28.00 in Canada (+$16.00 in USA)1.888.925.0313 [email protected]
Free Digital Subscriptionwww.fusionpublishinginc.com/subs.html
The information in Planning for Profits - Report on Mining has been carefully compiled from sources believed to be reliable, but its accuracy is not guaranteed.
www.ReportOnMining.com
This year has started well with the markets enjoying their best January in the last 25 years. Europe continues to command the headlines
but the “end of the world is nigh” message appears to have less impact due to its endless repetition. The rest of the world seems to be enjoying reasonable growth. Even the United States, while embroiled in vitriolic politics, is enjoying a modest recovery in spite of the never-ending rhetoric. There are even prognosticators predicting the beginning of a bull run.
There are many in the mining industries who are complaining that it’s very difficult to raise money in the current environment, but in my position I get to watch the numerous news releases issued every day and pay particular attention to those dealing with placements. There seem to be only two results—either they are oversubscribed in a matter of days, or they are withdrawn after having few takers. I would suggest this is likely due to there still being a limited retail market with so many spooked and therefore sitting on the sidelines leaving the game to institutional investors.
It will be very interesting to see how the atmosphere changes after PDAC. This year will be the largest convention ever—attracting delegates from around the world. Just how many Chinese delegates will be in attendance? What are backroom conversations going to focus on? Are the juniors finally going to enjoy financial support?
Canada is in an enviable position with its wealth of resources. I suspect everyone is going to recognize just how well off as the year progresses and the markets regain their optimism.
6 PDAC Awards
CHINA8 China Gold International Resources Corp Ltd.
14 The Long and Short of Commodity Futures by Joëlle Miffre
NORTH AMERICA16 Jourdan Resources Inc.
18 Abacus Mining and Exploration Corp.
21 Commodities Outlook by Elvis Picardo
SOUTH AMERICA24 Eco Oro Minerals Corp.
26 Pipeline Activity Index by Metals Economics Group

6 Planning for Profits | Report on Mining | Spring 2012 www.facebook.com/reportonmining
The Prospectors and Developers Association of Canada (PDAC) is a national association representing the mineral exploration and development industry. Its
7,000 individual and corporate members are involved in the exploration, discovery and development of new mines and new wealth. The association’s convention is the world’s largest annual gathering of the mineral industry. PDAC Convention 2012 will be held March 4-7 in Toronto. Further details are available at www.pdac.ca.
Gerald Panneton, president and CEO of Detour Gold Corp., is the winner of this year’s Bill Dennis Award, the Prospectors and Developers Association of Canada
(PDAC) announced last month. The award is given by the PDAC for prospecting success or for a Canadian mineral discovery. Panneton wins the award for advancing the company’s Detour Lake property in northern Ontario into a world-class, low-grade, high tonnage gold deposit with reserves of some 17.7 million ounces of gold. He is one of seven awards winners to be honoured at an awards evening on Monday, March 5, 2012, in Toronto during the association’s annual international convention (March 4-7).
David Giles, director of exploration for Mexican-based Fresnillo Plc, wins this year’s Thayer Lindsley Award for mineral discoveries outside Canada. Giles is receiving the
award, named after a top mine finder, for heading up exploration that has yielded several ore finds in Mexico, including the Madero mine and the Pinos Altos deposit. He is also credited with finding a new silver mine at Fresnillo, the Soledad-Dipolos mine in Herradura, and the San Julian silver-gold and Orisyvo gold deposits.
www.ReportOnMining.com Spring 2012 | Planning for Profits | Report on Mining 7
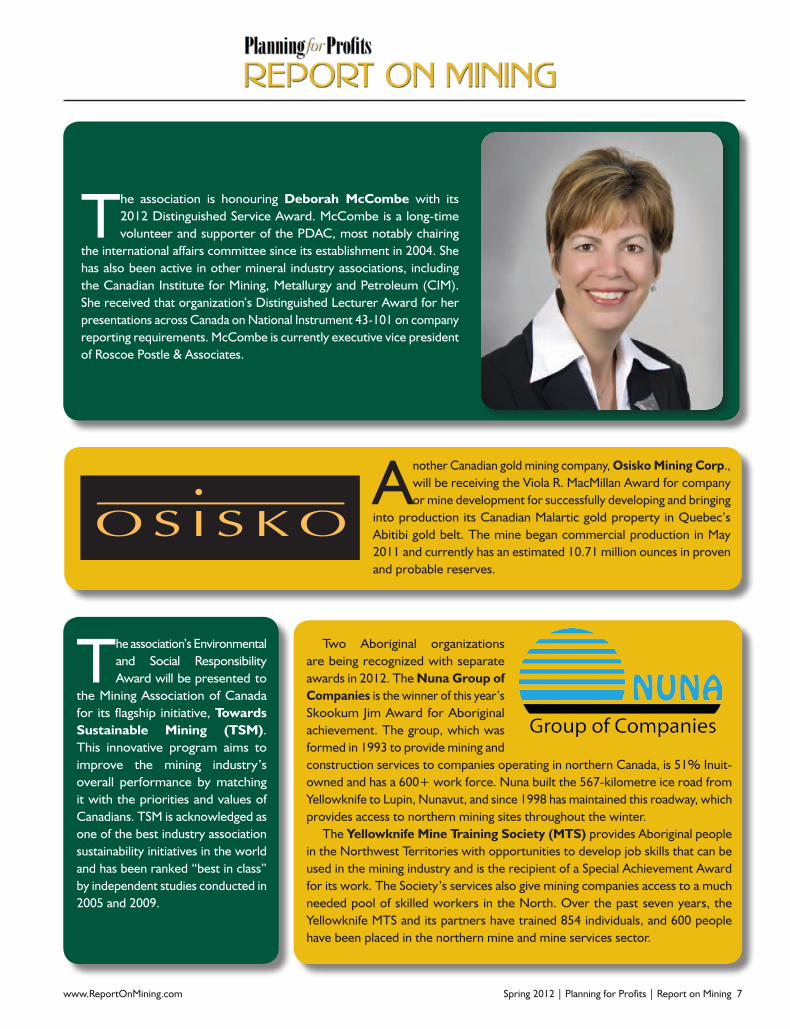
The association is honouring Deborah McCombe with its 2012 Distinguished Service Award. McCombe is a long-time volunteer and supporter of the PDAC, most notably chairing
the international affairs committee since its establishment in 2004. She has also been active in other mineral industry associations, including the Canadian Institute for Mining, Metallurgy and Petroleum (CIM). She received that organization’s Distinguished Lecturer Award for her presentations across Canada on National Instrument 43-101 on company reporting requirements. McCombe is currently executive vice president of Roscoe Postle & Associates.
The association’s Environmental and Social Responsibility Award will be presented to
the Mining Association of Canada for its flagship initiative, Towards Sustainable Mining (TSM). This innovative program aims to improve the mining industry’s overall performance by matching it with the priorities and values of Canadians. TSM is acknowledged as one of the best industry association sustainability initiatives in the world and has been ranked “best in class” by independent studies conducted in 2005 and 2009.
Two Aboriginal organizations are being recognized with separate awards in 2012. The Nuna Group of Companies is the winner of this year’s Skookum Jim Award for Aboriginal achievement. The group, which was formed in 1993 to provide mining and construction services to companies operating in northern Canada, is 51% Inuit-owned and has a 600+ work force. Nuna built the 567-kilometre ice road from Yellowknife to Lupin, Nunavut, and since 1998 has maintained this roadway, which provides access to northern mining sites throughout the winter.
The Yellowknife Mine Training Society (MTS) provides Aboriginal people in the Northwest Territories with opportunities to develop job skills that can be used in the mining industry and is the recipient of a Special Achievement Award for its work. The Society’s services also give mining companies access to a much needed pool of skilled workers in the North. Over the past seven years, the Yellowknife MTS and its partners have trained 854 individuals, and 600 people have been placed in the northern mine and mine services sector.
Another Canadian gold mining company, Osisko Mining Corp., will be receiving the Viola R. MacMillan Award for company or mine development for successfully developing and bringing
into production its Canadian Malartic gold property in Quebec’s Abitibi gold belt. The mine began commercial production in May 2011 and currently has an estimated 10.71 million ounces in proven and probable reserves.
8 Planning for Profits | Report on Mining | Spring 2012 www.facebook.com/reportonmining
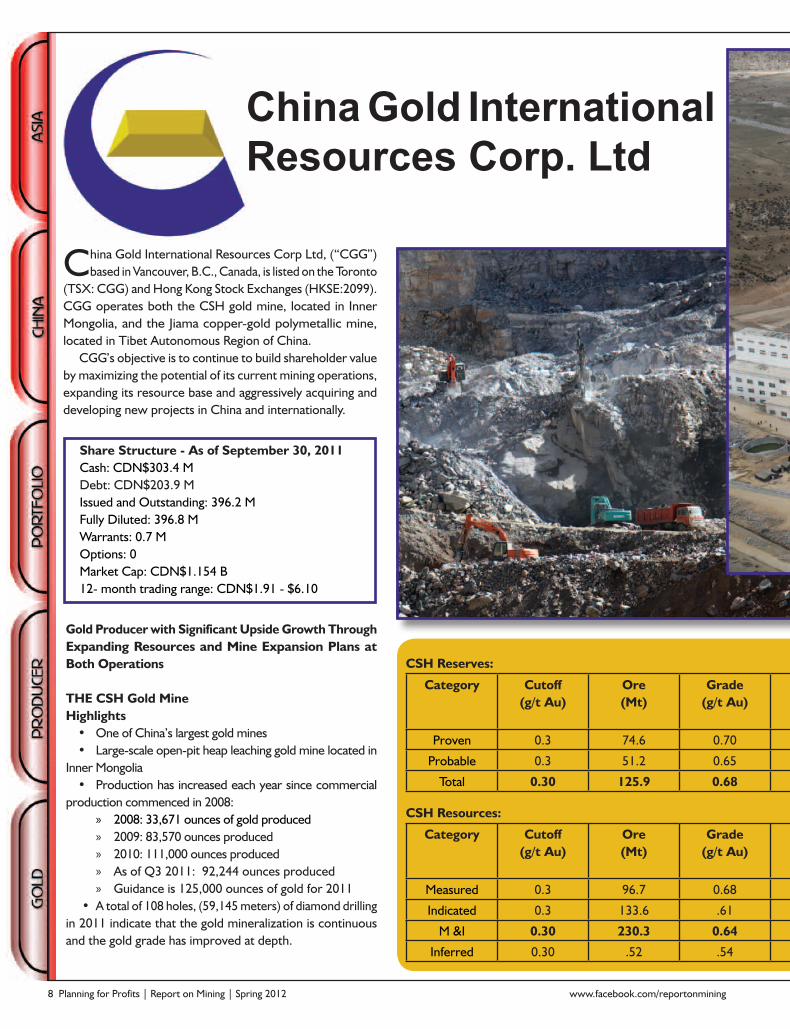
China Gold InternationalResources Corp. Ltd
China Gold International Resources Corp Ltd, (“CGG”) based in Vancouver, B.C., Canada, is listed on the Toronto
(TSX: CGG) and Hong Kong Stock Exchanges (HKSE:2099). CGG operates both the CSH gold mine, located in Inner Mongolia, and the Jiama copper-gold polymetallic mine, located in Tibet Autonomous Region of China.
CGG’s objective is to continue to build shareholder value by maximizing the potential of its current mining operations, expanding its resource base and aggressively acquiring and developing new projects in China and internationally.
CSH Reserves:
Category Cutoff(g/t Au)
Ore(Mt)
Grade(g/t Au)
ContainedAu
(M oz)
Proven 0.3 74.6 0.70 1.679
Probable 0.3 51.2 0.65 1.069
Total 0.30 125.9 0.68 2.749
CSH Resources:
Category Cutoff(g/t Au)
Ore(Mt)
Grade(g/t Au)
ContainedAu
(M oz)
Measured 0.3 96.7 0.68 2.114
Indicated 0.3 133.6 .61 1.598
M &I 0.30 230.3 0.64 4.736
Inferred 0.30 .52 .54 .007
Share Structure - As of September 30, 2011Cash: CDN$303.4 M Debt: CDN$203.9 M Issued and Outstanding: 396.2 M Fully Diluted: 396.8 M Warrants: 0.7 M Options: 0 Market Cap: CDN$1.154 B 12- month trading range: CDN$1.91 - $6.10
Gold Producer with Significant Upside Growth Through Expanding Resources and Mine Expansion Plans at Both Operations
THE CSH Gold MineHighlights • One of China’s largest gold mines• Large-scale open-pit heap leaching gold mine located in
Inner Mongolia• Production has increased each year since commercial
production commenced in 2008: » 2008: 33,671 ounces of gold produced » 2009: 83,570 ounces produced » 2010: 111,000 ounces produced » As of Q3 2011: 92,244 ounces produced » Guidance is 125,000 ounces of gold for 2011
• A total of 108 holes, (59,145 meters) of diamond drilling in 2011 indicate that the gold mineralization is continuous and the gold grade has improved at depth.

www.ReportOnMining.com Spring 2012 | Planning for Profits | Report on Mining 9
CSH Reserves:
Category Cutoff(g/t Au)
Ore(Mt)
Grade(g/t Au)
ContainedAu
(M oz)
Proven 0.3 74.6 0.70 1.679
Probable 0.3 51.2 0.65 1.069
Total 0.30 125.9 0.68 2.749
CSH Resources:
Category Cutoff(g/t Au)
Ore(Mt)
Grade(g/t Au)
ContainedAu
(M oz)
Measured 0.3 96.7 0.68 2.114
Indicated 0.3 133.6 .61 1.598
M &I 0.30 230.3 0.64 4.736
Inferred 0.30 .52 .54 .007
Photos, clockwise from opposite page: Jiama mine, Jiama operation, CSH crusher, CSH crusher, CSH processing.

10 Planning for Profits | Report on Mining | Spring 2012 www.facebook.com/reportonmining
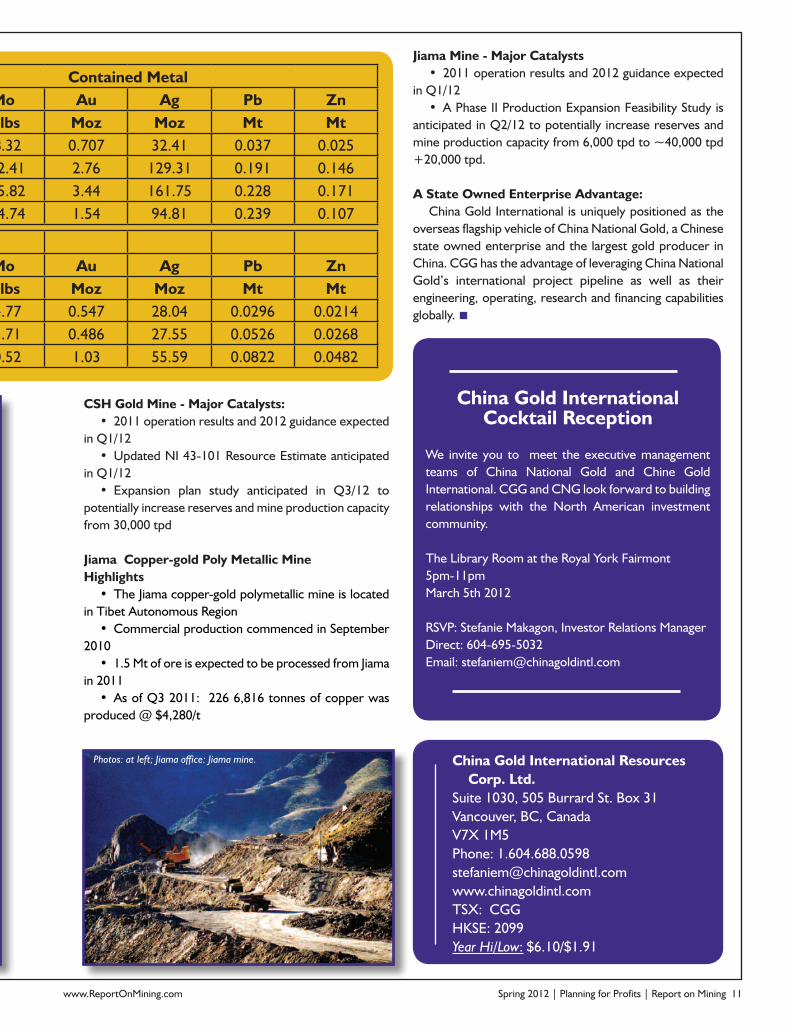
Jiama Resource Estimate Grade Contained MetalCategory Tonnes Cu Mo Au Ag Pb Zn Cu Mo Au Ag Pb Zn
Mt (%) (%) (g/t) (g/t) (%) (%) Mlbs Mlbs Moz Moz Mt MtMeasured 64.59 0.82 0.06 0.33 15.60 0.06 0.04 1,167.67 78.32 0.707 32.41 0.037 0.025Indicated 941.38 0.38 0.04 0.09 4.27 0.02 0.02 7,886.45 892.41 2.76 129.31 0.191 0.146Total M&I 1,005.97 0.41 0.04 0.10 5.00 0.02 0.02 9,092.90 975.82 3.44 161.75 0.228 0.171Inferred 820.76 0.31 0.05 0.06 3.58 0.03 0.02 5,609.36 904.74 1.54 94.81 0.239 0.107
Jiama ReservesCategory Tonnes Cu Mo Au Ag Pb Zn Cu Mo Au Ag Pb Zn
Mt (%) (%) (g/t) (g/t) (%) (%) Mlbs Mlbs Moz Moz Mt MtProved 53.44 0.83 0.038 0.32 16.3 0.06 0.04 977.94 44.77 0.547 28.04 0.0296 0.0214
Probable 51.84 0.85 0.04 0.29 16.5 0.11 0.05 971.39 45.71 0.486 27.55 0.0526 0.0268Total 105.28 0.84 0.039 0.31 16.4 0.08 0.05 1,949.68 90.52 1.03 55.59 0.0822 0.0482
www.ReportOnMining.com Spring 2012 | Planning for Profits | Report on Mining 11
Jiama Resource Estimate Grade Contained MetalCategory Tonnes Cu Mo Au Ag Pb Zn Cu Mo Au Ag Pb Zn
Mt (%) (%) (g/t) (g/t) (%) (%) Mlbs Mlbs Moz Moz Mt MtMeasured 64.59 0.82 0.06 0.33 15.60 0.06 0.04 1,167.67 78.32 0.707 32.41 0.037 0.025Indicated 941.38 0.38 0.04 0.09 4.27 0.02 0.02 7,886.45 892.41 2.76 129.31 0.191 0.146Total M&I 1,005.97 0.41 0.04 0.10 5.00 0.02 0.02 9,092.90 975.82 3.44 161.75 0.228 0.171Inferred 820.76 0.31 0.05 0.06 3.58 0.03 0.02 5,609.36 904.74 1.54 94.81 0.239 0.107
Jiama ReservesCategory Tonnes Cu Mo Au Ag Pb Zn Cu Mo Au Ag Pb Zn
Mt (%) (%) (g/t) (g/t) (%) (%) Mlbs Mlbs Moz Moz Mt MtProved 53.44 0.83 0.038 0.32 16.3 0.06 0.04 977.94 44.77 0.547 28.04 0.0296 0.0214
Probable 51.84 0.85 0.04 0.29 16.5 0.11 0.05 971.39 45.71 0.486 27.55 0.0526 0.0268Total 105.28 0.84 0.039 0.31 16.4 0.08 0.05 1,949.68 90.52 1.03 55.59 0.0822 0.0482
China Gold International Resources Corp. Ltd.Suite 1030, 505 Burrard St. Box 31Vancouver, BC, Canada V7X 1M5 Phone: 1.604.688.0598stefaniem@chinagoldintl.comwww.chinagoldintl.comTSX: CGGHKSE: 2099Year Hi/Low: $6.10/$1.91
China Gold International Cocktail Reception
We invite you to meet the executive management teams of China National Gold and Chine Gold International. CGG and CNG look forward to building relationships with the North American investment community.
The Library Room at the Royal York Fairmont5pm-11pmMarch 5th 2012
RSVP: Stefanie Makagon, Investor Relations ManagerDirect: 604-695-5032 Email: [email protected]
CSH Gold Mine - Major Catalysts: • 2011 operation results and 2012 guidance expected
in Q1/12 •Updated NI 43-101 Resource Estimate anticipated
in Q1/12• Expansion plan study anticipated in Q3/12 to
potentially increase reserves and mine production capacity from 30,000 tpd
Jiama Copper-gold Poly Metallic MineHighlights• The Jiama copper-gold polymetallic mine is located
in Tibet Autonomous Region•Commercial production commenced in September
2010• 1.5 Mt of ore is expected to be processed from Jiama
in 2011• As of Q3 2011: 226 6,816 tonnes of copper was
produced @ $4,280/t
Jiama Mine - Major Catalysts• 2011 operation results and 2012 guidance expected
in Q1/12 • A Phase II Production Expansion Feasibility Study is
anticipated in Q2/12 to potentially increase reserves and mine production capacity from 6,000 tpd to ~40,000 tpd +20,000 tpd.
A State Owned Enterprise Advantage:China Gold International is uniquely positioned as the
overseas flagship vehicle of China National Gold, a Chinese state owned enterprise and the largest gold producer in China. CGG has the advantage of leveraging China National Gold’s international project pipeline as well as their engineering, operating, research and financing capabilities globally.
Photos: at left; Jiama office: Jiama mine.

12 Planning for Profits | Report on Mining | Spring 2012 www.facebook.com/reportonmining
The rise in commodity prices over the last ten years and their recent volatility has generated considerable interest on the part of investors, regulators and policy-makers.
Attracted by the prospect of robust returns, diversification benefits, and potential for hedging inflation and macroeconomic risks, financial investors have increased their allocations to commodities over the period, primarily via passive investment into commodity futures indices.
However, recent market gyrations have contributed to reviving the debate on the role of commodities in strategic and tactical asset allocation and led to an increasing recognition of the relevance of long-short dynamic trading in commodity futures markets. Long-short strategies consist of buying some commodity futures in the hopes of that instrument rising in price and selling some commodity futures in the hopes of that instrument falling in price.
IntroductionThis article discusses three aspects of long-short dynamic
strategies for commodity portfolios: • The performance characteristics of long only portfolios
and long-short portfolios• The volatility of long only portfolios and long-short
portfolios• The correlation between traditional asset classes
(equities and bonds) and commodity investments when traditional asset classes are experiencing high volatility.
The Long and Short of Commodity Futures
By Joëlle Miffre, Professor of Finance, EDHEC Business School, Member, EDHEC-Risk Institute
The research on which this article is based was produced as part of the research project on “Exploring the Commodity Futures Risk Premium: Implications for Asset Allocation and Regulation” at EDHEC-Risk Institute conducted with support from CME Group.
Looking at performanceIn order to compare the performance and risk characteristics
of long only commodity portfolios and of long-short commodity strategies we must model the kind of portfolios implemented by hedge fund managers with a focus on commodities.
We start by mimicking the trading behaviour of long-short participants in commodity futures markets over the period 1992-2011. This is done by implementing a battery of long-short strategies, where these strategies are based on a momentum signal, on the slope of the term structure of commodity prices, on a double-sort that combines momentum and term structure signals, or on the positions of hedgers and speculators. The rule-based strategies that we implement specify minimum liquidity requirements for commodity contracts and then include in a long-short portfolio the commodities with the strongest momentum, the highest absolute roll-returns, or the most extreme hedging pressures.
www.ReportOnMining.com Spring 2012 | Planning for Profits | Report on Mining 13
The dataset includes Friday settlement prices for 27 commodity futures as obtained from Datastream International. These include 12 agricultural commodities, five energy commodities, four livestock commodities, five metal commodities—namely, copper, gold, palladium, platinum, silver—and finally, random length lumber. The frequency, time series and cross section of our strategies are chosen based on the availability of the positions of commercial traders (also often termed “hedgers”) and non-commercial traders (also often referred to as “speculators”) in the Commodity Futures Trading Commission (CFTC) Commitment of Traders Report (COT). These positions are collected every Tuesday and made available to the public the following Friday.
All portfolios short-list the 75% most liquid contracts out of the universe of commodity futures that are available at the time of portfolio construction. The momentum portfolio is composed by buying the (remaining) 20% with the highest past performance and shorting the (remaining) 20% with the lowest past performance over a chosen observation period. Likewise, out of the 75% of contracts that are the most liquid, the term structure portfolio buys the 20% with the highest roll returns i.e., the highest difference between the current spot price and the futures contract price, and sells the 20% with the lowest roll-returns. Finally, the hedging pressure strategies use as signals for asset allocation the positions of commercial traders and non-commercial traders, as reported by the CFTC.
To be more specific, the strategies take long positions in liquid backwardation commodities (i.e., commodities whose futures are trading below the expected spot price at contract maturity) and short positions in liquid contango commodities (the opposite market condition to backwardation).
The either single- or double-sort strategies we end up with aim at systematically taking long positions in the 15% of commodities whose prices are expected to appreciate and short positions in the 15% of commodities whose prices are expected to depreciate.
In terms of stand-alone performance and as previously reported in the literature, long-short commodity portfolios are found to dominate long-only commodity indices. The average mean excess return of the single-sort long-short portfolios equals 7.99% a year and that of the double-sort portfolios equals 9.03% a year. Over the same period, the mean excess return of the S&P-GSCI equals 0.64% a year and that of the long-only equally-weighted portfolio of the27 commodities included in this study is at 4.28% a year. The conclusion is similar once we adjust for risk. The Sharpe ratios (which measure returns in excess of the risk-free rate divided by volatility) of the long-short portfolios average out at 0.5093 with a range from 0.2711 (for the single-sort momentum strategy) to 0.6302 (for the single-sort hedger-based strategy). These Sharpe ratios always substantially exceed those of long-only benchmarks (0.0529 for the long-only equally-weighted portfolio and 0.1965 for the S&P-GSCI).
Taking the portfolio perspective
In the context of multi-asset class investment, the relationship between the volatility of commodity investments and that of traditional investments as well as the correlations between commodity investments and traditional asset classes have important implications for risk management and diversification.
The averages of the conditional volatilities of the long-short commodity strategies studied here range from 15.09% to 17.61% a year and are less than the average of the conditional volatilities of the S&P-GSCI, which stands at 20.81%. These differences are statistically significant. The equally-weighted portfolio of the27 commodities is found to have a conditional volatility of 11.28%.
The conditional volatilities of the long-short commodity strategies are also found to rise by less than that of the S&P-GSCI or the equally-weighted benchmark in periods of increased volatility in equity markets.
14 Planning for Profits | Report on Mining | Spring 2012 www.facebook.com/reportonmining
Furthermore, they fall in periods of increased volatility in fixed income markets at a time when the conditional volatilities of the long only commodity indices rise. This is welcome news to investors as it indicates that they can reduce the total risk of their multi-class portfolios in a more effective way by being long-short commodities as opposed to being long only.
Over the period, the conditional correlations of the S&P500 with the commodity investments studied are low, confirming their strategic role as risk diversifiers. The conditional correlations modelled relative to the long-short commodity portfolios are lower than those modelled relative to the long-only commodity indices, suggesting that the risk diversification benefits of commodity futures are stronger within long-short portfolios. Focusing on the period following the demise of Lehman Brothers, we observe a sharp rise in the conditional correlations between the S&P500 and long-only commodity indices while those between the S&P500 and long-short commodity strategies remain very low. This shows the much stronger diversification benefits associated with long-short strategies versus long-only indices.
The conditional correlations between the long-short and long-only commodity portfolios and the Barclays Capital U.S. Aggregate Bond Index are also found to be low over the period. A statistical test of differences between these correlations suggest that, other things being equal, bond investors are better off from a risk management perspective holding the S&P-GSCI than commodity portfolios based on past performance or on past roll-returns.
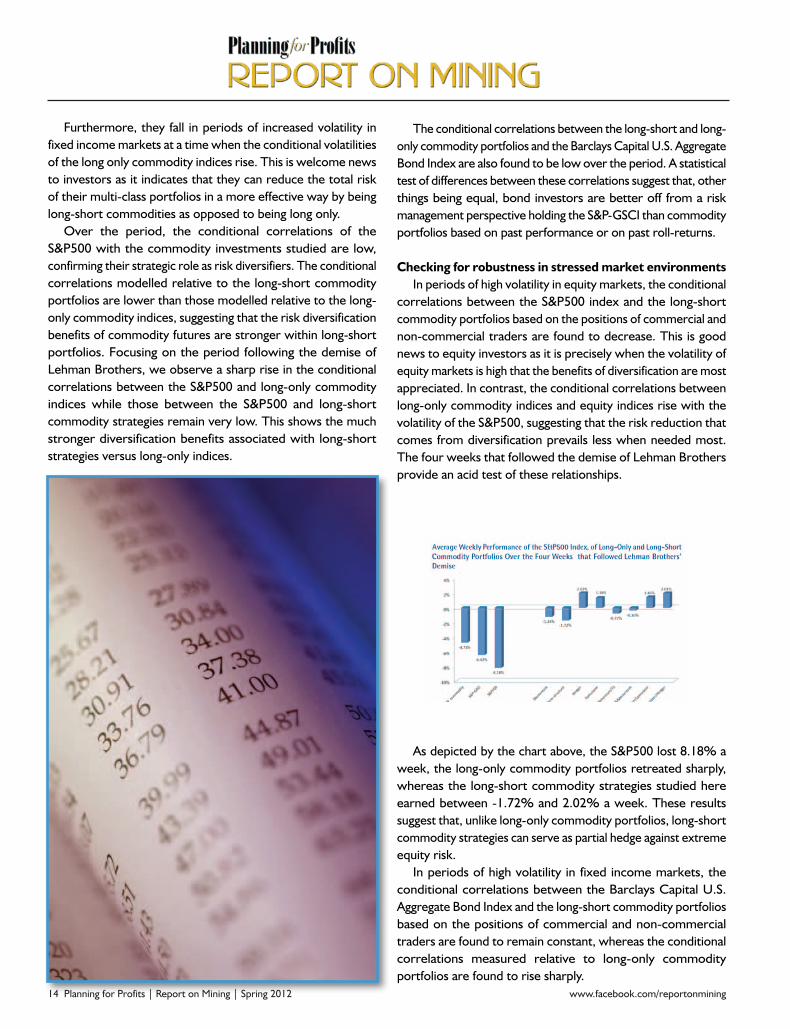
Checking for robustness in stressed market environmentsIn periods of high volatility in equity markets, the conditional
correlations between the S&P500 index and the long-short commodity portfolios based on the positions of commercial and non-commercial traders are found to decrease. This is good news to equity investors as it is precisely when the volatility of equity markets is high that the benefits of diversification are most appreciated. In contrast, the conditional correlations between long-only commodity indices and equity indices rise with the volatility of the S&P500, suggesting that the risk reduction that comes from diversification prevails less when needed most. The four weeks that followed the demise of Lehman Brothers provide an acid test of these relationships.
As depicted by the chart above, the S&P500 lost 8.18% a week, the long-only commodity portfolios retreated sharply, whereas the long-short commodity strategies studied here earned between -1.72% and 2.02% a week. These results suggest that, unlike long-only commodity portfolios, long-short commodity strategies can serve as partial hedge against extreme equity risk.
In periods of high volatility in fixed income markets, the conditional correlations between the Barclays Capital U.S. Aggregate Bond Index and the long-short commodity portfolios based on the positions of commercial and non-commercial traders are found to remain constant, whereas the conditional correlations measured relative to long-only commodity portfolios are found to rise sharply.

www.ReportOnMining.com Spring 2012 | Planning for Profits | Report on Mining 15
This suggests that long-short commodity portfolios based on the positions of hedgers and speculators can serve as better diversifiers than long only commodity portfolios in periods of extreme risk in fixed income markets.
Our results confirm the relevance of commodity futures investment and presents reasons as to why long-short strategies should prevail over long-only investing: they have lower conditional volatility than the leading long-only benchmark index; and they offer more effective diversification qualities for equity portfolios, especially in the recent period. Furthermore, long-short commodity portfolios have partial hedging characteristics providing protection against extreme-risk in the equity markets and to offer stable diversification properties in times of turbulence on the fixed income markets.
A disruptive force?We investigate whether the increased role
of financial investors has been a disruptive force in commodity futures markets. This is done by testing whether the increase in the long, as well as short, interests of speculators caused a change in the conditional volatility of long-short commodity portfolios or a change in the conditional correlation between their returns and those of traditional assets. Our (Granger) causality tests are tests of the hypothesis that changes in the positions of long-short investors do not cause changes in the volatility of the long-short commodity portfolios or have no impact on their conditional correlation with traditional assets. A failure to reject the hypothesis indicates a lack of causality.
We find virtually no support for the hypothesis that long-short investors have destabilised commodity prices by increasing volatility or co-movements between commodity prices and those of traditional assets. Interestingly, this conclusion holds irrespective of whether investors are labelled as “non-commercial” or “professional money managers”. Thus the analysis presented here does not call for a change in the regulation in relation with the increased participation of professional money managers in commodity futures markets.
The research from which this article was drawn was produced as part of the research project on “Exploring the Commodity Futures Risk Premium: Implications for Asset Allocation and Regulation” at EDHEC-Risk Institute conducted with support from CME Group.
About the Author: Joëlle Miffre is Professor of Finance at EDHEC Business School and a Member of EDHEC-Risk Institute. Her research on commodities and active strategies has appeared in leading academic journals. She also acts as scientific advisor to a Commodity Trading Advisor. This article presents her latest research on long/short commodity investing, produced with market data and support from CME Group.

16 Planning for Profits | Report on Mining | Spring 2012 www.facebook.com/reportonmining
Jourdan Resources Inc. is a Canadian junior mining exploration company trading under the symbol JOR on the TSX Venture Exchange. The Company is focused on the acquisition, exploration, production, and development of mining properties in phosphates (apatite). The Company’s properties are currently at the exploration stage and are located along the North Shore region of Quebec.
Jourdan’s experienced management and board of directors have refocused Jourdan on phosphates. With a strategy of successful exploration through cost-effective examination of historical occurrences and deposits as well as testing high-quality targets, Jourdan is very well positioned for the future.
Apatite is a mineral used in the manufacturing of fertilizer, which has grown substantially in demand in recent years.
Demand has grown so rapidly, its market price has risen from $42 per tonne to $150 per tonne in the course of the last five years.
Several factors are contributing to this growing demand, including:• an increasing need for fertilizers in developing countries;• low levels of global grain stocks;• increasing demand for plants used to produce biofuels;• growing demand for higher quality food;• the closure of several apatite mines;• the rising costs of constructing new mines.Jourdan’s Dissimieux Lake Phosphate Project is a large,
low grade, phosphate project lying within the trend of favourable ultramafic rocks between Arianne Resources’ Lac à Paul project and Investissement Québec/Yara International ASA’s Mine Arnaud.
Apatite is a mineral composed of phosphate found in volcanic rock. Once mined, the apatite is processed to a 40% grade concentrate. The concentrate is then shipped to clients for the production of fertilizers.
Phosphate is an essential element of plant nutrition, along with nitrogen and potash. It stimulates plant growth, root proliferation and the early maturation of fruits and cereals. Phosphate also increases plant resistance to cold, disease and adverse growing conditions.
The U.S. is the world’s largest supplier (it was China two years ago) and consumer of phosphate. However, the supply of phosphate in the U.S. has been steadily declining, with several mines expected to close. Currently, Agrium operates the only producing phosphate mine in Canada, based in Kapuskasing, Ontario. Production is expected to gradually slow until a complete shutdown around 2015. Other deposits in Canada will need to go into production in order to reduce the country’s dependency on international imports to meet agricultural fertilizer needs.
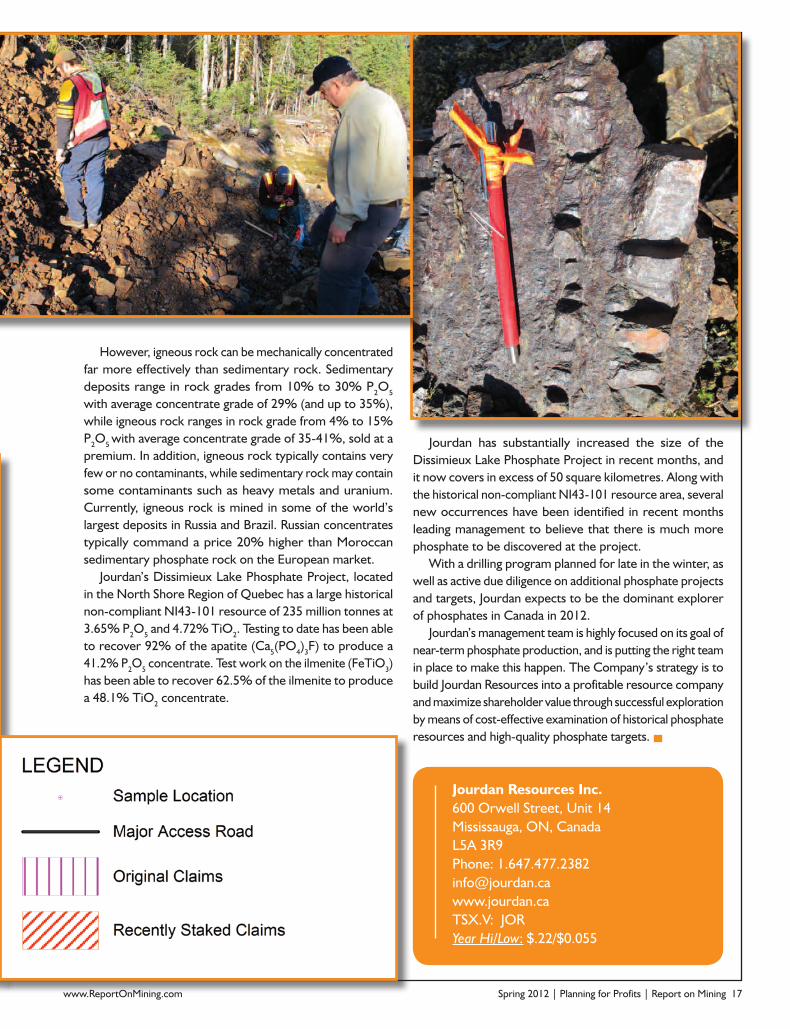
Phosphate rock is classified into two groupings based on the geological settings from which it is mined: igneous rocks and sedimentary rocks. The phosphate deposits of Lac à Paul are igneous rocks. Igneous phosphate deposits come from carbonatite and mafic-ultramafic intrusions. However, more than 80% of mined phosphate comes from sedimentary deposits, the ancient remains of millions of sea creatures deposited in oceans. While economically viable igneous deposits are rare, they tend to have advantages when compared to sedimentary deposits. The nature of igneous deposits does not lend to natural concentration of P2O5, so grades tend to be lower than their sedimentary counterparts.
RESOURCES
RESOURCES
Assay locations
www.ReportOnMining.com Spring 2012 | Planning for Profits | Report on Mining 17
Jourdan Resources Inc.600 Orwell Street, Unit 14Mississauga, ON, Canada L5A 3R9 Phone: [email protected]: JORYear Hi/Low: $.22/$0.055
However, igneous rock can be mechanically concentrated far more effectively than sedimentary rock. Sedimentary deposits range in rock grades from 10% to 30% P2O5 with average concentrate grade of 29% (and up to 35%), while igneous rock ranges in rock grade from 4% to 15% P2O5 with average concentrate grade of 35-41%, sold at a premium. In addition, igneous rock typically contains very few or no contaminants, while sedimentary rock may contain some contaminants such as heavy metals and uranium. Currently, igneous rock is mined in some of the world’s largest deposits in Russia and Brazil. Russian concentrates typically command a price 20% higher than Moroccan sedimentary phosphate rock on the European market.
Jourdan’s Dissimieux Lake Phosphate Project, located in the North Shore Region of Quebec has a large historical non-compliant NI43-101 resource of 235 million tonnes at 3.65% P2O5 and 4.72% TiO2. Testing to date has been able to recover 92% of the apatite (Ca5(PO4)3F) to produce a 41.2% P2O5 concentrate. Test work on the ilmenite (FeTiO3) has been able to recover 62.5% of the ilmenite to produce a 48.1% TiO2 concentrate.
Jourdan has substantially increased the size of the Dissimieux Lake Phosphate Project in recent months, and it now covers in excess of 50 square kilometres. Along with the historical non-compliant NI43-101 resource area, several new occurrences have been identified in recent months leading management to believe that there is much more phosphate to be discovered at the project.
With a drilling program planned for late in the winter, as well as active due diligence on additional phosphate projects and targets, Jourdan expects to be the dominant explorer of phosphates in Canada in 2012.
Jourdan’s management team is highly focused on its goal of near-term phosphate production, and is putting the right team in place to make this happen. The Company’s strategy is to build Jourdan Resources into a profitable resource company and maximize shareholder value through successful exploration by means of cost-effective examination of historical phosphate resources and high-quality phosphate targets.
18 Planning for Profits | Report on Mining | Spring 2012 www.facebook.com/reportonmining
Abacus - no ordinary junior miner
When you ask investors at any mining conference what they look for in a junior mining company as they make
their way around an endless myriad of booths, at the top of the list are three criteria: the project and its location, the management, and a major’s involvement. We look for a safe jurisdiction, proximity to infrastructure and other producers, a management that has a demonstrated track record and capability to bring the mine through feasibility into production, and involvement of a major whose due diligence and willingness to fund development is viewed as validating the quality of the project. In a word, these attributes MINIMIZE RISK—geopolitical, operational, execution, and financial.
These are the mines that will be built, or have a superior chance of coming onstream. The majors are in a global staking war to secure tomorrow’s growth; China, Japan, Korea are scouring the Americas in unprecedented numbers for long term supply, but one country has recently surprised, a little known Polish giant known as KGHM Polska Miedz S.A. (KGHM).
In May 2010, Europe’s largest producer of mined copper (9th globally) and third largest producer of silver confirmed market speculation that Abacus’ Ajax copper-gold project near Kamloops, B.C. had met the criteria to be their first significant investment outside of Poland. A relatively unknown name outside of Europe, KGHM announced aggressive growth plans to expand its current copper production of 500,000 to 700,000 metric tonnes per annum by 2018, its own production from the world’s largest copper operation subject to rising costs with mining at increasing depths.
Ajax Copper-Gold ProjectKGHM’s First Acquisition Outside of Poland
What differentiated Abacus’ from the other copper developers in Canada?
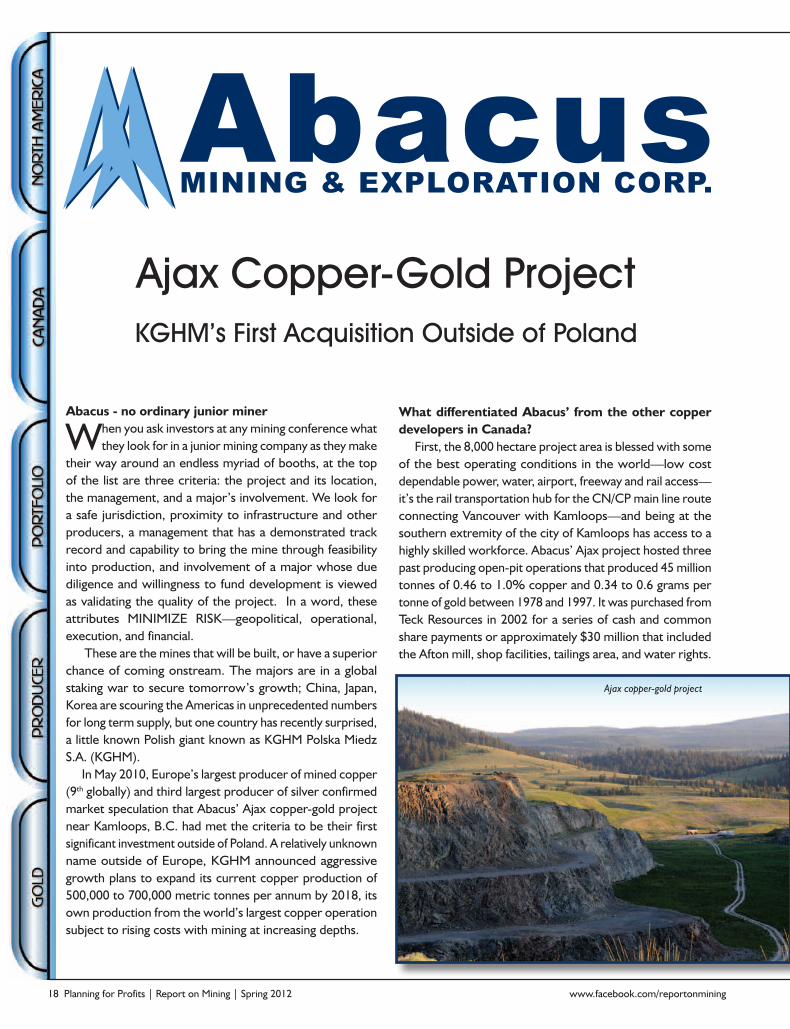
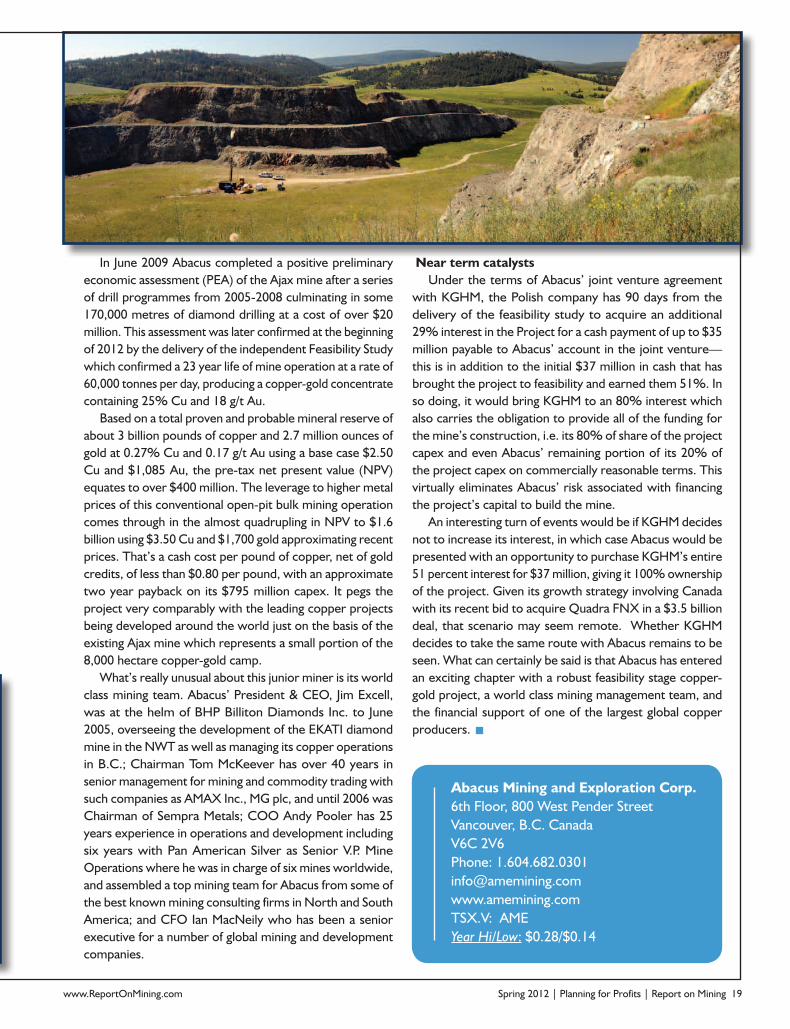
First, the 8,000 hectare project area is blessed with some of the best operating conditions in the world—low cost dependable power, water, airport, freeway and rail access—it’s the rail transportation hub for the CN/CP main line route connecting Vancouver with Kamloops—and being at the southern extremity of the city of Kamloops has access to a highly skilled workforce. Abacus’ Ajax project hosted three past producing open-pit operations that produced 45 million tonnes of 0.46 to 1.0% copper and 0.34 to 0.6 grams per tonne of gold between 1978 and 1997. It was purchased from Teck Resources in 2002 for a series of cash and common share payments or approximately $30 million that included the Afton mill, shop facilities, tailings area, and water rights.
Ajax copper-gold project
www.ReportOnMining.com Spring 2012 | Planning for Profits | Report on Mining 19
Near term catalystsUnder the terms of Abacus’ joint venture agreement
with KGHM, the Polish company has 90 days from the delivery of the feasibility study to acquire an additional 29% interest in the Project for a cash payment of up to $35 million payable to Abacus’ account in the joint venture—this is in addition to the initial $37 million in cash that has brought the project to feasibility and earned them 51%. In so doing, it would bring KGHM to an 80% interest which also carries the obligation to provide all of the funding for the mine’s construction, i.e. its 80% of share of the project capex and even Abacus’ remaining portion of its 20% of the project capex on commercially reasonable terms. This virtually eliminates Abacus’ risk associated with financing the project’s capital to build the mine.
An interesting turn of events would be if KGHM decides not to increase its interest, in which case Abacus would be presented with an opportunity to purchase KGHM’s entire 51 percent interest for $37 million, giving it 100% ownership of the project. Given its growth strategy involving Canada with its recent bid to acquire Quadra FNX in a $3.5 billion deal, that scenario may seem remote. Whether KGHM decides to take the same route with Abacus remains to be seen. What can certainly be said is that Abacus has entered an exciting chapter with a robust feasibility stage copper-gold project, a world class mining management team, and the financial support of one of the largest global copper producers.
In June 2009 Abacus completed a positive preliminary economic assessment (PEA) of the Ajax mine after a series of drill programmes from 2005-2008 culminating in some 170,000 metres of diamond drilling at a cost of over $20 million. This assessment was later confirmed at the beginning of 2012 by the delivery of the independent Feasibility Study which confirmed a 23 year life of mine operation at a rate of 60,000 tonnes per day, producing a copper-gold concentrate containing 25% Cu and 18 g/t Au.
Based on a total proven and probable mineral reserve of about 3 billion pounds of copper and 2.7 million ounces of gold at 0.27% Cu and 0.17 g/t Au using a base case $2.50 Cu and $1,085 Au, the pre-tax net present value (NPV) equates to over $400 million. The leverage to higher metal prices of this conventional open-pit bulk mining operation comes through in the almost quadrupling in NPV to $1.6 billion using $3.50 Cu and $1,700 gold approximating recent prices. That’s a cash cost per pound of copper, net of gold credits, of less than $0.80 per pound, with an approximate two year payback on its $795 million capex. It pegs the project very comparably with the leading copper projects being developed around the world just on the basis of the existing Ajax mine which represents a small portion of the 8,000 hectare copper-gold camp.
What’s really unusual about this junior miner is its world class mining team. Abacus’ President & CEO, Jim Excell, was at the helm of BHP Billiton Diamonds Inc. to June 2005, overseeing the development of the EKATI diamond mine in the NWT as well as managing its copper operations in B.C.; Chairman Tom McKeever has over 40 years in senior management for mining and commodity trading with such companies as AMAX Inc., MG plc, and until 2006 was Chairman of Sempra Metals; COO Andy Pooler has 25 years experience in operations and development including six years with Pan American Silver as Senior V.P. Mine Operations where he was in charge of six mines worldwide, and assembled a top mining team for Abacus from some of the best known mining consulting firms in North and South America; and CFO Ian MacNeily who has been a senior executive for a number of global mining and development companies.
Abacus Mining and Exploration Corp.6th Floor, 800 West Pender StreetVancouver, B.C. Canada V6C 2V6Phone: [email protected]: AMEYear Hi/Low: $0.28/$0.14

Time for facts in the mining debate?
Most Canadians rely on mined metals and minerals every day, often without realizing it. Our food sys-
tems depend on mined nutrients; we rely on the minerals in our cell phones and computers to stay connected with one another; and our energy needs are met with hydro, solar, and gas which all use minerals and metals to generate and transmit energy.
The Canadian economy also benefits from mining: 308,000 workers are employed directly in this industry (2% of the labor force) (Canada, Natural Resources, 2011). In 2009, mining and metal processing con-tributed $32 billion to Canada’s GDP (2.7%) and this sector is expected to remain an important contribu-tor to Canada’s economic growth (Canada, Natural Resources 2009).
Canadian mining is also important internationally. According to the Mining Association of Canada, in 2010 there were 1,000 exploration companies active in over 100 countries with more than 4,300 mining projects at various stages of development (The Mining Association of Canada, 2010). Canadian firms also contribute to government revenues through taxes and royalties. Yet despite its significance, the mining indus-try is poorly understood and debates on its local and global effects are increasingly polarized.
Anti-mining sentiments are growing and are often centred around allegations of environmental damage, community opposition, and increased social conflict over land and water resources. Miners, like everyone else, have a clear responsibility to avoid damage to others or provide compensation when it occurs. Moreover, mining, like other activities, has not had a perfect track record. But, paradoxically, anti-mining claims are growing even as the industry has increased community engagement, improved
Fraser Institute to launch mining facts website
Alana Wilson
environmental protection and restoration, and extended the economic and social benefits of operations to host com-munties. For example, many mining companies volun-tary provide communities with infrastructure (electricity, potable water, schools, improved roads), training, and health care as part of their Corporate Social Responsibility programs.
The complexity of the mining industry requires careful analysis that objectively considers the impacts and benefits from different perspectives. Unfortunately, the debate over such issues is often simplistic, biased, or does not reflect current mining practices.
The Fraser Institute’s Global Centre for Mining Studies has launched a new project to address this infor-mation vacuum. It aims to provide balanced consider-ation of both the benefits and challenges mining brings. It will explore the issues and debate surrounding the activities of Canadian mining companies in Canada and abroad. It will present information for a general audi-ence and will act as a resource for those communities, citizens, and media who have questions about the impact of mining activity. Its website, www.miningfacts.org , is scheduled to launch in late February 2012.
ReferencesCanada, Natural Resources Canada [NRC]. (2009). Canadian Minerals Yearbook (CMY) - 2009. NRC.
Canada, Natural Resources Canada [NRC]. (2011). Employ-ment Information Bulletin, July 2011. NRC. <http://www.nrcan.gc.ca/mms-smm/pubr-pubr/emp-emp11-eng.htm>, as of November 23, 2011.
The Mining Association of Canada. (2010). A Report on the State of the Canadian Mining Industry: Facts + Figures 2010. The Mining Association of Canada.
Environment Communities Economy
Senior Research Analyst, Fraser Institute Global Centre for Mining Studies

www.ReportOnMining.com Spring 2012 | Planning for Profits | Report on Mining 21
A year ago, the outlook for commodities was arguably much clearer than it is at present. Commodities entered 2011 on an optimistic note, as confidence in global
growth and the freefall in the U.S. dollar triggered a massive rally in the second half of 2010. In fact, the Reuters CRB index surged a record 29% in this period to finish up 17% for the year, as commodities as diverse as cotton, silver and coffee soared more than 80% on average; as a result, the group easily outperformed most major asset classes in 2010.
But the escalation in market volatility and extreme risk aversion since August took their toll on the commodity complex in 2011, resulting in the group posting its first annual decline since 2008. The Reuters CRB index fell 8% last year, and the London Metal Exchange index of six industrial metals retreated 22%. Gold rose 10% for its 11th straight year of gains, while copper—a reliable proxy for risk appetite and global growth expectations—tumbled almost 23% last year. In the energy sector, crude oil advanced 8% for its third annual gain even as natural gas continued to plummet, down 32% for the year.
The commodity retreat led to a decline of 11% for the TSX index last year. The TSX-Venture index was hit much harder, as investors abandoned junior miners and explorers in droves, resulting in a 35% plunge in the index. Although the environment for corporate financings was challenging in the second half of the year, overall financing activity did not decline precipitously in 2011. According to TMX Group data, total financings on the TSX-Venture exchange rose 2.4% to $10.1 billion last year. Financings on the TSX exchange fell 7.2% to $40.9 billion, as IPO financings plunged 38.3% to $6.6 billion.
On the U.S. side, the S&P 500 finished the year virtually unchanged, masking the tremendous recent increase in volatility. Daily moves in the S&P 500 averaged 2.2% in August, the most for that month since 1932; as well, the index’s average swings of 1.9% from May to December last year was triple the 50-year average move of 0.6% prior to the Lehman collapse in September 2008.
Outlook for Commodities Clouded by Rising Number of Wildcards
Murky Outlook Prevails Following First Annual Decline in Three Years
By Elvis Picardo, CFA
A year later, then, it is a very different story, as the outlook for commodities in 2012 is clouded by a rising number of wildcards, in our opinion. China continues to be one of these, and the issue of sovereign debt presently centering on Europe is another. A third potential wildcard that has only recently entered into the equation is Iran and its nuclear ambitions. In an environment where investors continue to be very skittish, any of these wildcards could disrupt global growth and lead to a significant decline in commodity prices.
Situation stabilizing but risks remainThe global economic environment certainly seems to have
stabilized since the International Monetary Fund published a gloomy forecast in its World Economic Outlook in September. This is evidenced by the fact that as of mid-January, most major global equity indices are up anywhere from 2% to 4%, with the S&P 500 near a five-month high; risk metrics have also declined and most commodity prices have advanced.
The IMF estimated in its report that global growth would moderate to about 4% in 2011 and 2012, from just over 5% in 2010. It had also warned of two specific risks that had downside implications—the possibility that the European debt crisis could escalate out of control, and the likelihood that softening economic activity in the U.S. may be further affected by factors such as a political impasse or a weak housing market.
But with both these risks having receded somewhat over the past couple of weeks, at least 2012 began on the right note. ECB President Mario Draghi recently said that there were tentative signs of economic stabilization in the euro area, following a massive infusion of cash into the financial system by the Central Bank last month. On an encouraging note, yields on Italian and Spanish debt sales also plunged this week. In the U.S., there are tentative signs that the twin pillars of employment and housing may finally be stabilizing, with jobs numbers exceeding expectations for three successive months, and shares of U.S. homebuilders in a pronounced uptrend lately.

22 Planning for Profits | Report on Mining | Spring 2012 www.facebook.com/reportonmining
Nevertheless, the situation in Europe remains fluid, and the region could easily plunge into recession this year if sovereign debt concerns escalate or the currency crisis worsens. This risk is underscored by the fact that Germany, the largest economy in Europe, contracted in the fourth quarter of 2011.
As for China, over-reliance on Chinese demand remains a major risk for commodity markets, as we have stated on more than one occasion. In our previous column here, we had noted the IMF’s assertion that the contribution to global demand from China—which accounts for about 40% of global metal consumption—had fallen to unusually low levels in the first half of 2011 due to slower activity in metal-intensive sectors, the result of policy tightening measures over the past year. The IMF had also noted that China’s base metal inventory cycle had gone from being bullish to bearish for metal prices last year.
With the Chinese economy slowing down perceptibly, there is widespread optimism for a soft landing in the nation. The IMF expects China to slow down only marginally to a growth rate of 9% in 2012 from about 9.5% last year; it therefore expects base metal consumption in China to remain stable around the rates seen in the first half of 2011.
The Chinese economy is forecast by economists to have slowed down to an 8.7% growth pace in the fourth quarter of 2011, from 9.1% in the third quarter. That was the slowest pace since 2009, due to weaker export growth and monetary tightening. With recent data showing that China’s import growth slowed to a two-year low in December, investors are now looking forward to easier monetary policy in the months ahead. On November 30, the People’s Bank of China cut reserve-requirement ratios for banks from a record high, the first such reduction in three years, while the swap market is reflecting expectations for a drop in the benchmark one-year deposit rate to 2.75% over the next 12 months, from 3.5% at present.
What if property prices in China plunge and precipitate a hard landing in the world’s second-largest economy? This remains a major risk to commodity prices for the second year in a year, and a risk that is magnified by the fact that the rest of the world is already on shaky ground in terms of economic growth.
The Iran wildcard is a relatively new one; depending on one’s point of view, it is either the biggest geopolitical risk in years or an issue of little significance. The issue has been precipitated by Iran’s threat on December 27 to block the Strait of Hormuz—through which about 20% of the world’s oil is shipped—in response to a proposed E.U. embargo on Iranian oil. The embargo is intended to force Iran to the bargaining table for negotiations over its nuclear program, concerns about which have been rising since November. A dramatic escalation in this issue or an outright confrontation would most likely have a positive impact on the price of crude oil, and perhaps gold, but it will only amplify downside risk for base metals and other commodities.
Commodity themes for 20121. We expect the pendulum of risk appetite to continue
oscillating this year, although the gyrations are unlikely to be as wide as in the second half of 2011. Figure 1, which displays our proprietary FAIL® Indicator (a composite measure of global systemic financial risk) versus the MSCI World Index and Reuters CRB Index over the past five years, clearly demonstrates the negative relationship between risk appetite and the performance of perceived risky assets such as stocks and commodities. Our view is that over the course of 2012, the risk switch is likely to spend more time “off” than “on,” which could cap commodity prices.
2. If risk appetite is not as hearty as it was in the two-year period from mid-2009 to mid-2011, the USD may hold its own or even advance against major currencies. This would represent a headwind for commodity prices, given the negative correlation between the greenback and commodities (using commodity-heavy indexes as a proxy – Figure 2).
3. Gold could well record its 12th successive year of advances in 2012, largely as a hedge against currency turmoil (and nebulous fears about an impending financial catastrophe), but its appeal is likely to be tarnished should one of the wildcard events discussed earlier come to pass. Physical demand is also likely to be affected if the precious metal resumes its ascent. Note that in India, the world’s largest market for gold, bullion prices surged by 31% in 2011 as a result of gold’s advance and the rupee’s depreciation.
Figure 1: FAIL® Indicator vs. MSCI World Index and Reuters CRB Index – 2007 to 2011 (Weekly)
Figure 2: Dollar Index (DXY) vs. LME Index, TSX Metals & Mining Index, TSX Venture Index – 2002 to 2011 (Weekly)
www.ReportOnMining.com Spring 2012 | Planning for Profits | Report on Mining 23
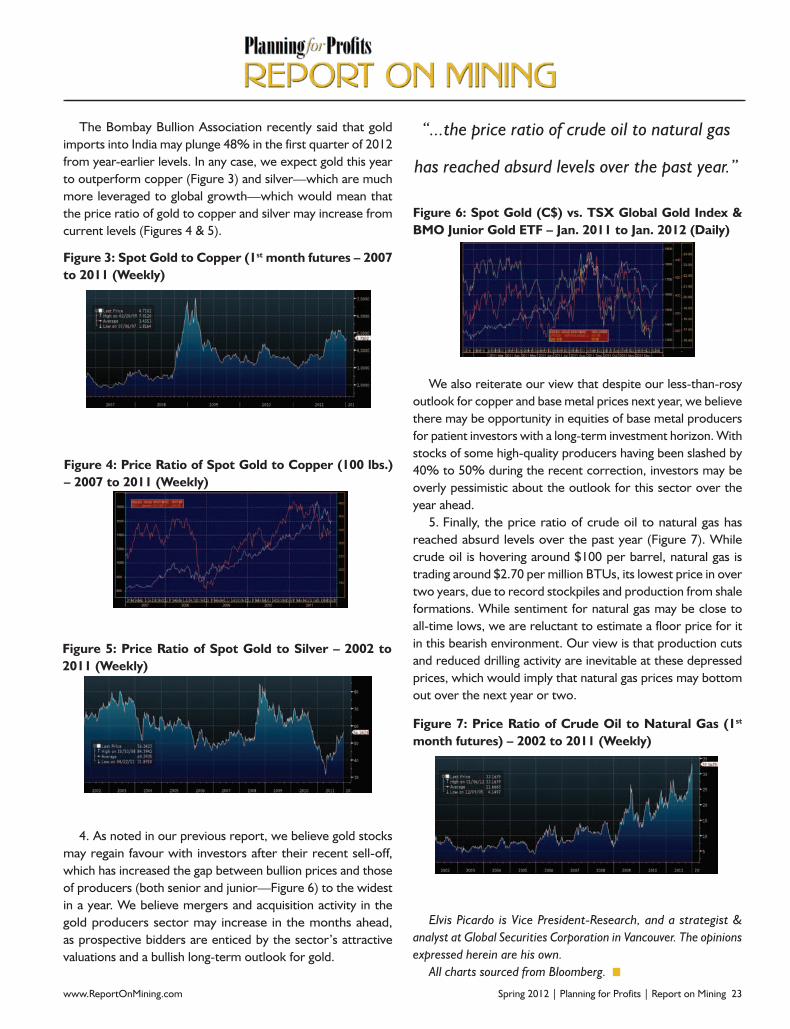
The Bombay Bullion Association recently said that gold imports into India may plunge 48% in the first quarter of 2012 from year-earlier levels. In any case, we expect gold this year to outperform copper (Figure 3) and silver—which are much more leveraged to global growth—which would mean that the price ratio of gold to copper and silver may increase from current levels (Figures 4 & 5).
4. As noted in our previous report, we believe gold stocks may regain favour with investors after their recent sell-off, which has increased the gap between bullion prices and those of producers (both senior and junior—Figure 6) to the widest in a year. We believe mergers and acquisition activity in the gold producers sector may increase in the months ahead, as prospective bidders are enticed by the sector’s attractive valuations and a bullish long-term outlook for gold.
We also reiterate our view that despite our less-than-rosy outlook for copper and base metal prices next year, we believe there may be opportunity in equities of base metal producers for patient investors with a long-term investment horizon. With stocks of some high-quality producers having been slashed by 40% to 50% during the recent correction, investors may be overly pessimistic about the outlook for this sector over the year ahead.
5. Finally, the price ratio of crude oil to natural gas has reached absurd levels over the past year (Figure 7). While crude oil is hovering around $100 per barrel, natural gas is trading around $2.70 per million BTUs, its lowest price in over two years, due to record stockpiles and production from shale formations. While sentiment for natural gas may be close to all-time lows, we are reluctant to estimate a floor price for it in this bearish environment. Our view is that production cuts and reduced drilling activity are inevitable at these depressed prices, which would imply that natural gas prices may bottom out over the next year or two.
Elvis Picardo is Vice President-Research, and a strategist & analyst at Global Securities Corporation in Vancouver. The opinions expressed herein are his own.
All charts sourced from Bloomberg.
Figure 3: Spot Gold to Copper (1st month futures – 2007 to 2011 (Weekly)
Figure 4: Price Ratio of Spot Gold to Copper (100 lbs.) – 2007 to 2011 (Weekly)
Figure 5: Price Ratio of Spot Gold to Silver – 2002 to 2011 (Weekly)
Figure 6: Spot Gold (C$) vs. TSX Global Gold Index & BMO Junior Gold ETF – Jan. 2011 to Jan. 2012 (Daily)
Figure 7: Price Ratio of Crude Oil to Natural Gas (1st month futures) – 2002 to 2011 (Weekly)
“...the price ratio of crude oil to natural gas
has reached absurd levels over the past year.”
24 Planning for Profits | Report on Mining | Spring 2012 www.facebook.com/reportonmining
Eco Oro Minerals Corp. (TSX: EOM) is a Canadian exploration and development company with an extensive
portfolio of properties in the California gold district of Colombia. The Company is focused on advancing the Angostura gold-silver project to production. Eco Oro’s objective is to become one of the first socially responsible gold producers in Colombia. Eco Oro is currently completing an updated preliminary economic assessment and a pre-feasibility study on Angostura to evaluate the potential for an underground operation.
Corporate Structure (as at January 17, 2012)Shares outstanding: 84.2 million Fully diluted: 91.3 million Share price: C$1.62 Market capitalization: C$136 million
Investment Highlights•An emerging gold company with resources of more than two million ounces gold for an underground mining scenario•Nearly 1,000 core holes drilled over more than 300,000 metres
•Board of Directors with broad and diverse experience and strong ties to Colombia•Experienced management and technical teams in Vancouver and Colombia•More than 30,000 hectares of exploration concessions in the California gold district, less than 10% of which has been evaluated•Strong balance sheet: U.S. $44.7 million cash and no debt (Q4 2011)•Well-funded community training and investment program•Significant institutional ownership
Angostura•55 kilometres by road from the city of Bucaramanga at 2,600 – 3,500 metre elevation•Access to major power grid, water and educated local workforce•U.S. $160 million invested to date•Typical high-sulphidation epithermal deposit with Au-Ag mineralization controlled by swarms of east-northeast-trending structures which dip steeply to the north
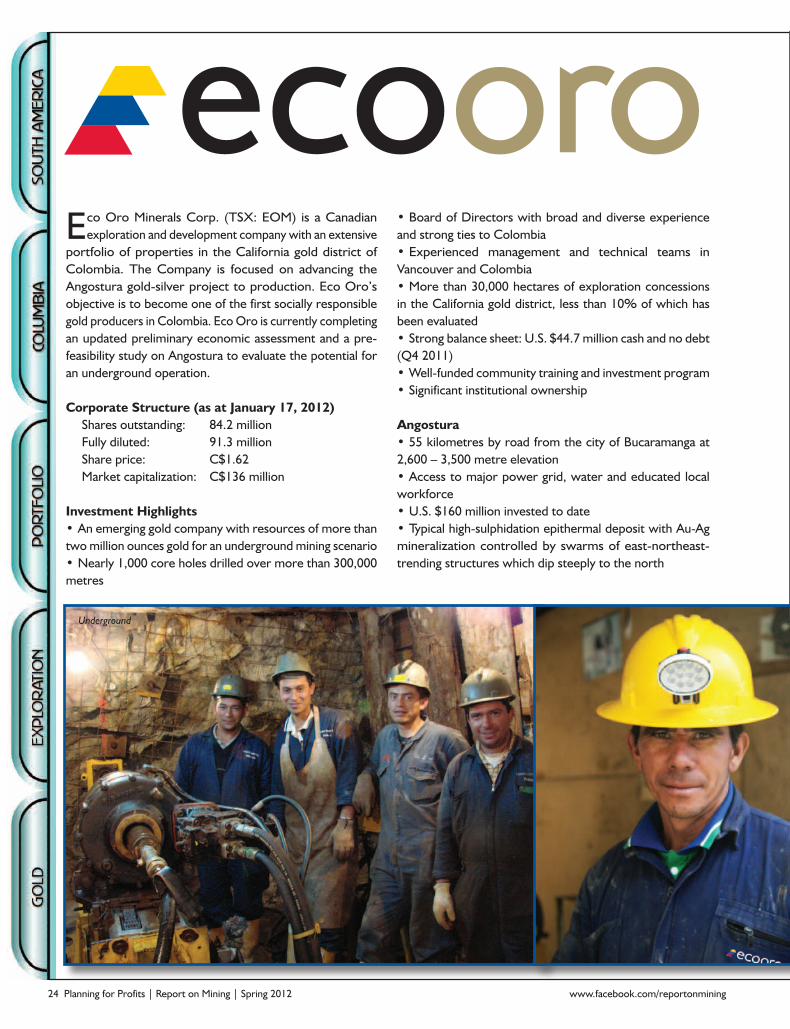
Underground
www.ReportOnMining.com Spring 2012 | Planning for Profits | Report on Mining 25
Armenia and La Violetal•These mineral occurrences have yet to be evaluated
Angostura ProjectAngostura, Eco Oro’s flagship project, is a multi-million-
ounce gold-silver deposit approximately 400 kilometres northeast of the Colombian capital of Bogotá within the Soto Norte region. The project is easily accessible by good roads from the city of Bucaramanga. Elevations range from 2,600 to 3,500 metres.
As per the April 2011 preliminary economic assessment, Angostura contains an underground mineable inferred resource of 2.4 million ounces gold and 13.6 million ounces silver using a gold cut-off grade of 3 gpt. Eco Oro is currently completing an updated preliminary economic assessment and pre-feasibility study on the deposit to evaluate the potential for an underground mine.
A 45,000 metre infill drilling program commenced in June 2011, which is now 60% completed. The program is designed to convert inferred mineral resource estimates into the indicated mineral resource category and better define the continuity and extent of high-grade veins.
Eco Oro Minerals is sponsoring the Soto Norte Foundation to provide skills training and education, support small businesses, and finance equipment and infrastructure in the Soto Norte district surrounding Angostura. The Company is also committed to developing best practices in environmental management and investing in regional environmental restoration including: nursery propagation of native flora; preservation of the Páramo ecosystem; and restoration of lost habitats, among other initiatives.
ManagementAnna Stylianides Interim President & CEOPaul Robertson CFO
DirectorsJuan Esteban Orduz Co-Chairman; Anna Stylianides Co-Chairman; Joao Carrelo; Jed Rubin; Jean-Sebastien Blanchette; Eduardo Jaramillo; Hubert Marleau
Eco Oro Minerals Corp.1430−333SeymourStreetVancouver BC, Canada V6B 5A6 Phone: 604.682.8212Fax: [email protected]: EOMYear Hi/Low: $5.48/$1.51
•More than 300,000 metres of drilling and 3,000 metres of underground development completed; infill drilling under way•Updated preliminary economic assessment and pre-feasibility study being completed
Satellite DepositsMóngora•Three kilometres south of Angostura with similar geology and mineralization•More than 20,000 metres drilled•NI43-101 resource estimate currently being completed•Remains open along strike and at depth
La Plata•5 kilometres southwest of Angostura, along same mineralized belt•7,162 metres drilled since 2010
Beneficiarios
26 Planning for Profits | Report on Mining | Spring 2012 www.facebook.com/reportonmining
Metals Economics Group (MEG) Pipeline Activity Index (PAI) increased in November to reach its highest level since March 2011, thanks to another record
month of significant drill results and improved financings, before falling again in December as explorers paused for the holiday season. December’s drop was mitigated by an end-of-year financing push that included a significant amount of debt raised—particularly for base metals.
The industry’s aggregate market cap declined in November and December to finish 2011 at $1.74 trillion—the lowest since July 2010. Market caps have now been under $2 trillion for four consecutive months, bringing 2011’s monthly average down to $2.16 trillion.
Metals Economics Group Pipeline Activity Index, January 2012
Financings Kept Pipeline Activity Index Steady as Drilling Slowed for the Holidays
The number of significant precious and base metals drill results showed an increase for the seventh consecutive month in November, before slowing for the holiday season. Although December was the lowest one-month total since April 2011, the number of announcements was still higher than any single month in 2010.
Compared with 2010, there was a marked increase in the total number of initial resource announcements in 2011. If metals prices hold—particularly gold—MEG expects the trend to continue upwards in 2012, given the significant increase in drilling reported throughout 2011.
MEG Pipeline Activity Index (PAI), January 2012
Source: MEG Industry Monitor; MineSearch; Exploration Activity Services, © Copyright 2012 Metals Economics Group

www.ReportOnMining.com Spring 2012 | Planning for Profits | Report on Mining 27
Using information only available from MEG through MineSearch, Exploration Activity Services, and Acquisitions Services, the Industry Monitor tracks developments based on announcements over the past 26 months of significant drill results, initial new resources, project development milestones, significant financings, and acquisitions.
For more information and to purchase the complete MEG Industry Monitor, visit Metals Economics Group’s web site at www.metalseconomics.com.
About Metals Economics Group (www.metalseconomics.com)Metals Economics Group (MEG) is the most trusted source of global mining information and analysis. We draw on three decades of comprehensive information and analysis, with an unsurpassed level of experience and historical data. To help our clients reach better decisions more quickly, we supply raw data and sophisticated analysis based on unbiased research and reporting. From worldwide exploration, development, and production to strategic planning and acquisitions activity—our databases and studies help you make confident decisions and, ultimately, improve results. The most trusted source of global mining information and analysis.
Contact: Nadine Tanner, Director, Marketing, Metals Economics Group, Suite 300, 1718 Argyle St., Halifax, Nova Scotia, Canada B3J 3N6. T: 902.429.2880; F: 902.429.6593; [email protected] Metals Economics Group (www.metalseconomics.com).
Although not nearly to the scale of 2010, the year-end financing push helped the number of significant financings (U.S. $2 million minimum) completed by junior and intermediate companies rebound. The almost $2 billion raised for base metals in November-December included $1.46 billion in debt—by far the most debt secured for base metals or gold in any bimonthly period since the Industry Monitor began in 2008. Although gold financings had a much more balanced distribution, the $452 million of debt raised in December is also the highest one-month total for gold in the past four years.
The MEG Pipeline Activity Index (PAI) measures the level and direction of overall activity in the supply pipeline, incorporating significant drill results, initial resource announcements, project development milestones, and significant financings into a single comparable index. The PAI is featured in the MEG Industry Monitor—a series of comprehensive graphs and charts, with related commentary, illustrating MEG’s analysis of monthly changes and emerging trends in the base and precious metals pipeline.
Significant Drill Results Announced
Source: MEG Industry Monitor; Exploration Activity Services, © Copyright 2012 Metals Economics Group
Jayarama ChalasaniCEOReliance Power
Wang YifangChairmanHebei Iron and Steel
Chen JinghePresident and CEOZijin Mining
Wang QinghaiVice Chairman and General ManagerShougang Corporation
Michael ZhuGlobal Directorof SalesVale
Anil MehtaChief Executive Offi cer, Power and Special Projects Atha Group
Enebish Baasangombo Executive DirectorErdenes MGL LLC
Arun Kumar Jagatramka Chairman and Managing DirectorGujarat NRE Coke Ltd
26 – 30 March 2012, Marina Bay Sands, Singapore
The 8th annual
Asia’s most in uential investment conference for the mining industry
Join over 1500 mining industry stakeholders and over 400 Asian capital holders in the only event in Asia that:• connects global projects to a truly diverse group of Asian capital holders• Provides Comprehensive coverage of Asian mines and mining jurisdictions• Is supported by major miners and governments
Platinum sponsor
Gold sponsors:
Offi cial broadcaster: Supported by : Produced by :
Key mining leaders and investors:
www.terrapinn.com/asiamining
Register by calling +65 6322 2771 (quote code – WTYS) , dropping us an email at [email protected] or simply sign up online at: https://secure.terrapinn.com/V5/rCalc.aspx?E=4614&C=1998WTYS
Special offe
r for
Fusio
n Publishing / R
eport on
Mining readers!
Save 15
% off the publis
hed rates!
Pay USD 24
00
for a 3 d
ay pass!

GLOBAL ECONOMYINDUSTRY
COUNTRY ECONOMY
COMPANIES
PEER 1PEER 2
PEER
3
TARGET
COMPANY
STOCK RESEARCH PORTAL
Stock Research Portal
Mining, Oil & Gas InvestmentsYou will make better decisions faster.✓ Save research time* (30%+) using our
independent, objective, web portal
✓ Our filtered, categorized, comparison data is structured for ease of access and helps you research data more efficiently
✓ Our proprietary features make it easier to find the information investors and traders seek
✓ Subscribers say our daily economic and resource commentary emails are worth the monthly subscription fee by themselves!
Your annual subscription is a small fraction of what you could earn from even one good investment idea!
Try Stock Research Portal
FREE for 30 days!Start today!
Then subscribe for $29/month.Pay just $277 per year in advance (Best Value) or
12 equal monthly payments of $29
www.stockresearchportal.com